
HAL Id: hal-03134051https://hal.archives-ouvertes.fr/hal-03134051
Submitted on 8 Feb 2021
HAL is a multi-disciplinary open accessarchive for the deposit and dissemination of sci-entific research documents, whether they are pub-lished or not. The documents may come fromteaching and research institutions in France orabroad, or from public or private research centers.
L’archive ouverte pluridisciplinaire HAL, estdestinée au dépôt et à la diffusion de documentsscientifiques de niveau recherche, publiés ou non,émanant des établissements d’enseignement et derecherche français ou étrangers, des laboratoirespublics ou privés.
Wave Attenuation Service by Intertidal CoastalEcogeosystems in the Bay of Mont-Saint-Michel, France:
Review and Meta-AnalysisAntoine Mury, Antoine Collin, Samuel Etienne, Matthieu Jeanson
To cite this version:Antoine Mury, Antoine Collin, Samuel Etienne, Matthieu Jeanson. Wave Attenuation Service byIntertidal Coastal Ecogeosystems in the Bay of Mont-Saint-Michel, France: Review and Meta-Analysis.Estuaries and Coastal Zones in Times of Global Change, pp.555-572, 2020, �10.1007/978-981-15-2081-5_32�. �hal-03134051�

See discussions, stats, and author profiles for this publication at: https://www.researchgate.net/publication/339579515
Wave Attenuation Service by Intertidal Coastal Ecogeosystems in the Bay of
Mont-Saint-Michel, France: Review and Meta-Analysis
Chapter · January 2020
DOI: 10.1007/978-981-15-2081-5_32
CITATIONS
0READS
59
4 authors:
Some of the authors of this publication are also working on these related projects:
Fanzines et autres publications DIY View project
Geomorphoclim: Paraglacial dynamics in Svalbard View project
Antoine Mury
Ecole Pratique des Hautes Etudes
12 PUBLICATIONS 10 CITATIONS
SEE PROFILE
Antoine Collin
Ecole Pratique des Hautes Etudes
82 PUBLICATIONS 839 CITATIONS
SEE PROFILE
Samuel Etienne
Ecole Pratique des Hautes Etudes
160 PUBLICATIONS 1,388 CITATIONS
SEE PROFILE
Matthieu Jeanson
Centre Universitaire de Mayotte
29 PUBLICATIONS 124 CITATIONS
SEE PROFILE
All content following this page was uploaded by Antoine Mury on 09 March 2020.
The user has requested enhancement of the downloaded file.

Wave Attenuation Service By Intertidal Coastal Ecogeosystems
In the Bay Of Mont-Saint-Michel, France:
Review And Meta-analysis
Antoine Mury1*, Antoine Collin1, Samuel Etienne1
1Ecole Pratique des Hautes Etudes (EPHE), PSL University, CNRS LETG.
Matthieu Jeanson2
2Université de Mayotte, CNRS ESPACE-DEV.
Abstract: The wave attenuation service (WAS) literature review over the Bay of Mont-Saint-Michel encompasses
saltmarshes, mudflats, seagrasses, shelly cheniers, oyster, honeycomb worm and sandworm reefs, which all together will
be named “ecogeosystems” in this review due to their combination of biogenic systems, ecological systems and
geomorphological systems (Mury et al., 2018). It provides a comparative meta-analysis of the various measurements of
wave attenuation induced by “ecogeosystems” across different studies focusing on wave height monitoring. The array of
“ecogeosystems” included in this review was firstly identified through a fine-scale mapping of the Bay of Mont-Saint-
Michel, then literature research was led using several keywords related to ecosystem services and coastal protection. A
total of 32 studies was compiled over six countries. The majority of studies was located on North-Atlantic Ocean
coastlines. According to their specificities, “ecogeosystems” were synthetically split into two categories, surface
(saltmarshes, mudflats, seagrasses and oyster reefs) and punctual (shelly cheniers), for the sake of the WAS
comparability. WAS associated with surface saltmarshes, mudflats, seagrasses, and oyster reefs ranged from 0.25 to
7.86%/m, from 0.01 to 4%/m, from 0.03 to 0.77%/m, from 1 to 64%/m, respectively. The punctual shelly chenier was
monitored from 70 to 98%. Honeycomb worm and sandworm reefs have no data about WAS according to our literature
review.
Key words: Protection Ecosystem Service; Coastal Hazards; Coastal Management; Mega-tidal Environment.
*Corresponding author. Email: [email protected]
1. Introduction
A consequence of global change might be an increase
in coastal risks (Temmerman et al., 2013). Indeed, sea-level
rise conjugated with spring tides, can lead to hazardous sea-
levels, in worldwide coastal areas subject to unprecedented
demographic densification (exposure), thus risks. Coastal
“ecogeosystems” such as tropical coral reefs, have the
potential to alleviate hazards by reducing wave energy due
to their topographic complexity (drag coefficient, Harris et
al., 2016, 2018). However, studies focusing on the wave
attenuation service (WAS) of natural barriers remain
spatially discrete and scattered, as well as not harmonized.
Moreover, the WAS of some barrier types remains poorly
known, or even unknown.
A comprehensive view of the ensemble of coastal
“ecogeosystems” is needed to help stakeholders tasked with
coastal risk reduction and coastal protection. The Bay of
Mont-Saint-Michel (BMSM, France) suitably matches this
objective, given its mega-tidal regime and the large panel of
natural barriers (Collin et al., 2018a) facing hazards and
protecting human assets.
The WAS literature review over the BMSM
encompasses saltmarshes, mudflats, seagrasses, shelly
cheniers, oyster, honeycomb worm and sandworm reefs. It
offers a comparative view of the various values of wave
attenuation by “ecogeosystems” observed across different
studies through wave height monitoring. Ecological
parameters acting as wave height attenuation factors have
also been evaluated. Beyond the comparative results, the
main objective of the study is to give an overview of the
existing knowledge of WAS evaluation and identify the
gaps hindering an efficient implementation of
ecogeosystem-based solution to sustainably cope with
coastal risks. Therefore, this work will be an opportunity to
bring new data on the WAS of shelly cheniers, honeycomb
worm and sandworm reefs, three types of “ecogeosystems”
still under-considered for their role in coastal protection
(only two studies: Jeanson et al., 2016; Mury et al., 2018).
2. Methods
The first step of this review work consists in the
identification of the various “ecogeosystems” of the
intertidal environment, which may take part in the wave
mitigation process and thus which have to be considered in
Sixth International Conference on Estuaries and
Coasts (ICEC-2018), August 20-23, 2018, Caen,
France

an integrated vision towards the management of coastal
risks.
In so doing, five different “ecogeosystems” of the
intertidal domain, which can possibly take part of the WAS,
were able to be identified from a mapping of the BMSM
(saltmarshes, mudflats/sandflats, shelly cheniers,
honeycomb worm and sandworm reefs) (Figs 1, 2, 3), and
two others were identified in the literature (seagrasses, and
oyster reefs) to have a more complete view of the intertidal
“ecogeosystems” of temperate coastal areas.
Figure 3. Cross-shore profiles in the Bay of Mont-Saint-Michel, France
Figure 2. Illustration of the "ecogeosystems" concerned by the WAS review
Figure 1. Location map of the "ecogeosystems" observed in the Bay of Mont-Saint-Michel, France

These “ecogeosystems” can be separated in three
categories depending on their nature: (1) plant ecosystems
(saltmarshes, seagrasses), (2) geomorphological structures
(mudflats/sandflats, shelly cheniers), and (3) biogenic
structures (honeycomb worm, oyster and sandworm reefs).
Concerning the screening method for scientific articles
on WAS by coastal “ecogeosystems”, the attention was
focused specifically on the wave attenuation through the
wave height attenuation data (WHA) (neither the velocity
nor flow), due to its recognized representativeness of the
submersion hazards. We examined the temperate intertidal
natural features (what excluded the mangroves and coral
reefs, which are tropical ecosystems as well as artificial
seagrasses). We searched for the literature using research
portals like Google Scholar, Web of Sciences and BibCnrs
(Database of CNRS research teams) to target articles
dealing with coastal protection, wave attenuation,
ecosystem services and nature-based solutions for wave
mitigation.
To achieve this literature review, several keywords
were used, from generic keywords (i.e., ecosystem services,
coastal protection service, coastal protection) to more
detailed terms, in the form of feature + wave attenuation (or
mitigation or reduction) or feature + wave height
attenuation or feature + protection service (e.g., saltmarsh
wave attenuation, saltmarsh wave height attenuation,
saltmarsh protection service). Subsequently, were selected
articles mentioning a percentage of attenuation by the
whole selected features or a percentage per unit of distance
(%/m) for the sake of data comparisons.
3. Results
A suite of 33 articles corresponded to the mentioned
research criteria: 15 concerned saltmarshes WAS, 7
mudflats/sandflats, 5 seagrasses, 4 oyster reefs, 2 shelly
cheniers, 0 dealt with honeycomb and sandworm reefs
WAS. Some of the identified “ecogeosystems” like
honeycomb worm reefs were not considered for their WAS
yet, thus were not mentioned in the literature (Figure 4).
Some “ecogeosystems”, such as oyster reefs, are well
known to act as natural breakwaters, but their WAS is
seldom assessed. Most studies, extracted in this literature
review, took place on the margins of the Atlantic Ocean,
especially along the European and North-American
coastlines (Figure 5).
Figure 5. Location map of the in situ study sites, from the review
Figure 4. Diagram of the distribution of the papers

Saltmarshes
About the saltmarsh review, fourteen studies dealing
with the WAS were selected (Table 1). Considering the
diversity across the different sites and the discrepancy in
measurement methods in the literature dataset, we had to
implement methodological choices to analyse the distinct
study results. First, we decided to compare the studies by
using the wave height attenuation (WHA) value, expressed
as a percentage of attenuation per meter, to obtain a
common unit between studies. When the WHA value was
not directly provided by the authors, we calculated it (see
shaded boxes). Even though the influence of the distance
from the shore, of the foreshore and seabed
characterization, the hydrodynamic conditions and water
depth, underlying the studies was not accounted for, the
calculated values offer a first-level comparison set. Second,
we carried out a classification based on ecological criteria
and more specifically on the plant length, to compare the
WAS across the studies. In this way, we retrieved plant
communities with a higher length range (Spartina
alterniflora, Spartina maritima, Scirpus mariqueter,
Spartina patens), which corresponded to the fringing marsh
of the lower mixed marsh communities (North-West
European mixed saltmarsh, Elymus athericus, Puccinellia
maritima, Salicornia, Suaeda maritima, etc.).
Regarding the higher plant community studies (Wayne
1976; Knutson et al., 1982; Morgan et al., 2009; Yang et
al., 2008; Yang et al., 2012; Lechevalier, 2016), the WHA
ranged from 0.95 to 7.86 %/m (mean: 3.3%/m).
These findings differed considerably from those
observed for the lower mixed saltmarshes (Moller et al.,
1996, 1999, 2002, 2006, 2014; Cooper, 2005; Collin et al.,
2018). Indeed, the WHA measured bottomed at 0.3 and
topped at 1.8%/m (mean: 0.52%/m) range.
Table 1. Synthesis table of Saltmarshes wave attenuation service studies (WHA: Wave Height Attenuation; WEA:
Wave Energy Attenuation; * grey literature, PS.: pressure sensors)
Reference Study
Location
Tidal
Catego
ry
Material
s
Site
Characteristics
Wave Attenuation
WHA WEA
Whole %/m Whole %/m
Wayne,
1976
Adams
Beach,
Florida, USA
Micro-
tidal
NC S. alterniflora 71%/20m 3.6 92%/20m 4.6
T. testudinum 42%/20m
2.1
67%/20m
3.4
Knutson
et al.,
1982
Chesapeake
Bay, Virginia,
USA
Micro-
tidal
Wave
gage
S. alterniflora 40%/2.5m
57%/5m
65%/10m
87%/20m
94%/30m
3.1 64%/2.5m
72%/5m
88%/10m
98%/20m
100%/30m
3.33
Moller et
al., 1996
North
Norfolk, UK Macro-
tidal
PS. North-West
European mixed
Saltmarsh
53.6%/180
m
0.3 79%/180m 0.44
Moller et
al., 1999
North
Norfolk, UK Macro-
tidal
PS. North-West
European mixed
Saltmarsh
60.96%/18
0m
63%/200m
0.34 82%/180m 0.45
Moller
and
Spencer,
2002
Dengie
Peninsula,
Essex, UK
Macro-
tidal
PS.
No
rth
-Wes
t
Eu
rop
ean
mix
ed
Sal
tmar
sh
Shallow
slopping
edge
87.37%/
163m
0.54 98.92%/
163m
99%/310m
(whole
transect)
0.61 – 0.3
(whole
transect)
Cliffed
edge
43.81%/
10m
4.38 79.13%/
10m
7.91
Cooper,
2005
The Wash,
Eastern
England, UK
Macro-
tidal
Buoy and
PS.
Wrangle flats
transect
90.7%/
300m
0.3 97.1%/
300m
0.32
Butterwick Low
transect
63.5%/
250
0.25 71.9%/
250m
0,29
Breast Sand
transect
78%/110m 0.7 91.3%/
110m
0.83
Moller, Dengie Macro- PS. North-West 2-7%/10m 1 – 1.8 / /

2006 Peninsula,
Essex, UK tidal European mixed
salt marsh
Yang et
al., 2008
Eastern
Chongming,
China
Macro-
tidal
Wave
recorder /
PS.
S. mariqueter, S.
alterniflora
16%/
16.5m
0.95 29%/
16.5m
1,80
Lambert,
2009
Saint Laurent
Estuary,
Canada
NC PS. S. alterniflora, S.
patens / / 37-88%/
566m
0.7-0.16
Morgan
et al.,
2009
Northern New
England, USA NC / S. alterniflora 55%/7m 7.86 / /
S. patens, J.
gerardii, D.
spicata and P.
maritima
52%/7m 7.43 / /
Yang et
al., 2012
Eastern
Chongming,
China
Macro-
tidal
PS. S. alterniflora 30%/7.5m
51%/20m
79%/51m
2.34 / /
Moller et
al., 2014
ex situ / PS. Mixed saltmarsh
of E. athericus, P.
maritima, A.
prostrata
20%/40m
(high
energy
conditions)
0.5 / /
Lechevali
-er, 2016*
Moëze,
France Macro-
tidal
Wave
sensors /
PS.
S. maritima / 1.9 / /
H. portulacoides / 4.6 / /
Collin et
al., 2018b
Bay of
Lancieux,
France
Mega-
tidal
PS. Lower marsh of S. anglica and S.
europaea
5-
10%/100m
0.05-0.1 / /
Medium marsh
of H.
portulacoides and
T. maritima
10-
20%/100m
0.1-0.2 / /
Upper marsh of H. portulacoides,
T. maritima, P.
maritima and F.
rubra
>20%/100
m
>0.2 / /
Mury et
al., 2018
BMSM,
France Mega-
tidal
PS. North-West
European mixed
Salt marsh
>78%/100
m
>0.78 / /
Mudflats/Sandflats
The second part of the review work was dedicated to
the WAS of mudflats and sandflats, in which seven studies
were selected (Table 2). The majority of these studies
indirectly dealt with the wave attenuation process by
mudflats or sandflats. Indeed, mudflat transect
measurements were mainly used as samples for comparison
with the other “ecogeosystems” WAS (only Houser and
Hill, 2010, focused on the mudflat WAS).
The WHA recorded in these various studies were
generally found between 0.23%/m (modest increase) and
0.2%/m (with the exception of the Morgan et al., 2009,
study data that reached 4%/m, a relatively high percentage
due to the low distance between recording stations).
Table 2. Synthesis table of Mudflats and Sandflats wave attenuation service studies (WHA: Wave Height
Attenuation; WEA: Wave Energy Attenuation; * grey literature, PS.: pressure sensors)
Reference Study
Location
Tidal
Category Materials
Site
Characteristics
Wave Attenuation
WHA WEA
Whole %/m Whole %/m
Moller et
al., 1996.
North
Norfolk,
UK
Macro-
tidal PS. /
13.5%/
197m 0.07 26%/197m 0.13
Moller et
al., 1999.
North
Norfolk,
UK
Macro-
tidal PS. /
15.29%/
197m 0.08 29%/197m 0.15

Moller
and
Spencer,
2002.
Dengie
Peninsula,
Essex, UK
Macro-
tidal PS.
Marsh edge :
shallow
slopping
20.57%/
147m 0.14
35.25%/
147m 0.24
Marsh edge :
cliffed edge
+23.91%/
102 m ( +0.23
+55.06%/
102m +0.54
Cooper,
2005.
The Wash,
Eastern
England,
UK
Macro-
tidal
Buoy /
PS.
Wrangle flats
transect 10.1%/330m 0.03 15.9%/330m 0.05
Butterwick
Low transect 23%/390m 0.06 35.8%/390m 0.09
Breast Sand
transect 36.4%/180m 0.2 56.2%/180m 0.31
Yang et
al., 2008.
Eastern
Chong-
ming,
China
Macro-
tidal
Wave-tide
recorder /
PS.
/ 11%/185m 0.06 21%/185m 0.11
Morgan
et al.,
2009.
Northern
New
England,
USA
NC NC / 28%/7m 4.0 / /
Houser
and Hill,
2010.
Fraser
River
Delta,
Canada
NC
Current
profiler /
PS.
/ 42%/4500m 0.01 62%/4500m 0.014
Seagrasses
Concerning the review work allocated to seagrasses
WAS, an important methodological choice has been made
by excluding all studies dealing with artificial seagrasses
(Table 3). Indeed, considering the relative fragility of
seagrasses in their natural environment, a plethora of
studies focused on artificial seagrasses. The exclusion of
artificial seagrasses from this review is justified by
primarily targeting the natural components of the intertidal
domain and their responses to meteorological and wave
forcing. Considering the studies dealing with WHA, a great
variability has been recorded, from 0.03%/m to 0.77%/m.
This variability in results can be explained by the fragility
of this kind of ecosystem and his dependence on the
experimental conditions. Furthermore, another explanatory
factor of this variability is the diversity of the
morphological characteristics (e.g., root system, leaf
morphometry) of the various species.
Table 3. Synthesis table of Seagrasses wave attenuation service studies (WHA: Wave Height Attenuation; WEA:
Wave Energy Attenuation; * grey literature, PS.: pressure sensors)
Reference Study
Location
Tidal
category Materials
Site
characteristics
Wave attenuation
WHA WEA
whole %/m whole %/m
Fonseca
and
Cahalan,
1992
ex situ -
wave
flume /
Wave
flume
Halodule
wrightii,
Syringodium
filiforme,
Thalassia
testudinum,
Zostera marina
/ / 20-76%/1m (mean 40%)
Prager
and
Halley,
1999
Calusa
Key,
Florida
Bay, USA
NC PS. Thalassia
testudinum / /
>80%/2500
m 0.03
Paul and
Amos,
2011
Ryde
Sand, Isle
of Wight,
UK
Macro-
tidal PS.
Zoster
-a
noltii
High
shoot
density
20% /30-
95m 0.66-0.21 / /
Low
shoot
density
<10%/30-
95m 0.33-0.11 / /
Bradley
and
Houser,
2009
Santa
Rosa
Island,
Florida,
USA
Micro-
tidal PS.
Thalassia
testudinum
+20%/5th
m then
decrease of
30%/39m
0.77
(39m) / /
Christian-
en et al.,
2013
Derawan
Island,
Indonesia NC PS.
Halodule
uninervis
18%/667m
30%/450m
11%/200m
0.03-0.07 / /
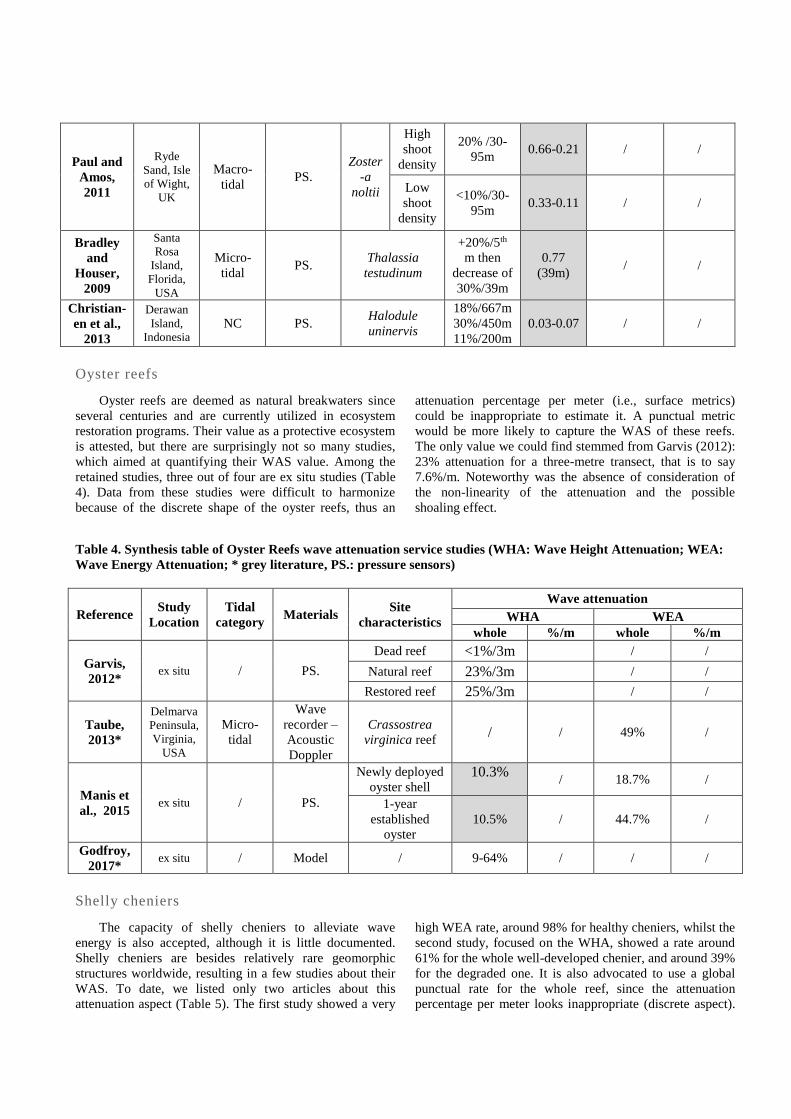
Oyster reefs
Oyster reefs are deemed as natural breakwaters since
several centuries and are currently utilized in ecosystem
restoration programs. Their value as a protective ecosystem
is attested, but there are surprisingly not so many studies,
which aimed at quantifying their WAS value. Among the
retained studies, three out of four are ex situ studies (Table
4). Data from these studies were difficult to harmonize
because of the discrete shape of the oyster reefs, thus an
attenuation percentage per meter (i.e., surface metrics)
could be inappropriate to estimate it. A punctual metric
would be more likely to capture the WAS of these reefs.
The only value we could find stemmed from Garvis (2012):
23% attenuation for a three-metre transect, that is to say
7.6%/m. Noteworthy was the absence of consideration of
the non-linearity of the attenuation and the possible
shoaling effect.
Table 4. Synthesis table of Oyster Reefs wave attenuation service studies (WHA: Wave Height Attenuation; WEA:
Wave Energy Attenuation; * grey literature, PS.: pressure sensors)
Reference Study
Location
Tidal
category Materials
Site
characteristics
Wave attenuation
WHA WEA
whole %/m whole %/m
Garvis,
2012* ex situ / PS.
Dead reef <1%/3m / /
Natural reef 23%/3m / /
Restored reef 25%/3m / /
Taube,
2013*
Delmarva
Peninsula,
Virginia,
USA
Micro-
tidal
Wave
recorder –
Acoustic
Doppler
Crassostrea
virginica reef / / 49% /
Manis et
al., 2015 ex situ / PS.
Newly deployed
oyster shell 10.3%
/ 18.7% /
1-year
established
oyster
10.5% / 44.7% /
Godfroy,
2017* ex situ / Model / 9-64% / / /
Shelly cheniers
The capacity of shelly cheniers to alleviate wave
energy is also accepted, although it is little documented.
Shelly cheniers are besides relatively rare geomorphic
structures worldwide, resulting in a few studies about their
WAS. To date, we listed only two articles about this
attenuation aspect (Table 5). The first study showed a very
high WEA rate, around 98% for healthy cheniers, whilst the
second study, focused on the WHA, showed a rate around
61% for the whole well-developed chenier, and around 39%
for the degraded one. It is also advocated to use a global
punctual rate for the whole reef, since the attenuation
percentage per meter looks inappropriate (discrete aspect).

Table 5. Synthesis table of Shelly Cheniers wave attenuation service studies (WHA: Wave Height Attenuation;
WEA: Wave Energy Attenuation; * grey literature, PS.: pressure sensors)
Honeycomb worm and sandworm reefs
To our knowledge, WAS of honeycomb worm
(Sabellaria alveolota) and sandworm (Lanice conchilega)
reefs were not studied yet. Nevertheless, literature
references evoke a potential mitigation process by the
honeycomb colonies, which might significantly increase the
surface roughness (Collin et al., 2018a) and so reduce wave
energy. This lack of consideration of engineer-ecosystems
into their protective role could be explained for several
reasons. These biogenic structures are overall poorly known
due to their relative rarity in comparison with some others
features like saltmarshes or seagrasses. In addition, their
location at the bottom of the intertidal zone (remote from
the coastline) drives scientists to consider them as some
marginal elements in the WAS of the entire intertidal zone,
especially in a mega-tidal environment.
4. Discussion
This review of the existing literature about the WAS of
the intertidal “ecogeosystems” in temperate areas allowed
us to highlight several elements.
Indeed, it appears that WAS of some “ecogeosystems”
are well documented, as it is the case for saltmarshes (Table
1). Contrariwise, some features, rarer worldwide or located
lower in the intertidal zone, are poorly known, particularly
shelly cheniers, honeycomb worm and sandworm reefs.
Thus, by a quantitative and qualitative analysis of the
different papers, we can deduce one pattern: the more we
go away from the coastline, the more we observe gaps in
the WAS knowledge. The distribution of the reviewed
papers along a cross-shore transect could be used to
illustrate this finding (Figure 6).
Another element we drew from this review is the
difficulties to harmonize the various data across studies.
These difficulties are due to several factors. The first one is
about the structural heterogeneity of study sites and
“ecogeosystems”: their shape (punctual features as cheniers
versus surface features as saltmarshes), and their inherent
composition (i.e., different vegetation communities for
saltmarshes studies, various length measurement transects
and various measurement conditions: weather, seasons,
tidal category, water levels). The second reason is about the
published datasets: some technical information might miss;
foreshore and seabed morphometry and features backing
the natural barriers, hydrodynamic regime and distance
from the coastline are often not specified, thus introducing
Reference Study
Location
Tidal
category Materials
Site
characteristics
Wave attenuation
WHA WEA
whole %/m whole %/m
Jeanson
et al.,
2016
BMSM,
France
Mega-
tidal PS.
Well-developed
shelly cheniers / / 98% /
Degraded shelly
cheniers / / 70% /
Mury et
al., 2018
BMSM,
France
Mega-
tidal PS.
Well-developed
shelly cheniers
61.1%/100
m 0.61 / /
Degraded shelly
cheniers
39.3%/100
m 0.39 / /
Figure 6. Scheme of papers’ distribution along a
conceptualized cross-shore transect

biases in the data harmonization due to the ignorance of the
influence of these elements on the WAS. The third reason
concerns the heterogeneity of measurement methods
between the different studies (pressure sensor, buoy, wave
recorder), which complexify and even impede the
comparison between studies. Moreover, significant wave
height calculation methods are overshadowed, because of
the absence of specifications in papers.
As a single variable based on significant wave height
WHA might appear as a simplistic methodological choice
in this review. Not considered in this review were the
characteristics linked to the tidal regime (infragravity
waves) and the flow velocity, taking probably part of the
marine flood hazards. Moreover, in most cases, WHA is
mathematically approached as a linear process along the
study section while it is obviously a non-linear process in
the complex real world (Koch et al., 2009). The wave
reduction decreases from the start to the end of the section,
i.e., the shoaling effect, which is rarely investigated in the
research studies. This simplified linear approach of the
mitigation process could be explained by the
methodological and material contingencies. Indeed,
frequently the data used for the calculation of the wave
attenuation arise from punctual and fixed stations, at the
beginning and the end of the study section. This approach
does not allow to observe the process in its entirety. Several
technical processes, in on-going development, should
correct for this problem, in particular by the contribution of
the high-resolution satellite imagery (Collin et al., 2018b).
Table 6 synthetizes results obtained from the papers
reviewed. Despite its plain design, the table gives a first
overview of the WAS value for every studied
“ecogeosystem”.
Table 6. Synthesis table of WAS from the meta-analysis
(WHA: Wave Height Attenuation, * Wave Energy
Attenuation data were used for Shelly Cheniers)
To conclude, a work of harmonization of the results of
the different studies is recommended by insisting on the
transparency in the methods used. To leverage a generic
model adaptable for all coastlines with their diversity of
“ecogeosystems” and specificities, we propose to improve
the knowledge about all the potential “ecogeosystems”
WAS worldwide. To solve the problem of harmonization, a
robust approach would be to either find generic metrics
across all “ecogeosystems” or ranking them through a table
showing both range, mean and standard deviation values.
This synoptic product holds great promise to be integrated
into toolboxes of stakeholders tasked with nature-based
mitigation of coastal risks.
References
Bradley, K. and Houser, C. 2009. “Relative velocity of
seagrass blades: implication for wave attenuation in
low-energy environments”, Journal of Geophysiscal
Research, 114(F1).
Christianen, M.J.A., van Belzen, J., Herman, J., van
Katwijk, M.M., Lamers, L.P.M., van Leent, P.J.M. and
Bouma, T.J. 2013. “Low-canopy seagrass beds still
provide important coastal protection services”, PLoS
ONE, 8(5), e62413.
Collin, A., Dubois, S., Ramambason, C. and Etienne, S.
2018a. “Very high-resolution mapping of emerging
biogenic reefs using airborne optical imagery and
neural network: the honeycomb worm (Sabellaria
alveolata) case study”, International Journal of Remote
Sensing, 1-16.
Collin, A., Lambert, N., James, D. and Etienne, S. 2018b.
“Mapping wave attenuation induced by salt marsh
vegetation using WorldView-3 satellite imagery”,
Revista de investigación Marina, 25(2), 67-69.
Cooper, N.J. 2005. “Wave dissipation across Intertidal
surfaces in the wash tidal inlet, Eastern England”,
Journal of Coastal Research, 21(1), 28-40.
Fonseca, M.S. and Cahalan, J.A. 1992. “A preliminary
evaluation of wave attenuation by four species of
seagrass”, Estuarine, coastal and shelf science, 35,
564-576.
Garvis, S.K. 2012. “Quantifying the impacts of oyster reef
restoration on oyster coverage, wave attenuation and
seagrass fragment retention in Mosquito Lagoon,
Florida”, Msc. Thesis, University of Central Florida,
Electronic These and dissertations. 2284.
Godfroy, M. 2017. “Quantifying wave attenuation by
nature based solutions in Galveston bay”, Msc.Thesis,
Delft University of Technology, pp. 145.
Harris, D.L., Rovere, A., Parravicini, V., Casella, E.,
Canavesio, R. and Collin, A. 2016. “Healthy coral
reefs may assure coastal protection in face of climate
change related sea level rise”, American Geophysical
Union Fall Meeting, GC11D-1167.
Harris, D.L., Rovere, A., Casella, E., Power, H., Canavesio,
R., Collin, Pomeroy, A., Webster, JM and Parravicini,
V. 2018. “Coral reef structural complexity provides
important coastal protection from waves under rising
sea levels”, Science advances, 4(2), eaao4350.
Shape Ecogeosystems WHA
Surface Saltmarshes 0.05-7.86%/m
Mudflats 0.01-4%/m
Seagrasses 0.03-0.77%/m
Punctual
Oyster reefs 1-64% (whole
reef)
Shelly Cheniers 70-98% (whole
transect)*

Houser, C. and Hill, P. 2010. “Wave attenuation across an
Intertidal sand flat: Implication for mudflat
development”, Journal of Coastal Research, 26(3),
403-411.
Jeanson, M., Etienne, S. and Collin, A. 2016. “Wave
attenuation and Coastal Protection by Shelly Ridges:
Mont-Saint-Michel Bay, France”, Journal of Coastal
Research, 75, 398-402.
Knutson, P.L., Brochu, R.A., Seelig, W.N. and Inskeep, M.
1982. “Wave damping in spartina alterniflora”,
Wetlands, 2, 87-104.
Koch, E.W., Barbier, E.B., Siliman, B.R., Reed, D.J.,
Perillo, G.M.E., Granek E.F., Primavera, J.H.,
Muthiga, N., Polasky, S., Halpern, B.S., Kennedy, C.J.,
Kappel, C.V. and Wolanski, E. 2009. “Non-linearity in
ecosystem services: temporal and spatial variability in
coastal protection”, Frontiers in Ecology and the
Environment, 7, 29-37.
Lambert, N. 2009. « Modélisation de la dissipation de
l'énergie des vagues par la végétation de marais
littoral ». PhD thesis. Rimouski, Québec, Université du
Québec à Rimouski, Institut des sciences de la mer de
Rimouski, pp. 97.
Lechevalier, A. 2016. « Etude de l'atténuation des vagues
par un champ de végétation composé de Spartina
maritima et Halimione portulacoides », Msc. Thesis,
Université de La Rochelle, pp. 34.
Manis, J.E., Garvic, S.K., Jachec, S.M. and Walters, L.J.
2015. “Wave attenuation experiments over living
shorelines over time: a wave tank study to assess
recreational boating pressure”, Journal of Coastal
Conservation, planning and management, 19(1), 1-11.
Moller, I., Spencer, T. and French, J.R. 1996. “Wind wave
dissipation over saltmarshes surfaces: preliminary
results from Norfolk, England”, Journal of Coastal
Research, 12(4), 1009-1016.
Moller, I., Spencer, T., French J.R., Leggett D.J. and Dixon
M. 1999. “Wave transformation over salt marshes: a
field and numerical modelling study from North
Norfolk, England”, Estuarine, Coastal and Shelf
Science, 49, 411-426.
Moller, I. and Spencer, T. 2002. “Wave dissipation over
macro-tidal saltmarshes: effects of marshes edge
typology and vegetation change”, Journal of coastal
research, 506-521.
Moller, I. 2006. “Quantifying saltmarsh vegetation and its
effect on wave height dissipation: Result from a UK
East coast saltmarsh”, Estuarine Coastal Shelf Science,
69, 337-351.
Moller, I., Kudella, M., Rupprecht, F., Spencer, T., Paul,
M., van Wesenbeeck B.K., Wolters, G., Jensen, K.,
Bouma, T.J., Miranda-Lange, M. and Schimmels, S.
2014. “Wave attenuation over coastal salt marshes
under storm surge conditions”, Nature Geoscience, 7,
727-731.
Morgan, P.A., Burdick, D.M. and Short F.T. 2009. “The
functions and values of fringing salt marshes in
Northern New England, USA”, Estuaries and Coasts,
32, 483-495.
Mury, A., Collin, A. and Etienne, S. 2018. “Wave
attenuation service of saltmarshes and shelly cheniers:
a spatio-temporal study in Mont-Saint-Michel Bay,
France”, Geophysical Research Abstracts, 20, 2044.
Paul, M. and Amos, C.L. 2011. “Spatial and seasonal
variation in wave attenuation over Zostera noltii”,
Journal of geophysical research, 116, C08019.
Prager, E.J. and Halley, R.B. 1999. “The influence of
seagrass on shell layers and Florida Bay mudbanks”,
Journal of Coastal Research, 15(4), 1151-1162.
Taube, S.R. 2013. “Impact of fringing oyster reefs on wave
attenuation and marsh erosion rates.” Msc. Thesis,
University of Virginia.
Wayne, C.J. 1976. “The effects of sea and marsh grass on
wave energy”, Coastal Research Notes, 14, 6-8.
Yang, S.L., Li, H., Ysebaert, T., Bouma, T.J., Zhang, W.X.,
Wang, Y.Y., Li, P., Li M. and Ding, P.X. 2008.
“Spatial and temporal variations in sediment grain size
in tidal wetlands, Yangtze Delta: On the role of
physical and biotic controls”, Estuarine, Coastal and
Shelf Sciences, 77, 657-671.
Yang, S.L., Shi B.W., Bouma, T.J. and Ysebaert, T. 2012.
“Wave attenuation at a salt marsh margin: a case study
of an exposed coast on the Yangtze Estuary”, Estuaries
and Coasts, 35, 169-182.
View publication statsView publication stats


