
Water & Pollution Level Monitoring System
for a Green Roof
Engineering 90 Senior Design Project Report
May 5, 2005
James Golden
Yue Li
Advisor: Professor E. Carr Everbach

Abstract
Green roofs are roofs covered in vegetation, and they reduce storm water runoff
by acting as reservoirs for rainwater and reduce pollutant concentrations by filtering
storm water. Few experiments have been performed to quantitatively demonstrate that
green roofs actually reduce runoff and pollution because not many monitoring systems
have been constructed. A low-cost monitoring system for use on a generic green roof
was designed and assembled to measure the flow rate of the runoff and the water table
level on the roof, and to collect samples for water quality analysis, so that the effects of a
green roof on storm water runoff can be measured.
2

Table of Contents Abstract...........................................................................................................................2 Table of Contents ...........................................................................................................3 Introduction....................................................................................................................4
Purpose of the Project ..................................................................................................4 History of the Project ...................................................................................................6 General Description of the Design...............................................................................7
Implementation of Design .............................................................................................8 Overall Mechanical Design of the System...................................................................8 Flow Rate Meter ........................................................................................................10 Capacitive Level Meter..............................................................................................12 Design of Sample Collector .......................................................................................17 Design of Data Collection by Microcontroller ..........................................................20 Printed Circuit Boards – Data-Logger/Transmitter and Receiver .............................23
System Cost ..................................................................................................................25 Conclusion ....................................................................................................................25 Future Work.................................................................................................................25 References.....................................................................................................................27 Acknowledgements ......................................................................................................27 Appendix.......................................................................................................................28
Pelton Turbine Diagram.............................................................................................28 Turbine Frame Diagram.............................................................................................29 Printed Circuit Board Design.....................................................................................30 PIC Microcontroller Code..........................................................................................30 MatLab Serial Port Reader and Text File Logger......................................................33
3

Introduction
Purpose of the Project
The idea of implementing green roofs on buildings is becoming increasingly
popular. Many small-scale green roofs have been constructed worldwide. Besides
energy conservation and aesthetic satisfaction, green roofs are beneficial because they
reduce storm water runoff and alleviate non-point source pollution in highly developed
residential areas. Functioning as a reservoir, green roofs retain a certain amount of storm
water after rainfall and reduce the total amount of runoff through evapotranspiration.
Gravel, soil and vegetation on green roofs also reduce pollutants and nutrients in storm
water through filtration and biological process.
There has not been much empirical information obtained regarding the
performance of green roofs in reducing storm water runoff and pollutants. Therefore, it is
necessary to install monitoring systems on various types of green roofs in order to
perform experiments to determine the ability of roofs to retain water and reduce
pollutants. The results of these experiments could be further used to develop a
mathematical model to quantify the benefits of installing green roofs. Nevertheless, so
far most of these monitoring systems require the installation of expensive instruments for
measurements. Moreover, most of them were designed for very specific sites. These two
factors have prevented monitoring systems from being widely implemented on green
roofs, which has resulted in the aforementioned lack of quantitative knowledge of the
performance of green roofs.
Swarthmore College has recently constructed two green roofs on its campus. The
first green roof was installed on the shed behind Papazian Hall. Due to its success, a
4

second green roof was installed on Alice Paul Hall in 2004. The two green roofs on
campus have provided us with an opportunity to design an economical monitoring system
which will make the measuring process easy and affordable for most clients who have
installed green roofs. Moreover, the monitoring system should be able to be easily
installed on different green roofs regardless of their types and geometric characters. In
general, our monitoring system should meet the following goals:
1. The system should be able to detect the flow rate of storm water effluent of a
green roof. By comparing the amount of storm water effluent from a green roof
and that from a conventional roof, we can determine the amount of storm water
runoff reduction the green roof can achieve.
2. The system should be able to detect the level of the water table on a green roof.
The resulting data will help us to understand how the roof functions as a water
reservoir.
3. The system should be able to collect samples of storm water effluent for water
quality analysis. By comparing the quality of storm water runoff from a green
roof and that from a conventional roof after the same rainfall, we can determine
the ability of the green roof to remove pollutants and nutrients from storm water.
4. The system should be affordable to general clients. The total cost of the system
should not exceed $200.
5. The system can be installed on different types of green roofs with minor
modification.
6. The system should be easy to operate and maintain.
5

By designing this monitoring system we hope more useful data will be accessible
for researchers to assess the performance of green roofs in alleviating environmental
issues associated with storm water runoff in highly developed area.
History of the Project
Our project is a continuation of some of the previous work done by professors and
students of the Engineering Department of Swarthmore College.
A prototype of the monitoring system was designed by Simeon Realov ’06 and
Frank Kyei-Manu ’06 under the guidance of Professor Carr Everbach. The system
consisted of a commercial flow rate meter, a parallel plate capacitive level meter, and a
wireless data-logging system. The commercial flow rate meter could not handle high
flow rates and failed to operate after the inside turbine was clogged by particles from the
water. The parallel plate capacitor level meter failed to change its capacitance with a
change in the water level. The wireless data transmission was noisy and had a very short
range. Despite these problems, the prototype did provide us with a foundation on which
we could develop our system. We kept the idea of using a capacitance level meter and
wireless data transmission in our project (more details in Water Table Level Meter –and
Printed Circuit Boards – Design Process).
After the failure of implementing the commercial flow rate meter, Professor Carr
Everbach, assisted by a high school student, designed a Pelton turbine flow rate meter.
We kept many of the ideas of this design in our project (more details in Flow Rate Meter
– Design Process). The major flaw of the original design was its use of steel ball
bearings for the turbine shaft. The bearing is vulnerable to rust which causes an increase
of friction with time, and this results in inconsistent flow rate data.
6

General Description of the Design
Our system consists of a water table level meter, a flow rate meter, a sample
collector, a printed circuit board for data-logging, system control, and wireless data
transmission, a printed circuit board for wireless data reception and wired transmission of
data to a computer, and a MatLab program to record the data in a text file on the
computer (Figure 1). The brain of the system is the printed circuit board for data-
logging, system control, and data transmission. It measures the reading from level meter
and flow rate meter, controls the sample collector to operate at specific time periods, and
wirelessly transmits data to the receiving end.
Figure 1. The general components and data flow of the system.
Sample collector
Flow rate meter
Water table level meter
Green Roof
Effluent
Water Quality Analysis
Remaining Water on the roof
Water table level
Flow rate
Control
Microcontroller/ Data logger / Transmitter
Wireless Data Transmission
Receiver
Serial Port
Software for data logging
7

Implementation of Design
Overall Mechanical Design of the System
Overflow pipe
Inlet funnel Flow rate meter Sample collector
Figure 2. The integrated system of an inlet funnel, a flow rate meter, a sample collector, and an overflow pipe
As shown in Figure 2, the support structure for the flow rate meter and sample
collector is a 1-inch ID PVC overflow pipe. Attached to the overflow pipe at the top is a
large inlet funnel. A hole was cut out of the slope of the funnel through which the
overflow pipe is attached using epoxy putty. When the device is placed into the top of
the outflow pipe on a green roof, it is supported by the funnel with the overflow pipe
protruding a small distance from the mouth of the pipe. Beneath the inlet funnel is the
flow rate meter, which consists of an aluminum bracket with an infrared emitter and
receiver and a Pelton turbine. A small plastic hose directs water passing through the
outlet of the funnel to the turbine. The wires connecting the emitter and receiver pass
through a small hole into the overflow pipe and run up and out of it to the data-
logging/transmitting printed circuit board. A small distance beneath the flow rate meter
is the sample collector, which consists of a PVC platform attached to the overflow pipe
8

using epoxy putty, three sample tubes, a servomotor and a small funnel with a spout
made from plastic straws supported by a small block of foam. The wires used to control
the servomotor also run through and out of the overflow pipe to the circuit board.
This integrated system needs fit into the storm water pipes on the two green roofs
at Swarthmore College. A PVC pipe with a 3.2-inch ID and 10-foot depth is used on the
Papazian green roof to direct storm water to the sewer. Six L-shaped cast iron pipes with
3.75 inch inner diameter are used for the same purpose on the New Dorm green roof.
The vertical depth of these pipes is 18 inches. Therefore, the distance between the top of
the inlet funnel and the bottom of the sample collector was designed to be 17.5 inches.
The opening of the inlet funnel has an outer diameter of 4 inches so that the funnel can sit
onto the inlet of the storm water pipes.
The water table level meter is a separate 2-inch ID PVC pipe about 5 inches long
that sits vertically in the soil on the green roof. The pipe has holes drilled on all of its
sides to allow the inflow of water. Wires that make up the electrodes of the capacitor
used in the level meter are connected to the circuit board.
The data-logging/transmitting circuit board sits in a plastic waterproof housing on
top of the roof with power and ground wires entering through small holes in the bottom
cover. The receiving circuit board is attached to the serial port of a computer for
recording of data.
9

Flow Rate Meter
General Description
The flow rate meter (Figure 3) consists of an aluminum frame, a styrofoam Pelton
turbine (see Appendix for dimensions), an aluminum shaft with pin-point bearings, and
an infrared emitter and receiver installed on both sides of the frame.
IR emitter/receiver
Shaft
Figure 3. The flow rate meter of the monitoring system
The turbine catches the water flow and transfers the momentum of the water to its
own kinetic energy. As a result, a correlation exists between the rotation speed of the
turbine and the rate of the water flow. By directing all the storm water runoff from the
roof onto the turbine and detecting the rotation speed of the turbine, we should be able to
determine the flow rate of the runoff. As shown in Figure 4, ten holes of the same
dimension were drilled through the turbine. The holes alternately allow and block
transmission of infrared light from the emitter diode to the receiver transistor. When the
Pelton Turbine Pin-point bearing
10

infrared light is received, the receiver outputs a voltage proportional to the strength of the
light. When no infrared light is received, the receiver outputs ground. These signals are
amplified and transmitted to the PIC microcontroller, which counts these high-to-low
voltage transitions. The count allows us to determine the number of revolutions of the
turbine within a certain amount of time, namely the rotation speed of the turbine (for
further explanation see Data Collection by Microcontroller section).
Figure 4. Front view of the Pelton turbine
Design Process
As discussed in the History of the Project, the steel ball bearings in the original
design are vulnerable to rust which causes an increase of friction with time and
inconsistent flow rate data. To solve this problem, we introduced pin-point bearings into
the system. We constructed a stainless steel shaft with two sharp ends and two nylon
blocks with a conical hole in the center of each of them. However, the system did not
perform well due to imprecise construction.
We next tried two Vee Jewel Assemblies produced by Small Parts Inc., as shown
in Figure 5. In each assembly a V-shaped jewel supported by a copper spring is set in a
11

V-shape Jewel Brass screw mount
Copper spring
Figure 5. Vee Jewel Assembly
brass screw mount. Stainless steel pivots produced by the same company were attached
to both ends of the aluminum shaft. Thanks to the extremely small contact area between
the pivot and V-shaped jewel, there is only a small change in the friction between the two
parts if the normal force between them changes. The copper spring behind the jewel
permits the jewel and pivot to move without breaking. Therefore, the spring prevents the
potential destruction of the shaft and bearings caused by thermal expansion. Moreover,
all materials used for the assemblies and pivots are immune to rust.
We decided the ideal material for the Pelton turbine would be both light and rigid,
and we ended up testing several different types of foam. Low weight keeps the inertia of
the turbine small so that it can quickly react when flow is present or absent. Rigidness is
necessary for the turbine to operate in various kinds of environments. After several tests
with foams of different compositions and densities, we decided to stay with the foam
used in the original model because it had the lowest inertia and was the most durable.
This foam is also cheaper than the other foams we tested.
Capacitive Level Meter
General Description
To measure the water table level on the roof, a capacitive water level meter was
designed and implemented. The capacitor sits in a vertically-positioned pipe in the soil
12

on the roof, and water is allowed to enter the pipe through holes in its sides, so the water
level in the cup will be the same as the water level on the roof. There is a U-shaped
enameled copper wire positioned inside the pipe such that the bottom of the U runs along
the open end on which the pipe stands, and there is another wire glued to the side of the
pipe with stripped ends positioned such that one end extends all the way to the bottom of
the pipe, as shown in Figure 6. The U-shaped copper wire acts as one electrode and the
water touching the stripped end acts as the other, and the enameling on the wire acts as
the dielectric; the wires create an annular capacitor. As water fills up in the soil on the
roof and in the pipe, it gradually covers more of the U-shaped wire, increasing the area of
interaction between the electrodes, which increases capacitance.
This capacitor is connected to an LM555 timer circuit which outputs a digital
signal at a frequency set by the time constant from two resistors and the annular
capacitor. As the water level changes, the value of the capacitance changes, and the
output frequency of the timer changes as well. The frequency of the timer output is
measured by the PIC and transmitted to a data-logging computer. The water table level
may then be extracted from this data.
A B
Figure 6: Water table level meter, side view and top view.
13

Design Process
We first attempted to use several different forms of a parallel plate capacitor. We
insulated two rectangular aluminum plates with electrical tape and taped them together.
The plates had to be sealed off from the water, because on the green roof the conductivity
of the rainwater would most likely vary with storms, and different conductivities would
create resistances in the timer circuit and therefore different timer output frequencies for
the same level of water. The plates were taped together because the capacitance is
inversely proportional to the distance between the plates, and to achieve a capacitance
that could be used in the timer circuit we needed the distance to be as small as possible.
The water would change the capacitance by altering the edge-effect electric fields instead
of the field between the plates. This design was tested by placing the capacitor in a cup
and measuring its capacitance in different levels of water. There was a small detectable
change, but the value drifted and was not constant with different conductivity levels.
Also, we were not satisfied that the connection between our copper wires and the
aluminum plate was strong enough to be used for accurate measurements.
We decided next to use copper plates and insulate them with something better
than electrical tape. To waterproof the plates we used glue, (waterproof paint is not made
anymore). We brushed the glue onto one side of the plates at a time, but the brushing
created many bubbles in the glue, and when the glue dried the bubbles had created tiny
holes that would allow water to come in contact with the plates. To get rid of the
bubbles, we tried de-gassing the glue and then dipping the plates into it and hanging them
to dry. This actually created more bubbles than before, but these bubbles had been
created over the first layer, so we thought there was a good chance that the plates were
14

waterproof. We tested this capacitor, but its capacitance barely varied with the water
level. When we hooked them up to the timer circuit, the timer frequency did not change
at all with water level.
Nathan Hurst, an engineering student in Australia, created a capacitive water level
meter using the aforementioned annular capacitor in a timing circuit like the one we had
adopted from Frank and Simeon’s work. Hurst’s capacitor was an ideal solution because
the water became an electrode instead of the dielectric, so changes in temperature would
not affect the capacitance. The other reason this was better than our parallel plate
capacitor was that the distance between the two electrodes became the thickness of the
enamel. These characteristics of the annular capacitor give it a measurable capacitance
that varies with water height and does not vary with temperature change.
The other problem with our parallel plate capacitor was that a conduction path
could be created between the plates by the water because we could not perfectly insulate
them. This is not as much of an issue with the annular capacitor, though, because the
enameling completely covers the wire. As shown in Figure 7, the timer pulse output is
very sensitive to the change of water conductivity when the conductivity is within the
range of 0 to 40 µS. After the conductivity exceeds 40 µS, the timer pulse output
generally stays constant. According to our measurements on April 2 and April 30, 2005,
the run-off water from the green roof had conductivities of 58.2 µS and 76.0 µS, which
are both beyond the sensitivity range of the timing circuit. Therefore, the change of
conductivity of the roof outflow should not introduce a significant variation of the pulse
data from the timer. Moreover, the lowest conductivity point corresponds to a timer pulse
15

variation of about 5 percent. Thus, even if the conductivity of the water is within the
sensitivity range, the variation of the timer pulse will be small.
4600
4650
4700
4750
4800
4850
4900
4950
0 20 40 60 80 100 12
Conductivity (uS)
Tim
er P
ulse
s
0
Figure 7. Timer pulses per counting time versus conductivity of water over capacitor.
The reason the timer reading changes even with the enameling as the dielectric is
that there is a conduction path from through the water to the bare wire in the water, and
this conduction can vary. This adds a small resistance to the timer circuit, which changes
the output frequency. We considered placing a bare wire parallel to the enameled wire in
order to reduce the effects of salinity in the water. When the capacitor discharges, the
electrons only have to travel the short distance to this wire as opposed to migrating all the
way through the water to one connection point. Since our capacitor appears to be
relatively insensitive to variations in conductivity, we have chosen not to use this method.
The timer circuit outputs noise when there is no water in the level meter, so we
chose to add a 40-pF capacitor in parallel to the level meter capacitor. The timer circuit
now outputs a small base frequency when there is no water in the level meter.
16

We calibrated the water table level meter using an automatic positioning system
to dip the level meter into water. We recorded the level meter output at heights varying
from 0-10 cm at increments of 0.5 cm. We recorded ten readings at each water level and
plotted the water height as a function of the average readings. The calibration curve is
shown below in Figure 8.
Water Level vs. Meter Output
y = -1E-14x4 + 2E-10x3 - 3E-08x2 + 0.0041x - 6.3347R2 = 0.9964
0
20
40
60
80
100
120
0 2000 4000 6000 8000 10000 12000
Meter output (count)
Leve
l (m
m)
Figure 8. Calibration curve for water table level meter.
Design of Sample Collector
General Description
The sample collector consists of a PVC platform supported by the overflow pipe,
a servomotor attached to the underside of the platform, an input flow pipe with a small
funnel attached above and the servomotor wheel attached below, and three sample cells
that hang from the platform. The servomotor position is controlled by the
17
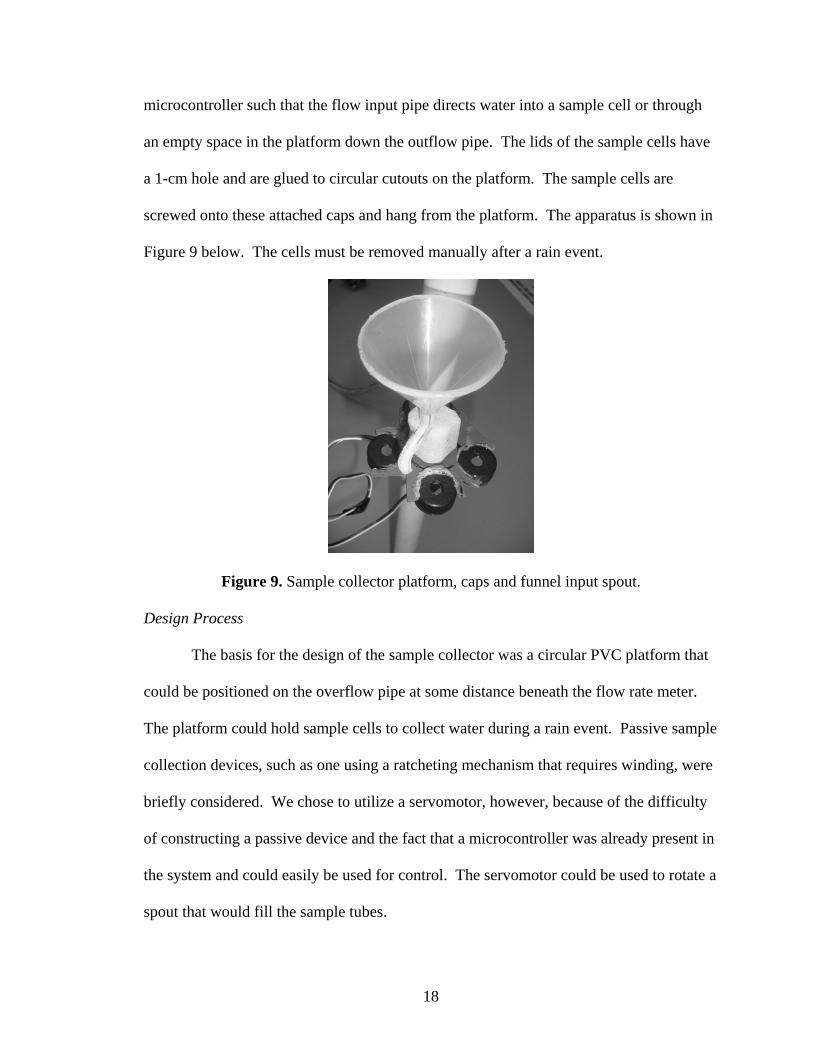
microcontroller such that the flow input pipe directs water into a sample cell or through
an empty space in the platform down the outflow pipe. The lids of the sample cells have
a 1-cm hole and are glued to circular cutouts on the platform. The sample cells are
screwed onto these attached caps and hang from the platform. The apparatus is shown in
Figure 9 below. The cells must be removed manually after a rain event.
Figure 9. Sample collector platform, caps and funnel input spout.
Design Process
The basis for the design of the sample collector was a circular PVC platform that
could be positioned on the overflow pipe at some distance beneath the flow rate meter.
The platform could hold sample cells to collect water during a rain event. Passive sample
collection devices, such as one using a ratcheting mechanism that requires winding, were
briefly considered. We chose to utilize a servomotor, however, because of the difficulty
of constructing a passive device and the fact that a microcontroller was already present in
the system and could easily be used for control. The servomotor could be used to rotate a
spout that would fill the sample tubes.
18

We decided to attach a spout beneath a small funnel on top of the sample collector
platform. This spout would be attached to a foam piece glued to the servomotor wheel.
As water would run off of the flow rate meter, it would be collected in this smaller funnel
and directed to a sample cell. We realized that most of the time we would not be
collecting samples, so we decided to cut pieces out of the platform such that there would
be a central area to shield the servomotor from water and three arms to hold the sample
cells, which left two small circular sectors of empty space, where water from the input
spout could be directed when samples were not being collected. The input spout was first
constructed using a copper pipe, but the pipe could not be bent at a tight enough angle to
direct water into the sample cells, so we used plastic straws.
The sample cells must be capped during the sampling process to protect against
contamination. Due to time constraints we decided to forego this problem and simply
leave the sample cells open. We purchased cells that hold 25-ml volumes, enough for
turbidity and phosphate- and nitrate-concentration tests. The cells have screw-on caps, so
they would either have to be left uncapped or we would have to put holes in the caps.
Unfortunately, the caps have the same diameter as the glass tube, so we could not hang
the cells from the lip of the caps. We decided to drill holes into the caps and glue them to
circular cutouts in the platform. The holes are relatively small, so that the contamination
will not be as much of a problem as if the cells were uncapped, but there will certainly be
some contamination. The cells can be screwed onto caps for support. A future sample
collector must solve this capping problem to prevent contamination.
19
Design of Data Collection by Microcontroller
Data collection by the flow rate meter and water table level meter were
implemented using a PIC16F873A microcontroller. As the flow rate meter’s Pelton
turbine spins, the ten holes around its center alternately allow and block transmission of
infrared light from an emitter diode to a receiver transistor (as described above in Flow
Rate Meter – General Description). When the infrared light is received, the receiver
outputs a voltage proportional to the strength of the light. When it is not received, the
receiver outputs ground. The output signal from the receiver is highly amplified such
that any voltage it outputs will be five volts. The PIC counts these high-to-low voltage
transitions on its first Capture-and-Compare (CCP) input pin. The CCP input pins can be
programmed to generate interrupts at a rising or falling edge on the input signal. The first
CCP pin was set to generate interrupts on rising edges of the infrared receiver’s output,
and this interrupt service routine increments a variable. Thus every time there was a
high-to-low transition from the receiver, a variable was incremented in software on the
microcontroller. To actually measure the flow rate, information from a timer must be
combined with this spin-counting technique, and this was accomplished by programming
a timer to overflow at a consistent time on the order of two seconds. When the timer
overflows, it generates an interrupt that prints the incremented spin variable and resets it.
Thus the number of spins per specified time was output by the microcontroller. It is not
necessary to know the exact duration over which the number of spins is counted because
it is consistent, so the numbers output by the microcontroller can be calibrated to actual
flow rates.
20

The water table level meter’s output from an LM555 timer is connected to the
other CCP input pin. This CCP pin is set to generate an interrupt on rising edges of the
timer output, and the interrupt service routine copies the value of the CCP timer to a
variable. The CCP timer counts the number of clock cycles between interrupt events, so
as the frequency of the timer output increases, the value of the CCP timer decreases. The
value of the CCP timer is never directly printed; when a particular function is called in
the body of the program, an average of this new measurement with the last five
measurements is calculated and printed. This strategy was adopted because the output of
the timer is fairly noisy, and this moving average filters out some of that noise.
The servomotor that positions the input flow the sample collector is also
controlled by the microcontroller. The Futaba S3305 servomotor moves to a specified
angular position between 0° and 180° based on the high time of the control input signal;
the low time of the signal does not affect the servomotor position as long as it is not
orders of magnitude larger than the high time. When the high time of the input signal is
380 µs, the motor positions itself at 0°, and when the high time of the input signal is 2320
µs, the motor positions itself at 180°; positions in between are determined by a linear
relation between these two points. We calculated the high times needed to position the
input flow over each sample cell based on the angular locations of the sample cells with
respect to the axle of the motor. We also calculated the high times needed to position the
input flow over the empty spaces on the sample collector for when we did not want to
collect samples. Once we correctly determined these positions, we programmed the
timing of the sample collector based on flow rates. The sample collector is positioned
initially over an empty space on the platform so that the flow captured by the sample
21

collector funnel is not collected. When the flow rate reaches a certain number, the input
flow pipe is positioned over the first sample cell and left there for a minute. The input
flow pipe is then moved back to an empty space. When the flow rate reaches two other
particular numbers, the other samples are collected. Flags are set in software after each
collection to ensure that each sample cell is filled only once. This scheme for collecting
samples based on the flow rate is imprecise because the flow rates that trigger sample
collection must be preset, when every storm will have a different flow rate curve. Also, it
is possible that some storms will not generate flow through the rate meter at all if the
reservoir capacity of the roof is too great. The hardware is in place, but a new approach
to the sample collector software may be necessary.
Smooth integration of these three facets of the software has not been
accomplished. The original plan for data output was to have the flow rate meter output
readings consistently, at every overflow of its two-second timer. The level meter could
print its reading every ten seconds in place of a flow rate meter reading. The servomotor
positioning functions would only be called when particular flow rates were generated. As
it stands, the level meter does not generate accurate readings when integrated with the
flow rate meter, even though it is accurate when it is the only function running. If the
reservoir capacity of the green roof turns out to be very high, then flow will not be
generated by most rain events, in which case it may be best to output only a level meter
reading every ten seconds and a flow rate reading only once it becomes non-zero. The
functions for the flow rate meter, level meter and sample collector individually have
already been written, the only need to be combined so as not interfere with one another.
22

Printed Circuit Boards – Data-Logger/Transmitter and Receiver
General Description
The data-logger/transmitter circuit board consists of a voltage regulator, an op-
amp, a 555 timer, a PIC microcontroller, an inverter, a transmitter and a DIP switch,. The
7805 5-V voltage regulator allows power sources with voltages higher than 5 V to power
the circuit board by down-regulating higher voltages to 5 V. The OA2772 op-amp is able
to operate on 5-V power and ground and is used to amplify the infrared receiver signal so
the CCP pin on the PIC can receive 5 V when the receiver gets infrared light. The
LM555 timer is used to create a timer circuit for the capacitive level meter. The PIC is
used to count the high-to-low transitions of the infrared receiver for the flow rate meter
and to capture the frequency of the level meter timer circuit. The 7404 hex inverter is
used to invert the output of the PIC before it is transmitted. The PIC outputs high when
idle, and outputs low bits interspersed with high bits only when printing data, so without
the inverter the transmitter would have to be transmitting all the time. The TXM-900-
HP3 transmitter sends the data the PIC collects wirelessly to the receiver. The 3-digit
DIP switch allows the selection of one of eight channels ranging from 900-930 MHz for
data transmission. The range of the transmitter has not been extensively tested, but it has
worked at a distance of 75 feet through walls, so it can hopefully transmit from the roof
of the Papazian shed to a computer in Hicks 310 or in the solar lab.
The receiver circuit board consists of a receiver, an inverter and a DIP switch.
The RXM-900-HP3 receiver receives data wirelessly from the transmitter. The hex
inverter inverts the data again back to its original form. The 3-digit DIP switch allows
23

channel selection. Received data is sent to a computer serial port through a TTL-RS232
converter.
Design Notes
The data-logger/receiver printed circuit board was very problematic. The
connections for the voltage regulator are wrong, so at first none of the integrated circuits
were connected to ground. The rightmost pin is actually Vin although it is labeled Vout,
and the leftmost pin is GND although it is labeled Vin. A voltage regulator therefore
cannot be placed directly into these pins; we soldered wires to the legs of a regulator and
attached the wires to the correct pins. There were also no power input pins, so we had to
clip power and ground onto the voltage regulator. The upper pin for the level meter input
is wired incorrectly, so we soldered a wire onto the lower pin of Resistor 4 and ran it out
under the board near the incorrect input pin, and connected the capacitor to the wire
instead of the input pin. We also added a 40-pF capacitor in parallel with the level meter
capacitor so that when the level meter was dry the timer circuit would still run (we
measured the capacitance of the capacitive level meter to range between 10 pF with no
water and 500 pF when covered with water. Finally, we added .01 µF capacitors in
parallel with the power and ground pins on the input line, the 555 timer, the servomotor
and the transmitter to filter out high frequency noise. A redesign of the board is probably
necessary to account for all of these mistakes and additions. The only problem with the
receiver board was that there was not a 5 V input pin, so we had to clip 5 V onto one leg
of the resistors used for the DIP switch.
24

System Cost
The cost of the monitoring system is shown in Table 1. The total cost of the
system is under $200, which will be reasonable price for many clients who have spent
thousands of dollars to install their green roofs.
Component Cost
Pin-point bearing $21 Foam Free Funnels $10 Sample tubes $12.50 Servo motor $20 Printed circuit board $33 PIC microcontroller $11 Wireless transmitter & receiver $75 Other circuit components $7
Total $189.50 Table 1. System cost
Conclusion
A low-cost monitoring system for a green roof was developed that could measure
the water table level of the water on the green roof and collect samples of the storm water
runoff. The flow rate meter was almost functional, except that it failed to operate
correctly when water blocked transmission of infrared light through the turbine. Data can
be transmitted from a green roof wirelessly to a computer for data recording. The system
is nearly ready to collect data on actual storms.
Future Work
There remains much work to be done on the monitoring system. First of all, the
flow rate meter was never calibrated because when it was tested water would block
infrared transmission through the holes in the turbine completely after about thirty
25

seconds of flow. Possible solutions to this include installing small glass rods in the holes
in the turbine to prevent water from entering them, or moving the location of the infrared
transmitter and receiver to intercept the fins of the turbine instead. The second solution is
preferred because the first solution adds weight to the turbine and thus increases its
inertia.
The aluminum frame of the flow rate meter could be redesigned to be more
compact. A smaller frame could allow the system to fit into pipes with smaller inner
diameters.
The transmitter and receiver were not thoroughly tested to determine transmission
range. An encoding scheme may reduce noise and improve range.
The program for the directing water into the sample collector must be changed to
allow for accurate filling of the sample bottles. More importantly, a method for keeping
the samples from contamination must be devised and implemented.
The data-logger/transmitter circuit board must be housed in a watertight container
so that it can be placed on top of the green roof. A photovoltaic power source could also
be installed to eliminate the need for a power connection.
Finally, data from actual rain storms must be collected to determine whether
green roofs actually reduce storm water runoff and pollution.
26

References Burkhead-Weiner D. et al. Analyzing Green Roofs: A Proposal for Swarthmore College.
Swarthmore, Pennsylvania: Swarthmore College, 2003.
Hurst, N. Water Wave/ Tide/Level Meter http://hawthorn.csse.monash.edu.au/
~njh/electronics/watersensor/ (March 25, 2005)
Acknowledgements
We would like to thank Professor Carr Everbach for his patient instruction,
advice, and previous work on the monitoring system for green roofs; Professor Frederick
Orthlieb for his advice on the mechanical design of the flow rate meter and the sample
collector; Professor Erik Cheever for his advice on the electrical design of the system;
and Machinist Grant Smith for his great contribution to the mechanical construction of
the system.
27

Appendix
Pelton Turbine Diagram
28

Turbine Frame Diagram
29

Printed Circuit Board Design
The files used to design the printed circuit boards are the ‘data.ms7’ and
receive.ms7’ Multisim files and the ‘mainboard.ewprj’ and ‘receive.ewprj’ Ultiboard files
on the attached CD.
PIC Microcontroller Code
This code continuously outputs a flow rate meter reading and a level meter
reading, and contains functions for moving the sample collector input spout to the three
correct positions.
-------------------------------- #device PIC16F873A #INCLUDE <16F873A.h> #INCLUDE "runser.h" long int spins = 0, spinscopy = 0; long int freqval, freqavg; long int levbuf[] = {0, 0, 0, 0, 0}; int i = 0, goflag = 1; #int_ccp1 void isr() { freqval = ccp_1; set_timer1(0); } #int_ccp2 void fourteen() { spins++; //delay_ms(5); // delay for settling time of comparator //printf("%d \n", spins); } #int_timer0 void countup() { i++; if (i == 30) { printf("%lu sl \n", spins);
30

spins = 0; i = 0; } } void level() { disable_interrupts(INT_TIMER0); disable_interrupts(INT_CCP2); enable_interrupts(INT_CCP1); // Setup interrupt on falling edge levbuf[0] = levbuf[1]; levbuf[1] = levbuf[2]; levbuf[2] = levbuf[3]; levbuf[3] = levbuf[4]; levbuf[4] = freqval; freqavg = (levbuf[0] + levbuf[1] + levbuf[2] + levbuf[3] + levbuf[4])/5; printf("a %lu\n", freqavg); disable_interrupts(INT_CCP1); enable_interrupts(INT_CCP2); enable_interrupts(INT_TIMER0); } void sample1() { for (i = 1; i < 250; i++) { output_low(pin_b2); delay_us(9208); output_high(pin_b2); delay_us(792); } delay_ms(5000); for (i = 1; i < 250; i++) { output_low(pin_b2); delay_us(8778); output_high(pin_b2); delay_us(1222); } goflag = 2; printf("collect1\n");
31

} void sample2() { for (i = 1; i < 250; i++) { output_low(pin_b2); delay_us(8349); output_high(pin_b2); delay_us(1651); } delay_ms(5000); for (i = 1; i < 250; i++) { output_low(pin_b2); delay_us(8005); output_high(pin_b2); delay_us(1995); } goflag = 3; printf("collect2\n"); } void sample3() { for (i = 1; i < 250; i++) { output_low(pin_b2); delay_us(7680); output_high(pin_b2); delay_us(2320); } delay_ms(5000); for (i = 1; i < 250; i++) { output_low(pin_b2); delay_us(8778); output_high(pin_b2); delay_us(1222); } goflag = 0; printf("collect3\n"); }
32

void main() { setup_timer_0(RTCC_internal | RTCC_div_256); setup_timer_1(T1_INTERNAL); setup_ccp1(ccp_capture_fe); setup_ccp2(ccp_capture_re); enable_interrupts(INT_CCP1); enable_interrupts(INT_CCP2); enable_interrupts(INT_TIMER0); enable_interrupts(GLOBAL); output_low(pin_B4); /* RB4 is LED, lit when low */ while(TRUE) { delay_ms(5000); sample1(); delay_ms(5000); level(); sample2(); delay_ms(5000); level(); sample3(); delay_ms(5000); level(); } }
MatLab Serial Port Reader and Text File Logger This MatLab file reads and records data from the receiver circuit board to a text
file for analysis.
---------------------------- % receiver.m % written to record data from green roof monitoring system % last modified 24 April 2005 % James Golden & Yue Li clear all; instrreset; ser = serial('COM1'); % use COM1 serial port fopen(ser); sink = fopen('flowinit.txt', 'w'); h = get(ser, 'Status'); % check to see if it worked OK if (h == 'open')
33

set(ser,'BaudRate',1200); set(ser,'StopBits',1); set(ser,'DataBits',8); set(ser,'Terminator','CR'); % 'CR' for Mac, or 'LF/CR' for handyboard set(ser,'Parity','none'); set(ser,'FlowControl','none'); disp('Reading Data on COM1 now...'); tic; flag = 1; while(flag) count = 0; onechar = 0; while(toc < 500) count = count + 1; [onechar, COUNT] = fread(ser,1,'uchar'); s(count) = char(onechar); % For level data - % if (s(count) == 'l') % while(onechar ~= 10) % count = count + 1; % [onechar, COUNT] = fread(ser,1,'uchar'); % s(count) = char(onechar); % end % fprintf(sink, '%s\t \t%s', datestr(now), s); % end % if (onechar == 10) flag = 0; fprintf(sink, '%s\t%s', datestr(now), s); s count = 0; end end end fclose(ser); fclose(sink); delete(ser); clear ser; end
34


