
Water challenges & opportunitiesBernard Giraud & Frédéric René – Présentation SG CIB
2 avril 2009

Uruguay
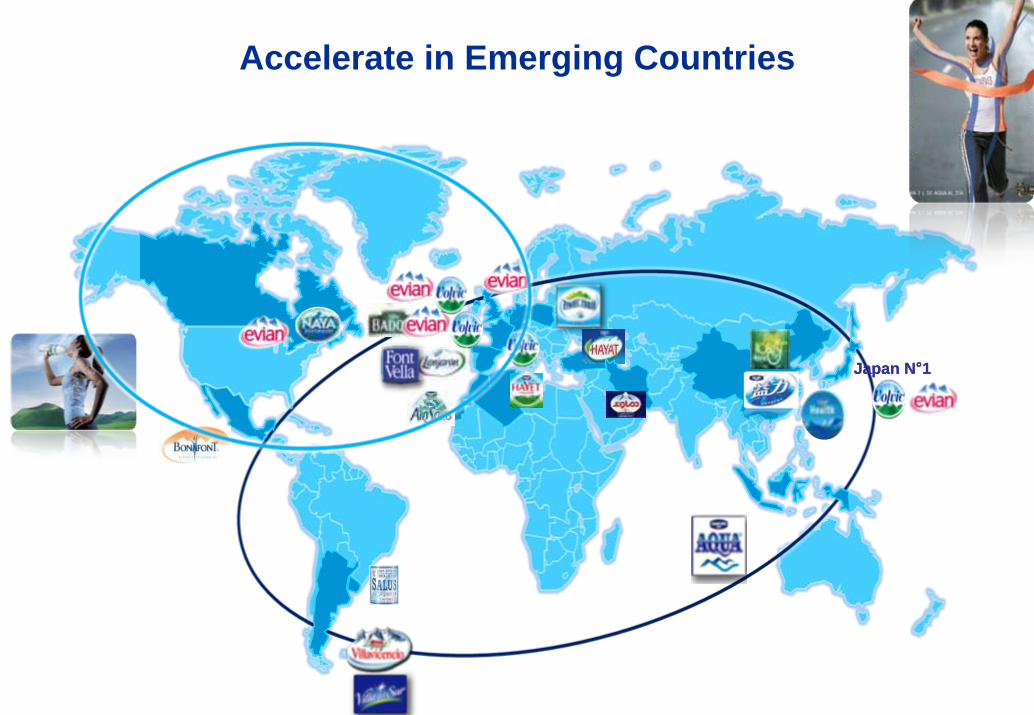
Danone Waters: Strong strategic positions in selected geographies
+ Evian Export: 152 countries
Mexico
Canada
France UK
Ireland
Spain
Argentina
Germany Belgium
Switzerland
Poland
China
JapanTurkey
Indonesia
IranAlgeria
Morocco
1

Our geographic split is well balanced*
Eastern Europe 7%
Western Europe40%
Asia Pacific 31%
Latin America18%
Others4%
* Based on sales Q3 20082
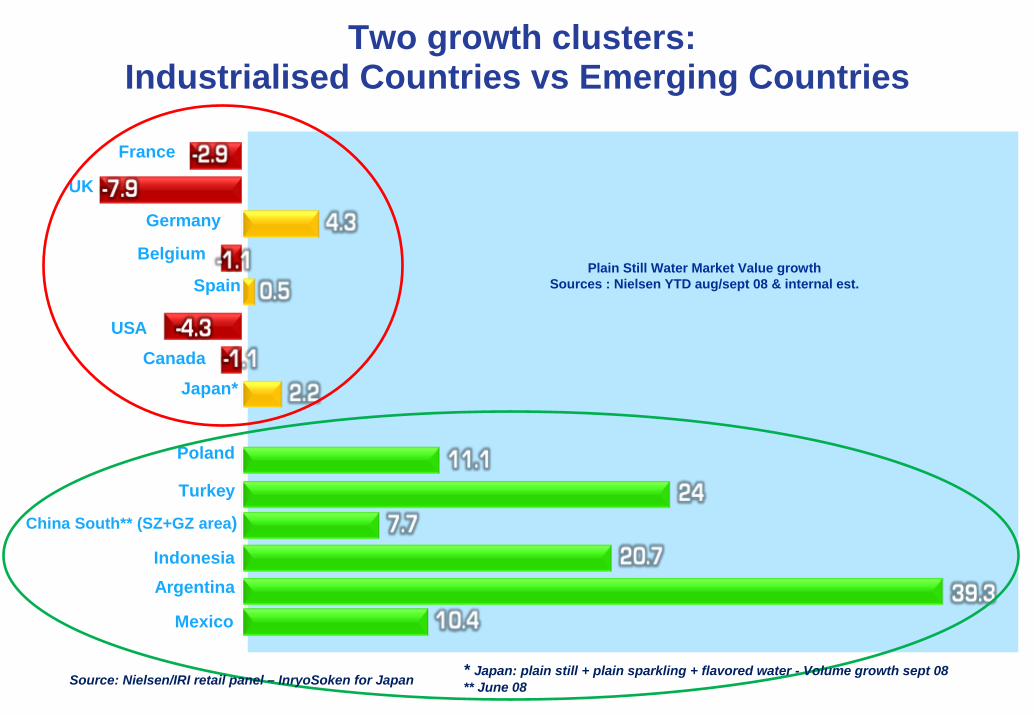
Plain Still Water Market Value growthSources : Nielsen YTD aug/sept 08 & internal est.
France
UK
Belgium
Spain
USA
Germany
Canada
Japan*
Poland
Turkey
Mexico
ArgentinaIndonesia
China South** (SZ+GZ area)
Two growth clusters: Industrialised Countries vs Emerging Countries
* Japan: plain still + plain sparkling + flavored water - Volume growth sept 08** June 08Source: Nielsen/IRI retail panel – InryoSoken for Japan3

Two different environments:
Category vilifiedTap water is an alternativeEconomic slowdown
Category = Safety / healthBottled water & jugs are essentialLow per capita consumption
4
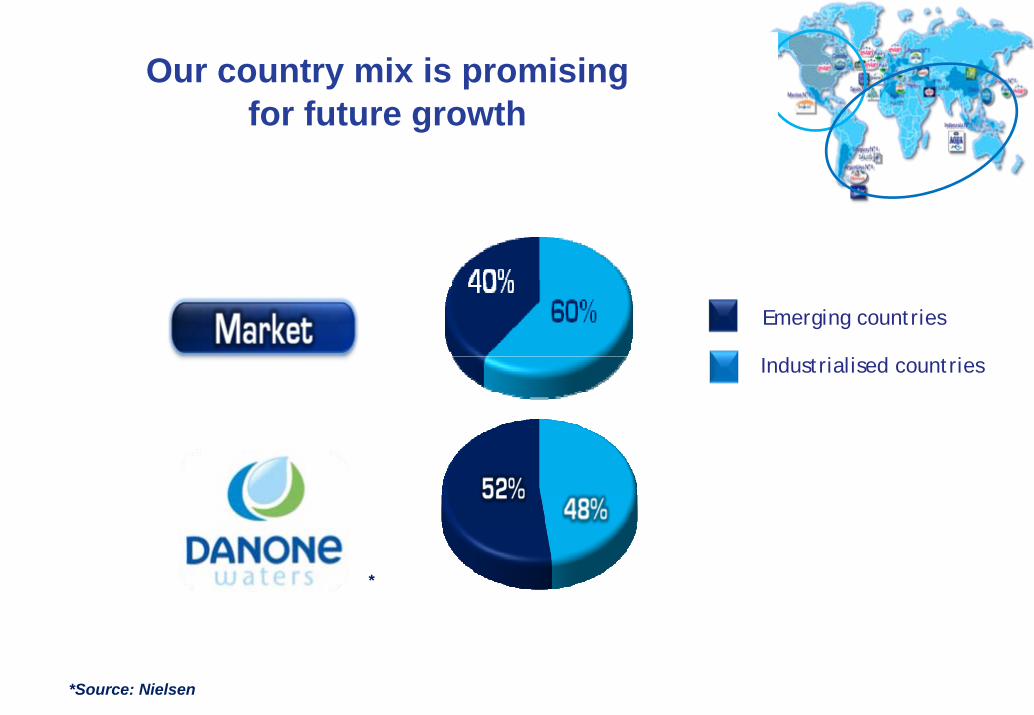
Our country mix is promising for future growth
5 *Source: Nielsen
*
Emerging countries
Industrialised countries
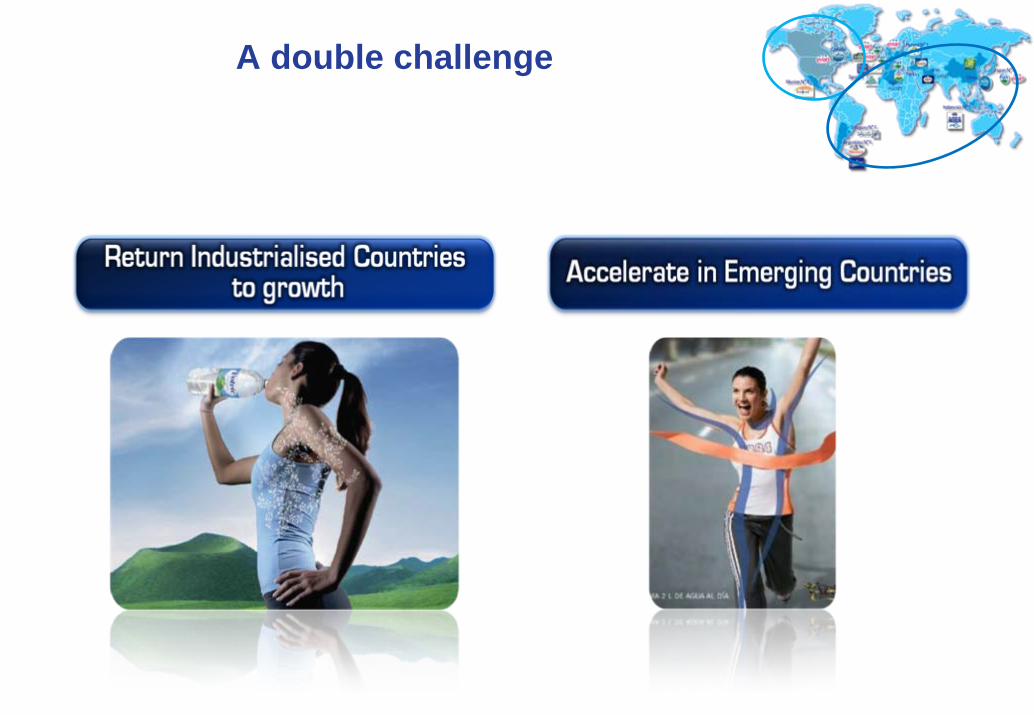
A double challenge
6

Tap water is no substitute for Mineral Water
Returning industrialised countries to growth
Mineral Water is the most environmental,healthiest and economical beverage
Our Mineral Waters are exemplaryin Sustainable Development
7
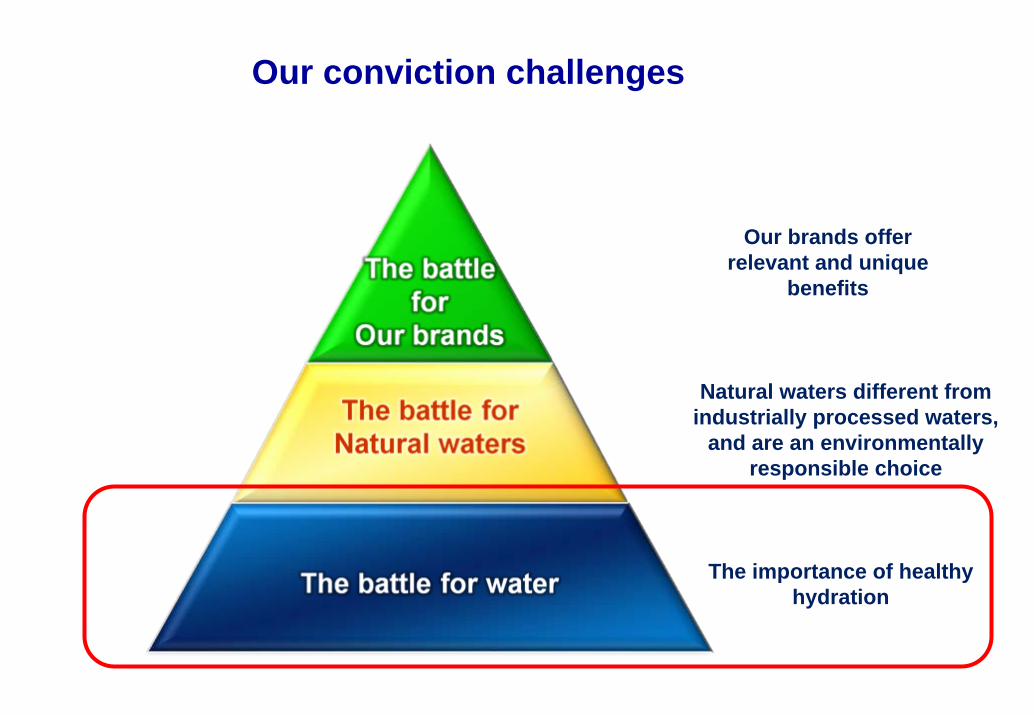
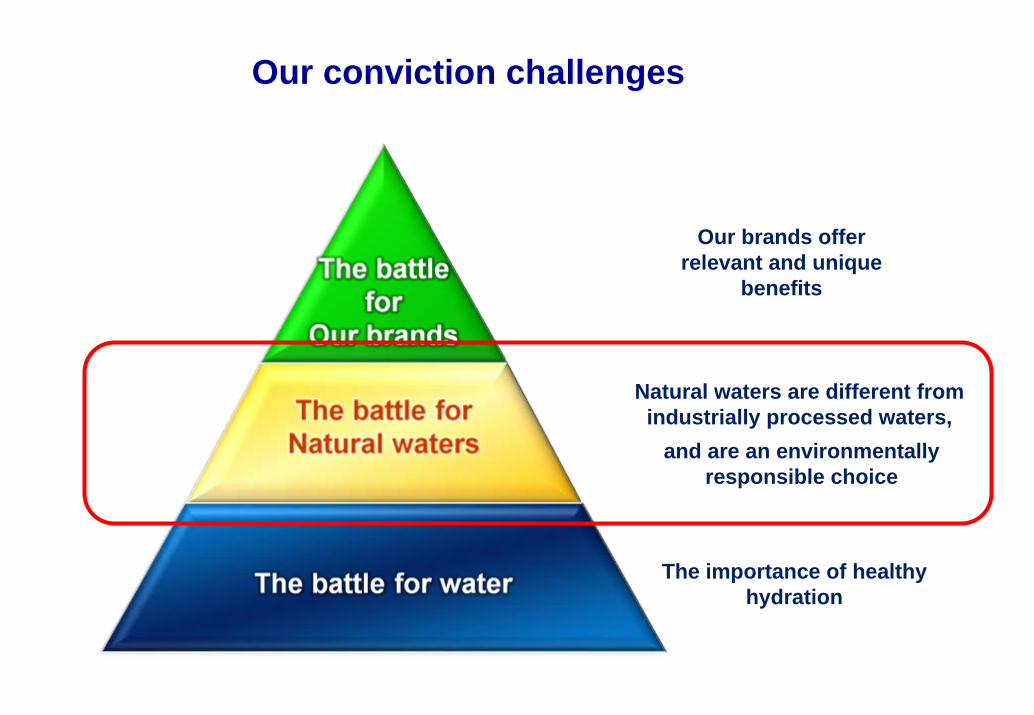
Our conviction challenges
Our brands offer relevant and unique
benefits
The importance of healthy hydration
Natural waters different from industrially processed waters,
and are an environmentally responsible choice

The most important macro-nutrient we put into our bodies– Average male: 1,000 litres p.a. (15 x body weight)– We recycle the water in our bodies 25 times per year
Water – essential to life
Water is the only liquid we need to hydrate
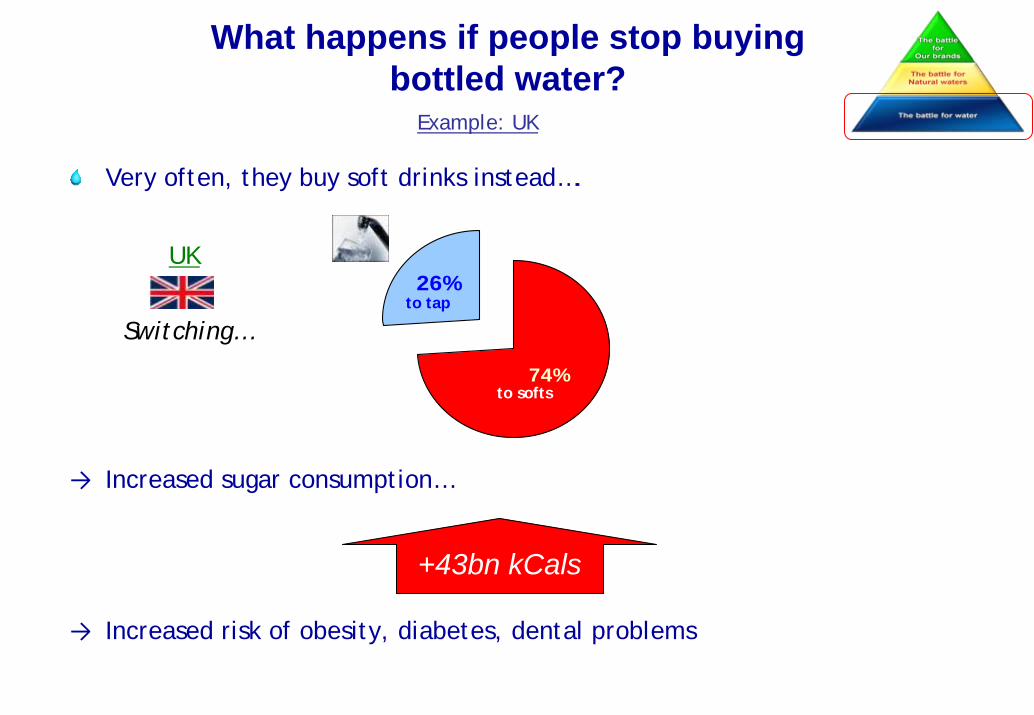
What happens if people stop buying bottled water?
26%
74%
Switching…
to softs
to tap
Very often, they buy soft drinks instead….
UK
→ Increased sugar consumption…
→ Increased risk of obesity, diabetes, dental problems
+43bn kCals
Example: UK
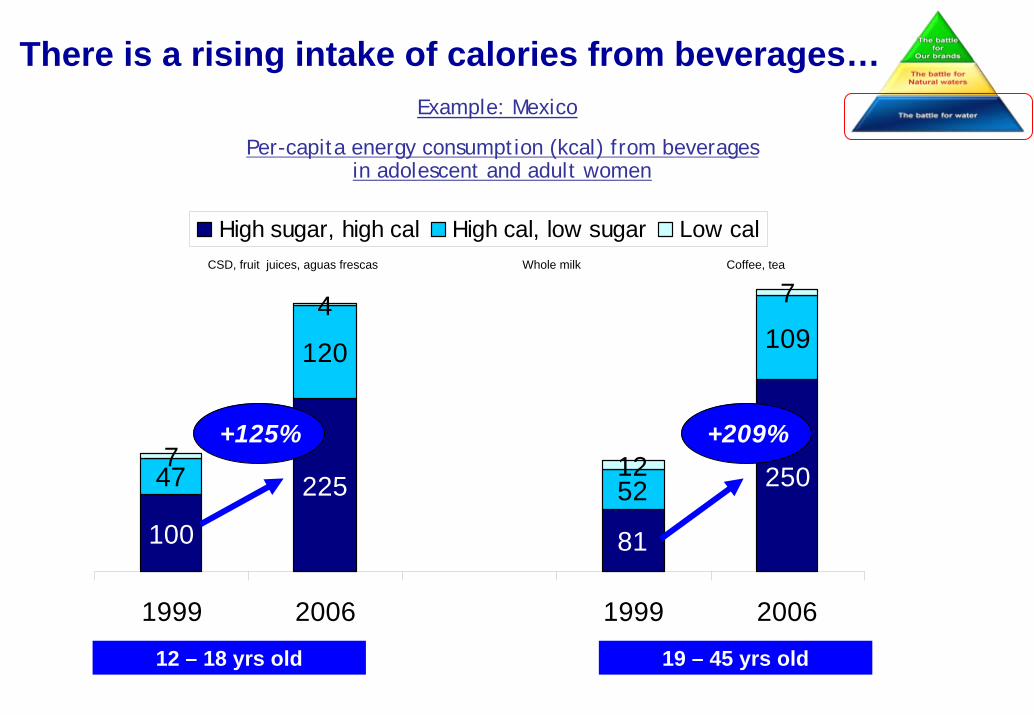
There is a rising intake of calories from beverages…
Per-capita energy consumption (kcal) from beveragesin adolescent and adult women
12 – 18 yrs old 19 – 45 yrs old
CSD, fruit juices, aguas frescas Whole milk Coffee, tea
Example: Mexico
100
225
81
25047
120
52
109
7
4
12
7
1999 2006 1999 2006
High sugar, high cal High cal, low sugar Low cal
+125% +209%
Our conviction challenges
Our brands offer relevant and unique
benefits
The importance of healthy hydration
Natural waters are different from industrially processed waters,
and are an environmentally responsible choice

TapWater
SpringWater
Natural MineralWater
Filteredtap water
Can come from various sources such as lakes, reservoirs, rivers thatcould have been fed by waste treatment centres
From a protected naturalunderground source
Nochemical treatment
Microbiologically pure
Each has a unique and stable compositon
Industrially treated waters Naturally sourced waters
pumps filtration piping tap
From a protected naturalsource
Nochemical treatment
Microbiologically pure
Composition varies according to source
All waters are not the same…
Natural origin
Naturalfiltration
Protectedsource
Constantcomposition
Purifiedwaters
Chemically treated to make it safe to drink Treated to make it safeto drink

Our Waters are 100% from “nature”
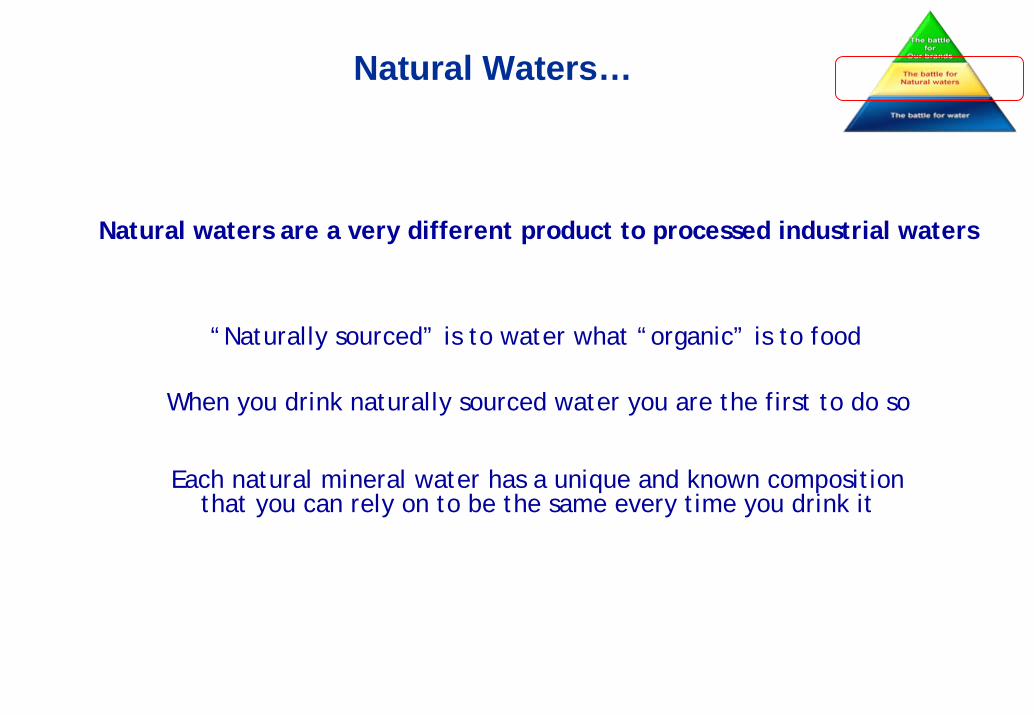
Natural Waters…
“Naturally sourced” is to water what “organic” is to food
When you drink naturally sourced water you are the first to do so
Each natural mineral water has a unique and known composition that you can rely on to be the same every time you drink it
Natural waters are a very different product to processed industrial waters

Our conviction challenges
Our brands offer relevant and unique
benefits
The importance of healthy hydration
Natural waters are different to industrially processed waters,
and are an environmentally responsible choice
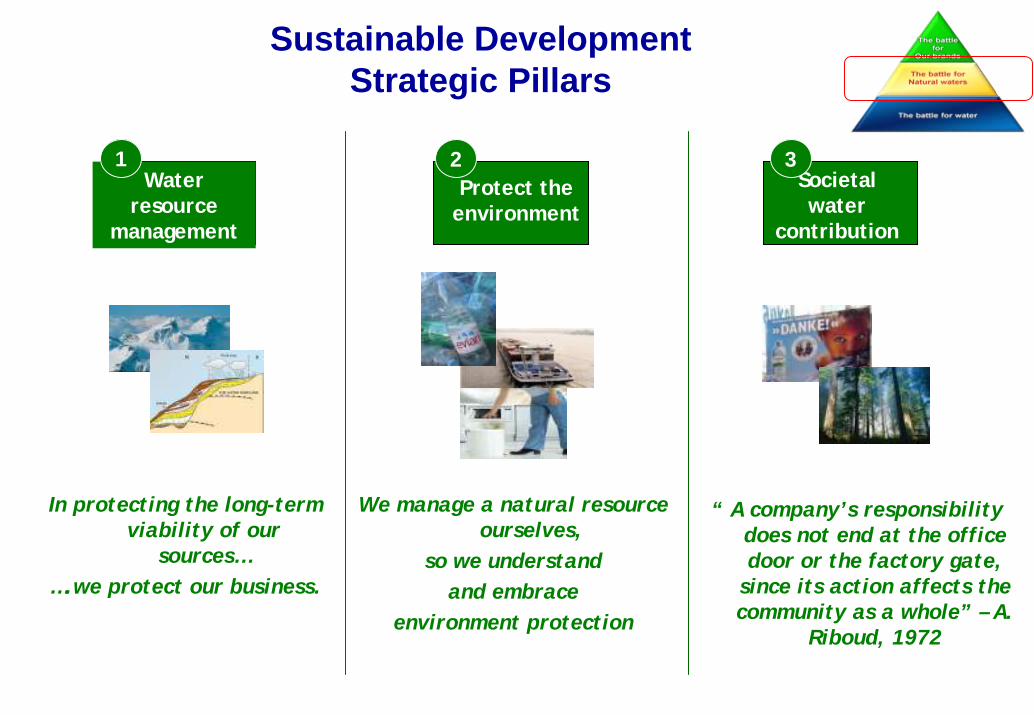
Water resource
management
Protect the environment
Societalwater
contribution
1 2 3
In protecting the long-term viability of our
sources…….we protect our business.
We manage a natural resource ourselves,
so we understandand embrace
environment protection
“ A company’s responsibility does not end at the office door or the factory gate,
since its action affects the community as a whole” – A.
Riboud, 1972
Sustainable DevelopmentStrategic Pillars
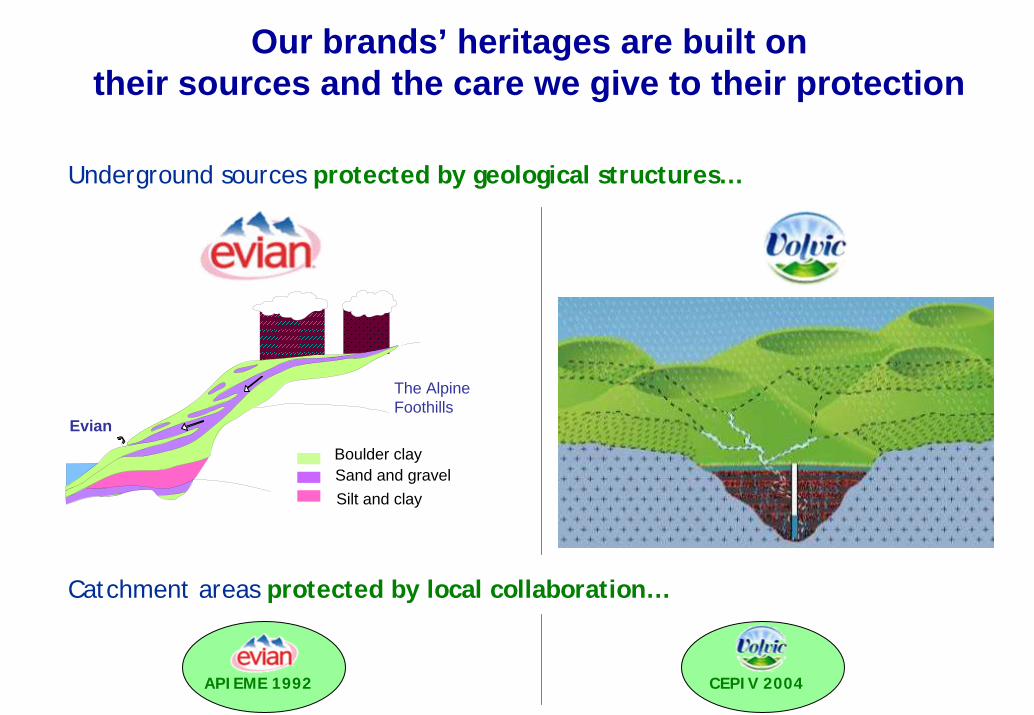
Our brands’ heritages are built ontheir sources and the care we give to their protection
Evian
The AlpineFoothills
Boulder claySand and gravelSilt and clay
Underground sources protected by geological structures…
CEPIV 2004APIEME 1992
Catchment areas protected by local collaboration…

Protecting nature isat the heart of our business model
Our business: natural sustainable waters– We protect our sources…to protect our
business
We value water… we use it sparingly– Evian: 1.7L of water to produce 1L of finished
product
– Objective: -50% less water wasted by 2011
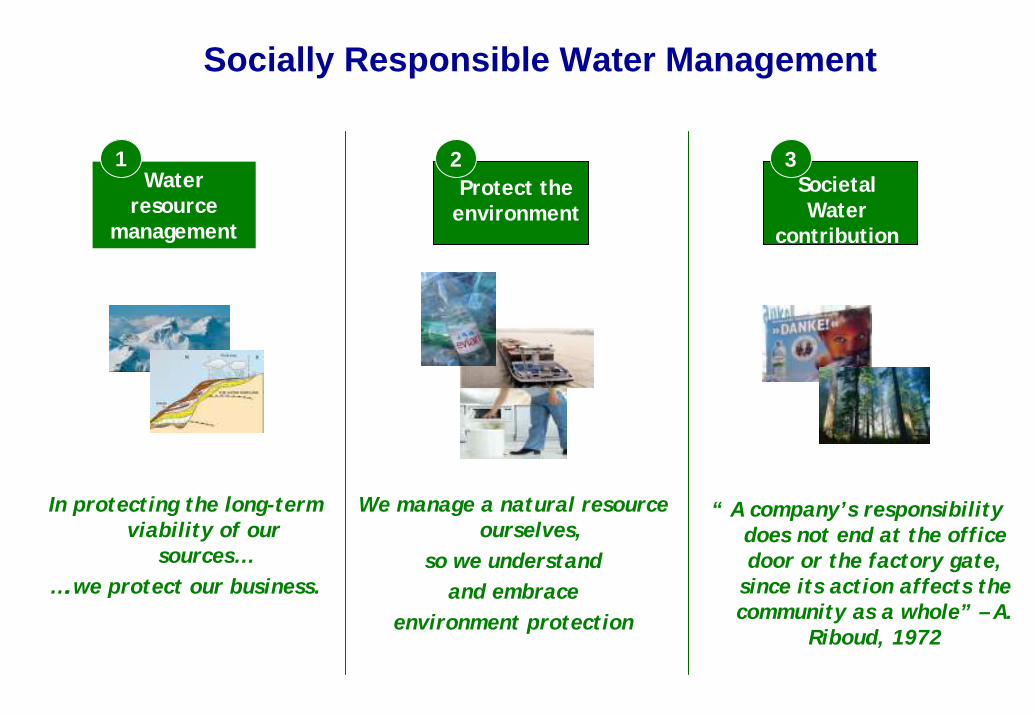
Water resource
management
Protect the environment
Societal Water
contribution
1 2 3
In protecting the long-term viability of our
sources…….we protect our business.
We manage a natural resource ourselves,
so we understandand embrace
environment protection
“ A company’s responsibility does not end at the office door or the factory gate,
since its action affects the community as a whole” – A.
Riboud, 1972
Socially Responsible Water Management

Danone’s Carbon FootprintReduction Ambitions
2007
-30%
2011At equivalent volume
CO2
4MM Tonnes
7.4M tonnes
5.2M tonnes
Water

Bottled Water:low carbon footprint vs other packaged beverages
Typically, the carbon footprint of 1L of bottled water is…
– About 0.7% of a typical person’s daily carbon footprint (assume 30kg/day)
– About the same as driving 1km in an energy-efficient car
DanoneBottled PlainStill Waters
Indicative CO2/litre
Source: Danone CWFP/competitor estimates
Energy/other…
1069g+
CSD ‘Fruit’drinks
908g
322g
194g
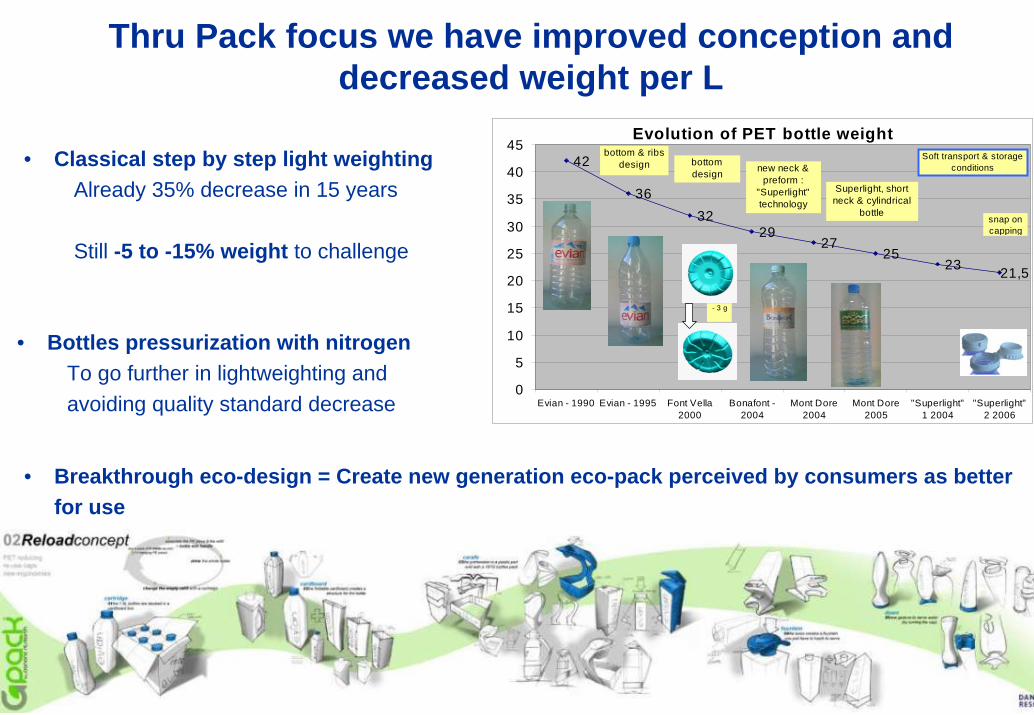
• Classical step by step light weightingAlready 35% decrease in 15 years
Still -5 to -15% weight to challenge
Evolution of PET bottle weight42
3632
2927
2523 21,5
0
5
10
15
20
25
30
35
40
45
Evian - 1990 Evian - 1995 Font Vella2000
Bonafont -2004
Mont Dore2004
Mont Dore2005
"Superlight"1 2004
"Superlight"2 2006
Superlight, short neck & cylindrical
bottle
new neck & preform :
"Superlight" technology
- 3 g
bottom & ribs design bottom
design
Soft transport & storage conditions
snap on capping
• Bottles pressurization with nitrogenTo go further in lightweighting and avoiding quality standard decrease
• Breakthrough eco-design = Create new generation eco-pack perceived by consumers as better for use
Thru Pack focus we have improved conception and decreased weight per L

And it works : e.g. Evian Carbon Reduction -Achievements-to-date and Ambition
261g198g
129g
CO2/litre
E2000 R2008 F2011
-24%.
.
.-35% ?
-51% We expect to have more than halved our carbon footprint by 2011
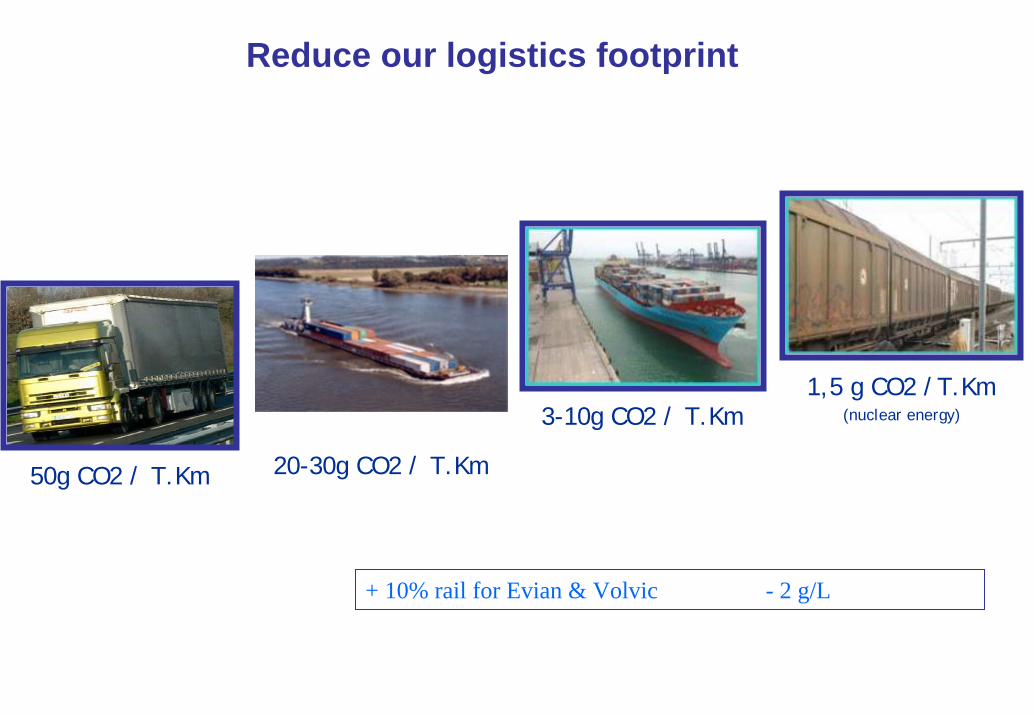
Reduce our logistics footprint
50g CO2 / T.Km 20-30g CO2 / T.Km
1,5 g CO2 /T.Km(nuclear energy)3-10g CO2 / T.Km
+ 10% rail for Evian & Volvic - 2 g/L

Opportunitiesadditives bio gas
“Green Truck” project : reduce Road CFP by 10%
Aerodynamic : -10% gazole consumption
Pneumatic : -7% gazole consumption
Fuel : No to first generation bio fuelYes to Gaz or second generation bio fuel (bio methane, …

“Blue Sea” Project : reduce seafreight CFP by 20%
How a +10,000 TEUs vessel generate only 7g CO2 /T.km?
Antifouling paint and maintenance of hull and propeller (1.5%*)
Waste Heat Recovery System (10%*)Electronically controlled engine (0,5%*)Adjusting main engines to economical speed (1%*)
Ballast water optimisation
Voyage Efficient System (VES) (1%*)
QUEST: Low energy reefer containers
(0,5%*)
Trim tests for all classes of vessels (1%*)
*CO2 emission saving potential
1 knot reduction = 10% less bunker

Energy consumption reduction action plans : réduction by 10% 04-06 when the production raised up to 20%.
- 4 alternative energy sources : Solar, Wind, Biomass (wood & bio-fuel), Hydraulic.
Canopée Project : carbon neutral plant is possible
Canopée Project : EDF, GDF, Cegelec, Vinci, Dalkia
Learnings from Volvo visit

Our NATURE ambition
2007
-30%
2011At equivalent volume
CO2
First…REDUCE
An then…CARBON COMPENSATE to become CARBON NEUTRAL …

We have applied our water expertiseto support major social initiatives for many years
Supporting wetlands protection in partnership with Ramsar since 1998…Water protection institutes:
ThailandJagadishpurArgentina
Raising funds to dig and maintain wells where water access is limited throughout the world since 2005
Achieved so far:Achieved so far:clean safe water forclean safe water for
200,000200,000 peoplepeople

With Evian, we link our environmental objectives to a strong societal project
CO2/litre
198g
2008
261g
E2000*
-24% .
129g
F2011
.-35%
-50%We have halved our carbon footprint by 2011
Carbon captured by restored wetlands will
help compensate Evian’s remaining
footprint
Evian will becarbon neutral
by 2011
.
* Calculation based on historic estimates of constituent variables

Wetlands expertise Inter-governmental
commitment
Expertise in water resource managementFinancial investment
Catalyst
Expertise in biodiversityOperational implementation
GovernanceCreation of “Danone fund for nature” to…– Administer funds– Select projects, oversee implementation, certification– Strategic direction of partnership
Danone/Evian-Ramsar-IUCN: A combination of expertise and resources

Mangroves: a key topic…
…for the planet– Carbon absorption
25% of mangroves have disappeared over the last 20 years– Carbon is no longer absorbed – Local communities lose vital resources
…for local communities– Food & raw materials – Water protection (from salination)
Japan N°1
34
Accelerate in Emerging Countries
Japan N°1
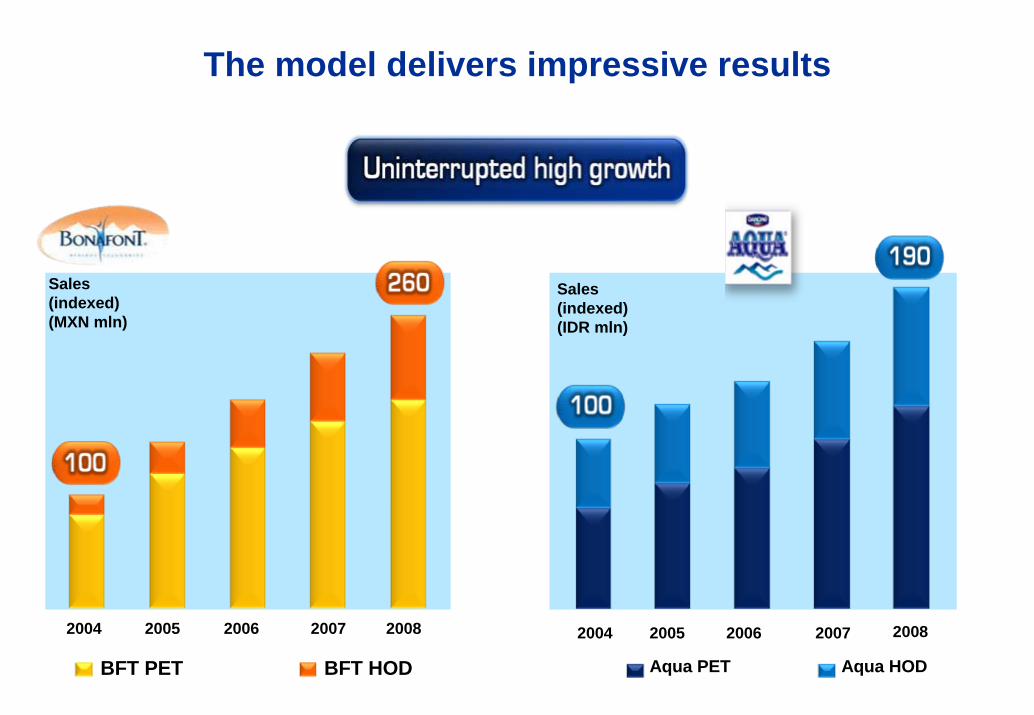
The model delivers impressive results
Sales (indexed)(MXN mln)
Sales (indexed)(IDR mln)
2004 2005 2006 2007 2008
BFT PET BFT HOD
2004 2005 2006 2007 2008
Aqua PET Aqua HOD35
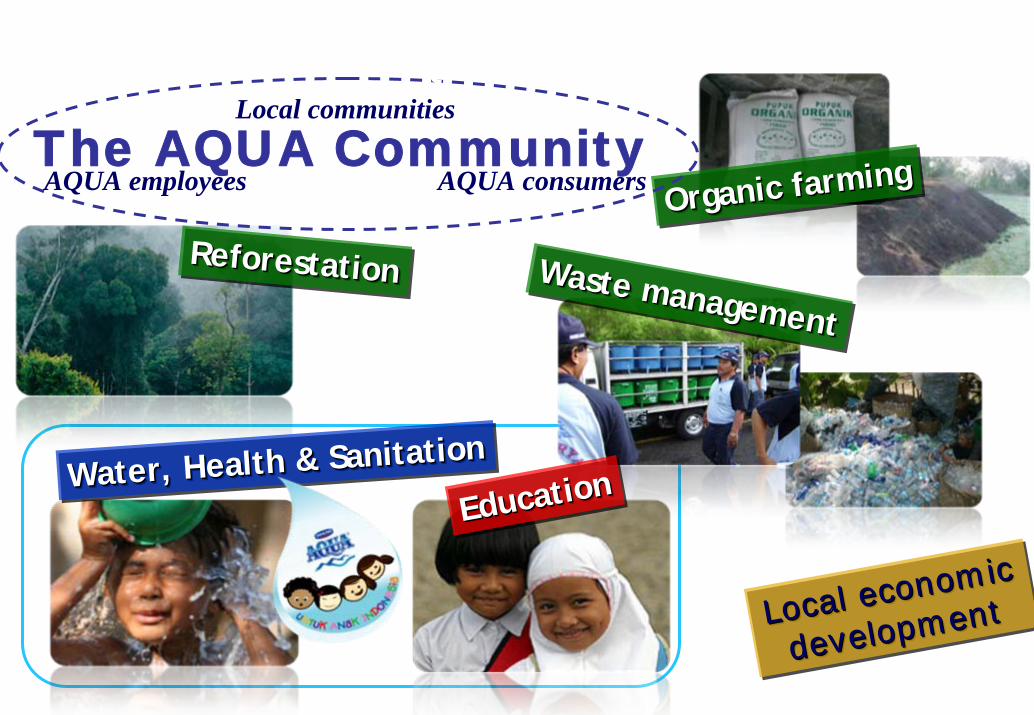
Waste management
Waste management
Waste management
ReforestationReforestationReforestation
Water, Health & SanitationWater, Health & SanitationWater, Health & Sanitation
EducationEducationEducation
Organic farmingOrganic farmingOrganic farming
Local economic
developmentLocal economic Local economic
developmentdevelopment
The AQUA CommunityLocal communities
AQUA employees AQUA consumers
AQUA Lestari


