Download - VOLUMETRIC SURVEY OF LAKE LIMESTONE - Texas

VOLUMETRIC SURVEYOF
LAKE LIMESTONE
Prepared for:
THE BRAZOS RIVER AUTHORITY
Prepared by:
The Texas Water Development Board
March 10, 2003
Texas Water Development Board

Craig D. Pedersen, Executive Administrator
Texas Water Development Board
Charles W. Jenness, Chairman Wesley E. Pittman, Vice ChairmanWilliam B. Madden Noe FernandezDiane E. Umstead Othon Medina, Jr.
Authorization for use or reproduction of any original material contained in this publication, i.e. notobtained from other sources, is freely granted. The Board would appreciate acknowledgement.
This report was prepared by the Hydrographic Survey group:
Carol R. Hearn, P.E., R.P.L.S.Duane ThomasRandall Burns
For more information, please call (512) 445-1471
Published and Distributedby the
Texas Water Development BoardP.O. Box 13231
Austin, Texas 78711-3231

TABLE OF CONTENTS
INTRODUCTION .......................................................................................................................... 1
HISTORY AND GENERAL INFORMATION OF THE RESERVOIR ......................................... 1
HYDROGRAPHIC SURVEYING TECHNOLOGY ...................................................................... 3GPS Information................................................................................................................. 3Equipment........................................................................................................................... 5Previous Survey Procedures............................................................................................... 6Survey Methods.................................................................................................................. 7
DATA............................................................................................................................................ 12
SUMMARY................................................................................................................................... 13
APPENDICES
APPENDIX A - DEPTH SOUNDER ACCURACY.....................................................................A-1APPENDIX B - RESERVOIR VOLUME TABLE .......................................................................B-1APPENDIX C - RESERVOIR AREA TABLE.............................................................................C-1APPENDIX D - AREA-ELEVATION-CAPACITY GRAPH ......................................................D-1
LIST OF FIGURES
FIGURE 1 - LOCATION MAPFIGURE 2 - LOCATION OF SURVEY DATAFIGURE 3 - 3-D BOTTOM SURFACEFIGURE 4 - DEPTH RANGESFIGURE 5 - 2-D CONTOUR MAP

1
LAKE LIMESTONE
HYDROGRAPHIC SURVEY REPORT
INTRODUCTION
Staff of the Hydrologic Survey Unit of the Texas Water Development Board (TWDB)
conducted a hydrographic survey on Lake Limestone in May, 1993. The purpose of the survey was
to determine the capacity of the lake at the normal pool elevation and to establish baseline
information for future surveys. From this information, future surveys will be able to determine
sediment deposition locations and rates over time. Survey results are presented in the following
pages in both graphical and tabular form.
HISTORY AND GENERAL INFORMATION OF THE RESERVOIR
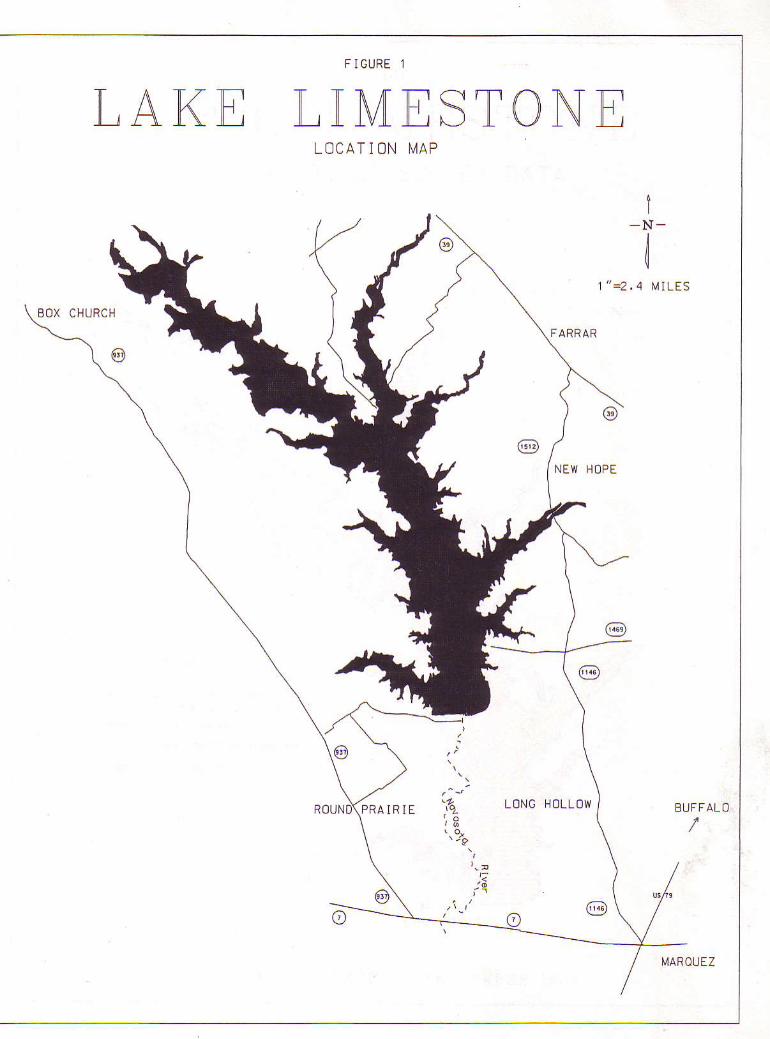
Lake Limestone, owned by the Brazos River Authority, is located in Leon, Limestone and
Robertson Counties approximately 18 miles west of Buffalo, Texas. Sterling C. Robertson Dam is
located on the Navasota River, a tributary of the Brazos River. Dam Construction commenced in
August, 1975 and was completed in October, 1978.
Application No. 3214 was filed May 6, 1974 with the Texas Water Rights Commission by
the Brazos River Authority (BRA) to construct a dam and reservoir on the Navasota River and to
impound a maximum of 217,494 acre-feet of water at elevation 363.0 feet above mean sea level
based on the National Geodetic Vertical Datum of 1929 (NGVD '29). All elevations presented in
this report are reported in NGVD '29 unless noted otherwise.
Permit No. 2950 was issued October 1, 1974, and maximum allocations set as follows:
70,000 acre-feet for municipal purposes; 77,500 acre-feet acre-feet for industrial purposes; and

2
70,000 acre-feet for irrigation, with a priority right of 70,194 acre-feet. Permit No. 2950-A was
issued on September 13, 1979, and amended Permit No. 2950 to allow the permittee to use the
impounded waters of Lake Limestone for nonconsumptive recreational purposes in addition to the
allocated uses.
An application for amendment was filed September 4, 1979, to correct an erroneous
impounding capacity. Permit No. 2950B was issued October 30, 1979, authorizing the BRA to
maintain Lake Limestone on the Navasota River and to impound a maximum of 225,400 acre-feet
at elevation 363.0 feet.
A change in usage required filing an amendment on November 3, 1980. Permit No. 2950C
issued November 25, 1980 reduced the annual municipal use to a maximum of 69,500 acre-feet of
water and allowed a maximum of 500 acre-feet of water for mining purposes.
Certificate of Adjudication No. 5165 was issued to the Brazos River Authority on
December 14, 1987. The owner was authorized to maintain an existing dam and reservoir and
impound not to exceed 225,400 acre-feet of water at elevation 363.0 feet. A priority right was
authorized to divert and use a maximum of 65,074 acre-feet of water annually for municipal,
industrial, irrigation and mining purposes. For purposes of the system operation, the owner was
authorized to exceed the priority right and to annually divert and use from Lake Limestone a
maximum of 69,500 acre-feet of water for municipal use, 77,500 acre-feet of water for industrial
use, 70,000 acre-feet of water for irrigation and 500 acre-feet of water for mining use. All
diversions and uses of water from Lake Limestone in excess of 65,074 acre-feet per year would be
charged against the sum of the amounts designated as priority rights in the other reservoirs within
the Brazos River Basin included in the System Operation Order. The owner was also authorized
to use the impounded waters in Lake Limestone for nonconsumptive recreational use.
Sterling C. Robertson Dam is a rolled earthfill structure separated into two sections by the
service spillway. The embankment to the west of the service spillway is approximately 5,800 feet
long with a maximum height of 57 feet. East of the service spillway, the embankment is
approximately 3,300 feet in length and 40 feet in height. The dam's effective crest elevation is

3
380.0 feet. The service spillway is a gated ogee weir with a concrete chute and stilling basin. The
weir crest is 200 feet wide at elevation 337.0 feet. The service spillway is controlled by five
tainter gates each 40 feet wide, with a top elevation of 365.0 feet. The gates are separated by eight
foot thick piers. Each of the two middle piers contain four foot by eight foot sluice gates. The east
pier contains two 36-inch diameter low-flow conduits and the west pier contains a 10-inch
diameter bypass outlet. The emergency spillway is a 3000-foot wide earthen channel located at
the west end of the embankment. The crest elevation of the emergency spillway is 369.6 feet.
Records indicate the reservoir's storage capacity at the normal pool elevation of 363.0 feet is
225,400 acre-feet with a surface area of 14,200 acres.
HYDROGRAPHIC SURVEYING TECHNOLOGY
The following sections will describe the equipment and methodology used to conduct this
hydrographic survey. Some of the theory behind Global Positioning System (GPS) technology and
its accuracy are also addressed.
GPS Information
The following is a brief and simple description of Global Positioning System (GPS)
technology. GPS is a new technology that uses a network of satellites, maintained in precise orbits
around the earth, to determine locations on the surface of the earth. GPS receivers monitor the
broadcasts from the satellites over time to determine the position of the receiver. With only one
satellite being monitored, the point in question could be located anywhere on a sphere surrounding
the satellite with a radius of the distance measured. Additional satellite readings would also
produce a possible location on a sphere surrounding that satellite with a radius of the distance
measured. The observation of two satellites from an unknown point decreases the possible
location to a finite number of points on a circle where the two spheres intersect. With a third
satellite observation, the unknown location is reduced to two points where all three spheres
intersect. One of these points is obviously in error because its location is in space, and it is
4
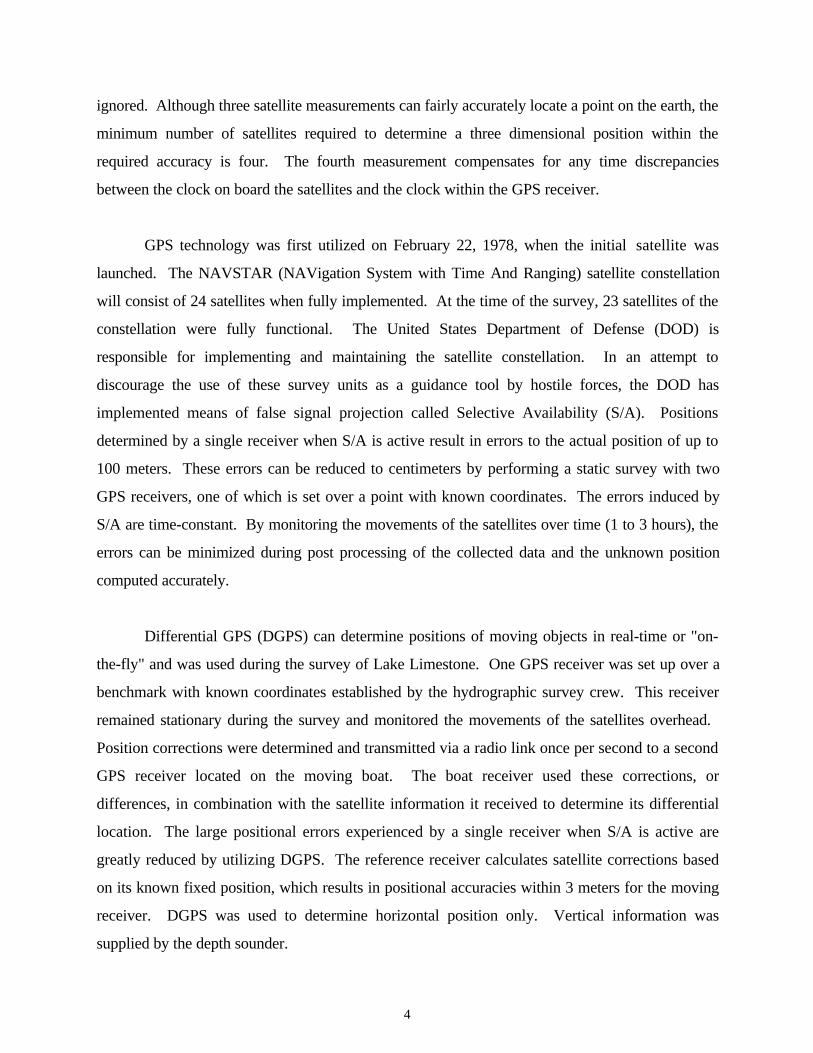
ignored. Although three satellite measurements can fairly accurately locate a point on the earth, the
minimum number of satellites required to determine a three dimensional position within the
required accuracy is four. The fourth measurement compensates for any time discrepancies
between the clock on board the satellites and the clock within the GPS receiver.
GPS technology was first utilized on February 22, 1978, when the initial satellite was
launched. The NAVSTAR (NAVigation System with Time And Ranging) satellite constellation
will consist of 24 satellites when fully implemented. At the time of the survey, 23 satellites of the
constellation were fully functional. The United States Department of Defense (DOD) is
responsible for implementing and maintaining the satellite constellation. In an attempt to
discourage the use of these survey units as a guidance tool by hostile forces, the DOD has
implemented means of false signal projection called Selective Availability (S/A). Positions
determined by a single receiver when S/A is active result in errors to the actual position of up to
100 meters. These errors can be reduced to centimeters by performing a static survey with two
GPS receivers, one of which is set over a point with known coordinates. The errors induced by
S/A are time-constant. By monitoring the movements of the satellites over time (1 to 3 hours), the
errors can be minimized during post processing of the collected data and the unknown position
computed accurately.
Differential GPS (DGPS) can determine positions of moving objects in real-time or "on-
the-fly" and was used during the survey of Lake Limestone. One GPS receiver was set up over a
benchmark with known coordinates established by the hydrographic survey crew. This receiver
remained stationary during the survey and monitored the movements of the satellites overhead.
Position corrections were determined and transmitted via a radio link once per second to a second
GPS receiver located on the moving boat. The boat receiver used these corrections, or
differences, in combination with the satellite information it received to determine its differential
location. The large positional errors experienced by a single receiver when S/A is active are
greatly reduced by utilizing DGPS. The reference receiver calculates satellite corrections based
on its known fixed position, which results in positional accuracies within 3 meters for the moving
receiver. DGPS was used to determine horizontal position only. Vertical information was
supplied by the depth sounder.

5
Equipment
The equipment used in the hydrographic survey of Lake Limestone consisted of a 23 foot
aluminum tri-hull SeaArk craft with cabin, equipped with twin 90 Horsepower Johnson outboard
motors. Installed within the enclosed cabin are an Innerspace Helmsman Display (for navigation),
an Innerspace Technology Depth Sounder and Velocity Profiler, a Trimble Navigation, Inc.
4000SE GPS receiver, a Motorola Radius radio with an Advanced Electronic Applications, Inc.
packet modem, and an on-board computer. The computer is supported by a dot matrix printer and
a B-size plotter. Power is provided by a water-cooled generator through an in-line uninterruptible
power supply. Reference to brand names does not imply endorsement by the TWDB.
The shore station included a second Trimble 4000SE GPS receiver, Motorola Radius
radio and Advanced Electronic Applications, Inc. packet modem, and an omni-directional antenna
mounted on a modular aluminum tower to a total height of 40 feet. The combination of this
equipment provided a data link with a reported range of 25 miles over level to rolling terrain that
does not require that line-of-sight be maintained with the survey vessel in most conditions, thereby
reducing the time required to conduct the survey.
As the boat traveled across the lake surface, the depth sounder gathered approximately ten
readings of the lake bottom each second. The depth readings were averaged over the one-second
interval and stored with the positional data to an on-board computer. After the survey, the average
depths were corrected to elevation using the daily lake elevation. The set of data points logged
during the survey were used to calculate the lake volume. Accurate estimates of the lake volume
can be quickly determined using these methods, to produce an affordable survey. The level of
accuracy is equivalent to or better than previous methods used to determine lake volumes, some of
which are discussed below.

7
Survey Methods
The Hydrographic Survey crew established coordinates for two benchmarks in May, 1993,
to serve as control for the shore station sites. An existing metal cap embedded in concrete marked
BRA #1, located near the centerline of the dam's crest on the west bank, was utilized for the first
shore station. This location was chosen because of the close proximity to the reservoir, the
unobstructed view of the reservoir, and the security of the area. Due to the size of the reservoir, a
second shore station site was required to maintain contact with the roving receiver. Once the
survey began, the location for the second benchmark was determined from the range of the first
shore station. The second benchmark, a brass cap stamped TWDB #007, is embedded in concrete
at the water treatment facility of the South Limestone County Water Supply Corporation. This
facility is located approximately 0.3 miles south of County Road 3371 in Limestone County.
A static survey using the two Trimble 4000SE GPS receivers was performed to obtain
coordinates for BRA #1. One GPS receiver was positioned over a USGS first-order monument
named FALLON, located approximately seventeen and one-half miles south of the dam. FALLON
was established in 1919. Satellite data were gathered from this station for approximately one and
one-half hours, with up to six satellites visible to the receiver. During the same time period, data
were gathered from the second receiver positioned over BRA #1.
Once data collection ended, the data were retrieved from the two receivers using Trimble
Trimvec software, and processed to determine coordinates for the shore station benchmark. The
NAVSTAR satellites use the World Geodetic System (WGS '84) spherical datum. WGS '84 is
essentially identical to the North American Datum of 1983 (NAD '83). The WGS' 84 coordinates
for BRA #1 were determined to be North latitude 31° 19' 31.73316", West longitude 96° 20'
02.190567", and ellipsoid height of 92.0465 meters. The approximate NGVD '29 elevation is
387.8 feet. Those coordinates were then entered into the shore station receiver located over BRA
#1 to fix its location and allow calculation and broadcasting of corrections through the radio and
modem to the roving receiver located on the boat.
8
The same procedure was used to establish coordinates for TWDB #007 benchmark, with
BRA #1 as the known point. The WGS '84 coordinates for TWDB #007 are North Latitude 31°
25' 47.19547", West Longitude 96° 22' 47.68978" and ellipsoid height of 97.8247 meters. The
approximate NGVD '29 elevation height is 406.18 feet.
The reservoir's surface area was determined by digitizing the lake boundary from 1966 USGS
quad sheets that were updated in 1982 from 1978 aerial photographs. Intergraph Microstation
CADD software was used to digitize an estimate of the 363.0 contour based on the North
American Datum of 1927 (NAD '27) used for this map. The graphic boundary was then
transformed from NAD '27 to NAD '83 using Microstation Projection Manager, to get the boundary
into a more recent datum compatible with the positions received from the satellites. The area of
the boundary shape was the same in both datum. NAD '83, a flat projected representation of the
curved earth surface, was chosen to calculate areas and volumes. NAD '27 is also a flat
projection, but the two datum have a slightly different point of origin, and distinctly different state
plane false northing and false easting coordinate to be able to distinguish coordinate points
between the two datum.
The resulting shape was modified slightly to insure that all data points gathered were
within the boundary. An aerial photo dated August 10, 1989 indicated significant sedimentation
along the upper reaches of the Navasota River. Since the elevation on the date of the photo was
362.7 feet, or 0.3 feet below normal pool, the boundary from the photo was assumed to be the
boundary for the Navasota River fork of the reservoir, and agreed quite well with the location of
the data collected. The boundary along Big Creek and Sanders Creek was also modified based on
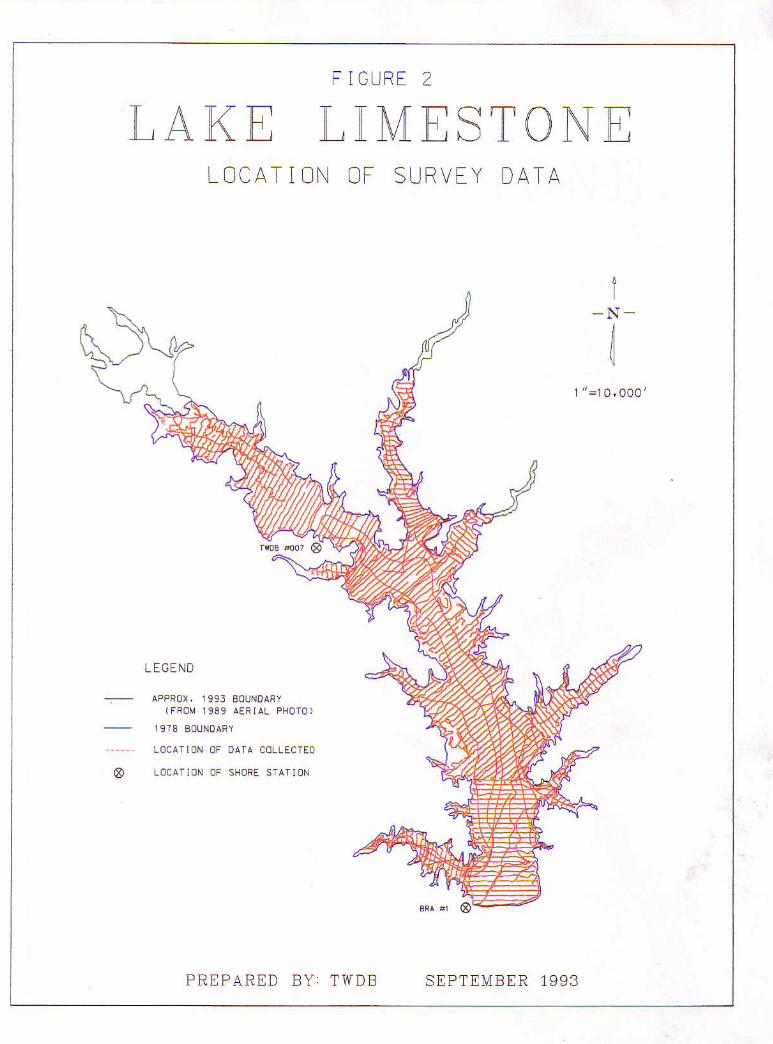
the extent of data collected (see Figure 2). The resulting acreage at the normal pool elevation was
thereby estimated to be 13,379 acres, or within 5.8 percent of the recorded 14,200 acres. An
aerial topo of the upper four feet of the lake or an aerial photo taken when the lake is at the normal
pool elevation would more closely define the present boundary. However, the minimal increase in
accuracy does not appear to offset the cost of those services at this time.
The survey layout was pre-planned, using approximately 150 survey lines at a spacing of
500 feet. Innerspace Technology Inc. software was utilized for navigation and to integrate and

9
store positional data along with depths. In areas where vegetation or obstructions prevented the
boat from traveling the planned line, random data were collected wherever the boat could
maneuver. Additional random data were collected lengthwise in the reservoir. Data points were
entered into the data set utilizing the DGPS horizontal position and manually poling the depth in
shallow areas where the depth was less than the minimum recordable depth of the depth sounder,
which is about 3.5 feet. Figure 2 shows the actual location of the data collection sites. Data were
not collected in areas that were inaccessible due to shallow water or obstructions. The data set
included approximately 138,000 data points.
TWDB staff verified the horizontal accuracy of the DGPS used in the Lake Limestone
survey to be within the specified accuracy of three meters. The shore station was set up over a
known United States Geological Service (USGS) first order monument and placed in differential
mode. The second receiver, directly connected to the boat with its interface computer, was placed
over another known USGS first order monument and set to receive and process the corrections.
Based on the differentially-corrected coordinates obtained and the published coordinates for both
monuments, the resulting positions fell within a three meter radius of the actual known monument
position. For DGPS operation the reference station receiver was set to a horizontal mask of 0°, to
acquire information on the rising satellites. A horizontal mask of 10° was used on the roving
receiver for better satellite geometry and thus better horizontal positions. The DGPS positions
were within acceptable limits of horizontal accuracy with a PDOP (Position Dilution of Precision)
of seven (7) or less. The GPS receivers have an internal alarm that sounds if the PDOP rises
above the maximum entered by the user, to advise the field crew that the horizontal position has
degraded to an unacceptable level.
The depth sounder measures depth by measuring the time between the transmission of the
sound pulse and the reception of its echo. The depth sounder was calibrated with the Innerspace
Velocity Profiler typically once per day, unless the maximum depth varied by more than twenty
feet. The velocity profiler calculates an average speed of sound through the water column of
interest (typically set at a range of two feet below the surface to about ten feet above the maximum
encountered depth), and the draft value or distance from the transducer to the surface. The velocity
profiler probe is placed in the water to wet the transducers, then raised to the water surface where

10
the depth is zeroed. The probe is then lowered on a cable to just below the maximum depth set for
the water column, and then raised to the surface. The unit reads out an average speed of sound for
the water column and the draft measurement, which are then entered into the depth sounder. The
speed of sound can vary based on temperature, turbidity, density, or other factors. Based on the
measured speed of sound for various depths, and the average speed of sound calculated for the
entire water column, the depth sounder is accurate to within +0.2 feet, plus an estimated error of
+0.3 feet due to the plane of the boat for a total accuracy of +0.5 feet for any instantaneous reading.
These errors tend to be minimized over the entire survey, since some are plus readings and some
are minus readings. Further information on these calculations is presented in Appendix A, Page 1.
Manual poling of depths within shallow areas agreed with the depth obtained by the depth sounder
typically within + 0.3 feet, and since the boat is moving much slower, the plane of the boat has
much less effect.
Analog charts were printed for each survey line as the data were collected. The gate mark,
which is a known distance above the actual depth that was recorded in the data file, was also
printed on the chart. Each analog chart was analyzed, and where the gate mark indicated that the
recorded depth was other than the bottom profile, depths in the corresponding data files were
modified accordingly. The depth sounder was set to record bad depth readings as 0, and all points
with a zero depth were deleted.

11
Each data point consisted of a latitude, longitude and depth. The depths were transformed
to elevations with a simple awk Unix command based on the water surface elevation each day,
rounded to the nearest tenth of a foot since the depth sounder reads in tenths of a foot, and ranged
from 363.0 to 363.4 feet. The data set was then loaded into an existing Microstation design file
with the Microstation ASCII Loader product. The design file contained the NAD '83 boundary
previously discussed in this report. The data points along with the boundary were used to create a
digital terrain model (DTM) of the reservoir's bottom surface using the Microstation Terrain
Modeler product. This software uses a method known as Delauney's criteria for triangulation. A
triangle is formed between three non-uniformly spaced points, including all points along the
boundary. If there is another point within the triangle, additional triangles are created until all
points lie on the vertex of a triangle. This method preserves all data points for use in determining
the solution. The set of three-dimensional triangular planes represents the actual bottom surface.
Once the triangulated irregular network (TIN) is formed, the software then calculates elevations
along the triangle surface plane by solving the equations for elevation along each leg of the
triangle. Areas that were too shallow for data collection or obstructed by vegetation were
estimated by the Modeler product using this method of interpolation. Any difference between the
estimated volume and the actual volume is believed to be minor because the shallow areas do not
contain significant amounts of water. From this three-dimensional triangular plane surface
representation, the Modeler product calculated the surface area and volume of the entire reservoir
at one-tenth of a foot intervals.
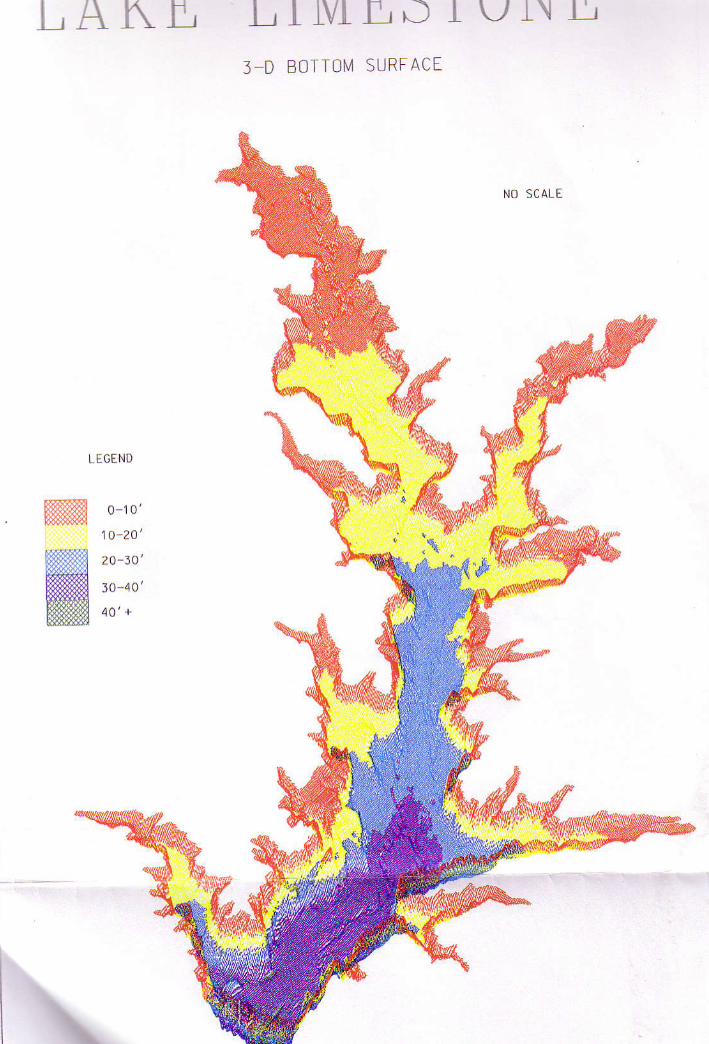
The three-dimensional triangular surface was then converted to a regular matrix of
elevation values, or a grid. A grid spacing of one hundred feet was chosen for this presentation, to
produce an illustration that would be easy to visualize, but not so dense that it would obscure
features. A vertical exaggeration of fifty was used to create a perception of depth within the
draawing. Figure 3 is a graphical representation of a grided version of the three-dimensional
DTM. Figure 4 presents a two-dimensional version of the same map, using bands of color
increasing in intensity from shallow to deep water.
The DTM was then smoothed and linear smoothing algorithms were applied to the
smoothed model to produce smoother contours. The following smoothing options were chosen for

12
this model: Douglas-Peucker option with a zero tolerance level to eliminate any duplicate points,
and Round Corners with a delta of 50 feet in an attempt to smooth some of the angularity of the
contours. Contours of the bottom surface at two foot intervals are presented in Figure 5.
DATA
Many of the trees in the fifteen-year-old lake have rotted off at the water line, but have not
been submerged long enough to decompose. The submerged branches posed a significant hazard to
navigation, and resulted in an increased survey collection time. Lake Limestone inundates
approximately 14 river miles of the Navasota River upstream of Sterling C. Robertson Dam. The
deepest portions of the lake are found within the area immediately adjacent to the dam. The DTM
shows a fairly well-defined channel characterized by intermittent deep pockets. This channel lies
within a a wide, flat floodplain that is bounded by relatively steep side slopes.
The 1989 aerial photo reflects significant sedimentation along the Navasota River. The
data collected in this area corresponds with the aerial photo and the revised boundary. Lake
Limestone was estimated by this survey to encompass 13,379 acres and to contain a volume of
215,751 acre-feet at the normal pool elevation of 363.0 feet. The reservoir volume table is
presented in Appendix B, Page 1 and the area table in Appendix C, Page 1. The one-tenth foot
intervals are based on actual calculations from the model. An elevation-area-volume graph is
presented in Appendix D, Page 1. The surface elevation of the lake was at or above the normal
pool elevation during the survey. Since the boat cannot negotiate in shallow water, at a minimum
the upper two feet are based on a straight-line interpolation from the last data points collected to
the normal pool elevation lake boundary as digitized. The positional data collected in the field
corresponds well with the boundary obtained from the photo-revised USGS map and aerial photo.
The Board does not represent the boundary, as depicted in this report, to be a detailed actual
boundary. It is an approximation of the actual boundary used to compute the volume and area
within the upper elevations.

13
The storage volume calculated by this survey is approximately 4.3 percent less than the
previous record information for the lake. The low flow outlet is at elevation 320.0 feet, resulting
in dead storage of three acre-feet. Therefore the conservation storage for the reservoir is
calculated to be 215,748 acre-feet.
SUMMARY
The lowest elevation encountered during this survey was 317.5 feet, or 45.5 feet of depth.
The conservation storage was calculated to be 215,748 acre-feet. The estimated reduction in
storage capacity is 9,652 acre-feet, or 4.3 percent less than that recorded in the permit. It is
assumed that the reduction in estimated storage is due to both a combination of sedimentation, and
improved data and calculation methods. Repeating this survey with the same calculation
methodology in five to ten years or after major flood events should remove any noticeable error
due to improved calculation techniques and will help isolate the storage loss due to sedimentation.
A-1
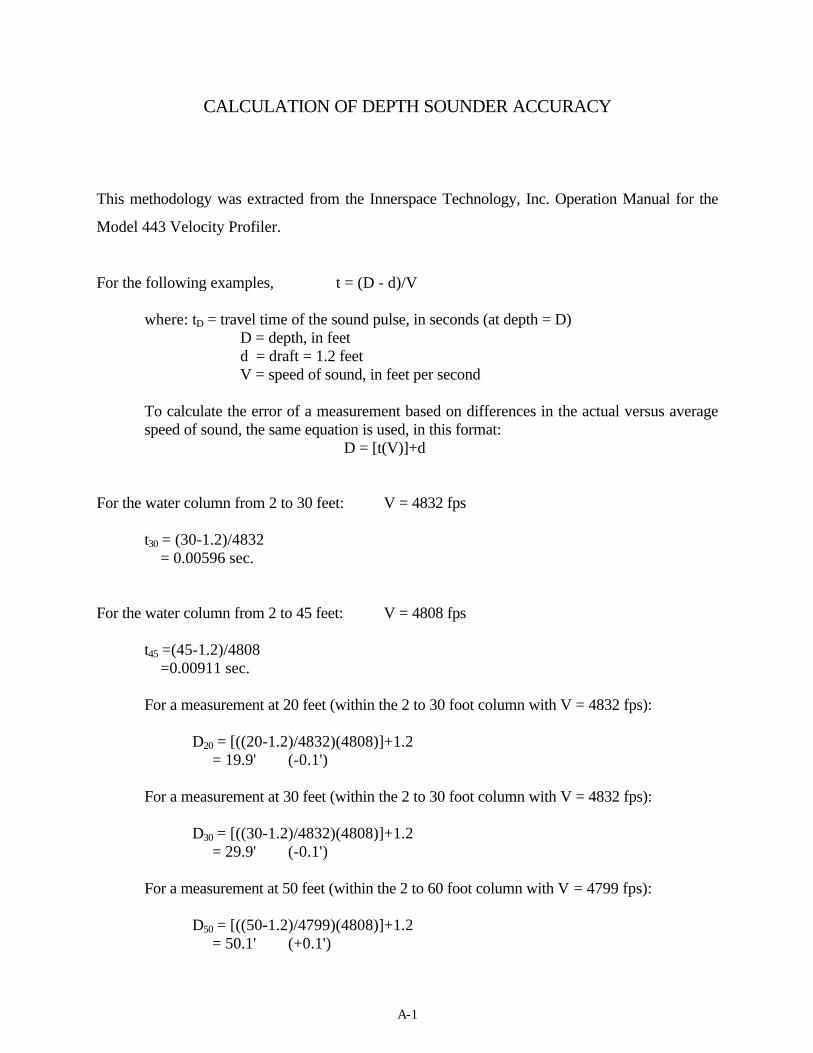
CALCULATION OF DEPTH SOUNDER ACCURACY
This methodology was extracted from the Innerspace Technology, Inc. Operation Manual for the
Model 443 Velocity Profiler.
For the following examples, t = (D - d)/V
where: tD = travel time of the sound pulse, in seconds (at depth = D)D = depth, in feetd = draft = 1.2 feetV = speed of sound, in feet per second
To calculate the error of a measurement based on differences in the actual versus averagespeed of sound, the same equation is used, in this format:
D = [t(V)]+d
For the water column from 2 to 30 feet: V = 4832 fps
t30 = (30-1.2)/4832 = 0.00596 sec.
For the water column from 2 to 45 feet: V = 4808 fps
t45 =(45-1.2)/4808 =0.00911 sec.
For a measurement at 20 feet (within the 2 to 30 foot column with V = 4832 fps):
D20 = [((20-1.2)/4832)(4808)]+1.2 = 19.9' (-0.1')
For a measurement at 30 feet (within the 2 to 30 foot column with V = 4832 fps):
D30 = [((30-1.2)/4832)(4808)]+1.2 = 29.9' (-0.1')
For a measurement at 50 feet (within the 2 to 60 foot column with V = 4799 fps):
D50 = [((50-1.2)/4799)(4808)]+1.2 = 50.1' (+0.1')

A-2
For the water column from 2 to 60 feet: V = 4799 fps Assumed V80 = 4785 fps
t60 =(60-1.2)/4799 =0.01225 sec.
For a measurement at 10 feet (within the 2 to 30 foot column with V = 4832 fps):
D10 = [((10-1.2)/4832)(4799)]+1.2 = 9.9' (-0.1')
For a measurement at 30 feet (within the 2 to 30 foot column with V = 4832 fps):
D30 = [((30-1.2)/4832)(4799)]+1.2 = 29.8' (-0.2')
For a measurement at 45 feet (within the 2 to 45 foot column with V = 4808 fps):
D45 = [((45-1.2)/4808)(4799)]+1.2 = 44.9' (-0.1')
For a measurement at 45 feet (within the 2 to 45 foot column with V = 4808 fps):
D80 = [((80-1.2)/4785)(4799)]+1.2 = 80.2' (+0.2')

tItIITTIIIIIIIIIIIt
LAKE LIITESTOIIE
Volt ,lE lll ICRE_FEEI. 1 . 2 . 7
^t4 23 1.tt8
. 8
IEXAS SATER DEVELET€TT BOAIOIESERVOIR VOTI'IC TAEIE
EIEVAIIOII IIICREI4ENT IS ONE TEIITII F@T
ELEV. FEET
3173t83 t 9320t21tzz
321
326
tzatz9
:i:
331
340311
l4t344345316347348349!50351352553
t56357
559360?41362155
. 0
138
1 9
1911Al
15512405t164471162137890981I
11985'14117
171402010523269266143017933?'381t5424301Zj6952562581?064011470!'25n126842i19172999612
107989'l15T26
lzrAV13541611536715580116673317a216'190257
202720215751
156
n2155 1 8976
1526
4Ea06t7lE071
10019'lzzt4
1467617427?01112359526965305163t396!854242994474745r1015870164702710797m178495192500
100457108a4t'l't7622
126a14136591146387156a7116?a5617912619t481203997
13
EO25E557
1032'1703
25013702502265t04254
10228124171493817f1520721
27312!09183479434972
4838?5364159ZBtl6532471736785128569E93276
101276109704114522127n5137371117113157914t6a98a180611'19271'l
I
t 02790
,97l0a9tru2702l8z45154.692u40
10438t26S!1520t18007zt03z2125427(634t295
5940313937488915114759869659487Xt9779213&1t994056
t02101110567'n9126
12859E13435411U44159029170124181802'193946
1
l l3 l
l0 l249
't't4a1855280439tt9t3096€57E626
1055r1Z9Zt1r171ramo213462$47280t4t1671tt6t l1983944115{940551735604596l�5n7!�05079917E718394UZ
10293?1t 1435120555129616139317119179160t151712671A29961951842074r5
1
1 Z
'tt5
317
lz1019492909LOt6
70236E19
10857t5165117421E5952166�22192028!705?050
402784149749924,52926105167?1175724406278793e95629
t0576:t112307121249130597140335150519r612051724151Ut97196124?w1t3
25
40'126
727t274zotS50151201s603719290tl
1t085t3{09160 t71849:tu9n
2472632451364�35407214538!5%tr55584761553678/�771399813t86C69296/t25
t0461tt!11182't22167
131t5{1113?41r1r661625001735701853991976nzl0r'.,r9
6t 5
'l4l
t7a7t3
1t1o212531214335575373539209
11305136471629t1919222299?5595?9086t2421368504116545475509695&10622516&47750n620558943897222
105441| 1405118084152514'112235
152617163102171ZJl18{{o7198930x1n0
6 716 1851 57
157 175111 111au 471
1a08 14742216 23103226 334944!a 4601t905 605E7535 VIZ9407 9609
11529 | 175513907 1416116573 1585519491 19n822620 2294421932 2627429447 29A123r2W t 6023726a 3769141616 4ZOf146364 4e51497 5202756974 575�1662860 6347169t10 69787575t 7Ul7a27E 8350190't97 9096298!21 98432
1052E6 107115111915 115835t24013 124913133476 1341441{334t 1443531536?3 1517341&505 165518t75B9a 1nO8t87819 189015200!88 201451213090 211117

TEXAS gATER DEVEIOPI4EIIT EOARD
RESERVOIR ATEA TAEIE
lus 23 1993
1
6t 5
'170
33744969292t
112l'1312
152417152000
25 t9241030283221t107t529!910420045t6
529456796081&47581672307612ao46ua88t89276965'
1008510589110821164612113t261o13225
LAKE LITIESTO}IE
AREA I[ ^CIES. 1ELEV. FEET
3173tElt9t20321
32t325tz63273283293t03!1
334335
337!38
3LO341342
344315
148t19
35t352
355
35E35956035136?l63
ELEV TtOtI lrctEtlElll Is ollE TEliTll fooT
. 0
I
720
201
5277!a961
116613W156417932051
?457to67t259344636403972125546155051,3625m6t576t1769017305759581lZ
894193519735
101761058611t91't t785122301271913379
t
8
az?203n,4'
97911E911041585tE19zo74
2601nn30E7327634683706100242834665t0625398580961976551
7737417685Et8982
a797t5
10226107t'11257
118E�Z12271lzm
1
9
9t
395,54783997
lz'1311211608184t20962344
29001107t294t49037t11032431247155093543658476?3465866983EUnao4221u 1 7902194249417
102r|107841133311479'12320
12833
v1022564105UE06
10171255'1137
1632187121192t76
3t26331235143874061434117595126
584762706521702174227423426786569067%61986l
10327t0833'11399
1l9?5't236
12494
1039
3272125
E5010371256145416541898
z10t97
31453!305536va740904372{401515955t4
63086655?06374607867E3098695911094999907
t0380t0882111531196912113't?9s6
I
1 1
126284
&7856
t0571?V14721575'l9zz
21{624tt
!155!5481559:tat64 t t 8440548l�151935553
669171037494791383498735915295379951
't0436
t095111523120111216015020
t
1 249
1403041tt6tr98&)
'l07g
129814881700196821922461275429863185
3847411t44404489s22555936000538067tO7146
n60al9la7n91959r75999'
10489109Er1158012017t250911086
1
61 353
154321170670903
I10015201505't722
197t
249027835005
5386360t
4173
49245261563t6011u1367t3714987280048450881692379615
1004010539t105111635121001255913t55
I57
1 76
185
508714
| 145'l!61
1541176a20272Z7l2547283430173212:,1,26
45654999532757306119&4268597267
80898507890193149695
1013010537
11736121461265313300

I
.t.I
I
*
t \
rL \
a -
ault"LllJ(!
g
E
aul(E
fi(rul
trE,
0
1,000
2,000
3,000
4,000
5,000
6,000
7,000
8,000
9,000
10,000
1 1,000
12,000
13,000
:14,000
15,000
230,000220,000210,000200,000190,000180,000170,000160,000150,000140,000130,000120,OOO1 10,000'100,000
90,00080,00070,00060,00050,00040,00030,00020,00010,0000
330 340 350ELEVATION (FEEI)
SURFACEAREA CAPACITY--ra- --.F--
LAKE LIMESTONEPrepared by: TWDB August 1 993
370360
D-t
IItIIItIItI
II
F I G U R E 1
T_,AKEn_,n \4ESI lONrL O C A T ] O N M A P
I- N -
jli
1 " = 2 . 4 M I L E S
BOX CHURCH
N E A H D P E
@
L 0 N 0 H 0 L L 0 r { BL]F F AL O
IttIIIIIIII
IttItIItI
F I G IJRE 2
{ , A K E N,T \ , {ES I IONTL O C A T I O N O F S U R V E Y D A T A
IN '
/{l
0 , 0 0 0 '
L E G E N D
- APPROX. 199] B€UNDARY( F R O M 1 ! 3 9 A E F I A L P H O J O )
I3 ' I3 BOUNOARY
LOCAI ION OF DATA COLLECTEO
E LOCAI ION OF SHORE SIATTDN
P R E P A R E D B Y . T W D B S E P T E M B E R 1 9 9 3
TItIII
L A K t r LIIVItL) T UI\ I - ,3_D BOTTON4 SURFACE
NO SCALE
LEOEND
ffi
ffi0 - 1 0 '
10 -2A '
20 -30 '
4 0 ' 1 .

TtTItIIIIIIIIIII
F I GL ]RT 4
{_,AKE{ - ,nN,frsT0NrD T P T F ] R A N G I S
2 0 - 3 0l 0 4 c
,l
- N -
,lI
1 " = 1 0 , 0 0 0 '
IP R E P A R E D B Y : T w D B S E P T E M B E R 1 9 9 3


