Dealers’ attitude and perception towards Supply Chain characteristics of Bharat
Petroleum Corporation Limited (BPCL)
Dr.R.Renganathan1, Dr.C.Vijayabanu2, Dr.V.Srinivasakumar
3, Dr.V.Vijayanand
4,
S.Divyadharshini5
1-4 Faculty, School of management, SASTRA University, Thanjavur
5 Faculty, School of management, SASTRA University, Thanjavur
Abstract
Supply chain management is vital for the survival, business performance and the
profitability of any organization. In order to meet the demand and requirement of customers,
supply chain management is very significant. For the survival and success of any firm
performance of supply chain is important but for the past few years to attain the required
supply chain performance organizations are undergoing heavy pressure. The supply chain of
Petroleum industry involves many transportation processes right from the purchase of crude
oil till reaching the customers. The channel member includes the suppliers, dealers and the
customers. The rationale of this study is to investigate the opinion of the dealers towards
their suppliers about the supply chain practices of BPCL and also to measure the supply
chain performance. For the purpose of this research, primary and secondary data are
utilized. The data for this study are collected from 60 dealers in Trichy, Ariyalur and
Perambalur districts. The structured questionnaire which comprises of both open and closed
-ended questions is used for the collection.
To measure the supply chain performance factors like product quality, supplier
dealer relationship, information sharing between the suppliers and dealers, time and the cost
aspects are included. It is found that dealers are in general, satisfied with the Supply chain
aspect of the suppliers. Aspects like grievance redressal, problem solving and
communication between dealers and suppliers have to be improved. The opinion of dealers
about the performance of supply chain will be useful to BPCL and also for the further
improvement in the supply chain practices to enhance the service levels.
Keywords: Intermediaries, Dealers, Supply chain, Attitude, Performance, Satisfaction,
Petroleum.
International Journal of Pure and Applied MathematicsVolume 119 No. 7 2018, 2495-2509ISSN: 1311-8080 (printed version); ISSN: 1314-3395 (on-line version)url: http://www.ijpam.euSpecial Issue ijpam.eu
2495
Introduction
To manufacture and sell the product, a supply chain is the linked with a group of
individuals, organizations, resources, activities, and technologies. In order to deliver the
finished product to the end user, a supply chain begins with the raw material from supplier to
the manufacturer and other intermediaries like a wholesaler, distributors, and retailers.
From raw material to finished goods each and every aspect of the business is taken care
by Supply Chain Management (SCM). Even though many activities and several partners are
involved in supply chain network, because of the efficient supply chain, revenue can be
increased by reducing costs. Right product, at the right time, right place and at the right Cost
to the customer can be achieved with the help of the supply chain.
The ultimate goal of any effective supply chain management system is to reduce
inventory. Supply chain management, by means of controlling the supply side activities of
any business, can provide value to the customer and achieve an advantage over competitors
in the marketplace. Economical and efficiency aspects of the supply chain can be assured by
the partners of supply chain network.With the help of proper management of the supply
chain, products delivery can be rapidly done to the customer and companies can reduce the
costs by means of controlling the inventory across the various parts of supply chain process.
Product, information, and fiancés are the most important aspects of Supply chain
management process.
In India, Bharat Petroleum has fuel stations across various places and sell petrol,
diesel, automotive LPG and CNG. In order to select dealers and allocate dealership for their
fuel station, Bharat Petroleum Corporation in India gives advertisement infamous dailies of
the various states across the country (https://www.bharatpetroleum.com/).
Statement of the Problem
Supply Chain Management is very important to any company nowadays for its
survival and growth. In Petroleum industry, the opinion of dealers about the supply chain
aspects of suppliers is extraordinarily important because the petrol pump dealers directly
deliver the petroleum products to the end customers. This study is focused on the dealers‟
opinion towards the supply chain aspects of BPCL.
Objectives of the study
To understand the perception of Bharat Petroleum Corporation Limited (BPCL)
dealers towards BPCL regarding various attributes of the supply chain performance.
International Journal of Pure and Applied Mathematics Special Issue
2496
To ascertain the demographic profile of BPCL dealers of Trichy, Ariyalur and
Perambalur districts of Tamil Nadu.
To understand the supply chain practices of BPCL.and to know the supplier-retailer
relationship.
To know the supply chain related problems faced by BPCL dealer.
To provide some suggestions to minimize the supply chain related problems of the
dealers.
Scope of the study
The scope of the study is to increase the service levels provided to BPCL dealers to
make the relationship between BPCL and their dealers more stronger. With the increasing
demand for petroleum products and the development in the automobile industry, there is a
huge opportunity for the petroleum sector. To enhance the availability of oil products in
India, the government would like to provide a number of retail outlets in the coming years,
that may pave the opportunity to enhance dealership base for petroleum products. For the
purpose of this study, dealers from Trichy, Ariyalur and Perambalur districts are included.
Research Methodology
60 dealers from Trichy, Ariyalur and Perambalur districts were taken for the study. Primary
data was collected from 60 respondents (Trichy, Ariyalur and Perambalur districts BPCL
Dealers) using a well- structured questionnaire. The questionnaire used for the survey
comprises of both open and close-ended questions. Internet, research papers, management
books, journal and newspaper articles were the sources of secondary data. Percentage
analysis, Mean and Standard Deviation, Chi -square analysis, Reliability analysis and Factor
analysis were used for data analysis.
Limitations of the study
The study was done with reference to Trichy, Ariyalur and Perambalur districts only.
Out of 74 petrol pumps (Trichy, Ariyalur and Perambalur districts), 60 petrol pumps
were taken for the study.
The opinion expressed by the dealers at a particular period of time may not be
applicable always. The survey was done for one month only.
Review of Literature
More than a slogan “People Above Oil” is a commitment to Bharat Petroleum Corporation
Limited. With regard to supply chain performance in the petroleum industry, customer,
financial, internal business process, innovation, and learning are important, Siddharth Varma
International Journal of Pure and Applied Mathematics Special Issue
2497
et al., (2008). Depending upon the stages in the product life cycle of a product, kind of supply
chain will also be diverse, Fisher (1997). According to Fidel Santos Manzano(2005),
upstream activities of the petroleum industry deal with the final production of crude oil & gas
and other activities like marketing and distribution of products from crude oil. Plans for
information technologies design and implementation, change management and process re-
engineering are required to set up a flourishing supply chain strategy development,
Lewin(2003). According to Mintzberg (1979), other than the input and output process of
supply chain network, for the firms‟ performance, companies have to concentrate on the
aspect of internal management. Supply chain management is the methodical, strategic
organization of the conventional business functions, Mentzeret (2001) to progress the
performance of the companies and supply chain. Creation, Integration, and Globalization are
the main movements which are experiential in the of supply chain management studies,
Movahedi B, (2009). According to Chan F.T.S, (2003) to classify the SCM, manufacturing,
outbound logistics, supplier, inbound logistics, marketing and sales and end customers are
connected. In the changing environment supply chain should react to the challenges that
come out due to alteration, Brewer P.C, (2000). Morgan, (2004), emphasized in his study
that, within supply chains, there are nine prerequisites which are essential for the successful
and dynamic performance measurement. Panizzolo, (2012), identified the transition of
supplier relationship management to partner relationship from the conventional and logistic
relationship. According to Jenkins.G, (1998), every stage in the logistics network faces
several challenges because of the potential of the suppliers of crude oil, extensive lead times
in transportation and restrictions in the various form of transportation .The supply chain can
facilitate to meet the demand in the marketplace with the help of collaboration and also
ensure customer satisfaction and minimization of inventory, Korgaonker.M.G, (1999).
Data analysis and interpretation
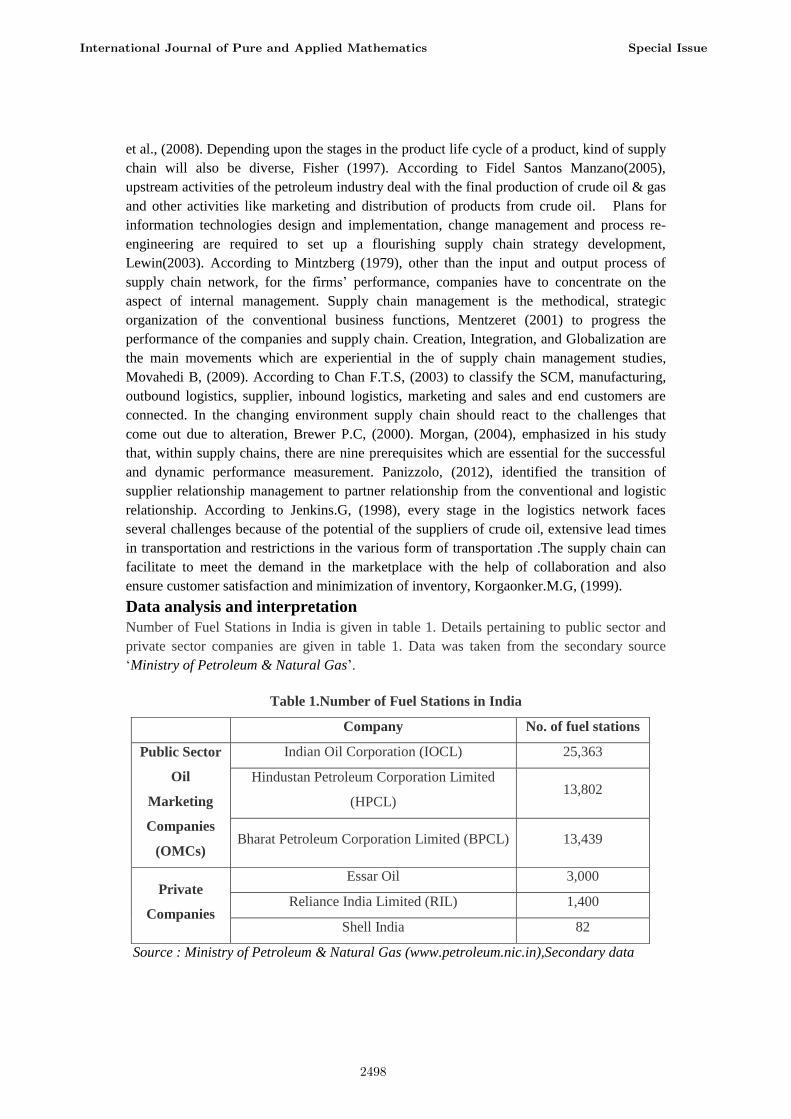
Number of Fuel Stations in India is given in table 1. Details pertaining to public sector and
private sector companies are given in table 1. Data was taken from the secondary source
„Ministry of Petroleum & Natural Gas‟.
Table 1.Number of Fuel Stations in India
Company No. of fuel stations
Public Sector
Oil
Marketing
Companies
(OMCs)
Indian Oil Corporation (IOCL) 25,363
Hindustan Petroleum Corporation Limited
(HPCL) 13,802
Bharat Petroleum Corporation Limited (BPCL) 13,439
Private
Companies
Essar Oil 3,000
Reliance India Limited (RIL) 1,400
Shell India 82
Source : Ministry of Petroleum & Natural Gas (www.petroleum.nic.in),Secondary data
International Journal of Pure and Applied Mathematics Special Issue
2498

Table.2. Th demographic profile of the respondents
3. Region of the Petrol pump
As per the table3, it is clear that 65% of the petrol pumps are located ionn highways and
21.7% of the petrol pumps taken for the study are located in the urban region.
Table 4. Ownership of the Petrol pump
Particulars % Particulars %
Age 17-27 years 5.0 Years of
Existence
of the
Petrol
pump
Less than 5 years 28.3
28-37 years 18.3 5-10 years 31.7
38-48 years 38.3 11-15 years 3.3
49 & above 38.4
Educational
qualification
SSLC 6.7 16-20 years 5.0
HSC 11.7
More than 20 yrs. 31.7
UG 70.0
PG 11.7
Gender Male 80.0
Female 20.0
No. of
Employees
in the Petrol
pump
5-7 18.3
8-10 35.0
More than 10 46.7
Frequency Percent
Urban 13 21.7
Rural 8 13.3
Highways 39 65.0
Total 60 100.0
Frequency Percent
Partnership 17 28.3
Proprietorship 42 70.0
Company 1 1.7
Total 60 100.0
International Journal of Pure and Applied Mathematics Special Issue
2499
As per the table 4, it is inferred that 70% of the dealers taken for the study are following
proprietorship form of ownership, 28.3% of the dealers taken for the study are following
partnership form of ownership.
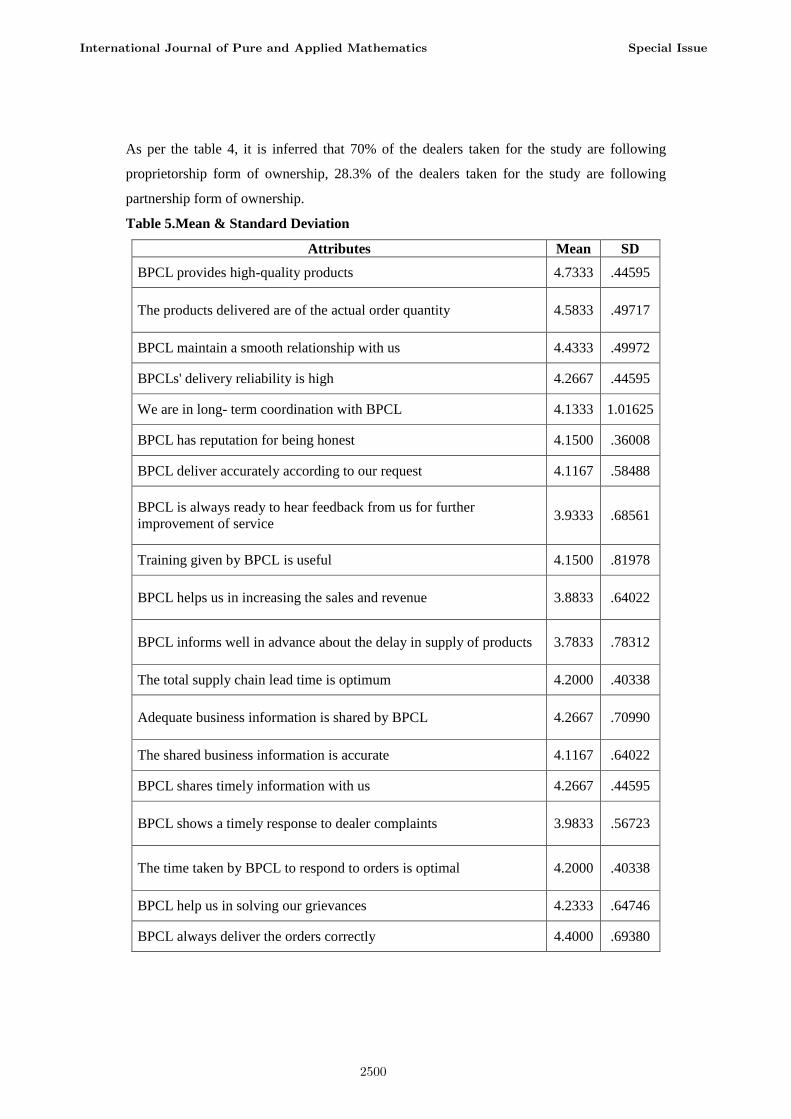
Table 5.Mean & Standard Deviation
Attributes Mean SD
BPCL provides high-quality products 4.7333 .44595
The products delivered are of the actual order quantity 4.5833 .49717
BPCL maintain a smooth relationship with us 4.4333 .49972
BPCLs' delivery reliability is high 4.2667 .44595
We are in long- term coordination with BPCL 4.1333 1.01625
BPCL has reputation for being honest 4.1500 .36008
BPCL deliver accurately according to our request 4.1167 .58488
BPCL is always ready to hear feedback from us for further
improvement of service 3.9333 .68561
Training given by BPCL is useful 4.1500 .81978
BPCL helps us in increasing the sales and revenue 3.8833 .64022
BPCL informs well in advance about the delay in supply of products 3.7833 .78312
The total supply chain lead time is optimum 4.2000 .40338
Adequate business information is shared by BPCL 4.2667 .70990
The shared business information is accurate 4.1167 .64022
BPCL shares timely information with us 4.2667 .44595
BPCL shows a timely response to dealer complaints 3.9833 .56723
The time taken by BPCL to respond to orders is optimal 4.2000 .40338
BPCL help us in solving our grievances 4.2333 .64746
BPCL always deliver the orders correctly 4.4000 .69380
International Journal of Pure and Applied Mathematics Special Issue
2500

I am satisfied with the performance of BPCL 4.4333 .49972
BPCL respond to quality related problems properly 4.4333 .49972
Delivery of the products id flexible 4.3000 .72017
We are well informed about the forthcoming promotions of BPCL 4.2333 .85105
When supply disruptions occur, BPCL provides alternate solutions 4.0667 .25155
BPCL let us know about the possible problems that affect our
business 4.1667 .86684
Cost of MAK lubricants is normal 4.2167 .69115
Discounts/Schemes provided by BPCL is attractive 4.2500 .85618
I will definitely recommend BPCL to others 4.4333 .49972
If I happen to avail one more outlet, I will definitely choose BPCL 4.4333 .49972
The overall supply chain performance of BPCL is satisfiable 4.5833 .49717
It can be inferred from table 5, almost all the mean values for the attributes are above 4.0.
The maximum value (4.73) is for the attribute „BPCL provides high- quality products‟ and the
minimum value (3.78) is for the attribute „BPCL informs well in advance about delay in
supply of products‟.
The hypothesis for the study-Null Hypothesis
H01: There is no relationship between gender and recommending BPCL to others.
H02 There is no strong relationship between gender and opinion about choosing BPCL
if it happens to avail on more outlet.
H03:There is a no relationship between age of the dealers and their opinion towards
recommending BPCL to others.
H04 There is a no relationship between age of the dealers and their opinion towards
recommending BPCL to others.
H05 : There is no relationship between age of the dealers and choosing BPCL if it
happens to avail one more outlet.
H06 :There is a no relationship between the age of the dealers and the overall supply
chain performance of BPCL
International Journal of Pure and Applied Mathematics Special Issue
2501

H07 :There is no relationship between educational qualification of the dealers and
their opinion towards recommending BPCL to others
H08 :There is no relationship between educational qualification of the dealers and
choosing BPCL if it happens to avail one more outlet
H09 :There is no relationship between educational qualification of the dealers and the
overall supply chain performance of BPCL
H10 :There is no relationship between operating years of the petrol pump and the
opinion of dealers towards recommending BPCL to others
H11 :There is no relationship between operating years of the petrol pump and choosing
BPCL if it happens to avail one more outlet
H12 :There is no relationship between operating years of the petrol pump and the
overall supply chain performance of BPCL.
Table 6: CHI-SQUARE TEST
S.No Demographic
profile
Particulars
Pearson Chi-Square NULL
HYPOTHESIS
Value Df
Asymp.
Sig. (2-
sided)
1 Gender of the
Dealers
Opinion towards
recommending BPCL
to others
.035 1 .851
Accepted
2 Gender of the
Dealers
Opinion towards
definitely choosing
BPCL itself, if it
happens to avail one
more outlet
.102 1 .750
Accepted
3 Gender of the
Dealers
Opinion towards
overall supply chain
performance of BPCL 2.739 1 .098
Accepted
4 Age of the
Dealers
Opinion towards
recommending BPCL
to others
60.000 3 .000
Rejected
5 Age of the
Dealers
Opinion towards
definitely choosing
BPCL itself, if it
happens to avail one
more outlet
40.000 3 .000
Rejected
11 Age Opinion towards
overall supply chain
performance of BPCL 35.314 3 .000
Rejected
International Journal of Pure and Applied Mathematics Special Issue
2502

Source: Primary data
Reliability Analysis
Table 7Reliability Statistics
Cronbach's Alpha N of Items
.949 30
The Cronbach‟s Alpha value for 30 items is 0.949 which is above 0.7. Hence the collected
data has high reliability.
12 Educational
Qualification
Opinion towards
recommending BPCL
to others 16.503 3 .001
Rejected
13 Educational
Qualification
Opinion towards
definitely choosing
BPCL itself, if it
happens to avail one
more outlet
14.926 3 .000
Rejected
14 Educational
Qualification
Opinion towards
overall supply chain
performance of BPCL
24.696 3 .000
Rejected
15 Operating
years of petrol
pump
Opinion of Dealers
towards
recommending BPCL
to others
11.261 3 .010
Rejected
16 Operating
years of petrol
pump
Opinion towards
definitely choosing
BPCL itself, if it
happens to avail one
more outlet
10.176 3 .000
Rejected
17 Operating
years of petrol
pump
Opinion of Dealers
towards overall supply
chain performance of
BPCL
4.320 3 .229
Accepted
18 Education
Qualification
To recommend
Karaikudi to others 89.692 21 .000 Rejected
19 Occupation To recommend
Karaikudi to others 133.825 21 .000 Rejected
20 Annual
income
To recommend
Karaikudi to others 58.512 14 .000 Rejected
International Journal of Pure and Applied Mathematics Special Issue
2503

Factor Analysis
Table 8 KMO & Bartlett’s Test
Kaiser-Meyer-Olkin Measure of Sampling adequacy 0.758
Barlett‟s Test of Sphericity
Approx Chi – Square 1.815
Degrees of freedom 59
Significance 0.000
Table 8 gives the KMO measure of sampling adequacy and the Barlett‟s test of sphericity.
The KMO measure of sampling adequacy value is o.758 which is greater than the acceptable
value o.6. Hence factor analysis can be used for the study.
Table 9 Total Variance Explained
Component
Initial Eigen values Extraction Sums of Squared
Loadings
Extraction
Total % of
Variance
Cumulative
% Total
% of
Variance
Cumulative
%
1 15.098 50.325 50.325 15.098 50.325 50.325 .991
2 6.163 20.544 70.870 6.163 20.544 70.870 .999
3 3.107 10.357 81.226 3.107 10.357 81.226 .999
4 2.211 7.370 88.596 2.211 7.370 88.596 .985
5 1.500 4.999 93.596 1.500 4.999 93.596 .999
6 1.119 3.731 97.327 1.119 3.731 97.327 .784
7 .765 2.549 99.875 .856
8 .037 .125 100.000 .999
9 1.39E-
015
4.64E-
015 100.000 .993
10 9.36E-
016
3.12E-
015 100.000 .929
11 8.30E- 2.77E- 100.000 .981
International Journal of Pure and Applied Mathematics Special Issue
2504

016 015
12 5.42E-
016
1.81E-
015 100.000 .999
13 4.29E-
016
1.43E-
015 100.000 .983
14 3.50E-
016
1.17E-
015 100.000 .996
15 2.79E-
016
9.30E-
016 100.000 .985
Table 9 sum up the total variance depicted by the Factor analysis solution and provides
suggestion towards the number of factors which are useful. As per the table 9, it is clear that 6
extracted factors explain 97.3% of the variance. Moreover, 89.4% of the variance in „Security
and safety measures are adequate‟ is explained by the extracted factors
Major findings of the study
It is inferred that 31.7% of the petrol pumps are being operated for both more than 20
years and between 5-10 years, 28.3% of the petrol pumps are being operated for less
than 5 and 5% of the petrol pumps are being operated between 16-20 years.
It is inferred that 78% of the dealers use RTGS/NEFT for making payments to BPCL
and 22% of the dealers use Net Banking for making payments to BPCL.
It is clear that 86.7% of the dealers use mobile phone for sharing information with
BPCL and 13.3% of the dealers use E-mail for sharing information with BPCL.
It is clear that 65% of the petrol pumps are located in highways and 21.7% of the
petrol pumps taken for the study are located in urban region.
It is inferred that 70% of the dealers taken for the study are following proprietorship
form of ownership, 28.3% of the dealers taken for the study are following partnership
form of ownership.
It is clear that 57% of the dealers strongly agree that they would definitely
recommend BPCL to others and 43% of the dealers agree that they would definitely
recommend BPCL to others.
It is inferred that 57% of the dealers strongly agree in definitely choosing BPCL itself
if it happens to avail one more outlet and 43% of the dealers agree in definitely
choosing BPCL itself, if it happens to avail one more outlet.
International Journal of Pure and Applied Mathematics Special Issue
2505
It is clear that 58% of the dealers strongly agree that they are satisfied with the overall
supply chain performance of BPCL and 42% of the dealers agree that they are
satisfied with the overall supply chain performance of BPCL.
It is clear that almost all the mean values for the attributes are above 4.0. The
maximum value (4.73) is for the attribute „BPCL provides high- quality products‟ and
the minimum value (3.78) is for the attribute „BPCL informs well in advance about
the delay in supply of products‟.
There is no strong relationship between gender of the dealers and their opinion
towards recommending BPCL to others.
There is no strong relationship between gender of the dealers and their opinion
towards definitely choosing BPCL itself if it happens to avail one more outlet.
There is a strong relationship between gender of the dealers and their opinion towards
overall supply chain performance of BPCL.
There is a strong relationship between age of the dealers and their opinion towards
recommending BPCL to others.
There is a strong relationship between age of the dealers and their opinion towards
definitely choosing BPCL itself if it happens to avail one more outlet.
There is a strong relationship between the age of the dealers and the opinion towards
overall supply chain performance of BPCL.
There is a strong relationship between educational qualification of the dealers and
their opinion towards recommending BPCL to others.
There is a strong relationship between educational qualification of the dealers and
their opinion towards definitely choosing BPCL itself if it happens to avail one more
outlet.
There is a strong educational qualification of the dealers and their opinion towards
overall supply chain performance of BPCL.
There is a strong relationship between operating years of the petrol pump and the
opinion of dealers towards recommending BPCL to others.
There is a strong relationship between operating years of the petrol pump and the
opinion of dealers towards definitely choosing BPCL itself if it happens to avail one
more outlet.
There is no strong relationship between operating years of the petrol pump and the
opinion of dealers towards overall supply chain performance of BPCL.
International Journal of Pure and Applied Mathematics Special Issue
2506

Suggestions
The grievance handling system is suggested to be more effective in order
to minimize the supply chain related problems.
It is suggested to respond to dealer problems as soon as possible which
will increase the trust towards BPCL.
The training given to the petrol pump employees is suggested to be given
as on the job training so that the employees get more practical training.
It is suggested to allow a person especially for attending dealer phone calls
in the depot (Karur).
Maintenance service for the petrol pumps can be improved
It is suggested to make necessary steps to solve the prevailing automation
problem faced by dealers.
It is also suggested to improve the contractor‟s efficiency in handling
maintenance and automation related problems in order to avoid
unnecessary queuing in complaints.
Conclusion
It is concluded from the study that the overall supply chain performance of BPCL is
optimum. The BPCL dealers are highly satisfied with the BPCL product quality, cost, and
delivery reliability of products. The use of information technology in information sharing by
BPCL is excellent; the Mobeconnect app is used for placing orders, making payments, also
registering the complaints. PDP (Planned Delivery Program), BROMA (Bharat Petroleum
Retail Outlet Maintenance Application) help dealers to easily communicate with BPCL
regarding the order placements and registering complaints. Effective grievance handling
system will improve the positive perception of BPCL dealers towards BPCL which will
thereby help in increasing the brand image of the company.
References
Brewer P.C, S. (2000). The balanced scorecard to measure supply chain performance. Journal
of Business Logistics, 75-93.
Chan F.T.S, Q. H. (2003). An innovative performance measurement method for supply chain
management, Supply Chain Management. An International Journal, 8 (3), 209-223.
International Journal of Pure and Applied Mathematics Special Issue
2507
Fidel Santos Manzano (2005).‟ Supply Chain Practices in the Petroleum Downstream‟,
Engineering Systems Division, Master of Engineering in Logistics, Massachusetts Institute of
Technology .p7.
Fisher, M.L., 1997, "What is the Right Supply Chain for Your Product?", Harvard Business
Review, March-April, pp. 105-116.
Jenkins.G. (1998). Managing inflexible supply chains. International Journal of Logistics,
Vol. 9:2, p. 83-90
Korgaonker.M.G. (1999, February). Integrated supply chain management. The Industry
Magazine , pp. 73-82.
Lewin, G., 2003, "A customer-led strategy for managing the downstream oil supply chain",
World Energy, June.49
Mentzeret. (2001). Defining Supply Chain Management. Journal of Business Logistics, 22
(2), 1-25.
Mintzberg. (1979). Supply Chain Management Research and Production and Operations
Management: Review, Trends, and Opportunities. In: Production and Operations
Management. Production and Operations Management, 15 (3), 449-469.
Morgan. (2004). Structure, speed, and salience: performance measurement in the supply
chain. Business Process Management Journal, 10 (5), 522-536
Movahedi B, L. K. (2009). Transition to B2B e-Marketplace Enabled Supply Chain:
Readiness Assessment and Success Factors. The International Journal of Technology,
Knowledge, and Society, 5 (3), 75-88.
Panizzolo, D. V. (2012). An Empirical Research on Supplier Relationship Management in
Automotive Industry. International Journal of Business and Management, 7 (9), 86.
Shapna.E,2K.Kavitha, “Blocking Misbehaving Users In Cross Domain Network”,
International Journal of Innovations in Scientific and Engineering Research (IJISER), Vol.2,
no.2, pp.22-27, 2015.
Siddharth Varma, Subhash Wadhwa, S.G. Deshmukh, (2008) "Evaluating petroleum supply
chain performance: Application of analytical hierarchy process to balanced scorecard", Asia
Pacific Journal of Marketing and Logistics, Vol. 20 Issue: 3, pp.343-356,
www.bharatpetroleum.com
International Journal of Pure and Applied Mathematics Special Issue
2508

2509

2510


