The Visual ComputerThis is a post-peer-review, pre-copyedit version of an article published in The Visual Computer. The
final authenticated version is available online at: https://doi.org/10.1007/s00371-018-1486-x.
Visual Analysis of Retinal Changes with Optical CoherenceTomography
Martin Rohlig · Christoph Schmidt · Ruby Kala Prakasam ·Paul Rosenthal · Heidrun Schumann · Oliver Stachs
Accepted: 24. January 2018 / Online date: 20. February 2018
Abstract Optical coherence tomography (OCT) ena-
bles noninvasive high-resolution 3D imaging of the hu-
man retina, and thus plays a fundamental role in de-
tecting a wide range of ocular diseases. Despite the
diagnostic value of OCT, managing and analyzing re-
sulting data is challenging. We apply two visual analysis
strategies for supporting retinal assessment in practice.
First, we provide an interface for unifying and structu-
ring data from different sources into a common basis.
Fusing that basis with medical records and augmenting
it with analytically derived information facilitates tho-
This work has been supported by the German Research Foun-dation (project VIES) and by the German Federal Ministryof Education and Research (project TOPOs).
Martin RohligInstitute for Computer Science, University of Rostock, Ros-tock, GermanyE-mail: [email protected]
Christoph SchmidtInstitute for Computer Science, University of Rostock, Ros-tock, GermanyE-mail: [email protected]
Ruby Kala PrakasamDepartment of Ophthalmology, University of Rostock, Ros-tock, GermanyE-mail: [email protected]
Paul RosenthalInstitute for Computer Science, University of Rostock, Ros-tock, GermanyE-mail: [email protected]
Heidrun SchumannInstitute for Computer Science, University of Rostock, Ros-tock, GermanyE-mail: [email protected]
Oliver StachsDepartment of Ophthalmology, University of Rostock, Ros-tock, GermanyE-mail: [email protected]
rough investigations. Second, we present a tailored visual
analysis tool for presenting, emphasizing, selecting, and
comparing different aspects of the attributed data. This
enables free exploration, reducing the data to relevant
subsets, and focusing on details. By applying both stra-
tegies, we effectively enhance the management and the
analysis of retinal OCT data for assisting medical diag-
noses. Domain experts applied our solution successfully
to study early retinal changes in patients suffering from
type 1 diabetes mellitus.
Keywords Visual analysis · Optical coherence
tomography · OCT data · Ophthalmology · Retina
1 Introduction
In the context of ophthalmology, optical coherence to-
mography (OCT) is a widely applied method to support
the medical diagnosis of various ocular diseases. Ba-
sed on high-resolution 3D imaging of the human retina,
many medical conditions can be detected. Examples are
diabetic retinopathy, age-related macular degeneration,
and glaucoma induced retinal changes [41]. The diag-
nostic procedures involve searching for subtle retinal
changes, analyzing multiple OCT datasets, and correla-
ting findings with other clinical information. Especially
for identifying early signs or investigating progressions,
all of these steps are mandatory. Yet, due to the com-
plexity of the data, already exploring a single volumetric
OCT dataset can be difficult. This becomes even more
complicated if details in multiple datasets have to be
compared or different proprietary data formats have to
be dealt with, e.g., in case of datasets from different
OCT devices. Hence, managing and analyzing OCT data
and relating them to other information are challenging
and time-consuming tasks.

2 Martin Rohlig et al.
We present an interactive visual approach to ad-
dress the peculiarities of OCT data: (i) data originating
from different acquisition modalities and (ii) volumetric
data of high spatial resolution combined with extracted
information. Our contributions are:
Unified Data Management: We convert and structureOCT data from different sources into a common
basis, enabling unified data access and management.
We fuse that basis with other medical records and
augment it with analytically derived information.
Interactive Visual Analysis: We propose a novel visual
design for presenting, emphasizing, and comparing
different aspects of the data. Coordinated interaction
facilitates exploration, selecting relevant subsets, and
inspecting details on demand.
This paper covers an extended version of our initial
work on visual analysis of OCT data [34]. Here, we in-troduce a new compact representation of multiple OCT
datasets that enables visual comparison and eases the
identification of subtle retinal changes. We integrate the
visualization, interaction, and computation techniques
in a visual analysis workflow and describe how it helps
to tackle the problem at hand. As another extension, we
outline our collaboration with medical experts, which
allowed us to understand their current analysis proce-
dure, define design requirements, and test our solutions.
The combined work steered the development and hel-
ped to address the experts’ needs. Lastly, we broaden
the discussion of our results, point out limitations, and
indicate future research directions.
The remainder of the paper is structured as follows.
The background and current analysis procedure are des-
cribed in Section 2. Related work is reviewed in Section 3
and design requirements are listed in Section 4. The uni-
fied data management and the interactive visualization
are detailed in Sections 5 and 6. In Sections 7 and 8, ap-
plication results and user feedback are presented. Finally,
limitations and future work are discussed in Section 9.
2 Background
The structure of the multi-layered retina in the posterior
segment of the eye cannot be examined with conven-
tional ophthalmic methods. Starting with ultrahigh-
resolution OCT-based retinal imaging [10], it is now
possible to display different layers of the retina and
provide unmatched detail and contrast images in an
extraordinary way. This improves the diagnosis of pat-
hologies, even at an early stage.
2.1 Optical Coherence Tomography Data
State-of-the-art OCT devices are based on frequency
domain optical coherence technology (also referred to as
swept source OCT or spectral domain OCT). The OCT
procedure is noninvasive and completely safe without
light hazard. A laser beam scans the retina using dedi-
cated scanning patterns in combination with active eye
tracking. In this process, consecutive 1D reflectivity pro-
files (A-scans) are acquired. The profiles contain informa-
tion about the spatial dimensions and location of inner
structures. Cross-sectional 2D image slices (B-scans) are
obtained by laterally combining a series of these axial
depth scans (A-scans). Multiple 2D image slices are then
merged into a 3D tomogram. Commercially available
systems currently have an approximate axial and lateral
resolution of 3−7 µm/pixel and 5−10 µm/pixel respecti-
vely, covering an area of about 9×9 mm at 2 mm scan
depth. The actual image resolution depends on acquisi-tion settings and differs between manufacturers. As an
example, datasets from the Spectralis OCT (Heidelberg
Engineering GmbH) can have a maximal resolution of
1536 equally spaced B-scans with 1536×512 pixels.
The raw volumetric image data are further proces-
sed using various image analysis techniques, including
image registration and noise reduction [3]. Complemen-
tary segmentation algorithms are applied on the datasets
to extract up to 11 retinal layers [13]. Optionally, mea-
surements are computed to additionally characterize the
data, e.g., thickness maps of the layers. Figure 1 illus-
trates common components of OCT data. Altogether, a
typical OCT dataset contains one 3D tomogram compo-
sed of multiple 2D image slices, several extracted layers,
and various computed measurements. In addition, onefundus image of the interior surface of the eye around
the OCT acquisition area is usually recorded, e.g., via
scanning laser ophthalmoscopy.
2.2 Current Analysis Procedure
Given the complexity of OCT data, it is challenging toidentify subtle and localized changes of various abnormal
conditions of the retina. Currently common analysis
procedures involve both analyzing individual datasets
and comparing multiple datasets.
Individual OCT datasets are analyzed in search for reti-
nal changes related to signs, symptoms, and other clini-
cal information of ocular diseases. This is usually done
to diagnose subtle variations that cannot be captured
with other examination methods or to obtain additio-
nal findings for investigating indications of a disease.

Visual Analysis of Retinal Changes with Optical Coherence Tomography 3
Fig. 1. Common data components of volumetric OCT datasets. During acquisition, primarily the area around the macula andthe optic disk (a) are captured with an OCT device (b). The resulting data consists of a fundus image of the interior surface ofthe eye (c) and multiple 2D image slices that form a 3D tomogram (d). Further processing allows to extract several retinallayers (e) and computed measurements (f), e.g., the layer thickness.
To detect localized retinal changes, the ophthalmolo-
gists have to explore three main aspects of OCT data:
the raw tomogram, the extracted layers, and associa-
ted measurements. This can entail high manual effort.
For example, the experts are often required to inspect
individual image slices or extracted layers one by one.
This causes strain, particularly in case of high-resolution
datasets that comprise hundreds of image slices. Howe-
ver, a high density of image slices is necessary for an
exact assessment of certain retinal areas, e.g., to detect
small macular holes [5] and to reduce errors of computed
measurements [30].
Alternatively, current analysis procedures are either
based on selective measurements or on excessive global
data reduction with regard to both, space and informa-
tion. In the first case, measurements are computed for
specific points in the data. Depending on the analysis
goal, the data are sampled at a known location, e.g.,
where changes are visible in the fundus image. As anot-
her example, several sample points may be aligned to
form custom sample patterns, e.g., to obtain approx-
imate layer profiles from the center of the fovea in a
certain direction. In the second case, the tomogram or
the extracted layers are subdivided into coarse sectors
and for each sector aggregated measurements are re-
trieved. The locations and areas of these sectors are,
for example, defined according to grids from the Early
Treatment Diabetic Retinopathy Study (ETDRS) [12].
These grids consist of nine regions that subdivide central,
pericentral, and peripheral concentric rings around the
fovea in nasal, temporal, inferior, and superior direction.
As a result, entire OCT datasets are represented by few
values. While this reduces the amount of information
that has to be examined, it also renders the analysis
results spatially unspecific.
Multiple OCT datasets are analyzed to compare selected
datasets either with each other, e.g., a baseline to a
follow-up dataset, or to reference data, e.g., datasets of
patients to data of a control group. Such analyses are
more involved and go beyond the steps necessary for
analyzing individual datasets.
In the first case, ophthalmologists typically have to
open separate views for each dataset. The views are
then individually adjusted to keep them consistent and
to ensure that matching parts per dataset are shown.
Searching for differences is realized by juxtaposing the
views or by switching back and forth between them.
Yet, manually coordinating and inspecting the separate
views is perceived cumbersome.
In the second case, ophthalmologists have to rely
on data reduction, e.g., based on ETDRS grids as des-cribed above. To start, aggregated measurements for
all considered datasets are computed. These values are
then exported for further statistical analysis. Yet, the
available export functionality is usually limited and so,
dozens of values per dataset have to be copied by hand
from the acquisition platform to the analysis software.
Particularly in case of larger studies with hundreds of
OCT datasets, this is time-consuming and error-prone.
Moreover, the statistical outcome often only shows com-
parisons of mean values from larger areas, e.g., sectors
of ETDRS grids. However, it does not disclose subtle
local variations or the actual morphological changes.
In addition to analyzing OCT datasets, ophthalmo-
logists have to relate their findings to other clinical data,
e.g., information on data quality, patient-related records,
and results of other examination methods. For this pur-
pose, they typically have to rely on third-party software
to show necessary information on demand. This further
complicates the data analysis.
Our new interactive visual approach shows such infor-
mation directly and simplifies identifying and processing
abnormal retinal characteristics.
3 Related Work
Current analysis procedures are based on a combination
of commercial and non-commercial OCT software and

4 Martin Rohlig et al.
general-purpose analysis software. Besides visualizing
OCT data, statistical evaluation of pointwise measu-
rements or aggregated values of certain regions is a
common approach in ophthalmic research. Particularly,
the thickness of retinal layers has been continuously used
as a basis for investigations of early structural changes
of the retina for a variety of diseases, e.g., diabetes mel-
litus [7, 9, 14] or glaucoma [6]. The statistical results
are reported via basic displays, e.g., tables, box-plots,
or color-coded ETDRS grid diagrams. Commercial and
non-commercial software offer additional methods forvisually analyzing OCT data.
3.1 Commercial Analysis Software
Commercial OCT software is predominantly distribu-
ted by OCT device manufactures. Currently, several
major platforms are available, including software from
Nidek, Optovue, Zeiss, Topcon, Heidelberg Engineer-ing and others. Modern 3D retinal imaging has led to
advances regarding the display and analysis functiona-
lity [28, 40]. Yet, commercial software typically matches
the respective device’s capabilities and hence, software
features often differ between tools. In general, they all
support managing, analyzing, and presenting OCT data.
For managing OCT data, users have to rely on device-
specific file formats and databases. This prohibits the ex-
change of OCT data. Moreover, it complicates analyzing
and comparing datasets from diverse manufactures, e.g.,
due to deviations in resolution, numerical precision, re-
gistration, noise reduction, and image segmentation [5].
For analyzing OCT data, users take measurements
based on OCT tomograms directly or based on prior
extracted retinal layers. Yet, supporting algorithms and
associated parameters are proprietary, and thus deviati-
ons between measurements may occur [35]. This makes
comparisons of analysis results from different tools error-
prone. Moreover, while some tools allow to relate measu-
rements to a proprietary normative database, available
methods generally do not support comparative analysis
of data from different individuals or groups. Thus, such
investigations have to be conducted based on exported
data and external software.
For displaying OCT data, three types of presentati-
ons are common. First, the acquired 2D image slices are
shown individually. This allows to view details but flip-
ping through the images is time-consuming. Second, a
fundus image is shown together with superimposed reti-
nal layers. This helps to link the layers to the fundus but
the layers can only be examined one at a time. Third, the
OCT tomogram is shown in 3D. This provides an over-
view of the data but adjusting the visual representation,
e.g., via navigation, is often limited. Also, combined 3D
visualizations of the tomogram and the layers are typi-
cally not available, and thus spatial relationships might
go unnoticed. Other drawbacks include inappropriate
hard-wired color-coding, lacking consideration of data
quality, and limited support for additional information.
Given those limitations, ophthalmologists are cur-
rently advised to use the same OCT device and asso-
ciated analysis software for all examinations of their
patients to ensure comparability of results [5].
3.2 Non-Commercial Analysis Software
Besides commercial software, few approaches for visually
analyzing retinal OCT data exist. The open-source soft-
ware ImageJ can be used to analyze OCT images [37].
The Iowa Reference Algorithms are a research-oriented
software that supports segmentation, visualization, and
measurement of retinal layers [17]. Instead of extracted
retinal layers, reflectivity profiles allow to characterize
retinal conditions [16]. 3D visualization based on ray-
tracing and artificial shadows shows subtle structures
more distinctly but images can take multiple seconds to
render [20]. Likewise, virtual reality can be employed to
enhance spatial perception and facilitate an immersive
data access [1, 38]. However, selecting and comparing
parts of multiple datasets or relating them to other
information is often not considered. Real-time 3D ren-
dering has also been studied to enable online display
of OCT tomograms during acquisition and to preselect
relevant subsets for reduced storage costs [32, 39]. Yet,
in-depth analysis of details still has to be done in a
post-acquisition stage.
Aside from ophthalmology, visual analysis of optical
coherence tomography data is an inherent part of ot-
her fields as well. Examples include different biomedical
applications, e.g., OCT-based exploration of cerebral
vessel walls [18], or material science, e.g., detection of
subsurface defect [11] or investigation of internal struc-
tures of bast fibers [31]. Although visual analysis proved
to be useful in those domains, respective solutions are
not directly applicable to retinal OCT data.
In summary, existing works offer different approa-
ches for managing, analyzing, and presenting OCT data.
Yet, each solution covers only a certain aspect. Our goal
is to develop an integrated approach that (i) incorpo-
rates previous efforts regarding a common data basis,
(ii) extends that basis with supplementary information,
(iii) visualizes and emphasizes different aspects of the
attributed data, and (iv) allows selecting and compa-
ring relevant subsets. With the resulting flexibility, we
are able to address the peculiarities of OCT data and
support the retinal assessment.

Visual Analysis of Retinal Changes with Optical Coherence Tomography 5
4 Requirements
Discussing with domain experts and analyzing existing
approaches, we derived two lists of requirements related
to: (i) managing OCT data and (ii) visualizing OCT
data.
Data-related Requirements: The data-related require-
ments reflect the experts’ needs with regard to mana-
ging and processing OCT data. We derived the following
list by talking with the experts about current limita-
tions and by analyzing the computation and storage
capabilities of OCT devices.
Manage data from different manufacturers (DR1): The
experts require support for OCT data from different
manufacturers. Particularly, they ask for a unified
access for datasets acquired using different OCT
devices. So, providing a common data basis that in-corporates all main aspects of OCT data, i.e., the raw
tomogram, extracted retinal layers, and computed
measurements, is a fundamental requirement.
Common and open data format (DR2): Based on the
common data basis, the experts want to make the
data openly available. This is to allow easy exchange,
storage, and further processing of datasets. Hence,
the second requirement is to provide a common and
open data format.
Derive and incorporate additional information (DR3):Directly incorporating and retrieving additional in-
formation is another request from the experts. This
is to provide them with further details to help to
characterize the condition of the retina. Especially,
measurements based on extracted layers are neces-
sary, as they allow to capture subtle changes which
would be hard to identify by looking at the raw OCT
data alone. Therefore, augmenting OCT datasets
with respective information has to be supported.
Coherent analysis pipeline (DR4): Altogether, the ex-
perts wish for a consistent set of data processing
and computation methods. This is to ensure com-
parability of analysis results across datasets. These
results also have to be reflected in the common data
basis. Accordingly, the attributed data should pro-
vide a starting point for a coherent analysis and
visualization pipeline.
Visualization-related Requirements: The visualization-
related requirements correspond to the experts’ goals
when visually analyzing OCT data. We derived the
requirements following a participatory design process.
Together with the experts we made general design deci-
sions and devised suitable visualization concepts:
Explore and relate different data aspects (VR1): To de-
tect localized retinal changes, the experts have to
explore the raw tomogram, the extracted retinal lay-
ers, and computed measurements. In this regard,
established display concepts have to be considered
(cf. 3.1). At the same time, the context of the three
data aspects has to be maintained. Therefore, visu-
alizing the aspects and interactively relating them
needs to be facilitated.
Show related information on demand (VR2): For asses-
sing the condition of the retina, the experts haveto relate findings to other information. So, besides
incorporating supplementary information in the com-
mon data basis (cf. DR3), showing that information
on demand together with the OCT data is required.
Discover and inspect regions of interest (VR3): The ex-
perts want to have quick access to different parts
of the data and to be able to inspect these parts in
greater detail. This is particularly important in case
of high-resolution datasets and subtle retinal chan-
ges. Hence, identifying, highlighting, and selecting
regions of interest is another basic requirement.
Compare multiple datasets (VR4): The experts need to
compare findings in multiple OCT datasets. This
involves both comparing individual datasets to each
other and analyzing datasets in relation to reference
data. Thus, we consider visually comparing multiple
datasets as a necessary design requirement.
Based on the experts’ demands, we incorporate a
unified data management that addresses requirements
DR1, ...,DR4 and develop an associated visualization
tool to meet requirements VR1, ...,VR4.
5 Unify, Structure & Enhance Data
Currently, no standardized description of OCT data
exists. This hinders data processing and analysis. Mo-
reover, the raw data alone may not provide enough
information for definite diagnoses. In an initial effort to
address these issues, we integrate a common data basis
and enrich that basis with derived layer attributes.
5.1 Common Data Basis
No matter if clinical or research use is intended, it is
often beneficial or at times even needed to take data
from different OCT devices into consideration. The most
problematic part with this is the fact that manufacturers
only provide software for the data of their own OCT
scanners. Consequently, there is no approved way of
viewing, analyzing, or comparing data from different de-
vices. Furthermore, there are only limited possibilities to

6 Martin Rohlig et al.
Fig. 2. Derivation of layer attributes. An attribute is computed by analyzing the extracted retinal layers in each acquiredimage slice of a dataset (a). One value is assigned to every pixel along the horizontal image axes, e.g., by measuring the verticaldistance between the upper and the lower layer boundaries. The values are combined into 2D attribute maps for each extractedlayer and each attribute definition (b). Aggregated attribute maps are compiled by applying summary statistics to all associatedpixels in the individual maps from multiple datasets (c).
implement own prototypes to perform such tasks, since
software libraries are provided with exclusive licenses
and incomplete data specifications.
To develop visual analysis solutions for OCT data,
it is essential to find a remedy for that issue. On this
account, we adapt and extend previous work [35]. Par-
ticularly, we integrate a common data format and a
library (UOCTE) that is capable of parsing data fromthe majority of current devices, e.g., Nidek, Eyetec, Top-
con, and Heidelberg Engineering (DR1). Based on the
UOCTE library, we map the parsed data into one com-
mon domain. The result is independent from constrai-
ned manufacturer-provided functionality and it opens
up new possibilities for data unification.
To structure the data, we utilize a common data
modeling language (UOCTML), which accompanies the
library (DR2). UOCTML consists of an easily amendable
XML file and a set of binary files for fundus, tomogram,
and layers. The resulting data format promotes data
exchange. Moreover, we are able to enrich the data
with derived information and other medical records.
To this end, we provide an associated interface with
dedicated processing capabilities. It allows either to
retrieve pre-segmented layer data or to apply basic layer
segmentation methods directly (e.g., [23]). In addition,
it enables extraction of OCT metadata and computation
of several layer attributes.
Together, the UOCTE library, the UOCTML data
format, and the interface represent initial steps towards
the development of common data standards in the dom-
ain of OCT data. The software and associated specifica-
tions are freely available [36]. Further technical details
regarding our efforts to unify distinct OCT data sources
are described in [35].
5.2 Derivation of Layer Attributes
To facilitate the analysis of OCT data, we incorporate
a set of derived attributes (DR3). This is to inject me-
aningful information into the data that can help to
characterize the condition of the retina. It allows us to
condense complex OCT data down to information that
is manageable and relevant. Moreover, the derived attri-
butes capture even subtle and localized retinal changes.
This way, they represent an effective starting point for
the subsequent visual data analysis (cf. Sect. 6).
The attribute derivation comprises two steps that
are carried out for each extracted layer. First, all points
that define a layer’s shape are enriched with derived
attribute values. Figure 2 illustrates this process. This is
to obtain attribute maps that characterize different layer
properties, e.g., thickness maps. Second, for each attri-
bute, a ranking of the layers is computed. A layer’s rank
is determined by analyzing the distribution of attribute
values and their spatial locations in the attribute maps.
The exact way how a ranking is computed can be con-
trolled via different parameters. That is, the ranks are
either defined by the total ratio of attribute values thatare considered abnormal in a map or by the amount and
size of connected abnormal regions. In addition, weights
can be assigned to regard certain areas on a layer with
abnormal characteristics more important than others.
For instance, a targeted investigation may adapt the
ranking to favor localized changes only in selected sec-
tors of the ETDRS grid. This helps users to focus on
layers with specific patterns.
In general, a single attribute alone will not suffice
to capture all abnormal conditions of the retina. The-
refore, we consider a collection of layer properties to
target symptoms of different ocular diseases. In pre-
vious works mainly the thickness of the retinal layers
has been studied to distinguish abnormal eyes from he-

Visual Analysis of Retinal Changes with Optical Coherence Tomography 7
althy eyes (e.g., [6, 9]). Based on discussion with domain
experts, we additionally incorporate several other pro-
perties. Examples are the curvature of the layers’ shapes
or the homogeneity of OCT values enclosed by layer
boundaries. This may help to detect localized deformati-
ons, e.g., drusen induced in an early stage of age-related
macular degeneration, and variations in reflectivity, e.g.,
small macular holes or fluid deposits caused by diabetic
retinopathy, respectively. Deriving corresponding attri-
bute maps enables a more sophisticated investigation of
the different layer properties.
Based on the individual attribute maps, we also sup-
port the computation of reference data (Fig. 2c). The
user can select any group of OCT datasets and compute
aggregated attribute maps for single or multiple attribu-
tes per layer. As the datasets may cover different retinalareas, the individual attribute maps are projected into a
common spatial frame of reference, e.g., using the center
of the fovea and of the optic disk as reference points.
Each point of an aggregated map then stores summary
statistics of the individual attribute maps, e.g., mean,
range, standard deviation, and histograms. This provi-
des a compact representation of multiple OCT datasets.
Moreover, it facilitates overview and comparison, while
being spatially more precise than analysis approaches
based on global data reduction according to ETDRS
grids (cf. Sect. 2). If necessary, such currently common
abstractions of attribute values are easily derived from
individual or aggregated attribute maps.
On top of the common data basis and derived layer
attributes, we develop a visual analysis tool with aug-
mented visualization techniques for the attributed OCT
data (DR4), which will be specified in the next section.
6 Visualize, Emphasize, Select & Compare Data
We aim at supporting users in visually analyzing OCT
data and related information. For this purpose, we design
a flexible visualization tool based on multiple coordi-
nated views. Figure 3 shows an overview of the user
interface. Our tool supports: (i) visualizing the data,
(ii) emphasizing details, (iii) selecting subsets, and (iv)
comparing multiple aspects.
6.1 Visualizing Data
In order to facilitate a comprehensive analysis of attribu-
ted OCT data, we visualize different types of information.
Our solution shows raw data together with extracted
layers, considers derived information, takes the quality
of the data into account, and facilitates the exploration
of relationships (VR1 + VR2). To this end, we support
four types of views: (i) a 2D top-down view, (ii) a 3D
view, (iii) a 2D cross-sectional view, and (iv) a view for
related information.
The 2D top-down view provides an overview of derived
attribute maps with regard to the interior surface of the
eye (Fig. 3a). The OCT acquisition area is visualized
on top of a fundus image. Each acquired image slice is
represented as a line. All extracted retinal layers are
shown as thumbnails on the side, ordered according
to the computed rankings. Optionally, the thumbnails
are enlarged and superimposed over the fundus image.
Derived attribute maps are color-coded using suitableand adjustable palettes [22]. The opacity of the overlay
can be adjusted using a slider, e.g., to help to relate
attribute values in the maps to noticeable structures in
the subjacent fundus image. If required, colored ETDRS
grids are shown in addition to the maps. This design
extends existing displays, in that it allows to view attri-
butes for all layers in one image without having to flip
through them manually. Hence, layers with abnormal
characteristics can be easily discovered.
The 3D view shows the tomogram together with the
extracted layers at a glance (Fig. 3b). The raw data arevisualized via direct volume rendering and the layers
are displayed as surfaces. Blending both 3D presenta-
tions allows to relate the tomogram to the layers. On
demand, the layer surfaces are color-coded based on de-
rived attributes. This illustrates interrelations between
attribute values and the layer shapes. For spatial refe-rence, a fundus image can be vertically moved through
the display. Showing the data in 3D allows for a faithful
representation of internal retinal structures. This way,
regions of interest can be precisely localized.
The 2D cross-sectional view supports the investiga-
tion of details and the comparison of several layers
at once (Fig. 3c). The acquired 2D image slices are de-
picted individually. The extracted layers are displayed
as superimposed lines along the horizontal image axes.
This allows to identify the exact layer profiles, to visu-
ally relate them, and to check for segmentation errors. A
detail chart shows plots of derived attributes of a single
layer or of multiple layers. The chart is positioned below
the image slices and aligned horizontally to maintain
the spatial context. Layers and plots are associated with
unique colors. Visualizing the layer profiles and the at-
tribute plots together facilitates a more precise analysis
and direct comparison in addition to the color-coded
visual representations in the other views.

8 Martin Rohlig et al.
Fig. 3. Overview of our prototypical visual analysis tool. The user interface allows to add and arrange multiple linked viewsfor visualizing different aspects of OCT data. Depicted are (a) a top-down view of the fundus overlayed with a derived attributemap, (b) a 3D view showing a volume visualization together with retinal layers as surfaces, (c) a cross-sectional view withextracted layers and a detail chart, and (e) a view for supplementary information. The signal strength of image slices iscolor-coded and shown together with associated legends (d).
Data quality is an important characteristic of OCT
data [25, 30]. It has to be considered to prevent wrong
conclusions from the data analysis. Therefore, in the
first three views, missing values are either mapped to
a special highlighting color to bring them to the users
attention or to a background color to focus on certainparts of the data instead. Moreover, quality measures,
e.g., the signal strength for 2D image slices, and as-
sociated legends are displayed in each view (Fig. 3d).
Indicating the data quality helps to differentiate bet-
ween artifacts and actual retinal changes, and thus aidsthe assessment of findings.
The information view displays general properties of
datasets, logs about selected values, or other patient-
related records (Fig. 3e). Depending on the type of
information, different basic visualizations are available,
e.g., tabular presentations or document viewers. In case
multiple datasets are loaded, the view can show re-
spective listings and help to assign datasets to the other
views. This allows users to directly check the additional
information together with the different perspectives of
the shown OCT data, without having to rely on external
software tools.
6.2 Emphasizing Data
Showing important information in the context of entire
datasets is essential for visually analyzing complex OCT
data [24]. We support users in comprehending the data
by emphasizing spatial relationships and characteristic
data values (VR3). For this purpose, we provide methods
for both spatial and data-oriented accentuation. Figure 4
illustrates how these methods can be applied.
Spatial emphasis conveys the spatial properties of the
visualized data. This is crucial in the 3D view (Fig. 4a).
We consider two illumination methods: a local technique
based on a directional lighting model and a global appro-
ach based on ambient aperture lighting [29]. Directional
lighting illustrates the general shape of the volumetric
data and enhances the perception of small-scale spatial
structures. Ambient aperture lighting highlights detailsand relationships between neighboring parts on the layer
surfaces. Stylization further emphasizes certain spatial
properties. On the one hand, enhancing edges makes it
easier to distinguish spatial features of the tomogram
and the layers. On the other hand, customized toon-
shading generates a continuous abstraction of the layers
that also reinforces the perception of depth [4]. Optio-
nally, stereoscopic rendering can be activated to further
facilitate 3D spatial perception.
Data-oriented emphasis highlights values of interest and
steers the user’s attention. For this purpose, we utilize
three visual variables: color, transparency, and blur [21].
In the 2D and 3D views, visual prominence is controlled
via an interactive transfer function editor. The editor
modifies the visual encoding to either strengthen or
attenuate the influence of values in the rendered ima-
ges. For instance, invalid values may be filtered out
by lowering their opacity. Other value ranges can be
assigned to special color palettes to compare them in
the different views. The views are linked with the edi-
tor and automatically update according to user input.

Visual Analysis of Retinal Changes with Optical Coherence Tomography 9
Fig. 4. Selecting and emphasizing data. The 3D view showsa selected layer, colored by its thickness (thin: green, thick:blue). Illumination and enhanced edges facilitate the spatialperception of the layer’s shape (a + b). Abnormal thicknessaccording to predefined thresholds is emphasized via spatialand data-driven selections (b). The small scattered elevations(orange, red) indicate the presence of drusen, a sign for age-related macular degeneration.
Figure 4b shows an example of modified colors for iden-
tifying abnormal attribute values. To further steer the
user’s attention, data-oriented emphasis is generated via
customized depth-of-field rendering [26]. Regions with
values of interest are depicted sharply, whereas their
surroundings are blurred in the visualization. This helps
to focus on details and to maintain the context at once.
Spatial emphasis and data-oriented emphasis can
also be combined. This is valuable for relating certain
data values to spatial properties. For example, in the 3D
view, abnormal attribute values are highlighted using
color. Applying enhanced edges illustrates their relati-
onship to the shape of the layers, while still being able
to precisely read off different color shades. In addition,
toon-shading or depth-of-field rendering can be activated
to support the identification of affected regions.
6.3 Selecting Data
To enable the exploration of large OCT datasets, the
data have to be reduced to relevant subsets. We support
this via coordinated selection techniques (VR3). Subsets
are interactively defined both spatially and data-driven.
Figure 4 exemplifies the application of both techniques.
Spatial selections enable users to specify regions of in-
terest. We integrate various selection methods based
on points and geometric shapes. Individual points can
be selected in all views to show their assigned values
via tooltips. In the 3D view, tomogram and layer se-
lections are realized via interactive clipping geometry,
including planes, spheres, or layer surfaces. For example,
clipping the tomogram via adjustable planes helps to
relate selected parts to the layers (Fig. 4a). In the 2D
views, polygon selection allows users to interactively
set multiple corners to define spatial regions of interest.
Users can choose to apply such selections to single image
slices and layers, or to groups of them. This way, in-
specting the same regions in different parts of the data
is possible. All spatial selections can be expanded or
reduced using binary operations. The provided selection
methods aid the specification of precise boundaries of
spatial regions, and hence are an effective way to reducethe data directly via their visual representation.
Data-driven selections permit users to specify value ran-ges of interest. For raw OCT data, the transfer function
editor facilitates selecting one or multiple value ran-
ges. To support such selections, a histogram is shown
for reference. For derived attributes, users can choose
which attributes are to be mapped onto the layer re-
presentations (Fig. 4b). This helps to focus on those
data characteristics and to relate them to their spatial
context. In addition, the detail chart in the 2D cross-sectional view enables selecting value ranges by brushing
parts of the attribute plots. Data-driven selections allow
to capture all regions with specific data characteristics
across entire datasets, which would be hard to dissect
via direct spatial selections in the views.
Specified selections can be applied in two ways: lo-cally, i.e, solely in one view, or globally, i.e., by automa-
tically propagating them to interlinked views. Moreover,
selections may be applied in combination with the emp-
hasizing methods to adapt the visual representations.This allows to show subsets either exclusively or high-
lighted in context of other data. For example, global
selections support linking and brushing. Selecting a point
in one view shows respective cursors in all other views.
To browse through the data, the cursor in the top-down
view is moved. The 3D view and cross-sectional view are
updated accordingly and continuously display matched
image slices and clippings of the tomogram. This allows
to quickly access and relate different parts of the data.
6.4 Comparing Data
Subtle retinal changes can often only be revealed by rela-
ting two or more datasets to each other. Hence, besides
displaying one dataset of one individual at a time, our
tool also allows to visually compare multiple intraindi-
vidual datasets, e.g., from follow-up examinations, and
interindividual datasets, e.g., from cohort studies (VR4).
We support this via a combination of superposition and
10 Martin Rohlig et al.
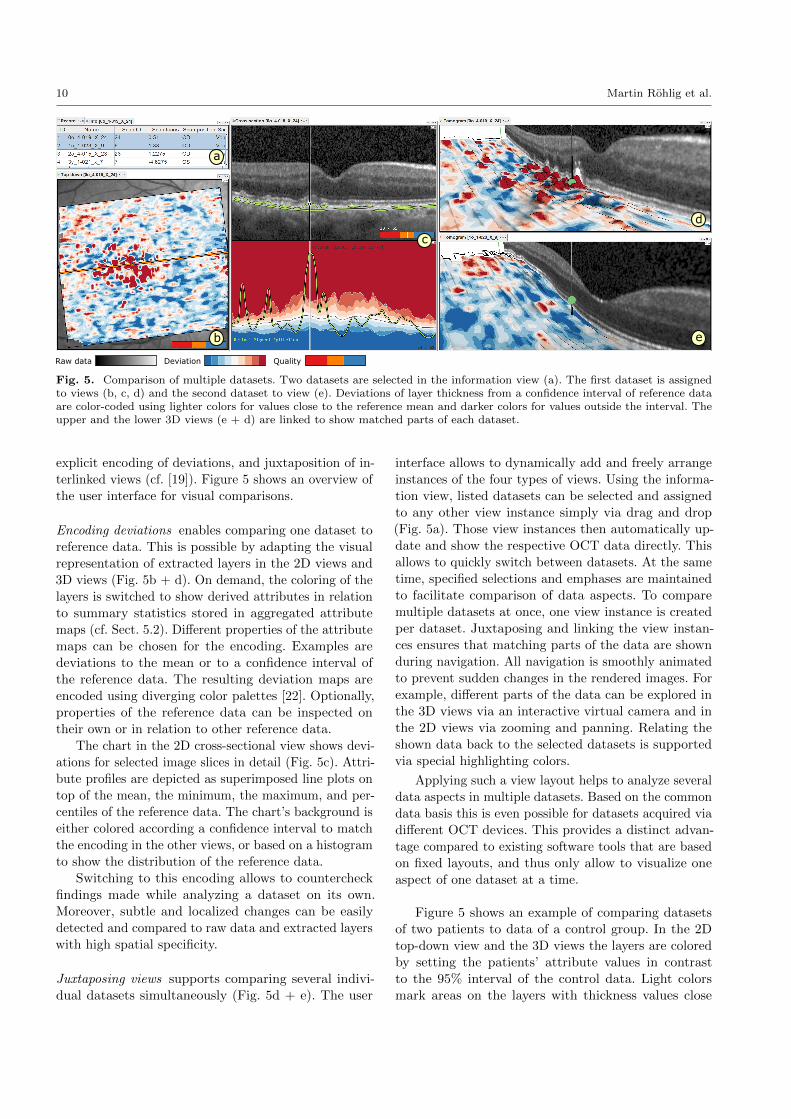
Fig. 5. Comparison of multiple datasets. Two datasets are selected in the information view (a). The first dataset is assignedto views (b, c, d) and the second dataset to view (e). Deviations of layer thickness from a confidence interval of reference dataare color-coded using lighter colors for values close to the reference mean and darker colors for values outside the interval. Theupper and the lower 3D views (e + d) are linked to show matched parts of each dataset.
explicit encoding of deviations, and juxtaposition of in-
terlinked views (cf. [19]). Figure 5 shows an overview of
the user interface for visual comparisons.
Encoding deviations enables comparing one dataset to
reference data. This is possible by adapting the visual
representation of extracted layers in the 2D views and
3D views (Fig. 5b + d). On demand, the coloring of the
layers is switched to show derived attributes in relation
to summary statistics stored in aggregated attribute
maps (cf. Sect. 5.2). Different properties of the attribute
maps can be chosen for the encoding. Examples are
deviations to the mean or to a confidence interval of
the reference data. The resulting deviation maps are
encoded using diverging color palettes [22]. Optionally,
properties of the reference data can be inspected on
their own or in relation to other reference data.
The chart in the 2D cross-sectional view shows devi-
ations for selected image slices in detail (Fig. 5c). Attri-
bute profiles are depicted as superimposed line plots on
top of the mean, the minimum, the maximum, and per-
centiles of the reference data. The chart’s background is
either colored according a confidence interval to match
the encoding in the other views, or based on a histogram
to show the distribution of the reference data.
Switching to this encoding allows to countercheck
findings made while analyzing a dataset on its own.
Moreover, subtle and localized changes can be easily
detected and compared to raw data and extracted layers
with high spatial specificity.
Juxtaposing views supports comparing several indivi-
dual datasets simultaneously (Fig. 5d + e). The user
interface allows to dynamically add and freely arrange
instances of the four types of views. Using the informa-
tion view, listed datasets can be selected and assigned
to any other view instance simply via drag and drop
(Fig. 5a). Those view instances then automatically up-
date and show the respective OCT data directly. This
allows to quickly switch between datasets. At the sametime, specified selections and emphases are maintained
to facilitate comparison of data aspects. To compare
multiple datasets at once, one view instance is created
per dataset. Juxtaposing and linking the view instan-
ces ensures that matching parts of the data are shown
during navigation. All navigation is smoothly animatedto prevent sudden changes in the rendered images. For
example, different parts of the data can be explored in
the 3D views via an interactive virtual camera and in
the 2D views via zooming and panning. Relating the
shown data back to the selected datasets is supported
via special highlighting colors.
Applying such a view layout helps to analyze several
data aspects in multiple datasets. Based on the common
data basis this is even possible for datasets acquired via
different OCT devices. This provides a distinct advan-
tage compared to existing software tools that are based
on fixed layouts, and thus only allow to visualize one
aspect of one dataset at a time.
Figure 5 shows an example of comparing datasets
of two patients to data of a control group. In the 2D
top-down view and the 3D views the layers are colored
by setting the patients’ attribute values in contrast
to the 95% interval of the control data. Light colors
mark areas on the layers with thickness values close

Visual Analysis of Retinal Changes with Optical Coherence Tomography 11
d eb ca
Fig. 6. Exemplary analysis workflow. An OCT dataset is gradually reduced to relevant information by selecting a layer in thetop-down view (a), defining a region of interest in the 3D view (b), and inspecting details in the cross-sectional view (c). Theobtained findings are then compared to further datasets (d) or to results of other examination methods (e).
to the reference mean, whereas dark colors indicate
thinning or thickening outside the reference interval.
In addition, one 3D view is added for each dataset.
The upper 3D view is adjusted to show a region of
interest. These view settings are dragged onto the second
3D view below. The second view automatically adapts
according to the applied changes and shows the same
region and encoding. This way, abnormal retinal changes
can be easily detected in each dataset and subsequently
compared to each other via the juxtaposed views.
6.5 Analysis Example
Our prototypical visualization tool can be applied in
various ways. Figure 6 illustrates an exemplary analy-
sis workflow. First, the overview of derived attribute
maps in the top-down view helps to identify and select
a retinal layer with abnormal characteristics (Fig. 6a).
Enlarging the attribute map over the fundus image re-
veals centralized abnormal changes in the selected layer.
Second, visualizing the layer in the 3D view allows tocompare the attribute values to the layer’s shape and
to the volume rendering of the raw tomogram (Fig. 6b).
This way, a region of interest can be localized and se-
lected. Third, to analyze the region in detail, individual
image slices and respective attribute plots are shown in
the cross-sectional view for the specified region (Fig. 6c).
Comparing the region to reference data is possible by
loading an aggregated attribute map. Deviations of attri-
bute values are emphasized by switching the color-coding
and applying further stylization methods. Finally, the
findings can be directly related to additional OCT da-
tasets (Fig. 6d), e.g., a follow-up dataset, or to results
of other examination methods (Fig. 6e). Applying such
an analysis procedure promotes an informed interactive
reduction of complex OCT data to clinical relevant in-
formation.
7 Application
In this use case, we applied our solution in cooperation
with domain experts to study if retinal changes in pe-
diatric patients suffering from type 1 diabetes mellitus
(T1DM) can be visualized in comparison with healthy
control subjects of the same age. Interestingly, none
of the patients showed signs of diabetic retinopathy
in results of other examination methods. In fact, the
principal goal of this study was to identify changes of
the retina that occur in a very early stage of a pri-
mary disease, e.g., diabetes mellitus. These changes are
precursors of secondary complications that may lead
to severe structural and functional defects. Secondary
complications, e.g., diabetic retinopathy, are often onlydiagnosed in an advanced state once symptoms are ob-
vious. However, the high sensitivity of OCT and the
visual analysis of OCT data support detecting subtle
and localized changes, and hence may contribute to an
early diagnosis and immediate intervention.
The study data were acquired via OCT examination
of two groups of subjects. The first group consists of
19 children with T1DM (∅ 14.2 years of age, ∅ 5.25
years duration of T1DM) and the second group of 30
healthy controls with matched sex and age (∅ 14.3 years
of age). For each subject, one volumetric OCT dataset
of the macula was selected for further investigation (49
datasets in total). In a pre-process, aggregated attribute
maps were computed for both groups. Individual attri-
bute maps for all layers in the datasets were derived on
the fly during visualization.
We jointly applied our tool to analyze the study data.
In addition, a currently common analysis procedure
based on statistical evaluation of ETDRS grids was
performed (cf. Sect.2). Figure 7 summarizes a part of
the obtained results.
Relating Patients to Controls: We started by visually
comparing the aggregated attribute map of the patient
group to the map of the control group (Fig. 7a). Devia-
tions of the mean values in both maps were color-coded.
The resulting visualization demonstrated that patients
exhibit thinning primarily in pericentral ETDRS sectors
around the fovea for several retinal layers, e.g., retinal
nerve fiber layer, ganglion cell layer, and inner plexi-
form layer. These first insights are in accordance with
the statistical analysis results and findings of previous
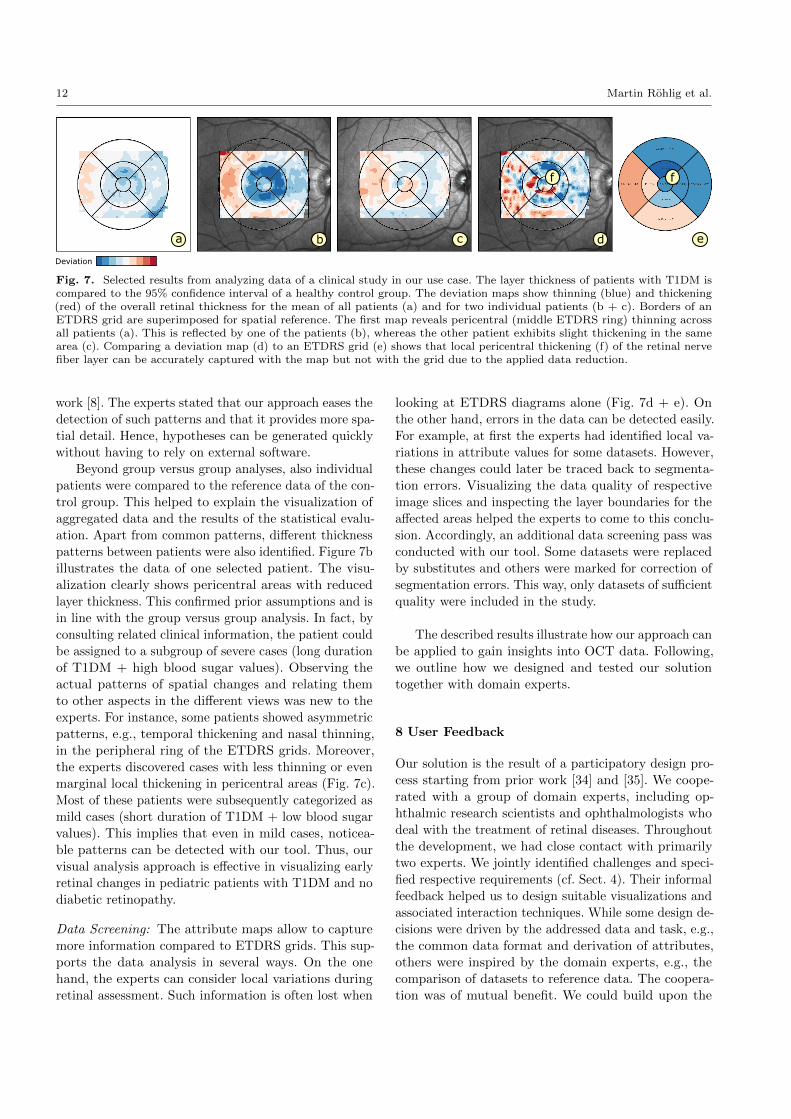
12 Martin Rohlig et al.
Fig. 7. Selected results from analyzing data of a clinical study in our use case. The layer thickness of patients with T1DM iscompared to the 95% confidence interval of a healthy control group. The deviation maps show thinning (blue) and thickening(red) of the overall retinal thickness for the mean of all patients (a) and for two individual patients (b + c). Borders of anETDRS grid are superimposed for spatial reference. The first map reveals pericentral (middle ETDRS ring) thinning acrossall patients (a). This is reflected by one of the patients (b), whereas the other patient exhibits slight thickening in the samearea (c). Comparing a deviation map (d) to an ETDRS grid (e) shows that local pericentral thickening (f) of the retinal nervefiber layer can be accurately captured with the map but not with the grid due to the applied data reduction.
work [8]. The experts stated that our approach eases the
detection of such patterns and that it provides more spa-tial detail. Hence, hypotheses can be generated quickly
without having to rely on external software.
Beyond group versus group analyses, also individual
patients were compared to the reference data of the con-
trol group. This helped to explain the visualization of
aggregated data and the results of the statistical evalu-
ation. Apart from common patterns, different thickness
patterns between patients were also identified. Figure 7b
illustrates the data of one selected patient. The visu-
alization clearly shows pericentral areas with reduced
layer thickness. This confirmed prior assumptions and is
in line with the group versus group analysis. In fact, by
consulting related clinical information, the patient could
be assigned to a subgroup of severe cases (long duration
of T1DM + high blood sugar values). Observing the
actual patterns of spatial changes and relating them
to other aspects in the different views was new to the
experts. For instance, some patients showed asymmetric
patterns, e.g., temporal thickening and nasal thinning,
in the peripheral ring of the ETDRS grids. Moreover,
the experts discovered cases with less thinning or even
marginal local thickening in pericentral areas (Fig. 7c).
Most of these patients were subsequently categorized as
mild cases (short duration of T1DM + low blood sugar
values). This implies that even in mild cases, noticea-
ble patterns can be detected with our tool. Thus, our
visual analysis approach is effective in visualizing early
retinal changes in pediatric patients with T1DM and no
diabetic retinopathy.
Data Screening: The attribute maps allow to capture
more information compared to ETDRS grids. This sup-
ports the data analysis in several ways. On the one
hand, the experts can consider local variations during
retinal assessment. Such information is often lost when
looking at ETDRS diagrams alone (Fig. 7d + e). On
the other hand, errors in the data can be detected easily.For example, at first the experts had identified local va-
riations in attribute values for some datasets. However,
these changes could later be traced back to segmenta-
tion errors. Visualizing the data quality of respective
image slices and inspecting the layer boundaries for the
affected areas helped the experts to come to this conclu-
sion. Accordingly, an additional data screening pass was
conducted with our tool. Some datasets were replaced
by substitutes and others were marked for correction of
segmentation errors. This way, only datasets of sufficient
quality were included in the study.
The described results illustrate how our approach can
be applied to gain insights into OCT data. Following,
we outline how we designed and tested our solution
together with domain experts.
8 User Feedback
Our solution is the result of a participatory design pro-
cess starting from prior work [34] and [35]. We coope-
rated with a group of domain experts, including op-
hthalmic research scientists and ophthalmologists who
deal with the treatment of retinal diseases. Throughout
the development, we had close contact with primarily
two experts. We jointly identified challenges and speci-
fied respective requirements (cf. Sect. 4). Their informal
feedback helped us to design suitable visualizations and
associated interaction techniques. While some design de-
cisions were driven by the addressed data and task, e.g.,
the common data format and derivation of attributes,
others were inspired by the domain experts, e.g., the
comparison of datasets to reference data. The coopera-
tion was of mutual benefit. We could build upon the

Visual Analysis of Retinal Changes with Optical Coherence Tomography 13
experts domain expertise and in turn, they benefited
from our solution as it provided them with new insights
into the data of their studies (cf. Sect. 7).
To ensure maximal practical relevance of the achie-
ved results, we assessed our solution in repeated de-
monstration and feedback sessions together with the
experts. The sessions were run using a pair analytics
approach [2]. They were scheduled after each major de-
velopment cycle and held at least once a month to review
new functionality. One session typically lasted between
one and two hours depending on the complexity of the
added methods and associated analysis tasks. Mainly
one visualization expert and at least one or two medical
experts participated. The visualization expert played
the role of the driver of the visual analysis tool, whereasthe medical experts played the role of the navigator
based on their contextual knowledge in the application
domain. The data and analytical tasks were consistent
between sessions and correspond to our use case. Se-
lecting the use case, i.e., currently relevant tasks and
familiar datasets, to test our solutions created a na-
turalistic setting for observations and reasoning. The
tasks involved both free exploration, e.g., discovering
abnormal characteristics in patients, and targeted inves-
tigations, e.g., retrieving values from specific deviation
maps in group versus group comparison. Session proto-
cols were recorded and exchanged after each session. In
addition to the results outlined in the previous section,
we obtained feedback regarding the general design and
functionality provided by our tool.
During the discussions, the experts stated, that they
liked the visual analysis tool because it allowed them to
explore and relate different aspects of the data. Theyappreciated the consideration of established display con-
cepts, e.g., the top-down view and the cross-sectional
view. At the same time, the integration of our extensions
was pointed out as meaningful, e.g., the overview of all
extracted layers or the view for supplementary informa-
tion. The experts also reassured us that the provided
emphasis and selection methods are indeed helpful for
inspecting different subsets in detail.
In earlier tests with initial prototypes of our tool,
they had mentioned that the provided controls required
some time to get accustomed with. Based on this feed-
back, we selected several interface components for a revi-
sion, including the controls of the virtual camera in the
3D view and control panels with associated display opti-
ons. To come up with alternative solutions, we referred
to available design guidelines (e.g., [15]) and prototyped
new interaction concepts. For example, with respect to
the 3D camera, we devised a new control mode that
is solely based on mouse input, whereas before mouse
and keyboard input was required. In addition, smooth
animated transitions between camera movements were
added to help users maintain their mental model during
navigation. Regarding the interface, indirections were
minimized by using direct manipulation where possible
and by showing control panels with advanced settings
only on demand. The reworked design was presented
and discussed in subsequent feedback sessions together
with the experts and again further refined. This iterative
process improved the user experience substantially.
As a major advantage, the experts identified the abi-
lity to compare multiple and possibly differing datasets.
The flexible interface and the interlinked views helped
them to quickly switch between datasets and to show
related information when necessary. For the analysis
of larger studies, they considered the visualization of
aggregated attribute maps to be particular useful. Utili-
zing these maps as reference data to compare individual
datasets to groups of datasets helped them to detect
even subtle and localized changes. In this regard, theyapproved to have both overviews, e.g., thumbnails of
deviation maps in the top-down view, and detail views,
e.g., the detail chart showing confidence intervals andhistograms for image slices, at their disposal. Overall,
they concluded that reducing the manual analysis effort
and being able to obtain results with higher accuracy
compared to the current analysis procedure are great
benefits. In fact, for the first time, they were able to per-
form such analyses for volumetric macular OCT datasets.This is an important step towards finding characteristic
retinal changes that indicate early symptoms of certain
diseases.
Applying pair analytics to test and reflect on the
introduced enhancements has been most fruitful so far,
as it combines the expertise of visualization experts anddomain experts. Findings in the data could be directly
explained and new views were added or adapted on the
fly to investigate further details. Applying our tool in
this way triggered discussions and sparked new ideas for
further improvements, which we will continue to share
with the ophthalmic community (e.g., [33]). Besides, the
experts recently asked us if we could provide them with
a dedicated standalone version of our tool, so they are
able to conduct further tests and apply it in clinical
practice on their own. Accordingly, our tool will be
used as a basis for further extension, fine-tuning, and
evaluation together with them.
9 Discussion and Conclusion
We presented an interactive visual approach for mana-
ging, analyzing, and presenting OCT data. A unified
data basis incorporates data from various devices and

14 Martin Rohlig et al.
derived information. A visual analysis tool supports ex-
ploration and emphasis of different data aspects, and
selections of relevant subsets in interlinked views. Mul-
tiple datasets can be compared to each other and to
reference data. Our approach constitutes a systematic
enhancement of existing work, and hence can be a useful
aid for retinal assessment using OCT.
Diagnostic Support: From an ophthalmic perspective,
visual analysis of retinal OCT data may be utilized in
various ways. With regard to clinical practice, it contri-
butes in confirming retinal changes in relation to other
clinical information and in getting a more complete idea
of the retinal condition of individual patients. Therefore,
the actual diagnosis and treatment decisions are often
made on an individual basis only after detailed clinical
and systemic investigation in addition to OCT analysis.
With regard to ophthalmic research, visual analysis ea-
ses the evaluation of cohort studies and provides results
with higher spatial specificity. This may lead to new in-
sights into how certain pathologies affect the structures
of the retina. The goal is to identify meaningful cha-
racteristics that can later be used to define biomarkers.
In this regard, experimental and prospective studies,
as presented in our use case, play an inherent role of
ophthalmic research. We highly recommend additional
prospective longitudinal studies to observe the structural
changes over a period of time and to relate these changes
with the functional aspects of the patients. To support
such investigations, both qualitative and quantitative
analyses of OCT data have to be integrated. Hence, we
plan to extent our approach to support time-oriented
data analysis and targeted statistical tests.
Data Support: Our data management is capable of par-
sing and converting data from different devices. By
making the software sources freely available, we ens-
ure its dissemination to an interested audience. This
is a first step towards developing device-independent
data standards. Although it remains difficult to cover
all possible data sources, we will continue our efforts
to support file formats of major manufacturers and
retrieve respective metadata. In addition, we plan to
directly relate the data to further information for cha-
racterizing the retina. This includes results from other
examination methods, e.g., angiography or microperime-
try, and diagnosis-related annotations. For this purpose,
the common data basis has to be extended to adequately
register, store, and exchange such information. Regar-
ding the extraction of retinal layers, our data interface
supports two methods. On the one hand, we retrieve
pre-segmented layer information from proprietary data
files of the OCT device manufacturers. On the other
hand, if such information is not available, we provide
basic segmentation methods [23] or use free software
(e.g., [27]). Yet, this does not emulate the functionality
of commercial software to its full extent. More work
is required to integrate state-of-the-art segmentation
algorithms (e.g., [13]). Directly incorporating advanced
methods into our tool and disclosing related parameters,
will help to reduce deviations between measurements
and facilitate the comparison of analysis results from
different datasets. In this regard, it remains to be stu-
died to what extent existing algorithms can be adaptedto address manufacturer-related differences in the data,
e.g., varying numerical precision or noise characteristics.
Analytic Support: We aid the visual analysis of OCT
data via various computational methods in our tool. This
includes the derivation of layer attributes, the ranking
of the layers, and the automated alignment of interlin-
ked views. We plan to enhance our approach based on
further feedback from domain experts. One particularrequest was to extend the support for analyzing multiple
datasets. Interesting patterns could be automatically
detected and subsequently suggested to the user. For
example, similarly to the computation of layer rankings,
the experts want to be able to search for matching sub-
sets across datasets. One possible approach would be toextract and compare features based on attribute maps
and reference data. An interesting open question is how
we can find meaningful feature definitions that address
specific analysis tasks, e.g., the identification of certain
symptoms. This requires assistance in evaluating how
well a feature captures certain characteristics and how
the feature extraction process can be steered to obtain
robust results.
Visual Support: The described examples demonstrate
that our approach is suitable for analyzing multiple da-
tasets at once. Visual comparison is supported either via
explicit encoding of deviations to reference data or by as-
signing different datasets to juxtaposed views. However,
adding multiple view instances only makes sense for up
to two or three datasets at a time. Comparing numerous
datasets by switching between multiple visualizations
may not be the best solution. Hence, we plan to extend
our tool to provide dedicated overview visualizations.
An effective design would allow to directly compare the
data of an entire study. Cognitive constraints and screen
space limitations will be challenging factors to deal with.
In a first prototype, we tested a small multiple design,
which shows synchronized top-down views for several
datasets in one image. This can be a feasible approach
for tens of datasets. In the future, we will investigate
alternative encodings that are scalable enough to handle
even more datasets.

Visual Analysis of Retinal Changes with Optical Coherence Tomography 15
User Support: We ascertained the general utility of our
solutions in first tests with domain experts (two being
authors of this paper). To improve our design, we plan
to integrate guidance for different diagnostic tasks. In
this context, specifications of dedicated workflows and
further evaluations of our tool will become necessary.
Acknowledgements The authors wish to thank HeidelbergEngineering GmbH for providing OCT hardware, and re-spective software interfaces and analysis software.
References
1. Aaker, G.D., Gracia, L., Myung, J.S., Borcher-
ding, V., Banfelder, J.R., D’Amico, D.J., Kiss, S.:
Three-dimensional reconstruction and analysis of
vitreomacular traction: Quantification of cyst vo-
lume and vitreoretinal interface area. Archives
of Ophthalmology 129(6), 805–820 (2011). DOI
10.1001/archophthalmol.2011.123
2. Arias-Hernandez, R., Kaastra, L.T., Green, T.M.,
Fisher, B.: Pair analytics: Capturing reasoning pro-
cesses in collaborative visual analytics. In: Pro-
ceedings of the Hawaii International Conference
on System Sciences, pp. 1–10. IEEE Computer
Society, Washington, DC, USA (2011). DOI
10.1109/HICSS.2011.339
3. Baghaie, A., Yu, Z., D’Souza, R.M.: State-of-the-
art in retinal optical coherence tomography image
analysis. Quantitative imaging in medicine and
surgery 5(4), 603617 (2015). DOI 10.3978/j.issn.
2223-4292.2015.07.02
4. Barla, P., Thollot, J., Markosian, L.: X-toon: Anextended toon shader. In: D. DeCarlo, L. Markosian
(eds.) Proceedings of the International Symposium
on Non-photorealistic Animation and Rendering,
pp. 127–132. ACM, Annecy, France (2006). DOI
10.1145/1124728.1124749
5. Berufsverband der Augenarzte Deutschlands e. V.,
Deutsche Ophthalmologische Gesellschaft, Retino-
logische Gesellschaft e. V.: Quality assurance of
optical coherence tomography for diagnostics of the
fundus: Positional statement of the BVA, DOG and
RG. Der Ophthalmologe 114(7), 617–624 (2017).
DOI 10.1007/s00347-017-0508-9
6. Chen, Q., Huang, S., Ma, Q., Lin, H., Pan, M.,
Liu, X., Lu, F., Shen, M.: Ultra-high resolution
profiles of macular intra-retinal layer thicknesses
and associations with visual field defects in primary
open angle glaucoma. Scientific Reports 7, 41,100
(2017). DOI 10.1038/srep41100
7. Chen, Y., Li, J., Yan, Y., Shen, X.: Diabetic macular
morphology changes may occur in the early stage
of diabetes. BMC Ophthalmology 16(12) (2016).
DOI 10.1186/s12886-016-0186-4
8. De Clerck, E.E., Schouten, J.S., Berendschot, T.T.,
Kessels, A.G., Nuijts, R.M., Beckers, H.J., Schram,
M.T., Stehouwer, C.D., Webers, C.A.: New opht-
halmologic imaging techniques for detection and
monitoring of neurodegenerative changes in dia-
betes: a systematic review. The Lancet Diabe-
tes & Endocrinology 3(8), 653–663 (2015). DOI
10.1016/S2213-8587(15)00136-9

16 Martin Rohlig et al.
9. van Dijk, H.W., Kok, P.H.B., Garvin, M., Sonka,
M., DeVries, J.H., Michels, R.P.J., van Veltho-
ven, M.E.J., Schlingemann, R.O., Verbraak, F.D.,
Abramoff, M.D.: Selective loss of inner retinal layer
thickness in type 1 diabetic patients with mini-
mal diabetic retinopathy. Investigative Ophthal-
mology & Visual Science 50(7), 3404 (2009). DOI
10.1167/iovs.08-3143
10. Drexler, W., Morgner, U., Ghanta, R.K., Kartner,
F.X., Schuman, J.S., Fujimoto, J.G.: Ultrahigh-
resolution ophthalmic optical coherence tomography.Nature Medicine 7(4), 502–507 (2001). DOI
10.1038/86589
11. Duncan, M.D., Bashkansky, M., Reintjes, J.: Sub-
surface defect detection in materials using optical
coherence tomography. Optics Express 2(13), 540–
545 (1998). DOI 10.1364/OE.2.000540
12. Early Treatment Diabetic Retinopathy Study Rese-
arch Group: Grading diabetic retinopathy from ste-
reoscopic color fundus photographs – an extension
of the modified airlie house classification: ETDRS
report number 10. Ophthalmology 98(5), 786 – 806
(1991). DOI 10.1016/S0161-6420(13)38012-9
13. Ehnes, A., Wenner, Y., Friedburg, C., Preising,
M.N., Bowl, W., Sekundo, W., zu Bexten, E.M., Stie-
ger, K., Lorenz, B.: Optical coherence tomography
(OCT) device independent intraretinal layer segmen-
tation. Translational Vision Science & Technology
3(1) (2014). DOI 10.1167/tvst.3.1.1
14. El-Fayoumi, D., Badr Eldine, N.M., Esmael, A.F.,
Ghalwash, D., Soliman, H.M.: Retinal nerve fiber
layer and ganglion cell complex thicknesses are re-
duced in children with type 1 diabetes with noevidence of vascular retinopathy. Investigative Op-
hthalmology & Visual Science 57(13), 5355 (2016).
DOI 10.1167/iovs.16-19988
15. Elmqvist, N., Vande Moere, A., Jetter, H.C., Cer-
nea, D., Reiterer, H., Jankun-Kelly, T.J.: Fluid in-teraction for information visualization. Informa-
tion Visualization 10(4), 327–340 (2011). DOI
10.1177/1473871611413180
16. Garrido, M.G., Beck, S.C., Muhlfriedel, R., Julien,
S., Schraermeyer, U., Seeliger, M.W.: Towards a
quantitative OCT image analysis. PLOS ONE 9(6),
1–10 (2014). DOI 10.1371/journal.pone.0100080
17. Garvin, M.K., Abramoff, M.D., Wu, X., Russell,
S.R., Burns, T.L., Sonka, M.: Automated 3-D in-
traretinal layer segmentation of macular spectral-
domain optical coherence tomography images. IEEE
Transactions on Medical Imaging 28(9), 1436–1447
(2009). DOI 10.1109/TMI.2009.2016958
18. Glaßer, S., Hoffmann, T., Boese, A., Voß, S., Kalin-
ski, T., Skalej, M., Preim, B.: Virtual inflation of the
cerebral artery wall for the integrated exploration
of OCT and histology data. Computer Graphics
Forum (2016). DOI 10.1111/cgf.12994
19. Gleicher, M., Albers, D., Walker, R., Jusufi, I.,
Hansen, C.D., Roberts, J.C.: Visual comparison
for information visualization. Information Visu-
alization 10(4), 289–309 (2011). DOI 10.1177/
1473871611416549
20. Glittenberg, C., Krebs, I., Falkner-Radler, C., Zei-
ler, F., Haas, P., Hagen, S., Binder, S.: Advantages
of using a ray-traced, three-dimensional renderingsystem for spectral domain cirrus HD-OCT to visu-
alize subtle structures of the vitreoretinal interface.
Ophthalmic Surgery Lasers and Imaging 40(2), 127–
134 (2009). DOI 10.3928/15428877-20090301-08
21. Hall, K.W., Perin, C., Kusalik, P.G., Gutwin, C.,
Carpendale, S.: Formalizing emphasis in information
visualization. Computer Graphics Forum 35(3), 717–
737 (2016). DOI 10.1111/cgf.12936
22. Harrower, M., Brewer, C.A.: Colorbrewer.org: An
online tool for selecting colour schemes for maps.
The Cartographic Journal 40(1), 27–37 (2003). DOI
10.1179/000870403235002042
23. Kahl, S., Ritter, M., Rosenthal, P.: Automated as-
sessment of the injury situation in patients with
age-related macular degeneration (AMD). In: F.P.
Leon, M. Heizmann (eds.) Proceedings of Forum
Bildverarbeitung, pp. 179–190. KIT Scientific Pu-
blishing, Regensburg, Germany (2014). DOI
10.5445/KSP/1000043608
24. Keim, D.A., Mansmann, F., Schneidewind, J., Tho-
mas, J., Ziegler, H.: Visual Analytics: Scope and
Challenges, pp. 76–90. Springer, Berlin, Heidelberg(2008). DOI 10.1007/978-3-540-71080-6 6
25. Koleva-Georgieva, D.N.: Optical coherence tomo-
graphy – segmentation performance and retinal
thickness measurement errors. European Ophthal-
mic Review 6(2), 78–82 (2012). DOI 10.17925/EOR.2012.06.02.78
26. Kosara, R., Miksch, S., Hauser, H.: Semantic depth
of field. In: Proceedings of the IEEE Symposium
on Information Visualization, pp. 97–104. IEEE
Computer Society, San Diego, CA, USA (2001).
DOI 10.1109/INFVIS.2001.963286
27. Mayer, M.A., Hornegger, J., Mardin, C.Y., Tor-
now, R.P.: Retinal nerve fiber layer segmentation
on FD-OCT scans of normal subjects and glaucoma
patients. Biomedical Optics Express 1(5), 13581383
(2010). DOI 10.1364/BOE.1.001358
28. Moisseiev, E., Park, S., Yiu, G., Werner, J.S., Za-
wadzki, R.J.: The third dimension: Advantages of
3D-OCT in retina – unprecedented detail of per-
fusion and other structures. Retinal Physician 13,
Visual Analysis of Retinal Changes with Optical Coherence Tomography 17
24–33 (2016)
29. Oat, C., Sander, P.V.: Ambient aperture lighting.
In: Proceedings of the Symposium on Interactive
3D Graphics and Games, pp. 61–64. ACM, Seattle,
WA, USA (2007). DOI 10.1145/1230100.1230111
30. Odell, D., Dubis, A.M., Lever, J.F., Stepien, K.E.,
Carroll, J.: Assessing errors inherent in OCT-derived
macular thickness maps. Journal of Ophthalmology
2011 (2011). DOI 10.1155/2011/692574
31. Placet, V., Meteau, J., Froehly, L., Salut, R., Bou-
bakar, M.L.: Investigation of the internal structureof hemp fibres using optical coherence tomography
and focused ion beam transverse cutting. Journal of
Materials Science 49(24), 8317–8327 (2014). DOI
10.1007/s10853-014-8540-5
32. Probst, J., Koch, P., Huttmann, G.: Real-time
3D rendering of optical coherence tomography vo-
lumetric data. In: P.E. Andersen, B.E. Bouma
(eds.) Proceedings of SPIE Optical Coherence Tomo-
graphy and Coherence Techniques IV, pp. 73,720Q
– 73,731Q. SPIE, Munich, Germany (2009). DOI
10.1117/12.831785
33. Rohlig, M., Junemann, A., Fischer, D.C., Prakasam,
R.K., Stachs, O., Schumann, H.: Visual analysis
of retinal OCT data. Klinische Monatsblatter fur
Augenheilkunde 234(12), 1463–1471 (2017). DOI
10.1055/s-0043-121705
34. Rohlig, M., Rosenthal, P., Schmidt, C., Schumann,
H., Stachs, O.: Visual analysis of optical coherence
tomography data in ophthalmology. In: M. Sedl-
mair, C. Tominski (eds.) Proceedings of the Euro-
Vis Workshop on Visual Analytics (EuroVA). The
Eurographics Association, Barcelona, Spain (2017).DOI 10.2312/eurova.20171117
35. Rosenthal, P., Ritter, M., Kowerko, D., Heine, C.:
OphthalVis – making data analytics of optical co-
herence tomography reproducible. In: K. Lawonn,
M. Hlawitschka, P. Rosenthal (eds.) Proceedings ofEuroVis Workshop on Reproducibility, Verification,
and Validation in Visualization. The Eurographics
Association, Groningen, Netherlands (2016). DOI
10.2312/eurorv3.20161109
36. Rosenthal, P., Ritter, M., Kowerko, D., Heine, C.:
Unified OCT explorer. http://bitbucket.org/
uocte/ (2016)
37. Schindelin, J., Rueden, C.T., Hiner, M.C., Eliceiri,
K.W.: The ImageJ ecosystem: An open platform for
biomedical image analysis. Molecular Reproduction
and Development 82(7-8), 518–529 (2015). DOI
10.1002/mrd.22489
38. Schulze, J.P., Schulze-Dobold, C., Erginay, A., Ta-
dayoni, R.: Visualization of three-dimensional ultra-
high resolution OCT in virtual reality. Studies in
health technology and informatics 184, 387–391
(2013). DOI 10.3233/978-1-61499-209-7-387
39. Sylwestrzak, M., Szlag, D., Szkulmowski, M., Tar-
gowski, P.: Real-time massively parallel processing
of spectral optical coherence tomography data on
graphics processing units. In: R.A. Leitgeb, B.E.
Bouma (eds.) Proceedings of SPIE Optical Cohe-
rence Tomography and Coherence Techniques V, pp.
80,910V–80,917V. SPIE, Munich, Germany (2011).
DOI 10.1117/12.889805
40. Wojtkowski, M., Srinivasan, V., Fujimoto, J.G.,Ko, T., Schuman, J.S., Kowalczyk, A., Duker, J.S.:
Three-dimensional retinal imaging with high-speed
ultrahigh-resolution optical coherence tomography.
Ophthalmology 112(10), 1734 – 1746 (2005). DOI
10.1016/j.ophtha.2005.05.023
41. Yoshimura, N., Hangai, M.: OCT Atlas. Springer,
Berlin, Germany (2014)


