
Presentation to the Puerto Rico Planning Board
Henry Rosa Polanco Ph.D.
May 30, 2014
Vertical Specialization:
Evidence from Puerto Rico (1977-2002)

Agenda
1. Introduction
2. Literature Review
3. Methodology
4. Results
5. Conclusions

INTRODUCTION
- Motivation
- What is Vertical Specialization?
- Why Puerto Rico?

Motivation
Compared Business Systems – Aponte-García (2012)
A. Module: Productions Systems
� Chains
� Value Chain [VC] – Porter (1985, 1990)
� Global Commodity Chain [GCC] – Gereffi (1995, 1999)
� Global Production Networks [GPN] – Dicken (2002)

“The NIDL, global commodity chains and production
networks all fit well with IB research agenda. The
progress of research in this area depends on
interdisciplinarity and connectivity… this type of
creative connectivity is needed in pushing forward the
frontiers of research…the comparative advantage of IB
scholars has always been their ability to combine
different approaches and to see the big picture.”
Buckley & Ghauri (2004)JIBS [A*], pp. 91, 92
Motivation

Why Vertical Specialization?
“Global Value Chains: Investment and Trade for
Development”
UNCTAD: WORLD INVESTMENT REPORT 2013
“A sluggish Postcrisis, Mega Trade Negotiations and
Value Chains: Scope for Regional Action ”
UN-ELCAC: DIVISION OF INTERNATIONAL TRADE AND INTEGRATION 2013
“Trade Crisis and Recovery: Restructuring of Global
Value Chains”
WORLD BANK: GLOBAL TRADE AND
FINANCIAL ARCHITECTURE 2010

What is Vertical Specialization?
“Trade patterns and global value chains in East Asia: From
trade in goods to trade in tasks”
- “New trade reality…often referred to as
global value chain or vertical specialization…
deepens the interdependency of trade relations
and has many implications for how we understand
trade policy”
WTO-IDE-JETRO 2011, P.4
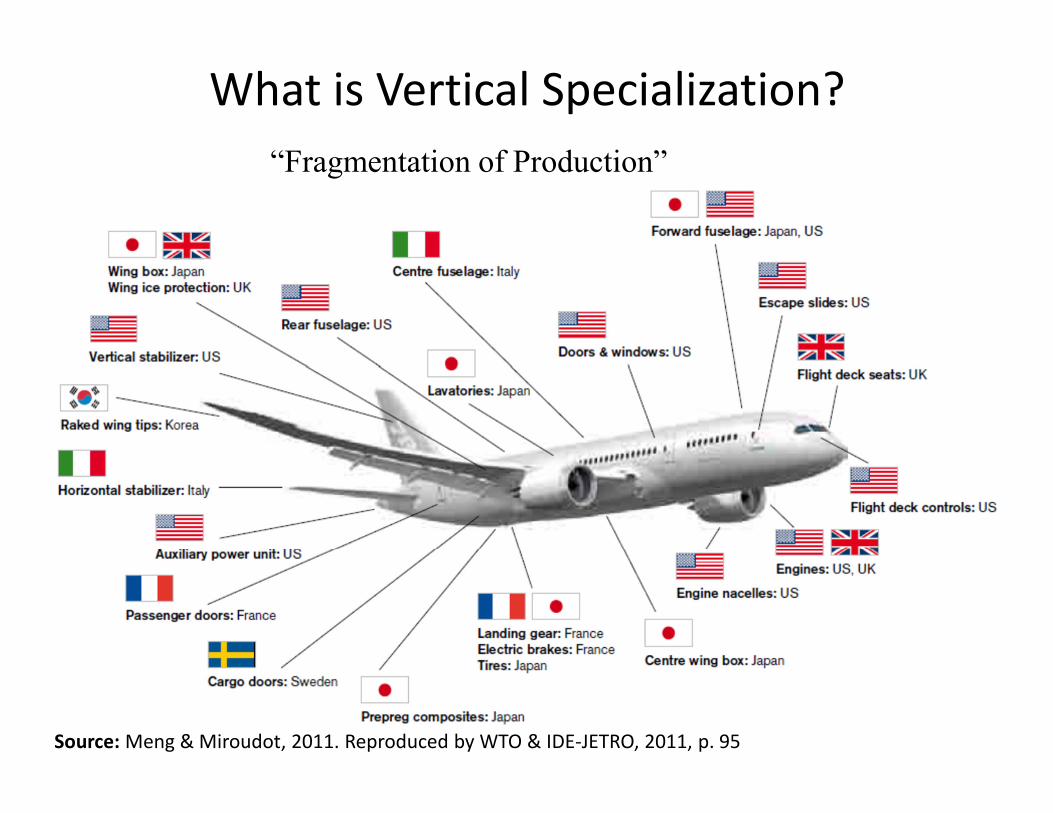
What is Vertical Specialization?
Source: Meng & Miroudot, 2011. Reproduced by WTO & IDE-JETRO, 2011, p. 95
“Fragmentation of Production”

“New Trade Reality”
What is Vertical Specialization?
Source: Adapted From WTO & IDE-JETRO, 2011, p. 4
Vertical Specialization Index
Key Industry Analysis:
Backward/Forward linkages

The vertical specialization index has never
been calculated for Puerto Rico.
Why Puerto Rico?

%
Source: Author’s calculation with data of the World Bank. Implicit GDP deflator were applied (2000 = 100)
55%
45%
Why Puerto Rico?

Trade vs. GDP
Mil
lio
ns
US
D (
20
00
= 1
00
)
Source: Author’s calculation with data of the World Bank. Implicit GDP deflator were applied (2000 = 100)
Why Puerto Rico?

LITERATURE REVIEW
- Main Approaches
- Vertical Specialization Index
- Empirical Applications

Approach Author Thematic International Business (IB) & Trade (IT) Link
Labour Fröbel et al. (1980)New Int’ Divison of
LabourEPZ's: Export-oriented industrial fragmentation
Production
Dixit & Grossman
(1982)
Multi-stages of
production
Specialization of production and trade in
intermediates goods
Jones & Kierzkowski
(1990, 2005)
Fragmentation &
services
Fragmented production blocks interconnected by
“services linkages”
Leamer (1996) De-localizationExternal production markets and internal labour
market (Heckscher-Ohlin Theorem)
Feenstra (1998) Des-integrationIntegration of trade and disintegration of
production.
Deardorff (1998) FragmentationFragmentation of production and patterns of
specialization and trade
Global
Value
Chains
Gereffi &
Korzeniewicz (1994)
Global Commodity
Chain
Spatial patterns, strategic reorientation and
transnational corporations (TNC’s)
Gereffi (1999) Commodity Chain International trade and industrial upgrade
Yeats (1999) Global Prod. Sharing Empirical evidence (SITC, revision 2, #7)
Sturgeon (2001) GVC & GPN Holistic analytical framework
Global Disintegration of Production
Source: The author
Main Approaches

International Trade Theoretical Approach
• B. Balassa (1967) [Book]
– “Vertical specialization” Vs. “Horizontal” (p.97)
• Findlay (1978) [JPE, A*]
– “…Vertical international division of labor…the less impatient country and therefore more capital abundant specialize in the more time-intensive earlier intermediate stages…”
Vs. “instantaneous labor-intensive final stage” (p.1005-1006)
• Sanyal (1983) [Ec, A]
– “…both countries are better off under vertical specialization
provided their specialized according to their comparative advantage” (p.75)

Concentrated
Coca-Cola
Country 1Intermediate
Goods
Final Good
Industryj
����������� j
Exports
Country 3
Capital and
Labor
Domestic
Sales
Domestic
Intermediate
Goods
A
B C
D
E
Puerto
Rico
Intermediate
Inputs
Domestic
Intermediate
Inputs
VSI =�� ��������������������� ����
��������� ��� �����
Vertical Specialization: Hummels, Ishii & Yi (2001)
Hummels et al., 2001, p. 78. [JIE, A*]
Country 2

1) “Backward GVC participation index…the country as a user of foreign inputs (upstream links)…”
Backer & Miroudot, 2013, p. 11 [OECD]
2) “HIY formula…method…approach…indicator”
Koopman, Wang & Wei, 2012, pp. 179,184 [JDE, A*]
3) “The value share of imported intermediates in exports”
Upward, Wang & Zheng., 2012, p. 5, 184 [JCE, A]
4) “…vertically specialized (VS) exports as a share of merchandise exports”
Dean, Fung & Wang, 2011, p. 616 [RIE, A]
Vertical Specialization Index
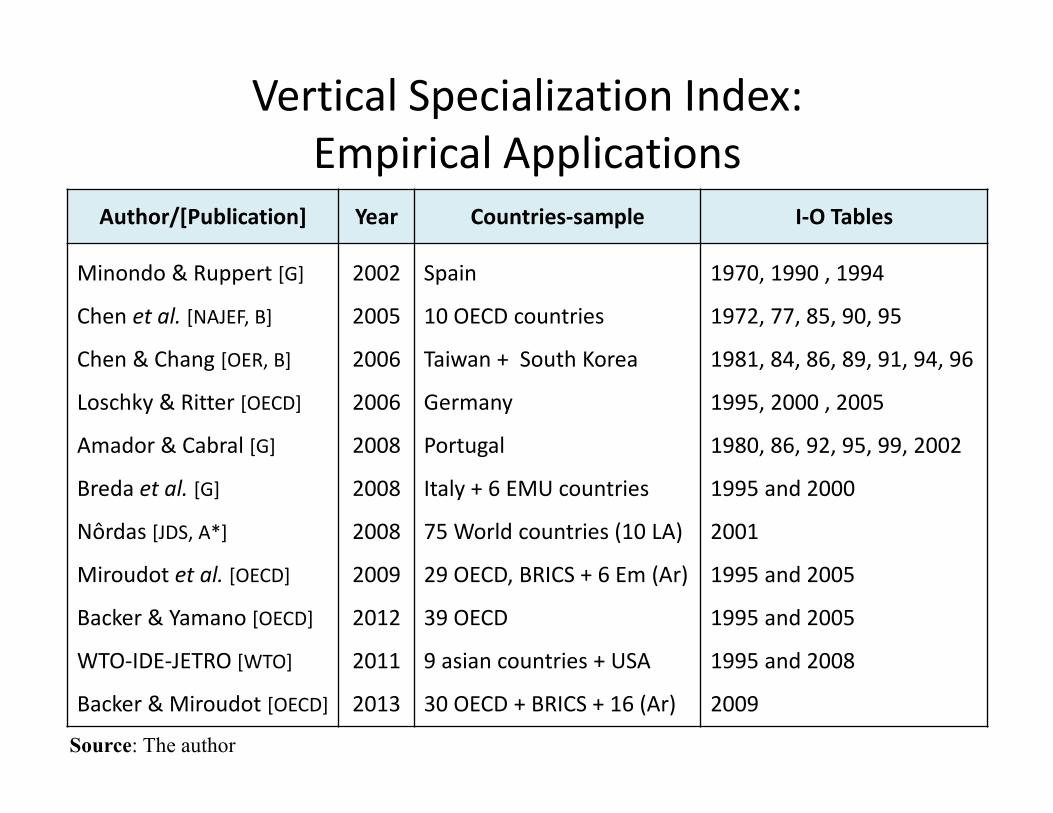
Author/[Publication] Year Countries-sample I-O Tables
Minondo & Ruppert [G]
Chen et al. [NAJEF, B]
Chen & Chang [OER, B]
Loschky & Ritter [OECD]
Amador & Cabral [G]
Breda et al. [G]
Nôrdas [JDS, A*]
Miroudot et al. [OECD]
Backer & Yamano [OECD]
WTO-IDE-JETRO [WTO]
Backer & Miroudot [OECD]
2002
2005
2006
2006
2008
2008
2008
2009
2012
2011
2013
Spain
10 OECD countries
Taiwan + South Korea
Germany
Portugal
Italy + 6 EMU countries
75 World countries (10 LA)
29 OECD, BRICS + 6 Em (Ar)
39 OECD
9 asian countries + USA
30 OECD + BRICS + 16 (Ar)
1970, 1990 , 1994
1972, 77, 85, 90, 95
1981, 84, 86, 89, 91, 94, 96
1995, 2000 , 2005
1980, 86, 92, 95, 99, 2002
1995 and 2000
2001
1995 and 2005
1995 and 2005
1995 and 2008
2009
Source: The author
Vertical Specialization Index:
Empirical Applications

Source: The author
Key Industries Analysis:
Empirical Applications
Author/[Publication] Year Countries IO-Tables
Dietzenbacher [EM, A]
EU Commission [G]
Reis & Rua [G]
Kelly et al. [wp]
Lima et al. [ECLAC]
Guo & Planting [US-BEA]
1992
2007
2009
2013
2013
2013
Netherlands
EU countries
Portugal
UK
Colombia
USA
1948, 1972, 1977, 1981, 1986
2000
1980, 1986, 1992, 1999, 2002
2005
2005
1972, 1977, 1982, 1985, 1990, 1997

METHODOLOGY
- Model
- Matrix Algebra
- Concepts and Proxys
- Data

� The Open Quantity Model of Input-Output
Analysis (“Non-competitive input-output model” by Chen et al.
2012 [CER, A])
� Leontief (1936, RES, A*), (1941, Book)
� Total Gross Output
� = �� + !� Total Gross Outlay
��′ = �′� + #′
Model

• � = $� + !• ! = � − $�• &' = $()*+• &, = -()*+• $ = &'()• ! = � − &'�• ! = (/ − &')�• � = (/ − &')*1!• �2 = 3'!4• HIY = �8&,3'9�:
(1) Basic material balance identity
(2)
(3) Technological domestic matrix (direct)
(4) Technological imported matrix (direct)
(5)
(6)
(7)
(8) Leontief inverse (direct + indirect)
(9)
(10) Vertical Specialization Index (VSI)
Matrix Algebra
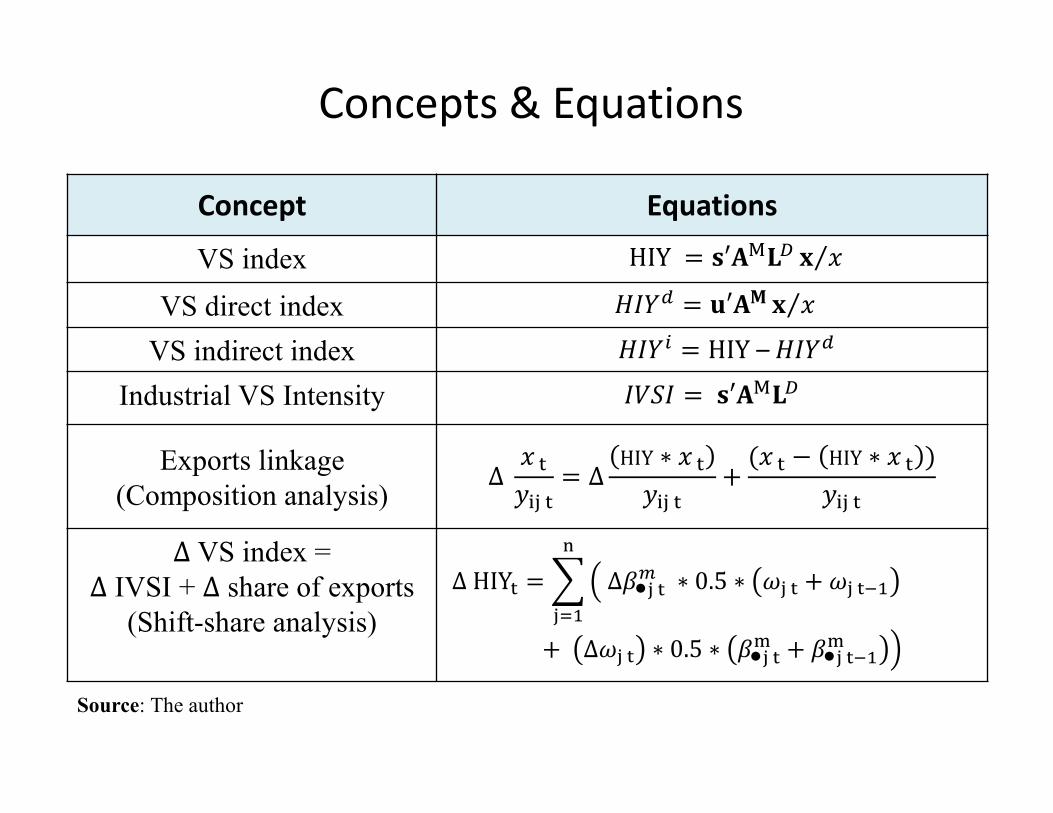
Concept Equations
VS index HIY� = �′&,3; 9 :<VS direct index =>?@ = �′&- 9 :<VS indirect index =>?A = HIY –�=>?@
Industrial VS Intensity >BC> = ��′&,3;
Exports linkage
(Composition analysis)∆� :�EFGH�E = ∆
HIY ∗ :�EFGH�E + (:�E − HIY ∗ :�E )
FGH�E∆ VS index =
∆ IVSI + ∆ share of exports
(Shift-share analysis)
�∆�HIYE =JK�∆L•H�EM � ∗ 0.5 ∗ QH�E + QH�E*1 �����������R
HS1+� ∆QH�E ∗ 0.5 ∗ L•H�ET + L•H�E*1T U
Source: The author
Concepts & Equations

Proxy Concept Equations
VS
Intensity
Analysis
The proportion of imported
intermediates inputs (of total inputs)
required for production by the import
penetration in order to respond to
final demand
>V = (�8-�W*+) X!Y*+ ∗ 100
Backward
Linkages
- Output multiplier
- Demand-driven input-output model
- The interdependence on inputs
Blink = �8 � − &' [Leontief]
Forward
Linkages
- Input multiplier
- Supply-driven input-output model
- The interdependence on outputsFlink = �8 � − a' [Gosh]
Source: The author
Concepts & Equations

� Social Accounting Matrix of Puerto Rico
� Symmetric Transactions Matrix (IOT)
� Years: 1976-77, 1981-82, 1986-87,
1991-92, 2001-2.
� Industries: 92
� Final Demand rectangular matrix
� C, I, G, Exports
Methodology: Data

BUSINESS
INDUSTRY
SECTOR
ECONOMY
Establishment, firm or entrepreneur organization
PRODUCT
PRODUCTIONPRODUCTION
Merchandise or service
Expenses + profit
MERCHANDISE
SERVICESSERVICES
ManufacturingManufacturing
MiningMining
Agriculture, forestry and
fisheries
Agriculture, forestry and
fisheries
UtilityUtility
Transport and CommunicationsTransport and Communications
Financial
Government
(31)
(1)
(34)
(59)
(2)
(3)
(9)
(11)
(3)
Methodology: Data from Puerto Rico IOT
Source: The author

RESULTS

Puerto Rico Vertical Specialization Index:
Applications by Scenarios and Sectors (1977-2002)*
*Data in percentage
1977 1982 1987 1992 2002 1977 1982 1987 1992 2002
Economy 41.2 41.9 34.9 31.1 16.6 22.8 30.0 32.6 29.3 15.9
Services 2.8 1.1 1.0 1.1 0.5 2.2 1.0 0.9 1.0 0.5
Merchandise 38.4 40.8 33.9 30.0 16.1 20.7 29.0 31.7 28.2 15.5
Services 38.8 27.7 24.8 27.7 12.4 29.9 25.2 22.8 25.3 11.4
Merchandise 41.4 42.5 35.4 31.3 16.7 22.3 30.2 33.1 29.4 16.1
SectorsScenario I Scenario II
Application A
Application B

Puerto Rico Vertical Specialization Index:
Applications by Scenarios and Sectors (1977-2002)*
*Data in percentage
1977 1982 1987 1992 2002 1977 1982 1987 1992 2002
Economy 41.2 41.9 34.9 31.1 16.6 22.8 30.0 32.6 29.3 15.9
Services 2.8 1.1 1.0 1.1 0.5 2.2 1.0 0.9 1.0 0.5
Merchandise 38.4 40.8 33.9 30.0 16.1 20.7 29.0 31.7 28.2 15.5
Manufacture 38.2 40.7 33.9 30.0 16.0 20.5 28.9 31.6 28.2 15.5
Services 38.8 27.7 24.8 27.7 12.4 29.9 25.2 22.8 25.3 11.4
Merchandise 41.4 42.5 35.4 31.3 16.7 22.3 30.2 33.1 29.4 16.1
Manufacture 41.4 42.6 35.4 31.3 16.7 22.2 30.3 33.1 29.4 16.1
Scenario II
Application B
Application A
Scenario ISectors
International Comparison of the Petroleum Effect on the VS Index
Source: Hummels el al. (2001) for OECD countries and the author for Puerto Rico.
Application B GE AU USA CA DE UK FR NE JA PR
Scenario I 18 10 8.5 22 31 25 23 38 18 41
Scenario II 16 8 6 19 27 20 17 27 6 22
Effect 2 2 2.5 3 4 5 6 11 12 19
Year 1978 1974 1977 1976 1977 1979 1977 1977 1975 1977
SIC Industry 1977 1982 1987 1992 2002
11000 Mining 0.04 0.003 0.08 0.07 0.07
29100 Petroleum Refineries 39.81 27.64 9.92 8.37 4.57
29200 Other Petroleum Products 1.70 0.63 0.46 0.46 0.54
-- The rest of Industries 58.5 71.7 89.5 91.1 94.8
Total 100 100 100 100 100
Share of Imported Intermediate Inputs
Petroleum Effect on Puerto Rico’s VS Index

*Data in percentage, one more or one less the indicated year. +/- means 2 years more/less. Sources: Chen et.al (2005);
Minondo y Rupert (2002) for Spain; Amador y Cabral (2008) for Portugal; Nôrdas (2008) all data from 2001; the author for
Puerto Rico.
Puerto Rico Vertical Specialization Index as a Share
of Merchandise Exports vis á vis 12 Countries*
AU CA DE FR GE IT JA NE PO SP UK USA PR
HIY - 21.9 31.2 22.9 18.4 - 17.7-
38.1 - - 25.3+
8.5 41.4
RANK - [6] [3] [5] [7] - [8] [2] - - [4] [9] [1]
HIY - 23.1 33.6 26.1 - - 18.7 44.6 37.8 - - 8.8+
42.5+
RANK - [6] [4] [5] - - [7] [1] [3] - - [8] [2]
HIY 11.5 27.8 33.5 26.7 19.8 26.9 13.5 36.9 33.0 31.0 24.1 9.3 35.4+
RANK [12] [8] [3] [7] [10] [6] [11] [1] [4] [5] [9] [13] [2]
HIY 11.2 27.0 29.5 23.9 19.6 22.5+
11.0 - 31.1+
25.6 25.9 10.8 31.3+
RANK [10] [4] [3] [7] [9] [8] [11] - [2] [6] [5] [12] [1]
HIY 15.7 - 28.2+
27.1 22.4 - 9.5 39.2 36.3 29.0 - 12.3+
-
RANK [7] - [4] [5] [6] - [9] [1] [2] [3] - [8] -
HIY 16.5 31.9 29.5 22.7 25.3 27.3 10.9 34.8 28.0 26.0 20.3 11.4 16.7
RANK [11] [2] [3] [8] [7] [5] [13] [1] [4] [6] [9] [12] [10]2001
1977
1980
1985
1990
1995

Source: OECD (2010); the author for Puerto Rico.
Puerto Rico Vertical Specialization Index as a share of
merchandise exports vis á vis 39 OECD countries

Source: Nôrdas (2008); The author for Puerto Rico
Puerto Rico Vertical Specialization Index as a share of
merchandise exports vis á vis 65 countries (2001-2)

Source: Nôrdas (2008); The author for Puerto Rico``
Puerto Rico Vertical Specialization Index as a Share of
Merchandise Exports vis á vis 10 LA Countries (2001-2)

Share of Vertically Specialized Exports:
Direct and Indirect

*Real: GDP implicit deflator using data from the Word bank, 100=2000.
$5 $8 $8
$9
$6
Real Vertically Specialized Exports*

Contribution to the change of
Export/Gross Output ratio

Source: Hummels et al. (2001) for OECD countries; Amador & Cabral (2008) for Portugal and the author for
Puerto Rico
CountriesInicial, final
years
∆ In exports
share of Gross
Output
Change of VS
exports
%
Japan 1970, 1990 3 6.1
Australia 1968, 1989 6 16.2
United States 1972, 1990 7 14.1
Puerto Rico 1977-1992 7 -49.0
Canada 1971, 1990 8 50.9
Germany 1978, 1990 9 22.2
Netherlands 1972, 1986 10 48.2
France 1972, 1990 11 32.4
United Kingdom 1968, 1990 15 31.7
Denmark 1972, 1990 17 30.8
Compared Contribution to the change of
Export/Gross Output ratio

Compared PR Vertical Specialization Contribution
�′&,3; 9 :<
Source: Hummels et al. (2001) for OECD countries; Amador & Cabral (2008) for Portugal and the author for
Puerto Rico
Shift-Share for Puerto Rico Shift-Share for 10 countries
Inicial, final
years∆
∆ VS
Intensity*
∆ Share of
Exports*
-1.9
[-27.5]
-8.8
[127.5]
1987, 1992 -3.4
1992, 2002 -13.3
1977, 2002 -6.9
-2.0
[59.1]
-1.4
[40.9]
-9.1
[68.3]
-4.2
[31.7]
1977, 1982 6.9
1982, 1987 2.7
6.8
[99.0]
0.1
[1.0]
1.6
[61.6]
1.1
[38.4]
CountriesInicial, final
years∆
∆ VS
Intensity*
∆ Share of
Exports*
Portugal 1980, 2002 16.0 73.1 26.9
Canada 1971, 1990 7.0 73.5 26.4
France 1972, 1990 6.0 90.3 9.6
United Kingdom 1968, 1990 5.7 110.4 -10.4
United States 1972, 1990 4.9 90.3 9.7
Netherlands 1972, 1986 3.2 136.4 -36.4
Australia 1968, 1989 2.2 78.4 21.7
Germany 1978, 1990 1.2 90.3 9.6
Denmark 1972, 1990 0.7 74.1 25.8
Japan 1970, 1990 -2.4 18.2 81.9
Puerto Rico 1982, 2002 -14.0 79.9 20.1

Fuente: OECD 2010 y cálculos propios para el offsh3 de Puerto Rico, 1992 y 2002
Relative Change of the Imported intermediates inputs as a
share of total inputs 1995, 2005
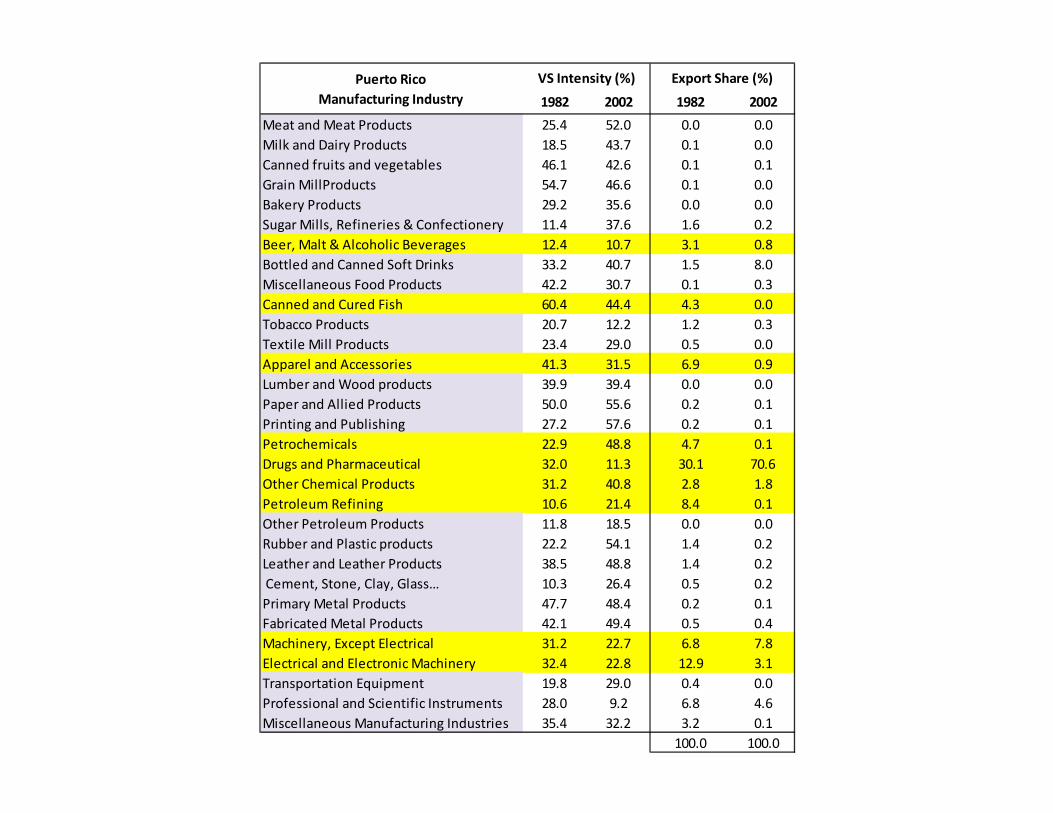
1982 2002 1982 2002
Meat and Meat Products 25.4 52.0 0.0 0.0
Milk and Dairy Products 18.5 43.7 0.1 0.0
Canned fruits and vegetables 46.1 42.6 0.1 0.1
Grain MillProducts 54.7 46.6 0.1 0.0
Bakery Products 29.2 35.6 0.0 0.0
Sugar Mills, Refineries & Confectionery 11.4 37.6 1.6 0.2
Beer, Malt & Alcoholic Beverages 12.4 10.7 3.1 0.8
Bottled and Canned Soft Drinks 33.2 40.7 1.5 8.0
Miscellaneous Food Products 42.2 30.7 0.1 0.3
Canned and Cured Fish 60.4 44.4 4.3 0.0
Tobacco Products 20.7 12.2 1.2 0.3
Textile Mill Products 23.4 29.0 0.5 0.0
Apparel and Accessories 41.3 31.5 6.9 0.9
Lumber and Wood products 39.9 39.4 0.0 0.0
Paper and Allied Products 50.0 55.6 0.2 0.1
Printing and Publishing 27.2 57.6 0.2 0.1
Petrochemicals 22.9 48.8 4.7 0.1
Drugs and Pharmaceutical 32.0 11.3 30.1 70.6
Other Chemical Products 31.2 40.8 2.8 1.8
Petroleum Refining 10.6 21.4 8.4 0.1
Other Petroleum Products 11.8 18.5 0.0 0.0
Rubber and Plastic products 22.2 54.1 1.4 0.2
Leather and Leather Products 38.5 48.8 1.4 0.2
Cement, Stone, Clay, Glass… 10.3 26.4 0.5 0.2
Primary Metal Products 47.7 48.4 0.2 0.1
Fabricated Metal Products 42.1 49.4 0.5 0.4
Machinery, Except Electrical 31.2 22.7 6.8 7.8
Electrical and Electronic Machinery 32.4 22.8 12.9 3.1
Transportation Equipment 19.8 29.0 0.4 0.0
Professional and Scientific Instruments 28.0 9.2 6.8 4.6
Miscellaneous Manufacturing Industries 35.4 32.2 3.2 0.1
100.0 100.0
VS Intensity (%) Export Share (%)Puerto Rico
Manufacturing Industry

Change of the Imported intermediates inputs as a share of
total inputs required for production (import penetration in
order to respond to final demand). 1995, 2005
Fuente: OECD 2010 y cálculos propios para el offsh3 de Puerto Rico, 1992 y 2002

* In percentage
**Based on Lall’s technological exports classification (2000)
1977 1982 1987 1992 2002
Pharmaceutic 3.3 10.2 10.2 10.0 8.4
Electrical Machinery 2.3 4.8 5.9 5.3 0.7
P&C instruments 0.9 2.1 2.9 3.0 0.4
Machinery 0.9 2.4 3.4 2.3 1.8
Petrochemicals 7.6 3.0 0.1 0.0 0.1
Other Chemicals 1.7 1.2 1.2 1.0 0.7
Wearing & Appareal 3.1 3.0 1.8 1.4 0.3
Leather 0.6 0.6 0.7 0.7 0.1
Goma y plástico 0.6 0.5 0.3 0.3 0.1
Textil 0.7 0.1 0.2 0.1 0.0
Petroleum Refineries 9.4 7.9 1.4 1.1 0.1
Canned Fished 4.0 2.7 2.7 1.4 0.0
Non-Alcoholic 0.2 0.6 2.4 2.9 3.3
Alcoholic Beverage 0.7 0.5 0.2 0.1 0.1
Tabacco 0.9 0.3 0.0 0.1 0.0
Total Sum 36.8 39.9 33.4 29.8 16.0
HIY 41.4 42.6 35.4 31.3 16.7
% 0.89 0.94 0.94 0.95 0.96
Vertically
Specialized
Mnf. Industries
Vertical Specialization Index*Exports Classification**
Category Technology Driven
Low
Technology
Baja
Simple /
Labour-
Intensive
Low Wages
Resource-
Based
Simple /
Labour-
Intensive
Natural
Endowments /
Low Wages
High
Technology
Complex /
Capital -
Intensive
I I&D /
Networks
/skilled labor
Medium
Technoloy
Complex /
Capital -
Intensive
I I&D /
Networks
/skilled labor

Fuente: OECD 2010 y cálculos propios para el offsh3 de Puerto Rico, 1992 y 2002
Change of the Imported intermediates inputs as a share of
total inputs High Technology. 1995, 2005

Fuente: OECD 2010 y cálculos propios para el offsh3 de Puerto Rico, 1992 y 2002
Change of the Imported intermediates inputs as a share of
total inputs Low Technology. 1995, 2005

Resource -Based Low Technology
Medium Technology High Technology
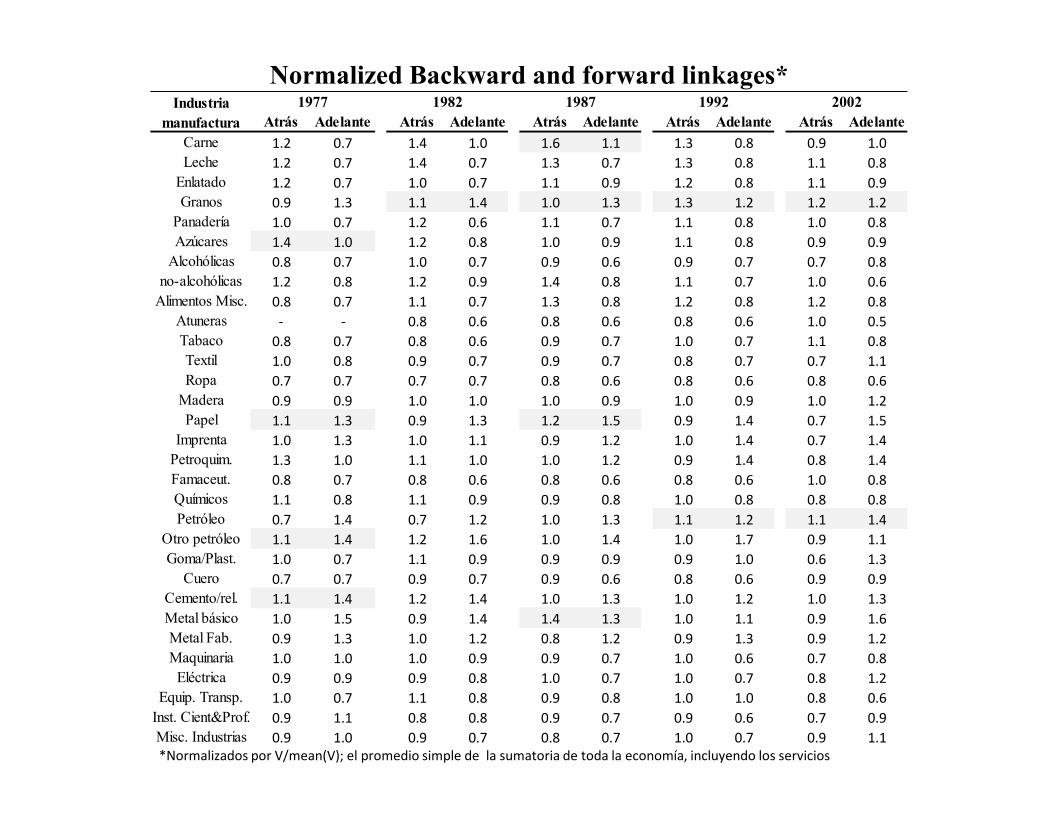
Atrás Adelante Atrás Adelante Atrás Adelante Atrás Adelante Atrás Adelante
Carne 1.2 0.7 1.4 1.0 1.6 1.1 1.3 0.8 0.9 1.0
Leche 1.2 0.7 1.4 0.7 1.3 0.7 1.3 0.8 1.1 0.8
Enlatado 1.2 0.7 1.0 0.7 1.1 0.9 1.2 0.8 1.1 0.9
Granos 0.9 1.3 1.1 1.4 1.0 1.3 1.3 1.2 1.2 1.2
Panadería 1.0 0.7 1.2 0.6 1.1 0.7 1.1 0.8 1.0 0.8
Azúcares 1.4 1.0 1.2 0.8 1.0 0.9 1.1 0.8 0.9 0.9
Alcohólicas 0.8 0.7 1.0 0.7 0.9 0.6 0.9 0.7 0.7 0.8
no-alcohólicas 1.2 0.8 1.2 0.9 1.4 0.8 1.1 0.7 1.0 0.6
Alimentos Misc. 0.8 0.7 1.1 0.7 1.3 0.8 1.2 0.8 1.2 0.8
Atuneras - - 0.8 0.6 0.8 0.6 0.8 0.6 1.0 0.5
Tabaco 0.8 0.7 0.8 0.6 0.9 0.7 1.0 0.7 1.1 0.8
Textil 1.0 0.8 0.9 0.7 0.9 0.7 0.8 0.7 0.7 1.1
Ropa 0.7 0.7 0.7 0.7 0.8 0.6 0.8 0.6 0.8 0.6
Madera 0.9 0.9 1.0 1.0 1.0 0.9 1.0 0.9 1.0 1.2
Papel 1.1 1.3 0.9 1.3 1.2 1.5 0.9 1.4 0.7 1.5
Imprenta 1.0 1.3 1.0 1.1 0.9 1.2 1.0 1.4 0.7 1.4
Petroquim. 1.3 1.0 1.1 1.0 1.0 1.2 0.9 1.4 0.8 1.4
Famaceut. 0.8 0.7 0.8 0.6 0.8 0.6 0.8 0.6 1.0 0.8
Químicos 1.1 0.8 1.1 0.9 0.9 0.8 1.0 0.8 0.8 0.8
Petróleo 0.7 1.4 0.7 1.2 1.0 1.3 1.1 1.2 1.1 1.4
Otro petróleo 1.1 1.4 1.2 1.6 1.0 1.4 1.0 1.7 0.9 1.1
Goma/Plast. 1.0 0.7 1.1 0.9 0.9 0.9 0.9 1.0 0.6 1.3
Cuero 0.7 0.7 0.9 0.7 0.9 0.6 0.8 0.6 0.9 0.9
Cemento/rel. 1.1 1.4 1.2 1.4 1.0 1.3 1.0 1.2 1.0 1.3
Metal básico 1.0 1.5 0.9 1.4 1.4 1.3 1.0 1.1 0.9 1.6
Metal Fab. 0.9 1.3 1.0 1.2 0.8 1.2 0.9 1.3 0.9 1.2
Maquinaria 1.0 1.0 1.0 0.9 0.9 0.7 1.0 0.6 0.7 0.8
Eléctrica 0.9 0.9 0.9 0.8 1.0 0.7 1.0 0.7 0.8 1.2
Equip. Transp. 1.0 0.7 1.1 0.8 0.9 0.8 1.0 1.0 0.8 0.6
Inst. Cient&Prof. 0.9 1.1 0.8 0.8 0.9 0.7 0.9 0.6 0.7 0.9
Misc. Industrias 0.9 1.0 0.9 0.7 0.8 0.7 1.0 0.7 0.9 1.1
Industria
manufactura
1977 1982 1987 1992 2002
Normalized Backward and forward linkages*
*Normalizados por V/mean(V); el promedio simple de la sumatoria de toda la economía, incluyendo los servicios

Orientación
Hacia Atrás
Orientación
Hacia Adelante
Industria Clave
Gráfica xx: Comercio vertical y eslabonamientos: Manufactura 1977

Orientación
Hacia Atrás
Orientación
Hacia Adelante
Industria Clave
Gráfica xx: Comercio vertical y eslabonamientos: Manufactura 1982

Orientación
Hacia Atrás
Orientación
Hacia Adelante
Industria Clave
Gráfica xx: Comercio vertical y eslabonamientos: Manufactura 1987

Orientación
Hacia Atrás
Orientación
Hacia Adelante
Industria Clave
Gráfica xx: Comercio vertical y eslabonamientos: Manufactura 1992

CONCLUSIONS
- Concluding Remarks
- Limitations and Future Research
- Contributions


