
© TNS July 2015
This research was funded through the Making Vegetable Markets Work (MVMW) Program, implemented by Mercy Corps in partnership with Swisscontact and East-West Seed International. MVMW seeks to
improve farm incomes from vegetable production, and subsequently household livelihoods, in Southern Shan and Rakhine States, Myanmar. MVMW also seeks to improve competitiveness of the vegetable sector as a whole and to improve the policy and enabling environment in order to promote sector growth. MVMW is funded by the Livelihoods and Food Security Trust Fund (LIFT). LIFT is a multi-donor fund established in 2009 to improve the lives and prospects of and vulnerable people in rural Myanmar. Current governmental donors are Australia, Denmark, the European Union, France, Ireland, Italy, the
Netherlands, New Zealand, Sweden, Switzerland, the United Kingdom and the United States of America. From the private sector, the Mitsubishi Corporation is a donor. The donors contracted UNOPS as the Fund Manager to administer the funds and provide monitoring and oversight for LIFT. So far, LIFT support has
reached nearly 2.8 million people, or roughly five percent of Myanmar's population
Disclaimer: This study was made possible by the generous support of LIFT. The views and opinions expressed herein are those of the author (TNS Myanmar). Overall responsibility for the content lies with Mercy Corps and does not necessarily reflect the views of LIFT or any of the LIFT donors.
Vegetable Consumption,
Preferences and Supply Chain Myanmar
Final Report

2
Vegetable Consumption, preferences and supply chain – final report © TNS July 2015
Contents
1 Executive summary 6
1.1 Context and background 6
1.2 Main findings 6
1.3 Recommendations 8
2 Research background 11
2.1 Research objectives 11
2.2 Research methodology 11
2.2.1. Quantitative household survey 11
2.2.2. Qualitative supply chain research 13
3 Findings 15
3.1 Supply chain overview 15
3.2 Traders (broker sales centre) 16
3.3 Broker 18
3.4 Wholesalers 19
3.5 Retailers 21
3.5.1. Sorting and altering produce along the supply chain 26
3.5.2. Honesty and consumer loyalty 27
3.5.3. Consumer channel preferences 28
3.5.4. Purchasing directly from the farmer 31
3.6 Household consumers 34
3.6.1. Vegetable preferences 34
3.6.2. Household budget 34
3.6.3. Vegetable usage and storage 35
37
3.7 Quality 38
3.8 Willingness to pay more for higher quality 41
3.9 Willingness to try new vegetables 42
3.10 Concerns 44
3.11 Chemicals 45

3
Vegetable Consumption, preferences and supply chain – final report © TNS July 2015
3.11.1. Selling organic produce 48
3.11.2. Certifying health and safety standards in the vegetable sector 49
3.12 Imports 50
Appendices 51
3.13 Appendix 1: Sampling Methodology 51
3.14 Appendix 2: Quantitative questionnaire 52
3.15 Appendix 3 – Qualitative respondent profiles 93
3.16 Appendix 4: Discussion guide for retailer/ restaurant/ supermarket managers 96

4
Vegetable Consumption, preferences and supply chain – final report © TNS July 2015
List of tables
Table 1 Sample structure and size .................................................................................................... 12
Table 2 Main purchase channel for household vegetables (%) .............................................................. 22
Table 3 Supply issues for commonly purchased vegetables (%) ............................................................ 23
Table 4 Household consumer loyalty (%) ........................................................................................... 27
Table 5 Top five retailer enquiries (%)............................................................................................... 27
Table 6 Important attributes when selecting a vegetable outlet (%) ...................................................... 29
Table 7 Perceived strengths and weaknesses of vegetable retail channels .............................................. 31
Table 8 Reasons for purchasing current range of vegetables (%) .......................................................... 34
Table 9 Reason for vegetable wastage (%) ........................................................................................ 37
Table 10 Considerations when purchasing vegetables (%) ................................................................... 38

5
Vegetable Consumption, preferences and supply chain – final report © TNS July 2015
Table of figures
Figure 2 Location (%) ..................................................................................................................... 12
Figure 1 Age Group (%) .................................................................................................................. 12
Figure 3 Market flow diagram ........................................................................................................... 16
Figure 4 Purchase unit (%) .............................................................................................................. 23
Figure 5 Level of retailer interaction (%) ........................................................................................... 27
Figure 6 Vegetables commonly purchased (%) ................................................................................... 34
Figure 7 Flexibility in household vegetable budget (%) ........................................................................ 35
Figure 8 Number of meals including vegetables cooked a day (%) ........................................................ 35
Figure 9 Main cooking methods (%) .................................................................................................. 36
Figure 10 Timeframe of vegetable usage after purchasing (%) ............................................................. 36
Figure 11 Average weekly wastage (%) ............................................................................................. 37
Figure 12 Willingness to trade off quality and price (%) ....................................................................... 42
Figure 13 Interest in trying new vegetables (%) ................................................................................. 42
Figure 14 Main concerns when buying vegetables (%) ......................................................................... 44
Figure 15 Concerns about chemicals used in vegetable harvest (%) ...................................................... 45
Figure 16 Concern by locations and SEC (%) ...................................................................................... 45
Figure 17 Appeal of chemical-free vegetables (%) .............................................................................. 47
Figure 18 Perceived impact of chemicals (%) ..................................................................................... 47
Figure 19 Measures to avoid/remove chemicals among household consumers (%) .................................. 48
Figure 20 Preference of locally grown Vs. imported vegetables (%) ....................................................... 50
Figure 21 Local v imported by locations and SEC (%) .......................................................................... 50

6
Vegetable Consumption, preferences and supply chain – final report © TNS July 2015
1 Executive summary
1.1 Context and background
In late March 2015, Making Vegetable Markets Work (MVMW) Program, implemented by Mercy Corps in
partnership with Swisscontact, and the Dutch Economic Mission to Myanmar facilitated the establishment of
the Vegetable Sector Acceleration Taskforce (VSAT) . The VSAT is a multistakeholder platform that convenes
government, the private sector and development partners to help accelerate the development of Myanmar’s
vegetable sector. The organisation aims to boost vegetable production and consumption by improving access
to production knowledge, improving safe use of pesticides, developing a strong seed sector, reducing post-
harvest losses and improving existing markets and creating new markets for vegetables.
Mercy Corps and its partners have collected considerable information on the vegetable production aspects of
the supply chain that have helped them to identify challenges and opportunities related to improving
vegetable production and efficiencies. While the organisations were aware that demand for vegetables was
increasing, an information gap was to know more about consumers’ preferences for vegetables – how they
perceived quality, their buying patterns, eating habits and perceptions towards chemicals and food safety.
The research reported here is the first consumer preferences research of Myanmar’s vegetable sector.
TNS Myanmar was selected to conduct the consumer preferences research and a mixed methodology
approach was adopted. A quantitative survey of households (n=800) was conducted in Yangon, Mandalay,
Taunggyi and Pathein. The locations were selected with the aim of capturing consumers with different levels
of access to vegetable markets, and quotas were placed on the sample to ensure consumers from different
socio-economic groups were included, as purchasing and consumption patterns were expected to vary
between the socio-economic groups. Household consumers were asked about their vegetable purchasing
and consumption behaviours, the parameters they consider when evaluating vegetable quality, their
willingness to try new vegetables and their concerns about the vegetables available to them in the market.
At the same time as the survey was conducted (September 2015), 38 qualitative in-depth interviews were
conducted with the main players in the supply chain - brokers, traders, wholesalers, wet market retailers,
supermarkets, hotels and restaurants in Yangon. These interviews focussed on supply chain dynamics,
perceptions regarding vegetable quality, purchasing and selling behaviours; and specifically investigated
willingness to bear risk, relationships with different actors in the supply chain, perceptions of consumers’
preferences for vegetable quality, consumers’ willingness to try new vegetables, and health and safety
concerns related to vegetables.
1.2 Main findings
Consumer preferences
A key objective of the research was to understand how consumers and actors in the supply chain evaluated
vegetable quality.
Traders and consumers of vegetables want “good quality”. Household consumers, irrespective of their
incomes are not willing to buy lower quality vegetables at a cheaper price. They are prepared to pay for

7
Vegetable Consumption, preferences and supply chain – final report © TNS July 2015
“good quality” and there is evidence they are prepared to pay more than they currently spend for improved
quality. Lower-end restaurant purchasers of vegetables are the exception as they are more concerned about
purchasing their restaurant inputs at lower prices to maximise their profit on low-margin meals. This need is
satisfied mainly by wet market retailers who trim bad spots, yellow leaves etc from damaged produce and
sell it at a lower price.
So, the primary need of household consumers and supply chain actors that impacts on their evaluation of
quality is: “I want this vegetable to last in good condition for a couple of days before I sell it, or my family
eats it”.
The shelf-life of a vegetable is particularly important to wet market retailers and supermarkets, and is also a
consideration of household consumers, who, although they visit a wet market for vegetables everyday do
not necessarily consume what they buy each day and expect produce to last 2-3 days at home. Shelf-life is
important to retailers because it may take them 2-3 days to sell what they buy and they want to be able to
display the produce on the second or third day still ”looking fresh” and attracting a good price. The key
consideration for supply chain actors is to buy vegetables that will transport well and sell quickly at the best
price. So, “looking fresh enough that it will last well”, either through transportation, on display at the market
or in the home drives the criteria being used to evaluate quality.
“Freshness” is primarily evaluated by visual cues – bruising, insect damage and signs of deterioration. More
specific cues of freshness, and therefore quality, naturally varies between vegetable types, and includes
colour, shape, size, firmness and ripeness. These are set out in the main findings of this report for specific
vegetables. Taste is not a primary driver of quality in most consumers’ minds.
Household consumers mainly shop at wet markets for vegetables and the drivers for this are convenience
and the markets’ proximity to homes. There is some dissatisfaction with the cleanliness of wet markets and
the produce sold there. About 20% of household consumers from most socio-economic groups say they do
visit supermarkets occasionally. As more supermarkets open and they become more convenient for people
to access, traffic in modern trade outlets will rise. Supermarkets are working at drawing more customers
into their stores and to encourage people to buy vegetables in supermarkets are pricing their fresh produce
to compete with wet markets, although this often means a loss in profit.
Household consumers and retailers in wet markets and street stalls are not well informed of where
vegetables have been grown or how. Ideas and fears about chemical residues on vegetables are circulating
among consumers and retailers who demonstrate a variety of beliefs about how to assess whether there are
harmful chemicals on a vegetable and how to avoid them. Consumers believe that chemicals are bad for
their health and can cause illness and diarrhoea. They want clean, safe food but they do not know how to
determine if that is what they are buying. The “organic” concept has strong appeal, but is not well
understood. It may be possible to grow demand for organic, or chemical-free, produce but a willingness to
pay more for that produce needs to be developed also. The implications of chemical-free/organic growing on
end price or on the look and taste of chemical-free produce is not well understood by consumers. Supply
chain actors, who are more connected to farmers, tend to think it would not be possible for farmers to grow
organically because they would not have the yields to generate adequate profit and the produce would not
look good enough to be accepted by consumers.

8
Vegetable Consumption, preferences and supply chain – final report © TNS July 2015
There are many information gaps and therefore opportunities to educate consumers, retailers and other
actors in the supply chain about vegetable quality and safety.
Consumers are open to trying new things, but in the vegetable sector they are not used to seeing new
varieties or types of vegetables in the market. They are accustomed to seeing, buying and cooking the same
vegetables as have always been in the market.
Market channels
Strong relationships with elements of trust and loyalty exist between players in the vegetable supply chain.
The strongest relationships are between farmers and traders, between some brokers and wholesalers and
between some retailers and wholesalers. The players in the supply chain who absorb the most risk are the
farmers and the traders who provide inputs to farms and accept the produce to sell on. They risk being left
with unsold produce or having to sell produce at too low a price. Wholesalers in urban markets also take risk
because they agree to prices before produce arrives in the market and risk having paid too much if a day
later, when the produce arrives, another region has flooded the market with the same kind of vegetables
and the price drops. Brokers face the least risk in the chain. Traders, brokers and wholesalers all play roles
in setting prices.
Risks are minimised in a variety of ways by different actors in the supply chain. One way has been through
much-improved communication between actors in the vegetable supply chain channels. Affordable SIM cards
and smartphones that have become available in Myanmar in 2015 have had a big impact on improving the
certainty and speed of transactions throughout the supply chain. The mobile phone provides opportunities
for organisations seeking to support the sector to reach any of the players in the supply chain with
information that may improve how the sector functions.
It is a supply-driven market and while there are good communication links between the actors in the chain
who are dealing and profiting, the communication link between the household consumer and the supply
chain is weak. There appears to be little awareness among consumers of opportunities for them to
communicate to suppliers up the chain regarding what they want to see in the vegetable markets where
they shop. Hotels and supermarket chains are consumers who do make demands for quality and types of
produce and there are wholesalers who are responding to this demand.
1.3 Recommendations
Improving consumer voice in the supply chain
Although there are online forums and pages on social media that consumers could be using to voice
concerns or express what they want to see in markets in relation to vegetables, participation in these forums
appears low. Consumers are not accustomed to having a voice to suppliers or farmers regarding vegetables
and this topic may not be top of mind when using social media. Awareness needs to be raised that these
channels are now there, that someone is listening and that there are benefits to consumers of voicing their
preferences and concerns. Traditional and modern media channels can be used to inform people of how
they could be participating more and how it would benefit them. Cooking shows on television, articles in
newspapers and journals, targeted social media are opportunities to do this.

9
Vegetable Consumption, preferences and supply chain – final report © TNS July 2015
Consumers and retailers appear to know little about where food has been grown or how. Restaurants,
supermarkets and retailers who do have direct relationships with farmers experience “better quality”
produce, which they appreciate. Improving consumers’ connections with farmers can be done by signage or
labelling at retail outlets telling consumers where the produce was grown (country outside Myanmar and
region within Myanmar) and whether it is chemical-free. In traditional trade outlets (wet markets/street
stalls) this can be done simply with small signs that sit next to the produce, in a similar way that the
different rice varieties are labelled in markets. This also improves vendors’ knowledge of where and how the
produce has been grown and could spark discussion among consumers and between consumers and retailers
and increase the role of demand in the supply chain.
In supermarkets, there is an opportunity for more vivid communications to be made and presented next to
vegetables for sale. Price can also be displayed in these fixed-price outlets. Small, colourful leaflets for
people to pick up and take with them with information about vegetables, their nutritional value, recipes, safe
cultivation can be an effective way to build knowledge and stimulate conversation between consumers and
their retailers. While supermarkets are still evolving into people’s shopping repertoires, the research tells us
that about one-fifth of people from most socio-economic groups do visit them occasionally. This is likely to
grow as more are built and become more convenient for people to visit. Information provided here may
reach fewer people initially but if leaflets can be taken away, are attractive and interesting to consumers
they will find their ways into homes and conversations. As well as having an impact on stimulating consumer
voice this can also have an impact on increasing vegetable consumption if the communication materials link
with people’s needs (is this food safe?, recipes that satisfy my family, health and nutrition information, how
to store produce).
Increasing vegetable consumption
The research tells us that health and nutrition are in consumers’ minds when purchasing vegetables. There
is an opportunity to improve knowledge and awareness of the role of vegetables in nutrition and health
through traditional media with good reach, as well as social media. Communications need to be targeted to
audiences through the media outlets they use. We know from other consumer research that it is primarily
the women in a household who shop and cook for their families and they are rewarded by seeing their family
enjoy the food they prepare and seeing their family in good health. Women say that one of the main
burdens of this role is deciding what to cook. They do not tend to experiment with dishes outside the
traditional repertoire and this has an impact on their willingness to try new vegetables as they are used to
buying the same produce they need for the same dishes. They also have not had much exposure to new
types of vegetables. Building awareness and interest in vegetables, new varieties, health, nutrition and
different dishes with not only the women who shop and cook, but also with their children, husbands and
other family members could have a positive impact on families thinking and talking more about what they
eat and the role of vegetables.
Certification body
The concept of a certification body is new to consumers and actors in the supply chain. There are doubts
about who to believe. Introducing such a system may be effective at building consumer demand and have
an impact on their selection of produce but would require considerable knowledge building and awareness
raising with consumers and all actors in the supply chain.
10
Vegetable Consumption, preferences and supply chain – final report © TNS July 2015
Chemical-free/organic
There is growing concern over the safety of vegetables due to chemical usage but little understanding of
what chemical-free/organic produce would cost or look like. While it may be too early to develop an organic
vegetable market in Myanmar, steps can be taken to circulate information that addresses consumer
concerns about pesticide usage and provide information that addresses misconceptions people have about
how to tell if produce is affected and how to safely wash produce. Such measures may lay the groundwork
for establishing markets for chemical-free/organic produce in the future.
Activities like the annual Myanmar Mango Festival held in Yangon, organised by the Myanmar Fruit and
Vegetable Producers’ Association (MFVPA) are well attended by growers and organisations promoting
chemical-free food. It also receives coverage in the Myanmar media. An activity like this for vegetables may
be a way to disseminate information and promote a certification body. A “vegetable festival” is also a chance
for growers, retailers and consumers to come together.
Future research
To examine consumer reactions to new concepts (chemical free/certification body), new vegetable varieties
and communication materials it is recommended that focus group discussions with consumers would allow
for produce, concepts and communication materials to be tested in detail. Attempts in the research reported
here to use photographs and showcards to stimulate discussion regarding quality and other concepts was
not particularly successful because an image is quite different from the actual vegetable. Group discussions
with consumers where they can examine actual vegetables would allow for more realistic and in-depth
discussion with consumers and retailers.
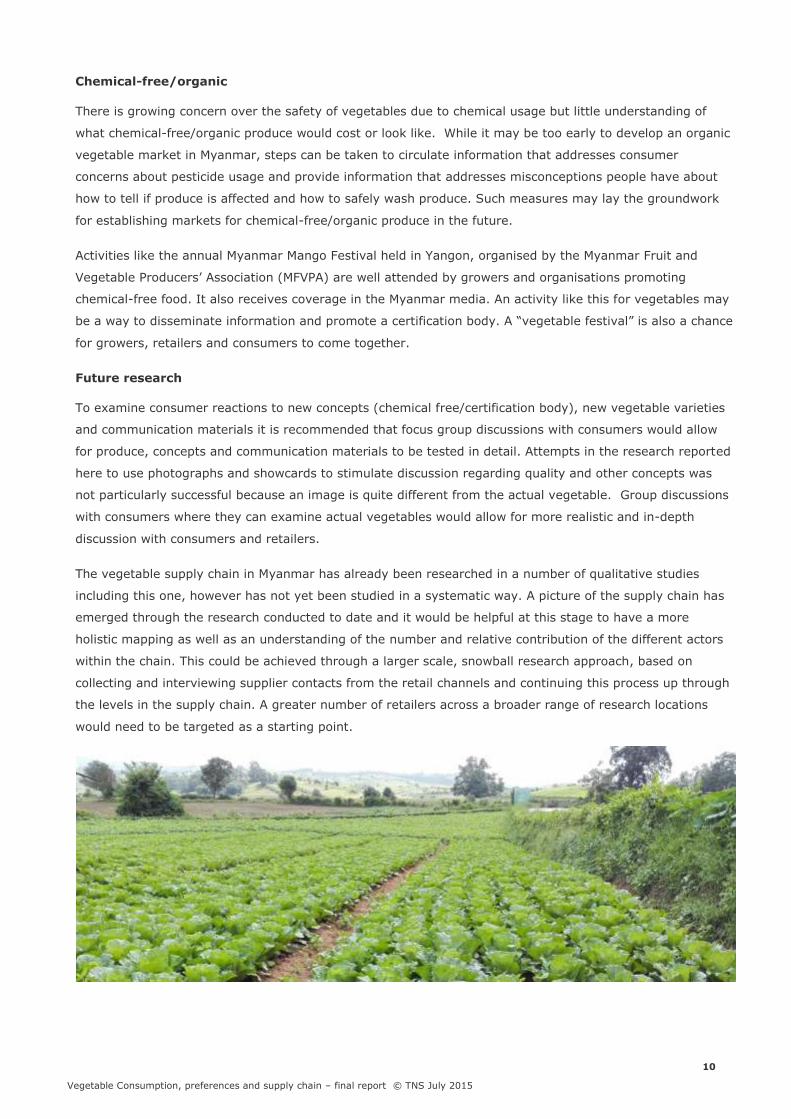
The vegetable supply chain in Myanmar has already been researched in a number of qualitative studies
including this one, however has not yet been studied in a systematic way. A picture of the supply chain has
emerged through the research conducted to date and it would be helpful at this stage to have a more
holistic mapping as well as an understanding of the number and relative contribution of the different actors
within the chain. This could be achieved through a larger scale, snowball research approach, based on
collecting and interviewing supplier contacts from the retail channels and continuing this process up through
the levels in the supply chain. A greater number of retailers across a broader range of research locations
would need to be targeted as a starting point.

11
Vegetable Consumption, preferences and supply chain – final report © TNS July 2015
2 Research background
The Making Vegetable Markets Work (MVMW) Program, implemented by Mercy Corps in partnership with
Swisscontact, and the Dutch Economic Mission to Myanmar facilitated the establishment of the Vegetable
Sector Acceleration Task Force (VSAT) in late March 2015 to help accelerate Myanmar’s vegetable
sector development by facilitating closer collaboration among a range of relevant stakeholders: government,
civil society, and domestic and international agribusinesses and business support organizations. Formation of
the VSAT arose from recommendations formulated during the Myanmar Vegetable Sector Round Table event
held in Nay Pyi Taw in November 2014. The organisation aims to boost vegetable production and
consumption by improving access to production knowledge, improving safe use of pesticides, developing a
strong seed sector, reducing post-harvest losses, and creating markets for vegetables.
In order to achieve its aims for the development of Myanmar’s vegetable sector, VSAT, facilitated by Mercy
Corps via the LIFT-funded MVMW Program, undertook the first consumer research of Myanmar’s vegetable
sector.
2.1 Research objectives
The core objectives of the study were to:
Map the current retail market outlets or other consumer access points for vegetables in the
country’s major cities, and detail the specific characteristics of these market channels.
Provide a more comprehensive understanding of consumer preferences for vegetables in terms
of quality perceptions, buying patterns, eating habits, trade-offs between quantity-quality-
pricing, and other related aspects of consumer preference.
Provide a more comprehensive understanding of current market trends in terms of market
share of the different outlets (high-end retail and wholesale, specialized shops, open/wet
markets, restaurants, hotels and other industrial/commercial consumers).
Provide a more comprehensive understanding of consumer preferences (quality, food safety) as
they relate to willingness to pay and consumer purchasing power.
Gather recommendations for increasing vegetable consumption in Myanmar through innovative
public and private sector marketing efforts.
2.2 Research methodology
A mixed methods approach was used in the research. A quantitative survey of consumer households and a
series of qualitative interviews with various players in the supply chain were conducted.
2.2.1. Quantitative household survey
The quantitative survey was designed to collect information from households about vegetable consumption
and purchase patterns, and to understand the needs and priorities that household consumers have. A
consumer usage and attitude survey was conducted with n=800 household consumer respondents from
Yangon, Taunggyi, Pathein and Mandalay. This sample size provides 95% confidence level of results which
are representative of tier1 and 2 cities in Myanmar with +/- 5% margin of error. The survey is robust

12
Vegetable Consumption, preferences and supply chain – final report © TNS July 2015
47
22
14
17
Yangon
Mandalay
Taunggyi
Pathein
18
26
28
28
18-30
31-40
41-50
51-60
enough to compare each city with disaggregated data to show differences in SEC, age and other profiling
variables at tier level. When selecting the cities, the team took into consideration the size and location of the
cities, with the aim of capturing household consumers who would have differing levels of access to vegetable
markets. The selected cities account for 47% of urban households in Myanmar, and the sample is allocated
proportionally to each location. Quotas were set based on income, to ensure a good cross section of
respondents who we expected to have different purchase and consumption patterns, priorities and needs.
The table below shows the sample structure and size. More information on the sampling procedure can be
found in Appendix 1: Sampling Methodology:
Table 1 Sample structure and size
Cities Geographic Zone Number of
households Sample size
Yangon Tier 1, South 1,073,678 380
Mandalay Tier 1, Central / North 221,861 180
Pathein Tier 2, South 66,036 130
Taunggyi Tier 2, Central / North 82,604 110
Total 800
Data was collected through a household survey of face-to-face interviews using Computer Assisted Personal
Interviewing (CAPI) devices, or tablets. These allowed for increased accuracy in data collection, faster
processing time and less environmental impact. The quantitative survey instrument can be found in
Appendix 2: Quantitative questionnaire.
Quantitative sample profile
Breakdown of the household consumer sample based on key demographic information is shown in the charts
below. Socio-economics status (SEC) indicates the wealth of the household (with “A” being most wealthy
and “F” being least wealthy). In order to give a more accurate result for socio-economics status (SEC), we
incorporated a number of variables including households’ income, respondents’ education, household
durables and no. of rooms in the house, into the calculation (Q12 – Q18 within the questionnaire). Points
were assigned according to the responses to each question and respondents were assigned to a quintile
based on their score.
Figure 2 Age Group (%) Figure 1 Location (%)

13
Vegetable Consumption, preferences and supply chain – final report © TNS July 2015
5
13
25
34
16
7
Figure 3. Socio-economics
Status (%)
A
B
C
D
E
F
2.2.2. Qualitative supply chain research
In-depth interviews were initially conducted with 28 respondents from various levels in the supply chain. The
sample was comprised of the following actors:
3 traders in the Broker Sales Centre
3 brokers
4 wholesalers
6 wet market retailers
4 street stall retailers
2 supermarket managers responsible for purchasing
4 restaurant owners and purchasers (2 higher-end, 2 lower-end)
2 hotel owners
Respondent profiles are included at Appendix 3 – Qualitative respondent profiles.
A further 10 interviews were conducted with Yangon wholesalers during the analysis stage of the research to
further investigate and clarify findings. The four wholesalers interviewed initially described slightly different
methods for how they placed orders for vegetables and negotiated prices and deliveries. They did not say
they purchased vegetables that arrived at Yangon’s Thirimingalar market on trucks, without having been
pre-ordered. It had been thought at the outset of the research that wholesalers did buy vegetables that
arrived at the market on spec. Because of the differences between wholesalers’ described behaviours and
because none of the four were buying from trucks on spec our interviewer team returned to Thirimingalar
during the analysis phase of the research to interview more wholesalers to confirm the purchasing
behaviours described were consistent across a larger number of wholesalers. The findings were confirmed.
It should be noted that not all actors fit into these distinct categories, and that they may occupy more than
one position in the market. These anomalies are highlighted throughout the report. The typical roles played
by each actor are outlined in the following table.
5
23
30
25
10
8
Figure 4. Income Level (%)
Less than 125,000
125,001 - 250,000
250,001 - 375,000
375,001 - 625,000
625,001 - 999,000
6 Above 1,000,000

14
Vegetable Consumption, preferences and supply chain – final report © TNS July 2015
Actor Myanmar name Function
Small-time trader A wae daw Transports farmers’ produce to the Broker Sales Centre (BSC) where the farmer has no means to do so
Not used by a majority of farmers – a minor actor
Broker Sales Centre (BSC) Pwal yone A centralised venue where traders coordinate with brokers and farmers.
Many provide farmers with input materials (e.g. seeds, fertilizers)
Set initial market price by assessing the supply in the market and the demand from the brokers
Receive 5–6% of what farmers earn Sell produce to brokers
Broker Pwal sar (kon thal) Buys produce from range of sources:
farmers, BSC and other brokers Haggles the price with the traders
Sells to wholesalers who place orders with them
Separates the produce into classes of quality for distribution to specific wholesalers
Wholesaler Lat Kar Usually has an established relationship
with a broker or number of brokers with whom they place orders according to a client’s orders, and their current stock levels
Generally sells multiple kinds of vegetables
Retailer Lat Li Includes wet market owners, street stall
owners, supermarkets, and restaurant owners
Purchase from a variety of sources –
some direct from farmers, most from wholesalers
The in-depth interviews were conducted in Yangon and Aung Ban in southern Shan State according to a
discussion guide that investigated:
the role of the respondent in the supply chain
their perceptions regarding vegetable quality
their purchasing and selling behaviours
their future expectations
The qualitative research specifically investigated the supply chain actors’ willingness to bear risk, their
relationships with different actors in the supply chain, their perceptions of consumers’ preferences for
vegetable quality, consumers’ willingness to try new vegetables, and health and safety concerns related to
vegetables.
An example discussion guide is included at Appendix 4: Discussion guide for retailer/ restaurant/
supermarket managers.

15
Vegetable Consumption, preferences and supply chain – final report © TNS July 2015
3 Findings
3.1 Supply chain overview
The relationships between the different actors within the supply chain are complex and varied in nature. This
section highlights the central relationships and characteristics that drive the vegetable market in Myanmar,
and addresses issues such as price setting, the trust and distrust implicit in transactions, the regularity of
customers and orders between supply chain levels, and transport and storage practices. The focus will then
turn to an analysis of the consumers – their major purchasing channels and their buying habits and
preferences. While the diverse array of business relationships within this sector makes generalisations
challenging, interviews with key actors revealed insightful, and sometimes surprising, findings. The following
diagram provides an overview of the market and its key actors, indicating the number of respondents that
were interviewed at each level.

16
Vegetable Consumption, preferences and supply chain – final report © TNS July 2015
3.2 Traders (broker sales centre)
Inputs and risk-bearing
While all operated at significantly different capacities, the three BSC traders interviewed all provided
agricultural inputs to a number of farmers. The supply of agricultural materials such as seeds, fertilisers and
pesticides acts as a credit system whereby the farmer is bound to provide the relevant BSC trader with their
produce. When the trader on-sells the produce, he receives 5%–6% of the price and the farmer receives the
rest. As a key input provider, and with his profit relying on the farmer delivering the promised crop, the
trader bears a degree of risk in on-selling the produce to the market. If a farmer were to break his
relationship with the trader and sell his produce elsewhere for a better price (such as to an independent
broker) then the BSC trader loses out on his input costs. However, despite the informal nature of these
credit-bound “contracts”, farmers rarely break the trust of the input-providing trader, because a good
reputation as a reliable supplier guarantees future input provision.
The sheer number of farmers some of the traders deal with often minimises the risk taken by traders – for
example, one trader reported that he dealt with between 700 and 800 farmers each week. The shortcomings
of a few of his farmer contacts are diluted by the magnitude of his network. A trader operating on this scale
does not provide inputs to all his farmers. He usually provides inputs for around 10% of the farmers he buys
from.
“I have 700-800 farmers who supply me with vegetables. I don’t need to give seeds and fertilizers to
all of them. Everyday at this Broker Sales Centre I deal with 200 to 300 farmers so I usually have a
good amount of produce to trade.” : Trader-Aung Ban
Figure 3 Market flow diagram

17
Vegetable Consumption, preferences and supply chain – final report © TNS July 2015
A smaller-scale operator might provide farm inputs to all the farmers he deals with and therefore bears a
more significant degree of risk.
“I provide 10 farmers with seeds, fertilizers and pesticides. These are the farmers I buy tomatoes
from. They bring their tomatoes to me because they want to receive more seeds and fertilizers from
me for the next crop. If they do not produce good crops or decide to sell their produce to another
trader then I lose.” : Tomato Trader -Aung Ban
The size of traders’ broker networks also varies. One of the trader respondents said he only dealt with seven
Yangon brokers, while other traders reported dealing with up to 100 different brokers.
“I have 70-80 brokers (customers) from Yangon, 30 customers are from Mandalay, 10 from Ba-an
and 5-10 from Mawlamyaing.”: Trader - Aung Ban
The traders’ close relationship to the farmers means they are more aware of the agricultural system and
factors affecting farmers’ ability to supply the market than other actors in the supply chain. As input
providers, these BSC traders can influence what is grown and available. Some say they try to choose new
seed varieties to see if they will grow well and be accepted by consumers.
“I am always looking to test different seeds from Thailand with the farmers. When a new variety has
been grown then I send some samples of the vegetables to Yangon to check if they sell well in the
market.” : Tomato Trader -Aung Ban
Price setting
The BSC traders play an important role in price setting in the market. One BSC trader explained that his
position was essential to the functioning of the market because
the farmers generally lacked adequate contacts and networks
to ascertain supply and demand in the market, and therefore
did not know what price to set for their produce.
“We decide the price. The farmer relies on us to do that
because they don’t know what is happening in the market. For
example, when the demand from the brokers is more than the stock I
have, the price increases. We have to raise the price when the demand
increases. If I have only 50 bags and there are 10 buyers, the price
definitely increases.” : Trader-Aung Ban
However, due to the fact that traders mainly operate within a
local area the prices they set do not necessarily translate to the
prices found in wholesale markets where demand and supply
dynamics shift because of produce being received from other
farming areas. Traders are in constant communication with each other in an attempt to assess supply and
demand forces within the market, but there is a considerable amount of deliberate miscommunication
between different BSCs attempting to get an advantage over their competitors.

18
Vegetable Consumption, preferences and supply chain – final report © TNS July 2015
3.3 Broker
“Promiscuous” buyers
The next link in the supply chain is the broker, who occupies the most fluid position within the market.
Brokers are “promiscuous” buyers, in that they make their purchases from a variety of sources based on
daily orders from wholesalers. If a broker cannot complete his orders from the stock at the BSC, he will
order directly from producers in the villages.
“I buy from vegetable farms directly when I have to. For instance when people want to buy
cabbages and there are not enough at the BSC, then I go direct to farmers to buy.”: Broker-Aung
Ban
They typically do not show loyalty to one BSC trader or other supplier, and most bargain hard for reduced
prices. One broker explained his bargaining strategy - he inquires about price at several BSC without making
a purchase to ascertain the market price. When a BSC trader asks him what other BSC traders are charging
for their produce for, he lies - “We never tell them the correct price – that is our skill” – and instead, tells
the trader a significantly lower price, in his attempt to bargain for the lowest price he can achieve.
“I start collecting prices from the traders at the Broker Sale Centre. I go from one trader to the next
asking for the price of snow peas. They will always ask me what the other traders are quoting for a
price. We never tell them the correct price. We make it lower. This is our skill and advantage in this
business.”: Broker-Aung Ban

19
Vegetable Consumption, preferences and supply chain – final report © TNS July 2015
The impact of mobile technology has
rapidly transformed the
machinations of the agricultural
sector. Actors at all levels are in daily
contact with both providers and
suppliers, taking orders and relaying
prices. Instant picture messaging is also
useful, with Viber being a key
communication platform. If wholesalers
are delivered poor quality produce, they
can immediately send a photo to their
broker demanding new produce or a
discount. If a trader wants to know if
there is interest in a new crop that they
provided to the farmer, they can send a
photograph down the supply chain to
gauge interest in the market. The ability
to communicate means coordination
within the market has significantly
improved.
Prior to the boom of the mobile phone
industry, actors were able to make phone
calls to place orders to their providers.
However, queuing for a landline phone
took time, and it was difficult and often
impossible to alter an order once it was
placed, which frequently resulted in
vegetable dealers having too much, or
too little stock depending on the
fluctuating supply and demand.
Risk-taking and profiteering
The broker’s wide networks, the key role they play linking
producers and markets and their role in price setting
means they are well positioned to achieve profit. One
broker explained how he manages to achieve profit. He
said that vegetables were sold for the highest price in the
very early hours of the morning. As the day goes on the
produce becomes cheaper because it is less fresh and
traders want to sell, rather than store, unsold produce. A
broker may buy carrots from the BSC at K3,000 per viss
at 5am, and then move to another BSC later in the
morning and buy more carrots for K2,500 per viss, and
finally from another BSC for K2,000 per viss. Then when
he quotes the price to the wholesaler, he may set the
price at K2,900 per viss, leaving him with a sizeable
profit.
Quality Sorting
The brokers also play the role of the quality sorters and
distributors in the market. Once a broker has purchased a
bulk amount of produce from a trader, they will then
proceed to separate the produce according to freshness,
ripeness and quality, in order to decide where to sell. The
highest quality produce is typically sent to Yangon, with
secondary-quality produce going to Mandalay and Nay Pyi
Taw. The leftover produce gets transported throughout
the country. The less ripe produce will be sent to
destinations requiring more travel time to ensure it has its
maximum shelf life after reaching the end market.
3.4 Wholesalers
Wholesaler interviews were conducted at Yangon’s Thirimingalar market, the biggest wholesale market in
Myanmar, which receives produce from all over the country. While the wholesaler level is by no means
simple, the research revealed there was a greater level of coordination and structure than was expected,
despite the fact that all wholesalers interviewed operated in different ways. Wholesalers differ in the scale at
which they work, from where and who they source their produce, who they sell their produce to and how
they make a profit. Because each of the four wholesalers interviewed operated in different ways each of
them is presented below. Three things they had in common were:
they dealt in a wider range of vegetables than traders or brokers (more of those actors tended to
specialise in 1-5 vegetables)
they often purchase the same vegetables at a different quality grade, so they can offer their customers
a cheaper, lower quality option, and a more expensive, high quality option
they place orders to brokers or farmers for the produce they will buy

20
Vegetable Consumption, preferences and supply chain – final report © TNS July 2015
Wholesaler 1
This wholesaler places daily orders with one trader. If his trader is unable to deliver him the necessary
amount or the desired level of quality, he will purchase extra produce from other wholesalers and brokers
without placing an order. He deals with around 40 – 50 customers a day, a majority of whom are regular.
“I have one regular trader and I call him and place orders. If he does not have enough produce I buy
from the shops around here.”: Wholesaler-Yangon
Wholesaler 2
The second wholesaler interviewed also had a regular broker who he placed orders with. But he also had a
number of other brokers who he called when his regular broker was not able to fill his orders. He deals with
around 40 customers a day, of which around 30 are regular.
“I deal with 40 customers in total a day, 30 customers are regular customers who are from wet
markets.”: Wholesaler-Yangon
Once again showing the proliferation and importance of mobile communication within the market,
Wholesaler 2 explained how produce was often damaged during the journey to Yangon from Shan State. If
on inspection he finds a significant portion of the produce has been damaged, he will send photographs of
the produce over Viber to his broker and demand a reduction in price.
Wholesaler 3
This wholesaler acts similarly to how brokers operate, as well as acting as a wholesaler. He sells in
Thirimingalar market but does not use a broker to source his produce. Instead, he has long-established
relationships with a group of farmers in Meiktila, who he provides farm inputs on credit. He considers himself
business partners with the farmers, and feels he must use their produce even on the days when the quality
of the output is not high. He provides vegetables to 15 wholesalers in Yangon, 3 in Mawlamyaing, 2 in both
Mandalay and Nay Pyi Taw, and occasionally sells to some retailers. Because he buys directly from farmers
he must ascertain the market price himself, which he does by phoning acquaintances at Thirimingalar
market.
Wholesaler 4
This wholesaler has close links to farmers in Hmawbi (approximately one hour northwest of Yangon) and
plays the roles of broker, wholesaler and retailer. He provides inputs to the farmers who sell their produce to
him, which he then sells on to wet market retailers, supermarkets, restaurants and factories. His farmers’
proximity to Yangon means his vegetables do not have to undergo the long and damaging journey from
further regional farms, and he insists his customers are happy to pay a higher price for his products because
they last longer.
“It is only one hour’s drive from Hmawbi to Yangon, so the produce is fresher and in
better shape when it gets to market than vegetables that have come from further away.
Customers prefer my produce because it is so fresh. It will last longer from the time
they buy it, so the price is higher.”: Wholesaler-Yangon
21
Vegetable Consumption, preferences and supply chain – final report © TNS July 2015
It had been thought at the start of the research that it was a common behaviour for wholesalers at
Thirimingalar market to buy produce from trucks that arrived at the market, without having placed orders.
Because none of the wholesalers reported this behaviour in the initial four interviews and because it was
apparent there were a range of different behaviours among wholesalers the research team returned to the
market during the analysis phase of the research to talk to more wholesalers to investigate further how
wholesalers bought their produce and established prices. The team spoke to 10 more wholesalers who all
said they always place orders for vegetables and contribute to transport costs to get the produce to market.
They said that the produce arriving at the market was almost always pre-ordered.
“Nobody would just send down a truck of vegetables without having orders and a
price agreed. They would not take the risk of paying for the transport and not
knowing if they could sell it for a good price once they arrived in Yangon. It’s also a
matter of trust. We order from the people we trust.” : Wholesaler - Yangon
It has become more reliable and convenient to place orders as mobile phones allow wholesalers and brokers
to share photographs of produce and determine a price with more certainty of what they are buying, and
also be more responsive to market demand and supply when negotiating prices.
“Before we had mobile phones we had to queue up for the landline phone and we
could not send pictures. It took a lot more time and we could not see photographs
of what we were buying like we can now. We receive pictures on Viber and then
negotiate the price. I am more certain now of what I am negotiating for and paying
for.” : Wholesaler - Yangon
“The phones also help us to sort out problems if the vegetables that arrive are
damaged or there are bad quality items hidden under the good quality ones.
Because now we can refer to the photo the broker sent us and send him a photo of
what arrived.” : Wholesaler - Yangon
Vendors at Thirimingalar market said about one-third of the people operating at the market were brokers
who specialised in one crop, particularly tomatoes, and sold to wet market and street stall retailers. These
brokers do not take the risk of committing to buy a delivery of vegetables, as wholesalers do. They agree
with the broker in the growing area to adjust the price to sell the produce in a day and take 10% of the
selling price. In these situations the risk is borne by the broker from the growing area.
One wholesaler explained how he reduced his losses if he had too much produce left at the end of a day. He
sells it to the vegetable sellers who do not have the required YCDC permits to operate at the market but set
up shops around the Thirimingalar market compound. They pay a reduced price for the produce and also sell
it on cheaper to customers (street stall holders, wet market retailers, small restaurants).
3.5 Retailers
Retailers are categorized here as the actors who supply directly to consumers, and includes wet markets,
street stalls, supermarkets, restaurants and hotels. Most of the retailer interviews were conducted with
market stall and street stall holders as they represent the most active vegetable retail environment. As

22
Vegetable Consumption, preferences and supply chain – final report © TNS July 2015
indicated by Table 2, the wet market is by far the most frequented outlet by household consumers for
purchasing vegetables.
Table 2 Main purchase channel for household vegetables (%)1
Wet market 85
Kiosk / hawker 11
Traditional store 4
Supermarket / hypermarket 0
Wet market and street stalls
These retailers typically deal with a wider range of vegetables than other actors in the supply chain. The
research was not focussed on specialist sellers, like potato and onion sellers, so most of the retail
respondents were selling as wide a range of vegetables as the season allowed.
These retailers do tend to have relationships with wholesalers who they trust and they tend to buy from
these sellers regularly. Retailers are looking for wholesalers who will reliably provide them with the same
quality of vegetable so they can deliver consistent quality to their customers. A detailed discussion on
quality appears later in this report under section 3.7.
For those with regular traders, trust and reliability of produce quality is the basis of the business
relationship.
“There are five kinds of carrots: special size, big size, normal size, small size and
reject. I tell the wholesaler what size I want on the phone. I usually order special
size, but some suppliers send deliveries that are mixed with other sizes. But some
suppliers send only “special” size packages, and I choose to buy from these
suppliers.” : Wet Market Retailer, Taunggyi
Having a relationship with a regular wholesaler also makes the price negotiation easier.
“Because I usually go to the same seller at Thirimingalar Market it is
comfortable for me when it comes to the price. Because we know each other
he doesn't try and sell me things at an unreasonable price like he might if he
did not know you. I know he will not put the bad carrots on the bottom or hide
cauliflowers that are going brown, and I know that he is being fair on the price.
The price does go up and down. Like when there were floods – it is fair that
everything costs a bit more because there is less produce around and with him
I feel that he is honest with me and does not put the price too high.
Sometimes if he has some produce that is not so fresh he will offer it to me at
a reduced price. I sometimes take it and chop it up to sell as a ’ready-to-cook’
mix.” : Street stall retailer - Yangon
1 Source: Household consumer study, Q020

23
Vegetable Consumption, preferences and supply chain – final report © TNS July 2015
99
96
95
48
40
23
16
15
14
11
1
1
0
1
4
3
48
58
76
83
83
33
84
98
99
97
0
4
2
1
2
1
53
1
0
3
Onion
Garlic
Tomato
Carrot
Beans
Eggplant
Cabbage
Pumpkin
Chilli
Okra
Cucumber
Cauliflow…
Kankong
By weight By piece/bunch Either
Supply issues are not uncommon and affect cauliflower and pumpkin in particular. Supply chain actors also
talked about supply fluctuations caused by seasonality, flooding and other climate related issues, and
through a lack of management and communication flow through the supply chain. This flows through to
price fluctuation which is one of the greatest concerns for consumers.
Table 3 Supply issues for commonly purchased vegetables (%)2
Sometimes unavailable
Cauliflower 21.63
Pumpkin 20.51
Carrots 7.90
Cabbage 6.07
Okra 5.79
Cucumber 5.14
Eggplant 4.36
Tomato 3.24
Beans 2.77
Chilli 2.04
Kangkong 1.50
Garlic 1.37
Onion 1.12
When shopping for vegetables it is quite common to purchase by piece or bunch (rather than weight), particularly for
certain vegetables such as kankong, cauliflower and cucumber. This can influence consumer preferences, particularly for
vegetables sold in units such as cauliflowers. Consumers may be attracted to larger sized vegetables at the expense of
taste or reject organically harvested produce which tends to be smaller. Working with retailers to shift this trend is
advised to encourage openness to variants which may be smaller in size, particularly if they can offer greater benefits
either for growers or consumers. See Figure 4 below.
2 Source: Household consumers survey, Q033
Figure 4 Purchase unit (%)

24
Vegetable Consumption, preferences and supply chain – final report © TNS July 2015
Restaurants
Trusted relationships with vegetable suppliers were also important to the restaurant owners who took part in
the research. Owners of lower-end restaurants who rely on selling food at affordable prices and have many
customers tended to value the relationship with suppliers for the ease of price negotiations. These
restaurant owners care more about paying a consistent price for their vegetables than they do about
receiving consistent quality. Although the relationship is important for regular purchasing these lower-end
restaurant owners will also look around for cheaper prices in retail wet markets and buy where the price is
lowest sometimes.
“Sometimes I have produce left over so I don’t need to buy a lot and I just go to
the local wet market at the end of the street and buy what I need for my
restaurant. I also know people there who understand that I have a restaurant so I
am looking for a good price. I think they keep some vegetables at a high price for
the housewife who is cooking just a little for her family and they keep other
vegetables for us who want to buy a lot at a good price, but can accept a
vegetable of a little lower standard.” : Restaurant Manager - Yangon
Respondents who owned restaurants of a higher standard were more concerned about being able to
purchase a consistent quality of vegetables so they could deliver consistent quality on their menu to their
customers. For example, a high-end restaurant owner responsible for purchasing in Yangon only purchases
from one trusted wholesaler and one farmer, both of whom he has an established working relationship with
and places daily orders.
“I like purchasing directly from the farmer because it is fresher. We have a long
relationship and I like the produce from this one farmer in Taunggyi so I stick with
him. I also use a wholesaler I know well because some vegetables are available
closer to Yangon, so it's more convenient to use the wholesaler for some vegetables.
But the important thing for me is that I know I can rely on the quality I receive. I
want fresh, good looking vegetables because my customers enjoy the food more and
keep coming back when the quality is good.”: Restaurant Manager-Yangon
Hotels
The buyers at large hotels, like the Shangrila Hotel in Yangon, have strong relationships with up to 7 or 8
vegetable wholesalers. Some of these wholesalers represent farms from where they source the produce
directly. Others are buying a wide variety of produce from brokers from all over Myanmar. High-end hotels
have high quality standards and will reject produce that does not meet their standard. Wholesalers deliver to
these customers and know that the hotel restaurants staff will inspect the produce as it arrives and reject
anything that does not meet their standards. Hotels, like restaurants, are also careful about the price and
will also reject an offer to supply certain vegetables if the price is too high. Still, wholesalers who are dealing
with this end of the market make good enough margins to cover the extra costs in sorting vegetables and

25
Vegetable Consumption, preferences and supply chain – final report © TNS July 2015
delivering them to the hotels and restaurants. The business from these large hotels is good enough that the
wholesalers accept being paid monthly.
“I buy from the wholesaler and he delivers the vegetables to my restaurant. If the
wholesaler doesn’t have what I want, the wholesaler goes and gets it from another
wholesaler.”: Restaurant Manager-Yangon
“We have to insist on a certain quality. We also have to have a reasonable price. Of course you
pay more for better quality, but the price must still be fair. Our wholesalers know this. They
know our standard and we have quite a good working relationship. When we ask for
something they will find it for us. It is about trust. We are a good customer, so they know it is
worth being fair with us on quality and on price.” : Hotel Restaurant Manager - Yangon
Supermarkets
The Yangon supermarket chain, Sein Gar Har, who participated in the research places daily orders with four
trusted wholesalers from Thirimingalar market. Volumes ordered depend on what they need to restock
shelves. The purchasing officer said they like to buy directly from farmers because the produce is fresher but
supply is inconsistent and so farms are not a reliable source. Wholesalers are flexible to varying sizes of
orders. If one cannot supply, another can easily be found.
Like high-end hotels the supermarkets make clear demands of their wholesalers regarding price, quality and
delivery. They reject produce that is not the quality they need for their customers. They are also very price
sensitive. The Sein Gar Har purchasing manager explained that the supermarket’s strategy with vegetable
pricing was to keep prices low and competitive with the wet market to try and establish new consumer
behaviours – to draw consumers away from wet markets and into supermarkets for vegetable purchasing.
“The challenge we face with vegetables is that people don’t come here for that.
They still shop in the wet market near their house for vegetables. We want to
start drawing them in here so they feel more comfortable buying cleaner
vegetables in an air-conditioned shop. But because we are competing with the
wet markets we have to keep the price down. So we negotiate carefully with the
wholesaler, but we have good relationships with the ones we use, so it works
well.” : Supermarket purchasing manager - Yangon

26
Vegetable Consumption, preferences and supply chain – final report © TNS July 2015
3.5.1. Sorting and altering produce along the supply chain
The retailer level in the supply chain is where most
alterations to the produce take place. Some brokers and
wholesalers will sort produce into quality grades with
different pricing for upper and lower market segments. But
it is the retailers who start to trim away dying leaves on
vegetables and remove signs of damage or decay to make
their produce more appealing to consumers. Most retailers
reported taking particular care of cauliflowers, which they
thoroughly rinse, prune away dirty or rotten parts, and
carefully remove the outer leaves. A few go further, and
specifically prepare vegetables for their customers. One
street stall owner in Taunggyi told of the considerable work
she puts into making her vegetables both aesthetically
pleasing and convenient to use, which she insists keeps her
customers coming back. For example, her preparation for
water cabbages involves rinsing and shaking the vegetables
to remove insects and dirt, cutting the ends off and slicing it
into one-inch pieces.
“I charge no additional service fees because they are my regular customers,
but some stall owners charge service fees for cleaning and preparing the
vegetables.” : Street stall vegetable retailer – Taunggyi.
Conversely, another street stall owner explained that when her produce started to become “faint and
yellow”, she “mixes them with the better stuff to make it all look pretty.”
Another wet market retailer also said that to avoid wasting produce she had bought, when it started to
deteriorate she chopped away the dying leaves or “spoilt” parts of the vegetable and combined it with other
chopped vegetables that she then sold at a reduced price as a “ready-to-cook” selection.
When supermarkets have produce that is starting to look unappealing they try to sort and rebundle produce
so it is more attractive for sale or they use it for cooking staff meals. Both supermarkets interviewed
reported they have to throw away wasted produce regularly.

27
Vegetable Consumption, preferences and supply chain – final report © TNS July 2015
3.5.2. Honesty and consumer loyalty
There are clearly varying attitudes among sellers at the wet market/street stall retail outlets towards
customer service. Some sellers value having regular customers and serve them well with price and quality.
“I’m not a sweet-talker and I never cheat with weight. I sell with the normal price
after adding transportation charges…and I don’t steal anything from the
bundles…in my opinion, I don’t need to make a profit of more than 10,000 kyats a
day. I just need to have regular sales and regular customers.” : Wet market
retailer – Taunggyi
Other retailers say they do not have many regular customers and do not talk or know many
of their customers. The household consumer data collected in this research tells the same
story – that there are consumers who go to a regular seller who they trust for vegetables,
but they are in the minority and most consumers shop around.
Table 4 Household consumer loyalty (%)3
I always buy from my regular seller(s) 17
I usually buy from my regular seller(s), and occasionally look around for other options
38
I don t have a regular seller, I look around to find the best option for my needs 45
Figure 5 Level of retailer interaction (%)4
Observed in Figure 5 above, there is little communication between the household consumers and the
retailers, so opportunities for them to communicate their needs and priorities are limited. Only two retailers
told us that regular customers would ask if the vendor had fresher produce behind their stall that they were
not intending to put out until older stock had sold – if so, the consumer asks to buy the fresher produce.
Consumers are like silent actors in the chain. They largely accept what the market provides and try to find
the best deal in the market for the vegetable they want to buy, only exercising their choice and voice
through avoiding buying vegetables that are damaged or not fresh. In this way the vegetable market is very
3 Source: Household consumer survey, Q023 4 Source: Q24 household consumer survey
25
37
74 Yes, ocassionally
Yes, regularly
No, never
Table 5 Top five retailer enquiries (%)
Information on preparing / cooking
vegetables
72
Help in selecting best quality
vegetables
39
Information about new vegetables
that they are selling
14
Information on which pesticides /
chemicals have been used
13
Information on where the vegetables
have come from
6

28
Vegetable Consumption, preferences and supply chain – final report © TNS July 2015
much driven by the considerations of supply rather than demand. There is an opportunity to advise retailers
to draw out consumer opinions about perceptions on quality and their fresh produce needs, which could
deliver benefits all the way up the chain. This feedback would be valuable for supplier and farmers, enabling
them to better tailor inputs and crops to suit and drive market demand. For the retailers themselves,
providing goods that are better aligned to customer desires can help them build their own loyalty and sales.
3.5.3. Consumer channel preferences
We saw in Table 2 above, that the wet market is by far the most common place of purchase for household
vegetables, and the study confirmed that the majority (66%) visit the wet market on a daily basis. This is a
well-established behaviour across the country and the majority of consumers in our research locations say
they purchase vegetables most days of the week. The frequency of purchasing vegetables was a little lower
in Taunggyi, which may be explained by the vegetables they buy in the market being fresher because they
are close to the source and therefore last longer, or perhaps they grow their own vegetables at home.
Vegetables bought in the city have often travelled long distances and deteriorated along the way giving
them a shorter shelf life. Many household consumers have adapted to this by purchasing everyday what
they will eat as the way to guarantee they are eating food that is as fresh as possible.

29
Vegetable Consumption, preferences and supply chain – final report © TNS July 2015
The popularity of the wet market, however, is somewhat at odds with what people say they want from a
vegetable outlet. Household consumers say that the most important attributes for them when selecting a
retail outlet are cleanliness of the outlet, proximity to home, and has a good range of produce at a
reasonable price (Table 6).
Table 6 Important attributes when selecting a vegetable outlet (%)
Is clean 82
Close to home 72
Offers a good range of vegetables 71
Is convenient to travel to and from 67
Sells vegetables at a reasonable price 59
Enjoyable shopping experience 58
Has convenient opening hours 36
Provides good customer service 36
Has vegetables available that I cannot
buy anywhere else 26
Sellers are knowledgeable about vegetables
23
Wet markets fall short in two of these criteria - cleanliness was the lowest ranking attribute of the wet
market, and proximity to home was also defined as a weakness (

30
Vegetable Consumption, preferences and supply chain – final report © TNS July 2015
Table 7 below). It is clear that range and pricing in the wet market is a key driver for wet market shopping
regardless of whether it is clean, or close to home. Visiting wet market or street stall shopping is also clearly
an entrenched behaviour in Myanmar society, where consumers do not yet have a wide choice of retail
options. While consumers say they would prefer a clean and modern shopping environment they do not
consider supermarkets as a regular alternative to their wet market shopping for vegetables at this point.
Still, 20% of household consumers occasionally purchase their vegetables from the supermarket and, as the
market evolves, we expect to see this behaviour grow. If the supermarkets are able to address the current
barriers of proximity and range of vegetables, it’s likely that they’ll start to capture much more share of
fresh produce buyers as we’ve seen in other emerging markets around the globe. This is likely to be one of
the main factors which will force transition in the market as retailers demand higher quality from growers
and distributers, at a reasonable and stable price. They may introduce their own players to the chain, such
as collectors and cold chain distributors in order to ensure these factors. Wet markets will also need to
evolve to maintain competitive, in particular addressing the weakness in terms of lack of perceived
cleanliness, but also they will need to find ways to differentiate themselves as the price and quality gaps
close. Working closely with modern trade retailers is recommended since it is expected that they will be the
actors who will drive change in the vegetable market going forward.

31
Vegetable Consumption, preferences and supply chain – final report © TNS July 2015
Table 7 Perceived strengths and weaknesses of vegetable retail channels
Strengths Weaknesses
Wet market Offers a good range of vegetables
Sells vegetables at a reasonable price
Sellers are knowledgeable about
vegetables
Is [less] clean
Has [less] convenient opening hours
[Less] close to home
Supermarket Is clean
Has convenient opening hours
Provides good customer service
Is [less] convenient to travel to and from
Sellers are [less] knowledgeable about
vegetables
[Less] close to home
3.5.4. Purchasing directly from the farmer
Suppliers had mixed feelings about purchasing directly from farmers – and these stemmed from concerns
about convenience, cost, quality and the kind of vegetables they want to buy. Wholesalers and retailers who
buy direct from farmers tend to have an established relationship with a farmer and often that farmer will be
a friend or family member. Unsurprisingly, Taunggyi residents who are surrounded by farming were more
likely to be purchasing directly from farmers than consumers in Yangon and Mandalay.
Yangon
Only one of the wholesalers interviewed in Yangon was buying direct from a farmer. However, they all
indicated they would like to have direct relationships with farmers because the produce may be fresher, they
would have more choice and it may give them a better price margin by avoiding the fees of the traders and
brokers. However, it is also clear that wholesalers value the work done by the brokers and traders.
Wholesalers discussed that buying direct from the farm would mean they would have to take more
responsibility for transport, would need to employ more staff for collection and that these extra costs may
negate the cheaper price achieved by buying direct. One of the wholesalers went further to say that it would
be difficult to find somebody as “sharp” as the traders, as the traders are believed to have all the necessary
contacts and experience to make them experts at their jobs.
“If I have to send some staff to the farm and manage the procedure of business
the staff charges will be more and the price will be the same. So I just import
from brokers.”: Wholesaler-Yangon
“We don't have the capacity. The brokers are sharp enough to know what
farms sell good produce.”: Wholesaler-Yangon
The desire to purchase from farmers was echoed by most retailers interviewed in Yangon, although there
were a few comments that farmers only wanted to sell in bulk, and that it wouldn’t be any cheaper to buy
from farmers and therefore wasn’t worth the added effort. However, for the most part, retailers were very
much in favour of buying from farmers, and some do, or at least have done so, in the past. A good example
comes from one wet market owner in Yangon who previously purchased her vegetables from Baukhtaw (an
area of farmland close to Yangon that is no longer in use) and lamented that this produce was much fresher
and of a higher quality than what she now purchases. She now purchases from farmers in Shan state,
Figure 9. Attributes of Wet Market %

32
Vegetable Consumption, preferences and supply chain – final report © TNS July 2015
where the vegetables are damaged on the long journey to Yangon and are “less durable” because of the
chemicals used.
“I used to buy from a farmer Bauk Htaw and it was always so fresh, the quality
and appearance of the vegetables were so good. The ones coming from Shan
state have chemicals on them and they get ruined on the way to Yangon. They
arrive older and more damaged than the ones I used to buy close to Yangon.”:
Wet Market Owner-Yangon
This retailer said buying direct from the farmer had not ended up being any cheaper than using the regular
broker/wholesaler channel.
Another wet market owner said she bought some items from farmers because the produce was fresher. But
the arrangement was only possible because the farmers came and delivered to her. She would not pursue
buying from farms direct if she had to arrange the transport.
“I buy watercress, spinach and roselle from the farmer because I don't need to go there to purchase
and it is more fresh. The price is the same as if I bought at Thirimingalar.”: Wet Market Owner-
Yangon
Transport is a major factor in determining wholesalers’ and retailers’ willingness and ability to purchase
directly from a farmer. One restaurant owner in Yangon explained that he had a long-established supply
relationship with a farmer in Taunggyi. The restaurant owner purchases directly from the farmer because he
believes the produce is “freshest when purchased from the farm”. The farmer also delivers directly to the
restaurant, meaning the restaurant does not have to hire additional staff, and after initially having a formal
contract, the two now have an informal agreement of business.
“We choose this supplier because his vegetables are good and because we don't need
to send our staff - otherwise we would have to send at least 3 staff and organise a
truck.”: Restaurant Manager-Yangon
This respondent was the owner of an upper-end restaurant, and it should be noted here that lower-end
retailers were often less concerned with vegetable freshness and quality, and were therefore less discerning
in who they purchased from.
Taunggyi and Aung Ban
As mentioned previously, due simply to proximity to the farms, the retailers interviewed in Taunggyi and
Aung Ban were significantly more likely to be able to purchase directly from farmers. While freshness isn’t
the prime concern (produce is generally fresher in Shan State than would be found in Yangon), produce is
still thought to be cheaper when purchased from a farmer. Convenience remained a factor for some – “if
the farm is too far, I won’t go there” – however, some farmers meet owners half-way, as in the case of the
street stall owner in Taunggyi who always purchases from farmers, but has never visited a farm.

33
Vegetable Consumption, preferences and supply chain – final report © TNS July 2015
“They bring the vegetables from their village and deliver it to the bus station (Pha
Yar Phyu)…we take the vegetables on the pushing-carts from there and lay them
in our shops to sell.” : Wet market retailer – Taunggyi
Retailers say the produce direct from a farm is better because it is fresher, will last longer and they get
more per bundle than when they buy from a broker or wholesaler.
“From the farm I can get many leaves in a bundle. If I buy from a reseller, there
are fewer leaves per bundle. And it is so fresh. If I don’t sell it today, then it is OK
for selling tomorrow.” : Street stall retailer - Taunggyi

34
Vegetable Consumption, preferences and supply chain – final report © TNS July 2015
63
63
52
51
37
36
33
31
20
20
19
18
13
37
37
48
48
61
61
66
66
73
76
78
80
75
0
1
2
3
2
4
7
3
3
12
Onion
Garlic
Tomato
Kankong
Beans
Chilli
Okra
Cucumber
Carrot
Cabbage
Eggplant
Cauliflower
Pumpkin
Regularly Occasionally Never
3.6 Household consumers
3.6.1. Vegetable preferences
Onions, garlic and tomatoes are the clear staple vegetable purchases for consumers. Beans and Kankong are
also frequently purchased vegetables. There was little difference between the vegetables frequently
purchased by higher and lower socio-economic groups or location.
End consumers claim that the main reason why they purchase these vegetables in particular is based on
their typical meal repertoire, followed by family taste preferences and then health and nutrition concerns.
Purchase of garlic, onion and chilli is very much linked to the recipe requirement, while kankong, beans and
cucumber are selected primarily because they are family favourites. Kankong, carrots, beans and okra are
also more commonly chosen for their health benefits. This information can help to shape the decision about
which variants are likely to be popular here, and can also shape programs to help increase vegetable
consumption. For example, we may look for variants of garlic or onion which are more aligned with their
functional use (such as a good shape or size for meal preparation) while enhancing taste will be more
important for kankong, beans and okra variants.
Table 8 Reasons for purchasing current range of vegetables (%)
Required for the recipes I cook 65.6
Family favourites 52.2
Healthy / nutritious 22.2
Readily available at my place of purchase
11.9
Available at a cheap price 6.9
Easy to prepare / cook 6.1
3.6.2. Household budget
At first glance (see Figure 7 below) the average household consumer appears to have a surprisingly flexible
budget with 88% saying their budget is fully flexible according to household needs. This might imply that
there is ample scope to develop the market without great consideration on cost, however this needs to be
Figure 6 Vegetables commonly purchased (%)

35
Vegetable Consumption, preferences and supply chain – final report © TNS July 2015
2.9 5.0
4.3
87.8
Fully fixed
Somewhat fixed
Somewhat flexible according to household needs
Fully flexible according to household needs
27 71 1
1 meal 2 meals 3 or more meals
understood in the context of low average household earnings and spend at the household level. Weekly
spend on vegetables is very low – with the average weekly budget being 6,600 Kyats5 for an average
household of 4.5 people. Nonetheless, the budget flexibility expressed provides a good indication that there
is room for growing the size of the vegetable market in Myanmar.
3.6.3. Vegetable usage and storage
Just under three quarters of households said they cooked vegetables for two out of the three daily meals,
however this may not fully align with
the number of meals that the
household consumes that contain
vegetables, since it may be that
respondents did not consider meals
where only uncooked vegetables
were consumed when providing
responses. Households consume a
range of dishes containing
vegetables. Almost half of consumers
reported that they stir-fried
vegetables daily. Consumption of raw vegetables is common with one-in-four consuming vegetables raw on
a daily basis and this underlines the importance of improving vegetable transportation and cold chain
services to protect vegetables and keep them fresh, which is particularly important when consuming raw
vegetables.
5 At the time of research, the exchange rate was 1USD = 1,300 MMK, therefore this amounts to a total of 5USD
Figure 7 Flexibility in household vegetable budget (%)
Figure 8 Number of meals including vegetables cooked a day (%)

36
Vegetable Consumption, preferences and supply chain – final report © TNS July 2015
28
34
4
55
66
85
65
54
63
71
61
4
63
63
54
21
40
32
14
33
41
34
28
35
22
25
8
11
34
5
2
1
3
4
2
1
3
34
7
1
1
42
1
0
1
41
6
Chilli
Tomato
Onion
Cabbage
Cauliflower
Kangkong
Eggplant
Carrots
Cucumber
Okra
Pumpkin
Garlic
Beans
I use them on the day I buy them I use them within 2 or 3 days
I use them within 4-7 days I keep them for more than a week
47
25
22
17
7
2
0
29
20
27
17
15
2
10
24
39
41
42
41
14
55
1
11
7
13
16
28
24
0
6
2
10
20
55
9
Stir fried
Eat fresh/raw
Soups
Curries
Steamed/boiled
Deep fried
Salad
Everyday 4-6 times per week 1-3 times a week
Less than once a week Never
Garlic and onion are almost always stored outside the refrigerator and are commonly kept for a week or
more. For other vegetables, storage varies and around 30% of people generally store vegetables in the
fridge, with a similar number who store them outside the fridge. The largest proportion (more than 40%) do
not store vegetables at all, and instead use them on the same day of purchase. This is the case with leafy
greens in particular, and aligns with the fact that most consumers are making daily trips to their vegetable
outlet of choice. Refrigeration is still limited and this contributes to the limited shelf-life of vegetables and
will continue to be a market barrier to accepting vegetable variants which are more prone to degradation in
the heat. The fact that the study was only conducted in urban areas means that refrigeration would be much
higher than the national average, as rural electrification is still low in Myanmar.
Just over half of household consumer respondents reported that they wasted no vegetables during the week.
Lower SEC consumers demonstrated a lower wastage average than higher SEC consumers. The main reason
Figure 10 Timeframe of vegetable usage after purchasing (%)
Figure 9 Main cooking methods (%)

37
Vegetable Consumption, preferences and supply chain – final report © TNS July 2015
cited for vegetable wastage is linked to short shelf life, and we can expect this to remain an issue until
transportation, cold chain and grid access improves in Myanmar.
The vegetables do not last long 57
I buy too much 36
The vegetables become rotten 27
I cook too much 11
52 38
7 1
Does not waste any vegetables
Wastes less than 10%
Wastes around 10%
Wastes around 20%
Figure 11 Average weekly wastage (%) Table 9 Reason for vegetable wastage (%)

3.7 Quality
Table 10 Considerations when purchasing vegetables (%)6
OVERALL Chilli Tomato Onion Cabbage Cauliflower Kangkong Eggplant Carrots Cucumber Okra Pumpkin Garlic Beans
Does not have bruises / signs of damage
61
63
61
62
66
68
59
66
63
60
61
60
54
55
It is clean
51
51
50
44
53
51
59
47
52
50
54
52
47
57
There is no damage from worms / pests
51
42
43
31
51
64
48
78
49
49
53
48
41
61
Is not wilted
39
43
30
27
38
40
70
35
36
38
41
29
31
44 Is naturally/organically grown
35
36
32
32
35
33
41
36
35
36
38
38
30
38
Is grown without using pesticides
31
28
29
26
35
33
36
29
30
32
36
33
24
33
Is a regular shape
31
31
33
47
28
27
13
31
32
38
33
29
37
16
Is firm enough
27
24
24
39
48
40
7
19
25
30
16
24
26
27
Is grown locally
19
17
14
22
18
17
19
17
19
18
19
23
21
24
Is a bright colour
14
16
19
13
9
9
18
10
22
12
12
23
8
15
Not too big
12
18
9
19
13
10
4
9
13
17
13
10
21
4
Not too small
12
13
10
21
10
10
4
10
13
11
9
7
27
5
There are no brown spots
12
11
8
7
15
20
20
12
9
8
11
8
9
12
Not too soft/over-ripe
10
9
57
7
3
3
3
7
3
12
7
17
3
6
Is an even colour
7
6
8
6
5
6
7
10
8
7
6
9
5
13
It smells good
7
10
5
11
6
6
5
4
5
4
4
5
18
10
Not too hard
2
2
4
0
1
1
1
3
3
1
8
2
1
3
6 Source: Q33 household survey. The numbers on this chart should be read horizontally e.g. cell in row 1, column 2 tells us that 63% say that it’s important that chilies do not have signs of damage. Green numbers show results that are high for this attribute compared to other vegetables, yellow numbers are average and red numbers are low.

39
Vegetable Consumption, preferences and supply chain – final report © TNS July 2015
During the supplier interviews the discussion on quality was introduced early in conversations so the
person’s parameters and language for quality could be established, and then used, throughout the
discussion to examine in detail how the respondents’ evaluated quality of vegetables and how it impacted on
their purchase decisions and behaviours. The starting point in these conversations was: “we’re going to talk
about the quality of vegetables – what makes a particular vegetable “good” or “bad” in terms of its quality”.
Their initial reactions to “quality” were discussed before they moved into discussing specific vegetables and
how to assess their quality.
Most players in the supply chain (traders, wholesalers, retailers) are looking for vegetables that will
transport well and sell quickly at a good price. This means they are looking for vegetables that are “looking
fresh” (indicated by green leaves, firm texture, shininess depending on the vegetable – these parameters of
quality and fresh are discussed in detail below) and are undamaged (no bruises or insect damage). These
buyers and sellers of vegetables are thinking of how quickly they can sell what they are buying and the best
price they can sell for. They are considering what their customers are looking for and are aware that their
customers, whether they be retailers or household consumers, will have choice between vendors and will
also be looking to buy the freshest produce – assessed mostly by visual appearance (described in detail
below). Overall, almost all participants in the qualitative research who were buyers and sellers of vegetables
when speaking initially about quality spoke about it in reference to “freshness”, which relates directly to
shelf-life – “how long will this vegetable still look good if I do not sell it today”. Traders and wholesalers
tend not to hold produce for long, as they are selling it on quickly, usually within the day. But their retailer
customers (wet markets, street stall markets and supermarkets) are more exposed to having to store
vegetables over time and keep it looking appealing to customers. For wet market and street stall vendors
produce that does not sell on the first day has to be stored (usually without refrigeration, but possibly in cool
spaces under soaked damp cloth) and then re-displayed as “fresh” the next day at as high a price as
possible. If the vegetable cannot be displayed as “fresh” and compete with the other produce being sold in
the market that day it needs to be trimmed or chopped and mixed and sold at a lower price, or discarded.
For household consumers, it is very important that vegetables are clean if they are to buy. So, for these on-
sellers of vegetables an important consideration when choosing the “good quality” vegetables to buy is “how
long will this vegetable last before it starts to lose its fresh visual look and I can’t sell it for a good profit
anymore”. Behind this evaluation is an idea that fresh means a short time since harvest and transport.
There is no evidence that traders, wholesalers or retailers know with any accuracy, or discuss, when the
actual harvesting was done or how long vegetables have spent in storage or transport. But it is clear from
the language people use to describe their views on quality that fresh means “recently from the ground”,
which results in “time for me to on-sell it without the food losing it’s visual cues of freshness” (these cues
are described in detail below).
Household consumers also indicated a need for vegetables to last for up to 2-3 days after purchase and this
is in their minds when selecting vegetables. Although most of these consumers do visit the wet market
everyday for vegetables, they do not necessarily eat all they buy on the same day. For them, the most
important factor for assessing quality is signs of damage including bruises / soft spots. This aligns to what
the suppliers and retailers talked about in relation to the challenges that they face with maintaining quality
during transportation of vegetables. In addition, for household consumers, cleanliness is an important

40
Vegetable Consumption, preferences and supply chain – final report © TNS July 2015
purchase consideration. Indeed wet market sellers take great care in presenting their vegetables and talked
about washing and laying out the vegetables, and even spraying them with water to make them look
appealing
Very few of these supply chain respondents or household consumers mentioned other factors like taste or
smell as being important considerations when evaluating vegetable quality. When supply chain actors were
prompted later in the interviews about their knowledge of, and attitudes towards chemicals, many said they
were concerned about the possible health risks arising from excessive chemical use in farming. However,
this concern did not come up once in the initial discussion on assessing vegetable quality. Household
consumers were asked their views on chemicals and were prompted with a showcard. Household consumers
indicated that chemicals on vegetables was a concern for the majority and influenced purchase decisions
more than shape and texture of the produce.
Lower-end restaurants are more willing than any of the other vegetable consumers to look for and purchase
vegetables that are “less fresh” ie: “some bruises, spots I can trim away” because they are looking to
purchase their restaurant inputs as cheaply as possible so they can maximise their profit on low-margin
meals. Their customers are less likely to see the vegetable in their raw state because they will be prepared
into dishes so visual cues of damage or deterioration can be disguised to the end consumer. The exceptions
are fresh salad and vegetables like carrots that are carved for ornamental purposes. Wet market and street
stall retailers confirm that these lower-end restaurant purchasers are regular customers for the produce that
the retailers have had to trim of bad spots, yellowing leaves and are selling at a lower price.
Higher-end restaurants and hotels are more selective of produce. When chefs are involved in vegetable
selection a more complex group of parameters are used to evaluate quality - taste, size, smell and signs of
correct growing. Purchasing officers interviewed say they attempt to understand and follow chefs’
requirements as they do not want conflict with the chefs or the wastage if the chef rejects the produce
purchased. However, the purchasing officers also say that chefs’ quality demands or demands for particular
vegetables cannot always be satisfied because of price or availability.
For leafy and brassica vegetables, colour and the strength of leaves and stems were the top priorities.
Leaves should be light green. Yellow indicates that they were old, while too dark a green indicates they were
likely to go soft and rot. Households primarily specified that such vegetables should not be wilted and also
raised issues about colour and brown spots more in relation to leafy vegetables compared to others.
Cauliflower was a vegetable that household consumers all seemed
to take particular care of evaluating before buying,, as they are seen
to be particularly susceptible to pests and rot (indicated by black
spots or “wet” patches on top). Brown spots and damage from pests
was also highlighted by household consumers as a more important
consideration when buying cauliflower. The Burmese word - “pwa” –
was often used to describe signs of poor quality in a vegetable. “Pwa”
can be translated as bloated/expanded/empty/limp/splayed/loose. A
leafy vegetable becomes “pwa” when it has been left in the ground
too long, according to respondents.

41
Vegetable Consumption, preferences and supply chain – final report © TNS July 2015
When selecting “soft skin” vegetables, like tomato, eggplant, chilli and capsicum consumers are
assessing size, firmness and “shininess.” Many also noted that the skin should have a certain resistance and
bounciness – they should be soft enough to depress a little when poked, but firm enough to tighten back
into shape. Household consumer interviews confirmed this and they said they considered firmness and size
when evaluating chillies, while for eggplant they were more likely to look for signs of pests.
The state of the stalk was also an important indicator for many respondents when assessing a vegetable’s
time since harvest.
“If the stalk is dry, the body will be rotten tomorrow.” : Broker – Aung Ban.
For tomatoes, consumers use fruits of different levels of ripeness for different purposes. Softer tomatoes
are used in cooking curries and
sauces, and firmer, green tomatoes
are used in salads. Taste was not a
criterion for assessing the quality of
the tomato. Assessments are made
based on “how rotten already” or
“how soft already” and from there
consumers assess whether it is
appropriate for what they want to
prepare and then negotiate a lower
price if the tomato is “soft” and only
good for curry.
The straight, bright carrots imported from China are much preferred for their size, colour and shape than
the smaller, odd-shaped and often “woody” local varieties. Only two consumers mentioned taste when
assessing carrots, aligning with the fact that carrots tend to be used more for decorative purposes. For this
reason, the bigger and more beautiful imports are more suitable, in terms of both how they look and the fact
that one carrot goes further.
The firmness of the stem was once more a common quality indicator for “Beans and legumes”, as was
colour – beans should be bright, solid green, and will yellow when they age. “Pwa” came up once again in
reference to beans – here meaning if a bean was swollen, hollow and empty, that it was no good and that it
had been left in the ground for too long. The skin of the beans should be tight and thick, and the peas inside
should not be too big, as this indicates age, according to consumers.
Consumers had the least to say about gourds and pumpkins. Gourds shouldn’t have scars on the skin, and
should sound hollow when knocked. The insides, particularly for pumpkins, should leave a sticky residue on
the fingers. Household consumers were more likely to mention that pumpkins should be a bright colour.
3.8 Willingness to pay more for higher quality
We saw in Figure 7 above, the majority of household consumers do claim that there is room to move in their
weekly vegetable budget and actually up to 25% of household consumers did demonstrate a willingness to
pay higher than regular prices for higher quality vegetable produce. Interestingly the budget variation

42
Vegetable Consumption, preferences and supply chain – final report © TNS July 2015
15
16
9
5
56
Very interested
Somewhat interested
Neutral
Not very interested
Not at all interested
threshold was not higher among the more wealthy households. However there was a clear limit of how much
consumers were willing to pay. The fact that consumers overwhelmingly are not interested in accepting
lower quality produce for a discounted price, no matter how great the discount, indicates that there is a
sensitivity to the low quality of produce available and a very strong idea of a benchmark price and a
benchmark standard of acceptable quality. Encouragingly, these results imply a readiness to evolve the
vegetable market and a certain willingness to pay a price premium for that.
Figure 12 Willingness to trade off quality and price (%)
3.9 Willingness to try new vegetables
Household consumers did not show particularly high levels of interest in trying new varieties of vegetables.
In fact, only half of the household consumers actually reported ever seeing new vegetables in the outlets
they frequented. Of those, only around a third registered interest in wanting to try new vegetables when
they came across them, while a much larger portion said they had no interest at all.
This aligns with the fact that consumers also overwhelmingly answered that their prime reason for
purchasing the vegetables that what they most frequently buy is for specific recipes (refer to Table 8),
indicating that when it comes to vegetable consumption, Myanmar consumers are largely creatures of habit.
While nearly 25% of the household consumers indicating an openness to trying new vegetables appears
promising, this figure is small when compared to market research figures for willingness to try new varieties
of other consumer goods in the Fast Moving Consumer Goods (FMCG) sector and indicates that while
2
1
2
2
2
1
69
76
87
16
14
9
12
1
+/- 10%
+/-25%
double / half
Lowest quality at highly discounted price Lower quality at discounted price
Regular price for the regular quality Higher quality at a somewhat premium price
-10% -5% +5% +10%
-25% -10% +10% +25%
half -25% +25% double
Figure 13 Interest in trying new vegetables (%)

43
Vegetable Consumption, preferences and supply chain – final report © TNS July 2015
16
21
18
12
11
10
21
18
14
18
4
26
21
15
7
7
8
6
8
4
5
2
3
42
38
56
58
75
55
A
B
C
D
E
F
Very Interested Somewhat interested Neutral
Not very interested Not at all interested
consumers may be more open to trying variations on existing vegetables, they will likely be less open to
trying brand new, unfamiliar vegetable types.
Retailers, wholesalers and brokers were also asked about their willingness to try new vegetables. The
concept of “new vegetables” was best understood at the Broker Sales Centre where traders are close to
farmers and try to provide different seed inputs to farms to help them grow better produce. However, in the
wholesale and retail markets respondents struggled to think of a “new” vegetable they had come across
indicating that consumers and vendors have not had much experience with new varietals or new vegetable
types entering the market.
Furthermore, it is clear that an unwillingness to purchase new vegetables isn’t just an attitude concentrated
to the lower SEC levels. While higher SEC levels do show a higher tendency to be open to purchasing new
vegetables, nearly 50% of the top two SEC levels still register little to no interest in purchasing new
vegetables.
The unwillingness at the consumer level was echoed in several discussions with suppliers.
“I don’t want to sell something I have never sold before because I won’t know
how to sell it.” : Wet market vendor – Taunggyi.
“If the new vegetable is pretty, some people might buy, but some people
won’t dare to buy something they don’t know.” : Wet market vendor –
Yangon
A restaurant owner in Taunggyi said she had never even seen new vegetables in the market, and this was
supported by a wet market owner in Taunggyi, who said that even if there were new vegetables, she wasn’t
interested in buying them as her customers would not be interested in them. A Yangon restaurant owner
also said he wasn’t interested in new vegetables, as he didn’t have the time or interest to figure out new
menu items and portioning systems. Suppliers’ rejection of new vegetables was thus largely based on their
understanding of the consumer, as well as a desire to stick with what they knew.
Figure 24. Willingness to try new vegetables VS SEC (%)

44
Vegetable Consumption, preferences and supply chain – final report © TNS July 2015
2
13
19
22
34
46
58
I worry about the country of origin
Lack of variation in available vegetables
I can t find the vegetables I need
I worry about the use of pesticides /chemicals
The quality is low
The price is high
The price is unstable
One wet market retailer said she was interested in trying new vegetables. She was one of the few retailers
who described having regular conversations with her customers. She said she would try something new,
encourage people to try and then seek their feedback.
“People these days are interested in new things. I sell a type of mustard leaf that is new – it
came from China. People like it.” : Wet market owner – Taunggyi.
Some actors higher in the supply chain, and thus closer to the input and growing level, are able to introduce
new produce to the market, such as the BSC Trader from Aung Ban who regularly provides his counterpart
farmers with new tomato seeds from Thailand, and gives sample products out to gauge interest in the
Yangon retail market. Aside from sending samples, the increase in mobile technology means that traders
and brokers can send photographs of new kinds of produce to the wholesalers and retailers to see whether
or not they are interested, as was the case of the broker in Aung Ban who told us how he sends pictures of
new pumpkins to his wholesalers, who have readily accepted the new produce.
Therefore, while interest in selling new produce does seem low, and the drivers for purchasing on the
consumer side are largely habit, suppliers do show a willingness to take a risk on a new vegetable, and there
seems to be an element within the consumer segment who are willing to try new kinds of produce.
3.10 Concerns
Unprompted questioning revealed that household consumers’ primary concerns about quality were price-
related. Unstable price is more of an issue than high price.
When traders, brokers and wholesalers talk about price it is clear that the price of vegetables changes
throughout the day depending on demand coming from wholesalers and the supply coming from famers at
the Broker Sales Centre and at wholesale markets.
“If we have floods like we did this year then there is less supply and the price
goes up because the people in Yangon still want to have their regular
vegetables. The price goes down when all the farmers turn up with cabbages all
Figure 14 Main concerns when buying vegetables (%)

45
Vegetable Consumption, preferences and supply chain – final report © TNS July 2015
59
22
44
34
66
51
46
42
36
40
21
39
18
46
30
25
30
29
29
28
8
23
20
8
11
14
15
13
13
4
4
1
7
2
4
5
3
7
2
9
7
18
5
2
9
6
12
15
17
Yangon
Mandalay
Taunggyi
Pathein
.
A
B
C
D
E
F
Highly concerned Somewhat concerned Neutral Not very concerned Not at all concerned
Socio
-econ
om
ic
sta
tus %
44
29
13
4
10 Highly concerned
Somewhatconcerned
Neutral
Not very concerned
Not at allconcerned
at once or the opposite happens and a pest or disease affects the crops and no
one has cabbages – then the price goes up again for cabbages. It’s the way it
works.” : Trader – Aung Ban
There seems to be more tolerance of price fluctuation at this end of the supply chain where the price is
being set and the conditions of supply are well understood. Where price fluctuations are less tolerated is in
the urban markets where consumers are sensitive to increasing prices – 58% of household consumers said
fluctuating prices were their main concern when purchasing vegetables.
3.11 Chemicals
The pervasive use of chemicals in agricultural production is known to be a relatively new phenomenon, with
one broker commenting: “Our elders say that in their time they could eat tomatoes as they like, maybe raw
or without washing it. But nowadays we can’t because of insecticides. It’s dangerous.”
As indicated by the charts below, a significant proportion of consumers are concerned by the use of
chemicals. This concern is more widespread in Yangon and amongst household consumers from higher SEC,
who have achieved higher education levels. Concern about chemical residues on vegetables is also higher in
Taunggyi, where people are closer to the farms and have more knowledge about agricultural processes.
Figure 15 Concerns about chemicals used in vegetable harvest (%)
Figure 16 Concern by locations and SEC (%)

46
Vegetable Consumption, preferences and supply chain – final report © TNS July 2015
The widespread concerns regarding chemical usage in vegetable
production were reflected in the conversations had with suppliers.
However, the overwhelming sentiment underpinning these anxieties
was that buying chemical-free produce was practically unavoidable
in the current market, and that the use of chemicals was a
necessary and desirable factor for driving profit and sales.
Supply chain actors who operate more directly with the farmers, like
the Aung Ban brokers and traders, talked about the necessity of
chemical fertilizers and pesticides in achieving crop yields. For
example, when explaining his input relationship with the farmer
from whom he buys, one broker in Taunggyi explained that when
purchasing seeds from input suppliers, the package includes
supplies of the recommended chemical fertilizers and pesticides.
When asked what would happen if they didn’t use it, he answered:
“We can’t do that (farm without chemical fertilisers and pesticides). If we do that
we won’t make a profit. We never stop using the chemicals provided, because
stopping might affect the crop. We are scared that the growth process will fail ... so
everybody uses chemicals.” : Broker – Taunggyi
Similarly, a broker from the BSC in Aung Ban explained how there were fewer birds to eat the insects,
meaning pesticides had become essential to control insect damage – and that in turn, the presence of
pesticides poisoned the soil, necessitating the use of chemical fertilizers. Shifting the focus from production
to sales, another broker-trader in Aung Ban stated that crops do not grow fast enough without chemical
fertilizers, meaning farmers would be unable to meet the market demand for quantity, and that chemical-
free vegetables would not grow big enough or be beautiful enough to be accepted by consumers.
“Organic means fruits grown naturally. We can’t plant that kind of species here. We
need more knowledge about plantations and farming. Nowadays there aren’t many
birds that eat insects from the plants because of humans or the weather. So, we
need insecticide. It’s it impossible to grow organic fruits.”: Trader-Aung Ban
“Vitamin sprays make vegetables bigger but if over use then it can become toxic for
the customers. So farmers have to spray. Without spray the vegetables are not
growing fast.”: Broker-Aung Ban
These concerns about vegetable size and appearance were echoed further down the chain, where many
wholesalers and retailers noted that chemically-grown vegetables sold better because they were larger in
size, grew faster and were more beautiful. For example, both wet market owners and street stall owners in
Taunggyi believed it would be impossible to grow and sell vegetables without chemicals, and that such
produce would never make it to the market because people don’t demand it.

47
Vegetable Consumption, preferences and supply chain – final report © TNS July 2015
3
8
10
11
12
21
29
33
40
78
The vegetables last longer
The vegetables look nicer / more perfect
Causes an unpleasant taste
Causes an unpleasant smell
Causes the vegetables to deteriorate
The vegetables grow bigger
Can cause vomiting
Can cause illness
Can cause diarrhea
Bad for health
“They’re not as beautiful. So customers won’t like them or buy them.”: Wet Market
Owner
“The customers don’t like this kind – with small holes - because they don’t know
about using pesticides and they just want vegetables without any holes.”: Street
Stall Owner-Taunggyi
This opinion was shared by many in Yangon, like the street stall owner who suggested that it was
“impossible for chemical free produce to exist” – and that regardless, organic produce would be “shrivelled”
whereas customers demand “big and shiny vegetables”. Further supporting this attitude, when asked to
comment on organically-produced vegetables, a wet market owner in Taunggyi stated: “They’re not as
beautiful. So customers won’t like them or buy them.”
Household consumers find the idea of organic vegetables very appealing however it is not clear exactly what
they understand from this or whether they appreciate the trade-offs that may be necessary in terms of
appearance and price. When asked to identify what impact chemicals have on vegetables, they were much
more likely to highlight negatives than positives, compared to those further up the supply chain.
So while eating organically-grown vegetables holds strong appeal for consumers there is doubt among
producers and traders that consumers would accept the look and shape of organically-grown vegetables.
There is also doubt that farmers could produce adequate yields growing produce organically. There is also no
evidence that consumers or traders along the supply chain would be prepared to pay more for organic
produce. In fact, some retailers, consumers and supply chain actors indicate they would expect to pay less
because the vegetables would not look as good as those grown with fertilizers and pesticides.
Figure 17 Appeal of chemical-free vegetables (%)
Figure 18 Perceived impact of chemicals (%)
82
14
3 1
Highly appealing
Somewhat appealing
Neutral
Not very appealing
Not at all appealing

48
Vegetable Consumption, preferences and supply chain – final report © TNS July 2015
9
10
13
15
18
23
32
90
avoid buying vegetables which have anunusual colour
avoid buying vegetables with a chemicalsmell
avoid vegetables which have perfect skin
Others
avoid buying vegetables which lookunusually big
remove the skin
cook the vegetables
clean the vegetables
Across the consumer and supplier levels, many respondents reported undertaking specific measures to
purchase or prepare vegetables so they are “safe” for consumption. However in most circumstances these
strategies reveal a flawed understanding of the nature of chemical uptake by the produce they are
consuming. Most people are of the assumption that simply washing vegetables will render their purchases
safe for consumption – the general attitude being summed up by the Aung Ban based trader who suggested:
“if they wash thoroughly, nothing will happen.” Most use plain water (warm and cold), and some suggest
using salt. One Yangon-based restaurant owner insists on purchasing directly from a farmer who does not
spray pesticides or fertilizers, and only uses chemicals in the soil, as he believes it to be safer. The same
respondent also suggested that because he purchases from far away, the chemicals will “wear off” on the
journey down to Yangon.
3.11.1. Selling organic produce
The concerns of the consumer about chemicals are taken into account by a select few wholesalers and
retailers who have tried to trade in chemical-free vegetables.
One Taunggyi restaurant owner said he was prepared to pay more for organic produce and had a supplier of
chemical-free tomatoes.
“They (the tomatoes) tend to smell bad after awhile and become coarse and
sticky. Buy one with chemicals and another without, leave them overnight
together, the next day you’ll see which one becomes bad fast and smell bad
fast. Those are the ones with chemicals.” : Taunggyi restaurant owner.
A street stall seller in Taunggyi reported that some customers deliberately bought spinach and mustard
leaves with holes in it, as the presence of insect damage was thought to indicate the absence of pesticides.
However, she said that the number of people who wanted flawless produce was much higher than those who
would accept organic produce. She also voiced her interest in increased availability of organic produce, after
recounting how quickly her she sold 20 bundles of organic Napa cabbages that she purchased on a whim.
Figure 19 Measures to avoid/remove chemicals among household consumers (%)

49
Vegetable Consumption, preferences and supply chain – final report © TNS July 2015
A hotel owner in Yangon also noted how her restaurant used to purchase vegetables from a nearby organic
market, and while she thought the vegetables were of much higher quality, she stopped purchasing there
because it was too expensive.
3.11.2. Certifying health and safety standards in the vegetable sector
Suppliers were also asked their opinions on the formation of a body to certify quality and ensure health
standards were upheld in the agricultural industry. For many, the question was met with confusion. While
most believed it was a good idea, it was frequently dismissed as being unfeasible in Myanmar for two key
reasons:
habits were too hard to change
the country lacked an educated and trustworthy taskforce
One wholesaler in Yangon explained that people were only interested in making a profit, and that they would
not be willing or interested to take the time to change their habits. Echoing the sentiment that time was a
barrier to ensuring higher quality standards, one wet market owner stated:
“I’m running two shops, I don’t have time to ask about the health and safety
of the vegetables and very few customers demand it anyway”.
Regarding whose responsibility such a task should be, one restaurant owner in Taunggyi suggested that:
“The government should do this service rather than another organization…the
government should lead this matter.”
However, an expectation of responsibility does not always align with trust.
“In our country many people don’t believe in the government. They’d need to
double check tests with an NGO,” one Broker said, adding, “Giving advice or
training is much better than checking up on goods.”
Those who were more receptive to the idea, largely distrusted the government’s capacity to single-handedly
undertake the task of certifying health and safety standards, but it was generally recognized that the
government would be necessary for proper regulations and law to be imposed. The best solution seemed to
be to respondents to appoint an NGO to which the government gave support and aid.
One broker emphasized that blame for chemical use should lie with the farmers and that other members in
the supply chain shouldn’t face recourse:
“Let’s say I bought some vegetables because I think it looks nice. And people can complain over my
choice. If government comes in and checks properly and they think the vegetables I bought are not
healthy…the dealers should not pay. Only farmers use chemicals. Because for us dealers, we don't
have time to think about adding chemicals as we have to make sure that all the orders are filled.” :
Broker - Aung Ban
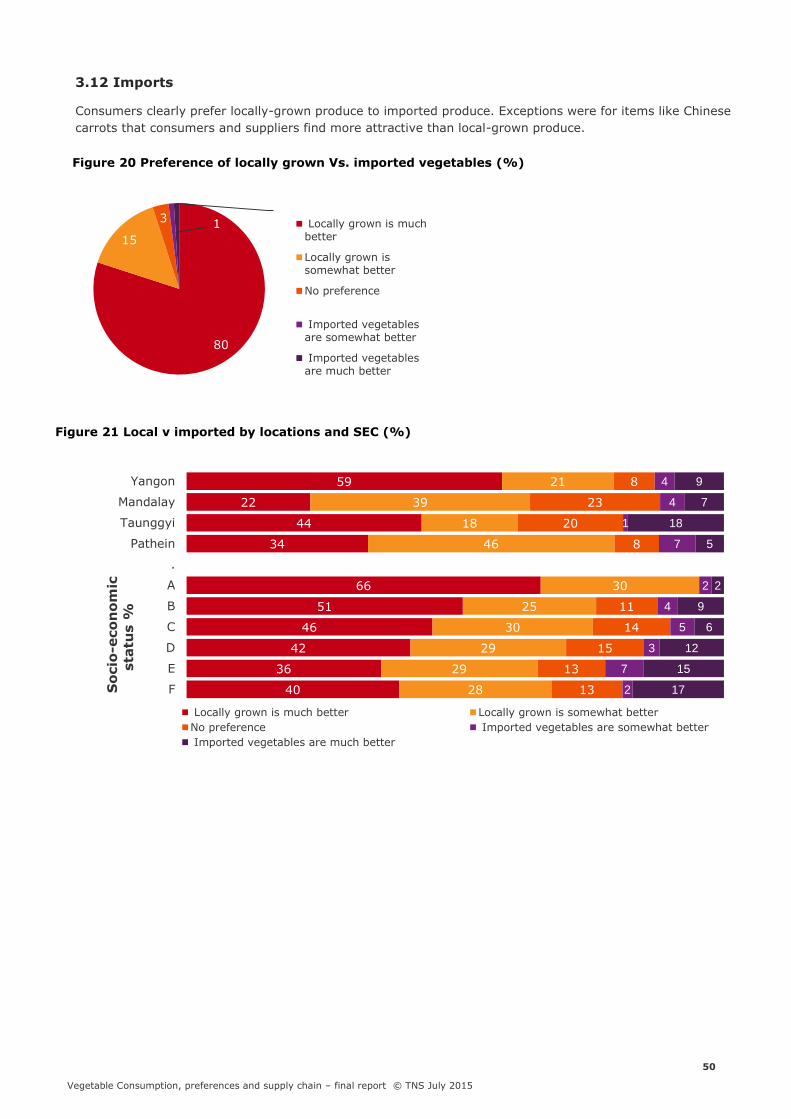
50
Vegetable Consumption, preferences and supply chain – final report © TNS July 2015
59
22
44
34
66
51
46
42
36
40
21
39
18
46
30
25
30
29
29
28
8
23
20
8
11
14
15
13
13
4
4
1
7
2
4
5
3
7
2
9
7
18
5
2
9
6
12
15
17
Yangon
Mandalay
Taunggyi
Pathein
.
A
B
C
D
E
F
Locally grown is much better Locally grown is somewhat better
No preference Imported vegetables are somewhat better
Imported vegetables are much better
So
cio
-eco
no
mic
sta
tus %
80
15
3 1
1
Locally grown is muchbetter
Locally grown issomewhat better
No preference
Imported vegetablesare somewhat better
Imported vegetablesare much better
3.12 Imports
Consumers clearly prefer locally-grown produce to imported produce. Exceptions were for items like Chinese
carrots that consumers and suppliers find more attractive than local-grown produce.
Figure 20 Preference of locally grown Vs. imported vegetables (%)
Figure 21 Local v imported by locations and SEC (%)

51
Vegetable Consumption, preferences and supply chain – final report © TNS July 2015
Appendices
3.13 Appendix 1: Sampling Methodology
Townships will be purposively selected in Yangon and Mandalay to give good geographic spread across the
city. At least 6 townships will be selected in Yangon and 4 in Mandalay. In Taunggyi, there is only one main
township where the urban wards are located.
A random probability proportionate to size (PPS) approach is suggested for selecting the wards within each
township. PPS means that the larger wards are proportionately more likely to be selected for interview. In
order to offset the bias that is created by the higher likelihood for larger wards being sampled, exactly the
same number of individuals will be selected per ward. In this way, individuals in large wards have smaller
probability of being sampled than individuals in the smaller wards. A target of maximum 20 respondents per
ward will be interviewed.
In each randomly selected ward a maximum of four start points will be selected and a maximum of five
respondents will interviewed per start point. We suggest that the start points should be purposively selected
by the team on the ground to ensure that there is good coverage across the ward. From the start point,
households will be contacted based on a predetermined interval. The interval will depend on the density of
the area and is usually 5 in urban areas. The interviewers will move from the starting point in a random
walk based on the right hand rule (RHR).
RHR: Once the starting point is determined, the interviewer will have to place his or her back to the (main)
entrance of the HH structure and move to the right (rule: always go to the right). Only those houses on the
right side of the street are counted. When the interviewer comes to the end of the village or outer ring,
he/she turns around and counts the houses on the right side which were on his/her left previously.
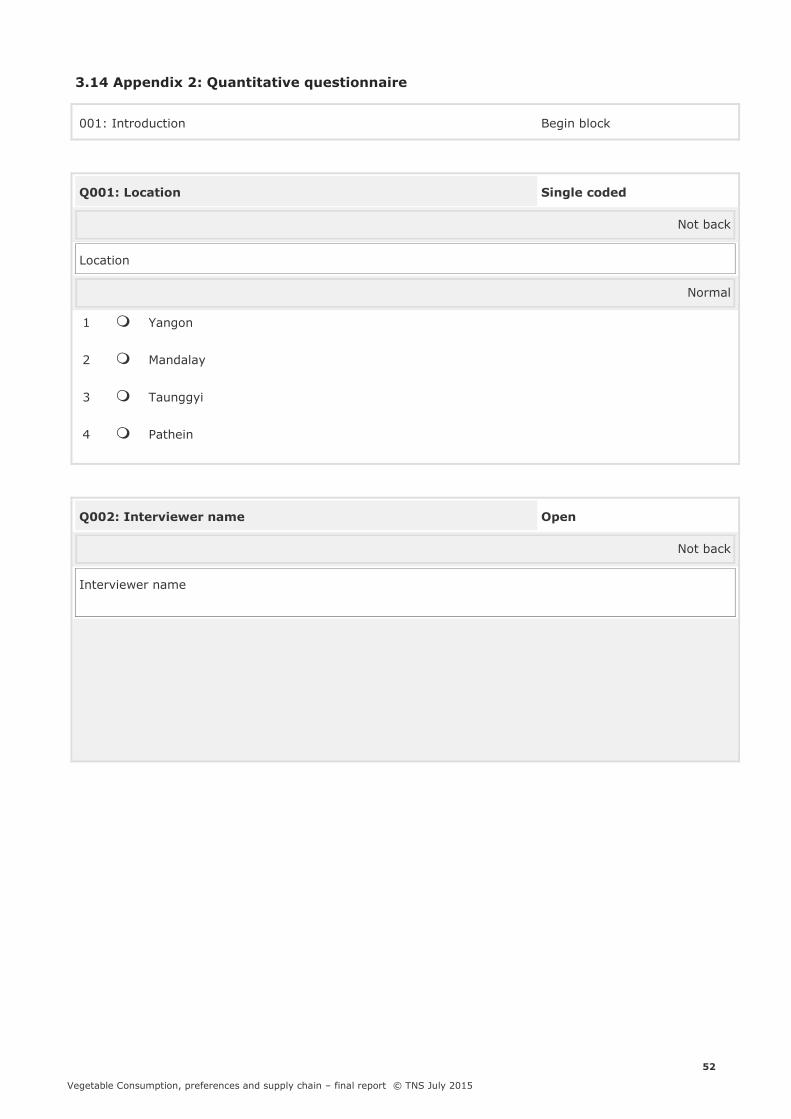
52
Vegetable Consumption, preferences and supply chain – final report © TNS July 2015
3.14 Appendix 2: Quantitative questionnaire
001: Introduction Begin block
Q001: Location Single coded
Not back
Location
Normal
1 Yangon
2 Mandalay
3 Taunggyi
4 Pathein
Q002: Interviewer name Open
Not back
Interviewer name
53
Vegetable Consumption, preferences and supply chain – final report © TNS July 2015
Q005: Introduction Text
Not back
Hello, I am …….[insert interviewer name], an interviewer of TNS, an independent market research
company in Myanmar. We are carrying out a study to find out about consumer attitude and behavior on
vegetables. We would be grateful if you could spare about 45 minutes of your time to assist us in our
research. Your personal information will not be provided to any third party and will be used for research
purposes only.
B001: Introduction End block

54
Vegetable Consumption, preferences and supply chain – final report © TNS July 2015
B002: Screener Begin block
Q006: Industry of employment Multi coded
Not back
Please indicate if you, or any member of your household, are employed by ANY of the following industries.
SHOWCARD
Random
1 Grower of vegetable
GO TO SCREEN OUT
2 Wholesaler / distributor of vegetable
GO TO SCREEN OUT
3 Retailer selling vegetable
GO TO SCREEN OUT
4 Hotel / restaurant
GO TO SCREEN OUT
5 Market research company
GO TO SCREEN OUT
6 Newspaper / TV company
GO TO SCREEN OUT
7 Advertising agency
GO TO SCREEN OUT
8 Mass Media ( TV/ Radio/ Newspaper/ Magazine)
GO TO SCREEN OUT
98 None of the above *Position fixed *Exclusive
55
Vegetable Consumption, preferences and supply chain – final report © TNS July 2015
Q007: Participation in MR Single coded
Not back
Have you participated in a market research study in the past 6 months, by this I mean have you
participated in any type of
discussion or interview regarding products, brands or attitudes? This could include face to face interview,
telephone survey, group discussion and any other kind of research?
Normal
1 Yes
GO TO SCREEN OUT
2 No
Q008: Gender Single coded
Not back
Record gender
Normal
1 Male
2 Female
Q009: Actual age Numeric
Not back | Min = 1 | Max = 99
May I know your age at your last birthday?

56
Vegetable Consumption, preferences and supply chain – final report © TNS July 2015
Q010: AGE RANGE Single coded
Not back
AUTO CODE INTO AGE RANGE
Normal
2 18 – 25 years old
3 26 – 30 years old
4 31 – 35 years old
5 36 – 40 years old
6 41 – 45 years old
7 46 – 50 years old
8 51 – 55 years old
9 56 - 60 years old
10 61 – 65 years old

57
Vegetable Consumption, preferences and supply chain – final report © TNS July 2015
Q011: Position in household Single coded
Not back
What is your position in this household?
SHOWCARD
Normal
1 Head of household / main income earner
2 Spouse of head of household
3 Daughter of head of household
4 Son of head of household
5 Mother of head of household
6 Father of head of household
7 Housekeeper / domestic staff
96 Other (specify): *Open *Position fixed

58
Vegetable Consumption, preferences and supply chain – final report © TNS July 2015
Q012: Household Income Single coded
Not back
What is the average monthly income of your household from all sources including social benefits and / or
remittances /gifts?
SHOWCARD
Normal
1 Less than 125,000
2 125,001 – 250,000
3 250,001 – 375,000
4 375,001 – 625,000
5 625,001- 999,000
6 Above 1,000,000
97 No answer *Position fixed *Exclusive
99 Don't know *Position fixed *Exclusive

59
Vegetable Consumption, preferences and supply chain – final report © TNS July 2015
Q013: Education Single coded
Not back
What is the highest level of education you have completed?
SHOWCARD
Normal
1 Illiterate (NOT ON SHOWCARD)
2 Literate but no formal / school education
3 Primary incomplete
4 Primary complete
5 Junior / middle school incomplete
6 Junior / middle school complete
7 Secondary / senior / high school incomplete
8 Secondary / senior / high school complete
9 College / university incomplete
10 College / university complete (graduate)
11 Post graduate studies incomplete (no post graduate
degree)
12 Post graduate studies complete (post graduate degree)
97 No answer *Position fixed *Exclusive

60
Vegetable Consumption, preferences and supply chain – final report © TNS July 2015
Q014: Number of rooms Single coded
Not back
How many rooms do you have in your home? Please include bathrooms, toilets and kitchens in the count,
but exclude attics and basements, unless used for living accommodation?
Normal
1 1 room
2 2 rooms
3 3 rooms
4 4 rooms
5 5 rooms
6 6 rooms
7 7 rooms
8 8 rooms
9 9 rooms
10 10 rooms
11 11 rooms
12 12 or more rooms

61
Vegetable Consumption, preferences and supply chain – final report © TNS July 2015
Q015: Household durables Multi coded
Not back
Which of these items do you have in working order in your home?
SHOWCARD
Random
1 Kitchen sink
2 Dining table
3 Primus (paraffin stove) / cylinder based gas stove
4 Refrigerator (Stand alone - this may have ice box but
NOT separate freezer section with its own door)
5 Fridge freezer (i.e. the freezer section has its own door,
separate from the refrigerator door)
6 Separate deep freezer
7 Cooker (i.e. oven & hob appliance)
8 Vacuum cleaner
9 Electric kettle
10 Microwave oven
11 Washing machine
12 Tumble dryer
13 Dish washing machine
14 Electric deep flat fryer
15 Electric mixer
16 Electric iron
17 Water filtering device
18 Telephone (landline)

62
Vegetable Consumption, preferences and supply chain – final report © TNS July 2015
19 Fax machine
20 Hi-Fi / stereo system (cassette, CD or vinyl)
21 Video player/recorder (VCR)
22 DVD recorder (i.e. not just a DVD player)
23 Electronic car navigation system (‘Sat Nav’) / GPS
system
24 Docking station (for MP3 / iPod)
25 Home cinema/theatre / entertainment centre / HDD
multimedia player
98 None of the above *Position fixed *Exclusive
Q016: Ownership of personal phone / phablet Multi coded
Not back
Do you have a mobile phone / phablet?
SHOWCARD
Random
1 Yes, I have a smartphone
2 Yes I have a keypad phone
3 Yes I have a phablet
4 No I do not have one *Position fixed

63
Vegetable Consumption, preferences and supply chain – final report © TNS July 2015
Q017: Buying decision maker Single coded
Not back
Which of the following statements best describe your involvement when buying vegetables?
SHOWCARD
Normal
1 I am one of the main decision makers and one of the
main buyers of vegetables for the household
2 I am one of the main decision makers but I am not one
of the main buyers of vegetables for the household
GO TO SCREEN OUT
4 I am not one of the main decision maker but I am one of
the main buyers of vegetables for the household
3 I am not a main decision maker or buyer for vegetables
in the household
GO TO SCREEN OUT
Q018: Responsibility for cooking Single coded
Not back
What is your responsibility for cooking in the household?
SHOWCARD
Normal
1 I am the main person responsible for cooking for the
household
2 I share the responsibility for cooking equally with
another/other member(s) of the household
3 I am not one of the main cooks for the household
GO TO SCREEN OUT

64
Vegetable Consumption, preferences and supply chain – final report © TNS July 2015
B002: Screener End block
B003: Purchase channels Begin block
Q019: Purchase frequency Single coded
Not back
How frequently do you buy vegetables?
SHOWCARD
Normal
1 Every day or almost everyday
2 4-5 times/ week
3 Three times a week
4 Twice a week
5 Once a week
6 Less often than once a week

65
Vegetable Consumption, preferences and supply chain – final report © TNS July 2015
Q020: Purchase channels Matrix
Not back
From which channels do you purchase vegetables?
a. Most often
b. Regularly
c. Occasionally
d. Never
SHOWCARD. SINGLE RESPONSE PER ROW
Normal
Most often Regularly Occasionally Never
Wet market
Kiosk / hawker
Traditional store
Supermarket /
hypermarket
Other

66
Vegetable Consumption, preferences and supply chain – final report © TNS July 2015
Q021: Important attributes for purchase channels Multi coded
Not back
Which of the following do you consider important for an outlet that sells vegetables?
SHOWCARD
Random
1 Enjoyable shopping experience
2 Offers a good range of vegetables
3 Sells vegetables at a reasonable price
4 Close to home
5 Has vegetables available that I cannot buy anywhere else
6 Sellers are knowledgeable about vegetables
7 Provides good customer service
8 Is convenient to travel to and from
9 Is clean
10 Has convenient opening hours
98 None of the above *Position fixed *Exclusive
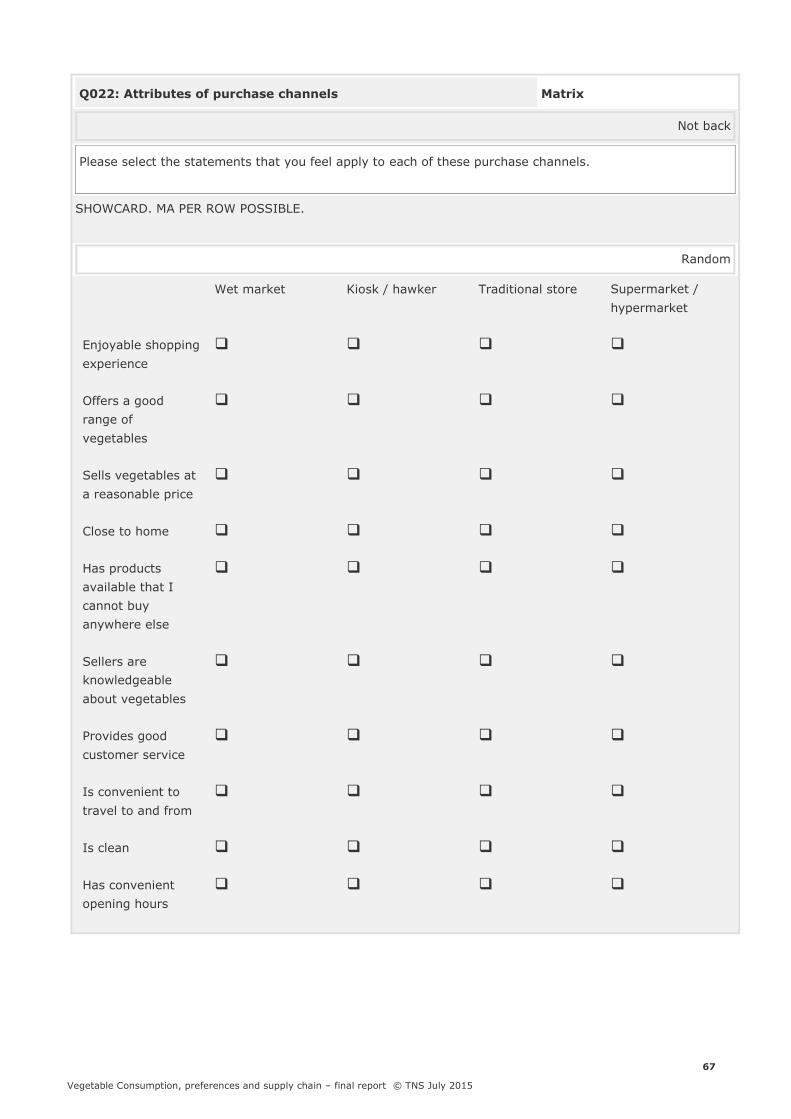
67
Vegetable Consumption, preferences and supply chain – final report © TNS July 2015
Q022: Attributes of purchase channels Matrix
Not back
Please select the statements that you feel apply to each of these purchase channels.
SHOWCARD. MA PER ROW POSSIBLE.
Random
Wet market Kiosk / hawker Traditional store Supermarket /
hypermarket
Enjoyable shopping
experience
Offers a good
range of
vegetables
Sells vegetables at
a reasonable price
Close to home
Has products
available that I
cannot buy
anywhere else
Sellers are
knowledgeable
about vegetables
Provides good
customer service
Is convenient to
travel to and from
Is clean
Has convenient
opening hours

68
Vegetable Consumption, preferences and supply chain – final report © TNS July 2015
Ask only if NOT Q020 ST=1 & SC=4
Q023: Regular seller Single coded
Not back
When shopping at the wet market, do you have use a regular seller or do you shop around?
Normal
1 I always buy from my regular seller(s)
2 I usually buy from my regular seller(s), and occasionally
shop around
3 I don't have a regular seller, I look around to find the
best option for my needs
Q024: Role of seller Single coded
Not back
When making a vegetable purchase at [MENTION MOST OFTEN VISITED CHANNEL AT VRSEL], do you ever
ask information / advice from the seller?
Normal
1 Yes, occasionally
2 Yes, regularly
3 No, never
GO TO B004

69
Vegetable Consumption, preferences and supply chain – final report © TNS July 2015
Q025: Advice sought from seller Multi coded
Not back
What type of advice / information do you seek?
UNPROMPTED / DO NOT SHOW SCREEN. PROBE: ANYTHING ELSE?
Random
1 Help in selecting best quality vegetables
2 Information on the origin of the vegetables
3 Information on which pesticides / chemicals have been
used
4 Advice on vegetable supply (e.g. when vegetables will
become available)
5 Information on where the vegetables have come from
6 Information on storing vegetables
7 Information on preparing / cooking vegetables
8 Information about new vegetables that they are selling
96 Other (specify): *Open *Position fixed
Q026: Trust on vegetable sellers Left-Right Matrix
Not back
Do you trust the information given by the seller?
Normal
Trust highly Distrust highly
B003: Purchase channels End block

70
Vegetable Consumption, preferences and supply chain – final report © TNS July 2015
B004: PURCHASING BEHAVIORS Begin block
Q027: Person responsible for setting budget Single coded
Not back
Who is the main person responsible for deciding the budget for household vegetables?
SHOWCARD
Normal
1 Head of household / main income earner
2 Spouse of head of household
3 Daughter of head of household
4 Son of head of household
5 Mother of head of household
6 Father of head of household
7 Housekeeper / domestic staff
96 Other (specify): *Open *Position fixed
Q028: Budget constraints Single coded
Not back
Do you have a fixed or flexible weekly budget for vegetables?
Normal
1 Fully fixed
2 Somewhat fixed
3 Somewhat flexible according to household needs
4 Fully flexible according to household needs

71
Vegetable Consumption, preferences and supply chain – final report © TNS July 2015
Q029: Weekly vegetable budget Single coded
Not back
What is your weekly budget for vegetables?
SHOWCARD
Normal
1 1,000 or less
2 1,001-2,500
3 2,501 - 5,000
4 5,001-7,500
5 7,501-10,000
6 10,001 - 15,000
7 15,001-20,000
8 20,001-30,000
9 30,001-40,000
10 40,001-50,000
11 More than 50,000
99 Don't remember *Position fixed *Exclusive

72
Vegetable Consumption, preferences and supply chain – final report © TNS July 2015
Q030: Vegetables purchased Matrix
Not back
Which of the following vegetables do you buy?
a. Regularly
b. Occasionally
c. never
SHOWCARD. SINGLE RESPONSE PER ROW.
Random
a. Regularly b. Occasionally c. Never
Chilli
Tomato
Onion
Cabbage
Kankong
Cauliflower
Eggplant
Okra
Cucumber
Garlic
Pumpkin
Carrot
Beans

73
Vegetable Consumption, preferences and supply chain – final report © TNS July 2015
Q031: Reason for purchasing those vegetables Matrix
Not back
Why do you purchase those vegetables in particular?
SHOWCARD. MULTI RESPONSE PER ROW POSSIBLE.
Random
Healthy /
nutritious
Family
favourites
Required for
the recipes I
cook
They are
readily
available at
my place of
purchase
They are
available at
a cheap
price
They are
easy to
prepare /
cook
Chilli
Tomato
Onion
Cabbage
Cauliflower
Kangkong
Eggplant
Carrots
Cucumber
Okra
Pumpkin
Garlic
Beans

74
Vegetable Consumption, preferences and supply chain – final report © TNS July 2015
Q032: Ranking of important vegetable buying considerations Matrix
Not back
For each vegetable, please rank the top-5 important factors you consider when assessing the quality of this
vegetables for purchase?
RANK IN ORDER OF IMPORTANCE 1 TO 5 FOR EACH TYPE OF VEGETABLE
Random
N
o
t
t
o
o
b
i
g
N
ot
to
o
s
m
all
N
ot
to
o
h
ar
d
Not
too
soft/
over
-ripe
Is
fir
m
en
ou
gh
Is
no
t
wil
te
d
Do
es
not
ha
ve
bru
ise
s
The
re
is
no
da
ma
ge
fro
m
wor
ms
/
pes
ts
Is
naturally/
organicall
y grown
Is
gro
wn
with
out
usin
g
pesti
cide
s
Is
gr
ow
n
loc
all
y
Is
a
reg
ula
r
sh
ap
e
Is
a
bri
gh
t
col
ou
r
Is
an
ev
en
col
ou
r
Th
er
e
ar
e
no
br
ow
n
sp
ots
It
is
cl
ea
n
It
sm
ell
s
go
od
Chilli
Tom
ato
Onio
n
Cabb
age
Cauli
flowe
r
Kang
kong
Eggp
lant

75
Vegetable Consumption, preferences and supply chain – final report © TNS July 2015
Carr
ots
Cucu
mber
Okra
Pum
pkin
Garli
c
Bean
s

76
Vegetable Consumption, preferences and supply chain – final report © TNS July 2015
Q033: Regularity of supply Matrix
Not back
Do you ever have difficulty buying the vegetables that you want?
SHOWCARD. SINGLE RESPONSE PER ROW.
Random
I can always find
this vegetable
I can usually find
this vegetable
This vegetable is
often not available,
according to
seasonality
This vegetable is
often not available,
I never know
whether I will find
it or not
Chilli
Tomato
Onion
Cabbage
Cauliflower
Kangkong
Eggplant
Carrots
Cucumber
Okra
Pumpkin
Garlic
Beans

77
Vegetable Consumption, preferences and supply chain – final report © TNS July 2015
Q034: purchase by piece or by weight Matrix
Not back
Do you prefer to buy by weight or by piece?
SHOWCARD. SINGLE RESPONSE PER ROW.
Random
By weight By piece I have no particular
preference
Chilli
Tomato
Onion
Cabbage
Kankong
Cauliflower
Eggplant
Okra
Cucumber
Garlic
Pumpkin
Carrot
Beans

78
Vegetable Consumption, preferences and supply chain – final report © TNS July 2015
Q035: Quality price scale 1 Matrix
Not back
Imagine you can buy a range of vegetable qualities, with the option of buying better quality at a higher
price than usual, or reduced quality at a lower price than usual. Please indicate which option you would
select.
SHOWCARD
Normal
I would accept
low quality
vegetables for
a 10% discount
on the regular
price
I would accept
less than
average quality
vegetables for
a 5% discount
on the regular
price
I would pay the
regular price
for the regular
quality
I would pay 5%
more for a
better than
average quality
vegetables
I would pay
10% more for
high quality
vegetables
+/- 10%
discount
Q036: Quality price scale 2 Matrix
Not back
SHOWCARD
Normal
I would accept
low quality
vegetables for
a 25% discount
on the regular
price
I would accept
less than
average quality
vegetables for
a 10% discount
on the regular
price
I would pay the
regular price
for the regular
quality
I would pay
10% more for
a better than
average quality
vegetables
I would pay
25% more for
high quality
vegetables
+/- 25%
discount
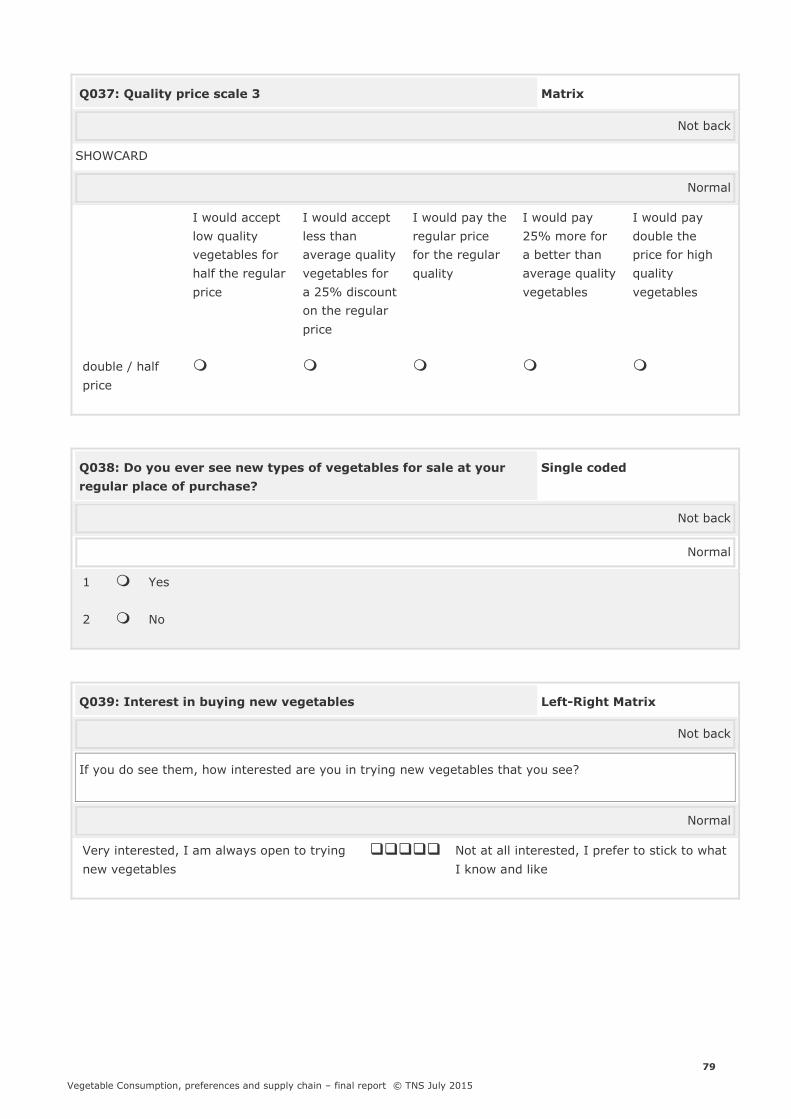
79
Vegetable Consumption, preferences and supply chain – final report © TNS July 2015
Q037: Quality price scale 3 Matrix
Not back
SHOWCARD
Normal
I would accept
low quality
vegetables for
half the regular
price
I would accept
less than
average quality
vegetables for
a 25% discount
on the regular
price
I would pay the
regular price
for the regular
quality
I would pay
25% more for
a better than
average quality
vegetables
I would pay
double the
price for high
quality
vegetables
double / half
price
Q038: Do you ever see new types of vegetables for sale at your
regular place of purchase?
Single coded
Not back
Normal
1 Yes
2 No
Q039: Interest in buying new vegetables Left-Right Matrix
Not back
If you do see them, how interested are you in trying new vegetables that you see?
Normal
Very interested, I am always open to trying
new vegetables
Not at all interested, I prefer to stick to what
I know and like

80
Vegetable Consumption, preferences and supply chain – final report © TNS July 2015
Q040: Triggers for purchasing new vegetables Multi coded
Not back
In the past, what has triggered you to try new types of vegetables?
UNPROMPTED / DO NOT SHOW SCREEN. PROBE: ANYTHING ELSE?
Random
1 When I noticed it for sale, I was just interested to try it
2 I tried it when I was eating out at a restaurant / friend /
family house and liked it
3 The vegetable seller recommended it to me
4 A friend family member recommended it to me
5 Someone in the household had tried it and asked me to
buy it
96 Other (specify): *Open *Position fixed
B004: PURCHASING BEHAVIORS End block

81
Vegetable Consumption, preferences and supply chain – final report © TNS July 2015
B005: Concerns Begin block
Q041: Concerns when buying vegetables Multi coded
Not back
What are the main concerns that you have when buying vegetables?
Random
1 I can't find the vegetables I need
2 The price is high
3 The quality is low
4 Lack of variation in available vegetables
5 The price is unstable
6 I worry about the use of pesticides / chemicals
7 I worry about the country of origin
96 Other (specify): *Open *Position fixed
98 None of the above *Position fixed *Exclusive

82
Vegetable Consumption, preferences and supply chain – final report © TNS July 2015
Q042: Impact of chemicals Multi coded
Not back
What impact do you think chemicals / pesticides used during the farming process have on the vegetables
you buy?
UNPROMPTED / DO NOT SHOW SCREEN. SAY: "IMPACTS CAN BE POSITIVE OR NEGATIVE" PROBE:
ANYTHING ELSE?
Random
1 Causes the vegetables to deteriorate
2 Causes an unpleasant smell
3 Causes an unpleasant taste
4 Bad for health
5 The vegetables grow bigger
6 The vegetables look nicer / more perfect
7 The vegetables last longer
8 Can cause illness
9 Can cause diarrhoea
10 Can cause vomiting
99 Don't know *Position fixed *Exclusive
Q043: Concern about pesticides Left-Right Matrix
Not back
How concerned are you about pesticides / chemicals used during the farming process?
Normal
I worry a lot about pesticides used in
farming vegetables
It's not something I think about at all

83
Vegetable Consumption, preferences and supply chain – final report © TNS July 2015
Q044: Appeal of organically grown Left-Right Matrix
Not back
Do you find the idea about organically grown vegetables appealing?
Normal
I very much like to buy organic vegetables It's not something I think about at all
Q045: Measures to avoid/remove chemicals Multi coded
Not back
What measures do you take to avoid / remove chemicals on vegetables?
Random
1 I clean the vegetables
2 I cook the vegetables
3 I avoid buying vegetables with a chemical smell
4 I avoid buying vegetables which look unusually big
5 I avoid buying vegetables which have an unusual colour
e.g. very bright / strong colour
6 I avoid vegetables which have perfect skin e.g. no small
holes or spots
7 I remove the skin
8 I don't do anything to avoid / remove chemicals *Position fixed

84
Vegetable Consumption, preferences and supply chain – final report © TNS July 2015
Q046: Country of origin Left-Right Matrix
Not back
Do you prefer locally grown or imported vegetables?
Normal
Locally grown is much better Imported vegetables are much better
Q047: Reason for origin preference Open
Not back
Why do you prefer [LOCALLY GROWN / IMPORTED]?
MENTION THE PREFERENCE THEY STATED IN PREVIOUS QUESTION
B005: Concerns End block

85
Vegetable Consumption, preferences and supply chain – final report © TNS July 2015
B006: Vegetable Usage Begin block
Q048: Vegetable storage Matrix
Not back
How do you normally store your vegetables at home?
SHOW CARD. SINGLE RESPONSE PER ROW.
Normal
Chi
lli
Tom
ato
Oni
on
Cabb
age
Cauliflo
wer
Kangk
ong
Eggpl
ant
Carr
ots
Cucum
ber
Ok
ra
Pump
kin
Gar
lic
Bea
ns
In
the
fridg
e
In
the
kitch
en
In
anot
her
room
in
the
hous
e
I do
not
store
, I
use
them
strai
ght
away

86
Vegetable Consumption, preferences and supply chain – final report © TNS July 2015
Q049: Length of storage Matrix
Not back
On average, how long do you keep the vegetables that you buy?
SHOWCARD. SINGLE RESPONSE PER ROW.
Random
I use them on the
day I buy them
I use them within
2 or 3 days
I use them within
4-7 days
I keep them for
more than a week
Chilli
Tomato
Onion
Cabbage
Cauliflower
Kangkong
Eggplant
Carrots
Cucumber
Okra
Pumpkin
Garlic
Beans

87
Vegetable Consumption, preferences and supply chain – final report © TNS July 2015
Q050: Frequency of cooking veggies Single coded
Not back
How often do you cook vegetables for your household?
Normal
1 More than once a day
2 4-6 times a week
3 1-3 times a week
4 Less than once a week
5 Never - rarely
Ask only if Q050,1
Q051: Number of meals with veggies per day Single coded
Not back
On Average how many meals do cook with vegetable a day?
Normal
1 1 meal
2 2 meals
3 3 or more meals

88
Vegetable Consumption, preferences and supply chain – final report © TNS July 2015
Q052: Vegetable dishes cooked Matrix
Not back
Which types of dishes do you cook with vegetables?
SHOW CARD. SINGLE RESPONSE PER ROW ONLY.
Random
Everyday 4-6 times per
week
1-3 times a
week
Less than once
a week
Never
Stir fried
Deep fried
Steamed/boiled
Salad
Curries
Soups
Eat fresh/raw
Q053: Frequency of washing vegetables Matrix
Not back
Do you wash your vegetables before using them?
Normal
Always Sometimes Occasionally Never
Frequency of
washing
vegetables

89
Vegetable Consumption, preferences and supply chain – final report © TNS July 2015
Q054: Washing vegetables Single coded
Not back
What do you usually wash your vegetables with?
Random
1 Water
2 Salty water
3 Soapy water
96 Other (specify): *Open *Position fixed
Q055: Vegetable wastage Single coded
Not back
On average, what proportion of your vegetables do you waste / throw away every week?
Normal
1 I don't waste any vegetables
GO TO B007
2 I waste less than 10% of the vegetables
3 I waste around 10% of the vegetables I buy
4 I waste around 20% of the vegetables I buy
5 I waste 25% or more of the vegetables I buy

90
Vegetable Consumption, preferences and supply chain – final report © TNS July 2015
Q056: Reason for wastage Multi coded
Not back
What is the main reason for vegetable wastage?
Random
1 I buy too much
2 The vegetables do not last long
3 The vegetables I buy become rotten
4 I cook too much
96 Other (specify): *Open *Position fixed
B006: Vegetable Usage End block
91
Vegetable Consumption, preferences and supply chain – final report © TNS July 2015
B007: Demographics Begin block
Q057: What is your marital status? Single coded
Not back
Random
1 Married
2 Single / never married
3 Separated / Divorced
4 Widowed
Q058: Occupation Single coded
Not back
Which of these best describes your main occupation?
Random
1 Housewife
2 Helping with family business
3 Student
4 Senior Manager
5 Business owner
6 Professional / supervisory level
7 Junior level / Admin
8 Hawker/casual worker/daily wages labour
9 Unemployed
96 Other (specify): *Open *Position fixed

92
Vegetable Consumption, preferences and supply chain – final report © TNS July 2015
Q059: Main income earner’s highest education
What’s the highest education of your household’s main income earner’s highest education?
1 Illiterate (NOT ON SHOWCARD)
2 Literate but no formal / school education
3 Primary incomplete
4 Primary complete
5 Junior / middle school incomplete
6 Junior / middle school complete
7 Secondary / senior / high school incomplete
8 Secondary / senior / high school complete
9 College / university incomplete
10 College / university complete (graduate)
11 Post graduate studies incomplete (no post graduate
degree)
12 Post graduate studies complete (post graduate degree)
97 No answer *Position fixed *Exclusive
B007: Demographics End block

3.15 Appendix 3 – Qualitative respondent profiles
RESPONDENTS PROFILE - Project : Eat your veg (2015-113)
No. Respondent's name Type of business
(respondent) Location Age Gender Education Position
1 Ma Thein Myint Retailer (Street Stall) Yangon 31 Female Middle school Owner
2 Hlaing Soe Tun Restaurant (Low End) Yangon 28 Male University Student Chef
3 Ko Ka Yin Wholesaler (Thirimingalar)
Yangon 32 Male Middle school In-charge
4 Daw Saw Saw Nyein Retailer (Street Stall) Yangon 49 Female Middle school Owner
5 Ma Khin Moe Lwin Retailer (Wet Market) Yangon 42 Female Middle school Owner
6 Ko Yin Han Restaurant (High End) Yangon 29 Male Graduate Manager
7 Ma Kyay Hmone Min Thu Hotel (Airport Inn) Yangon 25 Femae Graduate Purchasing
8 Ko Ka Yin Wholesaler (Thirimingalar)
Yangon 32 Male 10 Standard In-charge
9 Daw Thein Than Sint Retailer (Wet Market) Yangon 45 Female Middle school Owner
10 Ma Zar Chi Supermarket (Capital) Yangon 28 Female Graduate Purchasing Manager
11 Daw Khin Mya Wet Market Yangon 50 Female University Owner
12 Aung Kyaw Htoo Wholesaler (Thirimingalar)
Yangon 39 Male 10 Standard In-charge

13 Ko Sint Trader (To Thirimingalar)
Yangon 47 Male University Student Owner
14 Ko Aung Kyaw Phyo Lwin Supermarket (Sein Gay Har)
Yangon 33 Male University Student Purchasing Manager
15 Moe Moe Thu/ Ko Naing Sule Shangri-la/ apartment Hotel
Yangon 40 Female/ Male Graduates Purchasing-Service Manager/ Receiving
16 Nan Aye Shan Restaurant Taunggyi 50 Female Primary school Owner and purchaser
17 Ko Khaing Zaw Restaurant Taunggyi 25 Male Primary school Chef
18 Nan Khin Kyi Street Stall Taunggyi 26 Female Middle school Retailer
19 Nan Sein Pan Wet Market Taunggyi 37 Female University Student Retailer
20 Ma Wine Street Stall Taunggyi 32 Female Middle school Retailer
21 Ma Cherry San Wet Market Taunggyi 33 Female Middle school Retailer
22 Ma Thiri Wet Market Taunggyi 30 Female Primary school Retailer
23 Ko Khin Mg Myint Broker (Trader) Aung Ban 40 Male University Student Broker
24 Sai Ko Ko Broker sale centre (Tomato)
Aung Ban 36 Male High school Buyer and seller
25 Ko San Doe Broker (Trader) Aung Ban 25 Male 3rd Year Buyer and seller
26 Ko Phoe Ni Broker sale center Aung Ban 33 Male 10 Standard Buyer and seller
27 Ko Hla Win Thein Broker (Trader) Aung Ban 37 Male 10 Standard Broker

28 U Thein Oo Broker sale centre Aung Ban 45 Male Graduate Broker

96
Vegetable Consumption, preferences and supply chain – final report © TNS July 2015
3.16 Appendix 4: Discussion guide for retailer/ restaurant/ supermarket managers
Research Objectives:
Maps the current retail market outlets or other consumer access points for vegetables in the
country’s major cities and details out the specific characteristics of these market channels.
Provide a more comprehensive understanding of current market trends in terms of market share of
the different outlets (high-end retail and wholesale, specialized shops, open/wet markets,
restaurants, hotels and other industrial/commercial consumers).
Provide a more comprehensive understanding of consumer preferences for vegetables to include
aspects such as quality perceptions, buying patterns, eating habits, trade offs between quantity-
quality-pricing, and other related aspects of consumer preference.
Recommendations for increasing vegetable consumption in Myanmar through innovative public and
private sector marketing efforts.
Flow of discussion:
Section 1: INTRODUCTION/ WARM UP (5 mins)
Section 2: Exploration on shop (10 mins)
Section 3: Understanding of the quality vegetables (5 mins)
Section 4: Exploration on purchasing behaviour (15 mins)
Section 5: Exploration on selling behaviour (40 mins)
Section 6: Future expectation (5 mins)
WARM UP/ CLOSE

97
Vegetable Consumption, preferences and supply chain – final report © TNS July 2015
Section 1:
INTRODUCTION/
WARM-UP
To break ice and
make respondent feel
comfortable before starting the main discussion
(5 mins)
Interviewer self-introduction
Thank respondent for him/her participation
Quick introduction about the purpose of market research and the interview
No right or wrong, good or bad opinion, honest thoughts are appreciated
Inform audio/ video recording and observation
Respondent’s introduction – name, age, occupation, family, kids, etc.
Section 2:
EXPLORATION ON
SHOP
To understand the
general information
about the shop
(10 mins)
Today we are talking about the vegetables and first, please tell me-
What kinds of vegetables do you sell at your shop?
(For market/stall owners only) How many shops sell vegetables at this market?
How did you start your business at this market? (Probe the reasons – eg. More
customers, wide space, easy for travel, cheap place, many regular customers etc.)
How long have you been here?
What time do you open? What time do you close the shop? Do you open your shop
daily? Do you have any off days? How many off days do you have in a month?
How many customers do you have daily? How about one month?
Section 3:
UNDERSTANDING OF
THE QUALITY
VEGETABLES
To understand the
general information
about the quality
(5 mins)
Let’s talk about vegetables about how you define good and bad quality.
What factors do you think are most important in determining the quality of vegetables?
Probe (how the farmer cultivates, packaging and transport, chemical/pesticide usage)
MODERATOR NEEDS TO ASK WITH THE SHOW-CARDS FOR QUALITY SECTION.
When determining the quality of THESE KINDS OF VEGETABLES (show card) what
indicates good quality to you? What indicates bad quality to you?
MODERATOR SHOWS AND ASK ANOTHER (n=X) SHOW-CARD
Section 4:
EXPLORATION ON
PURCHASING
BEHAVIOR
To understand the
purchasing habits
(15 mins)
I would like to ask about your purchasing habits of vegetables.
Purchasing logistics and business relationships
Where do you buy your vegetables? From anywhere else?
Who do you buy your vegetables from? Please explain your relationship with the
supplier of your vegetables. Probe deeply –probe questions below will differ
depending on the nature of the wholesaler’s trader relationship.
***MODERATOR DRAW DIAGRAM IF REQUIRED***

98
Vegetable Consumption, preferences and supply chain – final report © TNS July 2015
Do you have an established relationship with one trader or do you source your
vegetables from different traders?
What informs the decision about who you buy from? (Trusted relationship with one
farmer? Pre-paid system with a farmer? Whoever has the cheapest price?)
How often do you buy vegetables?
Do you place orders with the supplier? If so, how often?
What influences how often you order? What informs the quantity that you order? (ie
influence of client demand)
Do you have the opportunity to check the quality of the vegetables produced by the
supplier before purchasing? What do you look for when checking?
How do you ensure the produce you are buying is good quality?
Do you normally face price fluctuation in the vegetables market? Why does it
happen? (Probe the reasons – eg. Flood, heavy rain, bridge broken, war etc.) What do
you do when it is happened?
How frequently do you face such problems? (Monthly basis? One time a year? Etc.)
(FOR THOSE WHO USE BROKERS) If you could purchase DIRECTLY from the farmer,
would you? Why/why not? Why do you use the brokers? Is it easier? More expensive?
Would you be trusting to buy from a collection centre managed by farmers instead of
buying from brokers?
Quality and willingness to bear risk
How do you normally keep the vegetable in your shop? (In fridge/freezer, room
temperature, spray the water, cover with wet textile etc.) Why do you keep like that?
Have you ever had a problem where the vegetables provided by the supplier did not
meet your standards of quality?
How willing would you be to buy a new variety of vegetable from your supplier? Why?
How willing would you be to buy vegetables of higher quality if it was more expensive
than what you normally purchase? Why? Specifically what would need to be improved
about the vegetable for you to consider it higher quality, and worth paying more for?
(Size, taste, freshness etc.)
For Restaurant, Hotel and Supermarket Managers
Do your buying habits reflect the number of customers you have, or do you buy a set
amount every time? Does this change? If yes, on which situation or day?
Do you buy the vegetables from refined wholesalers? Why do you buy? (Probe-
customers’ demand, caring hygiene, ready-to-go etc.)
What are the differences between that shop and other shops from markets about the
vegetables? (Probe-price, quality, hygiene, availability etc.)

99
Vegetable Consumption, preferences and supply chain – final report © TNS July 2015
(FOR THOSE WHO USE BROKERS) If you could purchase DIRECTLY from the farmer,
would you? Why/why not? Why do you use the brokers? Is it easier? More expensive?
Would you be trusting to buy from a collection centre managed by farmers instead of
buying from brokers?
Section 5:
EXPLORATION ON
SELLING BEHAVIOR
To understand selling
practice
(40 mins)
Well now we are going to discuss about your selling behaviour.
Selling logistics and business relationships
What kind of vegetables do you sell regularly? (Record the item )
On average, how many customers do you have each day?
What kinds of customers are they? (ie. individual, retailer from market/ street, hotel,
restaurant, food centre, for donation etc.)
How many regular customers do you have?
Where are they coming from? (Probe clearly whether they are from the region or any
other places, far away town to ask clearly)
Why are they coming to buy here? (Probe about the reasons to buy in this shop such as
cheap price, many options, easy to travel etc.)
How do you decide on the price that you sell the vegetables for? What influences this
decision?
Is there any occasion that the product is not enough for the demand? In what
occasion? How many times do you meet with this occasion? Which product/
vegetables?
How do you transport the produce to the place of sale? How do you ensure quality is
maintained on the journey? What do you store the vegetables in?
How do you package and present the vegetables in your shop before selling? Why do
you choose to do it this way? Does it affect how much your customers purchase?
Do you alter the product before on-selling? How do you decide what alterations to
make? (Probe)
Cleaning, cutting off the ends, cutting off the dirty parts?
Processing?
Grading?
Chemical ripening agent to improve appearance? Which one? How do you use it?
WHY do you make these alterations? Are customers more likely to purchase from you
if you make these changes? Is the produce more attractive?
How do you package the vegetables in your shop before selling? Why do you choose to
do it this way? Does it affect how much your customers purchase?
What happens to the vegetables that you are unable to sell? (Probe about whether
throwing or selling with cheap price etc.)

100
Vegetable Consumption, preferences and supply chain – final report © TNS July 2015
Quality and consumer’s willingness to try new things
ORGANIC PRODUCE
How do you understand the term “organic”? Please explain the difference between
organic and non-organic.
Does “organic” produce mean better quality? Why/why not?
Would you/do you ever buy/sell organic produce? Do your customers ever demand
organic produce? What kinds of customers want organic vegetables?
Where are they available from? Does the availability meet the demand?
Where is good organic produce grown? Who do you trust to grow it and be assured of
its quality and why?
Do your customers demand a certain standard of quality, or do they just buy what you
have? What defines their understanding of quality? How do they communicate this to
you? How do you ensure that the produce you sell meets their demands?
Do you think that your customers will be willing to buy high quality vegetables for a
higher price? Specifically what would need to be improved about the vegetable for
them to consider it higher quality, and for them to pay more for it? (Size, taste,
freshness etc.)
Do you think that your customers would be willing to try new kinds of vegetables?
Why/why not? What would be needed to encourage them to try a new kind of
vegetable?
For Restaurant, Hotel Manager
Now we are going to talk about your selling food and vegetables in your shop.
How many dishes with meat, fish and vegetables do you normally sell? (Probe about
the number of dishes on meat, fish and vegetables) Do you sell something special
dishes? Which dishes?
How much do you sell for each day? How about one month?
From that amount, how much goes for vegetables? (If you cannot say exactly, please
tell us in average percentage)
Which dish is more demand at this shop-meat or vegetables? (Please give me the
example for each dishes on a table-meat and vegetables)
Which kinds of vegetables do the customers normally eat? Why they eat?
What will be the difference of vegetables consumption comparing with previous?
(Probe-eat less, eat more vegetables, choose hygiene or without chemicals etc.) When?
Why do you think so?
Health and safety concerns

101
Vegetable Consumption, preferences and supply chain – final report © TNS July 2015
Are you aware of the health and safety practices of the farmers/traders from whom you
buy your vegetables?
Do your customers trust the health and safety standards in the produce that you sell?
(ie. Do they think it is healthy to eat?) How do you know this? How do they
communicate this to you?
Have you/your customers ever been concerned about health or safety in regards to the
produce you buy? How do you treat these concerns? Do you ever ask the trader?
Chemical fertilizer?
Pesticides?
Imported produce?
What do you think can be done to ensure that the vegetables are safe to eat? In other
countries, governments and organisations test that vegetables reach good health and
safety standards before they are sold. Do you think this would work in Myanmar?
Why/why not?
Knowledge
From any sources (media), do you or your customers know about how to eat
vegetables, how to eat vegetables, how much to eat?
Section 6:
FUTURE EXPECTATION
(5 mins)
Let’s think about the vegetables consumption in future.
Over your time working, have the types/varieties of vegetables available changed?
Do you think it will change? If so, why?
Have you seen changes in the quality of vegetables available? Has it become better
or worse? Do you think this will change? Why/why not?
Over your time working here, have you seen any changes in your customers’
expectations regarding the quality of vegetables? Do you think this will change?
Why/why not?
WRAP UP/ CLOSE Before I leave, is there anything else that you want to ask or add?
Give incentives to respondents


