Download - Using the TI-73

Using the TI-73:A Guide for Teachers
® Table of Contents <
Developed by
Cathy Cromar, Stephen Davies, Pamela Patton Giles,Gary Hanson, Pamela Weber Harris, Rita Janes,
Ellen Johnston, Jane Martain, Linda K. McNay, Melissa Nast,Louise Nutzman, Aletha Paskett, Claudia Schmitt, and Karen Wilcox
Edited by
Brenda Curry
Design by
Susan Gullord
With contributions by
Eddy Frey, Doug Harnish, Guy Harris,Gay Riley-Pfund, and Dianna Tidwell

ii
Using the TI-73: A Guide for Teachers
© 1998 T
EXAS
I
NSTRUMENTS
I
NCORPORATED

iii
© 1998 T
EXAS
I
NSTRUMENTS
I
NCORPORATED
About the Development Team
Texas Instruments would like to acknowledge the following individuals who worked as a
team in developing and evaluating these materials.
Cathy Cromar
teacher, Cottonwood Heights Elementary School, Salt Lake City, Utah
Stephen Davies
teacher, Oquirrh Elementary School, West Jordan, Utah
Pamela Patton Giles
K-12 math specialist, Jordan School District, Sandy, Utah
Gary Hanson
teacher, Sprucewood Elementary School, Sandy, Utah
Pamela Weber Harris
teacher, Southwest Texas State University, San Marcos, Texas
Rita Janes
teacher, Newfound Educational Associates, St. John’s, Newfoundland
Ellen Johnston
teacher, Trinity Junior High School, Fort Smith, Arkansas
Jane Martain
teacher, Mountview Elementary School, Salt Lake City, Utah
Linda K. McNay
teacher, Quincy Junior High School, Quincy, Illinois
Melissa Nast
teacher, Arlington, Texas
Louise Nutzman
teacher, Sugar Land Middle School, Sugar Land, Texas
Aletha Paskett
teacher, Indian Hills Middle School, Sandy, Utah
Claudia Schmitt
teacher, Oquirrh Elementary School, West Jordan, Utah
Karen Wilcox
teacher, Columbus, Ohio
Important notice regarding book materials
Texas Instruments makes no warranty, either expressed or implied, including but not limited to any implied warranties ofmerchantability and fitness for a particular purpose, regarding any programs or book materials and makes such materialsavailable solely on an “as-is” basis. In no event shall Texas Instruments be liable to anyone for special, collateral, incidental,or consequential damages in connection with or arising out of the purchase or use of these materials, and the sole andexclusive liability of Texas Instruments, regardless of the form of action, shall not exceed the purchase price of this book.Moreover, Texas Instruments shall not be liable for any claim of any kind whatsoever against the use of these materials byany other party.
Permission is hereby granted to teachers to reprint or photocopy in classroom, workshop, or seminar quantities the pagesor sheets in this work that carry a Texas Instruments copyright notice. These pages are designed to be reproduced byteachers for use in their classes, workshops, or seminars, provided each copy made shows the copyright notice. Suchcopies may not be sold, and further distribution is expressly prohibited. Except as authorized above, prior writtenpermission must be obtained from Texas Instruments Incorporated to reproduce or transmit this work or portions thereofin any other form or by any other electronic or mechanical means, including any information storage or retrieval system,unless expressly permitted by federal copyright law. Send inquiries to this address: Texas Instruments Incorporated, 7800Banner Drive, M/S 3918, Dallas, TX 75251, Attention: Manager, Business Services
Note: Using calculators other than the TI-73 may produce results different from those described in these materials.
www.ti.com/[email protected]
Copyright © 1998 Texas Instruments Incorporated.Except for the specific rights granted herein, all rights are reserved.
Printed in the United States of America.

iv
Using the TI-73: A Guide for Teachers
© 1998 T
EXAS
I
NSTRUMENTS
I
NCORPORATED
About the ActivitiesThis guide consists of 12 activities designed to be teacher-directed. They areintended to help develop mathematical concepts while incorporating theTI-73 as a teaching tool.
Organization
Each activity is self-contained and includes:
♦ The mathematical strands with which the activity is most closelyassociated: Number Sense; Patterns, Relations, and Functions;Measurement and Geometry; or Probability and Statistics
♦ The materials needed to perform the activity
♦ An overview of the mathematical purpose of the activity
♦ The detailed procedure, including step-by-step TI-73 keystrokes
Additionally, most of the activities contain:
♦ A student activity sheet as needed
♦ A teacher black-line master as needed
♦ A section to wrap-up what is being taught
♦ A section to assess what is being taught
♦ A section to extend what is being taught
Conventions Used
♦ Brackets [ ] around a key’s symbolindicate that the key is a second function(printed in yellow) on the TI-73.
Example - l
♦ Bold type indicates a calculator displayor format.
Example Done
How To Order Materials
To place an order or request additional information about TI calculators, callour toll-free number: 1-800-TI-CARES (1-800-842-2737).

v
© 1998 T
EXAS
I
NSTRUMENTS
I
NCORPORATED
Table of Contents
About the Development TeamAbout the Development Team
iii
About the ActivitiesAbout the Activities
iv
Number Sense
The Cookie Caper
1
Dice Digits
5
How Do You Measure Up?
9
Patterns, Relations, and Functions
Stadium Walls
13
The Twin’s Towers
23
Major Martian Headache
31
Measurement and Geometry
The Dolphin
35
Drip, Drip, Drip
41
Only the Height Has Been Changed
49
Probability and Statistics
Give Me 5!
55
A Foot is a Foot
–
Or is It?
63
Which Brand is Best?
69
TI-73 IndexTI-73 Index
7979
Activity Content IndexActivity Content Index
8080

1
© 1998 T
EXAS
I
NSTRUMENTS
I
NCORPORATED
Activity 1
The Cookie Caper
Students learn about equivalent fractions by sharing
their favorite cookies.
Number Sense
♦
equivalent fractions
♦
fractions to decimals
Materials
♦
7cm (2¾ in.) poster board circles for
cookies
♦
copies of fractional circles (provided)
♦
shapes of colored paper to represent
chocolate chips, nuts, raisins etc.
(optional)
♦
glue or glue sticks
♦
scissors
♦
markers or crayons
♦
TI-73 �
Setup
Before you begin, you or you and your students do thefollowing:
♦ For each student, cut a poster board circle with adiameter of 7cm (2¾ in.) to represent a cookie.
♦ Cut out the fractional circles that are provided andpaste one on the back of each poster board “cookie.”(Some students will have halves, some thirds, somefourths, etc.)
♦ Cut shapes of colored paper for raisins, nuts, etc., andglue them to the front of the cookies, or have studentsdraw their favorite ingredients on the front of theircookies.
Activity
Have students perform the steps unless otherwiseindicated.
1. After designing the cookies, turn them over and cutinto the assigned fractional parts pre-pasted on theback.
2. On a sheet of notebook paper, make a diagram of thecookie circle and the cuts made to make the assignedfractional parts.

2
Using the TI-73: A Guide for Teachers
Number Sense
© 1998 T
EXAS
I
NSTRUMENTS
I
NCORPORATED
3. Give students a set time period to trade cookie “bites”(slices) with each other. Tell them they must tradeequal-sized pieces, so they will need to know whatfractional parts are equal to each other.
Example A ½ slice may be traded for two ¼ slices.
At the end of the trade time, each student should stillhave a whole cookie, but now it is made of a variety ofcookie ingredients.
4. Discuss the results with your students. Ask:Why did some have a whole cookie, and some did
not?
What kinds of trades could they have made to end up
with a whole cookie?
5. Use the TI-73 to verify equivalent fraction trades andto count or add up fractions to see if they equal awhole cookie.
Example 1 If a student traded ¼ for 3/12, the student would enter
Y = Q " - t # # # to =b # to Done b[ = Y Z b
➪
If a 1
is displayed on the
right-hand side of the
screen, the 2 fractions are
equivalent. If a 0
is
displayed, they are not
equivalent fractions.
Example 2 If a student traded for ¼, ½, and 3/12, the student would enter
Y = Q " \ Y = Z "\ [ = Y Z b
➪
If a 1
is displayed on the
right-hand side of the
screen, the student knows
the pieces add up to a
whole cookie.

Number Sense
Activity 1: The Cookie Caper
3
© 1998 T
EXAS
I
NSTRUMENTS
I
NCORPORATED
Wrap-up
♦ Have students make a list of the fractions they thinkare equivalent to each other.
♦ Have students enter their equivalent fractions into theTI-73 and change each to a decimal using >(fraction-to-decimal function). Discuss why theseequivalent fractions also have the same decimal value.
Example Press Y = Q > b.
The display shows .25 as the decimal equivalent for ¼.
Then enter [ = Y Z > b.
The display again shows .25 as the decimal equivalent.
♦ Now have students make a diagram of their finalcookies next to their original diagrams. Have themlabel the new fractional parts and decimal amounts.
Extensions
♦ Older students: Change the decimals to percents andhave a pie chart of all three amounts—fractions,decimals, and percents.
♦ All students: Cut their pieces in half, name thefractional parts, and trade again for another set timeperiod. Investigate:Did they make equivalent trades?
Was it easier this time, or more difficult?
Does the new fractional cookie still add up to a whole
cookie on the TI-73?

4
Using the TI-73: A Guide for Teachers
Number Sense
© 1998 T
EXAS
I
NSTRUMENTS
I
NCORPORATED

5
© 1998 T
EXAS
I
NSTRUMENTS
I
NCORPORATED
Activity 2
Dice Digits
Students use 4 numbers, any operations, and grouping
symbols to write mathematical expressions that are
equal to each of the numbers 1 through 9.
Number Sense
♦
order of operations
♦
mental math
♦
basic computation
Materials
♦
student activity sheet (provided)
♦
transparency of activity sheet
♦
TI-73 ³
Setup
If your TI-73s have not been used for random numbergeneration prior to this activity, you and your studentsneed to store an integer “seed value” to rand in each TI-73.
With each rand execution, the TI-73 generates the samerandom-number sequence for a given seed value. TheTI-73 factory-set seed value for rand is 0. To generate adifferent random-number sequence, store any non-zeroseed value to rand .
➪
If you do not enter a seed
value, rand
uses whatever
value happens to be the
current seed. If there is no
seed, it uses the factory-
set value of 0
.
1. Enter the number you want for your seed value. Havestudents use different seed values. (In the exampleshown at the right, 1 is used.)
2. Now press X 1 " " 1 b1 " " 1 b b.
(For more information about seed values, refer to the“1 Probability Menu” section in the Math chapter ofthe TI-73 Guidebook .)
➪
If you want to restore the
factory-set seed value,
store 0
to rand
or reset
the defaults.

6
Using the TI-73: A Guide for Teachers
Number Sense
© 1998 T
EXAS
I
NSTRUMENTS
I
NCORPORATED
Activity
—
Part A
Whole ClassWhole Class
1. Demonstrate to your students how to roll dice on theTI-73 to get 4 numbers. Record the 4 numbers.
a. Go to the Home screen.
- l
b. Select dice from the MATH PRB menu, and paste itto the Home screen.
1 " " J
c. Enter the number of dice you want to roll at onetime.
Q E b
You now have 4 numbers.
d. Record the 4 numbers on the transparency.
2. Have students use each of the 4 numbers once, alongwith any operations symbols (and grouping symbols,when needed), to write an expression that has a valueof 1.
Example If your 4 numbers were {4 3 4 5} , an expression would be 1 = (5 - 3) - (4/4).
3. Record one of these expressions on the transparency.Ask if anyone has a different expression. Record these,also.
4. Repeat this procedure to write an expression equal to2.
5. Continue the demonstration until students understandwhat to do.
Students may use the TI-73 to find the expression or tocheck the value of the expression.
Example If the 4 numbers are {4 3 4 5} , andthe expression is 1 = (5 - 3) - (4/4), then enterD R T [ E TD Q F Q E b.

Number Sense
Activity 2: Dice Digits
7
© 1998 T
EXAS
I
NSTRUMENTS
I
NCORPORATED
Activity
—
Part B
Individual or Small Group
1. Have each student or pair of students roll dice on theTI-73 to get 4 numbers.
2. Instruct students to use all 4 numbers, any operations,and grouping symbols to write an expression for eachof the numbers 1 through 9.
3. Have students check their work on the TI-73 andrecord each expression on the student activity sheetprovided.
Wrap-up
♦ Students can exchange papers and check oneanother’s work.
♦ Ask students: Will it always be possible to write
expressions for each counting number using the 4
numbers? (no)
♦ Share examples of what students believe to beimpossible.
Assessment Suggestions
♦ Ask students to write a journal entry summarizing therules for order of operations. (Refer to “EquationOperating System (EOSé)” in Appendix B of the TI-73
Guidebook .)
♦ Ask students to think of an example of 4 numbers thatwould make this activity difficult or impossible tocomplete and explain why.
Extensions
♦ Find the probability of getting an “unlucky” roll suchas four 1s.
♦ Depending on the level of the students, extend theactivity to include exponents, roots, factorials, etc.
♦ As a class, use the 4 digits of the current year todevelop expressions that equal the numbers 1 through100. Display students’ work on a bulletin board.

8
Using the TI-73: A Guide for Teachers
Number Sense
© 1998 T
EXAS
I
NSTRUMENTS
I
NCORPORATED
Name
__________________________
Date
__________________________
Activity 2
Dice Digits
Roll dice to get 4 numbers. Record numbers below.
________ ________ ________ ________
Expression
Key Sequence
1 =
2 =
3 =
4 =
5 =
6 =
7 =
8 =
9 =
Can you find more than one expression for each number?

9
© 1998 T
EXAS
I
NSTRUMENTS
I
NCORPORATED
Activity 3
How Do You Measure Up?
Students discover the ratio between their heights and
the lengths of their intestines. This activity is a good
introduction to using lists to find the mean and
performing operations on lists.
Number Sense
♦
ratios
♦
mean
♦
estimation
♦
measurement
Materials
♦
tape measures or rulers for students
to measure their heights
♦
ball of string
♦
scissors
♦
masking tape
♦
TI-73 �
Setup
♦ Ask students: How long do you think your small
intestine is?
♦ Have each student estimate the length of theirintestine in meters or feet, and then cut a piece ofstring this length.
♦ Tape a long strip of masking tape on the floor as thehorizontal axis, and then make a vertical bar graphusing the students’ pieces of strings.
Activity
—
Part A
In this part, students find the average length of their smallintestines. Have students perform the steps unlessotherwise indicated.
➪
You may want to do this
part of the setup in the
hall or some place with a
large area of floor space.

10
Using the TI-73: A Guide for Teachers
Number Sense
© 1998 T
EXAS
I
NSTRUMENTS
I
NCORPORATED
1. Measure the strings.
2. Enter the data in L1 on the TI-73.
a. Display the List editor.
3
b. If necessary, clear L1.
$ to highlight L1
: b
c. Starting at the first line in L1, enter the stringlengths. (You’ll get an error if L1 is still highlighted.)Press b after each list item.
3. Find the mean of L1.
a. Return to the Home screen.
- l
b. Access the - v MATH menu and select mean .
- v " " [
c. Calculate the mean of L1.
- v Y E b
4. Inform students that the average small intestine is 6m(20 ft.) long. Ask:Was the mean you found close to 6m (20 ft.)?
Who had the closest estimate?
Which estimate was off the farthest?
What are some objects that are 6m (20 ft.) long?
If all the strings were connected together, how long do
you think they would be?
➪
Find some objects 6m (20
ft.) long that students are
familiar with in your local
area.
5. Find the sum.
a. Return to the Home screen.
- l
b. Access the - v MATH menu and select sum .
- v " " J
c. Calculate the sum.
- v Y E b

Number Sense
Activity 3: How Do You Measure Up?
11
© 1998 T
EXAS
I
NSTRUMENTS
I
NCORPORATED
Activity
—
Part B
In this part, students discover the ratio of the averageheight of a student to the average length of an intestine.Have students perform the steps unless otherwiseindicated.
1. Measure height in centimeters or inches.
2. Enter the data in L2.
a. Display the List editor.
3
b. If necessary, clear L2.
$ to highlight L2
: b
c. Enter the heights in L2. Press b after each listitem.
3. Find the average height on the Home screen using themean function.
a. Return to the Home screen.
- l
b. Access the MATH menu and select mean .
- v " " [
c. Calculate the mean.
- v Z E b
4. Compare the average height to intestine length as aratio.
Wrap-up
Ask students: How many average students would it take
to make the length of an average intestine?

12
Using the TI-73: A Guide for Teachers
Number Sense
© 1998 T
EXAS
I
NSTRUMENTS
I
NCORPORATED
Assessment Suggestions
The average length of the small intestine of an ostrich is1372cm (45 ft.). Three ostriches have heights of 314cm (10ft. 3 in.), 308cm (10 ft. 1 in.), and 299cm (9 ft. 8 in). Havestudents find the ratio of the ostriches’ average height toaverage intestine length.
Extensions
Investigate the length of the intestine for differentanimals. Compare the ratio of the height to intestinelength to the ratio you discovered above.
Herbivores length of intestines = 4 times body length or 12times length of torso.
Carnivores length of intestines = body length or 6 times length of torso.
How many average students would it take to make the
length of a weasel’s intestine?
How many teachers would it take to make the length of
the intestine?

13
© 1998 T
EXAS
I
NSTRUMENTS
I
NCORPORATED
Activity 4
Stadium Walls
Students investigate real-life situations and find
patterns by making concrete representations and
making T-charts. Students then describe and generalize
these patterns verbally, symbolically, and graphically.
Patterns and Relations
♦
patterning
♦
graphing
♦
evaluating expressions
♦
equivalent math expressions
Materials
♦
graph paper
♦
toothpicks
♦
TI-73 �
Setup
Present the following problem to students.
An engineer designs the skeleton for the walls of a new
stadium from equal lengths of steel beams that are
placed in a rectangular pattern as shown below. The
engineer knows that one wall has to have a length of 57.
How many steel beams are needed for this wall?
length 1
length 2
length 3
(This view is from the front.)
The length of each wall is measured by the number ofbeams along the bottom of the wall.

14
Using the TI-73: A Guide for Teachers
Patterns and Relations
© 1998 T
EXAS
I
NSTRUMENTS
I
NCORPORATED
Activity
Have students perform the steps unless otherwiseindicated.
1. Model the wall using toothpicks to represent thebeams to a length of 6.
2. As each length of the wall is modeled, record the totalnumber of beams in a T-chart.
Example
length(X)
number of
beams(Y)
1
4
2
3
4
5
6
7
7
10
13
16
19
22
3. Investigate the pattern in the tables and concretemodels and predict how many beams are needed for awall length of 7 and a length of 10.
4. Record answers in the table and share in small groupshow these values were determined.
5. With students working in small groups, ask them towrite a sentence to describe the patterns they see inthe table.
Ask: Do these patterns make sense in terms of the
concrete model?

Patterns and Relations
Activity 4: Stadium Walls
15
© 1998 T
EXAS
I
NSTRUMENTS
I
NCORPORATED
6. Now have students determine how many beams areneeded for a length of 57.
Discuss how they found their solutions.(Some students may find the solution by recognizingthat each number in the right-hand column is obtainedby adding 3 to the previous term, starting with 4.)
7. Show students how the TI-73 may be used to find thesolution in the same manner. You can do this in one oftwo ways, with the @ key or with the b key.
a. Using the @ key:
(1) Access the Set Constant screen.
- † (above the @ key)
(2) At C1, enter the constant.
\ [
(3) Return to the Home screen.
- l
(4) At the Home screen, begin your sequence with4.
4 @ @ @ and so on
➪
n =
number of counts
b. Using the b key:
At the Home screen, begin your sequence.
b \ [ b b b and so on
(You might discuss the inefficiency of this methodfor large numbers.)

16
Using the TI-73: A Guide for Teachers
Patterns and Relations
© 1998 T
EXAS
I
NSTRUMENTS
I
NCORPORATED
8. Using the TI-73, lead students to alternative methodsby reading the T-chart as a relationship between X andY.
a. Tell students to look at the numbers in theirT-chart and describe the rule that relates thenumber of lengths to the total number of beams.For example, As the number of lengths change,
what happens to the number of beams? Havestudents share rules in small groups, and then withthe whole class.
b. Write the rules on the board or chart paper so allcan see. Students may suggest the following rules(or something similar):
• The total number of beams is equal to 3 timesthe number of lengths plus 1.
• The total number of beams is equal to 4 plus 3times 1 less than the number of lengths in thebottom.
• The total number of beams is equal to 2 timesthe number of lengths plus the number oflengths plus 1.
9. Ask students to describe their rules symbolically(mathematically) using L to represent the number oflengths and B the total number of beams.
Record the equations so the whole class can see them.They are related to the rules stated earlier.
• The total number of beams is equal to 3 times thenumber of lengths plus 1.
B is 3 times L plus 1.B = 3L + 1
• The total number of beams is equal to 4 plus 3times 1 less than the number of lengths in thebottom.
B is 4 plus 3 times L minus 1.B = 4 + 3(L-1)
• The total number of beams is equal to 2 times thenumber of lengths plus the number of lengths plus1.
B is 2 times L plus L plus 1.B = 2L + L + 1

Patterns and Relations
Activity 4: Stadium Walls
17
© 1998 T
EXAS
I
NSTRUMENTS
I
NCORPORATED
10. Ask:What remains the same or constant? (1)
What changes or varies? (L-number of lengths varies)
What will the graph of the line represented by these
equations look like?
11. The TI-73 uses X and Y when graphing, so change theequation B = 3L + 1 to Y = 3X + 1 using the Y= editor.
a. On each line where there is an entry, clear theY= editor.
& :
b. Now enter the equation.
[ I \ Y
12. View the window.
'
13. Discuss the possible values for X and Y. Ask questionssuch as:What does X represent? (length)
Do you need negative values for Xmin? (no)
What would you suggest for Xmin? (Look at T-chartdata.)
What do you suggest for Xmax?
What does Y represent? (number of beams)
Do you need negative values for Ymin?
What do you suggest for Ymin? (Look at T-chartdata.)
What do you suggest for Ymax? Should it be smaller
or larger than Xmax?
At the right is an example of an appropriate window.

18
Using the TI-73: A Guide for Teachers
Patterns and Relations
© 1998 T
EXAS
I
NSTRUMENTS
I
NCORPORATED
14. Turn off STAT PLOTS , and then display the graph.
- e Q b *
15. Ask:What do you notice about the graph on the screen?
What is the value of Y when X is 57? How can you
find out? (Press ) to see the values on the graph.If you are not tracing whole number values for X,estimate the value of Y by rounding the decimal.)
What will Y equal when X is 57? (To find the wholenumber value, press R J b.)
Is this the same value you found earlier when you
added 3 to each previous term? When you used the
@ key? When you used the b key?
16. Since the X values in the table of values for theequation depend on some initial settings in the TABLESETUP, do the following.
a. Access the TABLE SETUP screen.
- f (above the ' key)
➪
Have students sketch the
graph on graph paper for
further discussions later
(slope, intercepts, how
does it describe the
situation in the problem?,
etc.).
b. Make sure the screen looks like the one shown atthe right (TblStart=0, @Tbl=1, Indpnt: Auto, Depend:Auto ).
17. Use the TI-73 to show a table of values for theequation.
- i (above the * key)
18. Compare the table on the TI-73 with the T-chart in thefirst part of the activity. Ask:What value does the table give for X = 57?
How does this compare to the value you computed
earlier for X = 57?
What do the X values in the table represent? (thelength of the wall)
What do the numbers in the Y1 column represent?
(the number of beams)
19. Enter the second equation Y = 4 + 3(X - 1) in Y2, andthen graph it.
& # to Y2 Q \ [ D I T Y E *
Ask: Do you see 2 lines? Why not?

Patterns and Relations
Activity 4: Stadium Walls
19
© 1998 T
EXAS
I
NSTRUMENTS
I
NCORPORATED
20. Change the graph style of Y2.
& # to Y2 ! so the cursor is blinking on top of thelittle diagonal line on the far leftb
Notice that the diagonal line has changed to a darkerline.
21. To see the second line graph over the first, press*.
Ask: What is true about the graph of the second
equation compared to the first? (same line)
22. Explain that another way to determine that the twoequations are graphing the same line is from the graphscreen.
23. Access the graph screen and turn on Trace .
* )
Notice that Y1=3X+1 is the equation at the top of thescreen.
24. Press $.
Notice that now Y2=4+3(X-1) is the equation at the topof the screen.
Press $ again a few times.
Point out to students that as they move from graph tograph, the Y values stay the same, proving that theequations graph the same line.
25. Look at the table of values for this equation.
- i
Ask: What do you notice about the values in Y2?
26. Repeat the procedure for the third equation byentering it in Y3 and viewing the table of values.
20
Using the TI-73: A Guide for Teachers
Patterns and Relations
© 1998 T
EXAS
I
NSTRUMENTS
I
NCORPORATED
Wrap-up
♦ Ask: Based on your observation of the graphs of the
equations, what conclusions would you draw about
the equations you graphed? Have students reportfindings. This could lead to a discussion of equivalentexpressions and simplifying expressions.
♦ Have students substitute X = 57 in the equations tofind a value for Y. This will also show the equivalencyof the equations.
Assessment Suggestions
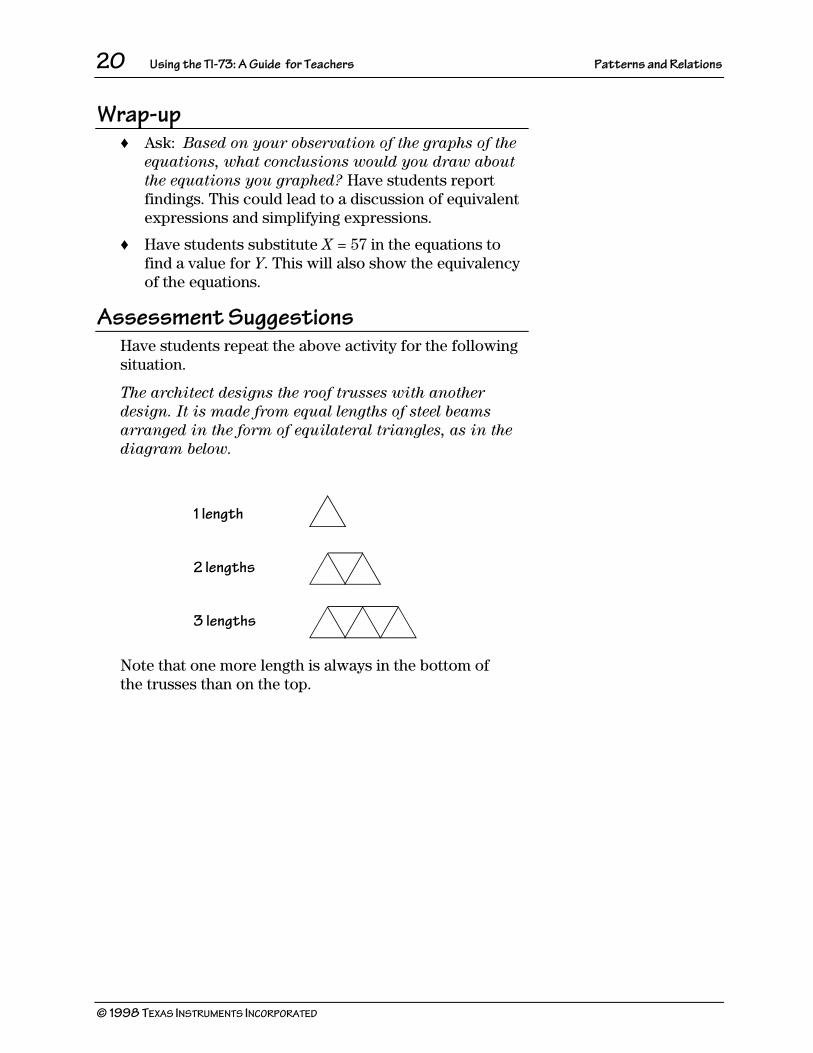
Have students repeat the above activity for the followingsituation.
The architect designs the roof trusses with another
design. It is made from equal lengths of steel beams
arranged in the form of equilateral triangles, as in the
diagram below.
1 length
2 lengths
3 lengths
Note that one more length is always in the bottom ofthe trusses than on the top.

Patterns and Relations
Activity 4: Stadium Walls
21
© 1998 T
EXAS
I
NSTRUMENTS
I
NCORPORATED
Extensions
♦ Assign the following problem and have studentsanswer the questions.
A group of students from a jazz choir want to attend
an international competition. They need to raise
money to help pay for the expenses. Each student
decided to investigate a scheme and present their
findings at the next meeting of the group.
One student decided to sell granola bars. The
predicted profit for every bar sold is $0.65. How
much could this scheme realistically make for the
trip?
♦ Have students present their solutions orally withhandouts that include a written plan along with tablesand graphs to support their cases.

22
Using the TI-73: A Guide for Teachers
Patterns and Relations
© 1998 T
EXAS
I
NSTRUMENTS
I
NCORPORATED

23
© 1998 T
EXAS
I
NSTRUMENTS
I
NCORPORATED
Activity 5
The Twin’s Towers
Students develop the concept of a variable while solving
problems using the b
key and the -
¢
key.
Patterns and Functions
♦
problem solving
♦
percents
♦
adding fractions
Materials
♦
blocks or cutouts
♦
student activity sheet (provided)
♦
TI-73 ³
Setup
Discuss the following situation with your class.
My twin brother and sister are building towers with
blocks. They built them in the following ways.
1-level tower
2-level tower
3-level tower
The twins want to know how many blocks they will need
for a tower 27 levels high. Can you help them find this?
No. of levels
1
2
3
4
5 . . . . . . 27
No. of blocks
3
4
5
6
7 . . . . . . 29
➪
Build the towers with
blocks as you discuss this
activity or have the
students build them with
you.

24
Using the TI-73: A Guide for Teachers
Patterns and
Functions
© 1998 T
EXAS
I
NSTRUMENTS
I
NCORPORATED
Activity
—
Part A
1. Ask students: Look at the row for the number of
blocks. What pattern do you see? (The first number is3 and then increases by 1.)
2. Demonstrate along with your class how to put thepattern into the TI-73.
a. Explain that this whole scenario starts with a1-level tower that needs 3 blocks. So the first entryis 3.
[ b
b. Ask students: How many blocks do you need for a
2-level tower? (Remember, you are working onhow to get from the original 3 blocks to the 4blocks in the 2-level tower.)
c. Press \ Y.
Ask the class to tell you what Ans means.
(Explain that just pressing \ indicates to the TI-73that it needs two things to add, so it grabs theanswer (in this case, 3) that you had in the lineabove and calls it Ans .)
d. Press b.
Explain that the number of blocks in the 1-leveltower is the first entry and output on the screen(3). The number of blocks in the 2-level tower isthe next output (4).
e. Press b again.
Ask the class to explain what happened.
(Because you did not enter a new command, theTI-73 did the previous command again; but thistime, Ans stood for the most current answer, whichwas 4.)
f. Ask students: How would you use the b key
(this technique) to find out how many blocks you
would need for a 10-level tower?
➪
Have students count aloud
as you press b
7 more
times.

Patterns and Functions
Activity 5: The Twin’s Towers
25
© 1998 T
EXAS
I
NSTRUMENTS
I
NCORPORATED
3. Now have students generate this sequence on theirTI-73s.
[ b \ Y b
4. Working in groups of two, have students use theirTI-73s to answer the following questions.How many blocks do you need for a 27-level tower?
(29)
How many blocks do you need for a 53-level tower?
(55)
A ___-level tower has 27 blocks? (25)
A ___-level tower has 53 blocks? (51)
Activity
—
Part B
1. Now the twins build the following towers. Havestudents build them, too.
1-story tower1-story tower
2-story tower2-story tower
3-story tower3-story tower
2. Ask students how they would enter this scenario intothe TI-73.
Z b \ Z b
3. Have students answer the following questions.How many blocks do you need for an 8-story tower?
A ____-story tower has 28 blocks.
How many blocks do you need for a 53-story tower?
A ____-story tower has 27 blocks.
Up to this point, students have been counting the numberof times they press b. To make it easier to see whichterm of the sequence they are on, they can create acounter that will keep track for them.

26
Using the TI-73: A Guide for Teachers
Patterns and
Functions
© 1998 T
EXAS
I
NSTRUMENTS
I
NCORPORATED
4. Have students set up the counter for the secondscenario.
- t # #, and then " until { bY ¡ Z " to } b# # to Done b b- t # #, and then " until { b# # to Done b- ¢ (above the a key)D Y E \ Y ¡- ¢ D Z E \ Z- t # #, and then " until } b# # to Done b b
➪ {}
indicates a list of
numbers.
➪ Ans(1)
means the answer
in the first position of the
list and Ans(2)
means the
answer in the second
position of the list.
Ans(1) +1
will count up by
ones to let you know which
term you are on, while
Ans(2)+2
is the familiar
pattern you use to find the
number of blocks each
tower will have.
Activity
—
Part C
1. Now the twins move to bigger things. Try this nextpattern with the counter.
1-story tower
2-story tower
3-story tower
2. Have students set up the counter.
- t # #, and then " until { bY ¡ R " to } b# # to Done b b- t # #, and then " until { b# # to Done b- ¢ (above the a key)D Y E \ Y ¡- ¢ D Z E \ [- t # #, and then " until } b# # to Done b b

Patterns and Functions
Activity 5: The Twin’s Towers
27
© 1998 T
EXAS
I
NSTRUMENTS
I
NCORPORATED
3. Explain to students that the process they have beenusing to find successive terms in a sequence ofnumbers is called recursion. Recursion means thateach term is built from the term before it. Thisrecursive process allows students to solve morecomplicated, real-life problems.
Wrap-up
Discuss the power of Ans with your students. You couldhave solved all of the situations examined by making listsof each sequence, term after term. With the power oftechnology, terms can be generated much faster anddifficult real-world problems can be solved.
Assessment Suggestions
1 story
2 story
3 story
or
1 story
2 story
3 story
♦ Have students write the recursive pattern they woulduse to generate how many blocks they need for eachtower.
♦ Ask students:How many blocks do the following need: 1 story, 8
stories, 150 stories, 99 stories?
If you use the following number of blocks, what story
are you on: 56, 110, 221?

28
Using the TI-73: A Guide for Teachers
Patterns and
Functions
© 1998 T
EXAS
I
NSTRUMENTS
I
NCORPORATED
♦ Give students a situation like in the last question. Thengive them the screen shot shown at the right. Askstudents to discuss what the screen means.
♦ In groups, have students come up with their ownsituations that can be solved recursively. Have themwrite the situations in story form, and then trade withanother group.
♦ Give students the screen shot at the right. Ask them tocreate at least one situation that would fit this pattern.
Extensions
Use the following patterns to work with fractions anddecimals.
1.
2.
DoublingDoubling
An old legend recounts the story of the ruler who offered
the subject any payment the subject requested. The
subject replied that the following would suffice: 1 grain
of wheat on the first square of the chessboard, 2 on the
next, 4 on the next, and so on, doubling the amount of
wheat on each successive square.
Ask students: How many grains of wheat will you need
just to fill the squares of the first row? (8 squares)
How many grains for half of the board? (32 squares)
How many grains to pay the subject in full? (64 squares)
{ _ ¡ Y } b, and then { - ¢ D Y E \ Y ¡ ZM - ¢ D Z E }

Patterns and Functions
Activity 5: The Twin’s Towers
29
© 1998 T
EXAS
I
NSTRUMENTS
I
NCORPORATED
Name
__________________________
Date
__________________________
Activity 5
The Twin’s Towers
1. Build the above pictures with blocks orcutouts.
2. How many blocks total will you need tobuild a 6-story building?
a. Build it and write the number here:
b. Now develop a pattern for entering itinto the TI-73. Write your pattern here:
✏____________________________
✏____________________________
c. Now check your pattern by entering itinto the TI-73 and pressing b 5times.
Did you get the right number of blocks? ✏____________________________
3. Using your TI-73 pattern, how many blockswill you need to build a 13-story building?
4. How many stories will you have if you use53 blocks?
✏____________________________
✏____________________________
5. How many stories will you have if you use54 blocks? ✏____________________________
➪
This pattern requires an odd number of
blocks, so you will not have a complete
building if you use 54 blocks.

30
Using the TI-73: A Guide for Teachers
Patterns and
Functions
© 1998 T
EXAS
I
NSTRUMENTS
I
NCORPORATED
Name
__________________________
1. Build the above pictures with pattern blocksor cutouts.
2. How many blocks total will you need tobuild a boat with 5 puffs of smoke?
a. Build it and write the number here:
b. Now develop a pattern for entering itinto the TI-73. Write your pattern here:
✏____________________________
✏____________________________
c. Now check your pattern by entering itinto the TI-73 and pressing b 4times.
Did you get the right number of blocks? ✏____________________________
3. Using your TI-73 pattern, how many blockswill you need to build a boat with 17 puffs ofsmoke?
4. How many puffs of smoke will you have ifyou use 37 blocks?
✏____________________________
✏____________________________

31
© 1998 T
EXAS
I
NSTRUMENTS
I
NCORPORATED
Activity 6
Major Martian
Headache
Students learn about patterning and writing simple
rules as they explore a hypothetical situation about
Martians.
Patterns
♦
patterning
♦
writing simple rules
Materials
♦
large marshmallows (heads)
♦
small marshmallows (antenna ends)
♦
toothpicks (antennas)
♦
paper and pencil
♦
TI-73
³
Setup
♦ Divide the class into groups and distribute 5 largemarshmallows to each student.
♦ Provide each group with a tray of toothpicks and adish of small marshmallows.
♦ Tell students:
There has been a recent discovery on the surface of
Mars. The Rover uncovered a tablet with Martian
inscriptions on it. After much decoding, scientists
have decided the tablet describes the physical
appearance of a Martian. Martians did apparently
have two antennas each. The tablet goes on to tell that
as the climate changed to much colder weather, the
Martians needed antenna muffs for each of their two
antennas.
♦ Ask students: If each Martian has two antennas, how
many antenna muffs will be needed for the entire
community of Martians?

32
Using the TI-73: A Guide for Teachers
Patterns
© 1998 T
EXAS
I
NSTRUMENTS
I
NCORPORATED
Activity
Have students perform the steps unless otherwiseindicated.
1. Make each large marshmallow into a Martian head bypoking 2 toothpicks on it and adding 2 smallmarshmallows to the tops of the toothpicks forantennas.
2. Starting with one Martian head, make a T-chart toshow how many heads and how many antennas. Anexample of the start of a T-chart follows.
# Martian
Heads
# Antennas
1
2
2
.
.
5
4
.
.
3. See if the students can see a pattern in their own 5Martian heads. Ask: What if we were to count
antennas in the entire classroom? Is there a fast way
to count them up?
Students can use the @ key to try their fast rule.
Example If students decided the rule was to add 2 antennas each time, then they would enter
- † (above the @ key)\ Z - lY @ Z @ (and continue puttingin the number of Martian heads and pressing @ until they get to 5)
See if this matches their T-charts. Students willprobably discover that for every marshmallow Martianhead, there are 2 times as many antennas.

Patterns
Activity 6: Major Martian Headache
33
© 1998 T
EXAS
I
NSTRUMENTS
I
NCORPORATED
4. Guide students to see that the rule for making antennamuffs is heads ¦ 2 = number of antenna muffs. Showstudents how this also can be written as X ¦ 2 =Y.
5. Ask students: If there are 67 Martians in a
community, how many antenna muffs would be
needed?
➪
The TI-73 displays the
multiplication symbol as an
asterisk ¦
.
6. On the TI-73, enter X ¦ 2 =Y into the Y= editor.
& I M Z
7. Explore for any given Martian community size by firstsetting up a table of values.
a. Access the TABLE SETUP screen.
- f (above the ' key)
b. Make sure the screen looks like the one shown atthe right (TblStart=0, @Tbl=1, Indpnt: Auto, Depend:Auto ).
8. Show on the TI-73 a table of values for the equation.
- i (above the * key)
9. Move around on the table and find the number ofantenna muffs needed for a community of 67 Martians.
$ and #
10. To find the number of antennas for even largercommunities, go back to the TABLE SETUP screen andchange TblStart to a larger amount, such as 1000.
- f
11. Display the table.
- i

34
Using the TI-73: A Guide for Teachers
Patterns
© 1998 T
EXAS
I
NSTRUMENTS
I
NCORPORATED
12. Tell students:
Digging deeper, the Rover found evidence of other
communities that had different numbers of
antennas.
13. Have your students repeat the above activity usingother numbers of antennas per Martian. See if they canwrite a rule for each.
Have them enter their rules in the Y= editor (&) anduse the table as before.
Wrap-up
Have students draw their Martians with a differentnumber of antennas and show how they adapt to theirenvironment. Have them include a description and therule for each.
Extensions
♦ Write problems telling other adaptations the Martiansmay have needed, such as more arms, toes, eyes, etc.
♦ Find the rules for each of their problems and exploreon the table for different community sizes.

35
© 1998 T
EXAS
I
NSTRUMENTS
I
NCORPORATED
Activity 7
The Dolphin
Students use ordered pairs to reproduce a picture of a
dolphin on the TI-73 screen, and then set up an
appropriate viewing window.
Geometry
♦
plotting ordered pairs
♦
connecting line graphs (xyLine)
Materials
♦
dolphin picture overlayed on a grid
(provided)
♦
transparency of provided dolphin
picture
♦
grid paper
♦
TI-73 ³
Setup
♦ On the grid paper, demonstrate how to draw the x- andy-axes.
♦ Have students draw and label the x- and y-axes ontheir papers. Ask: What do we call the intersection of
the x- and y-axes? (the origin)
♦ Have students label the origin on their graphs. (0,0)
♦ Review how to graph points on the coordinate grid.Begin at the origin. Ask: How do I graph (2,5), (5,2),
(-2,5), (5,-2), (2,-5), (-5,2), (-5,-2)?

36
Using the TI-73: A Guide for Teachers
Geometry
© 1998 T
EXAS
I
NSTRUMENTS
I
NCORPORATED
Activity
Have students perform the steps unless otherwiseindicated.
1. On the transparency of the dolphin picture, label the x-
and y-axes using whole numbers. Have students labeltheir copies, too.
2. Lead the class in a discussion of selecting the first fewkey points to make a dot-to-dot outline of the dolphin.Depending on the level of your students, these pointsmay be at whole number values, integral values, orfractional values.
3. Have students work with partners to complete the dot-to-dot outline of the dolphin. Ask: How could you get
the curved lines smoother? (select points closertogether, use fractional or decimal values forcoordinates)
➪
Depending on the level of
your students, the dolphin
may be in the first
quadrant only or it may be
in more than one quadrant.
4. On the transparency, label the points in alphabeticalorder and as ordered pairs counter-clockwise aroundthe outline of the dolphin. Have students label theircopies.
5. Record the coordinates of each of those points on asheet of paper.
➪
Remember, for a closed
figure, the first point’s
coordinates need to be
reentered as the last
point, also.
6. Using the TI-73, enter the x-coordinates of the dolphinoutline into L1 and the y-coordinates of the dolphinoutline into L2.
a. Display the List editor.
3
b. If necessary, clear L1.
$ to highlight L1
: b
➪
It is critical that students
enter the pairs of numbers
in the proper order,
because the order entered
is the order in which they
are plotted. You also need
to make sure that both
lists in each pair are the
same length ( L1
and L2
are the same length).
c. Starting from the first line in L1 , enter thex-coordinates. (You’ll get an error if L1 is stillhighlighted.) Press b after each list item.
d. Now follow the same procedure and enter they-coordinates in L2.

Geometry
Activity 7: The Dolphin
37
© 1998 T
EXAS
I
NSTRUMENTS
I
NCORPORATED
7. Set up the xyLine plot (connected line graph).
a. Access the STAT PLOTS menu.
- e (above the & key)
b. Select Plot 1 .
b
c. With the cursor blinking on the word On, select it.
b
d. Move to Type and select the xyLine plot (first row,second from left Ó).
# " b
e. Move to Xlist and select L1.
# - v b
f. Move to Ylist and select L2.
# - v # b
g. Move to Mark and select the . (dot) as the mark forthe xyLine plot.
# " " b
h. Set up the viewing window to match the part of thecoordinate grid that you used.
'
The values shown in the screen at the right are thestandard default values (( 6:Zstandard ). Formore information, see “Setting the WindowFormat” and “Defining Window Values” in theFunction Graphing chapter of the TI-73 Guidebook .
i. Turn on the grid.
- g # " b
j. Make sure the axes are turned on.
- g # # b
8. Display the picture of the dolphin.
*
You may want to link the student picture to theviewscreen calculator to display on the overhead.If you want to turn off the grid, press- g # b.
➪
Your students should learn
how to set up the
WINDOW, but you can use
(
7:ZoomStat to get
the ideal WINDOW values.
➪
If a student gets a dim
mismatch error, it means
that the 2 corresponding
lists have a different
number of elements. You
may also need to check the
Y= editor to clear or turn
off any functions (&
:
).

38
Using the TI-73: A Guide for Teachers
Geometry
© 1998 T
EXAS
I
NSTRUMENTS
I
NCORPORATED
Wrap-up
Have students compare their team’s picture graph withanother team’s picture. Have them discuss with theirpartner and the other team whether or not the graphs areexactly alike and why or why not.
➪
Students can press )
and then "
to view the
coordinates of each point
of their picture.
Assessment Suggestions
♦ Ask: What was represented by the numbers in L1 and
L2?
♦ Have students write a journal entry explaining whatthey learned.
Extensions
♦ Have students draw their own picture and label theordered pairs. Have them graph the drawings.
♦ Have students change the appearance of the dolphinwithout changing the data in the lists.
♦ Have students explore what happens if they reversethe x- and y-coordinates. (Change which list is theXlist and which is the Ylist in the Stat Plot setup.)
♦ If students want to store their picture to recall atanother time,
1. Turn off the axes.
- g # # " to AxesOff b
2. Access the DRAW STO menu and select StorePic .
2 " " b

Geometry
Activity 7: The Dolphin
39
© 1998 T
EXAS
I
NSTRUMENTS
I
NCORPORATED
3. Access the VARS menu and select Picture .
- } 4
4. At PICTURE, select where you want to store yourpicture.
b to select Pic1 or2 to select Pic2 or3 to select Pic3
♦ To recall the picture,
1. Turn off the axes.
- g # # " b
2. Starting at the Home screen (- l), go toDRAW STO and select RecallPic .
2 " " 2
3. Go to VARS and select Picture .
- } 4
4. Select where your picture is stored (Pic1 , 2 or 3).
5. Press *.

40
Using the TI-73: A Guide for Teachers
Geometry
© 1998 T
EXAS
I
NSTRUMENTS
I
NCORPORATED
41
© 1998 T
EXAS
I
NSTRUMENTS
I
NCORPORATED
Activity 8
Drip, Drip, Drip
S
tudents
collect
data from a dripping faucet
. Then,
using the TI-73, they
produce data on the
H
ome screen
.
Afterwards, they
view
the same
data
using a table
,
a
graph
,
and the Trace
feature.
Measurement
and Geometry
♦
rate of change
♦
volume
♦
graphs of equations
Materials
♦
student activity sheets (provided)
♦
sink with faucet or
large container
with a small hole
in lid
♦
watch with second hand
♦
container for collecting water
♦
measuring cups or cylinders
♦
TI-73
³
Activity
—
Part A
Have students perform the steps unless otherwiseindicated.
1. Turn on the faucet to a slow drip, and place acontainer to collect the water.
2. Record on the student activity sheet the exact timewhen you begin to collect the data.
3. Collect the data for 10 minutes.
4. During the collection, count and record the number ofdrops for any 2-minute period.
5. Use the TI-73 to calculate the number of drops perminute.
a. Go to the Home screen.
- l
b. Enter your 2-minute drip count and divide by 2.
Drip count F Z b
6. Measure the volume of the water collected in the10-minute period.
➪
If a faucet is not available,
a large container with a
small hole
can
be used
(p
lastic g
allon milk jug,
large can, etc.)
.
Leave the
lid on the container to get
a drip rather than a steady
stream of water.

42
Using the TI-73: A Guide for Teachers
Measurement and Geometry
© 1998 T
EXAS
I
NSTRUMENTS
I
NCORPORATED
7. Ask students:Why did we count for 2 minutes? (Ten minutes is along time to count. Counting for 2 minutes allows youto get an average for 1 minute. Counting for 3 or 4minutes might give a more accurate average perminute, but it might be too long for your students.)
Could you calculate the volume of each drop?
(volume of water / number of drops)
How much water would be collected in 1 hour? In 1
day?
What changes to increase the total amount of water?
(time)
What is the variable in this problem? (the number ofhours)
➪
A T-chart may help
students see the change.
8. Use the above questions to have students help youdevelop the formula for the following situation. Sincethe amount of water that would be collected changeswith the number of hours you are collecting it, youcould write an equation to describe this occurrence.
The volume of water equals the amount of water thatwould be collected in 1 hour times the number ofhours.
Y= (amount of water collected in one hour) ¦ X ➪
The TI-73 displays the
multiplication symbol as an
asterisk ¦
.
9. Enter the equation in the Y= editor (&).
Example If your calculation were two cups of water per hour, your equation would be Y = 2X (Z I). (See screen at the right.)
10. To view this graph, set up an appropriate, friendlyviewing window.
'Enter the numbers as shown in the screen at the right.Use # to move down the fields.
(For more information about the viewing window, see“Setting the Window Format” and “Defining WindowValues” in the Function Graphing chapter of the TI-73
Guidebook .)
➪ @X
is determined by the TI-
73, depending on what you
entered for Xmin
and
Xmax
.

Measurement and Geometry
Activity 8: Drip, Drip, Drip
43
© 1998 T
EXAS
I
NSTRUMENTS
I
NCORPORATED
11. View and trace the graph.
* )! or " to trace until X=0
Ask: What is the value of Y? What does this point
represent? (When time = 0, there is no water.)
12. Now look at this same information in a table.
- f (above the ' key)
The screen should look like the one at the right.
- i (above the * key)
13. Scroll down (#) in the X column to 24.Ask:What is in the Y1 column?
What does this value mean?
Is this the same amount of water that you calculated
on the Home screen for 1 day?➪
If you want to go directly
to X=24, set your table
start (TblStart
) to 24 on
the TABLE SETUP
screen
(-
f
).
Wrap-up for Part A
♦ Using the table, have students answer these questions.How much water would be wasted if the drip
continued over a weekend?
How much water would be wasted over the Christmas
holiday?
How much water would be wasted in a year?
How long would it take to fill our classroom with
water?
♦ Make sure students have completed their activitysheets.

44
Using the TI-73: A Guide for Teachers
Measurement and Geometry
© 1998 T
EXAS
I
NSTRUMENTS
I
NCORPORATED
Activity
—
Part B
Have students perform the steps unless otherwiseindicated.
1. Ask students: If the faucet were dripping twice as
fast, what would be the volume after 1 hour? After 2
hours?
2. Tell students to predict what the graph of this equationwould look like compared to the graph in Part A, step11.
3. Use the Manual-Fit function to plot these data pointsfor 1 hour and 2 hours.
a. First, change the settings for the viewing window.
'Enter the numbers as shown in the screen at theright. Use # to move down the fields.
b. Now return to the Home screen and clear a line.
- l to return to the Home screen: to clear a lineBe sure you’re on a clear line because Manual-Fitmust display on its own line.
c. Access the - v CALC menu and selectManual-Fit .
- v " " " [
d. Access the - } menu and select Y1.
- } (above the 9 key)Z b
e. Now display the graph.
b
If you change your mind after pressing b,you’ll have to press ^ to get out of the Manual-Fitscreen.

Measurement and Geometry
Activity 8: Drip, Drip, Drip
45
© 1998 T
EXAS
I
NSTRUMENTS
I
NCORPORATED
f. Now select the first point on the line.
" until X=1$ until Y=4b to select the first point on the line
g. Select the second point on the line.
" until X=2$ until Y=8b to select the second point
The screen shows the expression for the line.
h. Save the line.
b
4. Turn on Trace .
* ).
Ask: Was your prediction correct?
5. Investigate if the drip were half as fast. Use the sameprocedure as above to place a manual-fit line on thegraph and paste the expression into the Y= editor.
Extensions
If there are approximately 55,000,000 homes in North
America and each has one dripping faucet, how much
water is wasted per day? Per year?

46
Using the TI-73: A Guide for Teachers
Measurement and Geometry
© 1998 T
EXAS
I
NSTRUMENTS
I
NCORPORATED
Name
_______________________
Date
_______________________
Activity 8
Drip, Drip, Drip
Activity
—
Part A
1.
Record start time. ✏
__________________________
2.
How many drips did you count in 2 minutes? ✏
__________________________
3.
How much water did you collect in 10 minutes? ✏
__________________________
4.
Wha
t did you calculate for number of drips in
1 minute? ✏
__________________________
5.
How much water would be collected in 1 hour? ✏
__________________________
In 1 day? ✏
__________________________
6.
What changes to increase the total amount
of water? ✏
__________________________
7.
What is the variable in this problem? ✏
__________________________
8.
Describe, in words, the rate of change in
this problem. ✏
__________________________
9.
Translate your description in words into a
math sentence (an equation). ✏
__________________________

Measurement and Geometry
Activity 8: Drip, Drip, Drip
47
© 1998 T
EXAS
I
NSTRUMENTS
I
NCORPORATED
Name
_______________________
Activity
—
Part B
1.
If the faucet were dripping twice as fast, what
would be the volume after 1 hour? ✏
__________________________
After 2 hours? ✏
__________________________
Write these as data points. ✏
__________________________
2.
Predict what the graph of this equation would
look like compared to our graph. Sketch the graph
on the screen at the right.
Use
Manual-Fit
to plot these data points.
3.
Paste this equation into t
he Y= editor and view
the graph.
Did the graph match your prediction? ✏
__________________________
4.
Investigate if the drip were half as fast.

48
Using the TI-73: A Guide for Teachers
Measurement and Geometry
© 1998 T
EXAS
I
NSTRUMENTS
I
NCORPORATED

49
© 1998 T
EXAS
I
NSTRUMENTS
I
NCORPORATED
Activity 9
Only the Height
Has Been Changed
Students collect data and examine variables that may
cause a change in the distance a toy car will travel on
the floor when it is rolled down a ramp.
Measurement
♦
length
♦
mean
♦
collecting data
♦
graphing
Materials
♦
ruler
♦
yardstick, meterstick, or measuring
tape
♦
ramp (cardboard or wood) - length
should be divisible by 6
♦
toy car
♦
student activity sheet (provided)
♦
TI-73 ³
Setup
♦ Ask students:Have you ever made a ramp for your bicycle?
What angle was the best?
If your ramp were straight up, what would happen?
If your ramp were lying flat, what would happen?
♦ Tell students that they are going to investigate how theheight of a ramp will affect the distance that a toy carwill travel when it rolls down the ramp.
♦ Divide the students into groups, with group membershaving the following responsibilities.
• One student will hold a ruler perpendicular to thefloor.
• One or two students will hold the ramp with oneend touching the ruler and the other end on thefloor.
• One student will release the car from the top of theramp.
• One student will measure the distance the cartravels from the end of the ramp on the floor towhere the car stops on the floor.

50
Using the TI-73: A Guide for Teachers
Measurement
© 1998 T
EXAS
I
NSTRUMENTS
I
NCORPORATED
Activity
Have students perform the steps unless otherwiseindicated.
1. As a class, measure the ramps. They should all be thesame length.
2. Divide the length by 6 so students have 5 differentintervals to test their ramp height. (For example, if theramp is 24cm, the intervals would be 4cm, 8cm, 12cm,16cm, and 20cm. Zero cm would be flat and 24cmwould be straight up. If you wish to use inches, forexample, a 12-inch ramp, the intervals would be 2 in., 4in., 6 in., 8 in., and 10 in.)
3. Make predictions of the height of the ramp that willmake the car roll the longest distance.
4. Test each height and record it on the student activitysheet.
5. Ask students: At what height did your car roll the
longest distance? The shortest distance?
Find out the distances for all groups.
6. Set up a graph on the board by asking students thefollowing questions.What is the lowest ramp height? (zero)
Highest ramp height? (straight-up position)
What are the intervals in between? Set these numbersup on the vertical line of the graph.
What should we label the vertical line or y-axis?
(Height of ramp)
What is the shortest distance the car traveled?
What is the longest distance the car traveled?
How should we set up the numbers in between? (asequal intervals) This will go on the horizontal line ofthe graph.
What should we label the horizontal line or x-axis?
(Distance the car traveled)
7. Using the group data, create a horizontal bar graph onthe student activity sheet graph.

Measurement
Activity 9: Only the Height Has Been Changed
51
© 1998 T
EXAS
I
NSTRUMENTS
I
NCORPORATED
8. Now using the TI-73, create a horizontal bar graph, andthen compare it to the graph made on the activitysheet.
a. In L1, enter the ramp heights from 0 to the straight-up position.
(1) Display the List editor.
3
(2) If necessary, clear L1.
$ to highlight L1
: b
(3) Enter each ramp height. Press b after eachentry.
b. Now follow the same procedure to enter in L2 thegroup data showing the distance the car traveled.
The screen at the right shows an example ofstudent data in list format.
c. Now set up the bar graph.
(1) Access the STAT PLOTS menu.
- e (above the & key)
(2) Select Plot 1 .
b
(3) With the cursor blinking on the word On, selectit.
b
(4) Move to Type and select the bar graph (firstrow, last icon from left Ð).
# " " " b
(5) Continue setting up the rest of your TI-73screen to match the one shown at the right.Use - v to select L1, L2, L3, and L4. Pressb at Hor and at 1.

52
Using the TI-73: A Guide for Teachers
Measurement
© 1998 T
EXAS
I
NSTRUMENTS
I
NCORPORATED
9. Before graphing, set up the viewing window for eachTI-73 (').
• Xmin will be 0.
• Xmax will be the height of the ramp straight up plus5 (so you can see the full graph).
• Ymin will be 0.
• Ymax will be the longest distance a car traveledplus 5.
For more information, see “Setting the WindowFormat” and “Defining Window Values” in theFunction Graphing chapter of the TI-73 Guidebook .
➪
The Xmax
and Ymax
values
shown here are
just
examples.
10. Display the graph and discuss the data. Have studentscompare this graph to the graph they made on theiractivity sheets.
* )$ and # to view data
Wrap-up
♦ Combine class data and calculate the mean for eachheight using an overhead calculator. Do this on theHome screen of the TI-73 using traditional methods.
♦ Graph the class data on the overhead and compare theclass graph to the individual group graphs.
Assessment Suggestions
Discuss as a class or have students write in their journals:What is similar in all the graphs?
Are there differences? What could have caused these
differences?
Would a shorter or longer ramp affect the data?
Would a smaller or larger car affect the data? How?
Extension
Test the affect of varying the ramp length, car size orweight, or floor.

Measurement
Activity 9: Only the Height Has Been Changed
53
© 1998 T
EXAS
I
NSTRUMENTS
I
NCORPORATED
Name
__________________________
Date
__________________________
Activity 9
Only the Height
Has Been ChangedL1
Height of the RampHeight of the Ramp
L2
Distance the CarDistance the Car
TraveledTraveled
(flat) 0
0
(straight up)
0
Distance the car traveled
Hei
ght o
f ram
p
Straight up
Flat

54
Using the TI-73: A Guide for Teachers
Measurement
© 1998 T
EXAS
I
NSTRUMENTS
I
NCORPORATED

55
© 1998 T
EXAS
I
NSTRUMENTS
I
NCORPORATED
Activity 10
Give Me 5!
Probability
♦
order of operations
♦
mental math
♦
basic computation
Students investigate the results of tossing 5 coins.
They compare what happens to what is expected to
happen.
Materials
♦
student activity sheets (provided)
♦
TI-73 ³
Setup
♦ If your TI-73s have not been used for any randomnumbers prior to this activity, you and your studentsneed to store an integer “seed value” to rand in eachTI-73.
With each rand execution, the TI-73 generates thesame random-number sequence for a given seed value.The TI-73 factory-set seed value for rand is 0. Togenerate a different random-number sequence, storeany non-zero seed value to rand .
➪
If you do not enter a seed
value, rand
uses whatever
value happens to be the
current seed. If there is no
seed, it uses the factory-
set value of
0
.
1. Enter the number you want for your seed value.Have students use different seed values. (In theexample at the right, 1 is used.)
2. Now press X 1 " " 1 b1 " " 1 b b.
(For more information about seed values, refer to the“1 Probability Menu” section in the Math chapterof the TI-73 Guidebook .)
♦ Discuss with students events that are equally likely tooccur, such as tossing a coin and getting a head or atail.
➪
If you want to restore the
factory-set seed value,
store 0
to rand
or reset
the defaults.
56
Using the TI-73: A Guide for Teachers
Probability
© 1998 T
EXAS
I
NSTRUMENTS
I
NCORPORATED
Activity
—
Part A
Have students perform the steps unless otherwiseindicated. Have them play the game “Get Ahead with MoreHeads.” The instructions follow.
1. Group students into pairs.
2. Using the coin-toss function of the TI-73, toss 5 coins.
a. Return to the Home screen.
- l
b. Access the Math menu and select coin .
1 " " S
c. Toss 5 coins.
R E b
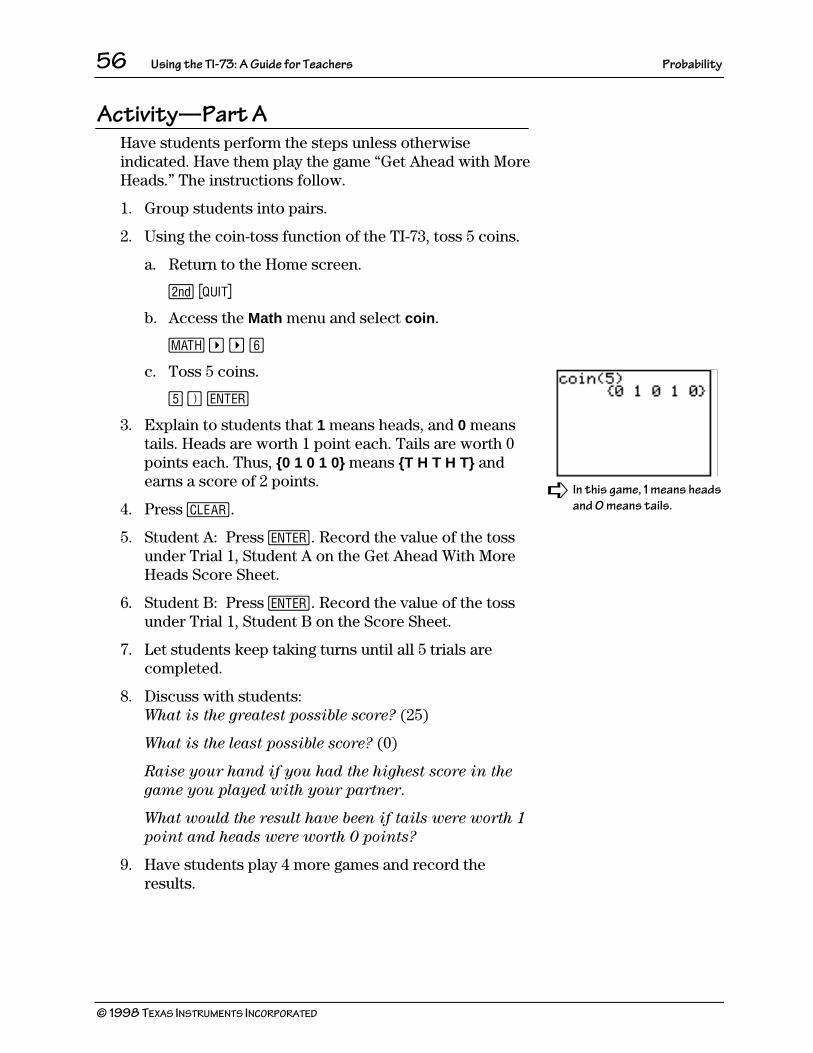
3. Explain to students that 1 means heads, and 0 meanstails. Heads are worth 1 point each. Tails are worth 0points each. Thus, {0 1 0 1 0} means {T H T H T} andearns a score of 2 points.
4. Press :.
5. Student A: Press b. Record the value of the tossunder Trial 1, Student A on the Get Ahead With MoreHeads Score Sheet.
6. Student B: Press b. Record the value of the tossunder Trial 1, Student B on the Score Sheet.
7. Let students keep taking turns until all 5 trials arecompleted.
➪
In this game,
1
means heads
and
0
means tails.
8. Discuss with students:What is the greatest possible score? (25)
What is the least possible score? (0)
Raise your hand if you had the highest score in the
game you played with your partner.
What would the result have been if tails were worth 1
point and heads were worth 0 points?
9. Have students play 4 more games and record theresults.

Probability
Activity 10: Give Me Five
57
© 1998 T
EXAS
I
NSTRUMENTS
I
NCORPORATED
10. Discuss with students:How many total trials did you and your partner
have?
Raise your hand if you had a 5-point toss. Raise
your hand if you had a 0-point toss.
Which score on a single trial would you predict is
more likely to occur, 0 or 5?
Out of the 50 trials, how many trials would you
predict to be worth 5 points?
11. Record group data in the Coin-Toss Trials Small GroupData table provided.
To calculate the probability, use:
# of times event occurred / total # of trials
12. Add the probability column, and then discuss why thesum is 1.
13. Convert the probability fraction to decimal form usingthe > key. Record this in the decimal column of theSmall Group Data table.
➪
Students should record
probabilities as
unsimplified fractions and
also in simplest fractional
form. Verify the total
number of trials as 50 by
adding the frequency
column.
14. Ask students:How do the probabilities between your group and
other groups compare?
Does one outcome seem to be more probable than
others?
Is one less probable?
15. Collect the class data and have students record it inthe Class Data table.
16. Enter the class data into the TI-73 using lists. Use L1
for the points and L2 for the frequencies.
a. Display the List editor.
3
b. If necessary, clear L1.
$ to highlight L1
: b
➪
In the student pairs, have
Student A call out
frequencies for points on
each roll while Student B
keeps a running total of the
frequencies either mentally
or with the
TI-73.

58
Using the TI-73: A Guide for Teachers
Probability
© 1998 T
EXAS
I
NSTRUMENTS
I
NCORPORATED
c. Starting from the first line in L1, enter the possiblepoints as shown in the screen at the right. (You’llget an error if L1 is still highlighted.) Press bafter each list item.
d. Follow the same procedure to enter the class datainto L2.
17. Now graph a histogram.
a. Access the STAT PLOTS menu.
- e (above the & key)
b. Make sure the other plots are off.
Q b
c. Select Plot 1 .
- e b
d. With the cursor blinking on the word On, select it.
b
e. Move to Type and select the histogram (secondrow, second from left Ò).
# " " " " " b
f. Move to Xlist . If L1 is not already set, set it to L1.
# - v b
g. Move to Freq . If L2 is not already set, set it to L2.
# - v Z
Your screen should look like the one at the right.
h. Set up the viewing window.'Enter the numbers as shown in the screen at theright. Use # to move down the fields.Change Ymax to match your class data.Set Ymin to -50 so that both the values and thegraph show during tracing.
➪
Note that @X
is
determined by the TI-73,
depending on what is
entered for Xmin
and
Xmax
. Xscl
represents the
width of the bar on the
histogram.

Probability
Activity 10: Give Me Five
59
© 1998 T
EXAS
I
NSTRUMENTS
I
NCORPORATED
18. Turn on trace.
)! and " to move along the histogram
Discuss the following questions.In our class data, which outcomes are least likely?
Which outcomes are most likely?
Compare this to your small group data. Is it the
same? If not, what makes the difference? (sample size)
Wrap-up for Part A
♦ Ask students: Which scores on a single toss are
equally likely (have the same probability)?
♦ Have students list the ways to get a sum of 1.(H T T T T T H T T T T T H T T T T T H TT T T T H)
♦ Now have students list the ways to get a sum of 4 toverify that the sums of 1 and 4 are equally likely.(H H H H T H H H T H H H T H H H T H H HT H H H H)
Assessment Suggestion for Part A
Have students record in their journals how theydetermined which outcomes were most or least likely tooccur.
Activity
—
Part B (for Advanced Classes)
Have students perform the steps unless otherwiseindicated.
1. Discuss the difference between the probabilities thatwere gathered (experimental probabilities) and theprobabilities that should have happened (theoretical
probabilities).
2. Use the tree diagram on the activity sheet to find theexpected (theoretical) probabilities and record themon the activity sheet.

60
Using the TI-73: A Guide for Teachers
Probability
© 1998 T
EXAS
I
NSTRUMENTS
I
NCORPORATED
3. Compare the group experimental probabilities with thetheoretical probabilities from the tree diagram.
a. Go to L3 and calculate the group probabilities bydividing each entry in L3 by the total number oftrials (sum of L2 ).
3 " $ to highlight L3 (See screen at the right.)- v Z F - v " " J- v Z E b
b. In L4 enter the frequencies from the tree diagram.(See screen at the right.)
" to the first line of L4
Enter the frequencies from the tree diagram. Pressb after each list item.
c. Then in L5, find the theoretical probabilities bydividing the frequencies in L4 by the total of L4,which is 32.
" $ to highlight L5
- v Q F - v " " J- v Q E b
➪
Counting the frequency of
the points on the tree
diagram resulted in the
frequencies listed in L4
.
4. Compare the experimental probabilities in L3 to thetheoretical probabilities in L5. (See screen at the right.)
Wrap-up for Part B
Have students write in their journals the differencebetween experimental and theoretical probability.
Assessment Suggestion for Part BAsk students: Suppose you toss 4 coins. How many
heads are most likely to occur? Explain.
Extensions♦ Find the probability of two equally likely events using
combinations in Pascal’s Triangle.
♦ Plot a histogram using the theoretical probabilities.
♦ Draw a pie chart comparing frequencies to totalnumber of possible outcomes.

Probability
Activity 10: Give Me Five
61
© 1998 T
EXAS
I
NSTRUMENTS
I
NCORPORATED
Activity 10
Give Me 5!
Name
__________________________
Date
__________________________
Get Ahead With More HeadsScore Sheet
Student
Trial
#
A
B
A
B
A
B
A
B
A
B
11
22
33
44
55
TotalTotal
Coin-Toss TrialsSmall Group Data
Points each rollPoints each roll
FrequencyFrequency
Probability-fractionProbability-fraction
Probability-decimalProbability-decimal
0 (0 H, 5 T)0 (0 H, 5 T)
1 (1 H, 4 T)1 (1 H, 4 T)
2 (2 H, 3 T)2 (2 H, 3 T)
3 (3 H, 2 T)3 (3 H, 2 T)
4 (4 H, 1 T)4 (4 H, 1 T)
5 (5 H, 0 T)5 (5 H, 0 T)
Total number of trials
—
50

62
Using the TI-73: A Guide for Teachers
Probability
© 1998 T
EXAS
I
NSTRUMENTS
I
NCORPORATED
Name
__________________________
Coin-Toss TrialsClass Data
Points each
toss
Frequency
Probability -
fraction
Probability -
decimal
Percent
equivalent
0
1
2
3
4
5
Totals
Theoretical Probability of Tossing 5 Coins
Pts each
toss
Freq
Prob
0
1
2
3
4
5
H 5 H, H, H, H, H = 1 + 1 + 1 + 1 + 1 = 5T 5 H, H, H, H, T = 1 + 1 + 1 + 1 + 0 = 4
H 5 H, H, H, T, H = 1 + 1 + 1 + 0 + 1 = 4T 5 H, H, H, T, T = 1 + 1 + 1 + 0 + 0 = 3H 5 H, H, T, H, H = 1 + 1 + 0 + 1 + 1 = 4T 5 H, H, T, H, T = 1 + 1 + 0 + 1 + 0 = 3H 5 H, H, T, T, H = 1 + 1 + 0 + 0 + 1 = 3
T 5 H, H, T, T, T = 1 + 1 + 0 + 0 + 0 = 2H 5 H, T, H, H, H = 1 + 0 + 1 + 1 + 1 = 4T 5 H, T, H, H, T = 1 + 0 + 1 + 1 + 0 = 3H 5 H, T, H, T, H = 1 + 0 + 1 + 0 + 1 = 3
T 5 H, T, H, T, T = 1 + 0 + 1 + 0 + 0 = 2H 5 H, T, T, H, H = 1 + 0 + 0 + 1 + 1 = 3T 5 H, T, T, H, T = 1 + 0 + 0 + 1 + 0 = 2H 5 H, T, T, T, H = 1 + 0 + 0 + 0 + 1 = 2
T 5 H, T, T, T, T = 1 + 0 + 0 + 0 + 0 = 1
H
T
H
T
H
T
H
T
<
<
<
<
<
<
<
<
H
T
H
T
H
T
H
H 5 T, H, H, H, H = 0 + 1 + 1 + 1 + 1 = 4T 5 T, H, H, H, T = 0 + 1 + 1 + 1 + 0 = 3H 5 T, H, H, T, H = 0 + 1 + 1 + 0 + 1 = 3
T 5 T, H, H, T, T = 0 + 1 + 1 + 0 + 0 = 2H 5 T, H, T, H, H = 0 + 1 + 0 + 1 + 1 = 3T 5 T, H, T, H, T = 0 + 1 + 0 + 1 + 0 = 2H 5 T, H, T, T, H = 0 + 1 + 0 + 0 + 1 = 2
T 5 T, H, T, T, T = 0 + 1 + 0 + 0 + 0 = 1H 5 T, T, H, H, H = 0 + 0 + 1 + 1 + 1 = 3T 5 T, T, H, H, T = 0 + 0 + 1 + 1 + 0 = 2H 5 T, T, H, T, H = 0 + 0 + 1 + 0 + 1 = 2
T 5 T, T, H, T, T = 0 + 0 + 1 + 0 + 0 = 1H 5 T, T, T, H, H = 0 + 0 + 0 + 1 + 1 = 2T 5 T, T, T, H, T = 0 + 0 + 0 + 1 + 0 = 1H 5 T, T, T, T, H = 0 + 0 + 0 + 0 + 1 = 1T 5 T, T, T, T, T = 0 + 0 + 0 + 0 + 0 = 0
H
T
H
T
H
T
H
T
<
<
<
<
<
<
<
<
H
T
H
T
H
T
T
Total number of
outcomes_______

63
© 1998 T
EXAS
I
NSTRUMENTS
I
NCORPORATED
Activity 11
A Foot is a Foot
–
Or is It?
Students investigate how their own foot measurements
compare to the customary measurement of a foot
(12 inches).
Probability and Statistics
♦
mean
♦
conversion of fractions to decimals
♦
measurement
Materials
♦
ruler
♦
student activity sheet (provided)
♦
TI-73 ³
Setup
♦ Tell students that the dictionary defines foot, as itrelates to measurement, as a measure of length equalto 12 inches based on the average length of a humanfoot.
♦ Have students investigate this definition to see if theaverage human foot is equal to 12 inches, or a foot.
Ask questions to guide the students to determine howthey will investigate this definition. Decide as a classyour answers to these questions:How will we find out if this statement is true?
Who will we survey (measure)?
What will we ask them?
Should we only survey students? (You will probablywant to include adults in the survey.)
How many people should we survey?
Could we find out this information without a
survey? Where could we find it?

64
Using the TI-73: A Guide for Teachers
Probability and Statistics
© 1998 T
EXAS
I
NSTRUMENTS
I
NCORPORATED
♦ Demonstrate to students how to measure a foot, fromheel to toe, so that everyone is measuring the same.Ask:What unit should we use to measure? (inches)
What if there are parts of an inch left? Will we recordit as a decimal or fraction? (Fraction would probablybe easiest for this part.)
Do we need to measure both feet or just one foot?
Should we measure with the shoe on or off?
Activity
Have students perform the steps unless otherwiseindicated.
1. Have each student measure 20 people, or the numberof people that the class decides to measure. Studentsneed to decide how many adults and how manychildren they will measure. They may use the activitysheet provided to organize their data.
2. Once students have collected data, ask:What is an average?
How will we find out if the average foot size in our
survey is 12 inches, or a foot? (Add them all togetherand divide by the number of feet measured.)
How will we add the fractional parts? (If you wish,you can convert them to decimals using the TI-73. Seethe example in the next step.)
3. Find the averages from the data.
a. Go to the Home screen.
- l
b. Convert fractions to decimals by using the > keyon the TI-73.
Example To convert 12¼ inches to a decimal,enter Y Z < Y = Q > b.
c. From the Home screen, find the mean usingtraditional methods.

Probability and Statistics
Activity 11: A Foot is a Foot
–
Or is It?
65
© 1998 T
EXAS
I
NSTRUMENTS
I
NCORPORATED
4. Now enter the data into a list (L1), and then find themean.
a. Display the List editor.
3
b. If necessary, clear L1.
$ to highlight L1
: b
c. Starting from the first line in L1, enter each length.(You’ll get an error if L1 is still highlighted.)Remember to press b after each entry.
d. Find the mean of the data in L1.
(1) Return to the Home screen.
- l
(2) Access the - v MATH menu and selectmean .
- v " " [ (pastes mean( to the Homescreen)
(3) Calculate the mean.
- v b (selects L1)E b
5. Ask students to analyze their data:Was your mean from L1 the same as the mean from
the Home screen?
Did everyone find the same average foot size in their
survey? Why or why not?
Would our results be more accurate if we combined
the class data?
How can we combine the data?
Should we combine all the lengths and then find the
mean, or could we combine all the means and find
the mean of that? Would we get the same answer both
ways?

66
Using the TI-73: A Guide for Teachers
Probability and Statistics
© 1998 T
EXAS
I
NSTRUMENTS
I
NCORPORATED
6. Combine the class data by either combining theindividual foot lengths and finding the mean or byaveraging the individual means. (It may be beneficialfor students to do it both ways so students can see ifthe same answer comes up both ways).
7. Now enter the combined data into a list (L2), and thenfind the mean.
a. Display the List editor.
3
b. If necessary, clear L2.
$ to highlight L2
: b
c. Starting from the first line in L2, enter each length.(You’ll get an error if L2 is still highlighted.)Remember to press b after each entry.
d. Find the mean of the data in L2.
(1) Return to the Home screen.
- l
(2) Access the - v MATH menu and selectmean .
- v " " [ (pastes mean( to the Homescreen)
(3) Calculate the mean.
- v Z (selects L2)E b

Probability and Statistics
Activity 11: A Foot is a Foot
–
Or is It?
67
© 1998 T
EXAS
I
NSTRUMENTS
I
NCORPORATED
Wrap-up
Ask students:Was the mean of the combined data from L2 the same as
the mean from the Home screen?
What does our combined class data show?
Is the statement true that the average length of a human
foot is 12 inches, or a foot?
Do you think our class data is accurate?
How could we make it even more accurate?
Where could we find data without measuring feet?
Do you think average foot sizes differ around the world?
How could we find out?
Assessment Suggestions
♦ Have students find averages of other sets of data, suchas average arm length in the class, and so on.
♦ Have students write about the definition from thedictionary and support or disprove the statement usingtheir class data.
Extensions
♦ Find the average adult foot size and compare it to theaverage child foot size.
♦ Research other countries and find out if average footlengths differ around the world. Make speculations asto why foot lengths differ.

68
Using the TI-73: A Guide for Teachers
Probability and Statistics
© 1998 T
EXAS
I
NSTRUMENTS
I
NCORPORATED
Name
__________________________
Date
__________________________
Activity 11
A Foot is a Foot
–
Or is It?
Name
(indicate child or adult)
Length of foot in inches
(use fractions for leftovers)
Convert fractions to
decimals
Mean of my data __________________
Mean of class data ________________
Does our class data support the statement that the average human foot is 12 inches long?____

69
© 1998 T
EXAS
I
NSTRUMENTS
I
NCORPORATED
Activity 12
Which Brand Is Best?
In this real-world activity, students comparison shop in
their community. Then they produce consumer reports
to share their findings with their class.
Probability and Statistics
♦
measures of central tendency (mean,
median, mode, range, quartiles)
♦
graphs (box plot, pictograph, bar
graph, pie chart)
♦
tables
Materials
♦
student activity sheets (provided)
♦
TI-73
³
Setup
♦ Explain to students that they need to find 5 or moredifferent brand names of the same product. Then theyneed to record the brands and prices for the productchosen (no purchase necessary).
Example
Brand Names
Prices
Brand A
$1.89
Brand B
$2.25
Brand C
$1.89
Brand D
$1.86
Brand E
$1.97
➪
Make sure that the 5
prices the students list
are not all the same.
♦ Allow 2 to 3 days for each student to “shop” and selecta product to research.

70
Using the TI-73: A Guide for Teachers
Pr
obability and Statistics
© 1998 T
EXAS
I
NSTRUMENTS
I
NCORPORATED
Activity
Have students perform the steps unless otherwiseindicated.
1. On the activity sheets provided, have students usetheir information to report the minimum and themaximum prices of the product they selected, themode, the mean, the median, and the range of prices.
a. First, enter the prices into List 1 (L1) on the TI-73,and set the decimal to the hundredths place.
(1) Display the List editor.
3
(2) If necessary, clear L1.
$ to highlight L1
: b
(3) Starting from the first line in L1, enter eachprice. (You’ll get an error if L1 is stillhighlighted.) Press b after each price.
(4) Now set the decimal to the hundredths place.
. # " " " b
(5) Go to the Home screen.
- l
b. Now find the minimum price.
(1) Access the - v MATH menu and selectmin .
- v " "b (pastes min( to the Home screen)
(2) Calculate the minimum price.
- v b (selects L1)E b
c. Follow the same procedure in step b for themaximum (2:max( ), mean (3:mean( ), median
(4:median( ), and mode (5:mode( ).

Probability and Statistics
Activity 12: Which Brand is Best?
71
© 1998 T
EXAS
I
NSTRUMENTS
I
NCORPORATED
2. Calculate the range.
3. Now make a box plot on the TI-73.
a. Access the STAT PLOTS menu.
- e (above the & key)
b. Make sure the plots are off.
4 b
c. Select Plot 1 .
- e b
d. With the cursor blinking on the word On, select it.
b
e. Move to Type and select the box plot (second row,third from left Ö).
# " " " " " " b
➪
One way to find the range
is shown in the screen
below.
f. Move to Xlist . If L1 is not already set, set it to L1.
# - v b
g. Move to Freq . If 1 is not already set, set it to 1.
# Y
Your screen should match the screen at the right.
h. Turn off any Y= functions.
& :
4. View the box plot.
( J
Note that you may need to change the Ymin and Ymaxvalues to 1 and 10, respectively, to match the screenshown at the right.
' # to Ymin Y# to Ymax Y _( J

72
Using the TI-73: A Guide for Teachers
Pr
obability and Statistics
© 1998 T
EXAS
I
NSTRUMENTS
I
NCORPORATED
5. Move around the graph and see the data.
)! and " to view data
➪
A nice connection is to
compare the trace values
for Xmin
, median
, and
Xmax
with their calculated
values.
6. Have students sketch and label their plot on paper fortheir report. (If you have TI-73 TI-GRAPH LINKé,students may print their graphs to color and label.)
7. Have students poll 50 people (students, teachers, andother adults) to find out which of the brands theywould actually buy. Have them record the responses inthe table provided on the activity sheet.
Students should try to poll those who would actuallywant to buy the product. They should ask the personwhy they chose that brand and include their responseswith their student analyses.
Example poll
Product Type:
Brand Name
Price
Tally for each choice
1. Brand A
$1.89
lllll lllll lllll ll
2. Brand B
$2.25
lllll lllll lllll lllll
3. Brand C
$1.89
lllll
4. Brand D
$1.86
lll
5. Brand E
$1.98
llll
8. In the table on the activity sheet, have students recordthe name of their product, the frequency, and their pollresults as a fraction, decimal, and percent.
➪
You can use =
to enter
fractions (numerator =
denominator "
) and >
to convert them to
decimals.
Example table
Brand Name
Frequency
Fraction
Decimal
Percent
Brand A
17
17/50
0.34
34%
Brand B
21
21/50
0.42
42%
Brand C
5
5/50
0.10
10%
Brand D
3
3/50
0.06
6%
Brand E
4
4/50
0.08
8%

Probability and Statistics
Activity 12: Which Brand is Best?
73
© 1998 T
EXAS
I
NSTRUMENTS
I
NCORPORATED
9. Now enter the surveyed information into the TI-73.
a. Enter the brand names in L2. (In this example, weuse the brand names from the example table.)
3 " to L2 - t # #, and then" until " b$ $, and then ! until A b# # # # to Done b b(Because " is only needed for the first element of acategorical list, you can enter the rest of theelements from the Text editor without it.)
b. Before entering the frequency, go back to modeand highlight Float .
. # to Float b
c. Now enter the tally.
3 " to L3 and enter the frequency
d. Go to the Home screen.
- l
10. Make a pictogram on the TI-73.
a. Access the STAT PLOTS menu.
- e (above the & key)
b. Make sure the other plots are off.
Q b
c. Select Plot 1 .
- e b
d. With the cursor blinking on the word On, select it.
b
e. Move to Type and select the pictogram (first row,third from left Î).
# " " b
f. Move to CategList . If L2 is not already set, set it toL2.
# - v Z

74
Using the TI-73: A Guide for Teachers
Pr
obability and Statistics
© 1998 T
EXAS
I
NSTRUMENTS
I
NCORPORATED
g. Move to Data List . If L3 is not already set, set it toL3.
# - v [ b
h. Continue setting up the plot. Your screen shouldlook like the screen at the right. Press b at Vertand at the $ icon.
➪ Scale
tells the TI-73 the
value or quantity each icon
represents. The display
shows a maximum of 7
icons. Choose your scale
based on the largest
number in your data list, or
you can select (
7:ZoomStat
and the TI-73
will select a scale for you.
The largest data number
divided by the scale must
be less than or equal to 7.
For example, if the largest
data number is 21 then
chose a scale of 3 because
21/3 �
7.
11. View the pictogram.
*
12. Now move around the graph and see the data.
)! and " to view data
13. Have students sketch their graphs on paper for theirreport. (If you have TI-73 TI-GRAPH LINKé, studentsmay print their graphs to color and label.)
14. Make a bar graph on the TI-73 showing the frequencyresults of the polls.
a. Access the STAT PLOTS menu.
- e (above the & key)
b. Make sure the other plots are off.
Q b
c. Select Plot 2 .
- e Z b

Probability and Statistics
Activity 12: Which Brand is Best?
75
© 1998 T
EXAS
I
NSTRUMENTS
I
NCORPORATED
d. Select the bar graph Ð (first row, last from left)and continue setting up the plot as in the picture atthe right. (DataList2 and DataList3 allow you to doa double or triple bar graph. They are not relevantto this activity, and whatever is listed is okay.)
15. Display the graph.
( J
16. Now move around the graph and see the data.
)! and " to view data
17. Have students sketch their graphs on paper for theirreport (or use TI-73 TI-GRAPH LINKé to print theirgraphs to color and label).
18. Make a pie chart on the TI-73 showing the percentsfrom the polls.
a. Access the STAT PLOTS menu.
- e (above the & key)
b. Make sure the other plots are off.
Q b
c. Select Plot 3 .
- e [ b
d. Select the pie chart Ï (second row, first from left)and continue setting up the plot as in the picture atthe right.
19. Display the pie chart.
*
20. Move around the graph and see the data.
)! and " to view data

76
Using the TI-73: A Guide for Teachers
Pr
obability and Statistics
© 1998 T
EXAS
I
NSTRUMENTS
I
NCORPORATED
21. Have students sketch their graphs on paper for theirreport (or use TI-73 TI-GRAPH LINKé to print theirgraphs to color and label).
22. Have students write analyses of their information.Here are some things you may want them to address:Do you think that packaging, advertising, shipping,
etc. have anything to do with different prices for the
same product? Why or why not?
How can a company of a certain brand charge more?
How can a company of a certain brand charge less?
What are some of the things that the people you polled
said as they told you their choice?
Wrap-up
♦ Have students make an attractive cover includingpictures or drawings of their product. Have themorganize their student activity sheets and graphs.
♦ Have students make their “consumer report”presentations for the class.
Assessment Suggestions
Collect reports to grade quality of student presentations.

Probability and Statistics
Activity 12: Which Brand is Best?
77
© 1998 T
EXAS
I
NSTRUMENTS
I
NCORPORATED
Name
__________________________
Date
__________________________
Activity 12
Which Brand Is Best?
1. Choose a product that is distributed in at least 5 different brands. List theproduct type, the different brands, and the price for each brand.
Product Type:Product Type:
Brand NameBrand Name
PricePrice
1.
$
2.
$
3.
$
4.
$
5.
$
2. Record the following information. Show all calculations.
minimum price ✏
_______________
maximum price ✏
_______________
range ✏
_______________
mode ✏
_______________
mean ✏
_______________
median ✏_______________
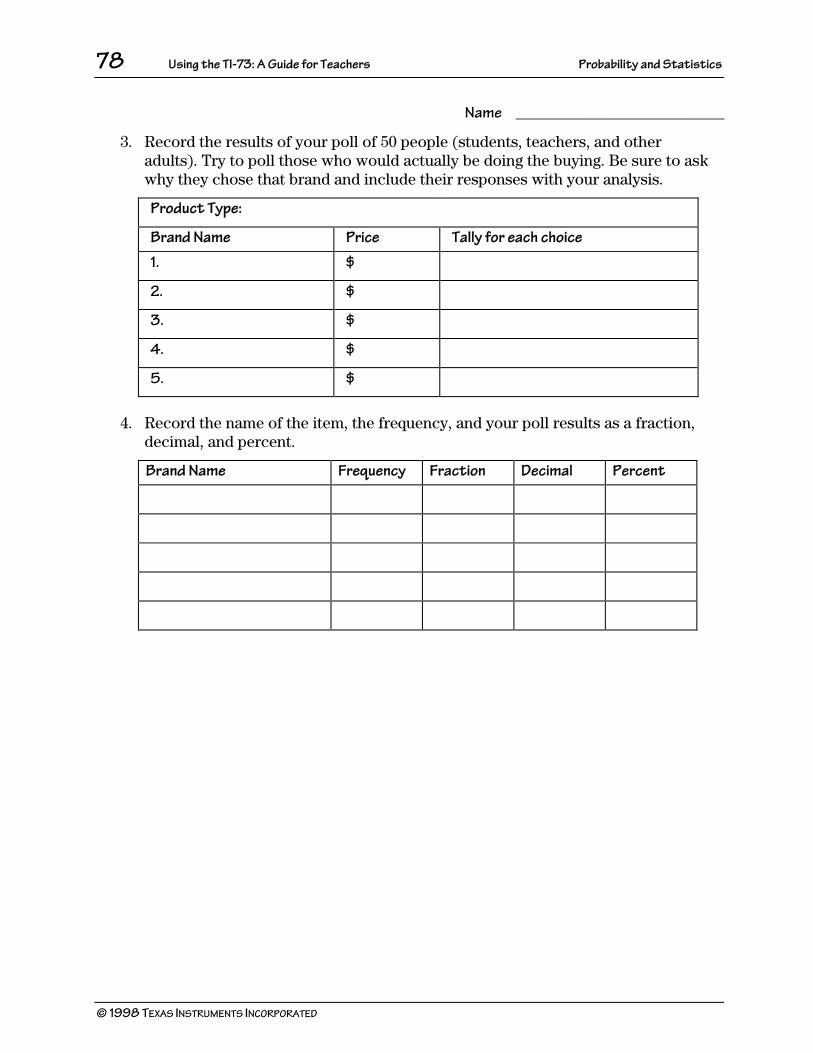
78
Using the TI-73: A Guide for Teachers
Pr
obability and Statistics
© 1998 T
EXAS
I
NSTRUMENTS
I
NCORPORATED
Name
__________________________
3. Record the results of your poll of 50 people (students, teachers, and otheradults). Try to poll those who would actually be doing the buying. Be sure to askwhy they chose that brand and include their responses with your analysis.
Product Type:
Brand Name
Price
Tally for each choice
1.
$
2.
$
3.
$
4.
$
5.
$
4. Record the name of the item, the frequency, and your poll results as a fraction,decimal, and percent.
Brand Name
Frequency
Fraction
Decimal
Percent

79
© 1998 T
EXAS
I
NSTRUMENTS
I
NCORPORATED
TI-73 Index
ACTIVITYPAGENO. TI-73 FUNCTIONS IN ACTIVITY
The Cookie Caper 1 Fraction-to-Decimal
Dice Digits 5 Random, Store, Dice, Probability
How Do You Measure Up? 9 List, Mean, Sum
Stadium Walls 13 Constant, Y=editor, Window, Graph, Trace, Table
The Twin’s Towers 23 Last Answer (Ans), Text
Major Martian Headache 31 Constant, Y=editor, Table
The Dolphin 35 List, Stat Plots (xyLine plot), Window, Graph, Format, Store,Recall
Drip, Drip, Drip 41 Table, Manual-Fit, Y=editor, Window, Graph, Trace
Only the Height Has Been Changed 49 List, Stat Plots (Bar Graph), Window, Graph
Give Me 5! 55 Random, Store, Coin, List, Fraction-to-Decimal, Stat Plots(Histogram), Window, Trace
A Foot is a Foot–Or is It? 63 Fraction-to-Decimal, List, Mean
Which Brand is Best? 69 List, Decimal, Stat Plots (Box Plot, Pictogram, Bar Graph, PieChart) Minimum, Maximum, Mean, Median, Mode, Zoom, Trace,Graph, Fraction, Fraction-to-Decimal

80
Using the TI-73: A Guide for Teachers
© 1998 T
EXAS
I
NSTRUMENTS
I
NCORPORATED
Activity Content Index
ACTIVITYPAGENO. PATTERNS FRACTIONS DECIMALS OPERATIONS
The Cookie Caper 1 x x Add.
Dice Digits 5 Order of Ops,Mental Math,Basic Math
How Do You Measure Up? 9
Stadium Walls 13 Relations,Rules
Order of Ops,Mental Math,Basic Math,Expressions
The Twin’s Towers 23 Functions x Add.
Major Martian Headache 31 Rules Add., Multi.
The Dolphin 35
Drip, Drip, Drip 41
Only the Height Has Been Changed 49
Give Me 5! 55 x x Order of Ops,Mental Math,Basic Math
A Foot is a Foot–Or is It? 63 x x
Which Brand is Best? 69 x x Add.

81
© 1998 T
EXAS
I
NSTRUMENTS
I
NCORPORATED
Activity Content Index
(continued)(continued)
ESTIMATION RATIO MEASUREMENT GEOMETRYPROBABILITYSTATISTICS
x Percent
x
x x x Mean
Rounding Graphing
Percent
x
Rate of Change,Volume
x Collecting Data
x Mean, Graphing,Collecting Data
Percent x
x x
Percent x


