
UNIVERSITY of CALIFORNIA COOPERATIVE EXTENSION
Using Saline Groundwater for Large-Scale Development and Irrigation of Pistachios
Interplanted with Cotton2009 Proposal Defense
1/15/09 Kearney Ag Center
Blake Sanden – Irrigation, Soil & Agronomy Advisor
Kern County, California

Large-Scale Utilization of Saline Groundwater for Development and Irrigation
of Pistachios Interplanted with Cotton
Co-investigators:Louise Ferguson – Pomology Specialist, UCCE DavisCraig Kallsen – Subtropical Crops & Pistachio Advisor, KernBob Hutmacher – Cotton Specialist, UCCE Shafter Brian Marsh – Agronomy Farm Advisor, UCCE Kern
Cooperator: Starrh & Starrh Farming
Funding: University of California Salinity/Drainage Taskforce & Water Resources Center, CA Pistachio Research Board
UNIVERSITY of CALIFORNIA COOPERATIVE EXTENSION

Changes in cotton and pistachio acreage from 1980 to 2005
0
200
400
600
800
1000
1200
1400
1600
1800
1980 1985 1990 1995 2000 2005
SJV
Cot
ton
(1,0
00 a
c)
0
20
40
60
80
100
120
140
160
SJV
Pist
achi
o (1
,000
ac)
CottonPistachio
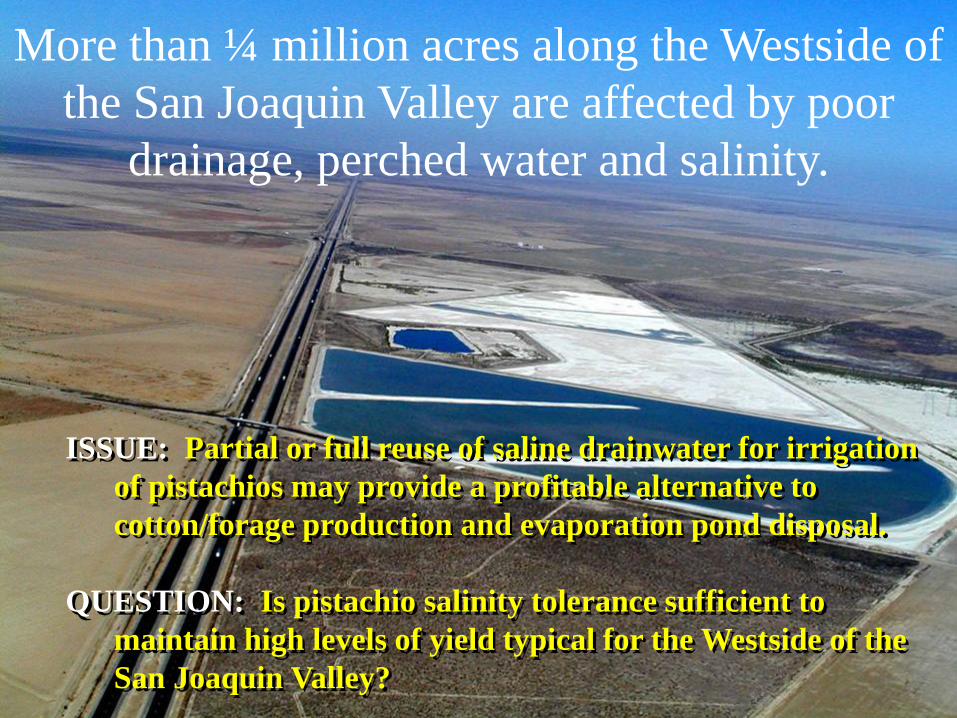
More than ¼ million acres along the Westside of the San Joaquin Valley are affected by poor
drainage, perched water and salinity.
ISSUE: Partial or full reuse of saline drainwater for irrigation of pistachios may provide a profitable alternative to cotton/forage production and evaporation pond disposal.
QUESTION: Is pistachio salinity tolerance sufficient to maintain high levels of yield typical for the Westside of the San Joaquin Valley?

ORIGINAL STUDYPotential for Using Drainage Water for Irrigating
Westside San Joaquin Valley Pistachios
1. SALINITY TOLERANCEDetermine salinity threshold, and possibly slope of pistachio yield decline in a high production setting.
2. CROP WATER USE & SALINITYDetermine the impact of salinity on ET.
3. CROP PHYSIOLOGYExamine the consequences of salinity on tree photosynthesis and water status.
OBJECTIVES

STUDY SITE – NW KERN COUNTY (Aerial 9/19/02)40 acre pistachio orchard planted 1989
Soil: calcareous Twisselman silty claySpacing: 5.2 x 6.1m (17 x 20 feet)
Irrigation: One 55 lph (14.5 gph) microsprinkler/tree centered between trees with 12 static jets @ 360o and a wetted diameter of 4.3m (14 feet).Established with CA Aqueduct water.
Salinity trial initiated April 1994, terminated November 2002.
( Trial size = 12 trees x 20 rows)

0.5-0.7 dS/m4 dS/m8 dS/m
12 dS/m
1 2 3 4BLOCKS
Plot Layout in Orchard


Marginal burn on 0.7 dS/m UCB Rep 2 (9/16/02)
No marginal burn on 0.7 dS/m UCB Rep 1 (9/16/02)

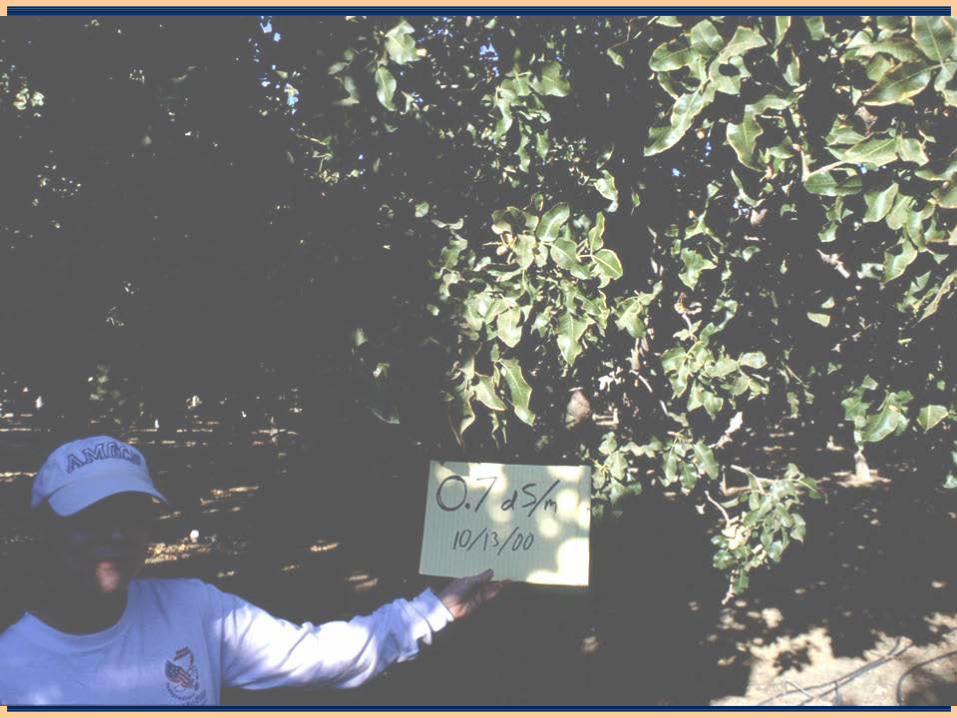
Precipitated salts on soil surface in 12 dS/m plot (10/13/00)
SALINITY TRIAL IRR. WATER @ 8 dS/mNa: 60 meq/l Cl: 40 meq/l B: 1 ppm
1,380 ppm 1,400 ppm

0
200
400
600
800
1000
1200
1400
1600
1800
3/23 4/6 4/20 5/4 5/18 6/1 6/15 6/29 7/13 7/27 8/10 8/24 9/7 9/21 10/5 10/19 11/2 11/16 11/30
2002
"M
ean"
Cum
ulat
ive
ET (m
m)
0.7 dS/m: 1448 mm 4 dS/m: 1308 mm 8 dS/m: 1080 mm 12 dS/m: 794 mm
0
200
400
600
800
1000
1200
1400
1600
1800
3/23 4/6 4/20 5/4 5/18 6/1 6/15 6/29 7/13 7/27 8/10 8/24 9/7 9/21 10/5 10/19 11/2 11/16 11/30
2002
"Zo
ne"
Cum
ulat
ive
ET (m
m) 0.7 dS/m: 1612 mm
4 dS/m: 1594 mm 8 dS/m: 1280 mm 12 dS/m: 935 mm
2002 “Zone” and “Mean” calculated ET’s compared

Total soil water content over 2002 season as determined by neutron backscatter
Soil water content and leaf water potential for 2002 season
-0.65
-0.60
-0.55
-0.50
-0.45
-0.40
-0.35
-0.30
-0.254/15 4/29 5/13 5/27 6/10 6/24 7/8 7/22 8/5 8/19 9/2 9/16 9/30 10/14
Bagg
ed L
eaf W
ater
Pot
entia
l (M
Pa)
0.7 dS/m 4 dS/m 8 dS/m 12 dS/m
2002 Pistachio Bagged Leaf Water Potentials

Cumulative Yields by SalinityCumulative and (Average Annual) Yield per tree; 1997 - 2002
Irrigation Water / Root Zone Salinity* Yield (kg/tree) Rootstock
0.75 / 4.7*
4.0 / 8.7*
8.0 / 11.3*
12.0+ / 13.2*
12 dS/m yield as a % of
control yield Atlantica 46.3 (7.7) 47.3 (7.8) 42.4 (7.1) 38.0 (6.3) 82% PGI 57.3 (9.6) 52.1 (8.7) 51.6 (8.6) 51.8 (8.6) 90% PGII 50.3 (8.4) 51.8 (8.6) 54.6 (9.1) 42.9 (7.2) 85% UCB1 56.0 (9.3) 62.0 (10.3) 53.6 (9.4) 36.2 (6.0) 65%
*Soil salinities are end of season 2002 values. +12 dS/m irrigation was only applied for 1997 through 2002 seasons.
8th-13th Leaf Average Annual Yield for 0.75 to
8 dS/m water (lb/ac):
PG1 UCB12,531 2,727

Relative yield of as a function of soil ECe
Sanden, B.L., L. Ferguson, H.C. Reyes, and S.C. Grattan. 2004. Effect of salinity on evapotranspiration and yield of San Joaquin Valley pistachios. Proceedings of the IVth International Symposium on Irrigation of Horticultural Crops, Acta Horticulturae 664:583-589.
0
20
40
60
80
100
0 2 4 6 8 10 12 14 16 18 20Soil Saturation Extract EC (dS/m)
Rela
tive
Yiel
d (%
) AlfalfaAlmondCottonPistachio
Cotton Relative Yield = 100 - 5.2(ECe - 7.7)
Pistachio Relative Yield(%) = 100 - 8.4(ECe-9.4)


Location of salinity trial
California Aqueduct
Lerdo Highway
Belridge Oilfield

Sodium (50 meq/l, 1150 ppm) and chloride (65 meq/l, 2301ppm) burn on sprinkler irrigated cotton.

Large-Scale Utilization of Saline Groundwater for Development and Irrigation
of Pistachios Interplanted with Cotton

Objectives1. Assess the viability of large-scale cotton production
and pistachio interplanting using saline groundwater(EC 5 dS/m and B @ 10 ppm) and optimal irrigation scheduling with SDI.
2. Determine crop ET as a function of salinity using simple water and chloride balance.
3. Maintain acceptable soil salinity levels for cotton stand establishment/production and maximum growth of young pistachios.
4. Compare total project profitability under SDI using 3 different levels of salinity: saline water, non-saline CA Aqueduct water and a 50/50 blend.

Treatments/TimetableControl: Aqueduct water only EC ~ 0.5 dS/m Blend: 50/50 mix of above EC ~ 2.5 dS/mWell: Shallow groundwater only EC ~ 5.0 dS/m
2004: Cotton only planted
2005-2008: Pistachios are planted a on 6.7m row spacing with 4, 0.97m rows of cotton in between trees. Trees are irrigated with cotton but on a reduced frequency in order to just satisfy ET and some leaching to maintain rootzone ECe < 8 dS/m.
(All treatments receive fresh water preirrigation of 150 to 300 mm, depending on water district availability, to recharge rootzone and germinate cotton.)
2009 on: Pistachios only

Belridge Salinity Trial-- 2, 155 acre fields-- 12, 19.5 acre testplots

FIELD LAYOUT: 9-3Filter Station
Dire
ctio
n of
wat
er fl
ow in
drip
Submain with subunit pressure regulators/set valves
Data Collection:Soil water content: replicated neutron probe sites for weekly measured depletion/ET, data logger/Watermark blocks recording estimated matric potential using electrical resistance.
Soil salinity patterns: sampling, at planting and post harvest. GIS survey with EM38 and aerial imagery.
Plant data: leaf water potential monthly just prior to the start of irrigation. Trunk diameter annually. Leaf tissue Ca, Mg, Na, Cl, B and petiole NO3, P and K. Lint yield and quality.
38"38"38"38" 38"56" 56"
22 ftDrip tape spacing showing "blank" areas for separation of cotton & 2005 pistachios, which will be planted to a 22 foot spacing.
Well
District Turnout
BLEND
BLEND
AQUEDUCTBLK 3
AQUEDUCTBLK 4
BLENDBLK 4
BLENDBLK 3
WELL ONLY BLK 3
WELL ONLY BLK 4
These valves not part of trial.
This pattern re-peated 20 times
across each block.

• Tape: TSX 12-220 @ 0.875 in diameter • Emitters: spaced @ 12 inches
• Depth: 9 to 10 inches below bed. • Run: 1280 to 1300 feet• Cotton rows: 38 inches• Irrigation depth: 1.97 in/day
SDI tape system installed January 2004

Measured irrigation “distribution uniformity”
DU = 94.9%.
1300 foot hose runs follow field grade down-slope from manifolds.

WATER
SOURCE pH EC SARCa
(meq/l)Mg
(meq/l)Na
(meq/l)Cl
(meq/l)B
(ppm)HCO3 (meq/l)
CO3 (meq/l)
SO4 (meq/l)
NO3-N (ppm)
Aqueduct 8.0 0.55 2.5 1.2 1.0 2.6 2.2 0.3 1.3 <0.1 0.7 0.3Blend 7.6 3.41 4.1 14.1 7.8 13.6 21.2 6.3 1.4 <0.1 9.9 2.9Well 7.6 5.15 5.2 22.7 12.7 21.8 33.5 10.4 1.5 <0.1 19.6 6.8
Treatment Water Quality

Data Collection and Analysis (the following data will be collected in both cotton and pistachios):
Soil water content and applied water:
• Neutron probe weekly measured depletion/ET • Soil matric potential at the 12, 24 and 48 inch depths adjacent to probe site • Weekly applied water through drip tape in both cotton and pistachios.
Soil and water salinity: • Replicated soil samples from 0-6, 6-18, 18-36 and 48-60 inch depths at planting and post
harvest • Analyzed for EC, Ca, Mg, Na, Cl, HCO3, and B. • Treatment water samples collected at the same time. • Transect of closely spaced samples characterize bed salinity patterns.
Plant data: • Replicated leaf water potential bimonthly (cotton and pistachio) • Trunk diameter annually (pistachio) • Leaf tissue Ca, Mg, Na, Cl, B, N, P, K (pistachio) and petiole NO3, P, K and B (cotton)
mid-season. • Lint yield and quality.

Recommended irrigation
schedules are provided to the
grower on a weekly basis for both cotton and pistachios for all treatments. In
practice, all treatments are
irrigated to supply slightly less than ET
demand for the 0.5 dS/m treatment.
IRRIGATION SCHEDULING REPORT -- Pistachio: SDI, Aqueduct Adjustment factor (% of Mature Water Use): 15%
CIMIS ET Estimates CURRENT DATE: 8/4/2006 LAST READING DATE: 8/3/2006Avg 2006 Meas
Week ET ET Use SOIL TYPE: sandy clay loam1/3 0.00 0.00 & Drainage FIELD CAPACITY (in/ft): 3.1
1/10 0.00 0.00 REFILL POINT (in/ft): 1.1 Total Avail @ 100% (in): 121/17 0.00 0.00 ROOTING DEPTH (ft): 6 Tree Row Area (sq ft): 28,1601/24 0.00 0.00 TREE ROW SPACING: 18' x 22' FLOW (gpm): 7.001/31 0.00 0.00 IRRIGATION SYSTEM: TSX 220-12 SDI
2/7 0.00 0.00 NORMAL RUN TIME (hrs): 24 WET AREA APPLIC (in): 1.642/14 0.00 0.00 WETTED VOLUME (%): 35% NUMBER of SETS: 42/21 0.00 0.00 NET APPLIC (in): 0.57
2/28 0.00 0.00 CURRENT DEPLETION PROJECTED IRRIGATIONS3/7 0.01 0.01 0.01 4.73 (in) 8/5 8/9 8/13
3/14 0.01 0.01 0.013/21 0.01 0.033/28 0.01 0.05
4/4 0.01 0.074/11 0.01 0.10 0.104/18 0.01 0.10 0.044/25 0.01 0.11 0.36
5/2 0.21 0.17 0.115/9 0.24 0.23 -0.06
5/16 0.28 0.28 0.185/23 0.30 0.23 -0.155/30 0.32 0.28 0.03
6/6 0.32 0.30 0.526/13 0.33 0.31 0.106/20 0.34 0.32 0.336/27 0.34 0.32 0.29
7/4 0.34 0.33 0.057/11 0.34 0.33 0.657/18 0.32 0.32 0.337/25 0.32 0.32 0.65
8/1 0.31 0.31 0.578/8 0.29
8/15 0.28 Total Applied (in): 5.28/22 0.248/29 0.22
9/5 0.219/12 0.189/19 0.179/26 0.1410/3 0.12
10/10 0.1010/17 0.0910/24 0.0510/31 0.04
11/7 0.0311/14 0.0011/21 0.0011/28 0.00
12/5 0.0012/12 0.0012/19 0.0012/26 0.00
Total 6.5 4.5 4.1
0%
25%
50%
75%
100%
125%
2/21 3/
7
3/21 4/
4
4/18 5/
2
5/16
5/30
6/13
6/27
7/11
7/25 8/
8
8/22 9/
5
9/19
10/3
10/1
7
10/3
1
11/1
4
Avai
labl
e W
ater
Sto
red
in R
ootz
one
1.5
2.0
2.5
3.0
3.5
4.0
Wat
er C
onte
nt @
Dep
th (i
n/ft)
Entire Rootzone 1' 3' 5'
STORED SOIL MOISTURE
0.0
0.5
1.0
1.5
2.0
2.5
3.0
2/21 3/
7
3/21 4/
4
4/18 5/
2
5/16
5/30
6/13
6/27
7/11
7/25 8/
8
8/22 9/
5
9/19
10/3
10/1
7
10/3
1
11/1
4
Appl
ied
Irrig
atio
n (in
)
-120
-100
-80
-60
-40
-20
0
Wat
erm
ark
Read
ings
(cb
suct
ion)
Irrig 12" 24" 48"
IRRIGATIONS & SOIL TENSION

Pima planted solid March 11-
25, 2004Delta Pine
340ELS

Pistachios (July 2005):Drip tape 9 inches below surface and 16 inches either side of pistachios with 56 inch space to tape in adjacent cotton bed. Pistachio spacing 17x22 ft.
Pistachio irrigation @ 22 ft spacing: 0.60 in/dayCotton irrigation @ 38 in spacing: 1.97 in/day
Pistachio rootstock planted 3/5-11/05
Delta Pine 340 planted 3/25-4/15/05

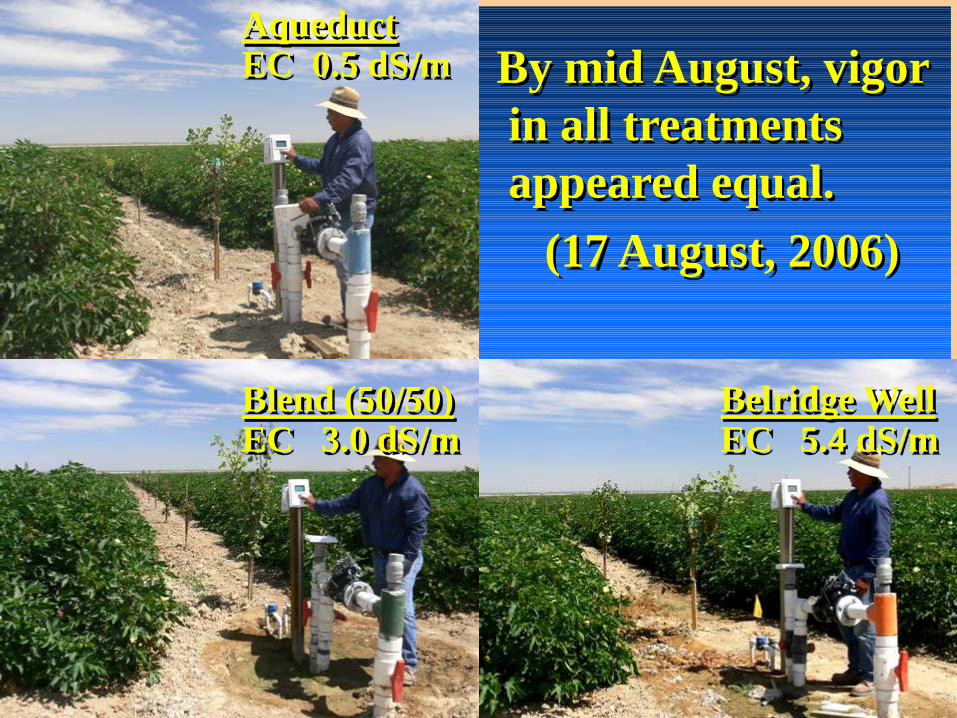
AqueductEC 0.5 dS/mNa 2.6 meq/lCl 2.0 meq/lB 0.3 ppm
Blend (50/50)EC 3.0 dS/mNa 12.1 meq/lCl 16.9 meq/lB 6.0 ppm
Belridge WellEC 5.4 dS/mNa 23.0 meq/lCl 33.5 meq/lB 11.1 ppm
Establishing pistachios interplanted in Pima cotton using drip tape and saline water.(1st leaf 2 Aug, 2005)

PistachioPanoche Clay loam
TSX 220-12 SDIAqueduct, Head
Irrigation 262 mm
-200-180-160-140-120-100
-80-60-40-20
03/27 4/17 5/8 5/29 6/19 7/10 7/31 8/21 9/11 10/2 10/23 11/13
Soil M
oistu
re
Tens
ion (c
b)
0.3m0.6m1.2m
PistachioPanoche Clay loam
TSX 220-12 SDIWell, Head
Irrigation 295mm
-180
-160
-140
-120
-100
-80
-60
-40
-20
03/27 4/17 5/8 5/29 6/19 7/10 7/31 8/21 9/11 10/2 10/23 11/13
Soil M
oistu
re
Tens
ion (c
b)
0.3m0.6m1.2m
PistachioPanoche Clay loam
TSX 220-12 SDIBlend, Head
Irrigation 254mm
-200
-180
-160-140
-120
-100
-80
-60-40
-20
03/27 4/17 5/8 5/29 6/19 7/10 7/31 8/21 9/11 10/2 10/23 11/13
Soil M
oistu
re Te
nsion
(c
b)
0.3m0.6m1.2m

AqueductEC 0.5 dS/mBelridge Well
EC 5.4 dS/m
Following stand establishment problems from a cool spring, the saline Well and Blend treatments showed reduced cotton plant height compared to the Aqueduct treatment.
(29 June, 2006)
Phytogen 810RR planted
4/12-14/06.

Cotton bed contours of ECe at emergence after ~8 to 10 inches of Aqueduct water for germination
Driptape
-0.4 -0.3 -0.2 -0.1 0 0.1 0.2 0.3 0.4-0.4
-0.3
-0.2
-0.1
0.0
Driptape
-0.4 -0.3 -0.2 -0.1 0 0.1 0.2 0.3 0.4-0.4
-0.3
-0.2
-0.1
0.0
Dep
th (m
)
Aqueduct 30 Mar, 2004 Aqueduct 20 Apr, 2005
Driptape
-0.4 -0.3 -0.2 -0.1 0 0.1 0.2 0.3 0.4-0.4
-0.3
-0.2
-0.1
0.0
Driptape
-0.4 -0.3 -0.2 -0.1 0 0.1 0.2 0.3 0.4-0.4
-0.3
-0.2
-0.1
0.0
Dep
th (m
)
Blend 30 Mar, 2004 Blend 20 Apr, 2005
Driptape
-0.4 -0.3 -0.2 -0.1 0 0.1 0.2 0.3 0.4Distance from Drip Hose (m)
-0.4
-0.3
-0.2
-0.1
0.0
Driptape
-0.4 -0.3 -0.2 -0.1 0 0.1 0.2 0.3 0.4Distance from Drip Hose (m)
-0.4
-0.3
-0.2
-0.1
0.0
Dep
th (m
)
Well 30 Mar, 2004 Well 20 Apr, 2005
Driptape
-0.4 -0.3 -0.2 -0.1 0 0.1 0.2 0.3 0.4-0.4
-0.3
-0.2
-0.1
0.0 Aqueduct 10 May, 2006
Driptape
-0.4 -0.3 -0.2 -0.1 0 0.1 0.2 0.3 0.4-0.4
-0.3
-0.2
-0.1
0.0 Blend 10 May, 2006
Driptape
-0.4 -0.3 -0.2 -0.1 0 0.1 0.2 0.3 0.4Distance from Drip Hose (m)
-0.4
-0.3
-0.2
-0.1
0.0Well 10 May, 2006
NNN
Driptape
-0.4 -0.3 -0.2 -0.1 0 0.1 0.2 0.3 0.4-0.4
-0.3
-0.2
-0.1
0.0
Driptape
-0.4 -0.3 -0.2 -0.1 0 0.1 0.2 0.3 0.4-0.4
-0.3
-0.2
-0.1
0.0
Dep
th (m
)
Aqueduct 30 Mar, 2004 Aqueduct 20 Apr, 2005
Driptape
-0.4 -0.3 -0.2 -0.1 0 0.1 0.2 0.3 0.4-0.4
-0.3
-0.2
-0.1
0.0
Driptape
-0.4 -0.3 -0.2 -0.1 0 0.1 0.2 0.3 0.4-0.4
-0.3
-0.2
-0.1
0.0
Dep
th (m
)
Blend 30 Mar, 2004 Blend 20 Apr, 2005
Driptape
-0.4 -0.3 -0.2 -0.1 0 0.1 0.2 0.3 0.4Distance from Drip Hose (m)
-0.4
-0.3
-0.2
-0.1
0.0
Driptape
-0.4 -0.3 -0.2 -0.1 0 0.1 0.2 0.3 0.4Distance from Drip Hose (m)
-0.4
-0.3
-0.2
-0.1
0.0
Dep
th (m
)
Well 30 Mar, 2004 Well 20 Apr, 2005
Driptape
-0.4 -0.3 -0.2 -0.1 0 0.1 0.2 0.3 0.4-0.4
-0.3
-0.2
-0.1
0.0 Aqueduct 10 May, 2006
Driptape
-0.4 -0.3 -0.2 -0.1 0 0.1 0.2 0.3 0.4-0.4
-0.3
-0.2
-0.1
0.0 Blend 10 May, 2006
Driptape
-0.4 -0.3 -0.2 -0.1 0 0.1 0.2 0.3 0.4Distance from Drip Hose (m)
-0.4
-0.3
-0.2
-0.1
0.0Well 10 May, 2006
NNN

-0.6 -0.4 -0.2 0 0.2 0.4 0.6-0.5
-0.4
-0.3
-0.2
-0.1
0.0
Dep
th (m
)
Driptape
Aqueduct 20 Apr, 2005
Driptape
-0.6 -0.4 -0.2 0 0.2 0.4 0.6-0.5
-0.4
-0.3
-0.2
-0.1
0.0
Dep
th (m
)
Driptape
Blend 20 Apr, 2005
Driptape
-0.6 -0.4 -0.2 0 0.2 0.4 0.6North Distance from Tree (m) South
-0.5
-0.4
-0.3
-0.2
-0.1
0.0
Dep
th (m
)
Driptape
Well 20 Apr, 2005
Driptape
Tree ECw = 5.4 dS/m
-0.6 -0.4 -0.2 0 0.2 0.4 0.6-0.5
-0.4
-0.3
-0.2
-0.1
0.0
Driptape
Aqueduct 10 May, 2006
Driptape
-0.6 -0.4 -0.2 0 0.2 0.4 0.6-0.5
-0.4
-0.3
-0.2
-0.1
0.0
Driptape
Blend 10 May, 2006
Driptape
-0.6 -0.4 -0.2 0 0.2 0.4 0.6North Distance from Tree (m) South
-0.5
-0.4
-0.3
-0.2
-0.1
0.0
Driptape
Well 10 May, 2006
Driptape
-0.6 -0.4 -0.2 0 0.2 0.4 0.6-0.5
-0.4
-0.3
-0.2
-0.1
0.0
Driptape
Aqueduct 27 Apr, 2007
Driptape
-0.6 -0.4 -0.2 0 0.2 0.4 0.6-0.5
-0.4
-0.3
-0.2
-0.1
0.0
Driptape
Blend 27 Apr, 2007
Driptape
-0.6 -0.4 -0.2 0 0.2 0.4 0.6North Distance from Tree (m) South
-0.5
-0.4
-0.3
-0.2
-0.1
0.0
Driptape
Well 27 Apr, 2007
Driptape
Tree ECw = 3.0 dS/m
Tree ECw = 0.5 dS/m
Tree ECw = 5.4 dS/m
Tree ECw = 3.0 dS/m
Tree ECw = 0.5 dS/m
Tree ECw = 5.4 dS/m
Tree ECw = 3.0 dS/m
Tree ECw = 0.5 dS/m
Pistachio row contours of spring ECe following ~8 to 10 inches (in 6 foot wetted area) of Aqueduct water to refill rootzone.

Longest Skip (ft)
Plants /Acre
Lint Yield 10/27/06 (bale/ac)
Aque 1.1 33,414 3.67Blend 1.4 31,982 3.23Well 2.0 29,288 *3.12
*Significantly different @ 0.051 probablility.
Cotton Plant Population / Longest “Skip” (as of 5/17/06) and Lint Yield
AqueductEC 0.5 dS/m
Blend (50/50)EC 3.0 dS/m
Belridge WellEC 5.4 dS/m
By mid August, vigor in all treatments appeared equal.
(17 August, 2006)

IR temp Colored Grayscale NDVI NDVI
8/14/06
9-17/29/04

IR temp Colored Grayscale NDVI NDVI
8/14/06
9-37/29/04

9-1: 8/14/06 NDVI
AqueductEC 0.5 dS/m
Blend (50/50)EC 3.0 dS/m
Belridge WellEC 5.4 dS/m
AqueductEC 0.5 dS/m
Blend (50/50)EC 3.0 dS/m
Belridge WellEC 5.4 dS/m

0.7510.734
0.7160.734 0.727
0.707
0.50
0.55
0.60
0.65
0.70
0.75
0.80
0.85
0.90
Aque0.5 dS/m
Blend 3.0 dS/m
Well5.3 dS/m
ND
VI R
atio
NDVI 7/29/04NDVI 8/14/06
NDVI comparison
after 3 seasons of irrigation treatments
Normalized Difference Vegetation IndexIndicates plant biomass and possibly vigor by the following ratio:
NDVI = (NIR-R) / (NIR+R)NIR = near infrared reflectance @ 800nm
IR = infrared reflectance @ 675nm
*Differences not statistically significant

So what about 2008?
9-1 West Compare4/18/08Aqueduct
EC 0.5 dS/m
Blend (30% Well, 70% Aque)
EC 2.8 dS/m
Well (60% Well, 40% Aque)
EC 4.7 dS/m

Driptape Driptape
Driptape
Blend 20 Apr, 2005
Driptape
Well 20 Apr, 2005
Driptape
Tree ECw = 5.4 dS/m
Driptape Driptape
Driptape Driptape
Driptape Driptape
-0.6 -0.4 -0.2 0 0.2 0.4 0.6-0.5
-0.4
-0.3
-0.2
-0.1
0.0
Driptape Driptape
-0.6 -0.4 -0.2 0 0.2 0.4 0.6-0.5
-0.4
-0.3
-0.2
-0.1
0.0
Driptape
Blend 27 Apr, 2007
Driptape
-0.6 -0.4 -0.2 0 0.2 0.4 0.6North Distance from Tree (m) South
-0.5
-0.4
-0.3
-0.2
-0.1
0.0
Driptape
Well 27 Apr, 2007
Driptape
Tree ECw = 3.0 dS/m
Tree ECw = 0.5 dS/m
Tree ECw = 5.4 dS/m
Tree ECw = 3.0 dS/m
Tree ECw = 0.5 dS/m
Tree ECw = 5.4 dS/m
Tree ECw = 3.0 dS/m
Tree ECw = 0.5 dS/m
-0.6 -0.4 -0.2 0 0.2 0.4 0.6-0.5
-0.4
-0.3
-0.2
-0.1
0.0
-0.6 -0.4 -0.2 0 0.2 0.4 0.6-0.5
-0.4
-0.3
-0.2
-0.1
0.0
-0.6 -0.4 -0.2 0 0.2 0.4 0.6North Distance from Tree (m) South
-0.5
-0.4
-0.3
-0.2
-0.1
0.0
-0.6 -0.4 -0.2 0 0.2 0.4 0.6-0.5
-0.4
-0.3
-0.2
-0.1
0.0
Dep
th (m
)
-0.6 -0.4 -0.2 0 0.2 0.4 0.6North Distance from Tree (m) South
-0.5
-0.4
-0.3
-0.2
-0.1
0.0
Dep
th (m
)
Driptape
Aqueduct 20 Apr, 2005Pre-irrigation 260 mm
Aqueduct 25 Apr, 2008Pre-irrigation 104 mm
Aqueduct 27 Apr, 2007Pre-irrigation 248 mm
Blend 25 Apr, 2008
Well 25 Apr, 2008
-0.6 -0.4 -0.2 0 0.2 0.4 0.6-0.5
-0.4
-0.3
-0.2
-0.1
0.0
Contours of soil salinity (ECe, dS/m) in pistachio beds after spring preirrigation

-0.6 -0.4 -0.2 0 0.2 0.4 0.6-0.5
-0.4
-0.3
-0.2
-0.1
0.0
Dep
th (m
)
-0.6 -0.4 -0.2 0 0.2 0.4 0.6-0.5
-0.4
-0.3
-0.2
-0.1
0.0
Dep
th (m
)
-0.6 -0.4 -0.2 0 0.2 0.4 0.6North Distance from Tree (m) South
-0.5
-0.4
-0.3
-0.2
-0.1
0.0
Dep
th (m
)
Driptape
Aqueduct 20 Apr, 2005Pre-irrigation 260 mm
Driptape
Driptape
Blend 20 Apr, 2005
Driptape
Well 20 Apr, 2005
Driptape
Tree B irr = 11.1 ppm
-0.6 -0.4 -0.2 0 0.2 0.4 0.6-0.5
-0.4
-0.3
-0.2
-0.1
0.0
Driptape
Aqueduct 25 Apr, 2008Pre-irrigation 104 mm
Driptape
-0.6 -0.4 -0.2 0 0.2 0.4 0.6-0.5
-0.4
-0.3
-0.2
-0.1
0.0
Driptape
Blend 25 Apr, 2008
Driptape
-0.6 -0.4 -0.2 0 0.2 0.4 0.6North Distance from Tree (m) South
-0.5
-0.4
-0.3
-0.2
-0.1
0.0
Driptape
Well 25 Apr, 2008
Driptape
Tree B irr = 6.0 ppm
Tree B irr = 0.3 ppm
Driptape
Tree B irr = 11.1 ppm
Tree B irr = 6.0 ppm
Tree B irr = 0.3 ppm
-0.6 -0.4 -0.2 0 0.2 0.4 0.6-0.5
-0.4
-0.3
-0.2
-0.1
0.0
Driptape
Aqueduct 27 Apr, 2007Pre-irrigation 248 mm
Driptape
-0.6 -0.4 -0.2 0 0.2 0.4 0.6-0.5
-0.4
-0.3
-0.2
-0.1
0.0
Driptape
Blend 27 Apr, 2007
Driptape
-0.6 -0.4 -0.2 0 0.2 0.4 0.6North Distance from Tree (m) South
-0.5
-0.4
-0.3
-0.2
-0.1
0.0
Driptape
Well 27 Apr, 2007
Driptape
Tree B irr = 11.1 ppm
Tree B irr = 6.0 ppm
Tree B irr = 0.3 ppm
Contours of soil saturation paste extract boron (ppm) in pistachio beds after spring pre-irrig

So what about 2008?
Seasonal soil moisture from neutron probe
showed no leaching after
June
0%
25%
50%
75%
100%
125%
2/25
3/10
3/24 4/
7
4/21 5/
5
5/19 6/
2
6/16
6/30
7/14
7/28
8/11
8/25 9/
8
9/22
10/6
10/2
0
11/3
11/1
7
Ava
ilabl
e W
ater
Sto
red
in R
ootz
one
1.5
2.0
2.5
3.0
3.5
4.0
Wat
er C
onte
nt @
Dep
th (i
n/ft)
Stored Soil Moisture - Well (c)
0%
25%
50%
75%
100%
125%
Ava
ilabl
e W
ater
Sto
red
in R
ootz
one
1.5
2.0
2.5
3.0
3.5
4.0
Wat
er C
onte
nt @
Dep
th (i
n/ft)
Stored Soil Moisture - Blend (b)
0%
25%
50%
75%
100%
125%A
vaila
ble
Wat
er S
tore
d in
Roo
tzon
e
1.5
2.0
2.5
3.0
3.5
4.0
Wat
er C
onte
nt @
Dep
th (i
n/ft)
Entire Rootzone 1' 3' 5'
Stored Soil Moisture- Aqueduct (a)

So what about 2008?
9-1 West Compare10/18/08Aqueduct
EC 0.5 dS/m
Blend (30% Well, 70% Aque)
EC 2.8 dS/m
Well (60% Well, 40% Aque)
EC 4.7 dS/m

Doing pixel counts in
PhotoShop
Select soil first with “Magic Wand” (Tolerance 50) and delete then select green foliage (Tolerance 50) to get total foliage pixel count and “Average Green” (0 is total green, 256 total white)

Aspect Ratio 16:9 5MB All images shot from 11:46 to 12:05 10/3/07
V2W Well 10/3/07992,744 pix
73.36 grn mean
V2W Well 10/18/081,785,752 pix
89.93 grn mean
Aspect Ratio 16:9 5MB All images shot from 14:30 to 14:45 10/18/08
9-1 West

V6W Aque
V4W Blend
V2W Well
9-1 West10/18/08

9-1 WestV6W Aque1,779,489 pix74.46 grn mean(Chroma intensity scale: 0=total black 255=total white)
V4W Blend1,699,659 pix81.55 grn mean
V2W Well1,785,752 pix89.93 grn mean
Photoshop pixel counts of pistachio
foliage

Pistachio foliage pixel
counts 10/3/07
AVERAGE LEAF PIXEL TOTALSLeaf Pixels % of Aque Mean Green
AQUEDUCT 1,730,431 100.0% 82.52BLEND 1,747,492 101.0% 86.31
WELL 1,772,039 102.4% 93.06

So what about 2008?
9-1 West Compare10/18/08Aqueduct
EC 0.5 dS/m
Blend (30% Well, 70% Aque)
EC 2.8 dS/m
Well (60% Well, 40% Aque)
EC 4.7 dS/m

Tissue Analysis for Kerman LeavesKerman Leaves 10/31/06 Pistachio 2006
N P K Na Cl B 10/30/06Aque 1.19 0.08 2.67 171 0.52 531 2.6550/50 1.36 0.08 2.83 140 *0.58 **954 4.34Well *1.55 0.09 2.99 201 *0.62 **1096 *4.61
Kerman Leaves 6/19/07 (PG1) Pistachio 2007Aque 2.56 0.14 1.69 99 0.24 16750/50 *2.67 0.14 1.76 108 0.28 **315Well *2.80 0.15 1.75 *133 0.30 **384
Kerman Leaves 10/19/07 (PG1) Pistachio 2007 10/18/07Aque 1.94 0.15 2.51 98 0.26 342 3.2350/50 2.04 0.14 2.71 106 *0.33 **730 4.68Well **2.24 0.14 2.76 111 0.30 **915 *6.53
Kerman Leaves 10/19/07 (UCB1) Pistachio 2007Aque 1.97 0.13 2.02 82 0.26 25350/50 2.01 0.13 2.19 80 0.29 **626Well 1.97 0.12 2.15 78 0.25 **682
Kerman Leaves 8/26/08 (PG1) Pistachio 2008 4/25/08Aque 2.29 0.13 2.91 80 0.12 301 2.6050/50 2.36 0.13 2.87 84 0.12 684 *4.69Well 2.33 0.13 3.15 79 0.15 **870 *5.64
Kerman Leaves 8/26/08 (UCB1) Pistachio 2008 11/11/08Aque 2.32 0.13 2.41 83 0.14 26950/50 2.41 0.13 *2.73 75 0.13 **606 PENDINGWell 2.37 0.13 2.50 68 0.14 **733
AVG Soil EC

PG1 rootstock growth significantly decreased by 7.4% in Well treatment
0
1
2
3
4
5
6
7
8
PG1 *UCB PG1 *UCB PG1 UCB PG1 UCB
Root
stoc
k Circ
umfe
renc
e (in
ch) Aque EC = 0.6 dS/m
Blend EC = 3.4 dS/mWell EC = 5.2 dS/m
10/19/05 10/31/06 10/22/08
Trees planted March 5-11, 2005. *Rootstock variety difference is significant for 2005 and 2006. *Irrigation salinity impact significant 2008 (P = 0.026).S li i T i ifi
10/18/07
*

Salt added to crop rootzone from start of project
Irrigation Treatment Irrig (in)
Salt (lb/ac)
Irrig (in)
Salt 1(lb/ac)
Irrig (in)
Salt (lb/ac)
Irrig (in)
Salt (lb/ac)
Irrig (in)
Salt (lb/ac)
Irrig (in)
Salt (lb/ac)
Aque 32.3 2343 10.4 1742 8.3 1022 12.0 1390 8.8 1553 71.7 8050 0.650/50 33.1 11390 10.4 8570 8.7 8994 10.8 7571 8.7 8185 71.6 44710 3.5Well 33.1 21444 11.8 14782 7.9 11104 10.7 13197 9.6 13296 73.1 73823 5.8
2Maximum increase in soil saturated paste EC for a 5 foot rootzone with no precipitation of salts and no leaching past the 5 foot depth.
2EC+ Max
(dS/m)
2004 (Cotton) 2005 2006 2007 TOTAL2008
1Irrigation inches for total tree spacing, salt totals (lb/ac) calculated for a 9.5 foot wide subbing area centered on the tree row. Assumes 640 ppm soluble salt = 1 dS/m and a 5 ac-ft depth of soil = 20 million lbs.

Economic Returns from Cotton

--Budget Justification for Pistachio/Cotton Saline Irrigation Project--
Labor 2006 2007 2008 2009 SRA II, 0.6 FTE @ $25,992 (’04-5), $28,000 (’06-7) 16,800 16,800 SRA II, 0.35 FTE @ $29,500 (2009) 11,200 10,325 Benefits @ 27% 4,536 4,536 3,024 2,787 Equipment/Supplies Loggers (6), Watermark blocks, wire, posts @ $700. 4,200 Auger bit, soil probes, PVC, fittings, gas, misc 500 200 200 400 Flowmeters, 16 @ $40 640 Cell phone 100 100 100 100 Refurbish pressure chamber, neutron probe parts 1,000 400 Lab Determinations, 1830 @ $2.00 (’06), 3,660 2130 @ $2.50 (’07), 1830 @ $2.75 (2008) 5,325 5,325 1510 @ $3.55 (2009) 5,360 Travel Field work and meetings, 5,000 mi @ $0.48 2,400 2,400 2,400 Professional serivces Pond-Shafter-Wasco RCD Irrigation Mobile Lab Irrigation system evaluations, 2 @ $300 600 600 600 Aerial imaging, 320 acres @ $3.50 1,120 1,120
ANNUAL TOTALS 30,261 31,081 22,556 20,492
UC Prosser Trust funding: (2004-5: $59,832) 12,000 12,000 0 0 Requested funding from CPRB: 18,261 19,081 22,556 20,492

•Without effective winter rainfall > 6 inches, adequate reclamation for cotton germination is problematic with SDI with tape @ 9” depth when using saline water
•Pistachio growth will be impaired without leaching of 6 to 9 inches of fresh water every 2 to 3 years.
•Presently adsorbed Boron could have a time bomb affect•Field, tree, budding variability are more significant impacts than irrigation salinity up to 5 dS/m
•Use of saline water could save $2,000 - 10,000/ac over 20 years•Another 2 to 5 years is required to assess the true sustainability of this system in order …
Conclusions

… to make sure this project doesn’t end up like Paul’s Valentine to his girlfriend!!


