Clemson University Clemson University
TigerPrints TigerPrints
All Dissertations Dissertations
August 2020
Using Heparin-Coated Nanoparticles in the Treatment of Using Heparin-Coated Nanoparticles in the Treatment of
Neointimal Hyperplasia Neointimal Hyperplasia
Nardine M. Ghobrial Clemson University, [email protected]
Follow this and additional works at: https://tigerprints.clemson.edu/all_dissertations
Recommended Citation Recommended Citation Ghobrial, Nardine M., "Using Heparin-Coated Nanoparticles in the Treatment of Neointimal Hyperplasia" (2020). All Dissertations. 2674. https://tigerprints.clemson.edu/all_dissertations/2674
This Dissertation is brought to you for free and open access by the Dissertations at TigerPrints. It has been accepted for inclusion in All Dissertations by an authorized administrator of TigerPrints. For more information, please contact [email protected].

USING HEPARIN-COATED NANOPARTICLES IN THE TREATMENT OF NEOINTIMAL HYPERPLASIA
A Dissertation Presented to
the Graduate School of Clemson University
In Partial Fulfillment of the Requirements for the Degree
Doctor of Philosophy Bioengineering
by Nardine Michael Ghobrial
August 2020
Accepted by: Dr. Delphine Dean, Committee Chair
Dr. Jeoungsoo Lee Dr. Olin Thompson Mefford
Dr. Ulf Schiller

ii
ABSTRACT
The use of stents in the treatment of atherosclerosis leads to a potential risk of
restenosis, caused by neointimal hyperplasia. Neointimal hyperplasia is mainly caused by
an injury to the endothelial layer of the blood vessel followed by the proliferation of
smooth muscle cells into the lumen of the blood vessel. To address this, we designed a
magnetically-guided drug delivery system to locally deliver heparin to a stented artery.
The nanoparticles were synthesized, characterized, and tested on relevant human cell
lines.
The particles were non-toxic to human smooth muscle cells, endothelial cells, and
fibroblasts. They reduced the proliferation of the smooth muscle cells and increased the
proliferation of endothelial cells at concentrations as low as 10 µg/mL. The particles also
shifted the smooth muscle cells from their synthetic phenotype to their contractile
phenotype.
The capture of the nanoparticles by the stent struts, under relevant magnetic field
and blood velocity was modeled using COMSOL Multiphysics. The coronary artery was
modeled using a 2D axisymmetric model with stainless steel stent struts. A Magnetic
field of 1 T was applied to magnetize the stent struts. Three different strut geometries
were compared for their effect of the capture efficiency. The model had a capture
efficiency 0f 34-42%, which is comparable to models using the same particle sizes.
Ex vivo organ culture studies using porcine right coronary arteries were
performed. The arteries were conditioned either statically in cell culture flasks or

iii
dynamically in an organ culture bioreactor. Nanoparticles reduced intimal thickening in
and expressed contractile properties in the treated arteries compared to the controls.
We were successfully able to synthesize heparin-coated magnetic nanoparticles
and achieve high heparin loading. Particle capture efficiency around the stent in the ex
vivo porcine artery model was found to be similar to that predicted by the computational
model. Consistent with the prior results of systemic heparin delivery, the nanoparticles
reduce the proliferation and dedifferentiation of vascular smooth muscle cells while
promoting endothelialization, both in vitro and ex vivo. Thus, these particles may be a
promising treatment option for neointimal hyperplasia.
.
iv
DEDICATION
This work is dedicated to my mom, Kamilia, who taught me the value of an
education when she went back to school when I was four, only because she wanted to be
more educated and who, when I was in middle school, got the Arabic versions of my
math textbooks to learn it, translate it, then teach it to me. I would not be where I am
today without your hard work over the past eight years and without your love and
support.
I hope that one day I am as hardworking, caring, and kind as you are. You are my
hero and my best friend. I love you.

v
ACKNOWLEDGMENTS
I would like to start with thanking my advisor Dr. Delphine Dean. None of this
work would have been possible without her. Dr. Dean’s support, leadership, and
mentorship taught me to be a better leader and mentor, in addition to a better engineer
and researcher. I am so grateful that Dr. Dean allowed me to explore and learn new skills
through my research and for all the opportunities to go to conferences to share my
research. Thank you, Dr. Dean, for all the support and “no panic”s over the past four
years.
I would also like to thank my committee; Dr. Jeoungsoo Lee, Dr. Thompson
Mefford, and Dr. Ulf Schiller for their mentorship, feedback, and support to this research.
I am very fortunate to have been able to learn from all of you and that each of you has
always been willing to meet with me individually when I had questions.
I would also like to thank everyone in my lab, past and present, for all their help.
Specially, my undergrad Claudia Wong for all help, Dr. Matt Rusin for passing down all
his knowledge to me and for his flawless PCR protocol, Suzanne Bradley for a great
immunofluorescence protocol, Dr. Elliott Mappus and Andrew Hargett for their previous
work on this project, and Melissa McCullough for always having feedback to make my
presentations better. A part of this work was done in collaboration with the Mefford
Group, so I would like to thank Dr. Ben Fellows and Tony Yan for synthesizing my
polymers and for all their help with the particle synthesis process.

vi
I am very grateful to have been a part of the Clemson Bioengineering family over
the past few years. I would like to thank everyone in the Bioengineering Department,
specially Dr. Martine LaBerge for her leadership, Chad McMahan for all his help with
histology, Dr. Dan Simionescu for teaching me how to dissect coronary arteries, my
undergraduate advisor D. Sarah Harcum, Maria Torres, Cassie Gregory, and Trish Nigro
for answering all my questions.
I would like to acknowledge all the technical help from Dr. Lee Sierad at Aptus
Bioreactors, George Wetzel at Clemson Electron Microscopy Facility, and Dr. Shannon
Alford at Clemson Agricultural Services.
Finally, I would like to thank everyone who has supported me personally through
this process. I would like to thank my family; my mom, Kamilia, for all her love and
support, my dad, Michael, for instilling in me a love for science and math since I was a
child, and my brother, Arsany, who is one of the best engineers and most hard-working
people I know. I would also like to thank my childhood friends Christine Michael,
Nourhan Mahmoud, and Christina Refaat. I am grateful to have you in my life.
I would also like to personally thank all my math and science teachers who
ignited in me a love for math and science that keeps me excited about learning every day.
In addition, I would not be the researcher I am today without my research mentors during
my undergraduate years; Olivia DeCroes Ries and Dr. Fernanda Guerra.
vii
My graduate school journey would not have been the same without the incredible
friends I made here. Mathew Stanford, Anastasia Frank-Kamenetskii, Sherry Wang,
Tanner Rathbone, Sarah Mbiki, Simar Singh, Jesse Rogers, and Harrison Smallwood, you
made the bad days better and the good days what they are. Thank you for the support, the
laughs, the memories, the writing days, the coffee runs. I am very lucky to have all of
you.
viii
TABLE OF CONTENTS
Page
TITLE PAGE ............................................................................................................... i ABSTRACT ................................................................................................................ ii DEDICATION ........................................................................................................... iv ACKNOWLEDGMENTS ........................................................................................... v LIST OF TABLES ..................................................................................................... xi LIST OF FIGURES ................................................................................................... xii CHAPTER 1. INTRODUCTION ..................................................................................... 1 Problem Identification .......................................................................... 1 Specific Aims ....................................................................................... 2 Significance ......................................................................................... 3 Innovation ............................................................................................ 5 References............................................................................................ 6 2. A REVIEW OF THE LITERATURE ......................................................... 8 Introduction .......................................................................................... 8 Arterial Physiology .............................................................................. 8 Atherosclerosis ....................................................................................10 Current Treatment Options ..................................................................11 Restenosis ...........................................................................................12 Nanoparticles in Vascular Applications ...............................................20 Nanoparticles in Restenosis .................................................................22 Magnetic Nanoparticles .......................................................................23 Drugs Used in Restenosis Prevention ..................................................25 Heparin ...............................................................................................26 Modeling .............................................................................................27 Ex Vivo ...............................................................................................29 References...........................................................................................30

ix
Table of Contents (Continued) 3. AIM 1.1: SYNTHESIZE HEPARIN-COATED NANOPARTICLES AND CHARACTERIZE THEIR PROPERTIES..................................................................40 Introduction .........................................................................................40 Materials and Methods ........................................................................41 Results ................................................................................................44 Discussion ...........................................................................................47 Conclusions .........................................................................................48 References...........................................................................................48 4. AIM 1.2: TEST THE CELL CYTOTOXIC AND PHENOTYPIC EFFECTS OF THE NANOPARTICLES IN VITRO ON VASCULAR CELLS. .........................53 Introduction .........................................................................................53 Materials and Methods ........................................................................54 Results ................................................................................................58 Discussion ...........................................................................................63 Conclusions .........................................................................................65 References...........................................................................................65 5. AIM 2: DEVELOP A COMPUTATIONAL MODEL TO ASSESS MAGNETIC FIELD PROPERTIES NECESSARY TO TARGET NANOPARTICLES TO STENTS UNDER PHYSIOLOGIC FLOW CONDITIONS. ................................69 Introduction .........................................................................................69 Materials and Methods ........................................................................69 Results ................................................................................................75 Discussion ...........................................................................................79 Conclusions .........................................................................................80 References...........................................................................................81 6. AIM3: VALIDATE THE COMPUTATIONAL MODEL USING A DYNAMIC FLOW EXPERIMENTAL MODEL. ......................................................85 Introduction .........................................................................................85 Materials and Methods ........................................................................86 Results ................................................................................................91 Discussion ......................................................................................... 103 Conclusions ....................................................................................... 105 References......................................................................................... 106 7. CONCLUSIONS AND RECOMMENDATIONS FOR FUTURE WORK108

x
APPENDICES ......................................................................................................... 111 A: Polymer Modification ............................................................................. 112 B: Magnetite Nanoparticle Synthesis ........................................................... 113 C: Fe Determination Protocol ...................................................................... 114 D: DMMB Assay ......................................................................................... 116 E: Cell and Tissue Fixation and Embedding Protocol for TEM .................... 117 F: Live/Dead Assay Protocol ....................................................................... 118 G: MTS Assay Protocol ............................................................................... 119 H: Immunofluorescence ............................................................................... 120 I: Polymerase Chain Reaction ..................................................................... 121 J: TEM Uptake Study ................................................................................. 126 K: Hematoxylin and Eosin Staining Protocol ............................................... 128 L: Masson’s Trichrome Staining ................................................................. 129 M: GMA Embedding Protocol ...................................................................... 130

xi
LIST OF TABLES
Table Page 2.1 A Summary of Vascular Targets Used with Different Types of Nanoparticles ........................................................................21 2.2 Targets for Nanoparticle Therapy in Cardiovascular Disease .....................23 3.1 Size Characterization of the Nanoparticles Using DLS ..............................46 6.1 The Conditions of the Static and Dynamic Experiments ............................87
xii
LIST OF FIGURES
Figure Page
2.1 The Composition of the Arterial Wall ........................................................ 9
2.2 Atherosclerosis Plaque in and Artery.........................................................10
2.3 Comparison Between VSMC Phenotypes ..................................................13
2.4 Stent Strut Geometries Investigated by He et al. ........................................18
2.5 Stent Strut Geometries Investigated by Jimenez et al. ................................19
2.6 The Effect of Different Drugs on the Cell Cycle of VSMCs ......................25
2.7 Schematic of a MDT System Using a Stent ...............................................27
3.1 A Schematic of Nanoparticle Synthesis and Functionalization...................41
3.2 Synthesis and Modification of PEO ...........................................................43
3.3 TEM of Uncoated Particles .......................................................................44
3.4 Heparin Loading Quantifies by DMMB ....................................................46
4.1 TEM Showing Uptake of Nanoparticles by hUVECs ................................58
4.2 Live/Dead Imaging and Quantification ......................................................60
4.3 MTS Results of Cell Proliferation .............................................................61
4.4 qRT-PCR Results ......................................................................................61
4.5 Immunofluorescence Images of hAoSMCs ...............................................62
5.1 Design of 2D axisymmetric Model of a Stented Artery .............................70
5.2 The Different Stent Strut Geometries Tested .............................................71
5.3 Shear Stress for the Different Stent Strut Geometries ................................76
5.4 Magnetic Flux Density for the Different Stent Strut Geometries ................77

xiii
List of Figures (Continued)
5.5 Velocity for the Different Stent Strut Geometries ......................................78
6.1 A Schematic of the Arterial Bioreator .......................................................88
6.2 Arterial Bioreator Setup and User Interface ...............................................89
6.3 H&E of TGF-β Compared to the Control ..................................................94
6.4 Masson’s Trichrome of TGF-β Compared to the Control ..........................95
6.5 Immunofluorescence of TGF-β Compared to the Control ..........................96
6.6 H&E of Statically Conditioned Arteries ....................................................97
6.7 Masson’s Trichrome of Statically Conditioned Arteries.............................98
6.8 Immunofluorescence of Statically Conditioned Arteries ...........................99
6.9 H&E of Dynamically Conditioned Arteries ............................................. 100
6.10 Masson’s Trichrome of Dynamically Conditioned Arteries ..................... 101
6.11 Immunofluorescence of Dynamically Conditioned Arteries .................... 102
6.12 ICP Data of Particle Uptake .................................................................... 103
Page

1
CHAPTER 1
INTRODUCTION
Problem Identification:
Currently the leading cause of death in both the United States and worldwide,
cardiovascular disease, continues to grow in prevalence and overall healthcare burden.
The number of cardiovascular deaths is expected to grow from 17.1 million in 2004 to
23.4 million in 2030 (1). Coronary artery disease (CAD) is one of the major causes of
morbidity and mortality in the developed world and it is expected to be one of the four
leading causes of death by 2030 (1). CAD is mainly caused by atherosclerosis.
Atherosclerosis is the build of plaque inside a blood vessel, usually an artery. It is mainly
caused by smoking, diet, and aging, in addition to genetic factors (2).
Current treatment options for CAD include percutaneous devices, which are
associated with high rates of restenosis. Two of the main causes of restenosis are
neointimal hyperplasia and thrombosis (2). Neointimal hyperplasia is mainly caused by
the proliferation and dedifferentiation of vascular smooth muscle cells (VSMCs) when
they are exposed to blood after an injury to the endothelial layer, where they undergo a
phenotypic shift and change from their contractile phenotype to a synthetic phenotype (2,
3). While drug-eluting stents (DES) are a step in the right direction in restenosis
prevention, they are associated with late stent thrombosis, due to delayed
endothelialization (1, 4).

2
We designed a drug delivery system to treat neointimal hyperplasia and prevent
restenosis through preventing the proliferation and dedifferentiation of VSMCs and
promoting endothelialization. We used heparin–coated magnetic nanoparticles to deliver
heparin to a magnetizable stent under an external magnetic field. Heparin has been shown
to reduce the proliferation of VSMCs and promote the proliferation of endothelial cells.
Our preliminary in vitro and in vivo studies have shown that our heparin–coated
magnetic nanoparticles are non-toxic (5). In vitro studies have shown that heparin–coated
magnetic nanoparticles reduce the proliferation of VSMCs and increase the proliferation
of endothelial cells (5).
Specific Aims:
Aim 1: To synthesize, characterize, and test heparin-coated magnetic
nanoparticles on relevant human cell lines.
• Approach 1.1: Synthesize heparin-coated nanoparticles and
characterize their properties. Magnetic nanoparticles were synthesized, coated with
amine-terminated polyethylene oxide, and heparin was attached to the amine ends.
Another set of amine-coated particles were acquired from a supplier and modified with
heparin. The core diameter, hydrodynamic diameter, and heparin loading for all the
particles were measured.
• Approach 1.2: Test the cell cytotoxic and phenotypic effects of the
nanoparticles in vitro on vascular cells. Human aortic smooth muscle cells (hAoSMC),
human umbilical vein endothelial cells (hUVEC), and human dermal fibroblasts (hDF)
3
were used to test the effect of the nanoparticles on toxicity, proliferation, differentiation,
and phenotypes of these cell lines.
Aim 2: Develop a computational model to assess magnetic field properties
necessary to target nanoparticles to stents under physiologic flow conditions. A
model that includes the layers of the arterial wall, blood flow, hemodynamic properties,
magnetic nanoparticles, magnetic field, and a magnetizable stent was developed. The
model tested different stent strut geometries, in addition to different assumptions on the
capture efficiency of the nanoparticles.
Aim 3: Validate the computational model using a dynamic flow experimental
model. An ex vivo testing model was used to validate the results of the computational
model and the in vitro studies. The model used a bioreactor and excised porcine coronary
arteries, to simulate the dynamic in vivo environment dynamically, in addition to static
testing.
Significance:
Historically, invasive surgeries to replace the stenosed blood vessel with a
vascular graft were the only available solution to treat atherosclerosis. In the 1970s,
balloon angiography was introduced to tackle the problem in a less invasive manner.
Since then, many percutaneous interventions (PCI) have been introduced to offer non-
invasive options for the treatment of atherosclerosis. Despite having high success rates,
percutaneous devices like vascular stents and balloon angioplasties have introduced new
complications such as restenosis (3). Restenosis is caused by an injury to the endothelial

4
layer of the artery, which leads the smooth muscle cells in the medial layer to proliferate
and switch their phenotype, in response to circulating growth factors. Current treatments
for neointimal hyperplasia focus on prevention. One example is using drug-eluting stents
(DES). DES reduced the incidence of in-stent restenosis (ISR) from 20-40% with bare
metal stents to 3-20% with DES (6).
While successful in reducing restonosis, DES use antiproliferation drugs
commonly used in cancer, which have introduced new complications, such as late stent
thrombosis (1, 4). While there have been good successes, the risks associated with PCI
reveal the need for a more effective option. This option needs to be effective where DES
fail and offer targeted treatment without new complications.
Our design to treat neointimal hyperplasia is uses heparin-coated magnetic
nanoparticles. The targeting method uses a magnetizable stent under an external magnetic
field. Although in vitro studies give a physiological understanding of the safety and
effectiveness of our drug delivery system, to fully understand the dynamics of the
magnetic field with the nanoparticles, stent, and hemodynamics in a stenosed artery, we
used a computational model to simulate the interactions between the different
components of our drug delivery system (5). Our model focused on a human coronary
artery, due to its prevalence in atherosclerosis and restenosis. The results from in vitro
studies and computational modeling were validated in ex vivo models, using porcine
coronary arteries.
5
Innovation:
Studies on the in-vitro effects of antiproliferative drugs paired with magnetic
nanoparticles have shown success on vascular smooth muscle cell, which proves their
effectiveness in the treatment of neointimal hyperplasia (4, 7-9). However, there is a lack
of understanding on the effect of the different drug delivery systems on endothelial cells.
This gap in knowledge requires investigation of the role of any proposed system on the
proliferation of endothelial cells, to prevent delayed endothelialization that would lead to
late stent thrombosis (1, 4).
Heparin has been shown to increase the proliferation of endothelial cells.
However, heparin has short in vivo half-life and leads to internal bleeding complications
if administered systemically in high doses. We developed a novel heparin-coated
magnetic nanoparticle system to provide targeted delivery to the site of the stent, with
lower side effects. The proposed approach evaluated the effectiveness of heparin coated
magnetic nanoparticles on the proliferation of endothelial cells.
Magnetic nanoparticles capture using magnetizable implants has been
investigated, however particle with diameters smaller than 50 nm are rarely studied (10-
13). The proposed model analyzes the different assumptions at a smaller diameter, which
sheds light on the particles behavior at this clinically significant level.
The effect of stent strut geometries on the effectiveness of magnetically guided
drug delivery systems had not been previously investigated. While dynamic ex vivo
systems are common in tissue engineering applications, their use to test magnetically
guided drug delivery systems has not been investigated.
6
References:
1. Yin RX, Yang DZ, Wu JZ. Nanoparticle drug- and gene-eluting stents for the
prevention and treatment of coronary restenosis. Theranostics. 2014 Jan 8;4(2):175-200.
2. Orford JL, Selwyn AP, Ganz P, Popma JJ, Rogers C. The comparative pathobiology of
atherosclerosis and restenosis. Am J Cardiol. 2000;86(4):6H-11H.
3. Marx SO, Totary-Jain H, Marks AR. Vascular smooth muscle cell proliferation in
restenosis. Circ Cardiovasc Interv. 2011 Feb 1;4(1):104-11.
4. Chorny M, Fishbein I, Yellen BB, Alferiev IS, Bakay M, Ganta S, et al. Targeting
stents with local delivery of paclitaxel-loaded magnetic nanoparticles using uniform
fields. Proc Natl Acad Sci U S A. 2010 May 4;107(18):8346-51.
5. Fellows BD, Ghobrial N, Mappus E, Hargett A, Bolding M, Dean D, et al. In vitro
studies of heparin-coated magnetic nanoparticles for use in the treatment of neointimal
hyperplasia. Nanomedicine. 2018 Mar 8;14(4):1191-200.
6. Lee JM, Park J, Kang J, Jeon K, Jung J, Lee SE, et al. Comparison among drug-eluting
balloon, drug-eluting stent, and plain balloon angioplasty for the treatment of in-stent
restenosis: a network meta-analysis of 11 randomized, controlled trials. JACC:
Cardiovascular Interventions. 2015;8(3):382-94.
7. Kempe H, Kempe M. The use of magnetite nanoparticles for implant-assisted magnetic
drug targeting in thrombolytic therapy. Biomaterials. 2010;31(36):9499-510.
7
8. Forbes ZG, Halverson DS, Fridman G, Yellen BB, Chorny M, Friedman G, et al.
Locally targeted drug delivery to magnetic stents for therapeutic applications. Computer
Architectures for Machine Perception, 2003 IEEE International Workshop on; IEEE;
2003.
9. Räthel T, Mannell H, Pircher J, Gleich B, Pohl U, Krötz F. Magnetic stents retain
nanoparticle-bound antirestenotic drugs transported by lipid microbubbles. Pharm Res.
2012;29(5):1295-307.
10. Mardinoglu A, Cregg P, Murphy K, Curtin M, Prina-Mello A. Theoretical modelling
of physiologically stretched vessel in magnetisable stent assisted magnetic drug
targetingapplication. J Magn Magn Mater. 2011;323(3):324-9.
11. Wang S, Zhou Y, Tan J, Xu J, Yang J, Liu Y. Computational modeling of magnetic
nanoparticle targeting to stent surface under high gradient field. Comput Mech.
2014;53(3):403-12.
12. Chen H, Ebner AD, Kaminski MD, Rosengart AJ, Ritter JA. Analysis of magnetic
drug carrier particle capture by a magnetizable intravascular stent—2: parametric study
with multi-wire two-dimensional model. J Magn Magn Mater. 2005;293(1):616-32.
13. Sharma S, Singh U, Katiyar V. Modeling and in vitro study on capture efficiency of
magnetic nanoparticles transported in an implant-assisted cylindrical tube under magnetic
field. Microfluidics and Nanofluidics. 2015;19(5):1061-70.

8
CHAPTER 2
A REVIEW OF THE LITERATURE
Introduction:
Cardiovascular disease (CVD) continues to be the biggest cause of death in the
industrialized world. The increase in the efforts to eradicate infectious diseases in
developing countries is expected to lead to a rise in life expectancies in those areas,
which in turn will increase the prevalence of cardiovascular disease. A major subset of
CVD is coronary artery disease (CAD), mainly atherosclerosis. Interventions to treat
atherosclerosis have introduced new complications, mainly restenosis. Restenosis is the
re-occlusion of the blood vessel, following endothelial injury. Drug eluting stents have
been introduced to tackle this problem, but they, in turn, introduced a new set of
complications due to delayed endothelialization.
Nanoparticles have been used in medicine for drug delivery, due to their large
surface area over volume ratios. Magnetic nanoparticles offer a viable option for targeted
drug delivery to magnetic and magnetizable implants. Heparin has been used as an
anticoagulant for decades, however, its antiproliferative properties have been investigated
in the past, but did not have much success when delivered systemically.
Arterial Physiology:
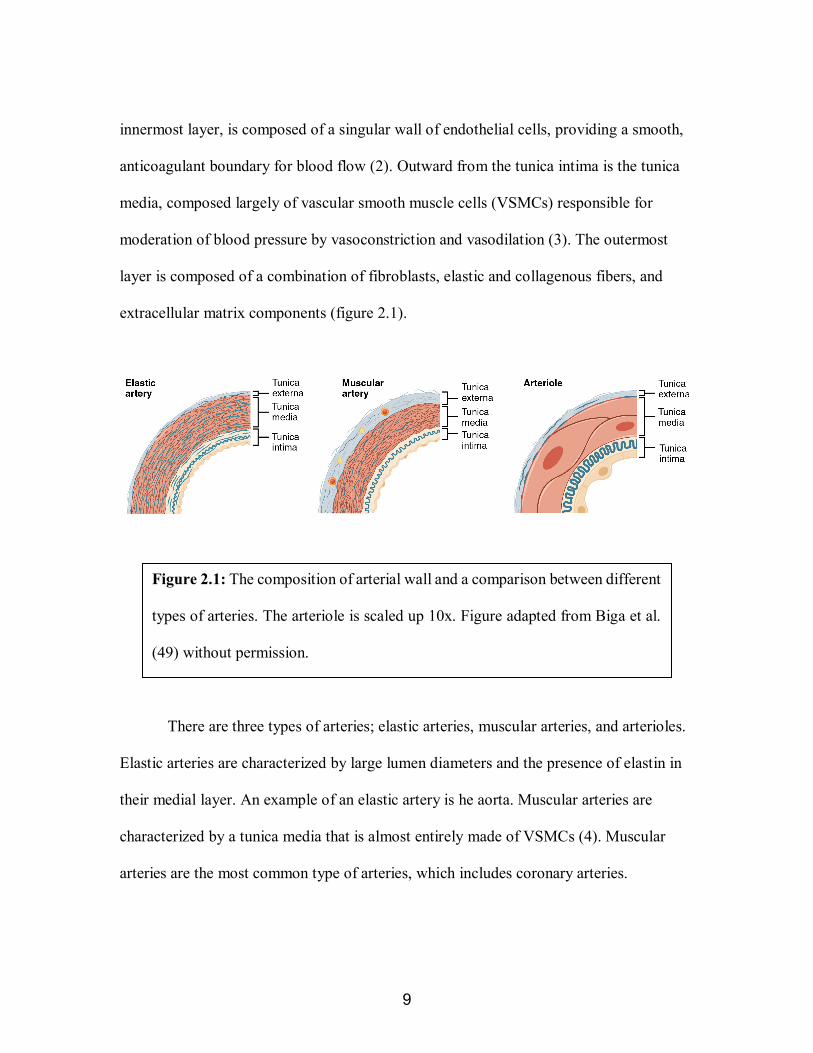
Arterial vessels are made up of three main components, the tunica intima, tunica
media, and the tunica externa (also known as the adventitia) (figure 2.1) (1). In arteries,
the medial layer tends to be thicker than that of veins. The composition of each layer
varies slightly depending on the function of the artery. The tunica intima, which is the
9
innermost layer, is composed of a singular wall of endothelial cells, providing a smooth,
anticoagulant boundary for blood flow (2). Outward from the tunica intima is the tunica
media, composed largely of vascular smooth muscle cells (VSMCs) responsible for
moderation of blood pressure by vasoconstriction and vasodilation (3). The outermost
layer is composed of a combination of fibroblasts, elastic and collagenous fibers, and
extracellular matrix components (figure 2.1).
There are three types of arteries; elastic arteries, muscular arteries, and arterioles.
Elastic arteries are characterized by large lumen diameters and the presence of elastin in
their medial layer. An example of an elastic artery is he aorta. Muscular arteries are
characterized by a tunica media that is almost entirely made of VSMCs (4). Muscular
arteries are the most common type of arteries, which includes coronary arteries.
Figure 2.1: The composition of arterial wall and a comparison between different
types of arteries. The arteriole is scaled up 10x. Figure adapted from Biga et al.
(49) without permission.

10
Arterioles are arteries with diameters smaller than 0.5 mm. Their medial layer is one
eighths that of muscular arteries and they do not have a tunica externa (4) (figure 2.1).
Atherosclerosis:
Atherosclerosis is the buildup of plaque in the lumen of a blood vessel, which is
caused by aging, smoking, diet, and genetic factors (figure 2.2). It is mostly prevalent in
arteries, specifically medium sized arteries, most commonly coronary and femoral
arteries. In coronary arteries, atherosclerosis leads to cardiovascular infarctions that could
be fatal. Atherosclerosis is a chronic inflammatory response influenced by interactions
between VSMCs, lipids, endothelial cells, inflammatory cells, and platelets (3).
Atherosclerosis tends to develop over decades and is mostly prevalent in older patients.
Historically, invasive surgeries to replace the stenosed blood vessel with a vascular graft
were the only available solution to treat atherosclerosis. In the 1970s, balloon
angiography was introduced to tackle the problem in a less invasive manner (2). Since
then, many percutaneous interventions (PCI) have been introduced to offer non-invasive
options for the treatment of atherosclerosis.
Figure 2.2: Atherosclerotic plaque in an artery. Figure adapted from
Elhadidy et al. (48) without permission.
11
Current Treatments Options:
Despite having high success rates, percutaneous devices like vascular stents and
balloon angioplasties have introduced new complications such as restenosis (2).
Restenosis is caused by an injury in the endothelial layer of the artery leading the smooth
muscle cells in the medial layer to proliferate and switch their phenotype, in response to
circulating growth factors (3). Current treatments for neointimal hyperplasia focus on
prevention. One example is using drug-eluting stents (DES). DES reduced the incidence
of in-stent restenosis from 20-40% with bare metal stents to 3-20% with DES (2, 5).
While successful in reducing restonosis, DES use antiproliferation drugs
commonly used in cancer treatment, such as sirolimus and paclitaxel, which have
introduced new complications, such as late stent thrombosis due to delayed
endothelialization (6, 7). These drugs reduce the proliferation of the endothelial cells
along with the smooth muscle cells, which slows down the healing of the vascular wall.
One other reason DES have not been completely successful is due to the limited control
over drug payload, dosage, or reloading, due to their limited surface area (7).
Polymeric bioresorbable stents have also been explored as an alternative. They
provide structural support to the blood vessel wall for a certain period of time then
degrade. Animal studies for bioresorbable stents have shown higher rates of intimal
hyperplasia and thrombosis due to inflammation (6). They also fail to provide the
mechanical support necessary (8). In addition to the aforementioned complications, DES
and bioresorbable stents increase the risk of clot formation due to portions of polymer

12
breaking off during implantation (8). Drug-eluting balloons have also been investigated.
They, however, need extended inflation times, which induces vessel ischemia (9).
Restenosis:
In contrast to atherosclerosis, the development of restenosis is a rapid process that
occurs in response to the implantation of PCI. It is caused by neointimal hyperplasia and
thrombosis. Neointimal hyperplasia following stenting most often occurs as the result of
damage to the interior vessel wall, the tunica intima (2, 3). Stresses to the vessel during
stent placement may result in endothelial denudation and shielding from shear stresses
necessary for proper endothelial functionalization (2). Following endothelial denudation,
VSMCs within the tunica media are exposed to growth factors, allowing migration from
the media into the lumen (6). Here they may experience excessive proliferation, similar to
a tumor or keloid, occluding the blood vessel by cell growth (6).
Factors Affecting Restenosis:
Cellular Factors: In addition to proliferation, VSMCs shift from their contractile
phenotype to a synthetic phenotype, which leads to restenosis (2) (figure 2.3). The
contractile phenotype is characterized by the presence of different contractile markers,
such as smooth muscle α-actin, smooth muscle myosin heavy chain, and calponin (1).
After injury, VSMCs shift towards a synthetic phenotype and enter the cell cycle (1).
Synthetic VSMCs show a higher rate of migration and proliferation, in addition, the
expression of contractile proteins is reduced and extracellular matrix components are
produced (1). These changes contribute to the thickening of the intima media.

13
During the early stages of embryonic vascular formation, VSMCs exhibit high
rates of migration, proliferation, and extracellular matrix production (10). In healthy adult
blood vessels, VSMCs only carry out their contractile functions. Upon injury, they
dedifferentiate to their synthetic phenotype to repair the blood vessel, by producing
extracellular components including collagen and elastin (10). This process contributes to
the formation of restenosis.
Figure 2.3: Comparison between VSMC phenotypes. Figure adapted from
Rensen et al. (33) without permission.
14
Although restenosis is caused predominantly by the proliferation and migration of
VSMCs, the roles played by endothelial cells and fibroblasts cannot be ignored.
Endothelial cells in the tunica intima act as a selectively permeable barrier to prevent
contact between VSMCs and growth factors circulating in the blood (2). Consequently,
the endothelial layer inhibits intimal hyperplasia (2). Contrary to endothelial cells,
fibroblasts role in restenosis is not well understood, however, studies have found that
after injuries to the endothelial layer, myofibroblasts have been located in the adventitial
layer (11). These fibroblasts have been found to express smooth muscle cell markers,
such as smooth muscle actin and vimentin (11).
Mechanical Factors: Restenosis rates have been related to many factors; stent or
balloon material, biocompatibility, flexibility, surface properties, deployment force,
presence of antiproliferation drugs, stent strut design and geometry, stent placement,
shear stress, and the size of the blood vessel (12). All these factors affect the re-
endothelialization of the arterial wall and in turn affect the vascular smooth muscle cell
proliferation. While each of these factors has a distinct effect on the stenosis of the
arteries, they all interact with each other and we rarely see the distinct role of one player
in the formation of intimal thickening.
Multiple studies have shown the relationship between mechanical forces and the
formation of restenosis in stented arteries. In bare metal stents, hemodynamics affects the
shear stress on the endothelial layer, which affects the mechanotransduction and causes
intimal thickening. In drug-eluting stents, the stent struts come in contact with the
endothelium and delay its healing leading to late stent thrombosis. Research has shown a

15
relationship between stent geometries, hemodynamics, shear stress, endothelialization,
and intimal thickening.
The endothelium usually inhibits thrombogenesis because endothelial cells
express an anticoagulant phenotype. After a stent is implanted, it forms a wall along with
the blood vessel creating a new boundary for the blood flow. This new boundary changes
the blood flow to try to separate around the strut. High shear rates have been proven to be
ideal for endothelialization. Higher shear rate levels have been found over thick and
nonstreamlined strut surfaces, which promotes endothelialization (12). Lack of proper
endothelialization causes higher risks of stent thrombosis or neointimal hyperplasia
leading to in-stent restenosis. Endothelial cells between stent struts are affected by
changes in hemodynamics, which can also affect the results of drug-eluting stents (13).
When the endothelium is injured, it is coated with activated platelets. Leucocytes are
attached to the platelets by adhesion molecules then secrete growth factors and cytokines
that activate vascular smooth muscle cells dedifferentiation and proliferation, which
causes neointimal hyperplasia (14).
1. Shear Stress: Shear stress has been one of the main mechanical factors to
affect restenosis rates in stented vessels, due to its relationship with all the other major
factors. Shear stress is identified as the force per unit area produced by blood flow when
it comes in contact with the endothelial layer (13). The interactions between the blood
flow and the endothelium induce mechanotrasnduction signals, which convert mechanical
forces into chemical signals, which in turn affects arterial development, homeostasis, and
adaptation (13). The interactions between shear stress and the endothelial layer also play
16
a major role in many cardiovascular pathologies, such as atherosclerosis, restenosis,
hypercholesterolemia, diabetes, and hypertension (13). Higher shear stress has been
shown to promote adaptive dilatation and structural remodeling of the blood vessel,
which is associated with less intimal thickening. Changes in shear stress affect the
signaling and gene expression of endothelial cells and vascular smooth muscle cells,
which in turn adapt to shear stress by altering vessel architecture (14).
Wentzel et al. (15) developed a model that combined 3D models of patients’
blood vessels and computational fluid mechanics to show the relationship between shear
stress and neointimal growth. For their data collection, they looked at fourteen patients
six months after stent implantation. They evaluated a model to test the hypothesis that
regions with low shear stress experience neointimal thickening. To test their hypothesis,
they used a three-dimensional reconstruction tool, ANGUS, which uses angiography and
ultrasound images combined with ECG data to reconstruct the blood vessel geometries.
They combined their 3D models with computational fluid dynamics models to construct a
more efficient, patient specific model. They compared the shear stress and neointimal
thickening data for each patient before and after stent implantation and six months after
implantation. For measuring neointimal thickness, the reconstructed 3D models were
used to measure the thickness of the vessel wall at implantation and six months after.
2. Stent Geometries: Stent design and geometries have been a major interest
of researchers in the past few years. With the shift in the percutaneous device market
from bare metal stents to drug-eluting stents, patients and clinicians had high hopes for
getting rid of the risk of restenosis. Although drug-eluting stents reduced that risk, they

17
did not demolish it completely, which led to a closer look at stent designs and geometries
to analyze how they affect wall stresses, neointimal thickening, and hyperplasia. A few
factors affecting this are, strut thickness and design, number of cross sections, cross-
sectional shape, and stent length (14).
Stent strut design creates disturbances in blood flow, which delays
endothelialization and causes late stent thrombosis (13). The endothelial cells between
the stent struts have been shown to be affected by the hemodynamics in the stented blood
vessel (13). Changes in flow patterns have been shown to affect platelet and
inflammatory cell transport, which in turn affects endothelialization.
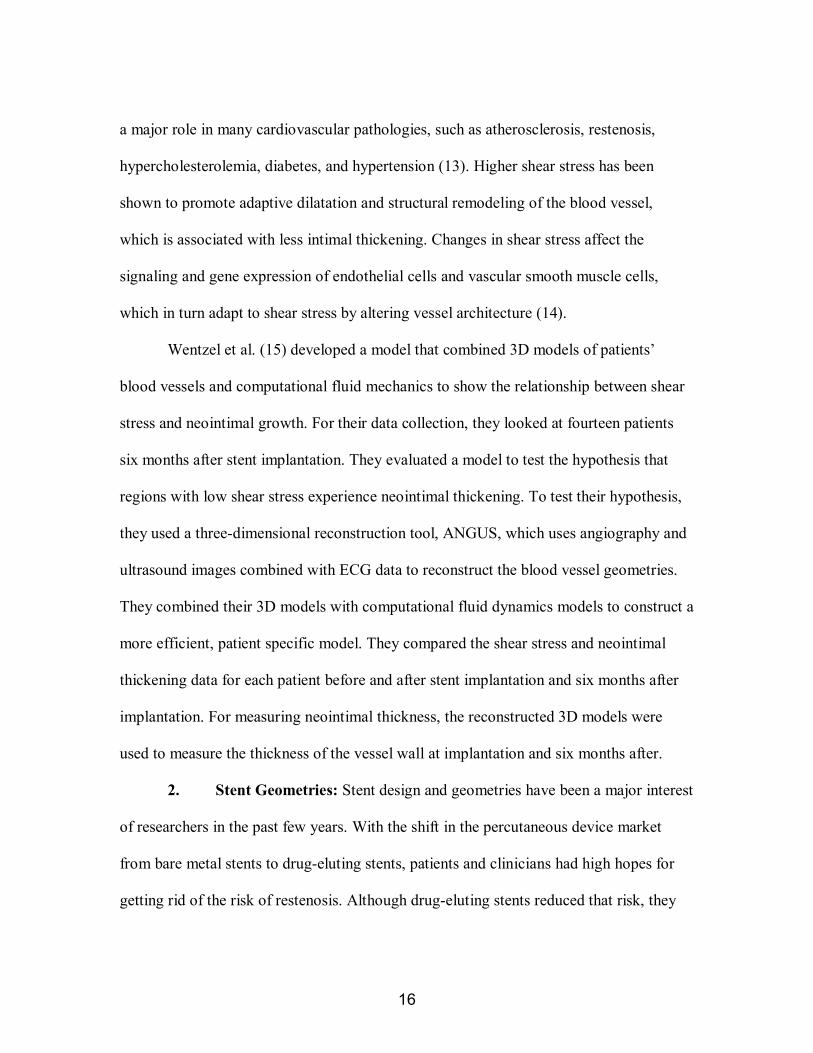
He et al. (16) developed a 3D CFD model to compare four different stent strut
designs with and without longitudinal connectors to compare the effect stent geometries
have on wall shear stress and flow separation and how they affect thrombosis and
neointimal thickening. In their model they focused on three parameters; strut
interspacing, amplitude or spacing between concave and convex portions of the same
strut, and the strut radius of curvature. The four different strut designs looked at are
shown in figure 2.4 (16). They did not model currently available strut geometries to allow
for a variation in the designs that could be used for future designs. They also considered
two different shear stress flow conditions: high and low.
18
Their (16) model used 3D Cartesian geometry with a focus on the near-strut parts
of the artery. To simplify their model, they only used two adjacent struts in the axial
direction.
The study found that designs without axial connectors are more hemodynamically
beneficial because they seem to be closer in geometry to normal physiologic arterial wall.
While it is theoretically possible to simulate a stent without connectors, it is not
applicable in stent design due to the mechanical support they provide for the artery. The
study has also found that designs with larger interstrut spacing and smaller spacing
between concave and convex portions had more benefit from a hemodynamic point. The
change between high and low flow conditions did not seem to affect the flow
characteristics in this model.
Figure 2.4: Stent strut geometries investigated by He et al. (16).
Adapted without permission.
19
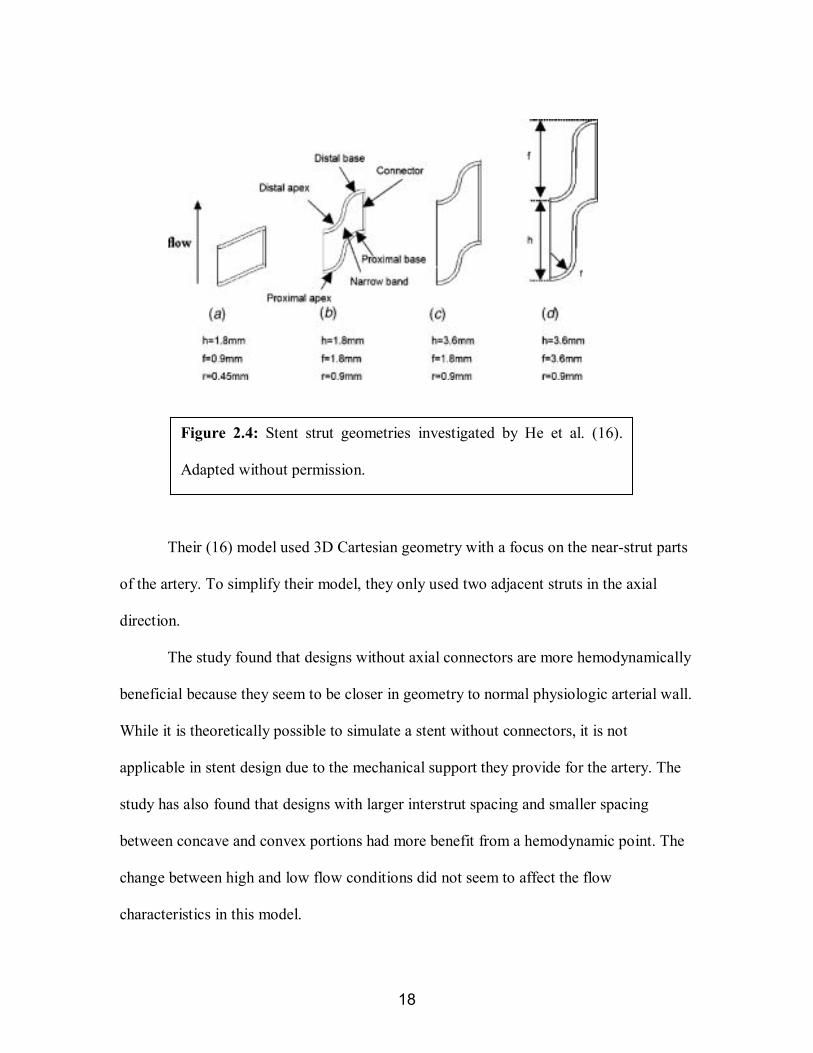
Jimenez et al. (12) looked at the hemodynamics in stented blood vessels using six
different streamlined and nonstreamlined strut designs with three different sizes. Their
study analyzed the effect of both shape and size of stent strut on the blood flow,
endothelialization, and intimal thickening in a stented vessel. They used a computational
fluid dynamics model to analyze their data. They used rectangular and circular strut
designs with three different length to width ratios for each. The different strut geometries
used can be seen in figure 2.5 (12).
Their results proved the relationship between the stent strut geometry and size and
shear stress and endothelialization. They showed a reduction in the shear stress values
when the thickness of the rectangular strut was decreased. Circular designs showed lower
shear stress than rectangular ones.
Figure 2.5: Stent strut geometries investigated by Jimenez et al. (12).
Adapted without permission.

20
Nanoparticles in Vascular Applications:
Nanoparticles have been used in medicine as drug delivery devices for various
applications (17). The large surface area to volume ratio allows the delivery of sufficient
amounts of drug to a specific site (18). They also provide targeted delivery options for
drugs with adverse systemic effects. One targeted delivery method is using magnetically
guided delivery systems, which primarily use magnetic nanoparticles.
One of the largest investigated uses of nanoparticles in medicine is their use in
imaging. Targeting nanoparticles to a specific location allows for better plaque imaging
using commonly used imaging modalities. Varvara Karagkiozaki (19) summarized the
investigated nanoparticle systems used for cardiovascular imaging (table 2.1).

21
Table 2.1: A summary of vascular targets used with different types of nanoparticles
used for their targeting by imaging modalities and of the payloads and surface
ligands used with them (19, 50-61). Adapted from Karagkiozaki (19) without
permission.
Abs=antibodies, CREKA=cysteine-arginine-glutamic acid lysine-
alanine, CT=computed tomography, DTPA=diethylene triamine pentaacetic
acid, Gd=gadolinium, LDL=low density lipoprotein, LOX-1=LDL-
receptor, MRI=magnetic resonance imaging, PEG=polyethylene
glycol, PET=positron emission tomography, SPIO’s=small superparamagnetic iron-
oxide nanoparticles, USPIOs=ultrasmall superparamagnetic iron oxide NPs, VCAM-
1=vascular cell adhesion molecule 1, SPECT=single-photon emission computed
tomography.

22
Nanoparticles in Restenosis:
In addition to imaging, nanoparticles have been used in cardiovascular
applications to prevent restenosis. Nanomedicine applications to prevent restenosis can
be split into two categories: preventing VSMC proliferation and promoting
endothelialization. It can also be divided into drug therapies, gene therapies, and
endothelial cell therapy (6). Yin et al. lay out a list of most of the currently researched
therapies. Some groups are investigating nanoparticle-eluting stents, which can have
great potential, but still face a limited surface area limitation and risk of thrombosis. The
major factors that affect a drug delivery device are the drug or therapeutic agent, the
targeting moiety, and the loading method.
Gu et al. (20) investigated using layered double hydroxide (LDH) nanoparticles
with low molecular weight heparin (LMWH), as a therapeutic agent. The LDH particle
design has a sandwich-like structure following the formula [M2+1-xM3+
x(OH)2]x+(An-
)x/n.mH2O, where M2+ is a divalent metal cation, M3+ is a tivalent metal cation, and An- is
an anion. M3+ replaces M2+, hydroxide layer becomes positive, balanced by exchangeable
anion and an anionic drug replaces the anion. For their specific design, they used
magnesium as a divalent metal cation, aluminum as a trivalent metal cation, and chlorine
as an anion, with LMWH being the anionic drug. They did not specify a targeting moiety
or method in their studies, however their in-vitro studies showed promising results.
23
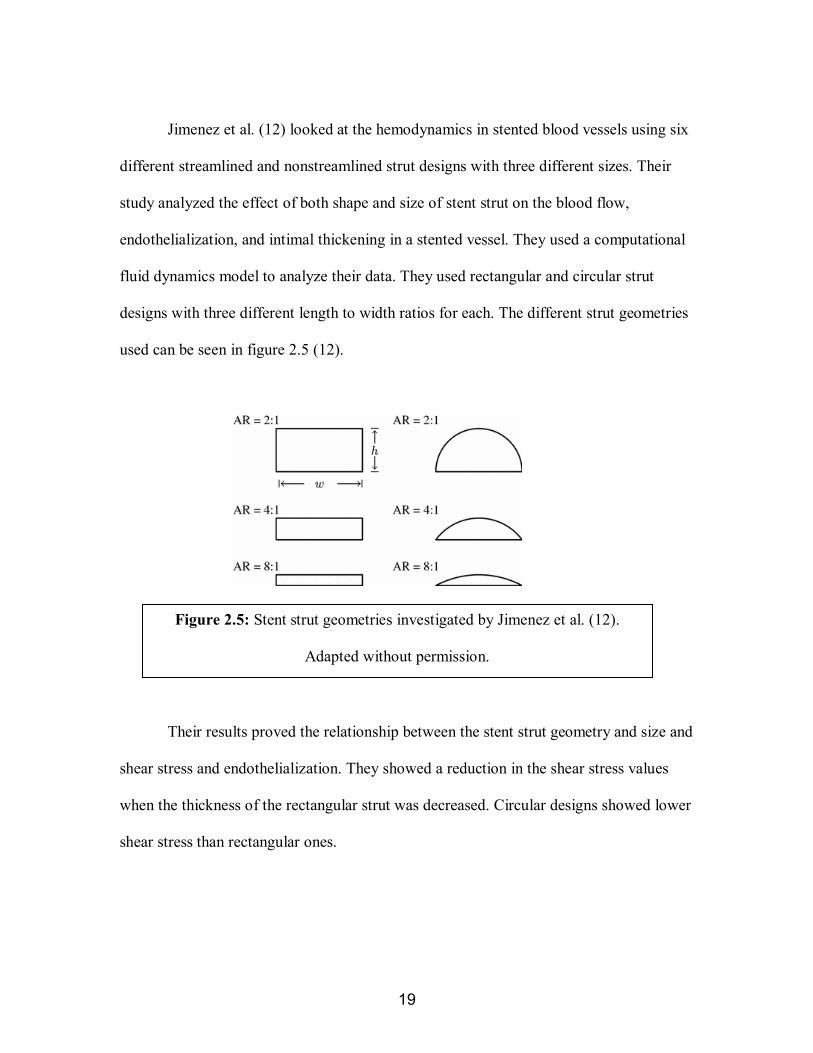
Cicha et al. (21) summarize some other investigated factors used to prevent
restenosis (table 2.2).
Magnetic Nanoparticles:
Magnetic nanoparticles have been used for different medical applications over the
years. These applications include MRI contrast agents, magnetically guided drug delivery
systems, hyperthermia therapy for cancer treatment, and magnetic separation (22).
A particle is superparamagnetic when it is small enough to be composed of a
single-domain, and there is sufficient thermal energy in the system to randomize the
moments of an assembly of particles so no bulk magnetization is observed in a defined
time period (23). How small a particle needs to be depends on the composition. The
Table 2.2: Targets for nanoparticle therapy in cardiovascular disease (20).
Adapted without permission.
NP=nanoparticles, NOX=NADPH oxidase, PECAM=platelet-endothelial
cell oxidation molecule, SMC=smooth muscle cell, SR-A=scavenger
receptor type A.
(38) (40) (41) (43, 44) (57) (58) (59) (60) (61)
24
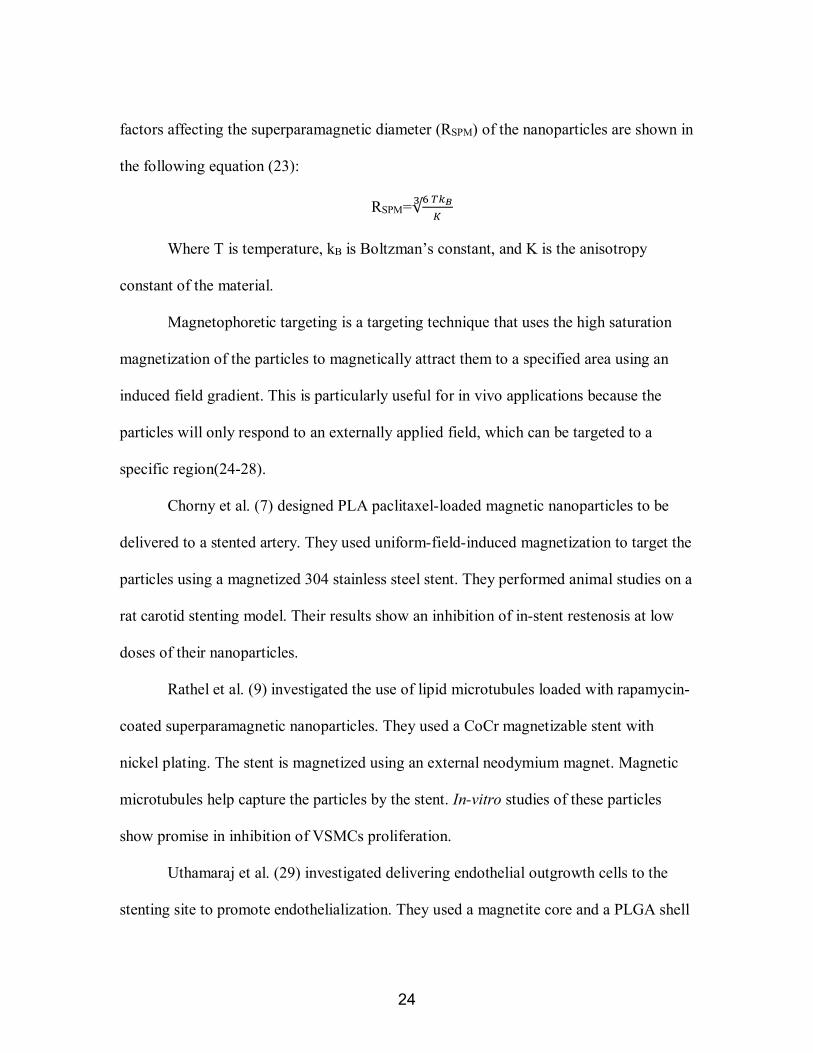
factors affecting the superparamagnetic diameter (RSPM) of the nanoparticles are shown in
the following equation (23):
RSPM=∛6 𝑇𝑇𝑘𝑘𝐵𝐵𝐾𝐾
Where T is temperature, kB is Boltzman’s constant, and K is the anisotropy
constant of the material.
Magnetophoretic targeting is a targeting technique that uses the high saturation
magnetization of the particles to magnetically attract them to a specified area using an
induced field gradient. This is particularly useful for in vivo applications because the
particles will only respond to an externally applied field, which can be targeted to a
specific region(24-28).
Chorny et al. (7) designed PLA paclitaxel-loaded magnetic nanoparticles to be
delivered to a stented artery. They used uniform-field-induced magnetization to target the
particles using a magnetized 304 stainless steel stent. They performed animal studies on a
rat carotid stenting model. Their results show an inhibition of in-stent restenosis at low
doses of their nanoparticles.
Rathel et al. (9) investigated the use of lipid microtubules loaded with rapamycin-
coated superparamagnetic nanoparticles. They used a CoCr magnetizable stent with
nickel plating. The stent is magnetized using an external neodymium magnet. Magnetic
microtubules help capture the particles by the stent. In-vitro studies of these particles
show promise in inhibition of VSMCs proliferation.
Uthamaraj et al. (29) investigated delivering endothelial outgrowth cells to the
stenting site to promote endothelialization. They used a magnetite core and a PLGA shell
25
that were uptaken by the cell. They used a magnetizable 2205 stainless steel stent for
targeting and a neodymium magnet to magnetize it. They also performed animal studies
using a pig model, which showed some success in a short period of time.
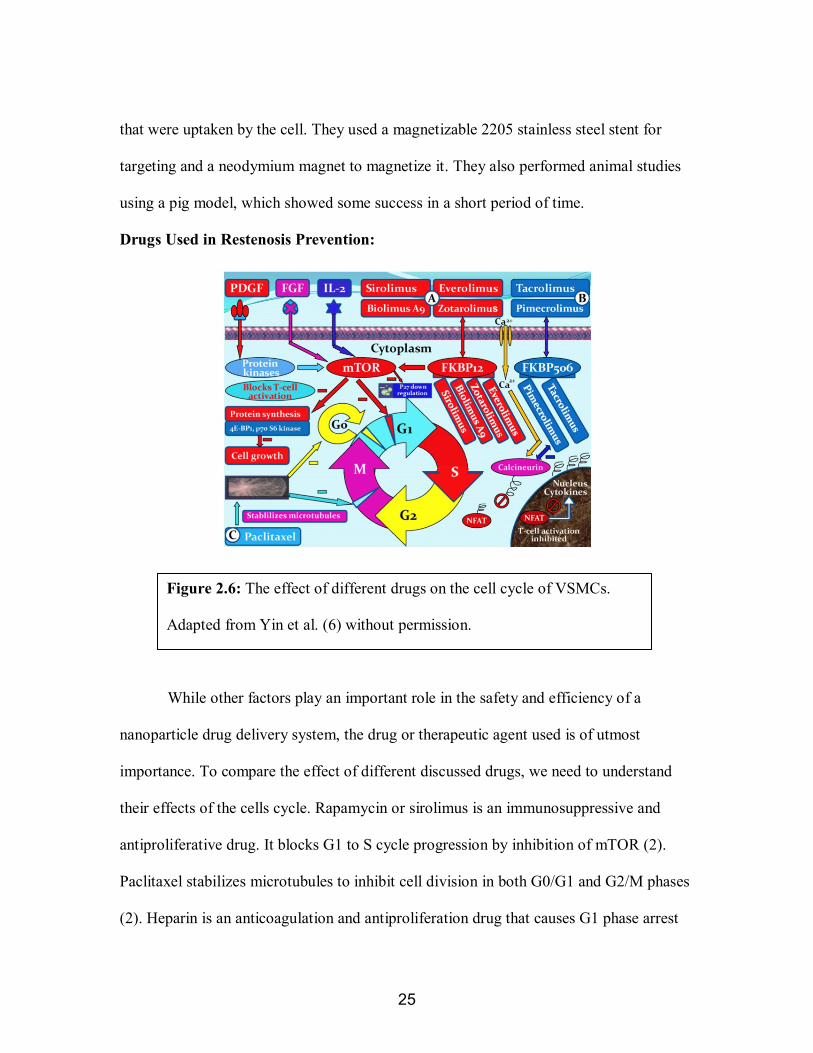
Drugs Used in Restenosis Prevention:
While other factors play an important role in the safety and efficiency of a
nanoparticle drug delivery system, the drug or therapeutic agent used is of utmost
importance. To compare the effect of different discussed drugs, we need to understand
their effects of the cells cycle. Rapamycin or sirolimus is an immunosuppressive and
antiproliferative drug. It blocks G1 to S cycle progression by inhibition of mTOR (2).
Paclitaxel stabilizes microtubules to inhibit cell division in both G0/G1 and G2/M phases
(2). Heparin is an anticoagulation and antiproliferation drug that causes G1 phase arrest
Figure 2.6: The effect of different drugs on the cell cycle of VSMCs.
Adapted from Yin et al. (6) without permission.
26
(30). Endothelial Cells promote the differentiation of VSMCs from synthetic to
contractile phenotype through activating the AKT pathway (1).
Yin et al. (6) looked at the different drugs used to treat neointimal hyperplasia in
detail and discussed the effect of each of them and which family they belong to (figure
2.5). They also discuss the different targeting drug delivery systems used to treat
neointimal hyperplasia and their success.
Heparin:
Heparin is a sulfated glycosaminoglycan comprised of repeating units of
glycosamine and uronic acid. (20, 31) In addition to its anticoagulation properties,
heparin has been shown to inhibit the proliferation of VSMCs by Clowes et al. (32) in
1977. Several studies since then (2, 3, 33-36) have shown heparin to reduce the
proliferation, migration, and dedifferentiation of VSMCs and to promote
endothelialization, to accelerate healing (3, 34, 37). Heparin affects growth and
proliferation of VSMCs in phase G1 in the cell cycle. It inhibits the activation of mitogen
activated protein kinase (MAPK) which in turn suppresses transcription factors needed
for the proliferation and migration of VSMCs (20, 30).
Heparin, however, is a negatively charged molecule, with a molecular weight of
12,00-18,000 Da, and has a half-life of 1-5 hours. This makes the systemic delivery of
heparin inefficient and causes undesirable side effects (38). Low molecular weight
heparin (LMWH) has been shown to have longer half-life and reduced side effects
compared to regular heparin (20).
27
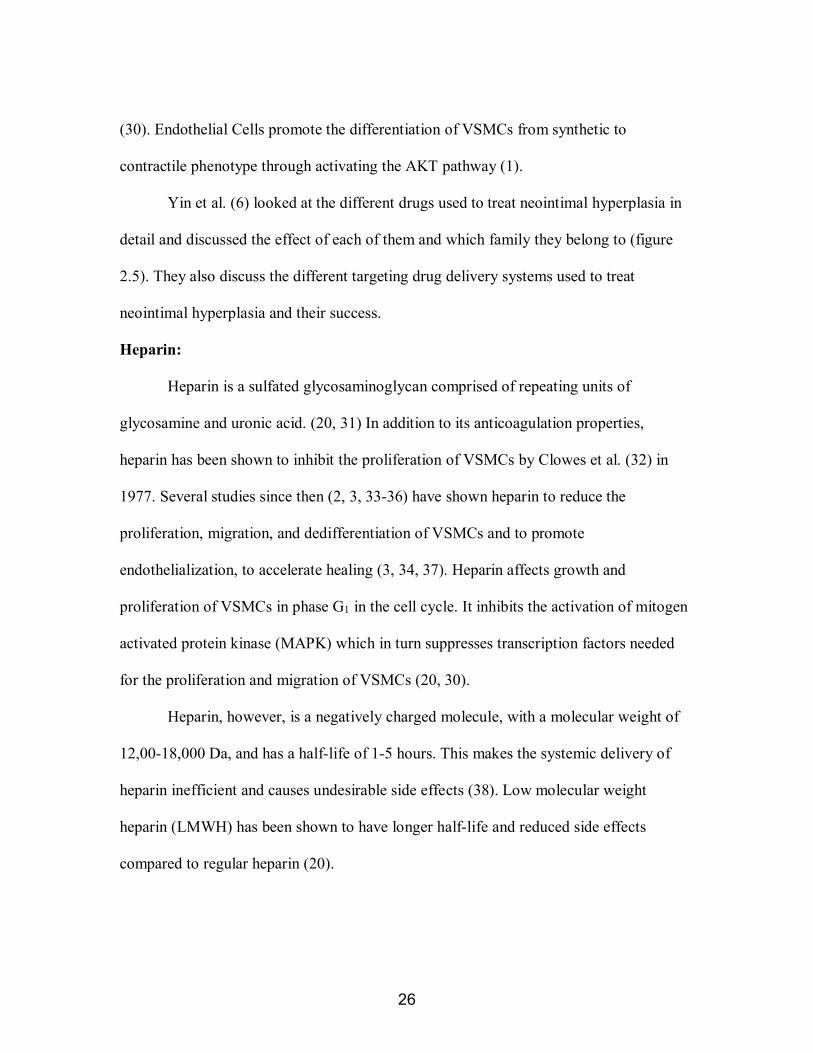
Modeling:
Computational modeling allows us to perform multiple quantitative analyses on a
system and compare different inputs and factors to optimize a system. It helps us perform
these analyses faster, cheaper, and more efficiently. It also gives us control over multiple
factors and allows us to compare theoretical models to physiological and pathological
cases. For magnetically-guided drug targeting (MDT) for the prevention of restenosis,
models of blood vessels provide a detailed look at the mechanics of the interactions
including hemodynamics, velocity, shear stress, external magnetic field, stent geometry
and magnetic properties, and the magnetic drug carriers. A few groups have studied the
effect varying these properties has on the capture efficiency of the particles.
Most models studying MDT systems to blood vessels assume incompressible,
Newtonian flow (39-42). The forces acting on the particles in the majority of the models
Figure 2.7: Schematic of a MDT system using a stent. Figure
adapted from Chorny et al. (47) without permission.
28
were Brownian motion, drag force, and magnetic force, with the assumption that inertia,
gravity, and buoyancy being negligible (41, 43). Figure 2.6 shows the basic design of a
MDT model using a stent.
Chen et al. (41) modeled nanoparticles with radii varying from 0.5 µm to 20 µm,
under a magnetic field ranging from 0.05 to 1.2 T. Unsurprisingly, particles with larger
diameters under stronger magnetic fields had higher capture efficiencies, which was as
high as 60%. They also compared the capture for different stent and particle materials.
Iron particles achieved higher capture efficiencies compared to magnetite particles and a
stainless steel 409 stent had higher captures than a nitinol stent.
Wang et al. (40) had the widest ranges in comparison for their values. They
compared magnetic fields in the range of 1-10 T and particle radii ranging from 10 to 500
nm. While their results were comparable to what was seen before, it is important to note
that they are one of the few groups to model a MDT system with a particle radius smaller
than 100 nm. At 10 nm, they achieved a capture efficiency of 20%, under a magnetic
field of 1 T.
In their study, Mardinoglu et al. (39) analyzed capture efficiency in stretched
vascular wall, which represents a stented artery more accurately. They modeled particles
with a diameter of 0.86 µm, under a field of 0.15-0.6 T. The system performance
decreased by 10% in the stretched vessel than the non-stretched one.

29
Ex-vivo:
Bioreactors are commonly used in tissue engineering research to simulate in vivo
environments to give stem cells the mechanical signals needed to differentiate to the
required cell type. They provide all the in vivo clinical conditions, including
hemodynamics and blood pressure, ex vivo. Additionally, a bioreactor for arterial organ
culture is used to simulate the in vivo conditions to test a drug delivery system. The role
of mechanotransduction is important in the development of both atherosclerosis and
restenosis. Dynamic flow environments have been used previously to study the effect of
mechanical forces on vascular pathology. An ex vivo model allows for a low cost way of
testing different vascular percutaneous devices, with control over more variables such as
blood pressure and blood vessel size. It is also a method to replace, reduce, and refine any
in vivo studies needed.
The use of dynamic ex vivo organ culture models has been assessed in the past.
Carere et al. (44) used an ex vivo model of the coronary artery to study angioplasty
injuries. Han et al. (45) assessed the role played by hypertensive pressure on contractile
responses in common carotid arteries. Perée et al. (46) studied the effects of balloon
angioplasty on carotid arteries. All these studies have validated that the use of ex vivo
dynamic models gives a unique insight into arterial physiology and pathology in response
to mechanical signals, that cell culture alone cannot provide.
30
References:
1. Rzucidlo EM, Martin KA, Powell RJ. Regulation of vascular smooth muscle cell
differentiation. Journal of vascular surgery. 2007;45(6):A25-32.
2. Marx SO, Totary-Jain H, Marks AR. Vascular smooth muscle cell proliferation in
restenosis. Circ Cardiovasc Interv. 2011 Feb 1;4(1):104-11.
3. Orford JL, Selwyn AP, Ganz P, Popma JJ, Rogers C. The comparative pathobiology of
atherosclerosis and restenosis. Am J Cardiol. 2000;86(4):6H-11H.
4. Waite L. Biofluid Mechanics in Cardiovascular Systems. 2006.
5. Lee JM, Park J, Kang J, Jeon K, Jung J, Lee SE, et al. Comparison among drug-eluting
balloon, drug-eluting stent, and plain balloon angioplasty for the treatment of in-stent
restenosis: a network meta-analysis of 11 randomized, controlled trials. JACC:
Cardiovascular Interventions. 2015;8(3):382-94.
6. Yin RX, Yang DZ, Wu JZ. Nanoparticle drug- and gene-eluting stents for the
prevention and treatment of coronary restenosis. Theranostics. 2014 Jan 8;4(2):175-200.
7. Chorny M, Fishbein I, Yellen BB, Alferiev IS, Bakay M, Ganta S, et al. Targeting
stents with local delivery of paclitaxel-loaded magnetic nanoparticles using uniform
fields. Proc Natl Acad Sci U S A. 2010 May 4;107(18):8346-51.

31
8. Forbes ZG, Halverson DS, Fridman G, Yellen BB, Chorny M, Friedman G, et al.
Locally targeted drug delivery to magnetic stents for therapeutic applications. Computer
Architectures for Machine Perception, 2003 IEEE International Workshop on; IEEE;
2003.
9. Räthel T, Mannell H, Pircher J, Gleich B, Pohl U, Krötz F. Magnetic stents retain
nanoparticle-bound antirestenotic drugs transported by lipid microbubbles. Pharm Res.
2012;29(5):1295-307.
10. Owens GK, Kumar MS, Wamhoff BR. Molecular regulation of vascular smooth
muscle cell differentiation in development and disease. Physiol Rev. 2004;84(3):767-801.
11. Strauss BH, Rabinovitch M. Adventitial fibroblasts: defining a role in vessel wall
remodeling. American journal of respiratory cell and molecular biology. 2000;22(1):1-3.
12. Jiménez JM, Davies PF. Hemodynamically driven stent strut design. Ann Biomed
Eng. 2009;37(8):1483-94.
13. Davies PF. Hemodynamic shear stress and the endothelium in cardiovascular
pathophysiology. Nature clinical practice Cardiovascular medicine. 2009;6(1):16-26.
14. Evans DJ, Lawford PV, Gunn J, Walker D, Hose DR, Smallwood RH, et al. The
application of multiscale modelling to the process of development and prevention of
stenosis in a stented coronary artery. Philos Trans A Math Phys Eng Sci. 2008 Sep
28;366(1879):3343-60.

32
15. Wentzel JJ, Krams R, Schuurbiers JC, Oomen JA, Kloet J, van Der Giessen WJ, et al.
Relationship between neointimal thickness and shear stress after Wallstent implantation
in human coronary arteries. Circulation. 2001 Apr 3;103(13):1740-5.
16. He Y, Duraiswamy N, Frank AO, Moore JE. Blood flow in stented arteries: a
parametric comparison of strut design patterns in three dimensions. J Biomech Eng.
2005;127(4):637-47.
17. Kempe H, Kempe M. The use of magnetite nanoparticles for implant-assisted
magnetic drug targeting in thrombolytic therapy. Biomaterials. 2010;31(36):9499-510.
18. Singh R, Lillard JW. Nanoparticle-based targeted drug delivery. Exp Mol Pathol.
2009;86(3):215-23.
19. Karagkiozaki V. Nanomedicine highlights in atherosclerosis. Journal of nanoparticle
research. 2013;15(4):1529.
20. Gu Z, Rolfe BE, Thomas AC, Campbell JH, Lu GM, Xu ZP. Cellular trafficking of
low molecular weight heparin incorporated in layered double hydroxide nanoparticles in
rat vascular smooth muscle cells. Biomaterials. 2011;32(29):7234-40.
21. Cicha I, Lyer S, Alexiou C, Garlichs CD. Nanomedicine in diagnostics and therapy of
cardiovascular diseases: beyond atherosclerotic plaque imaging. Nanotechnology
Reviews. 2013;2(4):449-72.

33
22. Kwon HJ, Shin K, Soh M, Chang H, Kim J, Lee J, et al. Large�scale synthesis and
medical applications of uniform�sized metal oxide nanoparticles. Adv Mater.
2018;30(42):1704290.
23. Benz M. Superparamagnetism: theory and applications. Discussion. 2012.
24. Zhou J, Zhang J, David AE, Yang VC. Magnetic tumor targeting of β-glucosidase
immobilized iron oxide nanoparticles. Nanotechnology. 2013;24(37):375102.
25. Tehrani MD, Yoon J, Kim MO, Yoon J. A novel scheme for nanoparticle steering in
blood vessels using a functionalized magnetic field. IEEE Transactions on Biomedical
Engineering. 2014;62(1):303-13.
26. Connell JJ, Patrick PS, Yu Y, Lythgoe MF, Kalber TL. Advanced cell therapies:
targeting, tracking and actuation of cells with magnetic particles. Regenerative medicine.
2015;10(06):757-72.
27. Polyak B, Fishbein I, Chorny M, Alferiev I, Williams D, Yellen B, et al. High field
gradient targeting of magnetic nanoparticle-loaded endothelial cells to the surfaces of
steel stents. Proc Natl Acad Sci U S A. 2008 Jan 15;105(2):698-703.
28. Angelopoulou A, Voulgari E, Kolokithas-Ntoukas A, Bakandritsos A, Avgoustakis
K. Magnetic nanoparticles for the delivery of dapagliflozin to hypoxic tumors:
physicochemical characterization and cell studies. AAPS PharmSciTech.
2018;19(2):621-33.

34
29. Uthamaraj S, Tefft BJ, Hlinomaz O, Sandhu GS, Dragomir-Daescu D. Ferromagnetic
bare metal stent for endothelial cell capture and retention. JoVE (Journal of Visualized
Experiments). 2015(103):e53100-.
30. Gilotti AC, Nimlamool W, Pugh R, Slee JB, Barthol TC, Miller EA, et al. Heparin
Responses in Vascular Smooth Muscle Cells Involve cGMP‐Dependent Protein Kinase
(PKG). J Cell Physiol. 2014;229(12):2142-52.
31. Pukac LA, Castellot JJ,Jr, Wright TC,Jr, Caleb BL, Karnovsky MJ. Heparin inhibits
c-fos and c-myc mRNA expression in vascular smooth muscle cells. Cell Regul. 1990
Apr;1(5):435-43.
32. Clowes AW, Karnowsky MJ. Suppression by heparin of smooth muscle cell
proliferation in injured arteries. Nature. 1977;265(5595):625-6.
33. Rensen S, Doevendans P, Van Eys G. Regulation and characteristics of vascular
smooth muscle cell phenotypic diversity. Netherlands Heart Journal. 2007;15(3):100-8.
34. Carey DJ. Control of growth and differentiation of vascular cells by extracellular
matrix proteins. Annu Rev Physiol. 1991;53(1):161-77.
35. Castellot JJ, Cochran DL, Karnovsky MJ. Effect of heparin on vascular smooth
muscle cells. I. Cell metabolism. J Cell Physiol. 1985;124(1):21-8.

35
36. Vadiveloo PK, Filonzi EL, Stanton HR, Hamilton JA. G1 phase arrest of human
smooth muscle cells by heparin, IL-4 and cAMP is linked to repression of cyclin D1 and
cdk2. Atherosclerosis. 1997;133(1):61-9.
37. Clowes AW, Clowes MM. Kinetics of cellular proliferation after arterial injury. IV.
Heparin inhibits rat smooth muscle mitogenesis and migration. Circ Res. 1986
Jun;58(6):839-45.
38. Edelman ER, Adams DH, Karnovsky MJ. Effect of controlled adventitial heparin
delivery on smooth muscle cell proliferation following endothelial injury. Proc Natl Acad
Sci U S A. 1990 May;87(10):3773-7.
39. Mardinoglu A, Cregg P, Murphy K, Curtin M, Prina-Mello A. Theoretical modelling
of physiologically stretched vessel in magnetisable stent assisted magnetic drug
targetingapplication. J Magn Magn Mater. 2011;323(3):324-9.
40. Wang S, Zhou Y, Tan J, Xu J, Yang J, Liu Y. Computational modeling of magnetic
nanoparticle targeting to stent surface under high gradient field. Comput Mech.
2014;53(3):403-12.
41. Chen H, Ebner AD, Kaminski MD, Rosengart AJ, Ritter JA. Analysis of magnetic
drug carrier particle capture by a magnetizable intravascular stent—2: parametric study
with multi-wire two-dimensional model. J Magn Magn Mater. 2005;293(1):616-32.
36
42. Sharma S, Singh U, Katiyar V. Modeling and in vitro study on capture efficiency of
magnetic nanoparticles transported in an implant-assisted cylindrical tube under magnetic
field. Microfluidics and Nanofluidics. 2015;19(5):1061-70.
43. Dames P, Gleich B, Flemmer A, Hajek K, Seidl N, Wiekhorst F, et al. Targeted
delivery of magnetic aerosol droplets to the lung. Nature nanotechnology. 2007;2(8):495.
44. Carere R, Koo E, Liu P, Gotlieb A. Porcine coronary artery organ culture: a model for
the study of angioplasty injury. Cardiovascular Pathology. 1992;1(2):107-15.
45. Han H, Ku DN. Contractile responses in arteries subjected to hypertensive pressure in
seven-day organ culture. Ann Biomed Eng. 2001;29(6):467-75.
46. Perrée J, van Leeuwen TG, Kerindongo R, Spaan JA, VanBavel E. Function and
structure of pressurized and perfused porcine carotid arteries: effects of in vitro balloon
angioplasty. The American journal of pathology. 2003;163(5):1743-50.
47. Chorny M, Fishbein I, Forbes S, Alferiev I. Magnetic nanoparticles for targeted
vascular delivery. IUBMB Life. 2011;63(8):613-20.
48. Elhadidy HS, Rizk RY, Dorrah HT. Generalized data stacking programming model
with applications. Journal of Electrical Systems and Information Technology.
2016;3(2):230-60.
49. Biga LM, Dawson S, Harwell A, Hopkins R, Kaufmann J, LeMaster M, et al.
Anatomy & Physiology. Corvallis, Oregon: Oregon State University. 2019.

37
50. Lipinski MJ, Amirbekian V, Frias JC, Aguinaldo JGS, Mani V, Briley‐Saebo KC, et
al. MRI to detect atherosclerosis with gadolinium‐containing immunomicelles targeting
the macrophage scavenger receptor. Magnetic Resonance in Medicine: An Official
Journal of the International Society for Magnetic Resonance in Medicine.
2006;56(3):601-10.
51. Lipinski MJ, Amirbekian V, Frias JC, Aguinaldo JGS, Mani V, Briley�Saebo KC,
et al. MRI to detect atherosclerosis with gadolinium�containing immunomicelles
targeting the macrophage scavenger receptor. Magnetic Resonance in Medicine: An
Official Journal of the International Society for Magnetic Resonance in Medicine.
2006;56(3):601-10.
52. Southworth R, Kaneda M, Chen J, Zhang L, Zhang H, Yang X, et al. Renal vascular
inflammation induced by Western diet in ApoE-null mice quantified by 19F NMR of
VCAM-1 targeted nanobeacons. Nanomedicine: Nanotechnology, Biology and Medicine.
2009;5(3):359-67.
53. Peters D, Kastantin M, Kotamraju VR, Karmali PP, Gujraty K, Tirrell M, et al.
Targeting atherosclerosis by using modular, multifunctional micelles. Proc Natl Acad Sci
U S A. 2009 Jun 16;106(24):9815-9.
54. Tassa C, Shaw SY, Weissleder R. Dextran-coated iron oxide nanoparticles: a versatile
platform for targeted molecular imaging, molecular diagnostics, and therapy. Acc Chem
Res. 2011;44(10):842-52.
38
55. Tu C, Ng TS, Sohi HK, Palko HA, House A, Jacobs RE, et al. Receptor-targeted iron
oxide nanoparticles for molecular MR imaging of inflamed atherosclerotic plaques.
Biomaterials. 2011;32(29):7209-16.
56. Hildebrandt N, Hermsdorf D, Signorell R, Schmitz SA, Diederichsen U.
Superparamagnetic iron oxide nanoparticles functionalized with peptides by electrostatic
interactions. Arkivoc. 2007(5):79-90.
57. Burtea C, Ballet S, Laurent S, Rousseaux O, Dencausse A, Gonzalez W, et al.
Development of a magnetic resonance imaging protocol for the characterization of
atherosclerotic plaque by using vascular cell adhesion molecule-1 and apoptosis-targeted
ultrasmall superparamagnetic iron oxide derivatives. Arterioscler Thromb Vasc Biol.
2012;32(6):e36-48.
58. Lipinski MJ, Frias JC, Amirbekian V, Briley-Saebo KC, Mani V, Samber D, et al.
Macrophage-specific lipid-based nanoparticles improve cardiac magnetic resonance
detection and characterization of human atherosclerosis. JACC Cardiovasc Imaging.
2009 May;2(5):637-47.
59. Winter PM, Caruthers SD, Lanza GM, Wickline SA. Quantitative cardiovascular
magnetic resonance for molecular imaging. J Cardiovasc Magn Reson. 2010;12(1):62.
60. Theoharis S, Krueger U, Tan PH, Haskard DO, Weber M, George AJ. Targeting gene
delivery to activated vascular endothelium using anti E/P-Selectin antibody linked to
PAMAM dendrimers. J Immunol Methods. 2009;343(2):79-90.

39
61. Li D, Patel AR, Klibanov AL, Kramer CM, Ruiz M, Kang B, et al. Molecular
imaging of atherosclerotic plaques targeted to oxidized LDL receptor LOX-1 by
SPECT/CT and magnetic resonance. Circulation: Cardiovascular Imaging.
2010;3(4):464-72.
40
CHAPTER 3
AIM 1.1: PARTICLE SYNTHESIS AND CHARACTERIZATION
Introduction:
Nanoparticles have been used in medicine as drug delivery devices for various
applications (1). The large surface area to volume ratio allows the delivery of sufficient
amounts of drug to a specific site (2). Studies on the in vitro effects of antiproliferative
drugs paired with magnetic nanoparticles have shown success on vascular smooth muscle
cell, which may make them good candidates for the treatment of neointimal hyperplasia
(3-6). In addition, small animal studies have shown that magnetic nanoparticles may be
able to be targeted to stents with external magnetic fields (2, 4). However, there is a lack
of understanding on the effect of the different drug delivery systems on endothelial cells.
For instance, these drug and magnetic nanoparticle systems used drugs similar to those in
DES, which are known to cause delayed endothelialization of the vessel (3, 7, 8).
It is important to understand the role of any proposed drug system on the
proliferation of endothelial cells, to prevent delayed endothelialization that would lead to
late stent thrombosis (3, 9). Heparin has been shown to reduce VSMC proliferation and
dedifferentiation (10-16). It has also been shown to promote endothelialization, to
accelerate healing (10, 12, 13, 17). However, heparin has a very short half-life in the
body limiting its efficacy in vivo (18). In addition, systemic delivery of high doses of
heparin is associated with bleeding risks (18).
41
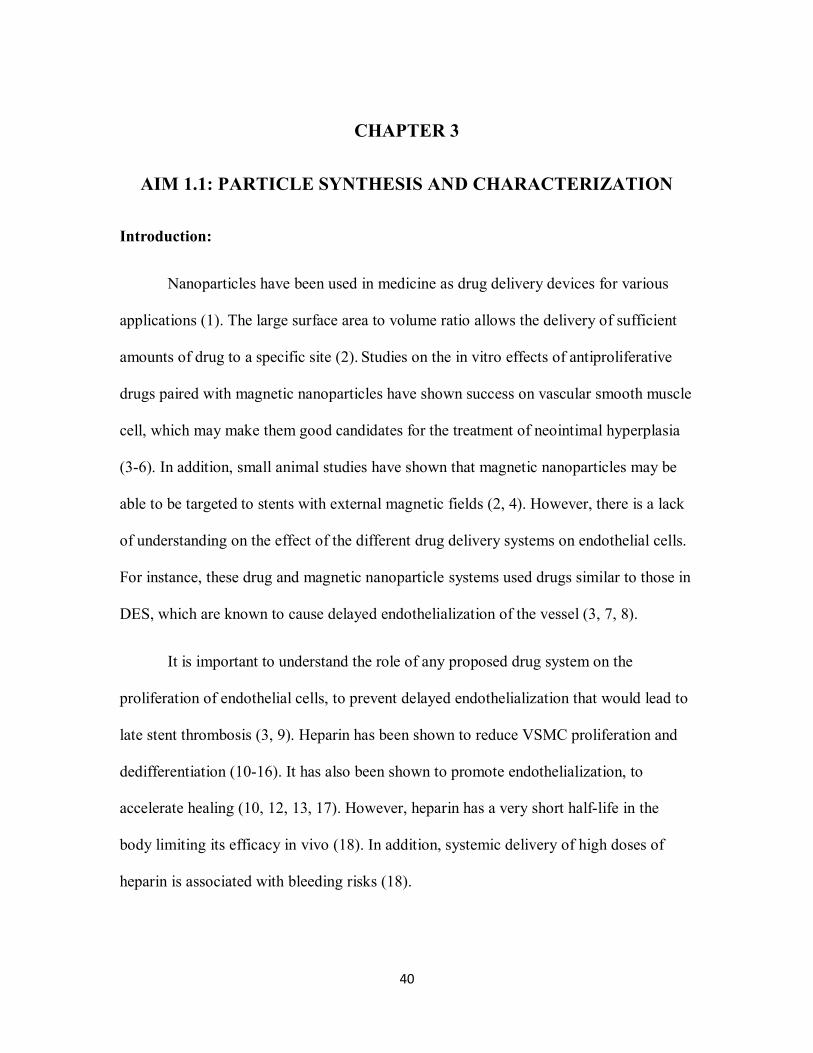
To address this, we developed and tested novel heparin-coated magnetic
nanoparticles to provide targeted delivery to the site of the stent, under an external
magnetic field. This chapter details the synthesis and characterization of two sets of
batches of nanoparticles. For the first set, the core particles were synthesized and
modified using a synthesized polymer, before the attachment of heparin (figure 3.1). For
the second set, amine-terminated nanoparticles were bought from a supplier and heparin
was attached to them.
Materials and Methods:
Iron oxide nanoparticle synthesis (set 1): Iron (III) acetylacetonate (Strem Chemicals,
99%) and oleic acid (Alfa Aesar, 90%) were combined in a 1:15 molar ratio in a 3 –neck
round bottom flask. The flask was input into a solder bath at 370oC, with overhead
stirring and N2 purging at 0.1 L/min. for 4 hours. The reaction was quenched by
removing from the metal bath and letting it sit at room temperature. The nanoparticles
Figure 3.1: A schematic of the nanoparticle synthesis and
functionalization processes.

42
were suspended in hexanes and precipitated with an ethanol (Fisher Scientific, anhydrous
92.7%) and acetone (BDH, 99.5%) mixture and magnetically separated four times.
Finally, the particles were suspended in chloroform (BDH, 99.8%).
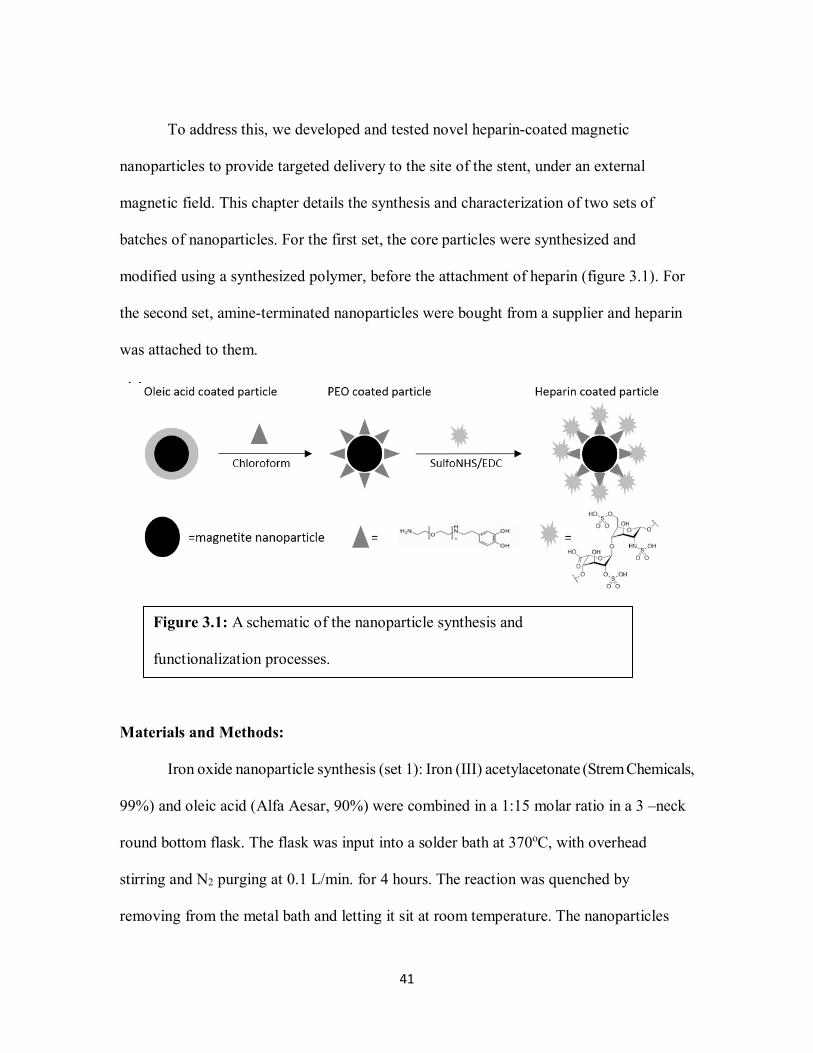
Ligand exchange (set 2): After the synthesis of the magnetite core, a 5000 g/mol
heterobifunctional, dopamine-terminated polyethylene oxide (PEO) polymer was
synthesized as previously published (19). The PEO polymer was attached to the
nanoparticles through a ligand exchange process, to reduce their toxicity. The size of the
polymer was chosen to prevent the aggregation of the nanoparticles, by providing
colloidal stability (20). The polymer was synthesized using a living anionic ring opening
polymerization of ethylene oxide with potassium bitrimethylsilylamide as an initiator and
methane sulphonyl chloride was used to terminate the reaction. The resulting polymer
was then modified with dopamine hydrochloride to add dopamine groups to the end to
attach to the magnetite particle surface and HCl was used to deprotect the amine ends.
The polymer synthesis and modification process is shown in figure 3.2.
The particles suspended in chloroform at approximately 3 mg/mL were injected
into scintillation vile containing previously described PEO polymer suspended in
chloroform at approximately 40 mg/mL, with a septum cap under sonication. The
injection process was done over a 30-minute period then allowed to sit under sonication
for another 30 minutes. The nanoparticle-PEO solution was then allowed to sit for four
days. After four days, chloroform was removed using rotary evaporation process. The
nanoparticles were then resuspended into hexanes, sonicated, magnetically separated, and
resuspended in chloroform and allowed to sit for 2 more days. The washing process was
43
repeated three times. After rotary evaporation for the third time, the particles were
suspended in DI water. They were sonicated briefly to ensure breaking any large
aggregates, then they passed through a 0.22 µm nylon syringe filter. The particles were
centrifuged at 10,000 RPM for 10 minutes, the supernatant was decanted, and the
nanoparticles were dispersed in DI water. To get rid of excess polymer, the particles were
filtered through 50 kDa centrifugal filter units (Millipore).
Heparin Attachment (both sets): Amine-functionalized iron oxide (II,III) magnetic
nanoparticles (Sigma-Aldritch,10 nm) were purchased from supplier (set 2). Amine-
functionalized nanoparticles were mixed with heparin at a 1:3 molar ratio. The aqueous
particle solution was added to a low molecular weight heparin (LMWH, MP Biomedical),
N-hydroxysulfosuccinimide (sulfoNHS, Thermo Scientific), and 1-ethyl-3-(3-
dimethylaminopropyl)carbodiimide hydrochloride (EDC, TCI Chemicals) solution, with
excess sulfoNHS and EDC. The carboxylic acid groups of the LMWH were then attached
to the primary amine groups on the nanoparticle ligand through a sulfoNHS/EDC
Figure 3.2: Synthesis and modification of heterobifunctional PEO polymer.

44
chemical reaction. The solution was allowed to sit on a shake plate for seven days to
allow reaction. To get rid of excess LMWH, sulfoNHS, and EDC, the particles were
filtered through 50 kDa centrifuge filter units.
Characterization: To characterize the size of the magnetic core of the
nanoparticles (set 1), a Hitatchi H7600 transmission electron microscope (TEM) was
used. Dynamic light scattering (DLS) using a Malvern Nano ZS zetasizer with a 633 nm
laser was used to measure the hydrodynamic diameter of the nanoparticles (both sets)
after functionalization with the amine and the heparin. Dimethylmethylene blue (DMMB)
assay was used to quantify the heparin loading onto the nanoparticles (both sets), where
absorbance was measured at 530 nm using a microplate reader. When 1,9-
dimethylmethylene is bound to sulfated glycosaminoglycans, it undergoes a shift in the
absorption spectrum around 525nm (21). Raw heparin was used to obtain a standard
curve and calculate the heparin loading per mass of particle.
Results:
Figure 3.3: TEM image of uncoated iron oxide particles. (Scale Bar
=100nm) and a histogram of nanoparticle magnetic core diameter
distribution. Average particle diameter was found to be 13.4 +/- 1.4 nm.

45
The synthesized nanoparticles, schematically shown in figure 1A, include a
magnetite core with an average diameter of about 13 nm. To characterize the size of the
magnetic core of the nanoparticles, transmission electron microscopy (TEM) was used
(figure 3.3); the average diameter was found to be 13.4 nm ±1.4 nm.
Dynamic light scattering (DLS) was used to measure the hydrodynamic diameter
of the nanoparticles after functionalization with the polymer and the heparin. The results
showed the final particles increase in the hydrodynamic diameter after every step, to
reach an average of 178.9 nm ± 2.2 nm for the first set and 137.1 ± 1.995 nm for the
second set (table 3.1).
Dimethylmethylene blue (DMMB) assay was used to quantify the heparin loading
onto the nanoparticles using optical absorbance (21). Heparin loading was calculated to
be 0.833 ± 0.010 µg heparin/µg nanoparticles for the first set and 0.311 ± 0.015 µg
heparin/µg nanoparticles (figure 3.4).

46
Figure 3.4: Heparin loading quantified via optical absorption using DMMB
assay and normalized to raw heparin. Top (set 1) and bottom (set 2).
Table 3.1: Size characterization of the nanoparticles using DLS after synthesis and
functionalization. Particle size increased with heparin functionalization.
47
Discussion:
The use of heparin in vivo as an anticoagulant has been successful for years.
While its antiproliferative effects on smooth muscle cells have long been shown in the
literature (14, 26, 27), the required heparin concentrations to achieve this effect in vivo
were much higher than those fitting in the therapeutic window of heparin when delivered
systemically (10-16). In this chapter, a novel method of using heparin-coated magnetic
nanoparticles is investigated for the potential delivery of heparin to sites of vascular
injury that may alleviate some of these systemic side effects. Low molecular weight
heparin (LMWH) was chosen over regular heparin because of its longer half-life and
reduced side effects (18, 28, 29).
The core particle size was chosen because particles with diameters less than 10
nm have been shown to be filtered quickly by the kidneys and the liver filters particles
with diameters larger than 30 nm (24, 25). The core diameter of the first set of particles
was measured to be 13.4 nm and for the second set it was reported to be about 10 nm.
The hydrodynamic diameter measured by DLS showed a difference in the diameters of
the two sets. That is attributed to the length of the PEO used as a spacer for the first set.
For heparin loading, the first set had more than twice the loading of the second
set. The large polymer spacer allows for more negatively-charged heparin molecules to
attach to the amine ends. However, the heparin loading on the second set is considered
acceptable compared to the concentration needed to achieve the desired cell response.

48
Conclusions:
We were successfully able to synthesize heparin-coated magnetic nanoparticles
and achieve high heparin loading, both by synthesizing and modifying purchased
nanoparticles. To improve the yield and heparin loading from the preliminary results, the
nanoparticle synthesis process needs to be optimized.
References:
1. Kempe H, Kempe M. The use of magnetite nanoparticles for implant-assisted magnetic
drug targeting in thrombolytic therapy. Biomaterials. 2010;31(36):9499-510.
2. Singh R, Lillard JW. Nanoparticle-based targeted drug delivery. Exp Mol Pathol.
2009;86(3):215-23.
3. Chorny M, Fishbein I, Yellen BB, Alferiev IS, Bakay M, Ganta S, et al. Targeting
stents with local delivery of paclitaxel-loaded magnetic nanoparticles using uniform
fields. Proc Natl Acad Sci U S A. 2010 May 4;107(18):8346-51.
4. Kempe H, Kempe M. The use of magnetite nanoparticles for implant-assisted magnetic
drug targeting in thrombolytic therapy. Biomaterials. 2010;31(36):9499-510.
5. Forbes ZG, Halverson DS, Fridman G, Yellen BB, Chorny M, Friedman G, et al.
Locally targeted drug delivery to magnetic stents for therapeutic applications. Computer
Architectures for Machine Perception, 2003 IEEE International Workshop on; IEEE;
2003.

49
6. Räthel T, Mannell H, Pircher J, Gleich B, Pohl U, Krötz F. Magnetic stents retain
nanoparticle-bound antirestenotic drugs transported by lipid microbubbles. Pharm Res.
2012;29(5):1295-307.
7. Lee JM, Park J, Kang J, Jeon K, Jung J, Lee SE, et al. Comparison among drug-eluting
balloon, drug-eluting stent, and plain balloon angioplasty for the treatment of in-stent
restenosis: a network meta-analysis of 11 randomized, controlled trials. JACC:
Cardiovascular Interventions. 2015;8(3):382-94.
8. Lagerqvist B, James SK, Stenestrand U, Lindbäck J, Nilsson T, Wallentin L. Long-
term outcomes with drug-eluting stents versus bare-metal stents in Sweden. N Engl J
Med. 2007;356(10):1009-19.
9. Yin RX, Yang DZ, Wu JZ. Nanoparticle drug- and gene-eluting stents for the
prevention and treatment of coronary restenosis. Theranostics. 2014 Jan 8;4(2):175-200.
10. Orford JL, Selwyn AP, Ganz P, Popma JJ, Rogers C. The comparative pathobiology
of atherosclerosis and restenosis. Am J Cardiol. 2000;86(4):6H-11H.
11. Rensen S, Doevendans P, Van Eys G. Regulation and characteristics of vascular
smooth muscle cell phenotypic diversity. Netherlands Heart Journal. 2007;15(3):100-8.
12. Clowes AW, Karnowsky MJ. Suppression by heparin of smooth muscle cell
proliferation in injured arteries. Nature. 1977;265(5595):625-6.

50
13. Carey DJ. Control of growth and differentiation of vascular cells by extracellular
matrix proteins. Annu Rev Physiol. 1991;53(1):161-77.
14. Castellot JJ, Cochran DL, Karnovsky MJ. Effect of heparin on vascular smooth
muscle cells. I. Cell metabolism. J Cell Physiol. 1985;124(1):21-8.
15. Vadiveloo PK, Filonzi EL, Stanton HR, Hamilton JA. G1 phase arrest of human
smooth muscle cells by heparin, IL-4 and cAMP is linked to repression of cyclin D1 and
cdk2. Atherosclerosis. 1997;133(1):61-9.
16. Marx SO, Totary-Jain H, Marks AR. Vascular smooth muscle cell proliferation in
restenosis. Circ Cardiovasc Interv. 2011 Feb 1;4(1):104-11.
17. Clowes AW, Clowes MM. Kinetics of cellular proliferation after arterial injury. IV.
Heparin inhibits rat smooth muscle mitogenesis and migration. Circ Res. 1986
Jun;58(6):839-45.
18. Gu Z, Rolfe BE, Thomas AC, Campbell JH, Lu GM, Xu ZP. Cellular trafficking of
low molecular weight heparin incorporated in layered double hydroxide nanoparticles in
rat vascular smooth muscle cells. Biomaterials. 2011;32(29):7234-40.
19. Stone R, Fellows B, Qi B, Trebatoski D, Jenkins B, Raval Y, et al. Highly stable
multi-anchored magnetic nanoparticles for optical imaging within biofilms. J Colloid
Interface Sci. 2015;459:175-82.

51
20. Saville SL, Woodward RC, House MJ, Tokarev A, Hammers J, Qi B, et al. The effect
of magnetically induced linear aggregates on proton transverse relaxation rates of
aqueous suspensions of polymer coated magnetic nanoparticles. Nanoscale.
2013;5(5):2152-63.
21. Farndale RW, Buttle DJ, Barrett AJ. Improved quantitation and discrimination of
sulphated glycosaminoglycans by use of dimethylmethylene blue. Biochimica et
Biophysica Acta (BBA)-General Subjects. 1986;883(2):173-7.
22. Cullity BD, Graham CD. Introduction to magnetic materials. John Wiley & Sons;
2011.
23. Benz M. Superparamagnetism: theory and applications. Discussion. 2012.
24. Lewinski N, Colvin V, Drezek R. Cytotoxicity of nanoparticles. small. 2008;4(1):26-
49.
25. Cheng F, Su C, Yang Y, Yeh C, Tsai C, Wu C, et al. Characterization of aqueous
dispersions of Fe 3 O 4 nanoparticles and their biomedical applications. Biomaterials.
2005;26(7):729-38.
26. Pukac LA, Castellot JJ,Jr, Wright TC,Jr, Caleb BL, Karnovsky MJ. Heparin inhibits
c-fos and c-myc mRNA expression in vascular smooth muscle cells. Cell Regul. 1990
Apr;1(5):435-43.
52
27. Gilotti AC, Nimlamool W, Pugh R, Slee JB, Barthol TC, Miller EA, et al. Heparin
Responses in Vascular Smooth Muscle Cells Involve cGMP‐Dependent Protein Kinase
(PKG). J Cell Physiol. 2014;229(12):2142-52.
28. Fellows BD, Ghobrial N, Mappus E, Hargett A, Bolding M, Dean D, et al. In vitro
studies of heparin-coated magnetic nanoparticles for use in the treatment of neointimal
hyperplasia. Nanomedicine. 2018 Mar 8;14(4):1191-200.
29. Gunn J, Cumberland D. Stent coatings and local drug delivery; state of the art. Eur
Heart J. 1999 Dec;20(23):1693-700.

53
CHAPTER 4
AIM 1.2: IN VITRO STUDIES
Introduction:
After injury, VSMCs have a shift towards a proliferative phenotype and enter the
cell cycle (1). Synthetic VSMCs show a higher rate of migration and proliferation (1).
The expression of contractile proteins is reduced and extracellular matrix components are
produced (1). These changes contribute to the thickening of the intima media. Although
restenosis is caused predominantly by the proliferation and migration of VSMCs, the
roles played by endothelial cells and fibroblasts cannot be ignored. Endothelial cells in
the tunica intima act as a selectively permeable barrier to prevent contact between
VSMCs and growth factors circulating in the blood (2). Consequently, the endothelial
layer inhibits intimal hyperplasia (2). Contrary to endothelial cells, fibroblasts role in
restenosis is not well understood, however, recent studies have found that after injuries to
the endothelial layer, myofibroblasts have been located in the adventitial layer (3). These
fibroblasts have been found to express smooth muscle cell markers, such as smooth
muscle actin and vimentin (3).
We developed and tested novel heparin-coated magnetic nanoparticles to provide
targeted delivery to the site of the stent, under an external magnetic field. In this chapter,
we investigate the effect heparin-coated magnetic nanoparticles have on the viability and
proliferation of human vascular cells in vitro.
54
Materials and Methods:
Cell Culture: Vascular human cells were cultured in standard conditions, using the
necessary cell culture media for each cell line. For these studies, human aortic smooth
muscle cells (hAoSMC), human umbilical vein endothelial cells (hUVEC), and human
dermal fibroblasts (hDF) were used. Recommended cell culture growth media (Cell
Applications, INC, 311-500, 211-500, and 116-500) was used for each cell line.
Uptake: To assess the cell uptake of the nanoparticles, TEM was used on
hUVECs. Cells were seeded at 200,000 cells/ flask in two T75 flasks. One flask was
treated with cell culture media with heparin coated nanoparticles at a 200 µg/mL
concentration and the other with cell culture media as a control. Cells were incubated in
standard conditions for 72 hours. After a three-day incubation, the cells were trypsinized
and centrifuged to form a pellet. The pellet was fixed with 3% glutaraldehyde, osmified
using 1% osmium tetroxide, dehydrated in a series of ethanol, and then infiltrated and
embedded in LR White (4). Ultrathin sections (70-90 nm) were cut using a microtome
and mounted on Formvar coated copper grids. A Hitachi H7600 TEM at 100kV was used
for imaging. EDX was used to confirm the presence of iron inside the cells.
Viability: The viability of each cell line was assessed using a live/dead assay to
get both quantitative and qualitative results. Cells were plated in a 24-well plate with
12,000 cells/well and incubated in cell culture media for 24 hours. After cell attachment,
media was aspirated and nanoparticles at different concentrations were added to each
well in quadruplicates and allowed to incubate for 72 hours, with cell culture media being
55
used as a control. After incubation, nanoparticle/media solutions were aspirated, cells
were washed 3 times with Phosphate Buffered Saline (PBS), then a solution of Live/Dead
assay using ethidium homodimer-1 (EtD-1) and calcein AM (Invitrogen) was added to
each well. The solution was made with 1 µL/mL EtD-1 in PBS and 0.25 µL/mL calcein
in PBS. A positive control with only EtD-1 or calcein was also prepared. Florescence was
measured at 485 nm emission and 530 excitation, using a microplate reader, for
quantitative results. The (% Live cells) was calculated according to the manufacturer’s
protocol and normalized to the control. Light imaging using an EVOS FL microscope
was used to assess the viability qualitatively.
Proliferation: Proliferation studies were done on all three cell lines using MTS
assay to compare the proliferation of the cells at different nanoparticle concentrations to
nanoparticle-free controls. The MTS tetrazolium compound, [3-(4,5-dimethylthiazol-2-
yl)-5-(3- carboxymethoxyphenyl)-2-(4-sulfophenyl)-2H-tetrazolium], reacts with live,
attached cells to form a colored product, formazan. Cells were plated in a 24-well plate
with 12,000 cells/well and incubated in cell culture media for 24 hours. After cell
attachment, media was aspirated and nanoparticles at different concentrations were added
to each well in quadruplicates and allowed to incubate for 72 hours, with cell culture
media being used as a control. hAoSMCs were treated with TGF-β for 24 hours, before
treatment with the nanoparticles. After incubation, nanoparticle/media solution was
aspirated, cells were washed three times with PBS, and MTS assay solution was added to
each well at 1mL/well. The solution was prepared by mixing CellTiter Aqueous One
Solution Cell Proliferation Assay (Promega) with cell culture media in a 1:5 ratio. The
56
cells were incubated for 4 hours with the MTS solution at 370 C, then triplicates of 180
µL from each well were transferred to a 96-well plate, giving nine replicates of each
treatment. Absorbance was measured at 490 nm using a microplate reader. Percent
proliferation was calculated and normalized to the control.
Gene Expression: Real-time polymerase chain reaction (qRT-PCR) was used to
assess the effect of the nanoparticles on the phenotype of the hAoSMCs. Cells were
treated with TGF-β for 24 hours before treatment with the nanoparticles. Cells were
seeded at 200,000 cells/ flask in two T75 flasks. One flask was treated with cell culture
media with heparin-coated nanoparticles at a 50 µg/mL concentration and the other with
cell culture media as a control. Cells were incubated in standard conditions for 72 hours.
Total RNA was collected from cells using TRIzol Reagent (Invitrogen). RNA
purification was carried out per the manufacturer’s instructions. Single-stranded cDNA
was obtained using the High Capacity cDNA Reverse Transcription Kit (Applied
Biosystems) following the manufacturer’s protocol. cDNA was then amplified in PCR
using PowerUp SYBR Green Master Mix (Applied Biosystems) and specific primers
(Integrated DNA Technologies). Amplification was performed using a StepOnePlus
Real-Time PCR System (Applied Biosystems) with appropriate settings based upon the
SYBR Green protocol. In hAoSMCs gene markers for smooth muscle 22 alpha (SM-
22α), calponin, and collagen type I were checked for changes in expression.
Glyceraldehyde-3-Phosphate Dehydrogenase (GAPDH) was used as a reference gene.
Immunofluorescence: hAoSMCs were plated in a 6-well plate with 50,000
cells/well and incubated in cell culture media for one day. Cells were treated with TGF-β

57
for 24 hours before treatment with the nanoparticles. Media was aspirated and
nanoparticles at 50 µg/mL added to half the wells with cell culture media used as a
control on the other half and allowed to incubate for 72 hours. After incubation, media
was aspirated and cells were washed with PBS three times. Cells were fixed with a 4%
formaldehyde (Sigma), 0.1% glutaraldehyde (Polysciences, Inc.) solution at room
temperature for 20 minutes. Cells were permeabilized with a 0.1% Triton X-100 (Sigma)
solution at room temperature for 15 minutes then blocked with a 2% blocking solution
with 3% goat serum for 30 minutes at room temperature. A primary mouse antibody for
alpha smooth muscle actin (Invitrogen, MA5-11547) at 1:500 ratio was added then
allowed to incubate overnight in the fridge. Alexa Fluor 488 secondary antibody (Thermo
Fisher Scientific) solution at 4 µL/mL was added for two hours at room temperature.
Alexa Fluor 568 Phalloidin (Thermo Fisher Scientific) was added at a concentration of
2.5% in PBS for 20 minutes at room temperature to stain for the actin cytoskeleton of the
cell. 300 nM DAPI (4′,6-diamidino-2-phenylindole, Thermo Fisher Scientific) was added
for 5 minutes at room temperature to stain for cell nuclei. Cells were rinsed three times
with 1X PBS (Alfa Aesar) between every solution change. Cells were imaged using an
EVOS FL light microscope at low and high magnifications.
Statistical Analysis: An analysis of variance (ANOVA) with α=0.05 for random
effects was performed for proliferation and cell viability to compare the effect of the
different concentrations of nanoparticles on the cells. Dunnett’s post hoc test was used to
compare the different treated groups to the control. A student t-test with α=0.1 was used
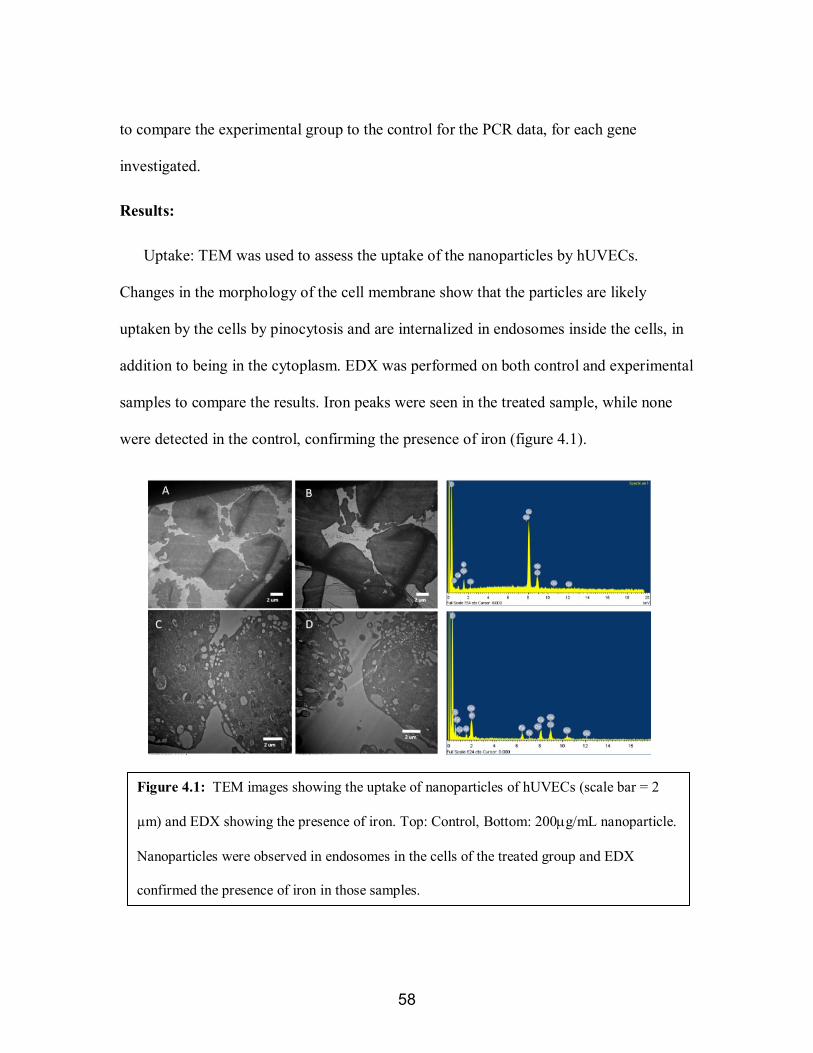
58
to compare the experimental group to the control for the PCR data, for each gene
investigated.
Results:
Uptake: TEM was used to assess the uptake of the nanoparticles by hUVECs.
Changes in the morphology of the cell membrane show that the particles are likely
uptaken by the cells by pinocytosis and are internalized in endosomes inside the cells, in
addition to being in the cytoplasm. EDX was performed on both control and experimental
samples to compare the results. Iron peaks were seen in the treated sample, while none
were detected in the control, confirming the presence of iron (figure 4.1).
Figure 4.1: TEM images showing the uptake of nanoparticles of hUVECs (scale bar = 2
µm) and EDX showing the presence of iron. Top: Control, Bottom: 200µg/mL nanoparticle.
Nanoparticles were observed in endosomes in the cells of the treated group and EDX
confirmed the presence of iron in those samples.

59
Viability: Quantitative viability results (figure 4.2), normalized to the control, show no
statistically significant difference between the viability of the cells treated with the
nanoparticles and the control in any of the cell lines tested at any nanoparticle
concentrations. None of the reductions exceeded 10% of that of the control. Qualitative
results (figure 4.2) confirm the results calculated quantitatively. The images show a
majority of green with very few cells stained red.
Proliferation: The effects of the nanoparticles on the proliferation of the different
cell lines was analyzed after a 72-hour incubation using MTS. The results (figure 4.3)
show an increase in the proliferation of hUVECs compared to the control that is
statistically significant at most concentrations and a statistically significant reduction of
at least 12% in the proliferation of the hAoSMCs compared to the control at all
concentrations. There was no statistically significant change in the proliferation of hDFs
at lower concentrations and a slight reduction at higher concentrations. These results
confirm a suppression in the proliferation of smooth muscle cells after treatment with the
nanoparticles even at concentrations as low as 10 µg/mL.
Gene Expression: Gene expression was assessed using qRT-PCR. (figure 4.4) The
expression of SM 22a was higher (P<0.1) in the treated cells compared to the control.
The expression of calponin was increased in the treated cells and the expression of
collagen was reduced.
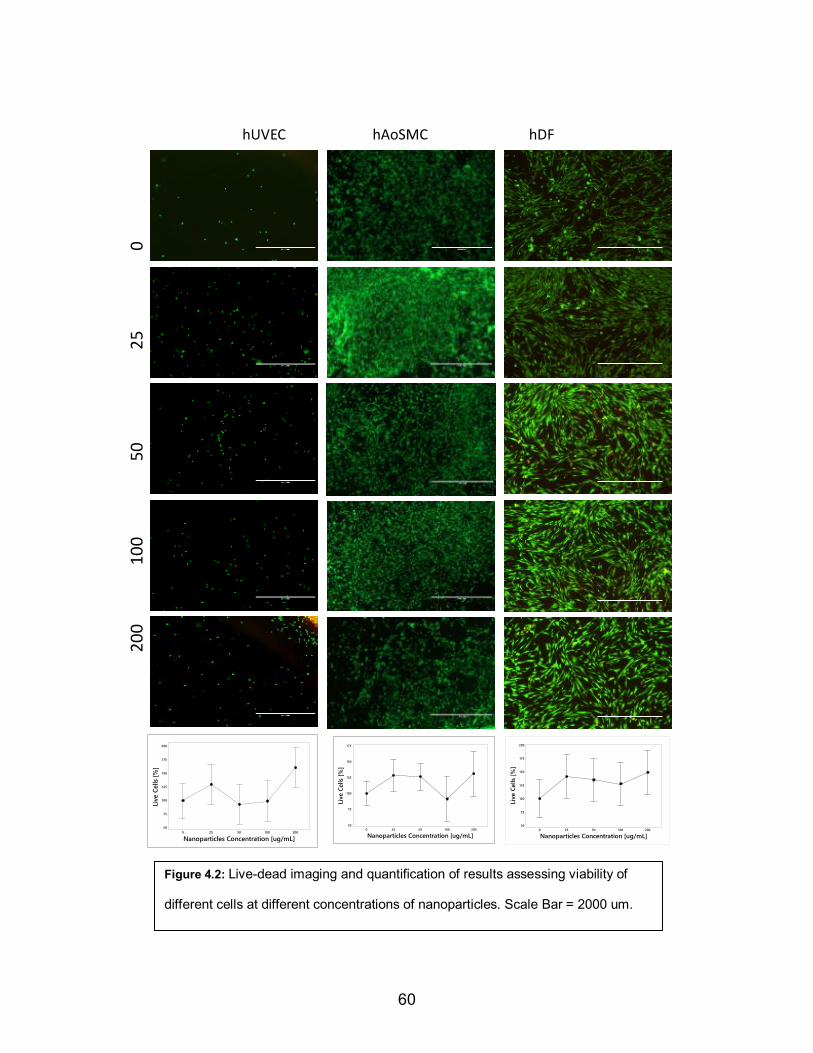
60
hUVEC hAoSMC hDF 20
0
1
00
50
2
5
0
20010050250
200
175
150
125
100
75
50
Nanoparticles Concentration [ug/mL]
Live
Cel
ls [%
]
20010050250
200
175
150
125
100
75
50
Nanoparticles Concentration [ug/mL]
Live
Cel
ls [%
]
20010050250
175
150
125
100
75
50
Nanoparticles Concentration [ug/mL]
Live
Cel
ls [%
]
Figure 4.2: Live-dead imaging and quantification of results assessing viability of
different cells at different concentrations of nanoparticles. Scale Bar = 2000 um.

61
Figure 4.3: MTS assay results assessing cell proliferation at different
concentrations of nanoparticles. Nanoparticle treatment increased HUVEC
proliferation while it decreased hAoSMC proliferation. (ANOVA: α=0.05)
Figure 4.4: qRT-PCR data showing expression of three genes
compared in the control and nanoparticle treated hAoSMC.

62
Immunofluorescence: Immunofluorescence was used to visualize the changes in
the morphology of hAoSMCs and the changes in marker expression compared to the
control (figure 4.5). Changes in the morphology were noticed between the control and
treated groups at low and high magnifications. (Figure 4C). In addition, there was a
marked increase in the alpha smooth muscle actin staining (green) in the treated groups
compared to the control.
Low Magnification (400 um) High Magnification (100 um)
50
ug/m
L
Con
trol
Figure 4.5: Immunofluorescence images at low and high magnifications of
representative hAoSMCs in control and 50µg/ml nanoparticle conditions. The top
row shows the synthetic phenotype and the bottom shows the contractile phenotype
after treatment with nanoparticles at low magnification (scale bar = 400um) and
high magnification (scale bar = 100um). Red=actin filaments. Green=alpha smooth
muscle actin. Blue=DAPI. Treated cells showed more alpha smooth muscle actin
(green) staining.

63
Discussion:
The uptake results agree with the results seen by Gu et al. (5) that showed
LMWH-carrying particles and raw LMWH being uptaken to endosomes with pinocytosis
in rat vascular smooth muscle cells. They show that LMWH-carrying particles, however,
were able to escape from the endosomes, which prevents the degradation of heparin by
lysosomes. The use of heparin in vivo as an anticoagulant has been successful for years.
While its antiproliferative effects on smooth muscle cells have long been shown in the
literature (6-8), the required heparin concentrations to achieve this effect in vivo were
much higher than those fitting in the therapeutic window of heparin when delivered
systemically (2, 6, 9-13). Previous studies by our group compared the effect of heparin-
coated magnetic nanoparticles produced by different methods to raw heparin. These
showed that the nanoparticles were significantly more efficient at reducing the
proliferation of smooth muscle cells than the raw heparin (14).
The current nanoparticle design improves on these results as these particles have
significantly less adverse toxicity effects in-vitro than the previous design. The results
presented here show that the heparin nanoparticles are non-toxic to cells in vitro at
concentrations as high as 200 µg/mL. The nanoparticles reduced the proliferation of the
smooth muscle cells at concentrations as low as 10 µg/mL, corresponding to 83.3 µg
heparin/mL. This heparin concentration is comparable to the ranges seen in systemic
delivery in previous studies (2, 6, 9-13). The proliferation of hDFs was not changed at
lower concentrations and was reduced slightly at higher concentrations, which is
64
consistent to the results seen by Castellot et al. (6) using raw heparin at similar
concentrations.
Our results indicate that there is a change in the phenotype of the smooth muscle
cells. Vascular smooth muscle cell phenotypic shift between contractile and to synthetic
phenotypes is on a scale rather than a binary change (10). In our study, cells were treated
with TGF-β prior to the start of treatment. TGF-β induces the hAoSMC towards a more
proliferative synthetic phenotype in vitro, which is similar to the phenotype of the cells in
an injured or disease in vivo environment (15). Following nanoparticle treatment, these
more synthetic hAoSMC cells seem to be shifting to more contractile-like phenotypes as
was visualized using immunofluorescence and confirmed by PCR. Treated cells had a
more spindle shape with organized aligned fibers that is associated with the contractile
phenotype (figure 4.5), while the control cells were rhomboid in shape with randomly
oriented fibers. A higher staining of alpha smooth muscle actin was also seen in the
treated cells. While not all the changes in the gene expression were statistically
significant, they showed a trend in the contractile phenotype direction. Taken together
with the proliferation assay results, this suggests that heparin-coated iron oxide
nanoparticles could have promise for the treatment of vascular injury or disease as they
increase endothelial cell proliferation while keeping vascular smooth muscle cells in a
less proliferative more contractile-like phenotype.
The concentrations of nanoparticles tested here fall in the range that has been used
by others investigating magnetic nanoparticle targeting to stents. These prior studies have
found that concentrations around 50 µg/mL are relevant to in vivo particle capture with
65
magnetic fields. For instance, Aviles et al. achieved a capture efficiency of 50% ex vivo
using a concentration of 50 µg/mL with a fluid velocity of 42.4 cm/s and a magnetic field
of 0.65 T (16). Chorny et al. had a 4.4% capture efficiency in vivo, in the arterial tissue,
using a particle concentration of 20 µg/mL of paclitaxel-loaded particles (17).
Endothelial cells have been shown to reduce the proliferation of smooth cells and
fibroblasts change their phenotype to myofibroblasts when the adjacent smooth muscle
cells are completely synthetic. The studies shown in this chapter show that for future
studies, nanoparticle concentration < 50 µg/mL could be safely and effectively used.
Conclusions:
The synthesized nanoparticles are nontoxic to cells and reduce the proliferation
and dedifferentiation of vascular smooth muscle cells while promoting endothelialization,
which is consistent with the results of delivering heparin systemically. Nanoparticle
concentrations of < 50 µg/mL are relevant for further in vivo investigations. These
particles show promise as a localized treatment of neointimal hyperplasia which is turn
leads to the prevention of restenosis without the side effects associated with the current
treatments.
References:
1. Rzucidlo EM, Martin KA, Powell RJ. Regulation of vascular smooth muscle cell
differentiation. Journal of vascular surgery. 2007;45(6):A25-32.
2. Marx SO, Totary-Jain H, Marks AR. Vascular smooth muscle cell proliferation in
restenosis. Circ Cardiovasc Interv. 2011 Feb 1;4(1):104-11.

66
3. Strauss BH, Rabinovitch M. Adventitial fibroblasts: defining a role in vessel wall
remodeling. American journal of respiratory cell and molecular biology. 2000;22(1):1-3.
4. Ng C, Li J, Perumalsamy R, Watt F, Yung L, Bay B. Localizing cellular uptake of
nanomaterials in vitro by transmission electron microscopy.
Microsc.Sci.Technol.Appl.Educ. 2010;1:316-20.
5. Gu Z, Rolfe BE, Thomas AC, Campbell JH, Lu GM, Xu ZP. Cellular trafficking of
low molecular weight heparin incorporated in layered double hydroxide nanoparticles in
rat vascular smooth muscle cells. Biomaterials. 2011;32(29):7234-40.
6. Castellot JJ, Cochran DL, Karnovsky MJ. Effect of heparin on vascular smooth muscle
cells. I. Cell metabolism. J Cell Physiol. 1985;124(1):21-8.
7. Pukac LA, Castellot JJ,Jr, Wright TC,Jr, Caleb BL, Karnovsky MJ. Heparin inhibits c-
fos and c-myc mRNA expression in vascular smooth muscle cells. Cell Regul. 1990
Apr;1(5):435-43.
8. Gilotti AC, Nimlamool W, Pugh R, Slee JB, Barthol TC, Miller EA, et al. Heparin
Responses in Vascular Smooth Muscle Cells Involve cGMP‐Dependent Protein Kinase
(PKG). J Cell Physiol. 2014;229(12):2142-52.
9. Orford JL, Selwyn AP, Ganz P, Popma JJ, Rogers C. The comparative pathobiology of
atherosclerosis and restenosis. Am J Cardiol. 2000;86(4):6H-11H.
67
10. Rensen S, Doevendans P, Van Eys G. Regulation and characteristics of vascular
smooth muscle cell phenotypic diversity. Netherlands Heart Journal. 2007;15(3):100-8.
11. Clowes AW, Karnowsky MJ. Suppression by heparin of smooth muscle cell
proliferation in injured arteries. Nature. 1977;265(5595):625-6.
12. Carey DJ. Control of growth and differentiation of vascular cells by extracellular
matrix proteins. Annu Rev Physiol. 1991;53(1):161-77.
13. Vadiveloo PK, Filonzi EL, Stanton HR, Hamilton JA. G1 phase arrest of human
smooth muscle cells by heparin, IL-4 and cAMP is linked to repression of cyclin D1 and
cdk2. Atherosclerosis. 1997;133(1):61-9.
14. Fellows BD, Ghobrial N, Mappus E, Hargett A, Bolding M, Dean D, et al. In vitro
studies of heparin-coated magnetic nanoparticles for use in the treatment of neointimal
hyperplasia. Nanomedicine. 2018 Mar 8;14(4):1191-200.
15. Guo X, Chen SY. Transforming growth factor-beta and smooth muscle
differentiation. World J Biol Chem. 2012 Mar 26;3(3):41-52.
16. Aviles MO, Chen H, Ebner AD, Rosengart AJ, Kaminski MD, Ritter JA. In vitro
study of ferromagnetic stents for implant assisted-magnetic drug targeting. J Magn Magn
Mater. 2007;311(1):306-11.
68
17. Chorny M, Fishbein I, Yellen BB, Alferiev IS, Bakay M, Ganta S, et al. Targeting
stents with local delivery of paclitaxel-loaded magnetic nanoparticles using uniform
fields. Proc Natl Acad Sci U S A. 2010 May 4;107(18):8346-51.

69
CHAPTER 5
AIM 2: COMPUTATIONAL MODELING
Introduction:
Historically, in vitro and in vivo studies were the only available options to
evaluate the safety and effectiveness of our drug delivery system. Recently, the use of
computational models has increased in evaluating drugs and medical devices, due to their
ability to provide faster, cheaper, accurate, and patient specific results. Theoretical and
computational models allow us to control multiple factors and offer a supplementary look
at the different designs and their success. Models of blood vessels also provide a detailed
look at the mechanical interactions including blood flow mechanics, velocity, and shear
stress and how they affect the endothelium and the vascular smooth muscle cells in the
medial layer.
To fully understand the dynamics of the magnetic field with the nanoparticles,
stent, blood flow, and the stented artery, we used a computational model to simulate the
interactions between the different components of our system. This model allowed us to
test different assumptions and evaluate the efficacy of our drug delivery system. It also
allowed us to examine different options for stent materials and strut geometries, to be
able to select the ideal stent for our system.
Materials and Methods:
Geometry: The fluid dynamics, magnetic field, and particle tracing for fluid flow

70
packages of COMSOL Multiphysics were utilized to create a 2D axisymmetric model of
a stented artery. The use of a 2D model rather than a 3D version reduced the
computational cost of each simulation. The artery was modeled as a channel with a radius
of 3 mm and a height of 250 mm (1). The vascular wall is composed of intima, media,
and adventitia layers of thicknesses 0.230 mm, 0.306 mm, and 0.340 mm, respectively (2,
3). The arterial wall has a Young’s modulus of 3x10⁸ Pa and a Poisson’s ratio of 0.27 (4).
The model geometry is shown in figure 5.1.
Geometry descriptions were classified by the geometric shape of an individual
strut (figure 5.2). Two models included rectangular stent geometries and the third model
included a circular arc geometry. The rectangular models differed through varying aspect
ratios (AR) of width to height, w:h, where one model had an AR equal to 6:1 (R6:1) the
Figure 5.1: The design of the 2D axisymmetric model of a stented artery.

71
other had an AR equal to 3:1 (R3:1). The circular stent geometry had an AR of 6:1
(A6:1). Each model included six struts of equal strut height, 0.2 mm, and distance
between each strut, 0.2 mm (2).
Hemodynamics: The flow in the channel was treated as Newtonian and
incompressible and modeled by solving the Navier-Stokes equations. The blood inlet
velocity profile (𝑢𝑢(𝑟𝑟, 𝑡𝑡)) is defined by the following equation (5):
𝑢𝑢(𝑟𝑟, 𝑡𝑡) =1.525𝜌𝜌
4𝜇𝜇�(cos(2𝜋𝜋𝑡𝑡) + 1.55)��
𝐷𝐷2�
2
− 𝑟𝑟2��
R6:1 R3:1 A6:1
Figure 5.2: The different stent strut geometry tested. The stented artery geometry of) rectangular 3:1, rectangular 6:1, and circular arc 6:1, including
both the arterial model and single stent strut.
w h

72
where the blood density, ρ, dynamic viscosity, μ, are 1060 kg/m3 and 4x10⁻³ Pa•s,
respectively (2). D is the cavity diameter, t is time and r is the radial spatial coordinate.
The pulsatile flow model was preferred over a steady flow model, as it more accurately
depicts the pulsatile nature of blood flow. Additionally, the cavity wall was given a roller
boundary condition to allow for arterial wall movement. This wall motion gains
additional legitimacy from the properties of the three arterial layers to the model (2, 3).
Blood was assumed to be a homogeneous continuum. This assumption is valid in
medium and large sized blood vessels, because they have diameters much larger than that
of a red blood cell, so the blood seems homogeneous (6).
Magnetic properties: The magnetization of the stent was modeled as (7):
𝐵𝐵�⃑ = 𝜇𝜇0𝜇𝜇𝑟𝑟 ,𝑠𝑠𝐻𝐻��⃑
where 𝐵𝐵�⃑ is the magnetic flux density, 𝐻𝐻��⃑ is the magnetic field, 𝜇𝜇0 is the
permeability of the vacuum (4𝜋𝜋 x10-7 N/A2), and 𝜇𝜇𝑟𝑟,𝑝𝑝 is the relative permeability of the
stent. 𝐻𝐻��⃑ was calculated to be 442,097.0641 A/m and the stent was given a relative
permeability of 1.8, which resembles that of 304 grade stainless steel (4). The relative
permeability of the particles (µr,p) was modeled to be 100 and they had a radius of 7 nm
(8).
The magnetic force acting on a single nanoparticle (�⃑�𝐹𝑚𝑚𝑚𝑚𝑚𝑚) was modeled using the
following equation (7):
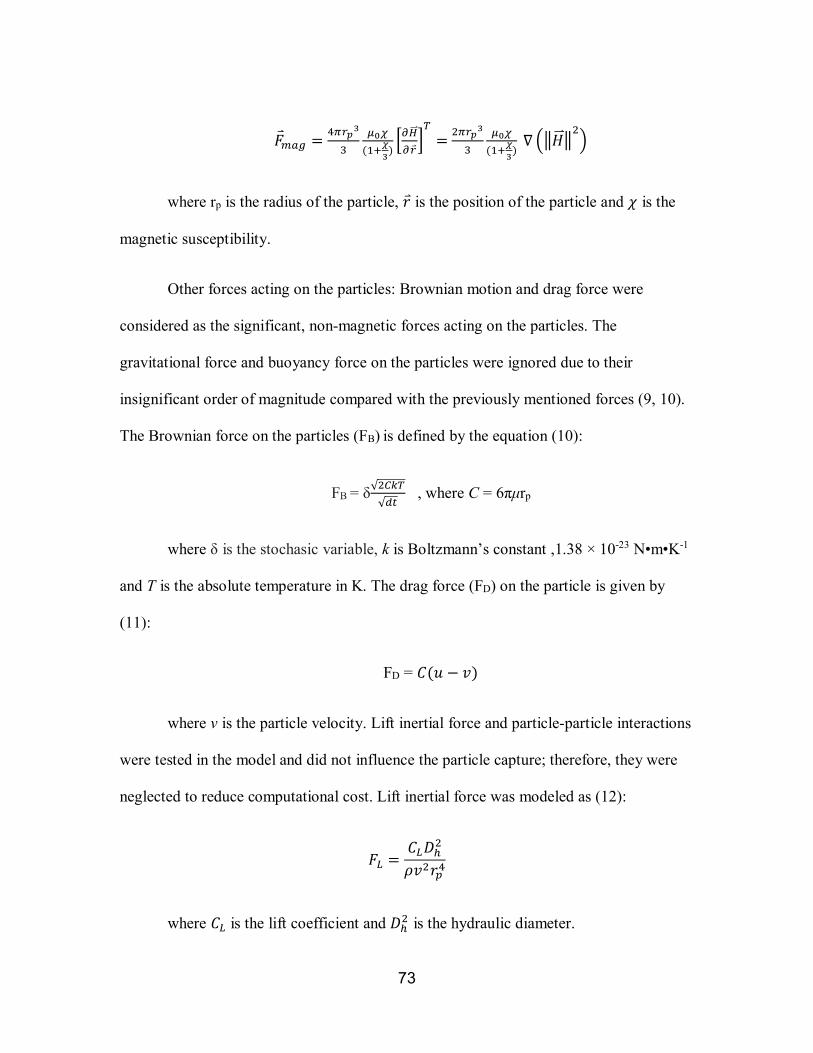
73
�⃑�𝐹𝑚𝑚𝑚𝑚𝑚𝑚 = 4𝜋𝜋𝑟𝑟𝑝𝑝3
3𝜇𝜇0𝜒𝜒
(1+𝜒𝜒3)�𝜕𝜕𝐻𝐻��⃑𝜕𝜕𝑟𝑟�𝑇𝑇
= 2𝜋𝜋𝑟𝑟𝑝𝑝3
3𝜇𝜇0𝜒𝜒
(1+𝜒𝜒3) ∇ ��𝐻𝐻��⃑ �
2�
where rp is the radius of the particle, 𝑟𝑟 is the position of the particle and 𝜒𝜒 is the
magnetic susceptibility.
Other forces acting on the particles: Brownian motion and drag force were
considered as the significant, non-magnetic forces acting on the particles. The
gravitational force and buoyancy force on the particles were ignored due to their
insignificant order of magnitude compared with the previously mentioned forces (9, 10).
The Brownian force on the particles (FB) is defined by the equation (10):
FB = δ√2𝐶𝐶𝐶𝐶𝑇𝑇√𝑑𝑑𝑑𝑑
, where C = 6πμrp
where δ is the stochasic variable, k is Boltzmann’s constant ,1.38 × 10-23 N•m•K-1
and T is the absolute temperature in K. The drag force (FD) on the particle is given by
(11):
FD = 𝐶𝐶(𝑢𝑢 − 𝑣𝑣)
where v is the particle velocity. Lift inertial force and particle-particle interactions
were tested in the model and did not influence the particle capture; therefore, they were
neglected to reduce computational cost. Lift inertial force was modeled as (12):
𝐹𝐹𝐿𝐿 =𝐶𝐶𝐿𝐿𝐷𝐷ℎ2
𝜌𝜌𝑣𝑣2𝑟𝑟𝑝𝑝4
where 𝐶𝐶𝐿𝐿 is the lift coefficient and 𝐷𝐷ℎ2 is the hydraulic diameter.

74
Particle-particle interactions were modeled using Coulomb’s Force. It was
assumed that the polymer and heparin coating on the nanoparticles do not affect the
particle-particle interactions. The addition of PEO of a molecular weight of at least 5000
g/mol has been shown to increase colloidal stability of the nanoparticles and reduce
particle aggregation (13). Heparin’s negative charge also plays a role in preventing
particle aggregation by increasing electrostatic repulsion (14, 15)
Model parameters: The model was meshed using tetrahedral elements. Corner
refinement was applied and a three-layer boundary was built along the arterial lining. The
final mesh had a maximum element quality of 0.00133, a minimum of 7.5*10-6, a
maximum element growth rate of 1.3, and a curvature factor of 0.3. 100 nanoparticles
were released simultaneously from the artery inlet with a density corresponding to flow
velocity and under an identical flow velocity field and external magnetic field conditions.
For computational ease, a freeze boundary condition was applied to the arterial
wall and stent struts to capture the nanoparticle after first contact. Capture efficiency
(CE) was determined by calculating the number of particles that were frozen to the
arterial wall or stent struts per total number of particles released. The blood velocity,
shear stress, and magnetic flux density around the stent struts were observed and their
maximum and minimum values were analyzed.
Model Validation: Shear stress was compared to the shear stress seen by Jimenez
et al. (16) and capture efficiency was compared to the results seen by Wang et al. (4). The
capture efficiency seen was also validated using ex vivo static and dynamic models,

75
where nanoparticles were delivered to porcine arteries. The results of the ex vivo analyses
are shown in chapter 6.
Results:
Blood velocity, shear stress, and magnetic flux density were observed for each of
the stent strut designs and their maximum and minimum values were calculated. The
particle capture efficiency was also calculated for each of the strut designs. The capture
efficiency for R1:6 was 34%, for R3:1 was 35%, and for A6:1 was 42%. The capture
efficiency when 𝐻𝐻��⃑ =0 was 1%.
The effect of the different stent strut geometries on the shear stress is shown in
figure 5.3. Rectangular struts had a wider ranges of shear stress values than the arch one
with R3:1 having the highest and the lowest values. It was observed, however, in figure
5.3D, that the areas with the lowest shear stress are the tip of the strut not the arterial
wall.
The magnetic flux density around each of the stent strut geometries is shown in
figure 5.4. As expected, the size of the strut had a larger effect on how it was magnetized
than its geometry. R3:1 had the highest value with 1.85 T, while A6:1 had the lowest at
1.67 T. Figure 5.4C shows that while R6:1 and A6:1 had similar values, they had
different field distributions.
Figure 5.5 shows the effect of the different stent strut geometries on the blood
velocity. Rectangular struts were observed to have higher velocities than the arch one,
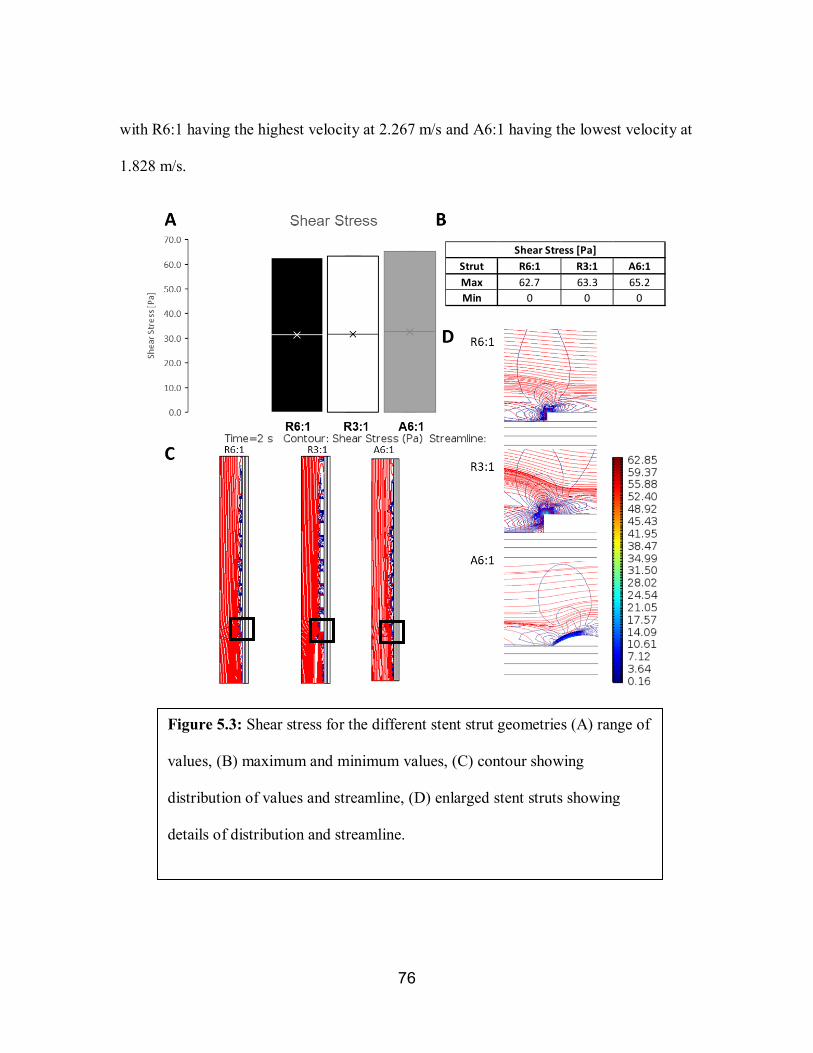
76
with R6:1 having the highest velocity at 2.267 m/s and A6:1 having the lowest velocity at
1.828 m/s.
Figure 5.3: Shear stress for the different stent strut geometries (A) range of
values, (B) maximum and minimum values, (C) contour showing
distribution of values and streamline, (D) enlarged stent struts showing
details of distribution and streamline.
Strut R6:1 R3:1 A6:1Max 62.7 63.3 65.2Min 0 0 0
Shear Stress [Pa]

77
Strut R6:1 R3:1 A6:1Max 1.6656 1.8514 1.6655Min 6.50E-08 6.49E-08 6.51E-08
Magnetic Flux Density [T]
Figure 5.4: Magnetic flux density for the different stent strut geometries
(A) range of values, (B) maximum and minimum values, (C) contour
showing areas with maximum and minimum values, (D) enlarged stent
struts showing details of distribution.

78
Strut R6 R3 A6Max 2.2672 2.2665 1.8182Min 8.62E-07 4.12E-08 9.34E-07
Velocity [m/s]
Figure 5.6: Velocity for the different stent strut geometries (A) range of
values, (B) maximum and minimum values, (C) contour showing areas
with maximum and minimum values, (D) enlarged stent struts showing
details of distribution.
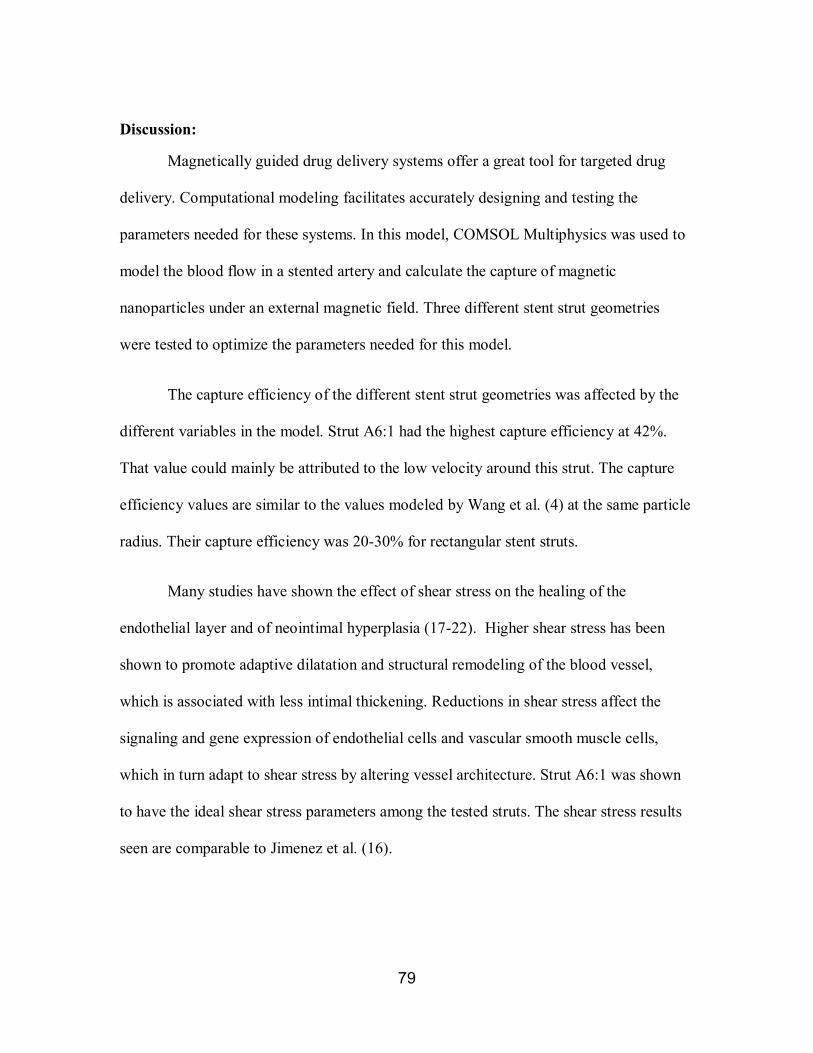
79
Discussion:
Magnetically guided drug delivery systems offer a great tool for targeted drug
delivery. Computational modeling facilitates accurately designing and testing the
parameters needed for these systems. In this model, COMSOL Multiphysics was used to
model the blood flow in a stented artery and calculate the capture of magnetic
nanoparticles under an external magnetic field. Three different stent strut geometries
were tested to optimize the parameters needed for this model.
The capture efficiency of the different stent strut geometries was affected by the
different variables in the model. Strut A6:1 had the highest capture efficiency at 42%.
That value could mainly be attributed to the low velocity around this strut. The capture
efficiency values are similar to the values modeled by Wang et al. (4) at the same particle
radius. Their capture efficiency was 20-30% for rectangular stent struts.
Many studies have shown the effect of shear stress on the healing of the
endothelial layer and of neointimal hyperplasia (17-22). Higher shear stress has been
shown to promote adaptive dilatation and structural remodeling of the blood vessel,
which is associated with less intimal thickening. Reductions in shear stress affect the
signaling and gene expression of endothelial cells and vascular smooth muscle cells,
which in turn adapt to shear stress by altering vessel architecture. Strut A6:1 was shown
to have the ideal shear stress parameters among the tested struts. The shear stress results
seen are comparable to Jimenez et al. (16).
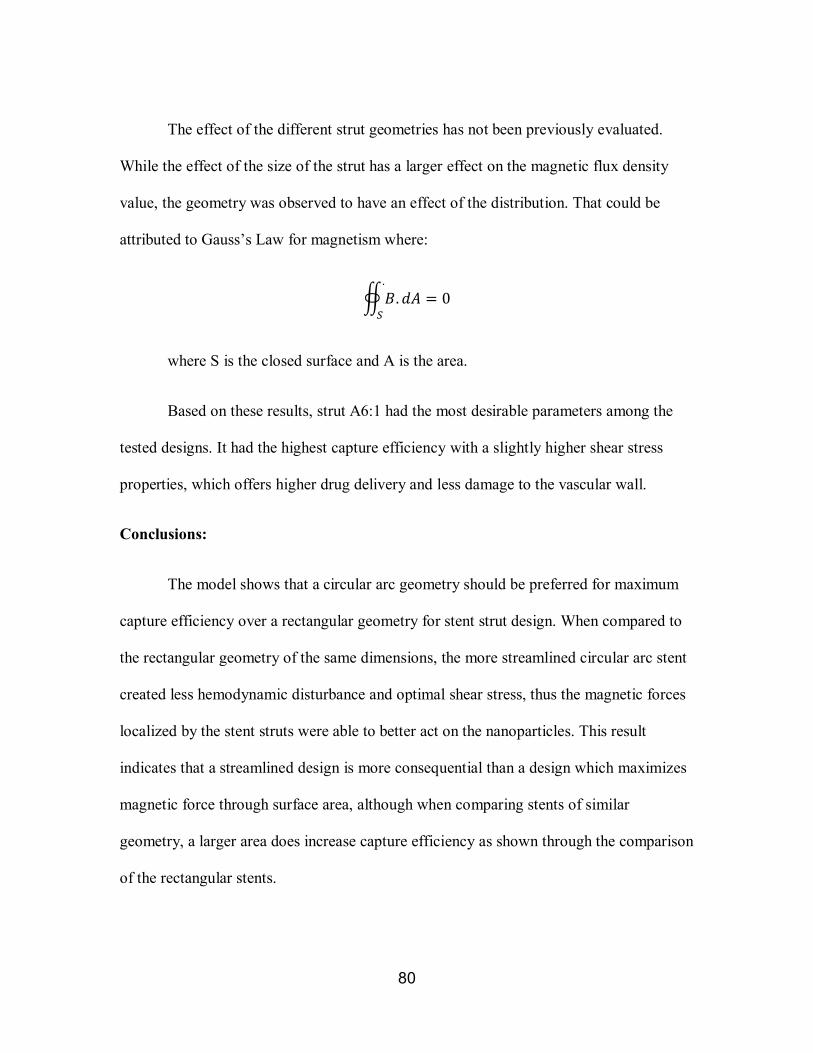
80
The effect of the different strut geometries has not been previously evaluated.
While the effect of the size of the strut has a larger effect on the magnetic flux density
value, the geometry was observed to have an effect of the distribution. That could be
attributed to Gauss’s Law for magnetism where:
�𝐵𝐵.𝑑𝑑𝑑𝑑.
𝑆𝑆= 0
where S is the closed surface and A is the area.
Based on these results, strut A6:1 had the most desirable parameters among the
tested designs. It had the highest capture efficiency with a slightly higher shear stress
properties, which offers higher drug delivery and less damage to the vascular wall.
Conclusions:
The model shows that a circular arc geometry should be preferred for maximum
capture efficiency over a rectangular geometry for stent strut design. When compared to
the rectangular geometry of the same dimensions, the more streamlined circular arc stent
created less hemodynamic disturbance and optimal shear stress, thus the magnetic forces
localized by the stent struts were able to better act on the nanoparticles. This result
indicates that a streamlined design is more consequential than a design which maximizes
magnetic force through surface area, although when comparing stents of similar
geometry, a larger area does increase capture efficiency as shown through the comparison
of the rectangular stents.

81
References:
1. Dodge JT,Jr, Brown BG, Bolson EL, Dodge HT. Lumen diameter of normal human
coronary arteries. Influence of age, sex, anatomic variation, and left ventricular
hypertrophy or dilation. Circulation. 1992 Jul;86(1):232-46.
2. Jimenez JM, Prasad V, Yu MD, Kampmeyer CP, Kaakour AH, Wang PJ, et al. Macro-
and microscale variables regulate stent haemodynamics, fibrin deposition and
thrombomodulin expression. J R Soc Interface. 2014 Feb 19;11(94):20131079.
3. Holzapfel GA, Sommer G, Gasser CT, Regitnig P. Determination of layer-specific
mechanical properties of human coronary arteries with nonatherosclerotic intimal
thickening and related constitutive modeling. American Journal of Physiology-Heart and
Circulatory Physiology. 2005;289(5):H2048-58.
4. Wang S, Zhou Y, Tan J, Xu J, Yang J, Liu Y. Computational modeling of magnetic
nanoparticle targeting to stent surface under high gradient field. Comput Mech.
2014;53(3):403-12.
5. Chen H, Ebner AD, Kaminski MD, Rosengart AJ, Ritter JA. Analysis of magnetic
drug carrier particle capture by a magnetizable intravascular stent—2: parametric study
with multi-wire two-dimensional model. J Magn Magn Mater. 2005;293(1):616-32.
6. Ethier CR, Simmons CA. Introductory biomechanics: from cells to organisms.
Cambridge University Press; 2007.

82
7. Thanh NT. Magnetic nanoparticles: from fabrication to clinical applications. CRC
press; 2012.
8. Pozo B, Garate JI, Araujo JÁ, Ferreiro S. Energy Harvesting Technologies and
Equivalent Electronic Structural Models. Electronics. 2019;8(5):486.
9. Dames P, Gleich B, Flemmer A, Hajek K, Seidl N, Wiekhorst F, et al. Targeted
delivery of magnetic aerosol droplets to the lung. Nature nanotechnology. 2007;2(8):495.
10. Räthel T, Mannell H, Pircher J, Gleich B, Pohl U, Krötz F. Magnetic stents retain
nanoparticle-bound antirestenotic drugs transported by lipid microbubbles. Pharm Res.
2012;29(5):1295-307.
11. Yue P, Lee S, Afkhami S, Renardy Y. On the motion of superparamagnetic particles
in magnetic drug targeting. Acta Mech. 2012;223(3):505-27.
12. Rasooli R, Çetin B. Assessment of Lagrangian modeling of particle motion in a spiral
microchannel for inertial microfluidics. Micromachines. 2018;9(9):433.
13. Saville SL, Woodward RC, House MJ, Tokarev A, Hammers J, Qi B, et al. The effect
of magnetically induced linear aggregates on proton transverse relaxation rates of
aqueous suspensions of polymer coated magnetic nanoparticles. Nanoscale.
2013;5(5):2152-63.
83
14. Gilotti AC, Nimlamool W, Pugh R, Slee JB, Barthol TC, Miller EA, et al. Heparin
Responses in Vascular Smooth Muscle Cells Involve cGMP‐Dependent Protein Kinase
(PKG). J Cell Physiol. 2014;229(12):2142-52.
15. Gu Z, Rolfe BE, Thomas AC, Campbell JH, Lu GM, Xu ZP. Cellular trafficking of
low molecular weight heparin incorporated in layered double hydroxide nanoparticles in
rat vascular smooth muscle cells. Biomaterials. 2011;32(29):7234-40.
16. Jiménez JM, Davies PF. Hemodynamically driven stent strut design. Ann Biomed
Eng. 2009;37(8):1483-94.
17. Dehlaghi V, Shadpoor MT, Najarian S. Analysis of wall shear stress in stented
coronary artery using 3D computational fluid dynamics modeling. J Mater Process
Technol. 2008;197(1):174-81.
18. Acampora KB, Langan EM,3rd, Miller RS, Laberge M. Development of a novel
vascular simulator and injury model to evaluate smooth muscle cell response following
balloon angioplasty. Ann Vasc Surg. 2007 Nov;21(6):734-41.
19. Davies PF. Hemodynamic shear stress and the endothelium in cardiovascular
pathophysiology. Nature clinical practice Cardiovascular medicine. 2009;6(1):16-26.
20. Wentzel JJ, Krams R, Schuurbiers JC, Oomen JA, Kloet J, van Der Giessen WJ, et al.
Relationship between neointimal thickness and shear stress after Wallstent implantation
in human coronary arteries. Circulation. 2001 Apr 3;103(13):1740-5.

84
21. Davies PF, Spaan JA, Krams R. Shear stress biology of the endothelium. Ann
Biomed Eng. 2005;33(12):1714-8.
22. LaDisa JF, Guler I, Olson LE, Hettrick DA, Kersten JR, Warltier DC, et al. Three-
dimensional computational fluid dynamics modeling of alterations in coronary wall shear
stress produced by stent implantation. Ann Biomed Eng. 2003;31(8):972-80.

85
CHAPTER 6
AIM 3: EX VIVO STUDIES
Introduction:
Atherosclerosis is a cardiovascular disease caused by the buildup of plaque in
arteries over years. Atherosclerosis is commonly found in coronary arteries and can cause
myocardial infarctions, which may lead to death. A common treatment for atherosclerosis
is the use of stents, which increase the patency of the blood vessel and provide
mechanical support to the vascular wall (1, 2). The use of stents to treat atherosclerosis
introduced new complications, mainly restenosis. Restenosis is caused by an injury to the
vascular wall or a disturbance in the shear stress, due to the thickness of the stent struts
(2-5). These factors directly lead to neointimal hyperplasia, which leads to restenosis, if
left untreated (2).
An injury to the vascular wall causes damage to the endothelial layer which leads
to the proliferation of the vascular smooth muscle cells (VSMC) and their
dedifferentiation from their contractile phenotype to a synthetic phenotype. These
changes lead to the thickening of the medial layer of the vascular wall and to a reduction
in the patency of the blood vessel.
We designed a drug delivery system to treat neointimal hyperplasia using heparin-
coated magnetic nanoparticles delivered to a magnetizable stent under a magnetic field.
In vitro studies (shown in chapter 4) showed a promise in reducing the proliferation and
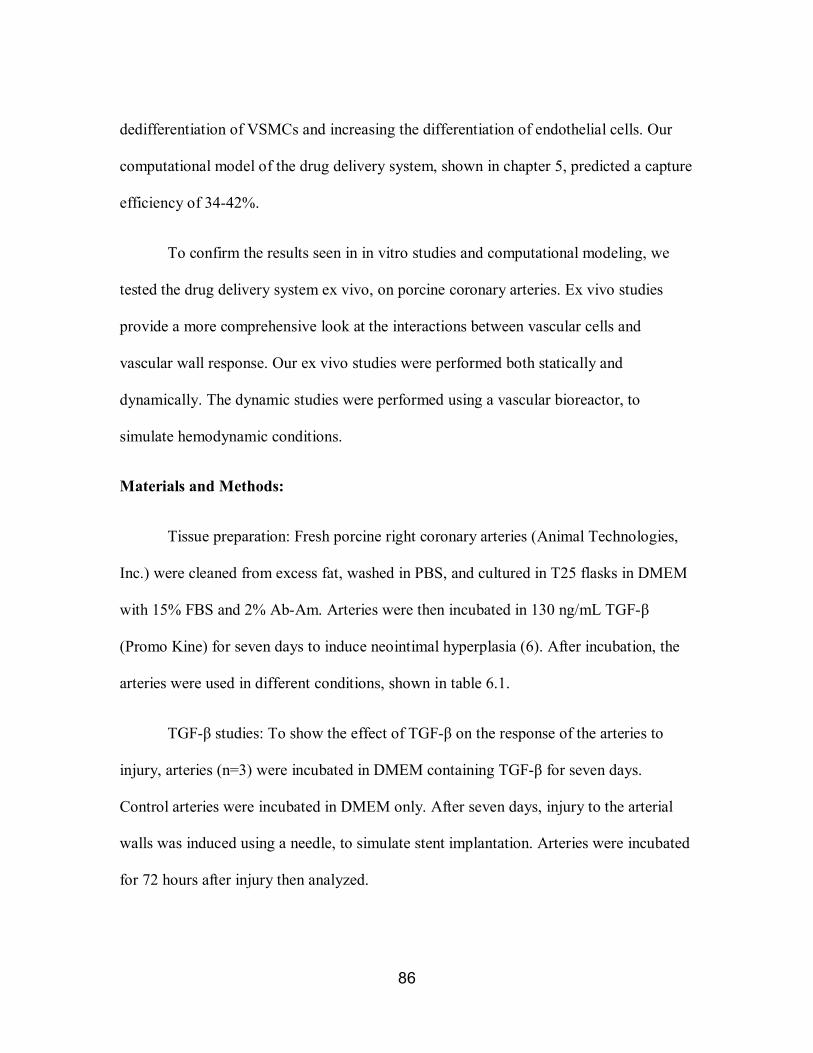
86
dedifferentiation of VSMCs and increasing the differentiation of endothelial cells. Our
computational model of the drug delivery system, shown in chapter 5, predicted a capture
efficiency of 34-42%.
To confirm the results seen in in vitro studies and computational modeling, we
tested the drug delivery system ex vivo, on porcine coronary arteries. Ex vivo studies
provide a more comprehensive look at the interactions between vascular cells and
vascular wall response. Our ex vivo studies were performed both statically and
dynamically. The dynamic studies were performed using a vascular bioreactor, to
simulate hemodynamic conditions.
Materials and Methods:
Tissue preparation: Fresh porcine right coronary arteries (Animal Technologies,
Inc.) were cleaned from excess fat, washed in PBS, and cultured in T25 flasks in DMEM
with 15% FBS and 2% Ab-Am. Arteries were then incubated in 130 ng/mL TGF-β
(Promo Kine) for seven days to induce neointimal hyperplasia (6). After incubation, the
arteries were used in different conditions, shown in table 6.1.
TGF-β studies: To show the effect of TGF-β on the response of the arteries to
injury, arteries (n=3) were incubated in DMEM containing TGF-β for seven days.
Control arteries were incubated in DMEM only. After seven days, injury to the arterial
walls was induced using a needle, to simulate stent implantation. Arteries were incubated
for 72 hours after injury then analyzed.
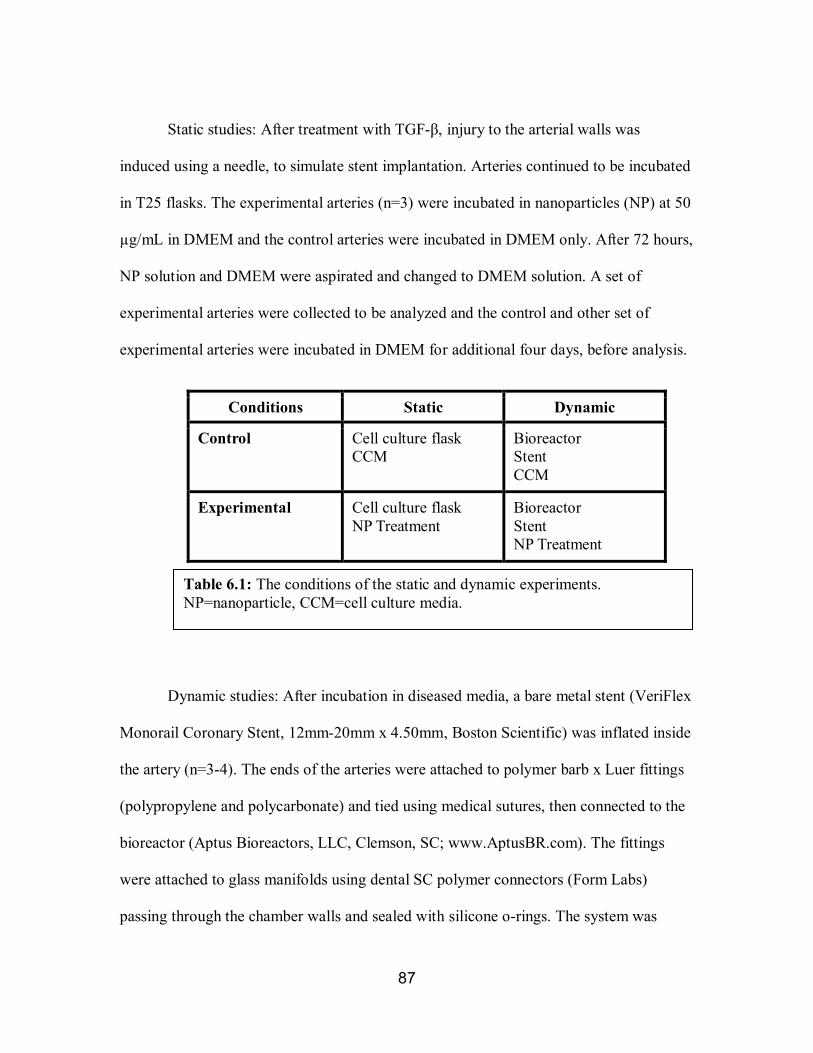
87
Static studies: After treatment with TGF-β, injury to the arterial walls was
induced using a needle, to simulate stent implantation. Arteries continued to be incubated
in T25 flasks. The experimental arteries (n=3) were incubated in nanoparticles (NP) at 50
µg/mL in DMEM and the control arteries were incubated in DMEM only. After 72 hours,
NP solution and DMEM were aspirated and changed to DMEM solution. A set of
experimental arteries were collected to be analyzed and the control and other set of
experimental arteries were incubated in DMEM for additional four days, before analysis.
Dynamic studies: After incubation in diseased media, a bare metal stent (VeriFlex
Monorail Coronary Stent, 12mm-20mm x 4.50mm, Boston Scientific) was inflated inside
the artery (n=3-4). The ends of the arteries were attached to polymer barb x Luer fittings
(polypropylene and polycarbonate) and tied using medical sutures, then connected to the
bioreactor (Aptus Bioreactors, LLC, Clemson, SC; www.AptusBR.com). The fittings
were attached to glass manifolds using dental SC polymer connectors (Form Labs)
passing through the chamber walls and sealed with silicone o-rings. The system was
Conditions Static Dynamic
Control Cell culture flask CCM
Bioreactor Stent CCM
Experimental Cell culture flask NP Treatment
Bioreactor Stent NP Treatment
Table 6.1: The conditions of the static and dynamic experiments. NP=nanoparticle, CCM=cell culture media.

88
connected to a peristaltic pump at a flow rate of 50 mL/min/artery, which was then
damped by a 250 mL dampening chamber before passing through a pinch valve set to an
open time of 300 ms and a close time of 500 ms (75 BPM) to create the pressure and
pulsatile flow. After passing through the vessels, a 250 mL compliance chamber and a
series of adjustable constriction clamps were used to control the systolic and diastolic
pressures which were 130-100 mmHg/ 60-30 mmHg. The media then flowed back
through the chamber and around the outside of the vessels at near-zero pressures before
passing through a media reservoir with a filtered cap (0.22 µm) for air exchange. Pressure
transducers measured pressure inside and outside the vessels and flow meter were
connected to the controls box which reported these values to the software. A schematic of
the bioreactor is shown in figure 6.1 and a picture of the bioreactor setup and the user
interface are shown in figure 6.2.
Figure 6.1: A schematic of the arterial bioreactor setup. Vessels are shown
connected in parallel in the middle of the chamber. Black arrow= NP injection.
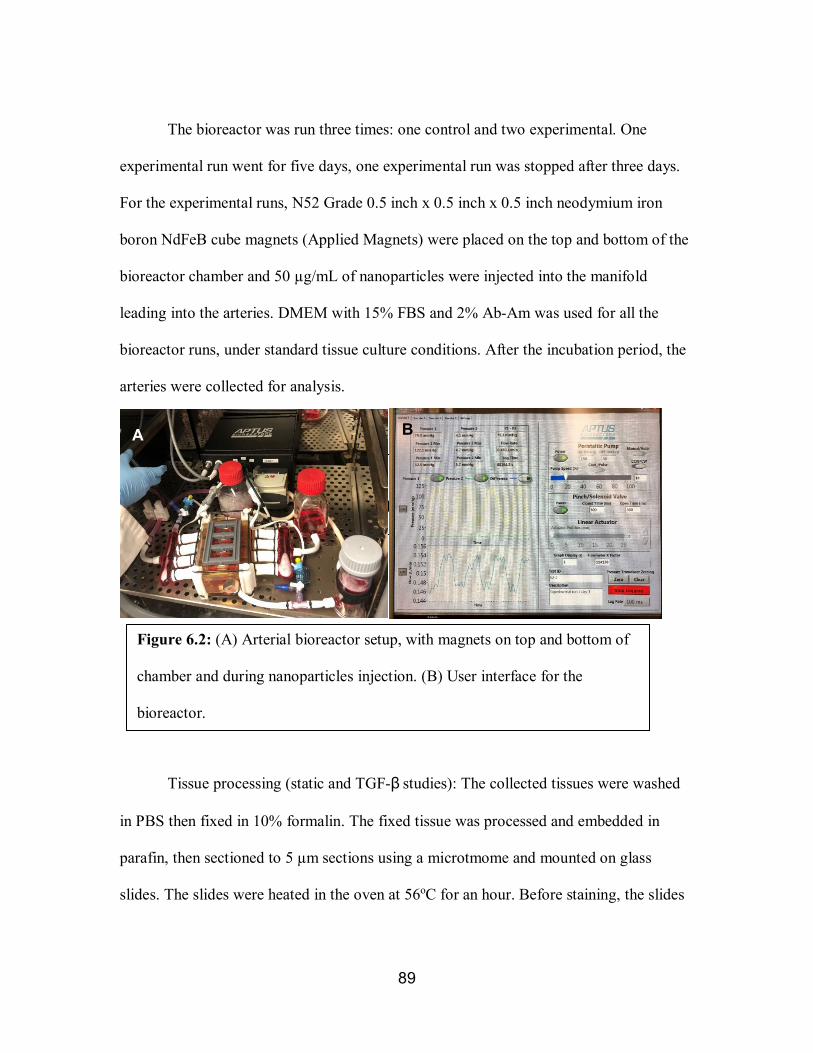
89
The bioreactor was run three times: one control and two experimental. One
experimental run went for five days, one experimental run was stopped after three days.
For the experimental runs, N52 Grade 0.5 inch x 0.5 inch x 0.5 inch neodymium iron
boron NdFeB cube magnets (Applied Magnets) were placed on the top and bottom of the
bioreactor chamber and 50 µg/mL of nanoparticles were injected into the manifold
leading into the arteries. DMEM with 15% FBS and 2% Ab-Am was used for all the
bioreactor runs, under standard tissue culture conditions. After the incubation period, the
arteries were collected for analysis.
Tissue processing (static and TGF-β studies): The collected tissues were washed
in PBS then fixed in 10% formalin. The fixed tissue was processed and embedded in
parafin, then sectioned to 5 µm sections using a microtmome and mounted on glass
slides. The slides were heated in the oven at 56oC for an hour. Before staining, the slides
Figure 6.1: A schematic of the arterial bioreactor setup. Vessels are shown
connected in parallel in the middle of the chamber.
A
Figure 6.2: (A) Arterial bioreactor setup, with magnets on top and bottom of
chamber and during nanoparticles injection. (B) User interface for the
bioreactor.
B A
A

90
were deparafinized with xylene.
Tissue processing (dynamic studies): The collected tissues were washed in PBS
then fixed in 10% formalin. The fixed tissue was processed and embedded in glycol
methacrylate (GMA), to preserve the stent. After fixing, the tissue was processed in
GMA for two weeks under vaccum, then embedded in GMA under ultravilot light for 24
hours. The GMA blocks were cut into sections of ~5 mm in thickness using a band saw.
The GMA sections were then glued to plexiglass slides then polished to ~80-120 µm
sections using a grinding wheel.
Histological staning: All the slides were dipped in graded ethanol before staining.
Hematoxylin and eosin (H&E) stain was used to stain the nuclei blue to purple and
cytoplasm and ECM pink to red. Masson’s trichrome was used to stain the nuclei black,
cytoplasm, muscle fibers and intracellular fibers red, and collagen blue. All the
histological stains were performed according to manufacturers’ protocols.
Immunoflourescence: tissue slides were heated up in a sodium citrate buffer
solution at 100oC for 20 minutes for antigen retrieval. After antigen retrieval, the tissues
were permeabilized with a 0.1% Triton X-100 (Sigma) solution at room temperature for
15 minutes then blocked with a 2% blocking solution with 3% goat serum for 30 minutes
at room temperature. A primary antibody for alpha smooth muscle actinin (1E12 was
deposited to the DSHB by Little, C.D. (DSHB Hybridoma Product 1E12)) or CD45
(CD45 (K252.1E4): sc-59065, Santa Cruz Biotechnology, INC.) at 1:500 ratio was added
then allowed to incubate overnight in the fridge. Alexa Fluor 568 secondary antibody
(Thermo Fisher Scientific) solution at 4 µL/mL was added for two hours at room

91
temperature. Tissues were rinsed three times with 1X PBS (Alfa Aesar) between every
solution change. Tissues were imaged using an EVOS FL light microscope.
Uptake analysis: Pieces (0.5 mm x 0.5 mm x 0.5 mm) of each of the collected
arteries were fixed in gluteraldhyde then frozen in saline. The frozen samples were
digested in 37% hydrochloric acid (HCl) solution for one hour at 80oC then allowed to sit
overnight (7). The HCl solution was evapourated and replaced with 3% nitic acid and
sent to Clemson University Agricultural Service Laboratory to quatify the amount of iron
found in the samples using Inductively Coupled Plasma (ICP). The iron oxide
concentration was calculated from the amout of iron measured with ICP. The
experimental samples were normalized to the control, then the capture efficincy was
calculated.
Statistical analysis: ICP data for uptake was compared with the controls using
one-way ANOVA (α=0.05) for the static and dynamic samples separately. Tukeys’ post
hoc test was used to analyze the difference between the groups. The static and dynamic
groups were compared using randomized block design ANOVA (α=0.05).
Results:
TGF-β studies: The tissues treated with TGF- β were compared to the control.
The tissues stained with H&E, shown in figure 6.3, show the morphological changes in
the neointimal healing in the control compared to the diseased model. The images at high
magnification (40X) show the effect of TGF-β on the nuclei in the medial layer, where
the nuclei are randomly oriented and areas of thickening in the intimal layer are noticed.
92
Masson’s trichrome (figure 6.4) showed more prominent morphological changes to the
vascular wall after treatment with TGF-β. More collagen deposition (shown in blue) is
noticed in the TGF-β treated tissues.
Immunofluorescent staining (figure 6.5) of the tissues shows a reduction in the
expression of smooth muscle alpha actinin in the TGF-β treated tissues and an increase in
the expression of CD45. The images also show morphological changes in the treated
tissues including areas of wall thickening at low magnification and changes is the muscle
fibers to a more random orientation after treatment.
Static studies: Tissues treated with nanoparticles were compared to the control.
H&E stained tissues, shown in figure 6.6, show the morphological changes in the
neointimal healing in the treated groups compared to the control. Areas with neointimal
thickening are noticed in the control tissues compared to the control. Masson’s trichrome
(figure 6.7) showed more collagen deposition (shown in blue) in the control arteries
compared to the treated tissue. Conversely, the nanoparticle-treated tissues show more
muscle fibers, shown in red, in the medial layer, specially noticed at higher
magnifications (40X).
Immunofluorescent staining (figure 6.8) of the tissues shows an increase in the
expression of smooth muscle alpha actinin in the nanoparticle treated tissues and a
reduction in the expression of CD45 that is mostly limited to the injured regions.
Dynamic studies: H&E staining (figure 6.9) for the three-day treated control
shows uniform thickness in the vascular wall compared to the control. For Masson’s
93
trichrome (figure 6.10) stained arteries, the experimental arteries more muscle fibers (red)
than the control arteries. For immunofluorescence (figure 6.11), tissues treated with
nanoparticles for three days show higher expression of smooth muscle alpha actinin in
the nanoparticle treated tissues and a reduction in the expression of CD45 compared to
the control. Intimal thickening around and CD45 expression are also noticed in the
control tissue stained for CD45.
Uptake studies: The nanoparticles uptake results show that the particles are
uptaken by the tissue. The tissues analyzed after three days show significantly higher
amounts of internalized particles than the controls and the longer incubated tissues. For
the static tissue, day three was significantly different from both the control and day seven.
For the dynamic tissue, there was a statistically significant difference in the uptake
between day three and the control. The uptake of the statically conditioned arteries was
also significantly different from that of the dynamically conditioned ones. The capture
efficiency of the static tissue was 18.8% at day three and 1.32% at day 7. For the dynamic
tissue, the capture efficiency was 31.4% at day three and 3.70% at day five.
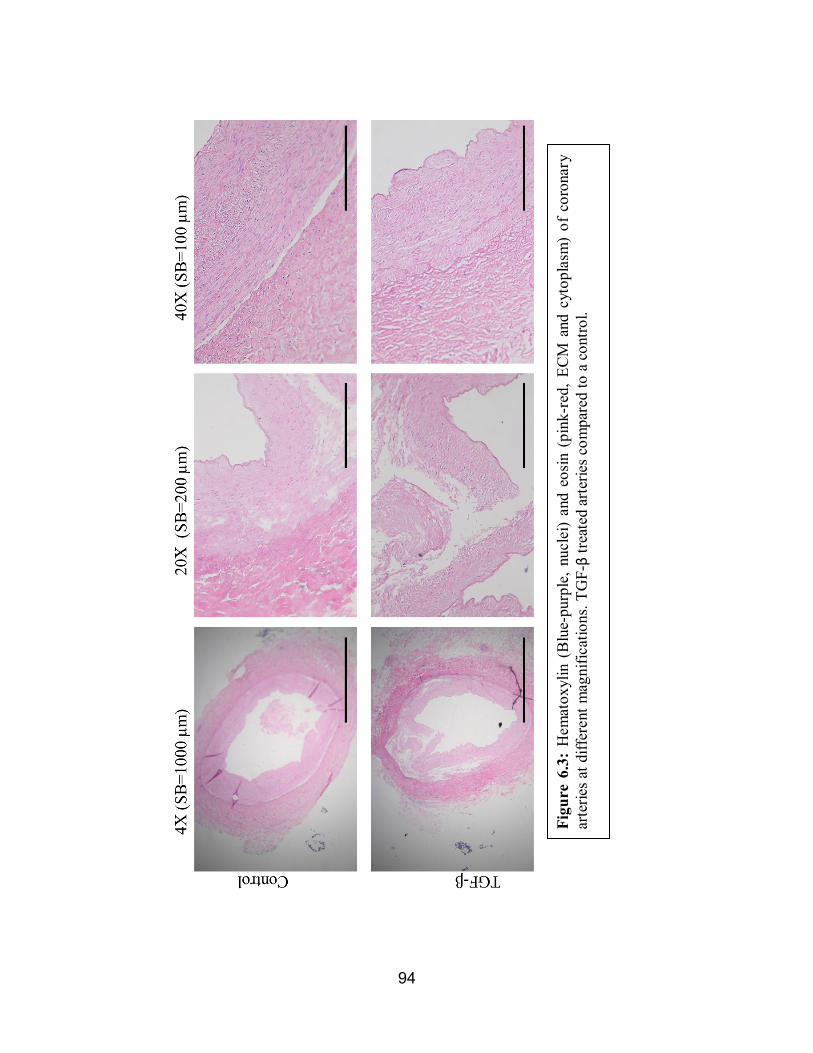
94
Figu
re 6
.3:
Hem
atox
ylin
(B
lue-
purp
le, n
ucle
i) an
d eo
sin (
pink
-red
, ECM
and
cyt
opla
sm)
of c
oron
ary
arte
ries a
t diff
eren
t mag
nific
atio
ns. T
GF-β
treat
ed a
rterie
s com
pare
d to
a c
ontro
l.

95
Figu
re 6
.4: M
asso
n’s T
richr
ome s
tain
ing
of co
rona
ry ar
terie
s at d
iffer
ent m
agni
ficat
ions
. Nuc
lei=
bla
ck,
cyto
plas
m a
nd m
uscl
e fib
ers=
red,
col
lage
n=bl
ue. T
GF-β
treat
ed a
rterie
s com
pare
d to
a c
ontro
l.

96
Figu
re 6
.4: I
mm
unof
luor
esce
nce
stai
ning
of c
oron
ary
arte
ries.
Left
= sm
ooth
mus
cle
actin
in a
nd r
ight
=CD
45.
TGF-β
treat
ed a
rterie
s com
pare
d to
a c
ontro
l.
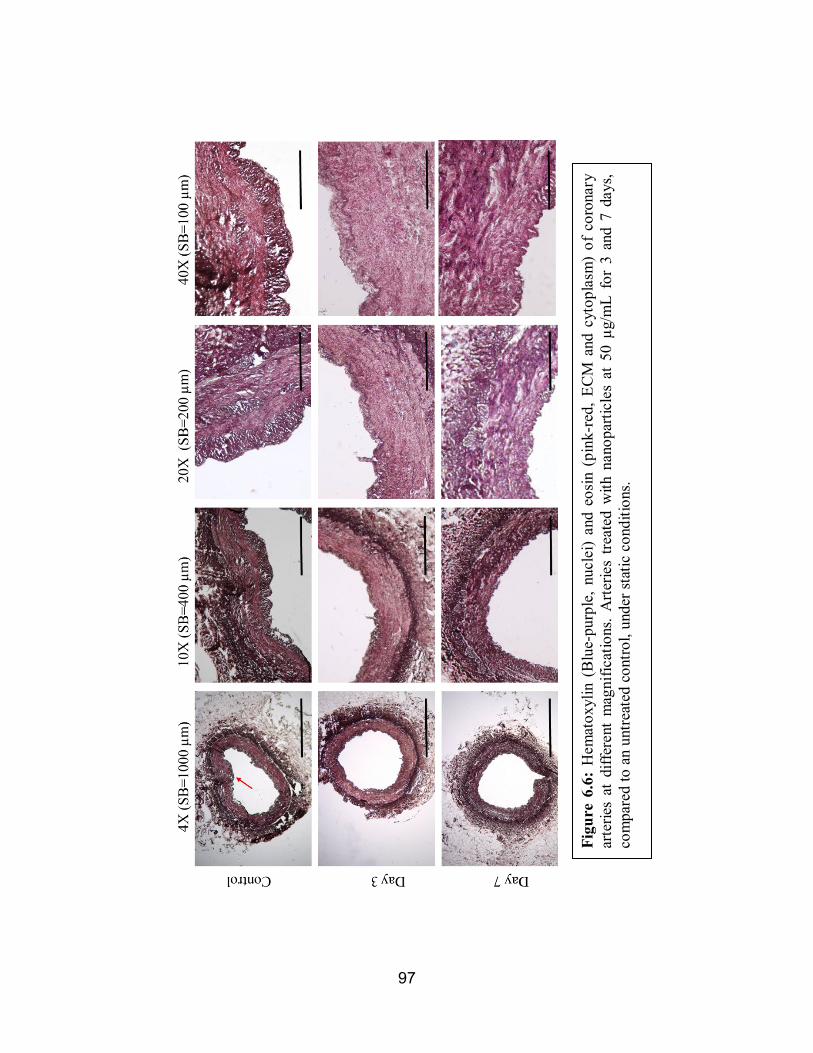
97
Figu
re 6
.6:
Hem
atox
ylin
(B
lue-
purp
le, n
ucle
i) an
d eo
sin (
pink
-red
, ECM
and
cyt
opla
sm)
of c
oron
ary
arte
ries
at d
iffer
ent
mag
nific
atio
ns. A
rterie
s tre
ated
with
nan
opar
ticle
s at
50
µg/m
L fo
r 3
and
7 da
ys,
com
pare
d to
an
untre
ated
con
trol,
unde
r sta
tic c
ondi
tions
.
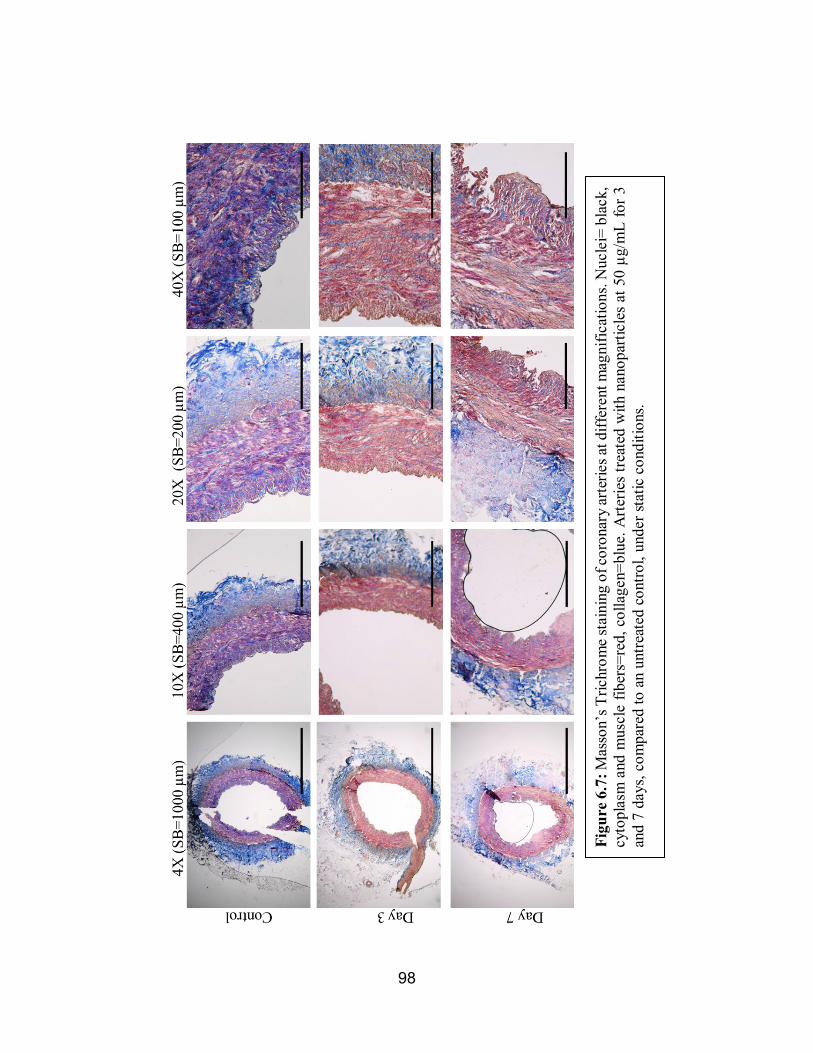
98
Figu
re 6
.7: M
asso
n’s T
richr
ome s
tain
ing
of co
rona
ry ar
terie
s at d
iffer
ent m
agni
ficat
ions
. Nuc
lei=
bla
ck,
cyto
plas
m a
nd m
uscl
e fib
ers=
red,
col
lage
n=bl
ue. A
rterie
s tre
ated
with
nan
opar
ticle
s at 5
0 µg
/mL
for 3
an
d 7
days
, com
pare
d to
an
untre
ated
con
trol,
unde
r sta
tic c
ondi
tions
.

99
Figu
re 6
.8: I
mm
unof
luor
esce
nce
stai
ning
of c
oron
ary
arte
ries.
Left
= sm
ooth
mus
cle
actin
in a
nd r
ight
=C
D45
. Arte
ries
treat
ed w
ith n
anop
artic
les
at 5
0 µg
/mL
for
3 an
d 7
days
, com
pare
d to
an
untre
ated
co
ntro
l, un
der s
tatic
con
ditio
ns.
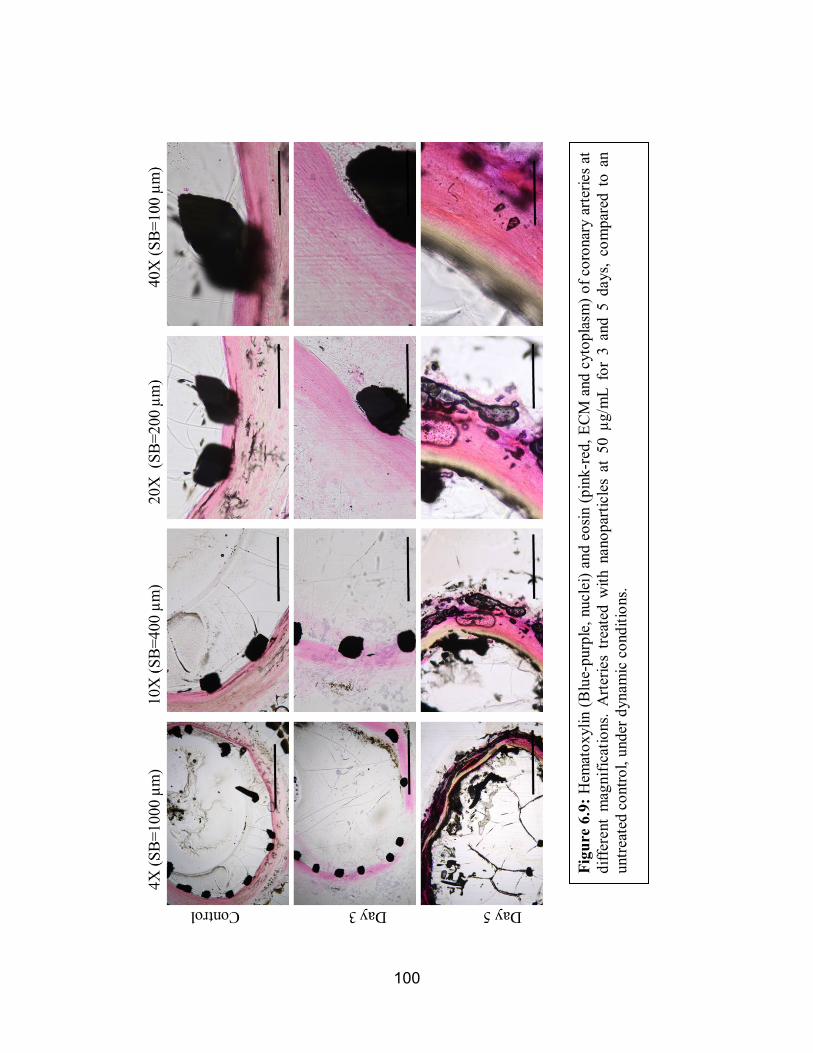
100
Figu
re 6
.9: H
emat
oxyl
in (B
lue-
purp
le, n
ucle
i) an
d eo
sin (p
ink-
red,
ECM
and
cyt
opla
sm) o
f cor
onar
y ar
terie
s at
diffe
rent
mag
nific
atio
ns.
Arte
ries
treat
ed w
ith n
anop
artic
les
at 5
0 µg
/mL
for
3 an
d 5
days
, co
mpa
red
to a
n un
treat
ed c
ontro
l, un
der d
ynam
ic c
ondi
tions
.
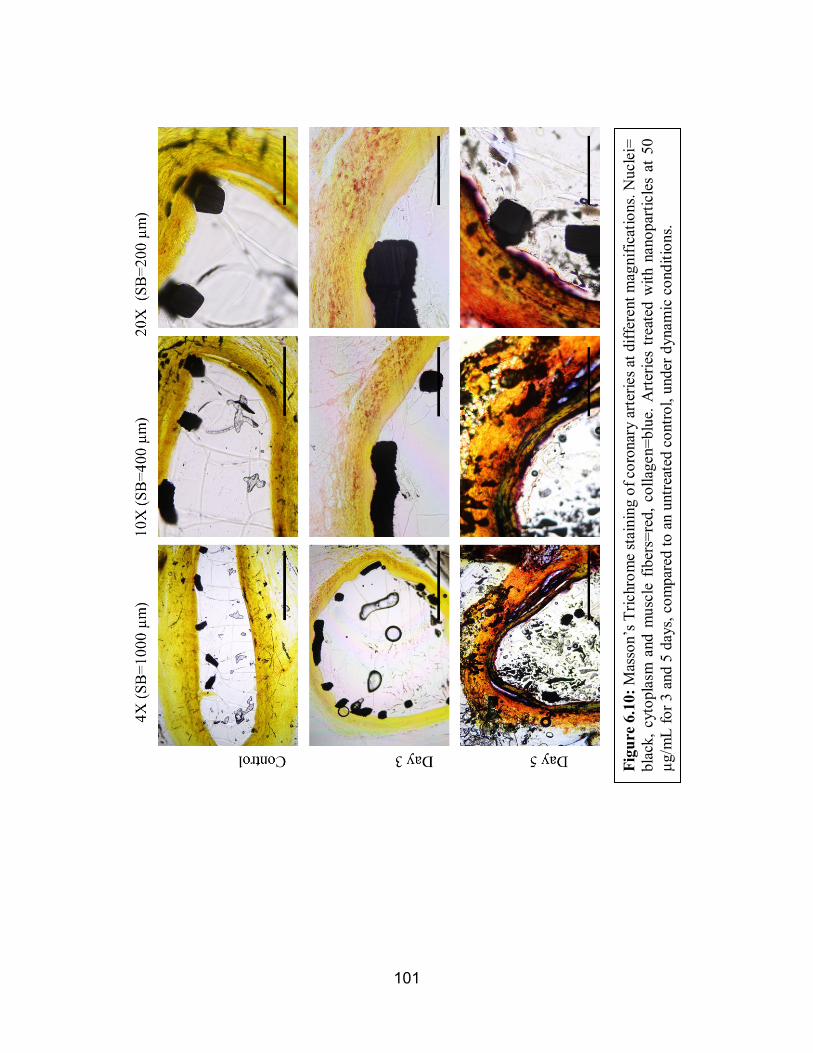
101
Figu
re 6
.10:
Mas
son’
s Tric
hrom
e st
aini
ng o
f cor
onar
y ar
terie
s at d
iffer
ent m
agni
ficat
ions
. Nuc
lei=
bl
ack,
cyt
opla
sm a
nd m
uscl
e fib
ers=
red,
col
lage
n=bl
ue. A
rterie
s tre
ated
with
nan
opar
ticle
s at
50
µg/m
L fo
r 3 a
nd 5
day
s, co
mpa
red
to a
n un
treat
ed c
ontro
l, un
der d
ynam
ic c
ondi
tions
.

102
Figu
re 6
.11:
Im
mun
oflu
ores
cenc
e st
aini
ng o
f cor
onar
y ar
terie
s. Le
ft =
smoo
th m
uscl
e ac
tinin
and
rig
ht
=CD
45. A
rterie
s tre
ated
with
nan
opar
ticle
s at 5
0 µg
/mL
for 3
and
5 d
ays,
com
pare
d to
an u
ntre
ated
cont
rol
unde
r dyn
amic
con
ditio
ns.

103
Discussion:
This study analyzed the effect of heparin-coated magnetic nanoparticles on the
formation of neointimal hyperplasia, ex vivo on porcine coronary arteries. The arteries
were treated with TGF-β for 7 days before treatment to introduce a diseased model (6).
Arteries treated with TGF-β were compared to control untreated arteries to ensure the
effect of TGF-β on the arteries. Arteries treated with TGF-β showed regions of
neointimal thickening, higher CD45 expression, lower smooth muscle actinin expression,
and more collagen deposition than the control, indicating that the TGF-β treated arteries
showed signs of neointimal hyperplasia.
Figure 6.12: ICP data of the particle uptake by the arteries for the different incubation periods, both statically and dynamically. one-way ANOVA (α=0.05)
* *

104
Healthy arteries express higher smooth muscle contractile markers, such as
smooth muscle actin, smooth muscle actinin, and calponin (1, 2, 8-10). The medial layer,
composed mostly of smooth muscle cells, has arranged muscle fibers that facilitate
healthy blood flow. When and injury occurs, the smooth muscle cells dedifferentiate to a
synthetic phenotype and proliferate, causing thickening in the vascular wall. Synthetic
smooth muscle cells express less contractile proteins and produce collagen and ECM.
CD45 is a cell surface protein found on leukocytes. It has been expressed in the arterial
wall in acute local inflammation episodes and during angiogenesis (11-13).
The arteries treated with nanoparticles showed less neointimal thickening than the
controls and they had higher expression of smooth muscle actinin and more fibers in the
medial layer than the control. The injured, nontreated arteries had thicker arterial walls
with higher expression of CD45 and more collagen deposition in the medial layer.
The dynamic arteries had less conclusive results, which could be attributed to the
harsh processing procedure used for them. The GMA embedded tissues are glued to the
slides and grinded using sand paper, which caused some damage to the tissue, seem
clearly in the day 5 images.
The nanoparticles were uptaken by the tissues under both conditions. The uptake
was significantly higher at day three, which indicates that the particles are released by the
tissue. This agrees with our previous results (appendix J) where 3T3 fibroblasts were
treated with amine-terminated particles and their uptake was studied by TEM over a
seven-day period. The cells started to release the nanoparticles at day four and fewer

105
particles were visualized after. This also agrees with in vivo results shown in Fellows et
al. (14) where similar heparin-coated nanoparticles were injected systemically into mice
and were all cleared very rapidly.
The capture efficiency of the nanoparticles by the dynamically conditioned tissue
at day three was in line with the capture efficiencies predicted by the computational
model in chapter 5. The lower value could be attributed to the stent strut geometry and
the computational model assumptions.
Conclusion:
Heparin-coated magnetic nanoparticles showed promise in the treatment of
neointimal hyperplasia in an ex vivo porcine artery model. The particles reduced
neointimal thickening at concentrations as low as 50 µg/mL within three days. They also
increased the expression of the smooth muscle contractile gene expression in injured
diseased arteries and reduced the inflammatory response that would lead to neointimal
hyperplasia and eventually restenosis in this ex vivo model. The particle capture
efficiency for the dynamic model was comparable to the computational model and most
of the particles were released by the arteries within seven days.
106
References:
1. Marx SO, Totary-Jain H, Marks AR. Vascular smooth muscle cell proliferation in
restenosis. Circ Cardiovasc Interv. 2011 Feb 1;4(1):104-11.
2. Orford JL, Selwyn AP, Ganz P, Popma JJ, Rogers C. The comparative pathobiology of
atherosclerosis and restenosis. Am J Cardiol. 2000;86(4):6H-11H.
3. Davies PF. Hemodynamic shear stress and the endothelium in cardiovascular
pathophysiology. Nature clinical practice Cardiovascular medicine. 2009;6(1):16-26.
4. Jiménez JM, Davies PF. Hemodynamically driven stent strut design. Ann Biomed Eng.
2009;37(8):1483-94.
5. Waters SL, Alastruey J, Beard DA, Bovendeerd PH, Davies PF, Jayaraman G, et al.
Theoretical models for coronary vascular biomechanics: progress & challenges. Prog
Biophys Mol Biol. 2011;104(1):49-76.
6. Guo X, Chen SY. Transforming growth factor-beta and smooth muscle differentiation.
World J Biol Chem. 2012 Mar 26;3(3):41-52.
7. Costo R, Heinke D, Grüttner C, Westphal F, Morales MP, Veintemillas-Verdaguer S,
et al. Improving the reliability of the iron concentration quantification for iron oxide
nanoparticle suspensions: a two-institutions study. Analytical and bioanalytical
chemistry. 2019;411(9):1895-903.

107
8. Owens GK, Kumar MS, Wamhoff BR. Molecular regulation of vascular smooth
muscle cell differentiation in development and disease. Physiol Rev. 2004;84(3):767-801.
9. Rensen S, Doevendans P, Van Eys G. Regulation and characteristics of vascular
smooth muscle cell phenotypic diversity. Netherlands Heart Journal. 2007;15(3):100-8.
10. Rzucidlo EM. Signaling pathways regulating vascular smooth muscle cell
differentiation. Vascular. 2009 May-Jun;17 Suppl 1:S15-20.
11. Wun K, Theriault BR, Pierre JF, Chen EB, Leone VA, Harris KG, et al. Microbiota
control acute arterial inflammation and neointimal hyperplasia development after arterial
injury. PloS one. 2018;13(12):e0208426.
12. Toledo-Flores D, Williamson A, Schwarz N, Fernando S, Dimasi C, Witt TA, et al.
Vasculogenic properties of adventitial Sca-1 CD45 progenitor cells in mice: a potential
source of vasa vasorum in atherosclerosis. Scientific reports. 2019;9(1):1-15.
13. Zengin E, Chalajour F, Gehling UM, Ito WD, Treede H, Lauke H, et al. Vascular wall
resident progenitor cells: a source for postnatal vasculogenesis. Development. 2006
Apr;133(8):1543-51.
14. Fellows BD, Ghobrial N, Mappus E, Hargett A, Bolding M, Dean D, et al. In vitro
studies of heparin-coated magnetic nanoparticles for use in the treatment of neointimal
hyperplasia. Nanomedicine. 2018 Mar 8;14(4):1191-200.

108
CHAPTER 7
CONCLUSIONS AND RECOMMENDATIONS FOR FUTURE
WORK
Atherosclerosis is a highly prevalent cardiovascular disease in the industrialized
world. Stents have been used in the treatment of atherosclerosis for about 40 years. While
having high success rates, stents introduced new complications, including neointimal
hyperplasia that leads to restenosis. In response to this, we designed heparin-coated
magnetic nanoparticles that could be delivered to a magnetizable stent. The designed
nanoparticles showed promise in the treatment of neointimal hyperplasia.
The nanoparticles were synthesized and characterized successfully. A set of
nanoparticles was synthesized using thermal decomposition to synthesize a magnetite
core, then modified with an amine terminated polymer, then modified with heparin. A set
of amine-terminated magnetite nanoparticles was also acquired from a manufacturer and
modified with heparin.
The particles were tested in vitro on human cells. The particles were not toxic to
any of the cell lines tested at concentrations as high as 200 µg/mL. They were able to
increase the proliferation of endothelial cells and reduce the proliferation of smooth
muscle cells. The smooth muscle cells expressed their contractile phenotype after
treatment with the nanoparticles, where higher expressions of smooth muscle actin and
calponin were noticed.
A computational model of the nanoparticle drug delivery system using COMSOL
Multiphysics was used to analyze different stent strut geometries. The model analyzed

109
the effect of the different geometries on the velocity, shear stress, and magnetic flux
density and how these factors affect the capture efficiency of the nanoparticles.
Ex vivo studies were performed using porcine coronary arteries to validate the
results seen in vitro, with the cell culture studies, and in silico, with the computational
modeling studies. Ex vivo studies were performed both statically and dynamically. The
dynamic system included an organ culture bioreactor that simulated physiological
conditions. The nanoparticle-treated arteries showed less neointimal thickening and
higher expression of contractile properties than the control. The uptake of the
nanoparticles was calculated. The arteries conditioned dynamically had particle capture
efficiencies at day three that were comparable to the values predicted by the
computational modeling studies.
Future expanded ex vivo analysis should include a quantitative measure of
neointimal hyperplasia. Patency calculations and PCR are recommended to further
analyze the efficiency of the proposed drug delivery system. A large animal model study
is needed to test the drug delivery system in vivo. The model should analyze the effect of
the nanoparticles and the drug delivery system on neointimal hyperplasia, while also
analyzing the toxicity of targeted delivery of the particles, in vivo.
These studies should also analyze the uptake and efficiency of the nanoparticles
over an extended period of time. All the studies discussed here did not extend past seven
days due to limitation of the ex vivo setup. While treating neointimal hyperplasia in its
early stages should limit the risk of restenosis, an extended in vivo study is recommended
to ensure lasting effect of the proposed treatment.

110
There have not been enough studies to analyze how different stent geometries
affect magnetically guided drug delivery systems. While the work in this dissertation
shows that there are distinct differences due to stent geometries, expanded computational
modeling to analytically analyze the effect of the different stent geometries on the
magnetic field and magnetic flux density could be used to inform the choice of an ideal
stent for the drug delivery system. This step could be incorporated into stent design
workflows.
A study to analyze the effect of heparinase on the release of the heparin on the
nanoparticles needs to be analyzed. The release of heparin from the nanoparticles with
and without heparinase could be analyzed over a period of time using DMMB, to confirm
the release method of heparin.
While stent use, clinically, has greatly advanced the treatment of cardiovascular
diseases, we need new approaches to deal with long-term complications that arise from
these approaches. Magnetic guided nanoparticle therapies provide a simple method for
targeting drugs to stented areas and could have applications beyond what was presented
here.

111
APPENDICES

112
Appendix A Polymer Modification
Written: Nardine Ghobrial
1. The polymer was synthesized by the Mefford Group using a living anionic ring opening polymerization of ethylene oxide with potassium bitrimethylsilylamide as an initiator and methane sulphonyl chloride was used to terminate the reaction (1).
2. In a round-bottom flask, add triethylamine and dopamine hydrochloride to the polymer in a 1.2:1.1:1 ratio, in 20 mL of dimethylformamide.
3. Place reaction on a magnetic stir plate overnight. 4. Add a few drops of hydrochloric acid to the reaction and let it stir for 4 hours. 5. Take flask with polymer solution off stir plate. 6. Put 20 mL polymer solution in 4X50 mL centrifuge tubes, 5mL each. 7. Fill the rest of the tubes to the top with ethyl ether. 8. Centrifuge for 7 minutes at 10,000 rpm. 9. Pour supernatant out and add 5 more mL of polymer to each tube. 10. Repeat steps 3, 4, and 5 until all the polymer solution is gone. 11. Add 5 mL of chloroform to the supernatant in each tube and fill the rest of the
tubes with ethyl ether. 12. Centrifuge again for 7 minutes at 10,000 rpm. 13. Poke holes in the caps of the centrifuge tubes using a needle and place them in
vacuum oven to dry overnight.

113
Appendix B Magnetite Nanoparticle Synthesis
Written: Nardine Ghobrial
1. Combine 1.074 g iron acetylacetonate with 15 mL of oleic acid in a 3-headed flask. 2. Cap the 2 side heads with rubber stoppers. 3. Heat a metal bath to 370oC and place the flask on a holder in the metal bath. 4. Carefully, attach a stir rod to the spinner and place it in the middle head of the flask
and start spinning. 5. Place nitrogen needle through the back stopper and adjust to 0.25 liter per minute. 6. Let the reaction run for 4 hours then let it sit overnight. 7. Separate magnetite solution into 3X50 mL centrifuge tubes. 8. For each tube, add 5 mL hexanes and ethanol:acetone in a 5:1 ratio. 9. Shake the tubes then use magnetic separation to discard the supernatant. 10. Repeat steps 8 and 9, 4 times then store in chloroform. 11. Inject the particles suspended in chloroform at approximately 3 mg/mL into
scintillation vile containing previously described PEO polymer suspended in chloroform at approximately 40 mg/mL, with a septum cap under sonication.
12. The injection process is done over a 30-minute period then allow it to sit under sonication for another 30 minutes, then allow it to sit for 4 days.
13. After four days, remove chloroform using rotary evaporation process. The nanoparticles are then resuspended into hexanes, sonicated, magnetically separated, and resuspended in chloroform and allowed to sit for 2 more days.
14. Repeat step 13, 4 times. After rotary evaporation for the third time, the particles are suspended in DI water.
15. Briefly sonicate the particles to ensure breaking any large aggregates, then pass them through a 0.22 µm nylon syringe filter.
16. Centrifuge the particles at 10,000 RPM for 10 minutes, decant the supernatant, and disperse the nanoparticles in DI water.
17. To get rid of excess polymer, the particles are filtered through 50 kDa centrifugal filter units (Millipore).
18. Mix the amine-functionalized nanoparticles with heparin at a 1:3 molar ratio. The aqueous particle solution is added to a low molecular weight heparin (LMWH, MP Biomedical), N-hydroxysulfosuccinimide (sulfoNHS, Thermo Scientific), and 1-ethyl-3-(3-dimethylaminopropyl)carbodiimide hydrochloride (EDC, TCI Chemicals) solution, with excess sulfoNHS and EDC.
19. Allow the solution to sit on a shake plate for 7 days to allow reaction. To get rid of excess LMWH, sulfoNHS, and EDC, the particles are filtered through 50 kDa centrifuge filter units.
114
Appendix C Fe Determination Protocol Written By: Elliot Mappus
Updated: Andrew Hargett 3/21/16
Iron Working Solution Preparation: 1. Obtain desired iron sample for test. 2. Transfer 5-8uL for concentrated samples or 100uL for dilute samples to a 10mL volumetric flask with a calibrated 10uL pipette. Note: Use one of the short-necked flasks to allow the pipette to reach the bottom of the flask. Place drop in center. We found 50 uL to work well. 3. Dissolve the iron in the flask with approximately 0.2mL of concentrated HCl for 15 seconds. 4. Fill the flask with deionized water to the 10 mL mark to form the iron stock solution. Top with a ground glass stopper and mix by inversion 3 times. 5. Transfer the solution to a disposable 15mL centrifuge tube and mix by inversion. Color Working Solution Preparation: 1.Hydroxylamine hydrochloride solution (100 g/L) – dissolve 1 g of hydroxylamine
hydrochloride in 10 mL nanopure water. 2.1,10-phenanthroline solution (3 g/L) – dissolve 0.3 g of 1,10-phenanthroline
monohydrate in 10mL of methanol and dilute to 100 mL with nanopure water. 3.Ammonium acetate-acetic acid solution – dissolve 10 g of ammonium acetate in
about 60 mL of wter, add 20 mL of glacial acetic acid, and dilute to 100 mL with nanopure water. Sodium acetate may be used in place of ammonium acetate.
Sample Preparation: 1. Using a calibrated 1mL pipette, transfer 0, 0.5, 1, 1.5, 2, and 2.5 mL of iron working solution to several 15 mL centrifuge tubes. 2. Dilute each centrifuge to 6mL with deionized water. 3. To develop color:
a. Add 0.2 mL of hydroxylamine hydrochloride solution to each centrifuge tube and swirl to mix. b. Add 0.5 mL of 1,10-phenathroline solution to each centrifuge tube and swirl to mix. c. Add 0.75 mL of ammonium acetate-acetic acid solution to each centrifuge tube and swirl to mix. d. Dilute each tube to 10 mL with nanopure (DI) water using a pipette. Mix by inversion.
4. Transfer 180 uL from each flask to a well in a 96-well plate.
115
Measure Absorbance: 1. Measure all samples using a plate reader. 2. For each sample, record the absorbance at 511 nm (the Fe peak) and at 690 nm (the baseline). 3. Subtract the 690 nm absorbance from the 511 nm absorbance and insert value into iron determination spreadsheet. Cleaning Procedure Notes: 1. Glassware should be stored in the drying oven and rinsed twice with DI water following use. 2. After stock solution is made, add 3 mL of concentrated HCl to the volumetric flask. Swirl for 30 seconds and dispose of the acid. 3. Rinse Volumetric flask twice with water in the fume hood, then twice outside of the fume hood. 4. Make the iron working solution immediately prior to measurements. 5. Color working solutions may be made several months in advance.
Reference: ASTM, E 394-0

116
Appendix D DMMB Assay
Written by: Alex Lindburg – MBEM Lab Updated: Andrew Hargett 3/21/16
Updated: Nardine Ghobrial 2/28/2018 DMMB Working Solution: 1. Dissolve 16 mg of DMMB dye in 1 L of nanopure water. 2. Add 3.04 g 99%+ pure glycine, 2.37 g NaCl, and 95 mL of 0.1 M HCol. 3. Stir with a stir-bar to mix thoroughly. 4. Filter through Watman paper, discard if there is any precipitate. 5. This solution may be stored at room temperature and protected from light for up to 2 months. Standard Curve Generation: 1. Make an initial working solution of 100 ug/mL GAG by adding 2.0 mg heparin powder to 20 mL of PBS. 2. Dilute appropriately to make final GAG working solutions of 0, 10, 20, 30, 40, and 50 µg/mL 3. Add 180 µL of DMMB working solution to 18 wells of a U-bottom 96-well plate. 4. Add 20 µL of GAG working solutions to wells in triplicates and shake for 5 seconds. 5. Read absorbance at 530 nm using a microplate reader. Reference: Mort, JS and PJ Roughly. Measurement of glycosaminoglycan release from cartilage explants. (2007) Methods in Molecular Medicine. 135, 201-209. Heparin Loading Calculation: 1. Create working solutions of nanoparticles at 0, 100, 150, 200, and 250 µg/mL in water. 2. Mix 20 µL of each nanoparticle working solution with 180 µL DMMB working solution in triplicates in a U-bottom 96-well plate. 113 3. Read absorbance using a microplate reader at 530 nm. 4. Normalize the value of nanoparticle concentration to heparin concentration to get the concentration of µg heparin per µg nanoparticles.
117
Appendix E Cell and Tissue Fixation and Embedding Protocol for TEM
Written by: Nardine Ghobrial
1. Cells are grown in T-75 flasks and passaged according to standard protocol forming a pellet in a 15mL centrifuge tube. Tissues are placed in a centrifuge tube.
2. Wash 3 times with buffer (cacodylate). 3. Fixate with 3% glutaraldehyde for 1 hour (24 hours for tissues and larger cell
pellets) at room temperature. 4. Rinse for 5 minutes in buffer (cacodylate), 3X 5. Add 1% osmium tetroxide with a few crystals of potassium ferrocyanide for 1
hour (4-6 hours, or until all in brown for tissues and larger cell pellets) at room temperature.
6. Dehydrate in ethanol in a series (50%-70%-95%-(2X)100%) for 4 (15) minutes each.
7. Infiltrate in LR White • LRW : ethanol- 1:1 overnight (fridge) • LRW 3 hours (room temperature) • LRW 20-24 hours (oven at 600C)
8. Utrathin sections (70-90 nm) are cut using a microtome. 9. Sections are mounted onto copper grids, precoated with Formvar 10. (Sections could be stained with uranyl acetate (30 minutes) and lead citrate (1
minute)). 11. TEM H7600 is used. 12. For EDAX analysis, TEM 2000 could be used.

118
Appendix F Live/Dead Assay Protocol
Written by: Andrew Hargett Updated: Nardine Ghobrial 6/26/2017
Sample Preparation: 1. Seed cells at 20,000 cells/well into a 24-well plate in standard media. 2. Incubate in standard media check for cell attachment. 3. Aspirate media and replace with experimental solutions and control parameters diluted in media in quadruplicates. 5. Incubate for 72 hours or as desired and check for cell attachment. 6. Aspirate media or experimental solutions and wash 3X with PBS. Live/Dead Assay: 1. The Live/Dead Viability/Cytotoxicity kit by Life Technologies was used to create working solutions of calcein acetoxymethyl (Calcein) and ethidium homodimer-1 (Etd-1). 2. Make solutions as follows:
a. 20 ul ethD-1 + 5 ul calcein 20 ml PBS (50 ml centrifuge tube) b. 5 ul ethd-1 5 ml PBS (15 ml centrifuge tube) c. 2.5 ul calcein 10 ml PBS (15 ml centrifuge tube)
3. Incubate all conditions for 30 min protected from light. (room temp.) 4. Measure fluorescence using a microplate reader at 485nm excitation to 530nm for live cell emission. 5. Calculate % live cell according to manufacturer’s protocol. 6. Image using an EVOS FL Microscope under Red/Green fluorescence for qualitative data.
119
Appendix G
MTS Assay Protocol Written by: Andrew Hargett
Updated: Nardine Ghobrial 7/11/2017 Sample Preparation: 1. Seed cells at 20,000 cells/well into a 24-well plate in standard media. 2. Incubate in standard media check for cell attachment. 3. Aspirate media and replace with experimental solutions and control parameters diluted in media in quadruplicates. 5. Incubate for 72 hours or as desired and check for cell attachment. 6. Aspirate media or experimental solutions and wash 3X with PBS. MTS Assay: 1. Mix the working solution from a CellTiter Aqueous One Solution Cell Proliferation Assay kit by Promega with standard media in a ratio of 1:5 by volume. (3 ml assay + 15 ml media in a 50 ml centrifuge tube wrapped in aluminum foil) 2. Aspirate experimental media and wash with sterile PBS 2x. 3. Add MTS solution diluted in media in same volume as experimental conditions. (600 ul) 4. Protect from light and incubate (in incubator) from 1-4 hours. 5. Transfer the supernatant to a 96 well plate (in triplicates-180 ul each). 6. Measure absorbance at 490 nm using a microplate reader.

120
Appendix H Immunofluorescence
Written: Suzanne Bradley 1. Fix cells using a 4% formaldehyde, 0.1% glutaraldehyde solution in 1X PBS for 20 minutes at room temperature. 2. Rinse gently 3 times with 1X PBS. 3. Permeabilize cells with a 0.1% Triton X-100 solution in 1X PBS for 15 minutes at room temperature. 4. Rinse gently 3 times with 1X PBS. 5. Block cells using a 2% BSA, 3% goat serum solution in 1X PBS for 30 minutes at room temperature. 6. Add primary antibody diluted in blocking solution 1:500, and incubate overnight at 4°C. 7. Save primary antibody for future uses. 8. Rinse gently 3 times with 1X PBS. 9. Add fluorescent secondary antibody at a concentration of 4 μL/mL in 1X PBS. 4. Rinse gently 3 times with 1X PBS. 5. Add 2.5% Alexa Fluor 568 Phalloidin (red) in 1X PBS for 20 minutes at room temperature. 6. Rinse gently 3 times with 1X PBS. 7. Add 300 nM DAPI solution (blue) in 1X PBS for 5 minutes at room temperature. 8. Rinse gently 3 times with 1X PBS and store in PBS to image. 9. Image with EVOS fluorescent microscope.

121
Appendix I Polymerase Chain Reaction
Written: Matt Rusin
Materials Needed
• TRIzol® Reagent • Water bath or heat block at 55-60°C • Chloroform • TURBO DNA-free Kit • Isopropyl Alcohol • Applied Biosystems PowerUp SYBER
Green Master Mix • 75% ethanol (in DEPC-treated water) • Applied Biosystems High Capacity
cDNA Reverse Transcription kit • RNase-free water • Selected Primers • Centrifuge capable of reaching 12,000xg
and 4°C • 96-well PCR plate and adhesive cover
• Sterile microcentrifuge tubes (1.5mL and 0.5mL tubes)
• RNase spray
Preparing Samples
1. Homogenizing Samples a. Passage cells according to proper protocol.
i. Remove media, wash cells with 1X PBS, and add Tripsin (5mL per T75 flask).
ii. Incubate at 37°C for 5 minutes in order to fully detach all cells. iii. Add an amount of media equivalent to the amount of Tripsin used and
transfer solution to a centrifuge tube. iv. Centrifuge for 5 minutes at 1000rpm. Remove supernatant.
b. Add TRIzol® directly to the cell pellet, volume dependent on the size of the pellet
i. 250µL is a good volume unless the cell pellet is very large. c. Lyse cells by pipetting solution up and down. “Mortar and pestle” sticks can
also be used to assist breaking up the cells. d. (Optional) Store sample solutions in individual 1.5mL microcentrifuge tubes.
Samples will be fine at room temperature for a couple hours, but if they will not be immediately used, store at -80°C.
i. Do note store at -80°C for more than a month. RNA will begin to degrade, resulting in lower quality.
2. Phase Separation a. Incubate homogenized sample for 5 minutes at room temperature. If samples are
frozen, allow to thaw first.
122
b. Add 0.2mL of chloroform per 1mL of TRIzol® used for homogenization. Close cap.
c. Shake tube vigorously by hand for ~15 seconds. Solution should turn cloudy pink.
d. Incubate at room temperature for 2-3 minutes. e. Centrifuge samples at 12,000xg for 15 minutes at 4°C.
i. The mixture separates into 3 distinct layers: lower red phenol-chloroform phase, an interphase, and a colorless upper aqueous phase. RNA will remain exclusively in the upper aqueous phase.
f. Carefully remove the aqueous phase and pipet it into a new microcentrifuge tube. This is made easier by angling the tube at a 45° angle.
i. DO NOT pull any of the interphase as it will contaminate the RNA. The interphase is a pink solid; if some is accidentally pulled into the pipet, slowly depress the plunger until it has been ejected
3. RNA Precipitation a. (If cell count is under 1x10⁶, start here) Add 5-10µg of RNase-free glycogen to
the aqueous phase. i. Stock glycogen is at a concentration of 5mg/mL. Dilute to appropriate
concentration. 1. It is recommended to add 5-10µg. This translates to 2µL of stock
solution. ii. Glycogen is co-precipitated with the RNA, but does not inhibit first-strand
synthesis at concentrations ≤4mg/mL, and does not inhibit PCR. b. Add 0.5mL of 100% isopropanol to the aqueous phase, per 1mL of TRIzol®
used for homogenization. Mix slightly. i. If no glycogen was used, incubate at room temperature for 10
minutes. ii. If glycogen was used, incubate at -20°C for 10 minutes.
c. Centrifuge at 12,000xg for 30 minutes at 4°C. i. RNA should be visible in a gel-like pellet at the bottom of the tube after
centrifuging. 4. RNA Wash
a. Remove the supernatant, leaving only the RNA pellet. i. The pellet is stuck pretty well to the bottom of the tube, so it can be safe to
dump the supernatant out. Be careful if you choose to do this instead of pipetting the liquid out.
ii. With the cap open, let the pellets dry slightly (<1 minute) b. Wash the pellet with 100µL of 75% ethanol.

123
c. Vortex briefly, then centrifuge at 12,000xg for 10 minutes at 4°C. d. Remove liquid, careful to not disturb the pellet. e. Centrifuge for 30 seconds.
i. This consolidates all remaining liquid. ii. Remove liquid, again careful to not disturb the pellet.
f. Air dry with the caps open, keeping a close eye on the pellets. i. As they dry, they will become more gel-like and start to disappear. If the
pellet dries too much, the RNA will degrade. It should take around 5 minutes for drying to occur, but each pellet will be different.
5. RNA Resuspension and DNase Treatment a. Resuspend pellet in 20µL DNase and RNase free water, pipetting up and down
a couple times to break pellet apart. b. Incubate in a water bath or heat block at 55-60°C for 10-15 minutes. c. Add 3µL 10x Turbo DNase Buffer; pipet up and down to distribute. d. Add 1µL Turbo DNase; pipet up and down to distribute. e. Incubate at 37°C for 30 minutes. f. Add 3µL DNase Inactivation Agent; pipet up and down to mix. g. Incubate at room temperature for 5 minutes, flicking occasionally to mix. h. Centrifuge at 10,000xg for 1.5 minutes. i. Transfer liquid to a 0.5mL centrifuge tube.
i. Be extremely careful not to disturb the pellet at the bottom as it will contaminate the sample.
6. RNA Quality Check: Nanodrop a. Place 4µL RNA-free H20 on pedestal for ~5 minutes. Wipe clean with
Kimwipe. b. Open the Nanodrop and follow instructions for calibration. Change “Type” to
RNA (on the left side of the screen). c. Blank the machine by placing 2µL RNA-free H20 on pedestal and pressing
“Blank”. The graphical result should be very close to 0. d. Measure the blank, then wipe clean. e. Measure each sample (2µL), being sure to label each in the software before
measurement. i. Good quality is shown by the A260/280 value being above 1.8. Below 1.6
is considered bad quality and should not be used for cDNA expansion or genomic analysis.
f. Export the data to a spreadsheet. Columns of interest include Samples ID, Nucleic Acid Concentration, A260, A280, and 260/280.
g. Place 4µL RNA-free H20 on pedestal for ~5 minutes in order to clean again.

124
7. cDNA Expansion and Reverse Transcription a. Remove cDNA Reverse Transcription Kit from freezer and allow to thaw. b. Prepare master mix from kit.
Component Volume/Reaction (uL) Kit with RNase
Inhibitor Kit without RNase Inhibitor
10X RT Buffer 2.0 2.0 25X dNTP Mix (100mM)
0.8 0.8
10X RT Random Primers
2.0 2.0
MultiScribe™ Reverse Transcriptase
1.0 1.0
RNase Inhibitor 1.0 - Nuclease-free H2O 3.2 4.2 Total per Reaction 10.0 10.0
Important: Include ~10% additional volume in the calculations to provide excess volume for the loss that occurs during reagent transfers.
c. Calculate volume of water to add to RNA to achieve desired concentration. i. 200ng of total RNA is sufficient for reliable results.
d. Pipette 10uL of master mix into each vial. e. Pipette calculated amount of RNA into each vial, then add Nuclease-free H2O
until total volume is 20uL. Pipette up and down a couple times to mix. f. Place samples in the thermal cycler using the following settings
Step 1 Step 2 Step 3 Step 4 Temperature 25°C 37°C 85°C 4°C Time 10 min 120 min 5 min ∞
8. SYBR Green and Primer Preparation
a. Thaw DNA samples and primers. Vortex to mix thoroughly. b. Swirl SYBR Green Master Mix to mix thoroughly. c. Determine volume amounts needed for each primer master mix (including at
least 3 replicates), then add 10% to account for pipetting error. Component Volume (20µL/well)
SYBR Green Master Mix 10µL Forward and Reverse Primers Variable (2-4µL)
DNA template 2µL Nuclease-Free Water Variable
Total 20µL

125
d. Mix components of each master mix thoroughly by vortexing. If there are any bubbles present, centrifuge briefly.
e. Transfer the correct volume of each master mix to the appropriate wells of an optical plate.
f. Seal the plate with an optical adhesive cover, then briefly centrifuge the plate to remove any air bubbles.
g. Plate can be stored at room temperature for up to 24 hours and still obtain reliable results.
9. Setup and running the PCR instrument a. Turn on the StepOne Plus. It will take 10-15 minutes for the instrument to
properly warm up and connect to the software. b. Place the plate in in the instrument. c. In the software, select “Advanced Setup”.
i. Define your targets (primers) and your samples. ii. Setup the plate by defining where each target and sample is located.
iii. Setup the run protocol. This is determined by a combination of the SYBR Green being used and melting temperature of the primers. Each SYBR Green kit should have a couple tables to help you figure out the proper temperatures to use. Determining the melting temperature of the primers is a little more involved, though, and might require some trial and error to nail down.
iv. Ensure that a melt curve is being generated at the end so you can be confident that your primers are acting correctly.
d. Start the run.

126
Appendix J
TEM Uptake Study
Day 0 Day 1
Day 2 Day 3

127
Day 4 Day 5
Day 6
128
Appendix K Hematoxylin and Eosin Staining protocol
Written: Jayesh Betala Updated: Nardine Ghobrial
For paraffin embedded tissues start here: 1) 10 dips in xylene for deparaffinizing
2) 5 minutes in xylene
For GMA embedded tissue start here:
3) 10 dips in 100% ethanol followed by 1 minute in 100% ethanol
4) 10 dips in 95% ethanol followed by 1 minute in 95% ethanol
5) Rehydrate in tap water for 1 minute followed by 1 minute in distilled water
6) 5 minutes in hematoxylin solution followed by rinsing under tap water until clear
7) 4 dips in clarifier, clear under tap water followed by bluing reagent for 1 minute and again rinsing under tap water
8) Dehydrate in 95% ethanol for 30 seconds, followed by 30 seconds in eosin
9) Dehydrate in 95% ethanol- 10 dips, 100% ethanol- 10 dips, 100% ethanol – 1 minute and 100% ethanol – 3 minutes
10) Clear in xylene with 10 dips and 5 minutes incubation.
11) Mount with a mounting medium, coverslip and image under microscope

129
Appendix L Masson’s Trichrome Staining protocol
Written: Jayesh Betala Updated: Nardine Ghobrial
For paraffin embedded tissues start here:
1. 10 dips in xylene for deparaffinizing 2. 5 minutes in xylene
For GMA embedded tissue start here:
3. 10 dips in 100% ethanol followed by 1 minute in 100% ethanol 4. 10 dips in 95% ethanol followed by 1 minute in 95% ethanol 5. Rehydrate in tap water for 1 minute followed by 1 minute in distilled water 6. Mordant in Bouin’s solution for 1 hour at 60⁰C. Wash in running tap water for 5
minutes 7. Stain in Weigert’s Iron hematoxylin working solution for 10 minutes (Working
solution prepared by mixing solution A and Solution B at 1:1 ratio) 8. Wash in running tap water for 5 minutes, followed by distilled water for 1 minute. 9. Stain with Biebrich Scarlet- Acid Fuchsin solution for 5 minutes followed by
rinse in distilled water 10. Treat with Phopsphotungstic/Phosphomolybdic acid for 10 minutes (Do not rinse
with distilled water at this step)
11. Stain with Aniline Blue solution for 5 minutes followed by at least 2 rinses in distilled water
12. Differentiate with 1% acetic acid for 30 seconds and rinse in distilled water 13. Dehydrate in 95% ethanol, 100% ethanol and clear in xylene for 5 minutes 14. Mount with mounting medium and coverslip and image under a microscope

130
Appendix M GMA Embedding Protocol Written: Nardine Ghobrial
1. Wash tissue in PBS then fix in 10% formalin for 24 hours.
2. Wash fixed tissue in saline then rinse in 100% ethanol for 5 minutes.
3. Place tissue in tissue cassettes in GMA inside a glass dessicator, under vaccum in
the fridge for 2 weeks
4. After 1 week, filter GMA and replace it.
5. Place tissue in a tear-away mold in GMA under ultravilot light for 24 hours to
cure.
6. Section the GMA blocks were cut into sections of ~5 mm in thickness using a
band saw.
7. Glue the GMA sections to plexiglass slides then polish to ~80-120 µm sections
using a grinding wheel.


