
1
User Manual
Solar-Log 300, 1200 and 2000
2
Publisher:
Solare Datensysteme GmbH
Fuhrmannstr. 9
72351 Geislingen-Binsdorf
Germany
Tel.:+49 7428 9418 -200
Fax:+49 7428 9418 -280
E-mail: [email protected]
Technical support:
End customers and non-certified installers
Tel.: +49-900-1737564*
Installation problems from certified installers and Solar-Log™ partners
Tel.: +49 7428 9418 -660
Service and planning inquiries
Tel.: +49 7428 9418 -660
International support for countries without country partners
Tel.: +49 7428 9418 -640
E-mail: [email protected]
*0.59 Euro per one-minute increment for calls from from German landline phones. Prices for calls from mobile

3
Table of Contents
1 General Information ����������������������������������������������������������������������������������������������������� 61�1 The necessary steps for precision monitoring of your PV plant with the Solar-Log™ � �������������������� 6
2 Operating via a web browser within your own network ������������������������������� 72�1 Requirements ����������������������������������������������������������������������������������������������������������������������������������������������������������������� 72�2 Overview �������������������������������������������������������������������������������������������������������������������������������������������������������������������������� 82�2�1 Start page ������������������������������������������������������������������������������������������������������������������������������������������������������������������������82�3 Accessing the Start page ������������������������������������������������������������������������������������������������������������������������������������������ 92�4 Accessing Yield data ������������������������������������������������������������������������������������������������������������������������������������������������� 102�4�1 Current values ��������������������������������������������������������������������������������������������������������������������������������������������������������������102�5 Production ��������������������������������������������������������������������������������������������������������������������������������������������������������������������� 112�5�1 Day view ������������������������������������������������������������������������������������������������������������������������������������������������������������������������� 122�5�2 Month view �������������������������������������������������������������������������������������������������������������������������������������������������������������������� 132�5�3 Year view ������������������������������������������������������������������������������������������������������������������������������������������������������������������������ 152�5�4 Total view ����������������������������������������������������������������������������������������������������������������������������������������������������������������������� 162�6 Consumption ���������������������������������������������������������������������������������������������������������������������������������������������������������������� 172�7 Balances ������������������������������������������������������������������������������������������������������������������������������������������������������������������������� 192�7�1 Day balance ������������������������������������������������������������������������������������������������������������������������������������������������������������������202�7�2 Month balance �������������������������������������������������������������������������������������������������������������������������������������������������������������� 212�7�3 Year balance ����������������������������������������������������������������������������������������������������������������������������������������������������������������� 222�7�4 Total balance ���������������������������������������������������������������������������������������������������������������������������������������������������������������� 232�8 Finances ������������������������������������������������������������������������������������������������������������������������������������������������������������������������ 242�9 Sensor ���������������������������������������������������������������������������������������������������������������������������������������������������������������������������� 252�10 System Information �������������������������������������������������������������������������������������������������������������������������������������������������� 262�11 Accessing Diagnostic values ��������������������������������������������������������������������������������������������������������������������������������� 272�11�1 Inverter diagnostic ����������������������������������������������������������������������������������������������������������������������������������������������������� 272�11�2 Accessing Event logs ������������������������������������������������������������������������������������������������������������������������������������������������302�11�3 Accessing Notifications �������������������������������������������������������������������������������������������������������������������������������������������� 312�11�4 Accessing Feed-In Management �������������������������������������������������������������������������������������������������������������������������� 332�11�5 Accessing the SCB Monitor (only Solar-Log 2000) ������������������������������������������������������������������������������������� 372�11�6 Accessing components �������������������������������������������������������������������������������������������������������������������������������������������� 382�11�7 Accessing CSV Export ���������������������������������������������������������������������������������������������������������������������������������������������� 392�11�8 Accessing Support ������������������������������������������������������������������������������������������������������������������������������������������������������ 41
3 Notifications �����������������������������������������������������������������������������������������������������������������423�1 Yield E-mail ������������������������������������������������������������������������������������������������������������������������������������������������������������������ 423�1�1 Details of the individual E-Mail functions ���������������������������������������������������������������������������������������������������������443�2 Performance Monitoring ����������������������������������������������������������������������������������������������������������������������������������������� 473�2�1 Performance Monitoring Notification �����������������������������������������������������������������������������������������������������������������493�2�2 Calculation and Explanation of the Notification ��������������������������������������������������������������������������������������������50

4
4 Operating the Solar-Log 1200 and 2000 via Touch Display ���������������������524�1 Navigating from the touch screen ���������������������������������������������������������������������������������������������������������������������� 524�2 Accessing the Dashboard �������������������������������������������������������������������������������������������������������������������������������������� 544�3 Accessing the Energy Balance ����������������������������������������������������������������������������������������������������������������������������� 544�4 Accessing Forecast��������������������������������������������������������������������������������������������������������������������������������������������������� 564�5 Accessing Yield history ������������������������������������������������������������������������������������������������������������������������������������������� 574�6 Accessing Environmental performance ������������������������������������������������������������������������������������������������������������ 574�6�1 Pac Correction Factor ����������������������������������������������������������������������������������������������������������������������������������������������604�6�2 Calculating the PAC correction factor ���������������������������������������������������������������������������������������������������������������� 61
5 Using the Solar-Log WEB ���������������������������������������������������������������������������������������625�1 Registering for Solar-Log™ WEB "Classic 2nd Edition" ����������������������������������������������������������������������������� 625�2 Accessing Plant data ����������������������������������������������������������������������������������������������������������������������������������������������� 645�3 Accessing Yield data ������������������������������������������������������������������������������������������������������������������������������������������������ 675�3�1 How to navigate between different overviews ����������������������������������������������������������������������������������������������� 675�3�2 The meaning of the values in the overviews ���������������������������������������������������������������������������������������������������685�3�3 Daily Overview ������������������������������������������������������������������������������������������������������������������������������������������������������������685�3�4 Monthly Overview ������������������������������������������������������������������������������������������������������������������������������������������������������695�3�5 Annual Overview ��������������������������������������������������������������������������������������������������������������������������������������������������������705�3�6 Total Overview�������������������������������������������������������������������������������������������������������������������������������������������������������������� 715�3�7 Accessing and filtering the Event log ���������������������������������������������������������������������������������������������������������������� 72
6 Using the Solar-Log™ Android App ��������������������������������������������������������������������746�1 Installing the App ������������������������������������������������������������������������������������������������������������������������������������������������������ 746�2 Add plants �������������������������������������������������������������������������������������������������������������������������������������������������������������������� 756�3 Plant settings �������������������������������������������������������������������������������������������������������������������������������������������������������������� 766�3�1 S0 meter ������������������������������������������������������������������������������������������������������������������������������������������������������������������������ 776�3�2 Management ���������������������������������������������������������������������������������������������������������������������������������������������������������������� 786�4 The Toolbar ������������������������������������������������������������������������������������������������������������������������������������������������������������������ 796�5 Accessing Yield values �������������������������������������������������������������������������������������������������������������������������������������������� 806�5�1 Daily Overview ������������������������������������������������������������������������������������������������������������������������������������������������������������� 816�5�2 Monthly Overview ������������������������������������������������������������������������������������������������������������������������������������������������������� 816�5�3 Annual Overview �������������������������������������������������������������������������������������������������������������������������������������������������������� 826�5�4 Total Overview������������������������������������������������������������������������������������������������������������������������������������������������������������� 836�6 Accessing CO2 savings ������������������������������������������������������������������������������������������������������������������������������������������� 836�7 App settings ���������������������������������������������������������������������������������������������������������������������������������������������������������������� 846�7�1 Periodical data update ��������������������������������������������������������������������������������������������������������������������������������������������� 856�7�2 Reset �������������������������������������������������������������������������������������������������������������������������������������������������������������������������������866�7�3 Slide show ��������������������������������������������������������������������������������������������������������������������������������������������������������������������� 876�7�4 Legal Disclaimer ��������������������������������������������������������������������������������������������������������������������������������������������������������� 876�8 The Yield Data as a Slide Show ��������������������������������������������������������������������������������������������������������������������������� 886�9 Using the Android App with a Smartphone ��������������������������������������������������������������������������������������������������� 886�9�1 Smartphone vertical format �����������������������������������������������������������������������������������������������������������������������������������896�9�2 Smartphone - horizontal format ��������������������������������������������������������������������������������������������������������������������������906�9�3 Solar-Log™ Widget for Smartphones ������������������������������������������������������������������������������������������������������������������ 91

5
7 Using the Solar-Log™ APP iPhone V3 for iPhones ����������������������������������������927�1 Installing the App ������������������������������������������������������������������������������������������������������������������������������������������������������ 927�2 Add plants �������������������������������������������������������������������������������������������������������������������������������������������������������������������� 937�3 Accessing Yield data ������������������������������������������������������������������������������������������������������������������������������������������������ 947�3�1 How to navigate between different overviews ����������������������������������������������������������������������������������������������� 957�4 The top menu bar������������������������������������������������������������������������������������������������������������������������������������������������������ 977�5 The bottom menu bar ��������������������������������������������������������������������������������������������������������������������������������������������� 987�5�1 Daily Overview ������������������������������������������������������������������������������������������������������������������������������������������������������������987�5�2 Monthly Overview ������������������������������������������������������������������������������������������������������������������������������������������������������997�5�3 Annual Overview ������������������������������������������������������������������������������������������������������������������������������������������������������ 1007�5�4 Total Overview������������������������������������������������������������������������������������������������������������������������������������������������������������ 1017�6 Viewing CO2 savings ��������������������������������������������������������������������������������������������������������������������������������������������� 1027�7 Viewing Plant data �������������������������������������������������������������������������������������������������������������������������������������������������� 1037�8 The Yield Data as a Slide Show ������������������������������������������������������������������������������������������������������������������������� 1057�8�1 Start the Slide Show ����������������������������������������������������������������������������������������������������������������������������������������������� 106
8 Cleaning and care����������������������������������������������������������������������������������������������������� 1078�1 Cleaning tips �������������������������������������������������������������������������������������������������������������������������������������������������������������� 1078�2 Care tips ����������������������������������������������������������������������������������������������������������������������������������������������������������������������� 107
9 Notifications on the LCD Status Display ���������������������������������������������������������1089�1 Meaning of the symbols on the LCD display ������������������������������������������������������������������������������������������������ 108
10 Disposal �������������������������������������������������������������������������������������������������������������������������� 111
11 Technical Data ������������������������������������������������������������������������������������������������������������ 112
12 List of figures �������������������������������������������������������������������������������������������������������������� 118

6
General Information
1 General Information
This user manual is intended to assist you in operating the Solar-Log 300, 1200 and 2000. The yield data
from the Solar-Log300, 1200, 2000 can be displayed in several ways:
• via a web browser in a local network (LAN) (Chapter 2).
• via the touch screen directly on the device (Chapter 4)
• via the Internet (Chapter 5) or
• with the Solar-Log™ App (Chapter 6 and 7).
1�1 The necessary steps for precision monitoring of your PV plant with the
Solar-Log™ �
• Connecting and detecting inverters, refer to the Inverter Connection Manual and the Configuring
connected devices chapter in the Installation Manual.
• Configuring inverters, generator output, MPP Trackers and module fields, refer to the Configuring
connected devices chapter in the Installation Manual.
• Configuring the notification function and status messages from the inverter, refer to the Configur-
ing Notifications chapter in the Installation Manual.
• Activating and configuring performance monitoring, refer to the Configuring connected devices
chapter in the Installation Manual.
Note:The Solar-Log needs a continuous supply of electricity to avoid data loss and to
ensure precision monitoring of the PV plant

7
Operating via a web browser within your own network
2 Operating via a web browser within your own network
2�1 Requirements
InformationFor faster access, enter "solar-log" in the address bar of the web browser and cre-
ate a bookmark.
In a local network (LAN)
To operate the Solar-Log 300, 1200 and 2000 via a web browser, you need a computer that is connected
to the same local network (LAN). This computer will also need to have a web browser installed on it.
The Solar-Log unit also has to be connected to this network with the proper network settings.
Via the Internet
In addition to a computer with a web browser, you need an Internet connection as well as a user account.
To set up a user account, please contact your installer or see our website for more information:
http://www.solar-log.com/en/products-solutions/solar-log-web.html

8
Operating via a web browser within your own network
2�2 Overview
2�2�1 Start page
Fig.: Navigation designations
The start page contains the following sections:
• Header bar (A)
• Left navigation (B)
• Tabs (C)
• Configuration page (D)
Header bar
The header contains three main sections:
• Yield data - Here you can view your plant's yield overview and have the option to select different
periods of time such as day, month, year and the total yield to date.
• Diagnostic - Here you can view the fault and process messages and filter them according to vari-
ous criteria.
• Configuration - Here you can change the device settings as required.
Left navigation menu
Depending on the tab selected, you can access additional functions from the navigation menu (left-side).
Tabs
Additional configuration sections appear according to the function selected.
Configuration page
Here, you can make necessary configurations for the optimal monitoring and evaluation of your plant. You
can also view information on the power output, yields and the device.

9
Operating via a web browser within your own network
2�3 Accessing the Start page
Start your web browser and enter "solar-log" in the address bar of the web browser or select the book-
mark in the browser's navigation bar. If there are several Solar-Log™ devices connected to the network,
enter http://solar-log-wxyz in the address bar. Here “wxyz” stands for the last 4 digits of the serial number
of the Solar-Log™.
• The welcome screen is displayed.
Fig.: Welcome screen
The following navigation menus can be selected from the header bar:
• Yield data
• Diagnostic
• Configuration

10
Operating via a web browser within your own network
2�4 Accessing Yield data
Access the yield data from the header bar.
The following options can be selected from the left-side navigation menu:
• Current values
• Production
• Consumption (only appears when a consumption meter is connected)
• Balances
• Finances
• Sensor (only appears when a sensor is connected)
• System Information
2�4�1 Current values
Select the Current values menu to see the plant's new Dashboard view.
Fig.: The plant's current values
The following values are displayed in a tachometer format:
• Consumption (only when consumption meters are connected). This displays the current consump-
tion.
• Production (output generated by the plant). This displays the current production.
• Feed-in amount (only when meters are connected). This displays current amount of grid feed.

11
Operating via a web browser within your own network
There are two graphs below the Dashboard display
• The current day curve (graph on the left). There is also the option to display the previous five days
as a curve in this graph. Just click on the day value in the graph on the right.
• The current day value as well as those from the previous 5 days (graph on the right). Move the
mouse above one of the bars to display the day value. Click on one of the bars to have it display in
the graph on the left as a curve.
Below the graphs, there is a table that displays the measured output from the devices connected:
• The current output from each individual inverter.
• The total current consumption as measured by the consumption meters.
• The current irradiation per m2 as measured by the sensor.
2�5 Production
You can select a graphic display of your plant's production from the Production menu.
Fig.: Graphic display of the plant's total production
12
Operating via a web browser within your own network
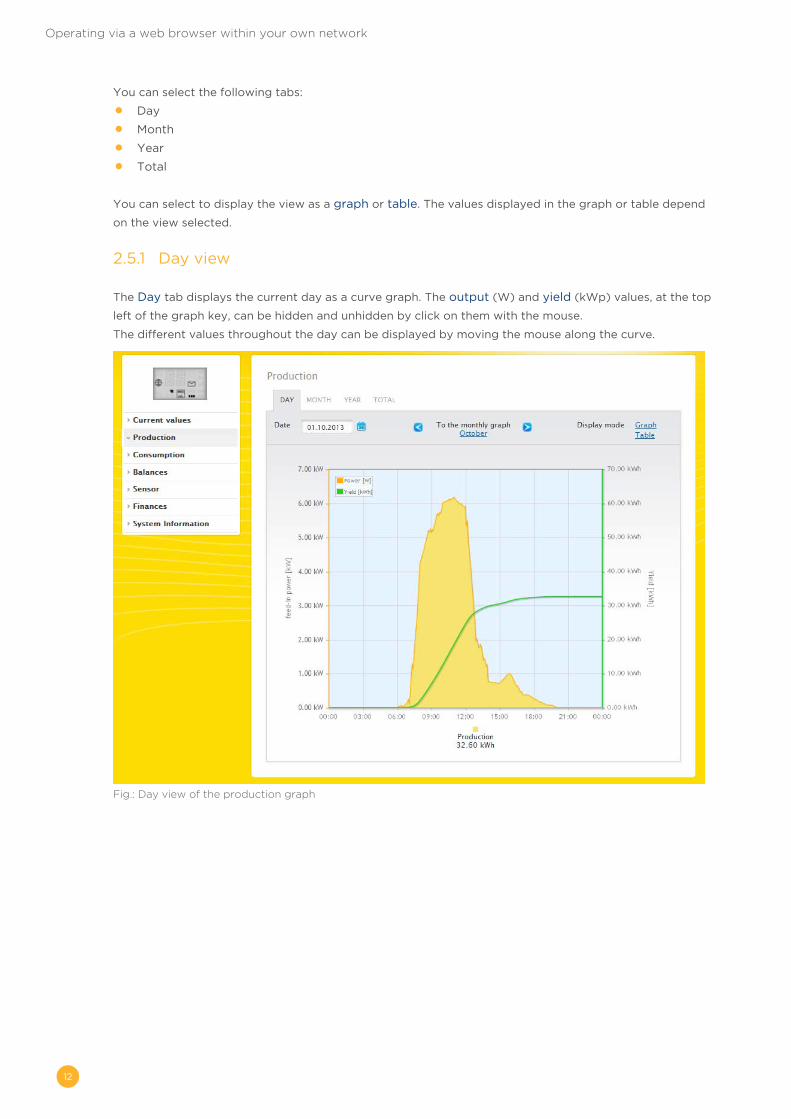
You can select the following tabs:
• Day
• Month
• Year
• Total
You can select to display the view as a graph or table. The values displayed in the graph or table depend
on the view selected.
2�5�1 Day view
The Day tab displays the current day as a curve graph. The output (W) and yield (kWp) values, at the top
left of the graph key, can be hidden and unhidden by click on them with the mouse.
The different values throughout the day can be displayed by moving the mouse along the curve.
Fig.: Day view of the production graph

13
Operating via a web browser within your own network
Fig.: Day view of the production table
When you click on Table, the values from the current output generated will be allocated to the individual
inverters and displayed as a table. In this way, you can check the output of every inverter at any time.
2�5�2 Month view
The Month tab displays the daily yields from the month as a total in a bar graph.
• The daily yield can be displayed by moving the mouse above one of the bars.
• Click on a bar to go to the corresponding day view.
Fig.: Month view production graph

14
Operating via a web browser within your own network
Fig.: Month view of the production table
When you click on Table, the date and daily output will be listed for the entire month.

15
Operating via a web browser within your own network
2�5�3 Year view
The Year tab displays the monthly yields from the year as a total in a bar graph.
• Move the mouse above one of the bars to display the monthly yield with a comparison of the cur-
rent and target values in regard to the annual forecast.
• Click on a bar to go to the corresponding month view.
Fig.: Year view graph
When you click on Table, the annual values for the entire year are allocated to each month according to
the actual output generated.

16
Operating via a web browser within your own network
2�5�4 Total view
The Total tab displays the annual yields as a total in a bar graph. The red line displays the target balance
that is calculated according to the annual forecast.
• Move the mouse above one of the bars to display the annual yield with a comparison of the current
and target values in regard to the annual forecast.
• Click on a bar to go to the corresponding year view.
Fig.: Total view graph
Table:
The plant's total power output (since the monitoring started) is allocated every year according to the out-
put generated.
The Date box is included in the day, month and year view and has a calendar function with which you
can search for certain days, months or years according to the view selected. You can go backwards and
forwards within the selected period with the arrow keys for the previous or next day or week.
17
Operating via a web browser within your own network
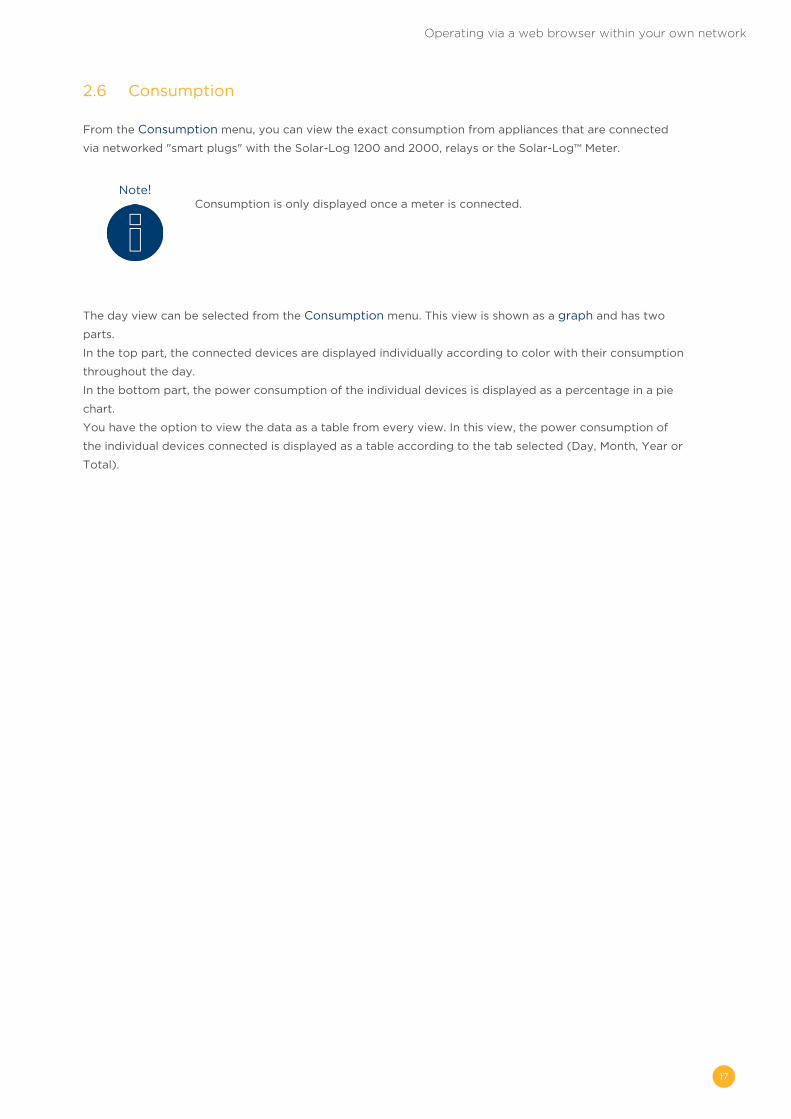
2�6 Consumption
From the Consumption menu, you can view the exact consumption from appliances that are connected
via networked "smart plugs" with the Solar-Log 1200 and 2000, relays or the Solar-Log™ Meter.
Note!Consumption is only displayed once a meter is connected.
The day view can be selected from the Consumption menu. This view is shown as a graph and has two
parts.
In the top part, the connected devices are displayed individually according to color with their consumption
throughout the day.
In the bottom part, the power consumption of the individual devices is displayed as a percentage in a pie
chart.
You have the option to view the data as a table from every view. In this view, the power consumption of
the individual devices connected is displayed as a table according to the tab selected (Day, Month, Year or
Total).

18
Operating via a web browser within your own network
Fig.: Graph of the daily consumption from the connected appliances
With this display mode, you have the option to select additional tabs.
• Month:
This displays the graph view in two parts. In the top part, you see the devices connected as a bar graph
with the power consumption displayed in different colors.
In the bottom part, the devices connected are displayed as a percentage in a pie chart.
The additional table view option can be selected with the display mode on the bottom-right corner.
• Year:
This displays the graph view in two parts.
In the top part, you see the devices connected as a bar graph with the power consumption displayed in
different colors. In the bottom part, the devices connected are displayed as a percentage in a pie chart.
The additional table view option can be selected with the display mode on the bottom-right corner.
• Total:
THis displays the graph view in two parts. In the top part, you see the connect devices as a bar graph with
the power consumption displayed in different colors.
In the bottom part, the connected devices are displayed as a percentage in a pie chart.
The additional table view option can be selected with the display mode on the bottom-right corner.

19
Operating via a web browser within your own network
2�7 Balances
You can see the relationship between your plant's production and consumption from the Balances menu.
Note!Consumption is only displayed once a meter is connected.
Fig.: Balances graph
The following tabs can be selected:
• Day
• Month
• Year
• Total
The start view displays the current daily values as a graph.

20
Operating via a web browser within your own network
2�7�1 Day balance
The Day tab under Balances displays the production, consumption and self-consumption side-by-side as a
day curve. The values at the top left of the graph key can be hidden and unhidden by clicking on them.
The different values throughout the day can be displayed by moving the mouse along the curve.
Fig.: Day balance graph
The green areas display the amount of consumption that was covered with PV power. The yellow areas
displays the surplus of PV generated power and the red areas display the amount of consumption that was
not covered with PV power.
You have a choice between the Graph and Table display mode.

21
Operating via a web browser within your own network
2�7�2 Month balance
The Month tab under Balances displays the production and consumption side-by-side in a bar graph.
• Move the mouse above one of the bars to view either the daily yield or consumption.
• Click on one of the bars to go to the corresponding day view.
Fig.: Month view balance graph

22
Operating via a web browser within your own network
2�7�3 Year balance
The Year tab under Balances displays the production and consumption side-by-side in a bar graph.
• Move the mouse above one of the bars to view either the monthly yield or consumption with a
comparison of the current and target values in regard to the annual forecast.
• Click on one of the bars to go to the corresponding month overview.
Fig.: Year view balance graph

23
Operating via a web browser within your own network
2�7�4 Total balance
The Total tab under Balances displays the production and consumption side-by-side in a bar graph.
• Move the mouse above one of the bars to view either the annual yield or consumption with a com-
parison of the current and target values in regard to the annual forecast.
• Click on one of the bars to go to the corresponding annual overview.
Fig.: Total balance graph

24
Operating via a web browser within your own network
2�8 Finances
Your plant's financial performance can be displayed as a graph or table from the Finances menu. (See the
chapter "Defining Tariffs and Costs" in the Installation Manual to configure of the tariff and consumption
values)
Fig.: Finances overview
The total financial performance of your plant is displayed as a graphic with the actual/target value curve in
the overview.
The following values are listed in the table:
• Feed:
This displays the amount of power in KWh that has been fed into the grid and also calculates the value into
your local currency.
• Self-consumption:
This displays the amount of self-consumption in KWh and also calculates the value into your local currency.
• Power consumption:
This displays the amount of power consumption that has been purchased in KWh and also calculates the
value into your local currency.
The totals are automatically calculated at the bottom of the table based on the PV revenue and purchased
power expenses.

25
Operating via a web browser within your own network
Note!
The graphical overview under the menu selection “Yield Data | Finances” is not
visible until several weeks of data logging have gone by.
2�9 Sensor
A graphic evaluation from the connected sensors can be displayed from the Senor menu.
Fig.: Graph of Sensor Box values
The following values can be displayed individually:
• IrradiationW/m²
• Module temperature C°
• Ambient temperature C°
• Wind speed m/s
The individual values at the top left of the graph key can be hidden and unhidden by clicking on them. You
can select and subsequently evaluate certain days with the Date box.
Note!
Data is only available if a sensor is connected.

26
Operating via a web browser within your own network
2�10 System Information
Go to the System information menue to view plant and system information.
Fig.: System Information
The following information is displayed:
About this Solar-Log™:
• Model
• Serial number
• Firmware version
Plant data:
• Plant size
• Installation date
Detected devices:
• Inverters
• Power meters
• Sensors

27
Operating via a web browser within your own network
2�11 Accessing Diagnostic values
Access the Diagnostic from the header bar.
The following options can be selected from the left-side navigation menu.
• Inverter diagnostic
• Event log
• Notifications
• Feed-In Management
• SCB Monitor (only Solar-Log 2000 with SCB activated)
• Alarm contact (only Solar-Log 2000)
• CSV Export
2�11�1 Inverter diagnostic
To access the Inverter diagnostic menu, go to Diagnostic | Inverter Diagnostic.
The following tabs can be selected from this menu:
• Inverter details
• Tracker comparison
• Module field comparison
Inverter details
To access the Inverter details menu, go to Diagnostic | Inverter Diagnostic | Inverter details.
A particular date and device (e.g. inverter or sensor) can be selected under inverter details and evaluated.

28
Operating via a web browser within your own network
Fig.: Inverter details graph
In the example (see Fig.: Inverter details graph), the following values can be displayed for the inverter:
• Pac
• DC power 1
• DC voltage 1
• Temperature (this value is displayed if the inverter supports this function. Otherwise only the
value 1/0 C° is displayed in the graph)
• Yield
All of the displayed values can be directly selected and deselected at any time by clicking in the graph key
(upper-right corner of the graph).
Tracker comparison
To access the Tracker comparison menu, go to Diagnostic | Inverter Diagnostic | Tracker comparison.
Two trackers (either from the same device or two different devices) can be compared on a particular date
by selecting the date, device and Tracker.
Fig.: Tracker comparison graph
In the example (see Fig.: Tracker comparison graph), two different inverters have been selected and evalu-
ated*** and the better view has been selected for the DC voltage 1 and 2 values.

29
Operating via a web browser within your own network
The two strings from inverter 6 and 7 are directly compared to each other.
The gray line displays the degree of deviation. The deviation as a percentage is indicated in the right
column. The deviation is displayed as a positive or negative percentage. In the example, the deviation
between the strings is from about -5% to +5%. The column on the left indicates the kW/kWp output of the
tracker.
In the graph legend (upper-right corner of the graph), all of the displayed values can be directly selected
and deselected at any time with a mouse click.
Module field comparison
To access the Module field comparison menu, go to Diagnostic | Inverter Diagnostic | Module field com-
parison.
Fig.: Module field comparison graph
With the date and Module Field boxes, the module field comparison permits all devices (e.g. inverters and
sensors) and their strings that are assigned to the same module field to be compared on the current and
previous days (see Fig.: Module field comparison graph) in order to more efficiently detect faults from the
performance monitoring.
In the example graph, the following values are displayed:
• Sensor
• Inverter 6
• Inverter 7
The gray areas along the course of the sensor line show the range of tolerance in which the plant should
operate.
In the graph legend (upper-right corner of the graph), all of the displayed values can be directly selected
and deselected at any time by clicking in the graph key (upper-right corner of the graph).

30
Operating via a web browser within your own network
2�11�2 Accessing Event logs
To access the Event logs menu, go to Diagnostic | Event logs.
By accessing the event logs, this loaded in the following mode. ***
Fig.: The event log is being loaded.
After the event log has been loaded, the window switches back to the normal view.
Fig.: Event log
The following settings are available from the four drop-down menus in this view:
• Devices:
Under devices, you can select individual devices or leave the default selection as is. (default “All devices”).
• Days:
Under days, you can select individual days or leave the default selection as is (default “All days”).
• Status codes:
Under status codes, you can select individual status codes or leave the default selection as is (default “All
status codes”).

31
Operating via a web browser within your own network
• Fault codes:
Under fault codes, you can select individual fault codes or leave the default selection as is (default “All
fault codes”).
By default, the current day is displayed in the table with all devices, fault codes and status codes.
2�11�3 Accessing Notifications
To access the Notifications menu, go to Diagnostic | Notifications.
Fig.: Notification overview
The notification overview is displayed as a table.
A maximum of 50 messages are displayed in this table. The following columns are displayed:
• Message date:

32
Operating via a web browser within your own network
This column is when a fault was detected and reported.
• Send date:
This column displays the date when the message has been successfully sent. Pending is displayed in this
column if there are more send attempts remaining, or aborted after 5 unsuccessful attempts to send the
message.
• Send Tries:
This column displays the number of attempts needed to successfully send the message; if still “pending,”
the current number of unsuccessful attempts is displayed in this column. It is reported as “aborted” after 5
unsuccessful attempts to sent the message. The number 1 to 5 can be displayed in this column if there are
still more send tries remaining (“pending”).
• Message type:
This column displays the message type. (for example: Offline. If an inverter is offline)
• Recipient;
The method in which the message is sent is displayed under Recipient.
• Text:
There is the option to display the messages sent by the Solar-Log™ under Text.
Note!For sending notifications, see the chapter "Configuring Notifications" in the Instal-
lation Manual.
Fig.: Message with text field

33
Operating via a web browser within your own network
2�11�4 Accessing Feed-In Management
To access the Feed-In Management menu, go to Diagnostic | Feed-In Management.
Note!The menu Feed-In Management under Diagnostic | Feed-In Management only
appears if active power has been configured in the Configuration | Special Func-
tions | Feed-In Management section.
Fig.: Feed-In Management - Control State
The inverter control can analyzed and adjusted in the Diagnostic | Feed-In Management section.

34
Operating via a web browser within your own network
Explanation of the Symbols and Values in the Power Reduction Section
The following values are displayed in the Power Reduction section:
Type of Reduction:
The type of reduction configured in Configuration | Special Functions | Feed-In Management is displayed
here.
Target power output %:
The current reduction level is displayed here as a percentage of the power output.
The detailed values for the individual bus connections and for the total plant are displayed in the following
table. The individual buses (RS485 a-c) are displayed depending on which bus is assigned to control the
inverters.
The column Total always corresponds to the plant total and reflects the value from the the grid connec-
tion point. The consumption values are displayed in all of the columns, but only the plant total is taken into
account.
Note!The values from the individual inverters are calculated per bus and for the entire
plant.
Generator power (kW):
The generator power corresponds to the module output of the inverter that is connected to this data bus.
This value results from the total of the partial outputs entered in the field generator power under configu-
ration | Devices | Configuration. This kW values is used when calculating the output reduction (e.g.: the
70% reduction).
Maximum AC power (kW):
The maximum AC power of the inverter(s) depends on the device. Refer to the inverter specifications for
this value and configure it in the field Maximum AC power under configuration | Devices | Configuration.
Allowed power (kW):
This kW value is the maximum amount of power that is allowed at the grid connection point. The value is
calculated based on the generator output and the current power output.
Consumption (kW):
This value is calculated from the consumption meters and refers to the entire plant. The values displayed
in the respective bus column only refer to the plant total and are not taken into account in the correspond-
ing columns. The consumption values is normally subtracted from the allowed power from the entire plant.
Control value power (kW):
This value is calculated by this Solar-Log™ and is the maximum current power output from the inverters. It
is used for the current target power output.
Note:
The values recorded may differ due to rounding in the calculations by the Solar-Log™ (technical reasons).

35
Operating via a web browser within your own network
Current power output (kW):
The value refer to the current output generated by the inverter per interface (column) and for the entire
plant.
Control value power (% AC):
The Solar-Log™ calculates the control value power (kW) as a percentage of the maximum AC power and
relays this to the inverters.
Current power output (AC%):
The value indicates the total output generated as a percentage of the maximum AC power for the inverter
or all of the inverters on a bus.
Feed-in power (% DC):
This value is the current amount of feed-in power as a percentages of the generated output.
Explanation of the Symbols in the Feed-in power (% DC) column:
The feed-in power value is in the target power range with a tolerance of -2% to +1%.
The feed-in power value is below target value allowed. Generally, this means that the output
allowed at the grid connection point is not being achieved due to low irradiation or high self-
consumption.
This means that the value is above the target value allowed.
If the red triangle is only displayed at a bush and entire plant has a green symbol, this means
that only this bus is over the target value allowed. However, the plant totals do not go over the
target value because of self-consumption.
36
Operating via a web browser within your own network
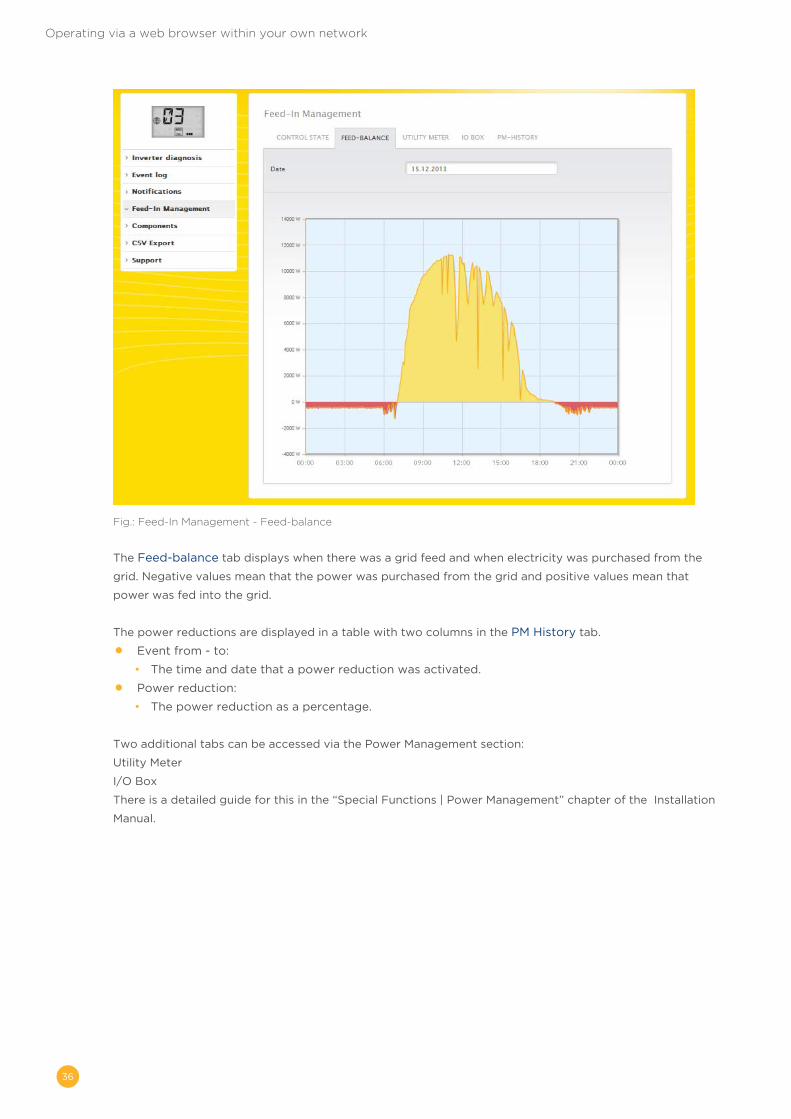
Fig.: Feed-In Management - Feed-balance
The Feed-balance tab displays when there was a grid feed and when electricity was purchased from the
grid. Negative values mean that the power was purchased from the grid and positive values mean that
power was fed into the grid.
The power reductions are displayed in a table with two columns in the PM History tab.
• Event from - to:
• The time and date that a power reduction was activated.
• Power reduction:
• The power reduction as a percentage.
Two additional tabs can be accessed via the Power Management section:
Utility Meter
I/O Box
There is a detailed guide for this in the “Special Functions | Power Management” chapter of the Installation
Manual.

37
Operating via a web browser within your own network
2�11�5 Accessing the SCB Monitor (only Solar-Log 2000)
To access the SCB Monitor menu, go to Diagnostic | SCB Monitor.
Fig.: SCB string overview
The SCB String Overview is displayed in a split-screen window. The connected devices (SCBs) can be
individually accessed in the top screen via the pull-down menu.
The bottom screen displays the current measurements from the individual strings based on the analog and
digital number.
Note!The SCB Monitor menu only appears when an SCB is connected and it is also only
available with the Solar-Log 2000.
38
Operating via a web browser within your own network
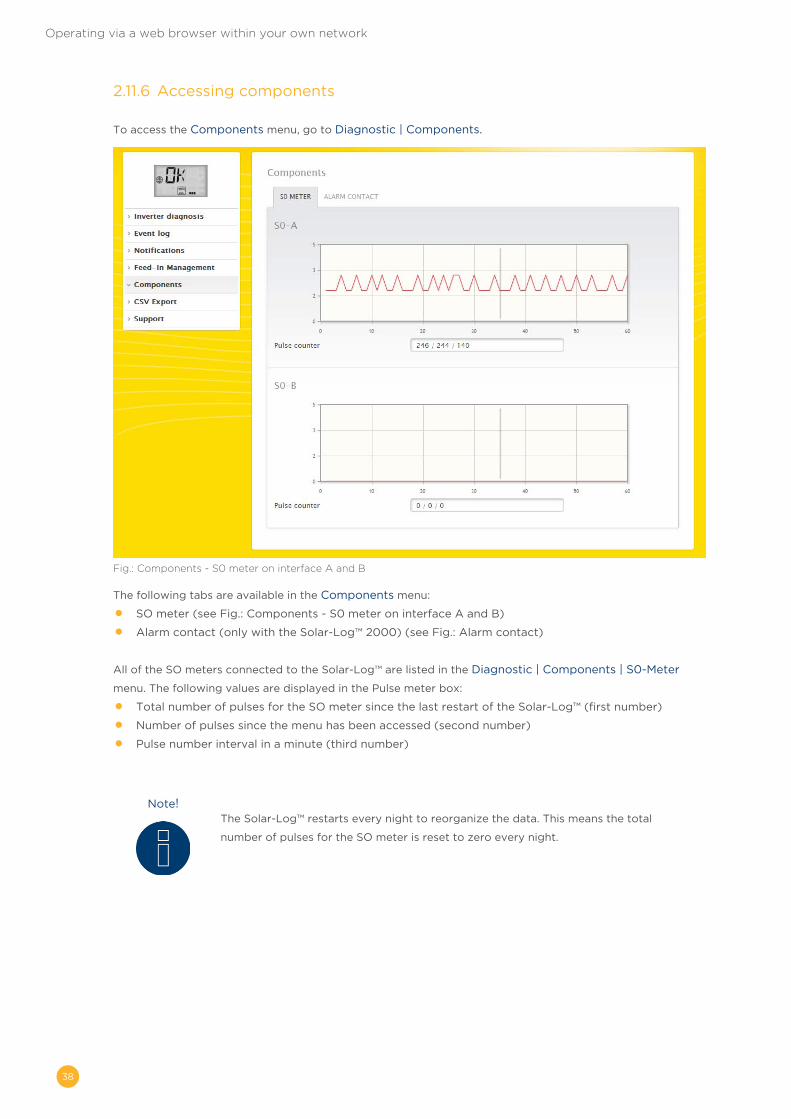
2�11�6 Accessing components
To access the Components menu, go to Diagnostic | Components.
Fig.: Components - S0 meter on interface A and B
The following tabs are available in the Components menu:
• SO meter (see Fig.: Components - S0 meter on interface A and B)
• Alarm contact (only with the Solar-Log™ 2000) (see Fig.: Alarm contact)
All of the SO meters connected to the Solar-Log™ are listed in the Diagnostic | Components | S0-Meter
menu. The following values are displayed in the Pulse meter box:
• Total number of pulses for the SO meter since the last restart of the Solar-Log™ (first number)
• Number of pulses since the menu has been accessed (second number)
• Pulse number interval in a minute (third number)
Note!The Solar-Log™ restarts every night to reorganize the data. This means the total
number of pulses for the SO meter is reset to zero every night.

39
Operating via a web browser within your own network
The Diagnostic | Components | Alarm contact menu. menu is displayed in a split-screen window.
Fig.: Alarm contact
In the Alarm contact part at the top, you have the option to manually acknowledge the alarm or to reset
it.
In the Current Status part at the bottom, you see the information in regard to the input of the notification
(e.g. alarm), the internet status (e.g. OK) and if the notification has been manually or automatically ac-
knowledged.
Note!The alarm contact is only available with the Solar-Log 2000.
2�11�7 Accessing CSV Export
To access the CSV Export menu, go to Diagnostic | CSV Export.
Fig.: CSV Export
You can download a CSV file form your plant from the CSV Export menu. You can select between minute
values or daily values for the CSV file.

40
Operating via a web browser within your own network
When Minute Values are selected, the file contains only a maximum of 30 days worth of values. When
selecting Daily Values, all of the inverters are individually listed, but only the end of the day value is docu-
mented.
The CSV file with minute values is a in a table format and contains the 5-minute values from the last 30
days and the Pac and DC values from the individual inverters and also from every MPP tracker.
The CSV file with day values is a in a table format and contains the day values from every individual in-
verter since the start of the plant's operation (since plant monitoring with the Solar-Log™ started).
Note!Files in the CSV format can be created with simple text editors or spreadsheet
programs like MS Excel or Open Office Calc.
Important:Only a CSV file with day values can be imported and not a CSV file with minute
values.
Important! When importing CSV data, all of the data on the device is deleted and replaced.

41
Operating via a web browser within your own network
2�11�8 Accessing Support
To access the Support menu, go to Diagnostic | Support.
Fig.: Support - General
There are three sections under the Support | General menu:
• System Information:
The following information is available in this tab:
• Model (type of Solar-Log™).
• Hardware (hardware components available for the device).
• Solar-Log™ serial number.
• Firmware Version and date.
• Revision number.
• RTOS (Solar-Log™ operating system).
• CLIB (Version number of the Solar-Log™ library used).
• Creating diagnostic report:
You have the option to create and download a diagnostic report. This can be sent to the Solar-Log™ sup-
port for analysis. (See Fig.: Support - General.)
• Creating screenshots:
You have the option to create and download screenshots of the display in this section. This can be used to
document errors on the Solar-Log's internal display. (See Fig.: Support - General.)

42
Notifications
3 Notifications
3�1 Yield E-mail
The Solar-Log300, 1200, 2000 comes with an e-mail program that can send a daily overview of the day's
performance to two different e-mail addresses (maximum of 57 characters, separated with a semicolon).
The settings are configured under the Configuration | Notifications menu.
Click on the Recipient tab to be able to enter the recipient's e-mail address.
Fig.: Entering the recipient's e-mail address.

43
Notifications
In the Yield tab, you can defined yield notifications per e-mail or text message (SMS).
Fig.: Defining time frame and modes.
The time frame and modes for notifications can be defined here.
There are four modes:
• Deactivated
• Yield overview short
• Yield overview (All INV)
• Yield overview (All INV & groups)
Note!See the chapter “Notification Settings” in the Installation Manual for additional
information on the notification function.
44
Notifications
3�1�1 Details of the individual E-Mail functions
Deactivated
• If no e-mail notifications are required.
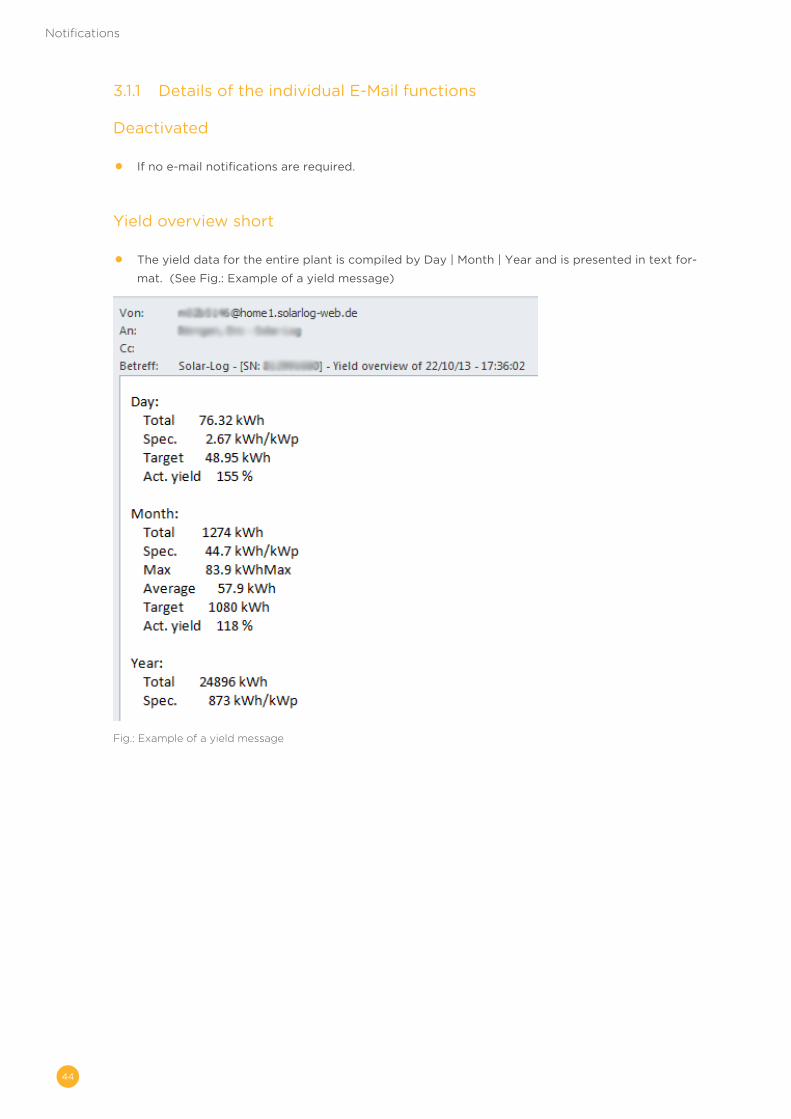
Yield overview short
• The yield data for the entire plant is compiled by Day | Month | Year and is presented in text for-
mat. (See Fig.: Example of a yield message)
Fig.: Example of a yield message
45
Notifications
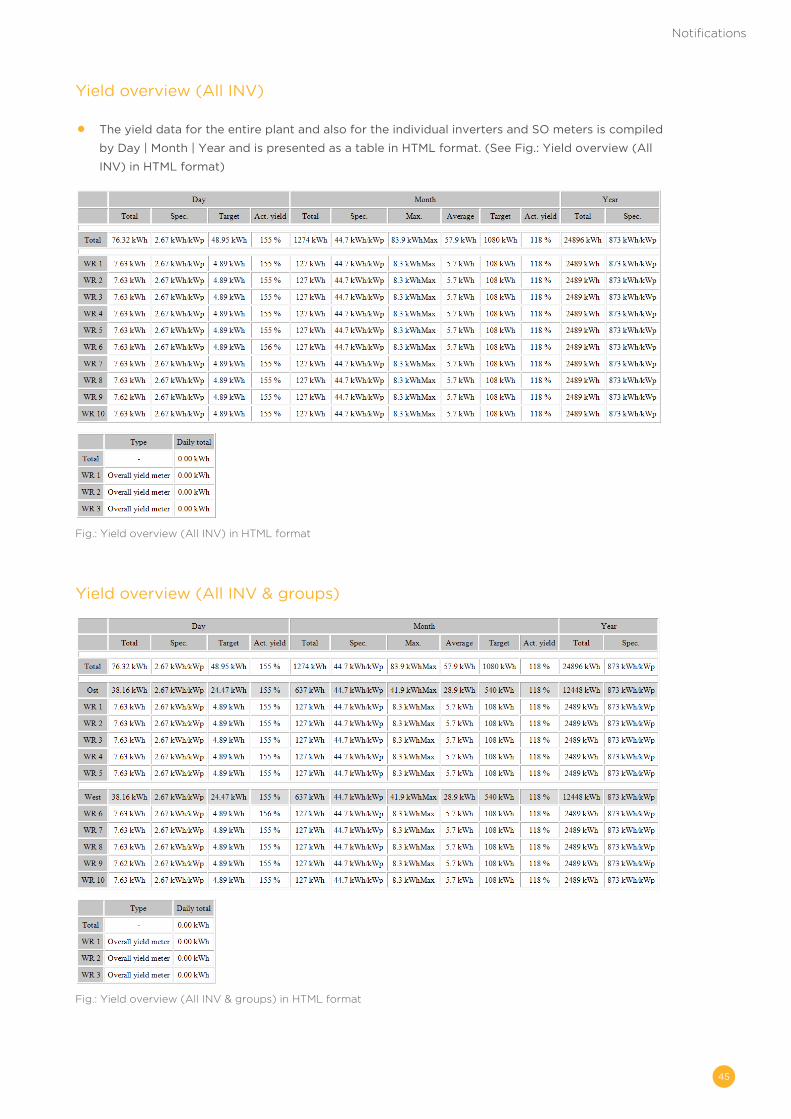
Yield overview (All INV)
• The yield data for the entire plant and also for the individual inverters and SO meters is compiled
by Day | Month | Year and is presented as a table in HTML format. (See Fig.: Yield overview (All
INV) in HTML format)
Fig.: Yield overview (All INV) in HTML format
Yield overview (All INV & groups)
Fig.: Yield overview (All INV & groups) in HTML format

46
Notifications
Details of the individual yield overviews
Subject: The Solar-Log serial number and time and date
Day:
Field Explanation Text
Total The actual amount of grid feed for the day in kWh.
Specific Yieldspecific,theenergyyielddividedbytheamountof generator power installed.(Values are normalized to 1 kWp)
Max The maximum power in Kw
Target The yield in kWh which can be achieved according to the forecast.
Actual Yield The percentage of days on which the target was achieved.The daily yield achieved as percentage, and the totalto target ratio.
Month:
Field Explanation Text
Total The actual amount grid feed for the day in kWh.
Specific Yieldspecific.Theenergyyielddividedbytheamountof generator power installed.(Values are normalized to 1 kWp)
Max Displays the maximum daily production for this month in kWh.
Medium The average daily production which was achieved for this month.
Target The yield in kWh which had been achieved up to the current day according to the forecast.
Actual Yield Percentage of the monthly target that has already been achieved up to the current day.The month target already achieved as a percentage. At the total to target ratio.
Year:
Field Explanation Text
Total The actual amount grid feed for the day in kWh.
Specific Yieldspecific.Theenergyyielddividedbytheamountof generator power installed.(Values are normalized to 1 kWp)

47
Notifications
3�2 Performance Monitoring
To monitor different sized inverters, the Solar-Log™ normalized to the value from every inverter to 1 kWp.
This is based on the amount of generator power set in Configuration | Devices | Configuration.
The generator power is equivalent to 100% and the value here is normalized to 1 kWp)
Example plant:
Fig.: Performance Monitoring: Example pant with two inverters
Inverter 1, Inverter 1 house Inverter 2, Inverter 2 house
Generator Power:25* 220W (modules) = 5500 Wp
Generator Power:15* 220W (modules) = 3300 Wp
Module Field 1 Module Field 1
48
Notifications
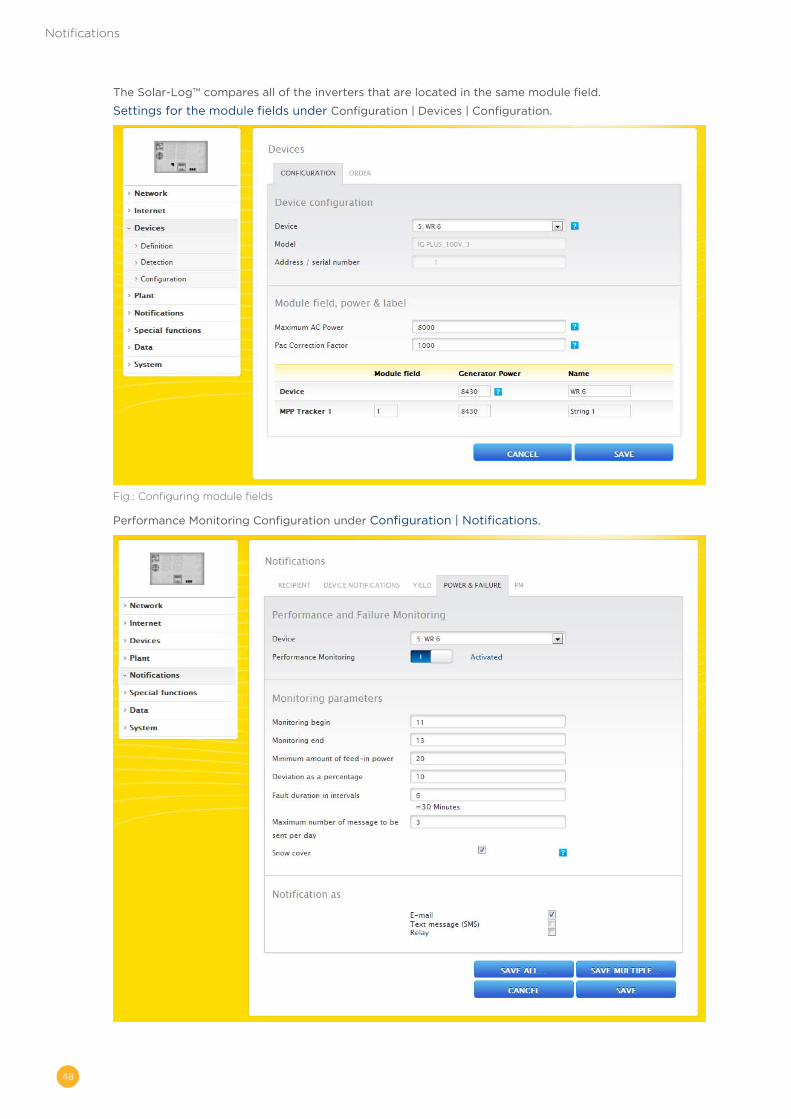
The Solar-Log™ compares all of the inverters that are located in the same module field.
Settings for the module fields under Configuration | Devices | Configuration.
Fig.: Configuring module fields
Performance Monitoring Configuration under Configuration | Notifications.

49
Notifications
Fig.: Configuring performance monitoring
The output measured from the inverters is compared to the generator capacity that is listed in the system.
A notification is sent (by email) when the deviation exceeds the amount configured (for example 10%) over
a set time period (for example 30 minutes).
Note!For performance monitoring configurations, see the chapter "Configuring Notifi-
cation " in the Installation Manual.
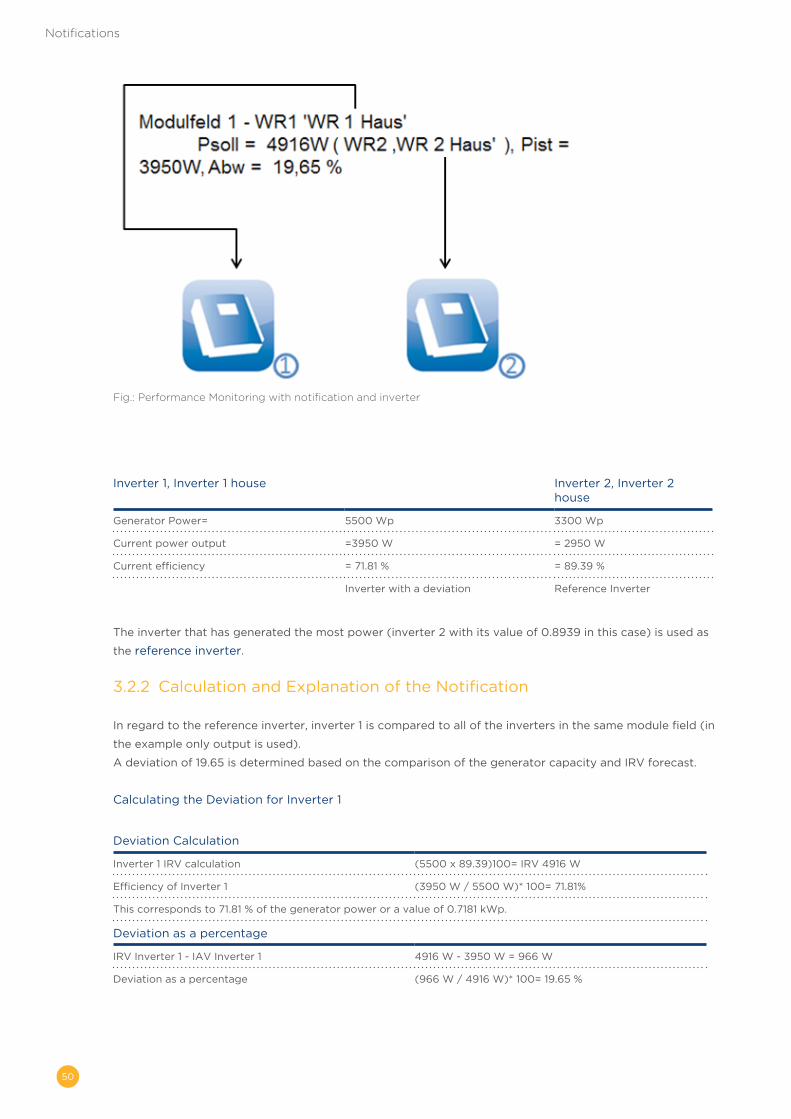
3�2�1 Performance Monitoring Notification
Example Notification:
Module Field 1 - Inverter 1 'Inverter 1 House'
IRV = 4916W ( Inverter 2, Inverter 2 House' ), IAV = 3950W, deviation = 19.65 %
The notification contains the following information:
Module field:
The module field which was affected or at least the module field in which a deviation was detected.
Deviating inverter:
Inverter 1
IRV:
The reference value that is used to contrast inverters. It comes from the most effective operating inverter,
the value is in W.
IAV:
The amount of output from inverter with a deviation.
Dev:
The amount of deviation as a percentage of the reference value.
50
Notifications
Fig.: Performance Monitoring with notification and inverter
Inverter 1, Inverter 1 house Inverter 2, Inverter 2 house
Generator Power= 5500 Wp 3300 Wp
Current power output =3950 W = 2950 W
Currentefficiency = 71.81 % = 89.39 %
Inverter with a deviation Reference Inverter
The inverter that has generated the most power (inverter 2 with its value of 0.8939 in this case) is used as
the reference inverter.
3�2�2 Calculation and Explanation of the Notification
In regard to the reference inverter, inverter 1 is compared to all of the inverters in the same module field (in
the example only output is used).
A deviation of 19.65 is determined based on the comparison of the generator capacity and IRV forecast.
Calculating the Deviation for Inverter 1
Deviation Calculation
Inverter 1 IRV calculation (5500 x 89.39)100= IRV 4916 W
EfficiencyofInverter1 (3950 W / 5500 W)* 100= 71.81%
This corresponds to 71.81 % of the generator power or a value of 0.7181 kWp.
Deviation as a percentage
IRV Inverter 1 - IAV Inverter 1 4916 W - 3950 W = 966 W
Deviation as a percentage (966 W / 4916 W)* 100= 19.65 %

51
Notifications
Inverter 2 is used as the reference inverter since it was the most effective one at the time of the measure-
ment. Inverter 1 should have produced an output of 4916 W based on the measurement and the calcula-
tions comparing all of the inverters in the same module field. The actual output was 3950 W, a deviation of
19.65%. This caused a notification to be sent.

52
Operating the Solar-Log 1200 and 2000 via Touch Display
4 Operating the Solar-Log 1200 and 2000 via Touch Display
The Solar-Log 1200 and 2000 are equipped with a touch screen that allows power output, yield history
and environmental performance to be quickly displayed. Data can also be imported from and copied to
USB sticks via the display.
Note!Never use sharp, pointed objects on the touch screen!
This will damage the screen's delicate surface.
4�1 Navigating from the touch screen
After the Solar-Log 1200, 2000 has started, the overview view is displayed.
Fig.: Start page of the display
The following is displayed in this view:
The header bar with
• the Solar-Log™ module
• navigation heading
• date
• time

53
Operating the Solar-Log 1200 and 2000 via Touch Display
The following symbols are displayed in the left-side navigation menu and can be selected for additional
options:
Power
Yield History
Environmental per-
formance
Settings
The display window with:
• Solar-Log™ type
• the connected devices (inverter, power meter etc.)
• a table with the following values: earnings from PV, purchased power (only with connected meters)
and the total for the day and overall.
Swipe your fingers on the display, either from right to left or left to right, to switch to the next view.
There is a split-screen window for the energy balance, environmental performance and yield history menus.
The dots at the bottom of the screen( ) indicate the current page of the menu.
You can always view the power output for the current day by tapping on the top header with the time and
date. The current Dashboard is displayed by tapping on it twice.

54
Operating the Solar-Log 1200 and 2000 via Touch Display
4�2 Accessing the Dashboard
You can swipe to go from the start page to the Dashboard. From the Power menue.
Fig.: Dashboard view
In the view from left-to-right:
Current consumption and today's consumption high (only with connected meters)
Current production and today's production high
Current grid feed and today's grid feed high for power fed into the grid (only with connected meters)
4�3 Accessing the Energy Balance
You can swipe from the start page to go to the Energy Balance from the Power menu.
Fig.: Energy Balance view
The energy balance is a split-screen window. The top part of the window displays the following values:
Production:
• Current plant production.

55
Operating the Solar-Log 1200 and 2000 via Touch Display
Consumption:
• Current power consumption (only with connected meters)
Surplus:
• Current grid feed (only with connected meters)
The bottom part of the window displays the connected appliances with their current consumption values.
Use the arrows to display additional appliances.
Note!Values are only visible if appliances are connected via networked "smart plugs",
relays or the Solar-Log™ Meter.
Note!Up to 10 appliances can be connected and configured.
56
Operating the Solar-Log 1200 and 2000 via Touch Display
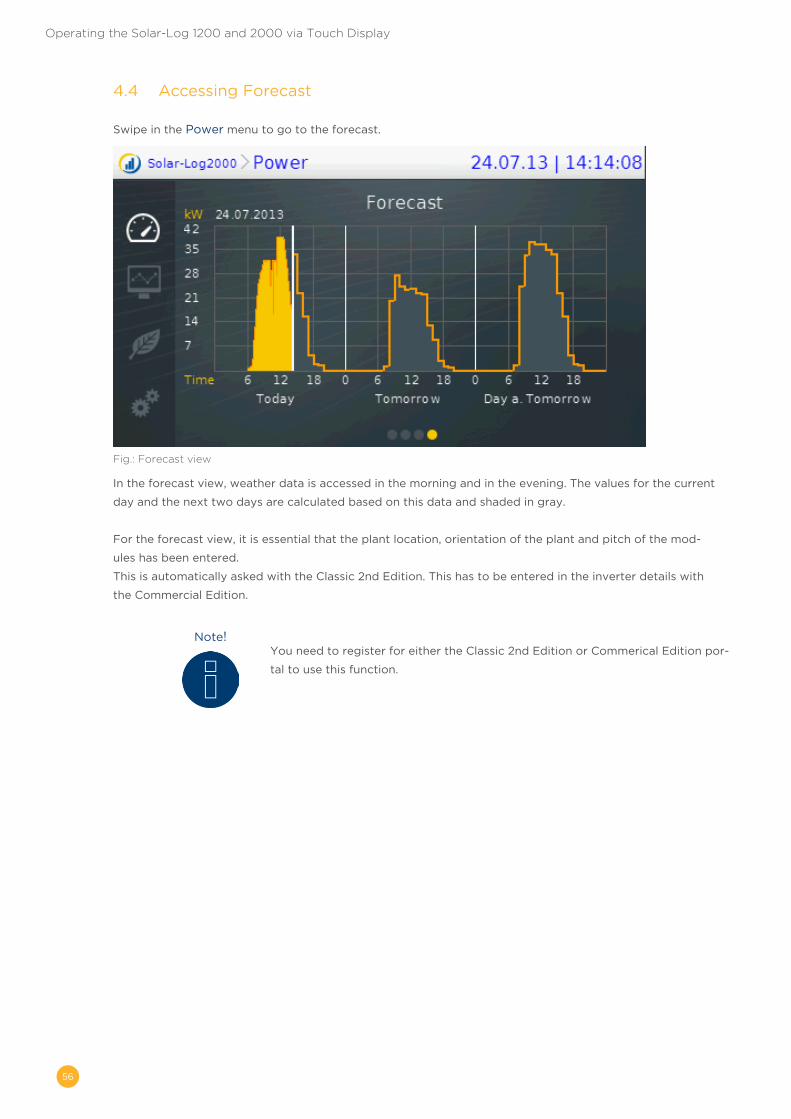
4�4 Accessing Forecast
Swipe in the Power menu to go to the forecast.
Fig.: Forecast view
In the forecast view, weather data is accessed in the morning and in the evening. The values for the current
day and the next two days are calculated based on this data and shaded in gray.
For the forecast view, it is essential that the plant location, orientation of the plant and pitch of the mod-
ules has been entered.
This is automatically asked with the Classic 2nd Edition. This has to be entered in the inverter details with
the Commercial Edition.
Note!You need to register for either the Classic 2nd Edition or Commerical Edition por-
tal to use this function.

57
Operating the Solar-Log 1200 and 2000 via Touch Display
4�5 Accessing Yield history
Access the Yield History from the navigation menu on the left by tapping on the symbol.
Fig.: Yield history - Day
The Yield history view is displayed in two sections.
In the top part, you have the option, depending on the display mode (year, month, year), to swipe on the
display to go to the exact date.
In the bottom part, you can swipe to the next display mode: day, month, year or total.
4�6 Accessing Environmental performance
Access the Environmental Performance from the navigation menu on the left by tapping on the Environ-
mental performance symbol.
Fig.: Environmental performance - Day view
The Environmental performance view is displayed in two sections.

58
Operating the Solar-Log 1200 and 2000 via Touch Display
The top display contains:
• Day
• Month
• Year
• Total
The bottom display contains the values for your plant's environmental contributions:
• Avoided CO2 emissions
• Oil saved
• Reduced nuclear waste
• Trip with an electric car (in kilometers)
• Trees saved
• Households (energy needs for a family of four)

59
Operating the Solar-Log 1200 and 2000 via Touch Display
Accessing the USB menu
Access the USB menu from the navigation menu on the left by tapping on the Settings symbol.
Fig.: Menu Settings
This brings you to the main Settings menu. Tap on USB.
The sections:
• Start
• Basic settings
• Advanced settings
are described in detail in the chapter "Direct Device Configurations" in the Installation Manual.
Fig.: USB menu
You have the following options from the USB menu:
Save all data:
• The Solar-Log™ creates the folder "backup" on the stick and saves the solarlog_backup.dat and
solarlog_config.dat files there.
Import yield data:
• The Solar-Log™ searches for a valid solarlog_backup.dat file on the USB stick and imports it.

60
Operating the Solar-Log 1200 and 2000 via Touch Display
Import configuration:
• The Solar-Log™ searches for a valid solarlog_konfig.dat file on the USB stick and imports it.
Firmware update:
• The Solar-Log™ searches for a firmware update to import and then starts the update.
Note!As soon as a USB stick has been plugged in, the folder named "Backup" is auto-
matically created on the USB stick. At the end of the day, the Solar-Log™ saves a
daily backup with the date in this folder.
Important!
The Solar-Log™ does not overwrite the daily backup files. Thus it is important to
regularly backup or exchange the USB stick before it runs out of space.
Important:When importing data from the USB stick, all of the data on the device is deleted
and replaced.
Note!Import the current configuration before importing saved yield data.
4�6�1 Pac Correction Factor
At photovoltaic plants, several measuring points and power generators (inverters) are combined with one
another. The Solar-Log™ evaluates this data and partially looks for any correlations.
Since some of the components are not calibrated, deviations in the values measured can easily arise.
For example, if the total amount of energy produced based on what the inverters display is compared with
the values from calibrated power meters, deviations of up to 8% can arise.
In practice, meters and inverters both can display too much or too little kWh.
To correct these inaccuracies in the medium term, the Solar-Log™ firmware uses a PAC correction factor.
The PAC correction factor is located in the Configuration | Devices | Configuration menu.

61
Operating the Solar-Log 1200 and 2000 via Touch Display
4�6�2 Calculating the PAC correction factor
All of the yield data is saved internally without the correction factor. The correction factor is only applied
to the data output. The factor can therefore be adjusted at any time.
The formula for calculating the correction factor is as follows:
(Yield power meter / yield inverter) * 1000
If the inverter does not have a display, it is advisable to use the values which are recorded by the Solar-
Log™ from a period over a week.
That is why it is recommended to leave the default PAC correction factor at 1000 initially.
The correction factor can be adjusted yearly after receiving the statement from the utility company.
Example calculation:
Inverter 1 Inverter 2 Calibrated power meter
Total energy Total energy Total energy
259.12 kWh 305.22 kWh 550.55 kWh
Total = 564.34 kWh Deviation= 13.79 kWh
By comparing the values, you see that the inverters are more likely to display too much output.
Pac Correction Factor
Calibrated power meter total energy Inverter total energy
550.5 kWh 564.34 kWh
Calculated PAC correction factor in the example:
(550.55 kWh/564.34 kWh)* 1000= 975.66
Rounded PAC correction factor = 976
62
Using the Solar-Log WEB
5 Using the Solar-Log WEB
With the Solar-LogTM WEB, you can access your plant's yield data and event log via the Internet
and set yield and fault notifications to be sent to an e-mail address daily. A Solar-LogTM WEB account is
required.
The portal offers additional functions which can be tailored to your needs. Please contact your installer for
more information or check out our website:
http://www.solar-log.com/en/products-solutions/solar-log-web.html.
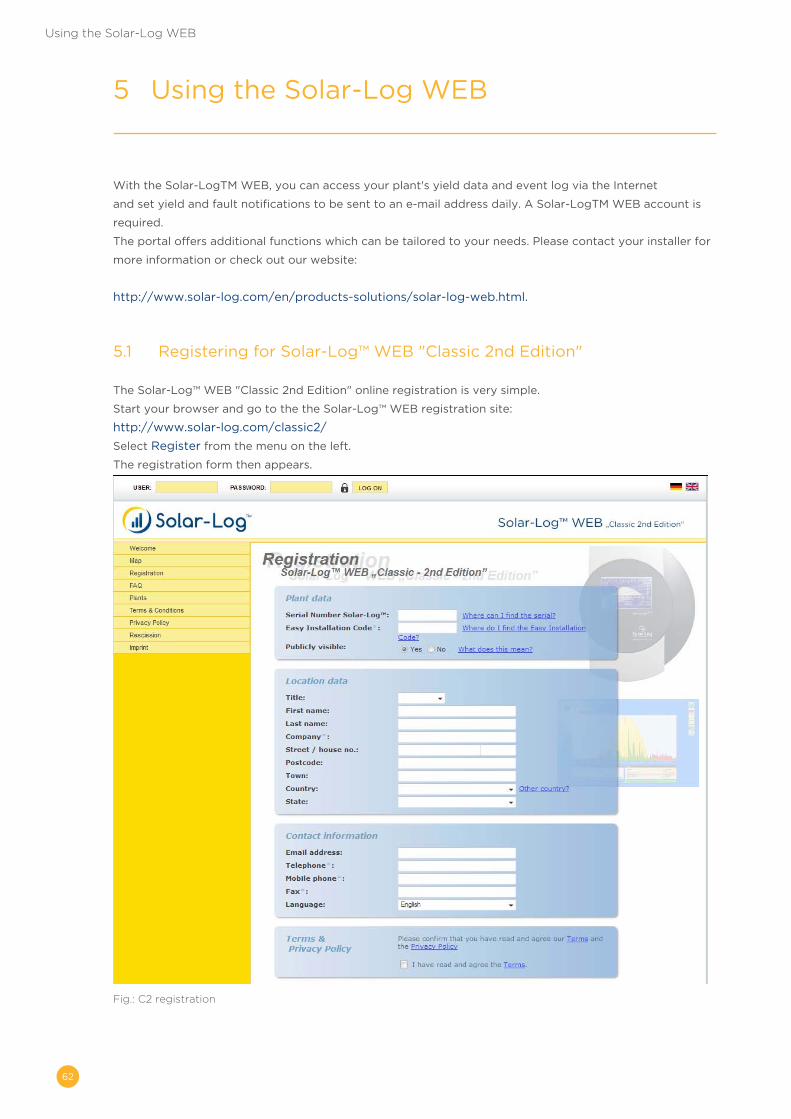
5�1 Registering for Solar-Log™ WEB "Classic 2nd Edition"
The Solar-Log™ WEB "Classic 2nd Edition" online registration is very simple.
Start your browser and go to the the Solar-Log™ WEB registration site:
http://www.solar-log.com/classic2/
Select Register from the menu on the left.
The registration form then appears.
Fig.: C2 registration

63
Using the Solar-Log WEB
Enter your device's Serial Number.
The serial number (SN) is located under the top cover.
Select whether the date should be public visibility in the Internet or not.
Your plant information can then be viewed by other portal users. When you select "No", then you have to
log on to the site with your user data that you will receive from Solare Datensysteme GmbH once the reg-
istration process has been completed.
The “Public Visibility” setting can be changed later at any time from your site's configuration menu.
Enter your location and contact information .
Confirm that you have read our General Terms & Conditions (GTC) and Privacy Policy.
Enter the password from the image. This system is used to prevent bots from trying to access our server.
Confirm the information entered by clicking on Register Now.
If you forgot to enter a password or entered the wrong one, a new password is automatically generated
again without having to reenter all of the information.
After the registration has been successfully completed, you will receive a confirmation e-mail. After you
have confirmed the registration, we will check your data and activate your account.
Note!Accounts are only activated during the week. This can take up to 24 hours.
64
Using the Solar-Log WEB
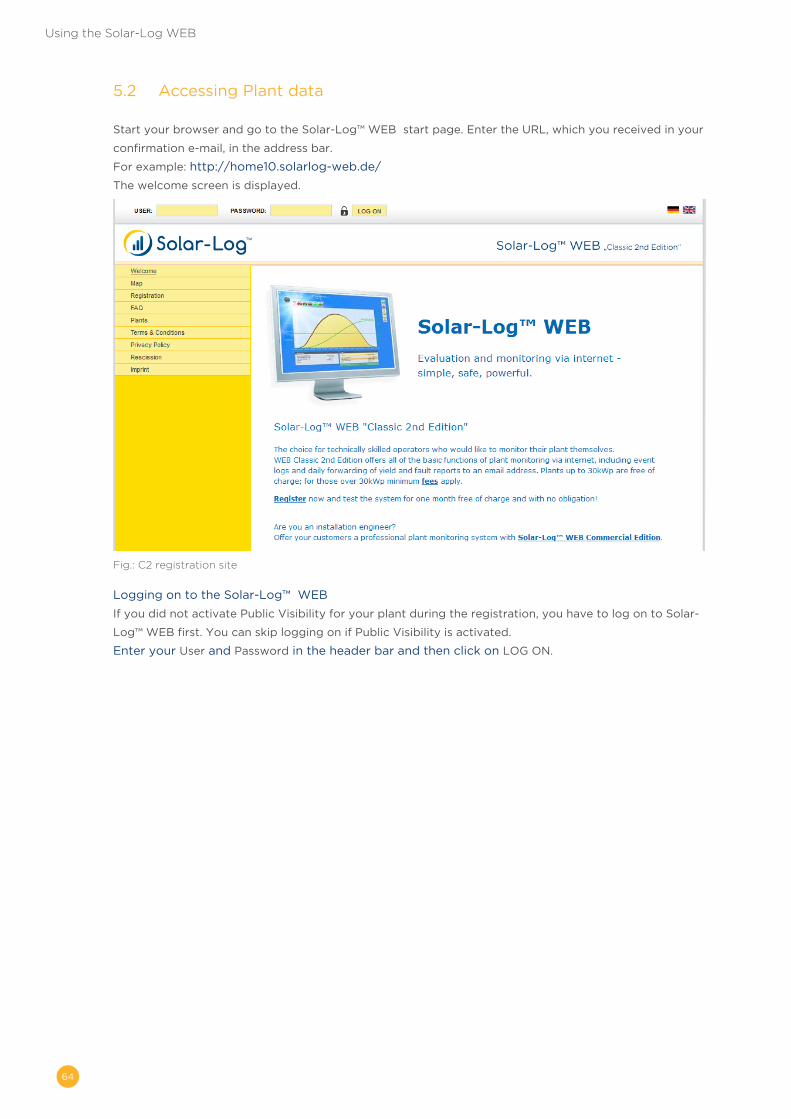
5�2 Accessing Plant data
Start your browser and go to the Solar-Log™ WEB start page. Enter the URL, which you received in your
confirmation e-mail, in the address bar.
For example: http://home10.solarlog-web.de/
The welcome screen is displayed.
Fig.: C2 registration site
Logging on to the Solar-Log™ WEB
If you did not activate Public Visibility for your plant during the registration, you have to log on to Solar-
Log™ WEB first. You can skip logging on if Public Visibility is activated.
Enter your User and Password in the header bar and then click on LOG ON.

65
Using the Solar-Log WEB
Accessing the Plant overview
To display plants click on Plants from the menu on the left. In the window that appears, you can enter
search criteria.
Fig.: C2 Plant search screen
Here you have the following search options:
• Zip code
• Plant size from - to
• Production year
• Module type
• Orientation from - to
• Roof pitch from - to
The results can also be filtered with the following criteria by using the Only results research option.
• with image
• with current data
• with irradiation sensor
The number of plants matching the search criteria is displayed in Results.
Fig.: C2 Plant search with a filter
66
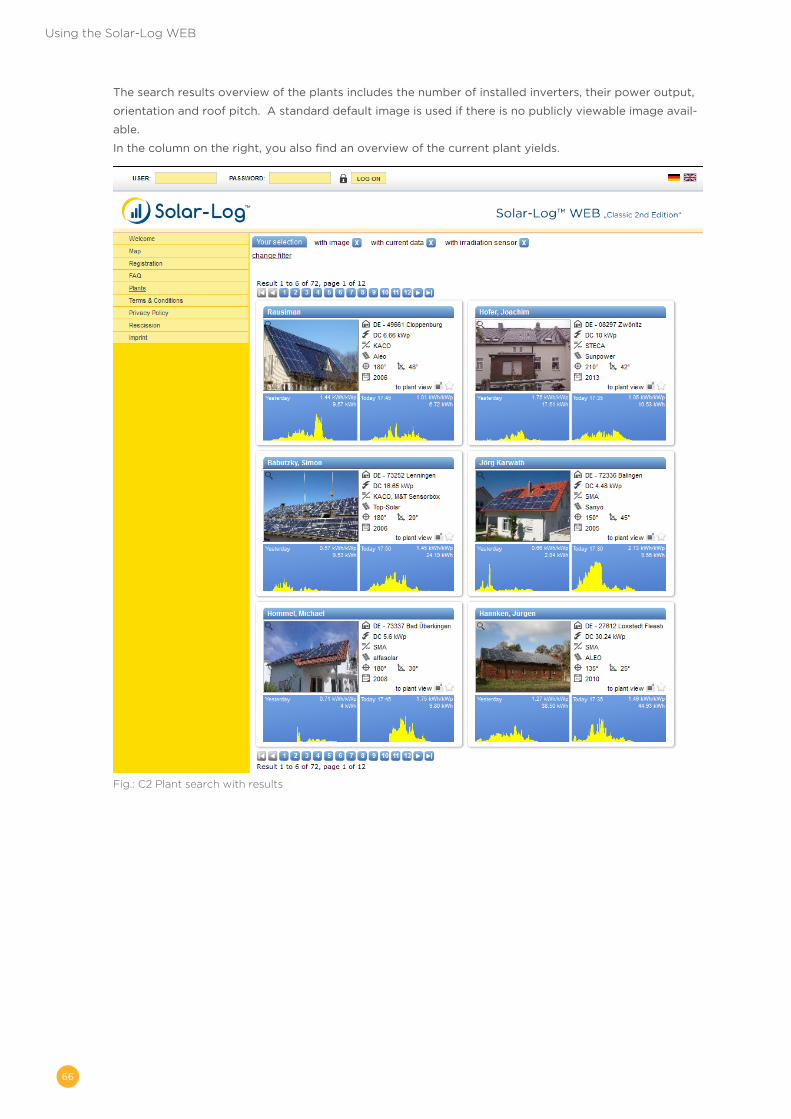
Using the Solar-Log WEB
The search results overview of the plants includes the number of installed inverters, their power output,
orientation and roof pitch. A standard default image is used if there is no publicly viewable image avail-
able.
In the column on the right, you also find an overview of the current plant yields.
Fig.: C2 Plant search with results

67
Using the Solar-Log WEB
Clink on the Plant link above the day graph from today.
The graphic overview of the plant is displayed.
Fig.: C2 plant with a day curve
The graphic overview displays additional options that can be selected for your plant, such as current value,
day yield and any fault notifications if present.
Create a bookmark in your browser for faster access to the plant details.
5�3 Accessing Yield data
5�3�1 How to navigate between different overviews
How you navigating the website overviews, corresponds to navigating the overview page from your local
network.
Switching between overviews
Move your mouse to the inverted triangle on the left next to the displayed period.
An overview of the periods is displayed.
Fig.: C2 Navigating in the view
Click on the desired period.
The period overview is then displayed.

68
Using the Solar-Log WEB
5�3�2 The meaning of the values in the overviews
The values displayed below the graph correspond to the values from the overview page from your local
network.
Due to privacy concerns, the plant revenues are not displayed on the internet site.
5�3�3 Daily Overview
Start your browser and click on the bookmark for your plant.
• You might have to log on.
• The plant details overview is then displayed.
Select Graphic from the menu on the left.
• The plant's daily overview is displayed.
Fig.: Day curve with additional values
The daily yields are displayed as a curve graph. The dark green line indicates the daily target yield.
The different values throughout the day can be displayed by moving the mouse along the curve.
Daily Overview selection buttons
• Yield: Yield curve from which the yield performance can be observed. Additionally, the dark green
line indicates the daily target yield total.
• DC voltage: Generator voltage To view the voltage of individual strings, only one inverter can be
selected.
• kWp: Switches the scale from "Output in watt" to "Output in kW/kWp." After that, only of the
curves will be comparable in regard to their specific output. Diminishing module performance can
also be recognized.
• 24h: Displays the output for every hour of the day in comparison to the consumption for the entire
day.

69
Using the Solar-Log WEB
Additional functions with S0 power meters
The following displays are additionally available when a S0 power meter is connected to the Solar-Log™.
• CM: This displays the power consumption of your building as a graphic in watts.
• Cons.: This displays the power consumption of your building as a curve in kWh.
• Values: This displays various values for your inverter as text.
• Balances: This displays the relation between your power consumption and yield In the box at bot-
tom on the left, the ration is also displayed as a percentage.
Additional functions with the Sensor Box
Solar: Displays the reference value from a Irradiation sensor. The plant's daily output has to lay within the
range measured by the sensor.
• M °C: This displays the module temperature that is measured by the Sensor Box.
• A °C: This displays the ambient temperature that is measured by the ambient temperature sensor.
• Wind: This displays the wind speed and strength. These values are measured by the wind sensor.
Click on the selection button and then on the magnifying glass icon.
• The selected curve is displayed.
5�3�4 Monthly Overview
Select Monthly Overview from the navigation menu.
Fig.: Plant C2 - Monthly Overview
The daily yields from a month are displayed as a total in a bar graph. The dark green line indicates the
month's target yield.
Move the mouse above one of the day bars.
• The yield from the selected day is displayed.
By clicking on a bar,
• the corresponding curve is displayed.
70
Using the Solar-Log WEB
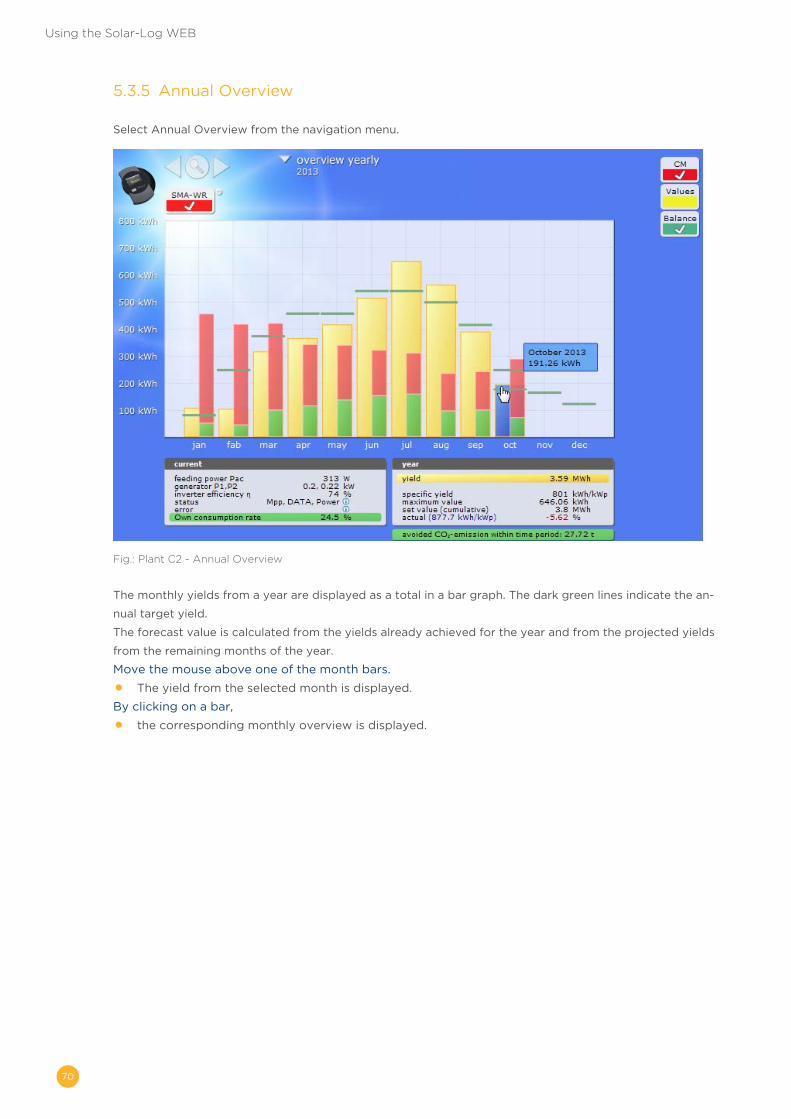
5�3�5 Annual Overview
Select Annual Overview from the navigation menu.
Fig.: Plant C2 - Annual Overview
The monthly yields from a year are displayed as a total in a bar graph. The dark green lines indicate the an-
nual target yield.
The forecast value is calculated from the yields already achieved for the year and from the projected yields
from the remaining months of the year.
Move the mouse above one of the month bars.
• The yield from the selected month is displayed.
By clicking on a bar,
• the corresponding monthly overview is displayed.

71
Using the Solar-Log WEB
5�3�6 Total Overview
Select Overview of all Years from the navigation menu.
Fig.: Plant C2 - Total Overview
The individual annual yields are displayed as a total in a bar graph. The dark green line indicates the annual
target yield. Two green lines are then displayed for the current year:
• The top line indicates the annual target.
• The bottom line indicates the accumulated annual yield compared to annual target.
Move the mouse above one of the year bars.
• The yield from the selected year is displayed.
By clicking on a bar,
• The corresponding annual overview is displayed.
Click on Linear Overview Years:
• The total linear overview is then displayed.

72
Using the Solar-Log WEB
5�3�7 Accessing and filtering the Event log
Select Events from the menu on the left.
• The complete list of all of the system events is displayed.
Fig.: Plant C2 - Notifications
Use the filter function to view a particular event or events from a particular day within the last 10 days.

73
Using the Solar-Log WEB
Fig.: Plant C2 - Filtered notifications
1. Select the desired inverters from the All inverters drop-box.
• Only the events from the selected inverters are then displayed.
2. Limit your selection by selecting the desired day from the All Days drop-box.
• Only the events from the selected day are then displayed.
3. Limit your selection further by selecting the desired day from the All Days drop-box.
• The status selection options available are only those that occurred during the selected time
period.
4. Additionally, you can limit your selection further by selecting the type of fault from the All Faults
drop-box.
• The fault selection options available are only those that occurred during the selected time pe-
riod.
5. Click on Clear Selection to reset all of the filter settings.

74
Using the Solar-Log™ Android App
6 Using the Solar-Log™ Android App
We offer a Solar-Log™ App for Android tablet PCs and smartphones to allow you to access your plant data
at any time and from any location. The App is available for free from the Google Play store.
The App displays current and past yield data in a graphical form.
Note!The manual and screen shots refer to the Android tablet PC. The operating instruc-
tions for smartphones may differ.
The differences are explained in detail in the chapter "Using the Android App with
a smartphone."
Requirements
Our Solar-Log™ App is compatible with every Android tablet PC and smartphone starting from OS version
2.3 Gingerbread (4.0 Ice Cream Sandwich is recommended).
The Solar-Log™ App only runs with the server solutions Solar-Log™ Web Classic 2 and the WEB Commer-
cial Edition from Solare Datensysteme GmbH.
6�1 Installing the App
The App is available for free from the Google Play store.
Loading the App
1. Search for "Solar-Log" in the Google Play store.
2. Follow the directions to download and install the App on your smartphone.
3. Start the App on your smartphone.
• The start screen is displayed.
Fig.: The App icon
The App is started via the icon

75
Using the Solar-Log™ Android App
6�2 Add plants
You can monitor as many plants with the App as are connected with a Solar-Log™.
1. Go to the toolbar to monitor a plant.
Fig�: The App's toolbar
2. Touch the symbol in the toolbar.
Fig.: Adding a plant to the App
3. Touch the plus symbol.
• The screen Solar-Log™ App Access Data is then displayed.
Fig.: Entering the plant's access data
4. Enter the URL, Serial Number and Password from the registration email that you received from
Solare Datensysteme GmbH.
5. After that, tap on the Load button.

76
Using the Solar-Log™ Android App
Fig.: Entering the plant name in the App.
6. After that the Plant Name appears. Check that everything is correct and then touch OK.
7. The plant's current daily values will then be loaded. This can take a moment.
6�3 Plant settings
By selecting add Plants, you can adjust the settings for the view displayed.
1. Tab the symbol in the toolbar to go to the plant.
Fig.: Changing the plant display settings.
Tap on the symbol for the following settings:
• S0 meter
• Management
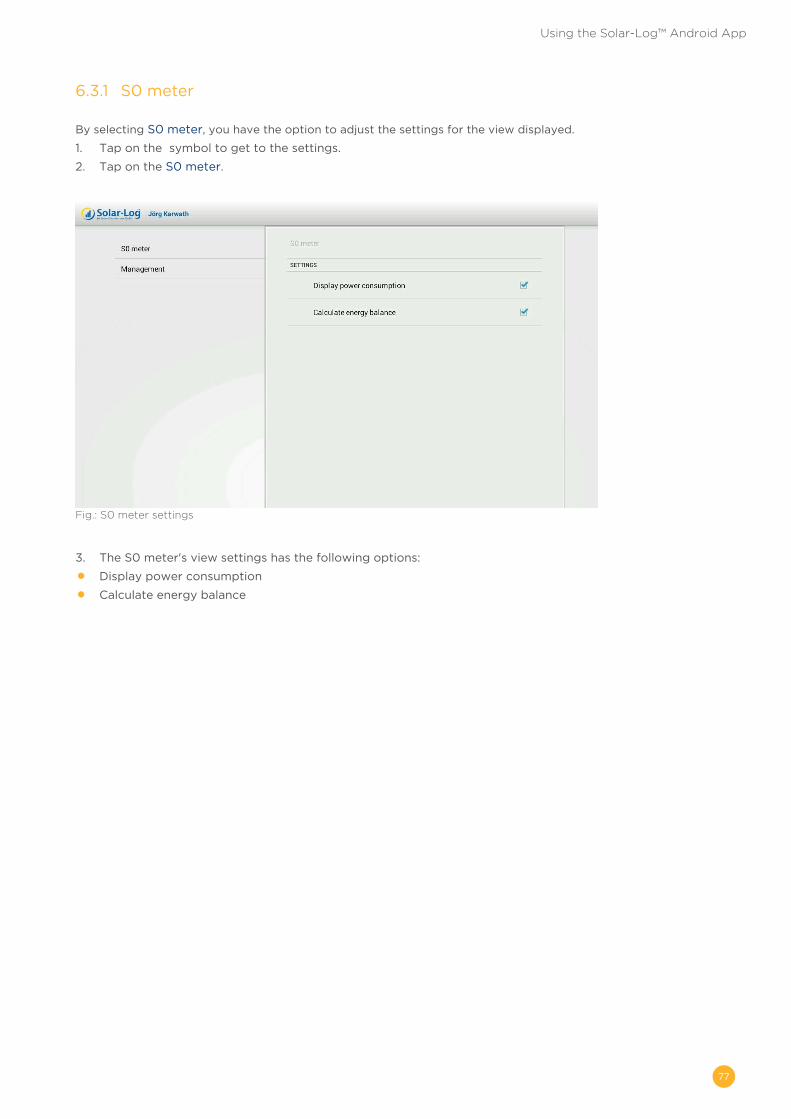
77
Using the Solar-Log™ Android App
6�3�1 S0 meter
By selecting S0 meter, you have the option to adjust the settings for the view displayed.
1. Tap on the symbol to get to the settings.
2. Tap on the S0 meter.
Fig.: S0 meter settings
3. The S0 meter's view settings has the following options:
• Display power consumption
• Calculate energy balance
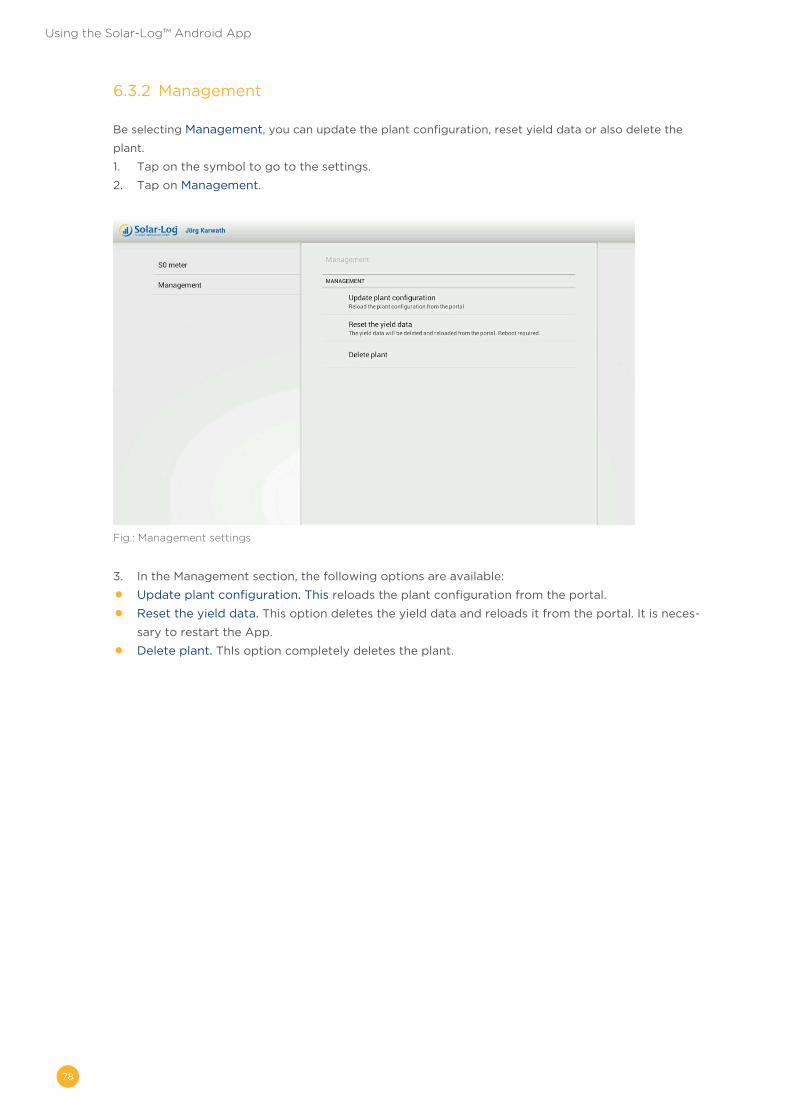
78
Using the Solar-Log™ Android App
6�3�2 Management
Be selecting Management, you can update the plant configuration, reset yield data or also delete the
plant.
1. Tap on the symbol to go to the settings.
2. Tap on Management.
Fig.: Management settings
3. In the Management section, the following options are available:
• Update plant configuration. This reloads the plant configuration from the portal.
• Reset the yield data. This option deletes the yield data and reloads it from the portal. It is neces-
sary to restart the App.
• Delete plant. ThIs option completely deletes the plant.

79
Using the Solar-Log™ Android App
6�4 The Toolbar
You can select the desired menu from the toolbar at the top right corner.
Fig.: Toolbar.
Use the symbol to add a plant
By selecting the symbol, you can display various yield values.
• Day
• Month
• Year
• Total
• CO2
Tap on the symbol to start the slide show.
By selecting the symbol, you can perform various actions:
• Update
• Today
• Settings
• End

80
Using the Solar-Log™ Android App
6�5 Accessing Yield values
After your plant has been correctly recognized, the yield values are displayed with the current daily values
in the overview.
Note!The data is only updated when your mobile device is connected to the Internet.
Fig.: Day curve with a menu selection
By selecting the symbol, you can display various yield values.
• Day
• Month
• Year
• Total
• CO2
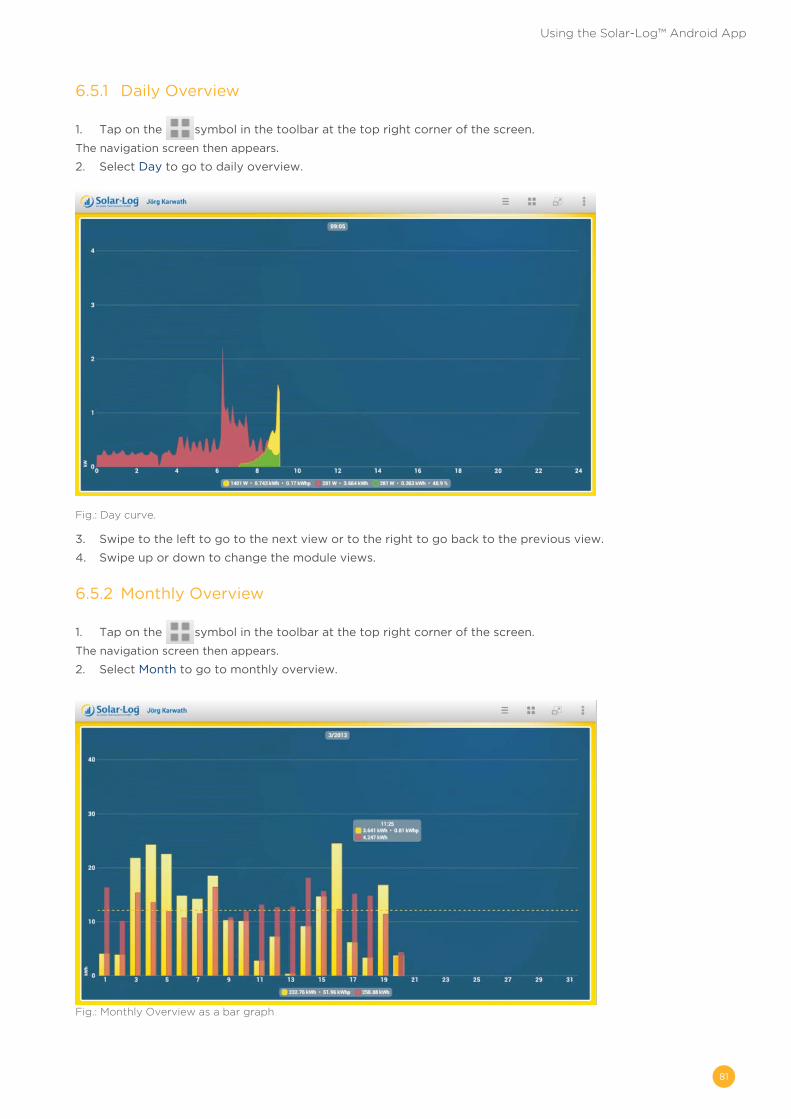
81
Using the Solar-Log™ Android App
6�5�1 Daily Overview
1. Tap on the symbol in the toolbar at the top right corner of the screen.
The navigation screen then appears.
2. Select Day to go to daily overview.
Fig.: Day curve.
3. Swipe to the left to go to the next view or to the right to go back to the previous view.
4. Swipe up or down to change the module views.
6�5�2 Monthly Overview
1. Tap on the symbol in the toolbar at the top right corner of the screen.
The navigation screen then appears.
2. Select Month to go to monthly overview.
Fig.: Monthly Overview as a bar graph

82
Using the Solar-Log™ Android App
The daily yields of the selected month are displayed as a bar graph.
3. Swipe to the left to go to the next view or to the right to go back to the previous view.
4. Swipe up or down to change the module views.
6�5�3 Annual Overview
1. Tap on the symbol in the toolbar at the top right corner of the screen.
The navigation screen then appears.
2. Select Year to go to the annual overview.
Fig.: Annual Overview as a bar graph
The monthly yields of the selected year are displayed as a bar graph.
3. Swipe to the left to go to the next view or to the right to go back to the previous view.
4. Swipe up or down to change the module views.
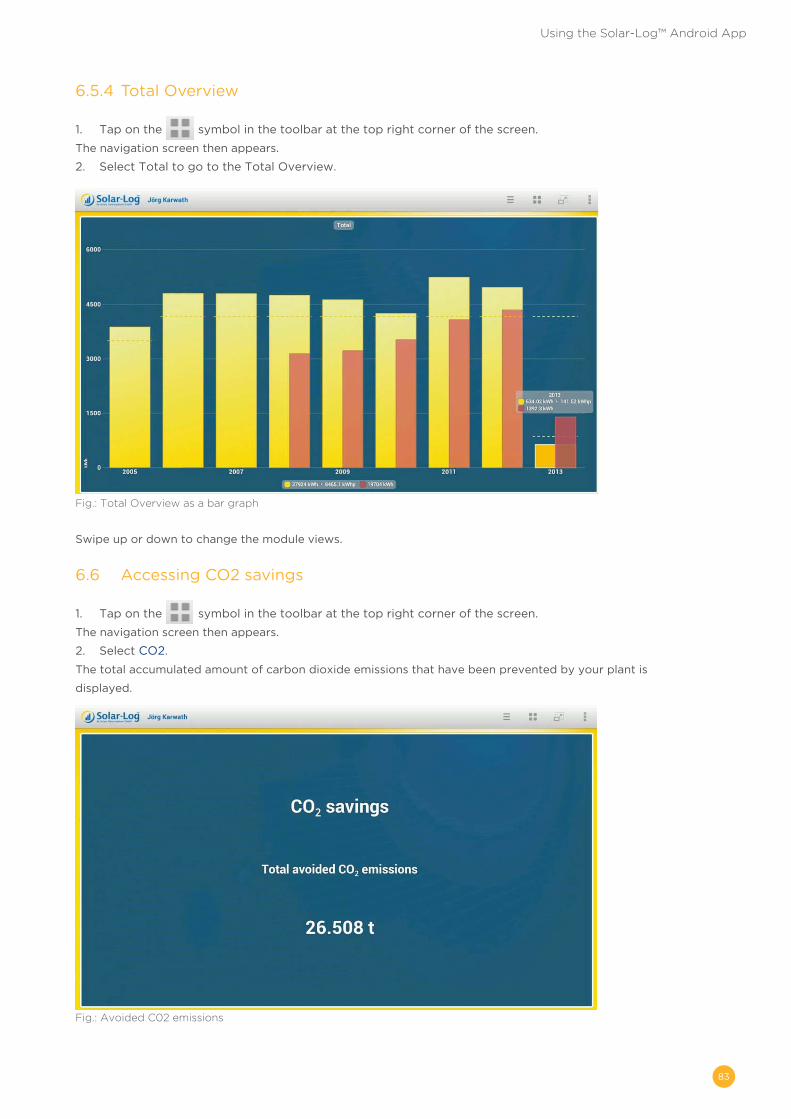
83
Using the Solar-Log™ Android App
6�5�4 Total Overview
1. Tap on the symbol in the toolbar at the top right corner of the screen.
The navigation screen then appears.
2. Select Total to go to the Total Overview.
Fig.: Total Overview as a bar graph
Swipe up or down to change the module views.
6�6 Accessing CO2 savings
1. Tap on the symbol in the toolbar at the top right corner of the screen.
The navigation screen then appears.
2. Select CO2.
The total accumulated amount of carbon dioxide emissions that have been prevented by your plant is
displayed.
Fig.: Avoided C02 emissions

84
Using the Solar-Log™ Android App
The savings shown is calculated using the quantity of carbon dioxide that would have been created in
order to generate the same amount of energy using fossil fuels.
6�7 App settings
Tap on the symbol in the toolbar at the top right corner of the screen.
The navigation screen then appears.
• Update
• Today
• Settings
• End
Fig.: Day curve and menu
• Select Update to update the plant's data.
• Select Today to leave the yield data and to switch to the current daily overview.
• Select End to quit the application.

85
Using the Solar-Log™ Android App
By selecting Settings from the menu, the following categories are available:
• General
• Slide show
• Legal Disclaimer
Fig.: General settings.
6�7�1 Periodical data update
1. Under General, tap on Periodical data update
The following setting options will become visible.
Fig.: Periodical data update settings
2. Tap on the update interval to automatically update the data. The window then automatically
closes.
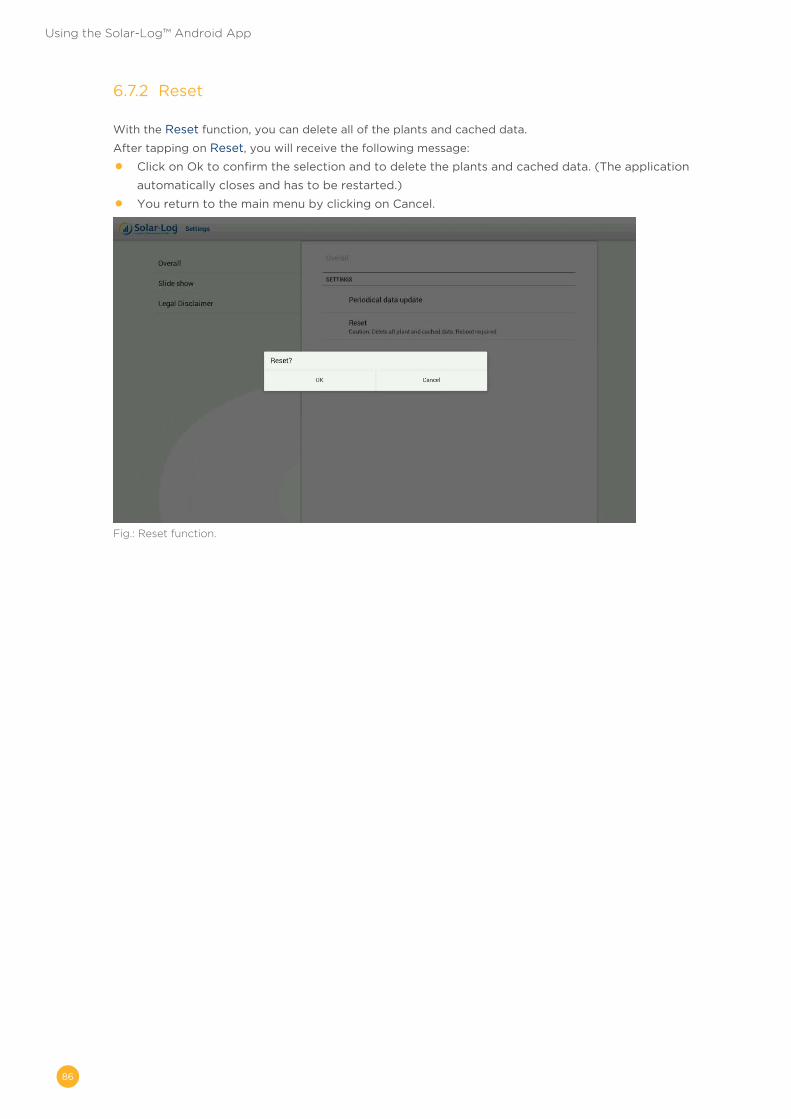
86
Using the Solar-Log™ Android App
6�7�2 Reset
With the Reset function, you can delete all of the plants and cached data.
After tapping on Reset, you will receive the following message:
• Click on Ok to confirm the selection and to delete the plants and cached data. (The application
automatically closes and has to be restarted.)
• You return to the main menu by clicking on Cancel.
Fig.: Reset function.

87
Using the Solar-Log™ Android App
6�7�3 Slide show
In the Slide Show menu, you have the option to adjust the display duration settings and to select a back-
ground image.
The following settings are available by selecting Slide Show.
• Display duration. You can determine after how many seconds the image should switch.
• Background image. You can select the background image that is to be displayed when the respec-
tive value is activated.
Fig.: Slide Show settings
6�7�4 Legal Disclaimer
You can see the App's version and who is legally responsible by selecting Legal Disclaimer.
Fig.: Legal Disclaimer
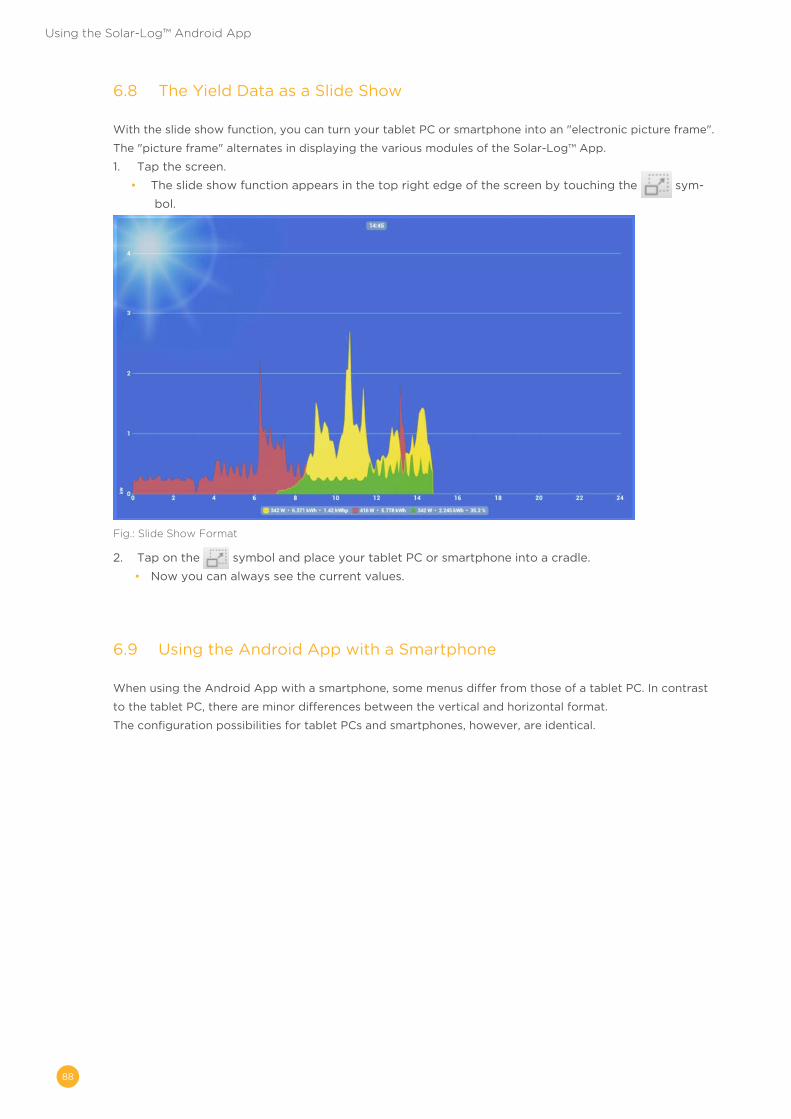
88
Using the Solar-Log™ Android App
6�8 The Yield Data as a Slide Show
With the slide show function, you can turn your tablet PC or smartphone into an "electronic picture frame".
The "picture frame" alternates in displaying the various modules of the Solar-Log™ App.
1. Tap the screen.
• The slide show function appears in the top right edge of the screen by touching the sym-
bol.
Fig.: Slide Show Format
2. Tap on the symbol and place your tablet PC or smartphone into a cradle.
• Now you can always see the current values.
6�9 Using the Android App with a Smartphone
When using the Android App with a smartphone, some menus differ from those of a tablet PC. In contrast
to the tablet PC, there are minor differences between the vertical and horizontal format.
The configuration possibilities for tablet PCs and smartphones, however, are identical.

89
Using the Solar-Log™ Android App
6�9�1 Smartphone vertical format
Use the
and symbols from the toolbar in the top right corner of the screen to add plants and adjust set-
tings.
Similarly, use the symbol to select the yield data.
Fig.: View of the Smartphone in the vertical format
When in the vertical format, click on the smartphone's Menu button for the App Settings and Slide show.
(See your smartphone's manual.)
After pressing the Menu button, the options that are accessible with the App settings symbol and Slide
show symbol on the tablet PC appear.

90
Using the Solar-Log™ Android App
Fig.: Selection via the menu button
Use the Back button on the smartphone (see the phone's user manual)
to return to the program.
6�9�2 Smartphone - horizontal format
The only difference between the horizontal and vertical format is that slide show can also be selected from
the toolbar.
The App settings have to be accessed with the smartphone's Menu button.
Fig.: Selection via the menu button - horizontal format
Use the Back button to return to the program.
91
Using the Solar-Log™ Android App
6�9�3 Solar-Log™ Widget for Smartphones
With an Android smartphone, you can display yield reports from your plant with the Solar-Log™ Widget.
(Activating Widgets: see the phone's user manual).
The Widget allows the plant's current daily yields to be display directly on your smartphone's home screen.
Changing the view:
The view can be directly changed in the App. All you have to do is tap on the Widget.
Adjusting the size and positioning the Widget:
Press on the Widget 1 to 2 seconds to change the size. A box with four points pops up. Move one of the
four points to define the size.
To select the Widget's position, press down on the Widget and move it to the desired position.
Note!2x1, 2x2 and HD can be selected for the Widget for devices with Android versions
less
than 4.0.
Only HD is available for Android versions greater than 4.0.
The HD format for the newer Android versions, however, can be displayed in vari-
able sizes.
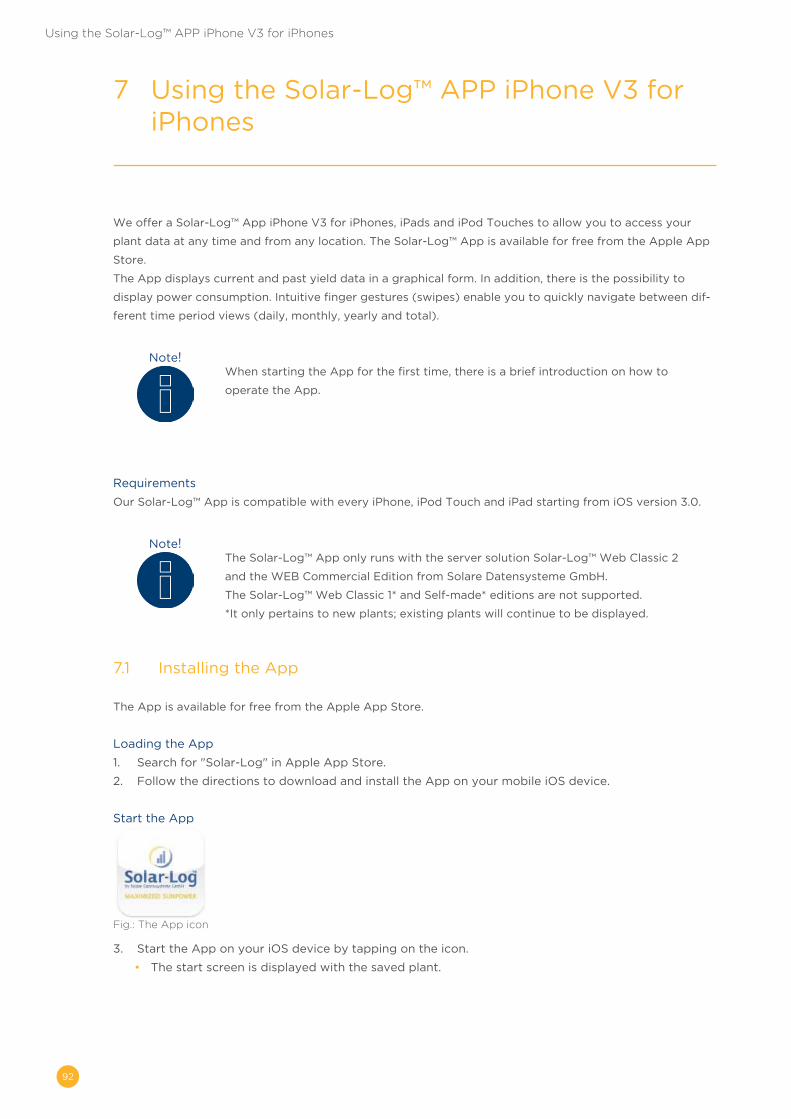
92
Using the Solar-Log™ APP iPhone V3 for iPhones
7 Using the Solar-Log™ APP iPhone V3 for iPhones
We offer a Solar-Log™ App iPhone V3 for iPhones, iPads and iPod Touches to allow you to access your
plant data at any time and from any location. The Solar-Log™ App is available for free from the Apple App
Store.
The App displays current and past yield data in a graphical form. In addition, there is the possibility to
display power consumption. Intuitive finger gestures (swipes) enable you to quickly navigate between dif-
ferent time period views (daily, monthly, yearly and total).
Note!When starting the App for the first time, there is a brief introduction on how to
operate the App.
Requirements
Our Solar-Log™ App is compatible with every iPhone, iPod Touch and iPad starting from iOS version 3.0.
Note!The Solar-Log™ App only runs with the server solution Solar-Log™ Web Classic 2
and the WEB Commercial Edition from Solare Datensysteme GmbH.
The Solar-Log™ Web Classic 1* and Self-made* editions are not supported.
*It only pertains to new plants; existing plants will continue to be displayed.
7�1 Installing the App
The App is available for free from the Apple App Store.
Loading the App
1. Search for "Solar-Log" in Apple App Store.
2. Follow the directions to download and install the App on your mobile iOS device.
Start the App
Fig.: The App icon
3. Start the App on your iOS device by tapping on the icon.
• The start screen is displayed with the saved plant.
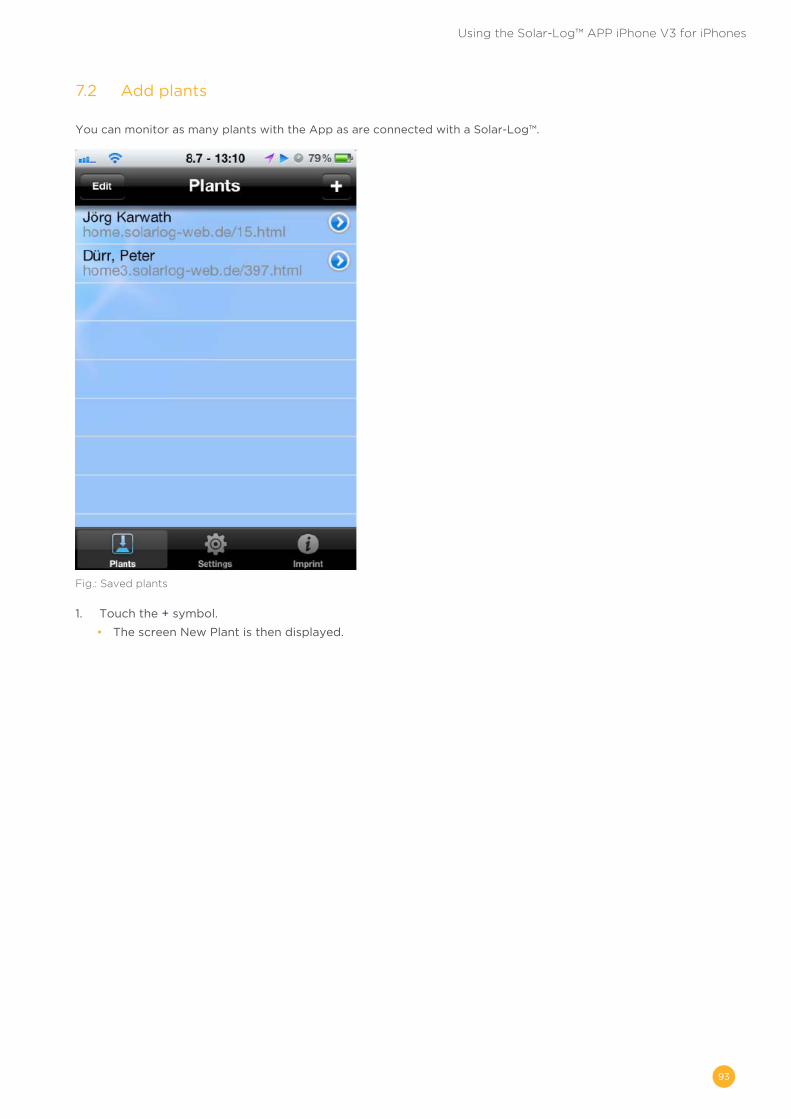
93
Using the Solar-Log™ APP iPhone V3 for iPhones
7�2 Add plants
You can monitor as many plants with the App as are connected with a Solar-Log™.
Fig.: Saved plants
1. Touch the + symbol.
• The screen New Plant is then displayed.
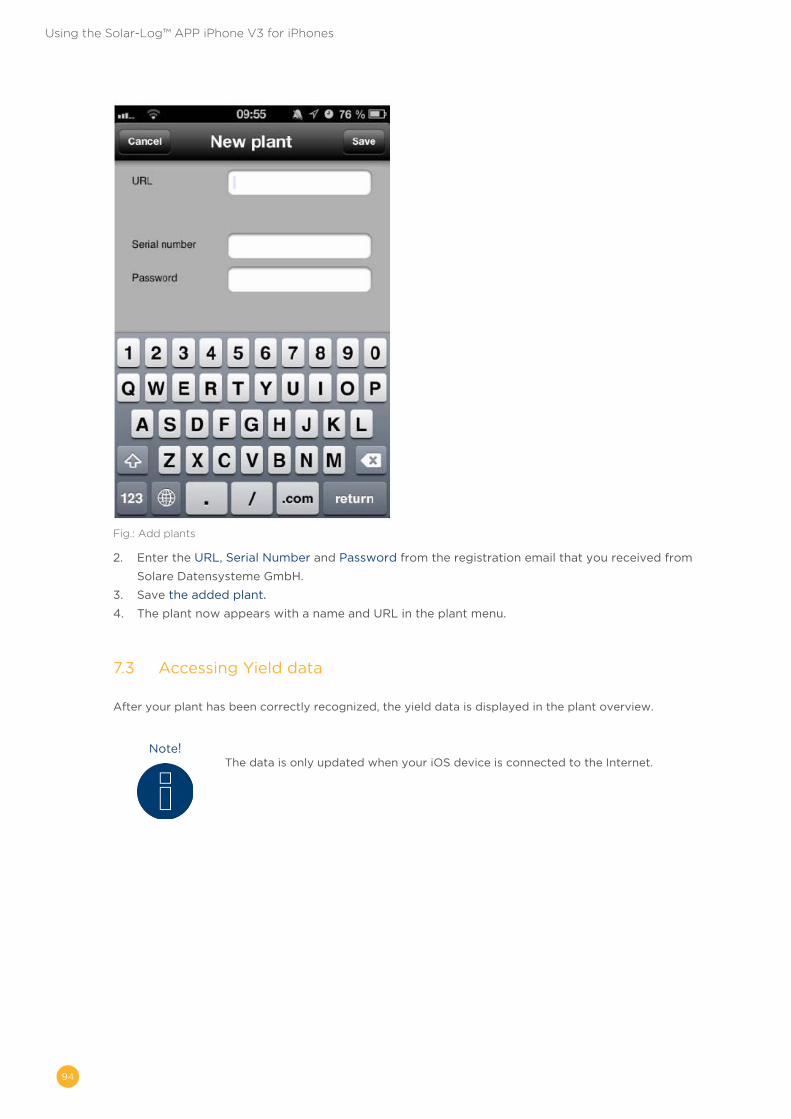
94
Using the Solar-Log™ APP iPhone V3 for iPhones
Fig.: Add plants
2. Enter the URL, Serial Number and Password from the registration email that you received from
Solare Datensysteme GmbH.
3. Save the added plant.
4. The plant now appears with a name and URL in the plant menu.
7�3 Accessing Yield data
After your plant has been correctly recognized, the yield data is displayed in the plant overview.
Note!The data is only updated when your iOS device is connected to the Internet.

95
Using the Solar-Log™ APP iPhone V3 for iPhones
7�3�1 How to navigate between different overviews
1. Start the App
Fig.: Saved plants
2. Touch the blue arrow next to the name of your plant. The current Daily Overview is then displayed
with the yield values, percentage (based on the forecast) and consumption (only if a meter is con-
nected and activated, see the chapter "Accessing Plant Data”).
3. By touching the screen, a menu appears on the top and bottom the screen from which you can
select the desired view.

96
Using the Solar-Log™ APP iPhone V3 for iPhones
Fig.: Day curve with the top and bottom menu selection
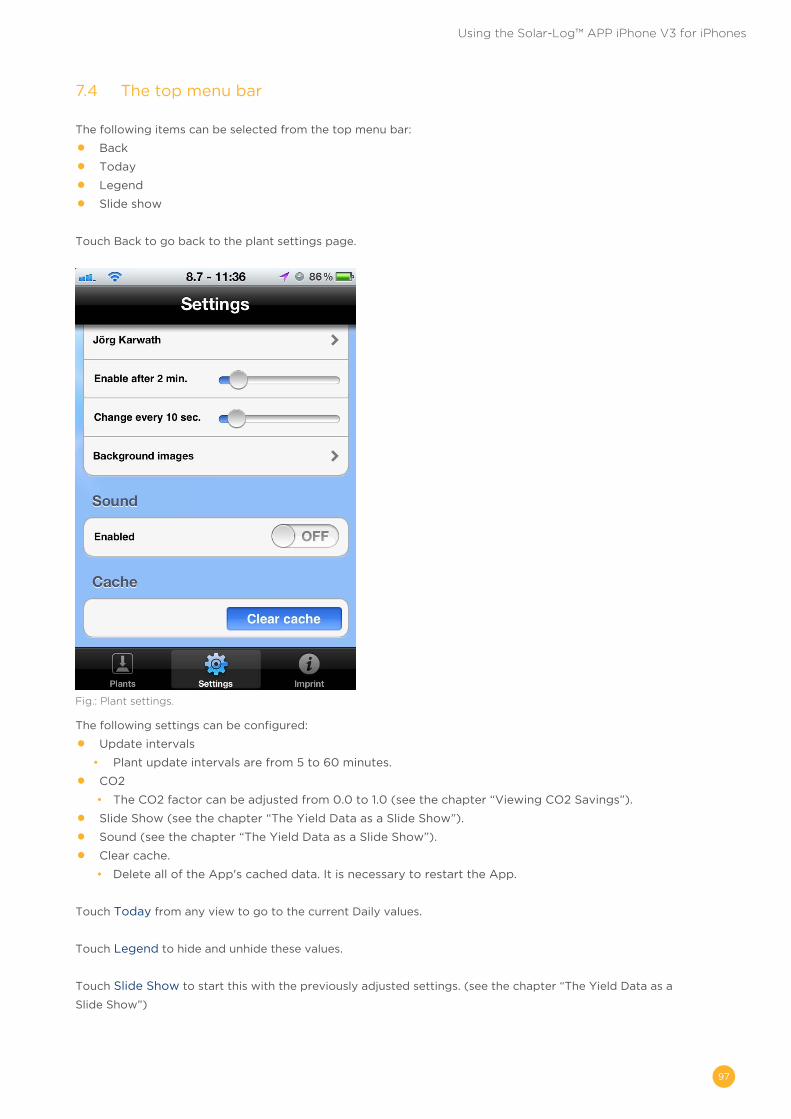
97
Using the Solar-Log™ APP iPhone V3 for iPhones
7�4 The top menu bar
The following items can be selected from the top menu bar:
• Back
• Today
• Legend
• Slide show
Touch Back to go back to the plant settings page.
Fig.: Plant settings.
The following settings can be configured:
• Update intervals
• Plant update intervals are from 5 to 60 minutes.
• CO2
• The CO2 factor can be adjusted from 0.0 to 1.0 (see the chapter “Viewing CO2 Savings”).
• Slide Show (see the chapter “The Yield Data as a Slide Show”).
• Sound (see the chapter “The Yield Data as a Slide Show”).
• Clear cache.
• Delete all of the App's cached data. It is necessary to restart the App.
Touch Today from any view to go to the current Daily values.
Touch Legend to hide and unhide these values.
Touch Slide Show to start this with the previously adjusted settings. (see the chapter “The Yield Data as a
Slide Show”)

98
Using the Solar-Log™ APP iPhone V3 for iPhones
7�5 The bottom menu bar
The following items can be selected from the bottom menu bar:
• Day
• Month
• Year
• Total
• CO2
• Plant
7�5�1 Daily Overview
1. Tap the screen.
• The bottom menu bar is then displayed.
2. Select Day to go to the Daily Values.
Fig.: Day curve - horizontal format
The daily yields are displayed as a graphical curve.
1. Rotate your iOS device horizontally for a better view.
2. Swipe to the left to go to the next view or to the right to go back to the previous view.
3. Swipe up or down to change the module views.
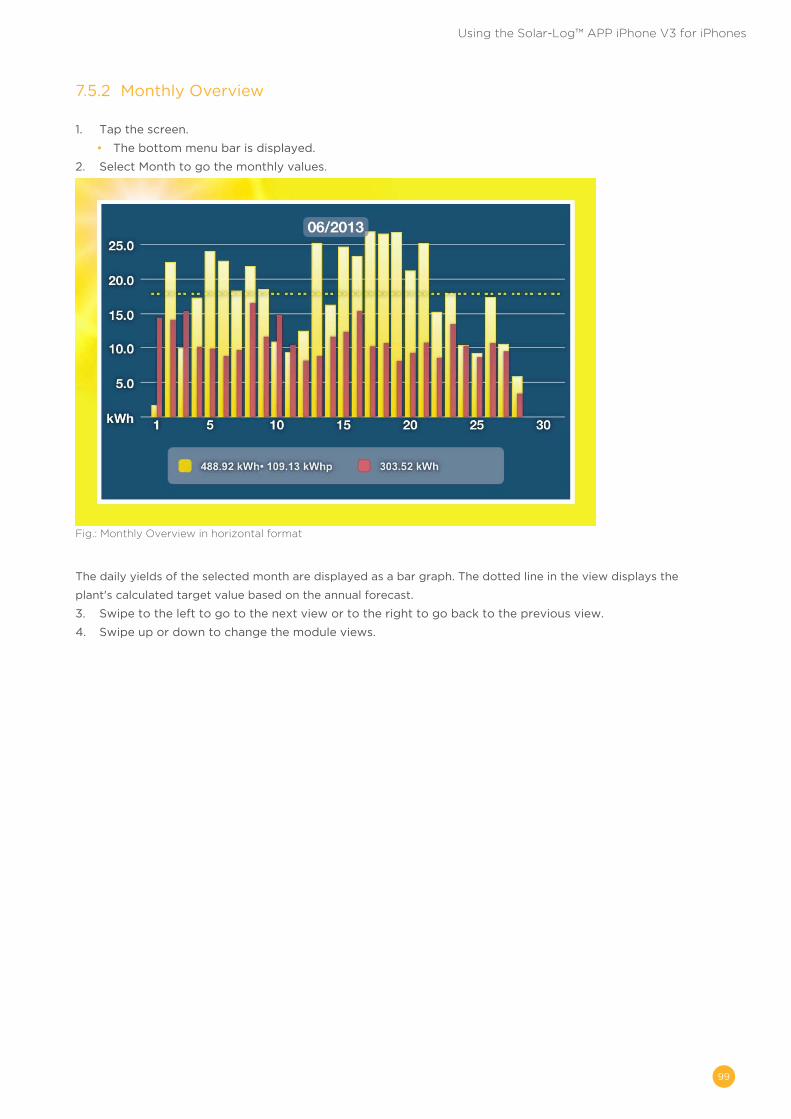
99
Using the Solar-Log™ APP iPhone V3 for iPhones
7�5�2 Monthly Overview
1. Tap the screen.
• The bottom menu bar is displayed.
2. Select Month to go the monthly values.
Fig.: Monthly Overview in horizontal format
The daily yields of the selected month are displayed as a bar graph. The dotted line in the view displays the
plant's calculated target value based on the annual forecast.
3. Swipe to the left to go to the next view or to the right to go back to the previous view.
4. Swipe up or down to change the module views.

100
Using the Solar-Log™ APP iPhone V3 for iPhones
7�5�3 Annual Overview
1. Tap the screen.
• The bottom menu bar is displayed.
2. Select Year to go the yearly values.
Fig.: Annual Overview in horizontal format
The monthly yields of the selected year are displayed as a bar graph. The dotted line in the view displays
the plant's calculated target value based on the annual forecast.
3. Swipe to the left to go to the next view or to the right to go back to the previous view.
4. Swipe up or down to change the module views.

101
Using the Solar-Log™ APP iPhone V3 for iPhones
7�5�4 Total Overview
1. Tap the screen.
• The bottom menu bar is displayed.
2. Select Total to go to the Total View.
Fig.: Total Overview in horizontal format
The annual yields of the total view are displayed as a bar graph. The dotted line in the view displays the
plant's calculated target value based on the annual forecast.
3. Swipe up or down to change the module views.

102
Using the Solar-Log™ APP iPhone V3 for iPhones
7�6 Viewing CO2 savings
1. Tap the screen.
• The bottom menu bar is displayed.
2. Select CO2.
• The total accumulated amount of carbon dioxide emissions that have been prevented by your
plant is displayed.
Fig.: CO2 savings
• The CO2 savings depends on how much CO
2 emissions are produced to generate 1 kWh of power
(g/kWh).
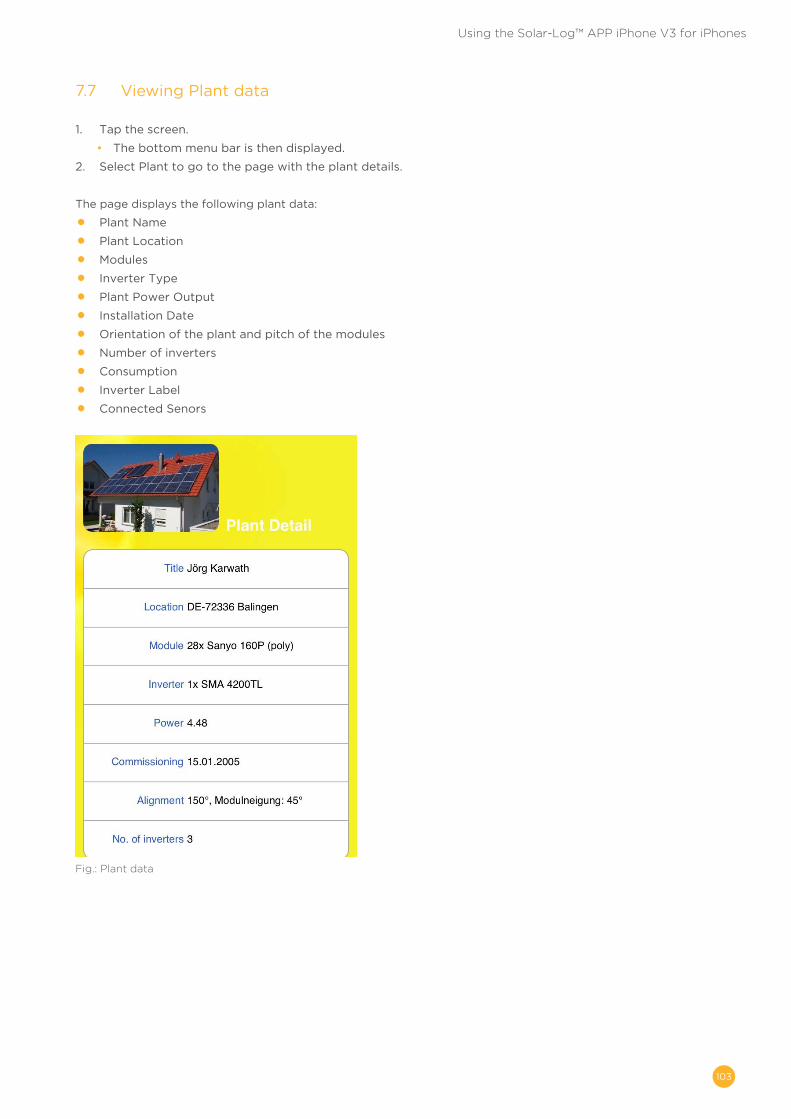
103
Using the Solar-Log™ APP iPhone V3 for iPhones
7�7 Viewing Plant data
1. Tap the screen.
• The bottom menu bar is then displayed.
2. Select Plant to go to the page with the plant details.
The page displays the following plant data:
• Plant Name
• Plant Location
• Modules
• Inverter Type
• Plant Power Output
• Installation Date
• Orientation of the plant and pitch of the modules
• Number of inverters
• Consumption
• Inverter Label
• Connected Senors
Fig.: Plant data

104
Using the Solar-Log™ APP iPhone V3 for iPhones
Fig.: Display settings
In addition, you can also adjust the following settings from these menu items:
• Images.
• Select plant image.
• Select background image.
• Consumption (can only be activated if a meter is connected).
• Activate display power consumption (has to be manually activated).
• Activate calculate energy balance (has to be manually activated).
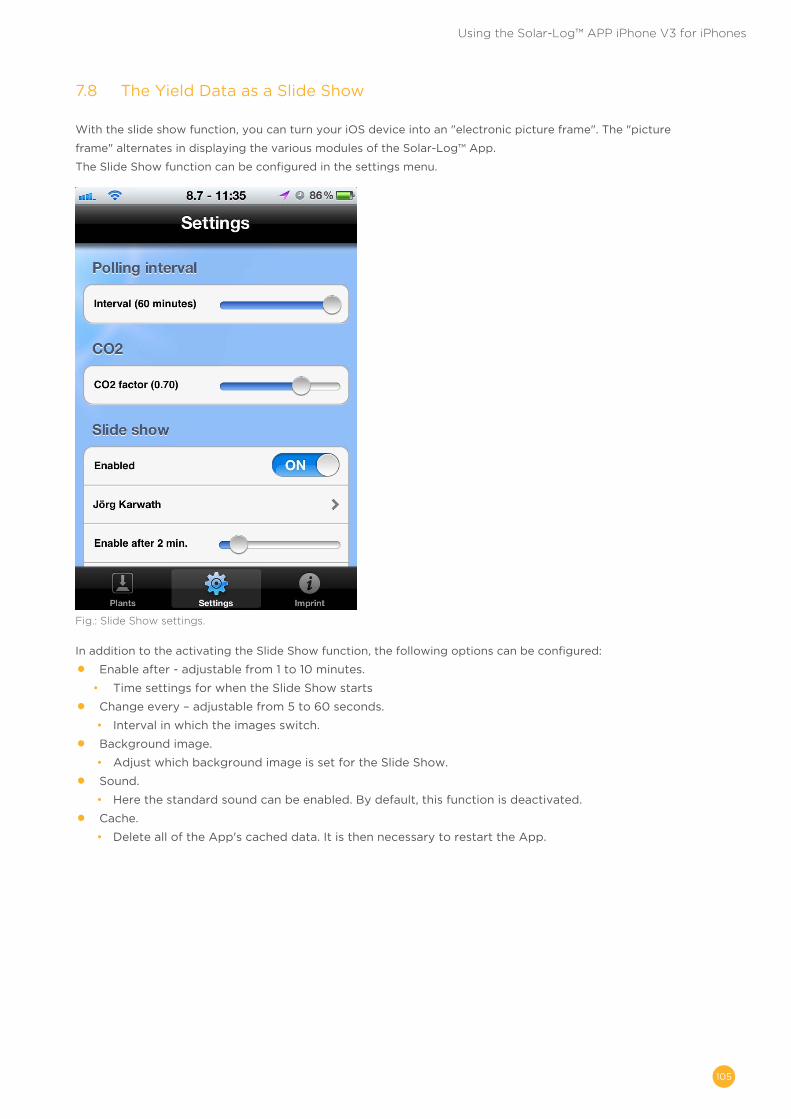
105
Using the Solar-Log™ APP iPhone V3 for iPhones
7�8 The Yield Data as a Slide Show
With the slide show function, you can turn your iOS device into an "electronic picture frame". The "picture
frame" alternates in displaying the various modules of the Solar-Log™ App.
The Slide Show function can be configured in the settings menu.
Fig.: Slide Show settings.
In addition to the activating the Slide Show function, the following options can be configured:
• Enable after - adjustable from 1 to 10 minutes.
• Time settings for when the Slide Show starts
• Change every – adjustable from 5 to 60 seconds.
• Interval in which the images switch.
• Background image.
• Adjust which background image is set for the Slide Show.
• Sound.
• Here the standard sound can be enabled. By default, this function is deactivated.
• Cache.
• Delete all of the App's cached data. It is then necessary to restart the App.

106
Using the Solar-Log™ APP iPhone V3 for iPhones
7�8�1 Start the Slide Show
1. Tap the screen. The menu bar is then displayed.
Fig.: Screen with the top and bottom menu selection
2. Select Slide Show from the top menu bar.
• Now you can always see the current values.

107
Cleaning and care
8 Cleaning and care
8�1 Cleaning tips
Important:Be sure to unplug the device prior to cleaning it!
• Clean the device on the outside only with a dry, lint-free cloth.
• If the device is very dirty, it can be cleaned with a slightly damp cloth and a commercially available
household cleaner.
Important:When cleaning, make sure that no moisture gets into the device!
8�2 Care tips
• Make sure that the device is not exposed to any moisture at the location where it is kept.
• Make sure that the device is not exposed to any heat or strong sunlight at the location where it is
kept.
• Please take note of the Technical Data.

108
Notifications on the LCD Status Display
9 Notifications on the LCD Status Display
The Solar-Log 300, 1200 and 2000 have an LCD Status Display for notification on the during installation and
operation.
9�1 Meaning of the symbols on the LCD display
The following symbols are shown on the Solar-Log™ LCD display.
Fig.: LCD Status Display with all of the symbols
Meaning of the symbols on the LCD display
Symbol Meaning
Inverters
Internet or Network
Firmware update progress

109
Notifications on the LCD Status Display
Sensors for - Irradiation- Wind- Temperature
Meter
Booting progress
SIM card
Easy Installation active
GPRS available
NotificationsfromtheSolar-Log™
Signal strength in combination with GPRS, WiFi or Bluetooth
Encrypted WiFi connection
Wireless internet.
Time
Input box for fault codes

110
Notifications on the LCD Status Display
Note!
Please refer to the chapters “Notifications on the LCD display,” “Fault messages”
and “Faults” in the Installation Manual for more explanation on the LCD Status
Code.
111
Disposal
10 Disposal
Important:Solar-Log™ contains electronic components that can release highly toxic substanc-
es if burned or disposed of along with domestic waste.
Note!Make sure you dispose of the Solar-Log™ as electronic scrap in the recycling cen-
ter.
²

112
Technical Data
11 Technical Data
Product comparison Solar-Log 300 Solar-Log 1200 Solar-Log
2000
Basi
c f
un
cti
on
s
PM+ (2)
PM+ / WiFi (2) -
PM+ / GPRS (2) 4)
Bluetooth (BT) (2) -
WiFi (wireless LAN) (2) -
Bluetooth (BT) / WiFi (2) -
GPRS (2)
Solar-LogTM Meter (CT) -
Central inverter SCB and SMB - -
Communication interface1 x RS485 / RS422 (1 INV manufac-
turer per bus)
1 x RS485 1 x RS485 / RS422 (1 INV manufac-
turer per bus)
1 x RS485, 2x RS485 / RS422, 1 x CAN(1 inv. manufac-
turer per bus)
Max. plant size15 kWp / 1 INV. manu-facturer
100 kWp / 2 INV. manu-facturer
2000 kWp / 3 INV. manu-facturer
Max. cable length max. 1000 m 1) max. 1000 m 1) max. 1000 m 1)
Pla
nt
mo
nit
ori
ng
String monitoring (depend-ing on inverter type)
Inverter failure, status of fault and power monitoring
Sensor system connection (irradiation/ temp./ wind)
3) 3) 3)
E-mail and text mes-sage (SMS) alert
Alarm (local) - -
Yield forecast and deg-radation calculation
Self-produced energy consump-tion: Digital electricity meter
Self-produced energy consump-tion: Managing external appliances

113
Technical Data
Product comparison Solar-Log 300 Solar-Log 1200 Solar-Log
2000V
isu
aliz
ati
on
Integrated web servers
Graphic visualization – PC local and Internet
LCD Status Display
Display on the unit -4.3" TFT color display
4.3" TFT color display
Controls on the unit - via touch screen via touch screen
Large external display RS485 / S
0 pulse
Inte
rfaces
Ethernet network
USB flash drive
Potential-free contact (relay) -
Alarm contact (anti-theft) - -
Gen
era
l D
ata
Power supply voltage / device voltage / current consumption
115 V – 230 V / 12 V / 3 W
Ambient temperature -10 °C to +50 °C
Housing / dimensions (W x D x H) in cm Mounting / protection level
Plastic / 22.5 x 4 x 28.5 / Wall-mounted / IP 20 (indoor use only)
Connection to Solar-LogTM WEB "Commercial Edition"
Multi-lingual (DE, EN, ES, FR, IT, NL, DK)
Memory, Micro SD card, 2 GB, endless data logging
Warranty 5 years
1) Depending on the inverter used, and the cable length (details can also vary from one type of device to another).2) Other important information about Bluetooth and compatibility, Power Management, self-con-sumption and SCB and SMB inverters can be found on our website www.solar-log.net.3) Using every inverter on the same bus is not always possible, see the inverter database www.solar-log.com4) Solar-Log 2000 PM+ / GPRS interfaces: 1 x RS485, 1 x RS485 / RS422, 1 x CAN (1 INV manufacturer per bus)

114
Technical Data
Accessories Solar-Log 300 Solar-Log 1200 Solar-Log
2000
Accessories
Ready-to-install cable kits for most supported inverters
Digital electricity meter
PowerLine Package
RS485 Wireless Package
Sensors
Surge protection
Accessories for SMA invertersSpecial PiggyBack RS485 (except TL-20 series)
Data Module SMA RS485
Top Features Solar-Log 300 Solar-Log 1200 Solar-Log
2000
LCD Status Display Status display for installation and operations
Easy Installation
Installation is possible without PC and installation expertise.
The inverter detec-tion and Internet registration is enabled by default and is started automatically.
Query for addition-al information, then automatic inverter detection and in-ternet registration.
-
Network recognitionAutomatic search for the DHCP server and assign-
ment of a valid IP address in the local network.
Local network accessibility
Registration is done with its name. The IP address of the Solar-Log™ no longer needs to be known, unless there are several Solar-
Logs on the network. The Solar-LogTM can be accessed directly from a web
browser with this address: http://solar-log.
Additional functions
Monitoring, optimization and managing of self-con-sumption with a fixed regulation of active power in-
cluding the calculation of self-consumption.
Evaluation of Sensor Box Commercial data
- -Monitoring of central inverters
Solar-LogTM MeterMonitoring, feed-in manage-
ment and power meter.-
Support for the Solar-LogTM SCB/SMB
- -Individual string monitoring
Solar-LogTM PM+ functionalityRemote controlled active power reduc-
tion and reactive power adjustments
Monitoring large plants with the support of the Solar-Log 2000 or Solar-Log 2000 PM+ with active power reduction and reactive power control along with response signals.

115
Technical Data
Article Number Solar-Log 300 Solar-Log 1200 Solar-Log
2000
Standard 255574 255591 255592
BT 255577 255585 -
WiFi 255576 255584 -
BT / WiFi 255578 255586 -
PM+ 255579 255587 255594
PM+ / WiFi 255580 255588 -
GPRS 255575 255583 255593
PM+ / GPRS 255581 255589 255595
Solar-LogTM Meter (CT) 255582 255590 -

116
Technical Data
Interfaces Solar-Log 300 Solar-Log 1200 Solar-Log
2000In
vert
er
inte
rface
RS485/RS422 – interface usageRS485 / RS422 – combined interface usage
RS485 – interface,RS485 / RS422 – combined interface usage
RS485 A – interface,RS485 / RS422 B – / RS485 / RS422 C* - combined interface usage
RS485 – interface usage
Inverter connection
Connection of a Sensor Basic to record environ-mental data(irradiance and module sensor)
Connection of a Sensor Box Com-mercial to record environmental
data (irradiance, module and ambi-ent temperature, wind sensor)
Connection of meter for self-consumption according to IEC 60870
Connection of the display panels produced by Schneider Displaytechnik, Rico or HvG
- -
Connecting the Utility Meter and I/O Box for PM remote control technology
RS422 – interface usageRS 422 Fronius / Sunville connectible with-
out additional interface converters
CAN bus - -For the con-nection of e.g. Voltwerk inverters
Ad
dit
ion
al fu
ncti
on
in
terf
aces
S0 pulse input – for optional recording and calcula-
tion of self-produced power consumption.
2x S0 In / 1x S
0 out
2 input to connect an additional power meter
S0 pulse output to connect large external dis-plays, pulse factor can be set to any value
Relay -Relay for external switch con-
trol, e.g. heat pumps
Alarm - -
Connection for anti-theft protec-tion via contact loop for external alarms via poten-tial-free contact
USB connectionTo access data
Import firmware updates at plants
PM+ interface (optional)
PM+ (Power Management)
For connection of a ripple-control receiver to regulate the plant
Fulfills the EEG 2012 requirements
Solar-LogTM Meter (optional)Current measurements via transformers (extra ac-
cessory) up to 2 x 3 phases or 6 single phases

117
Technical Data
Interfaces Solar-Log 300 Solar-Log 1200 Solar-Log
2000
Net-
wo
rk
Network Connection to the internet (Ethernet, fixed IP address or DHCP)
GPRS (optional)Antenna connection and SIM card slot for Solar-Log™ with integrated GPRS
* not with GPRS models

118
List of figures
12 List of figures
Navigation designations ............................................................................................................................................................................................... 8Welcome screen ............................................................................................................................................................................................................... 9The plant's current values ...........................................................................................................................................................................................10Graphic display of the plant's total production ................................................................................................................................................ 11Day view of the production graph ......................................................................................................................................................................... 12Day view of the production table ........................................................................................................................................................................... 13Month view production graph .................................................................................................................................................................................. 13Month view of the production table ......................................................................................................................................................................14Year view graph............................................................................................................................................................................................................... 15Total view graph .............................................................................................................................................................................................................16Graph of the daily consumption from the connected appliances .......................................................................................................... 17Balances graph.................................................................................................................................................................................................................18Day balance graph .........................................................................................................................................................................................................19Month view balance graph ....................................................................................................................................................................................... 20Year view balance graph .............................................................................................................................................................................................21Total balance graph ......................................................................................................................................................................................................22Finances overview .........................................................................................................................................................................................................23Graph of Sensor Box values ....................................................................................................................................................................................24System Information ......................................................................................................................................................................................................25Inverter details graph ...................................................................................................................................................................................................26Tracker comparison graph ........................................................................................................................................................................................27Module field comparison graph ..............................................................................................................................................................................28The event log is being loaded. ................................................................................................................................................................................29Event log ............................................................................................................................................................................................................................29Notification overview .................................................................................................................................................................................................. 30Message with text field ................................................................................................................................................................................................31Feed-In Management - Control State ..................................................................................................................................................................32Feed-In Management - Feed-balance .................................................................................................................................................................33Components - S0 meter on interface A and B ..............................................................................................................................................35Alarm contact ..................................................................................................................................................................................................................36CSV Export .......................................................................................................................................................................................................................36Support - General ..........................................................................................................................................................................................................38Entering the recipient's e-mail address. .............................................................................................................................................................39Defining time frame and modes. ...........................................................................................................................................................................40Example of a yield message ......................................................................................................................................................................................41Yield overview (All INV) in HTML format...........................................................................................................................................................42Yield overview (All INV & groups) in HTML format ......................................................................................................................................42Performance Monitoring: Example pant with two inverters ................................................................................................................... 44Configuring module fields .........................................................................................................................................................................................45Configuring performance monitoring ..................................................................................................................................................................45Performance Monitoring with notification and inverter .............................................................................................................................47Start page of the display ........................................................................................................................................................................................... 49Dashboard view ...............................................................................................................................................................................................................51Energy Balance view .....................................................................................................................................................................................................51Forecast view ...................................................................................................................................................................................................................53Yield history - Day .........................................................................................................................................................................................................53Environmental performance - Day view .............................................................................................................................................................54Menu Settings ..................................................................................................................................................................................................................55USB menu ..........................................................................................................................................................................................................................55C2 registration .................................................................................................................................................................................................................58C2 registration site ....................................................................................................................................................................................................... 60C2 Plant search screen .................................................................................................................................................................................................61C2 Plant search with a filter .......................................................................................................................................................................................61C2 Plant search with results .....................................................................................................................................................................................62C2 plant with a day curve ..........................................................................................................................................................................................63C2 Navigating in the view ..........................................................................................................................................................................................63Day curve with additional values .......................................................................................................................................................................... 64Plant C2 - Monthly Overview ...................................................................................................................................................................................65Plant C2 - Annual Overview .................................................................................................................................................................................... 66Plant C2 - Total Overview ..........................................................................................................................................................................................67Plant C2 - Notifications ...............................................................................................................................................................................................68Plant C2 - Filtered notifications ............................................................................................................................................................................. 69The App icon ................................................................................................................................................................................................................... 70The App's toolbar ..........................................................................................................................................................................................................71Adding a plant to the App .........................................................................................................................................................................................71Entering the plant's access data .............................................................................................................................................................................71
119
List of figures
Entering the plant name in the App. ....................................................................................................................................................................72S0 meter settings ..........................................................................................................................................................................................................73Management settings ..................................................................................................................................................................................................74Toolbar. ...............................................................................................................................................................................................................................75Day curve with a menu selection ...........................................................................................................................................................................76Day curve. ..........................................................................................................................................................................................................................77Monthly Overview as a bar graph ........................................................................................................................................................................77Annual Overview as a bar graph ..........................................................................................................................................................................78Total Overview as a bar graph ................................................................................................................................................................................79Avoided C02 emissions ..............................................................................................................................................................................................79Day curve and menu ................................................................................................................................................................................................... 80General settings. ..............................................................................................................................................................................................................81Periodical data update settings ...............................................................................................................................................................................81Reset function. ................................................................................................................................................................................................................82Slide Show settings .......................................................................................................................................................................................................83Legal Disclaimer .............................................................................................................................................................................................................83Slide Show Format ....................................................................................................................................................................................................... 84View of the Smartphone in the vertical format ..............................................................................................................................................85Selection via the menu button ................................................................................................................................................................................86Selection via the menu button - horizontal format.......................................................................................................................................86The App icon ....................................................................................................................................................................................................................88Saved plants .....................................................................................................................................................................................................................89Add plants ........................................................................................................................................................................................................................ 90Saved plants ......................................................................................................................................................................................................................91Day curve with the top and bottom menu selection ...................................................................................................................................92Plant settings. ..................................................................................................................................................................................................................93Day curve - horizontal format ................................................................................................................................................................................ 94Monthly Overview in horizontal format ..............................................................................................................................................................95Annual Overview in horizontal format ............................................................................................................................................................... 96Total Overview in horizontal format ....................................................................................................................................................................97CO2 savings ......................................................................................................................................................................................................................98Plant data .......................................................................................................................................................................................................................... 99Display settings ............................................................................................................................................................................................................ 100Slide Show settings. ..................................................................................................................................................................................................... 101Screen with the top and bottom menu selection ........................................................................................................................................ 102LCD Status Display with all of the symbols ....................................................................................................................................................104

The copyright of these instructions remains with
the manufacturer. No part of these instructions may
be may be reproduced in any form or processed,
duplicated or distributed using electronic systems
without the written consent of Solare Datensysteme
GmbH. Subject to change without notice!
Non-compliance resulting in contradiction of the
above-mentioned specifications shall result in obli-
gation to provide compensation for damages.
All brands and trademarks contained in this manual
are the sole property of the respective manufactur-
er, which we respect and recognize herewith.
Solare Datensysteme GmbH
Fuhrmannstraße 9
72351 Geislingen-Binsdorf
Germany
Tel: +49 7428 9418 200
Fax: +49 7428 9418 280
www.solar-log.com
www.solarlog-WEB.com
Hotline: +49 7428 9418 660
EN
| 0
1.20
14 V
ers
ion
3.0
C


