Usability and credibility evaluation of electronic
governments: users’ perspective
A thesis submitted for the degree of
Doctor of Philosophy
By
Zhao Huang
School of Information System, Computing and Mathematics
Brunel University
December 2010

ii
ABSTRACT
With the rapid development of the Internet and web technology, governments
worldwide have caught onto this revolution and shown rapid development of
electronic government (e-government) in the public sector. Nowadays, there are a
significant number of e-governments that are accessible via the Internet and provide a
range of information and services. However, existing research indicates that e-
government still faces the challenge of generating greater users‟ interaction in terms
of accessing information, utilizing services and participating in e-government decision
making. Among a variety of reasons for this challenge, usability and credibility have
been found to be the key factors in users‟ decisions about e-government engagement
and need to be explored. This research attempts to evaluate the usability and
credibility of current e-governments, focusing on specific e-government websites in
the UK. This research adopted heuristic evaluation, which is based on users‟
perception, to implement a thorough and in-depth assessment of e-government
websites. In addition, to obtain a more comprehensive evaluation, users‟ performance
was measured in order to reveal the level of users‟ interaction with e-government
websites when they perform a set of practical tasks. The research design was a quasi-
experimental, consisting of two linked experiments. Experiment 1 aimed to evaluate
usability and credibility of the target e-government websites, identifying a range of
existing usability and credibility problems. Based on the usability and credibility
problems found, design solutions were proposed for each of the target e-government
websites. Experiment 2 aimed to examine the effects of the proposed design solutions
on the usability and credibility problems identified on the redesigned e-government
websites. The findings of experiment 1 suggested that the e-government websites
need to improve their usability and credibility. In particular, the most serious usability
problems found in the target e-government websites lay within the areas of “aesthetic
and minimalist design”, “recognition rather than recall”, and “consistency and
standards”. In addition, the most serious credibility problems identified were within
the areas of “site looks professional”, “make site easy to use and useful”, and “show
the honest and trustworthy people behind the site”. The findings of experiment 2
revealed that the usability and credibility problems found in experiment 1 had been
improved by the proposed design solutions. Furthermore, these improvements might
increase the overall usability and credibility of the target e-government websites,

iii
making the users‟ task performance better within the redesigned e-government
websites. Based on the findings of the experiments, this research developed a set of
usability and credibility guidelines. Each guideline addressed a number of the specific
usability and credibility elements at the detailed level of e-government website design.
These guidelines can be helpful to guide designers to develop more usable and
credible e-government websites.

iv
ACKNOWLEDGEMENTS
I would like to express my deepest gratitude to many people for their constant support,
help, encouragement, without which this achievement would not have been possible.
I am extremely grateful to my supervisors, Dr. Laurence Brooks, Dr. George
Ghinea and Dr. Sherry Chen for their enthusiastic guidance, invaluable advice and
immense patience throughout my PhD research. Thank you for making my stay at the
Brunel University memorable and the experience of my PhD wonderful.
A very special thank you goes to my parents, Jian Long Huang and Lun Hua Liu,
and my wife, Nan Nan Gai and baby daughter Dan Chen Huang for their enormous
love, unwavering support and great encouragement during the years of my PhD study.
I would also like to acknowledge the academic staffs and the colleagues in the School
of Information System, Computing and Mathematics for their valuable assistance and
advice to this research.
Many thanks for all my friends for their continuous help and encouragement during
my PhD study.

v
PUBLICATIONS
The thesis includes the following research papers that have been published as the
results of this study:
Huang, Z., Brooks, L. & Chen, S. (under review) Evaluating credibility of web-based
electronic government in the UK: users‟ perspective, International Journal of Human-
Computer Interaction.
Huang, Z. & Brooks, L. (Accepted) Usability evaluation and redesign of e-
government: users‟ centred approach, 2nd
World Congress on Computer Science and
Information Engineering, Changchun, China.
Huang, Z. & Brooks, L. (Accepted) Evaluating usability of web-based electronic
government: users‟ perspective, HCI International 2011, Orlando, Florida, USA.
Huang, Z. & Brooks, L. (2011) Addressing e-government website usability: a users‟
centred evaluation, 7th International Conference on Web Information Systems and
Technologies, Noordwijkerhout, Netherlands.
Huang, Z. & Brooks, L. (2011) Developing credibility guidelines for e-government
website design: an empirical study, 16th UK Academy for Information System 2011
Conference, Oxford University, Oxford, UK.
Huang, Z., Brooks, L. & Chen, S. (2009) The assessment of credibility of e-
government: users‟ perspective, HCI International 2009, San Diego, CA, USA.

vi
TABLE OF CONTENTS
CHAPTER 1 INTRODUCTION ................................................................................ 1
1.1 Introduction .......................................................................................................... 1
1.2 Research aim and questions ................................................................................. 3
1.3 Research scope ..................................................................................................... 4
1.4 Research methodology ......................................................................................... 6
1.5 Structure of the thesis ........................................................................................... 8
CHAPTER 2 LITERATURE REVIEW .................................................................. 11
2.1 Introduction ........................................................................................................ 11
2.2 E-government ..................................................................................................... 12
2.2.1 E-government development ......................................................................... 13
2.2.2 E-government development in the UK ........................................................ 16
2.2.3 E-government websites ................................................................................ 17
2.3 Usability ............................................................................................................. 19
2.3.1 Usability concept ......................................................................................... 19
2.3.2 Usability effects on e-government ............................................................... 22
2.3.3 Usability effects on e-government users ...................................................... 25
2.4 Credibility ........................................................................................................... 27
2.4.1 Credibility concept ....................................................................................... 27
2.4.2 Credibility effects on e-government ............................................................ 29
2.4.3 Credibility effects on e-government users ................................................... 30
2.5 Usability and credibility combination ................................................................ 32
2.6 Research gaps in relation to usability and credibility in e-government ............. 35
2.7 Summary and conclusion ................................................................................... 37
CHAPTER 3 THEORETICAL BACKGROUND .................................................. 39
3.1 Introduction ........................................................................................................ 39
3.2 Usability and credibility evaluation methods ..................................................... 40
3.2.1 Heuristic evaluation ..................................................................................... 41
3.2.2 Performance measurement ........................................................................... 43
3.3 Nielsen‟s usability heuristics .............................................................................. 44
3.3.1 Extension of usability heuristics .................................................................. 46
3.4 Fogg‟s credibility guidelines .............................................................................. 48
3.4.1 Extension of credibility guidelines .............................................................. 49
3.5 Summary and conclusion ................................................................................... 50
CHAPTER 4 METHODOLOGY ............................................................................. 52
4.1 Introduction ........................................................................................................ 52
4.2 Research strategy, approach and techniques ...................................................... 53
4.2.1 Research strategy: experimental study ........................................................ 54
4.2.2 Research approach: quantitative and qualitative approaches ...................... 55
4.2.3 Research techniques: questionnaire and observation ................................... 57
vii
4.3 Research instruments .......................................................................................... 59
4.3.1 E-government websites ................................................................................ 59
4.3.2 Task sheet .................................................................................................... 61
4.3.3 Usability and credibility questionnaire ........................................................ 64
4.4 Research design .................................................................................................. 72
4.4.1 Variables measurement ................................................................................ 73
4.4.2 Participants................................................................................................... 74
4.4.3 Research environment and materials ........................................................... 75
4.4.4 Experimental procedure ............................................................................... 76
4.4.5 Pilot study .................................................................................................... 76
4.5 Data analysis ....................................................................................................... 77
4.5.1 Selecting the appropriate analysis method................................................... 78
4.5.2 Analysis methods ......................................................................................... 80
4.6 Summary and conclusion ................................................................................... 82
CHAPTER 5 EXPERIMENT 1: USABILITY AND CREDIBILITY
EVALUATION ........................................................................................................... 84
5.1 Introduction ........................................................................................................ 84
5.2 Description of the participants and their responses ............................................ 84
5.2.1 Description of the participants ..................................................................... 85
5.2.2 Description of the participants‟ responses ................................................... 86
5.3 Users‟ perception ................................................................................................ 89
5.3.1 Users‟ perception: quantitative data ............................................................ 89
5.3.1.1 Overall users‟ perception of usability and credibility ........................... 89
5.3.1.2 Users‟ perception of usability and credibility strengths ........................ 91
5.3.1.3 Users‟ perception of usability and credibility problems ..................... 107
5.3.2 Users‟ perception: qualitative data ............................................................ 122
5.4 Users‟ performance .......................................................................................... 130
5.5 Summary and conclusion ................................................................................. 135
CHAPTER 6 PROPOSED DESIGN SOLUTIONS .............................................. 137
6.1 Introduction ...................................................................................................... 137
6.2 Proposed design solutions for London Authority 1 .......................................... 138
6.3 Proposed design solutions for London Authority 2 .......................................... 140
6.4 Proposed design solutions for London Authority 3 .......................................... 144
6.5 Summary and conclusion ................................................................................. 149
CHAPTER 7 EXPERIMENT 2: IMPROVED USABILITY AND
CREDIBILITY ASSESSMENT ............................................................................. 153
7.1 Introduction ...................................................................................................... 153
7.2 Description of the participants and their responses .......................................... 154
7.2.1 Description of the participants ................................................................... 154
7.2.2 Description of the participants‟ responses ................................................. 155
7.3 Users‟ perception .............................................................................................. 159

viii
7.3.1 Users‟ perception: quantitative data .......................................................... 160
7.3.2 Users‟ perception: qualitative data ............................................................ 196
7.3.3 Summary of the results in relation to users‟ perception ............................ 200
7.4 Users‟ performance .......................................................................................... 202
7.5 Summary and conclusion ................................................................................. 207
CHAPTER 8 GENERAL DISCUSSION AND GUIDELINES DEVELOPMENT
.................................................................................................................................... 209
8.1 Introduction ...................................................................................................... 209
8.2 General discussion of the findings from experiments 1 and 2 ......................... 210
8.2.1 Discussion of the results from experiment 1 ............................................. 210
8.2.2 Discussion of the results from experiment 2 ............................................. 212
8.3 Usability and credibility guidelines development ............................................ 214
8.3.1 Usability guidelines development .............................................................. 215
8.3.2 Credibility guidelines development ........................................................... 227
8.4 Practical issues in guidelines implementation .................................................. 236
8.5 Summary and conclusion ................................................................................. 237
CHAPTER 9 CONCLUSIONS ............................................................................... 239
9.1 Introduction ...................................................................................................... 239
9.2 Research summary ........................................................................................... 239
9.3 Review of the research questions ..................................................................... 241
9.3.1 Research question 1 ................................................................................... 242
9.3.2 Research question 2 ................................................................................... 243
9.3.3 Research question 3 ................................................................................... 244
9.3.4 Research question 4 ................................................................................... 245
9.3.5 Research question 5 ................................................................................... 245
9.4 Research contributions ..................................................................................... 246
9.4.1 Contribution to knowledge about usability and credibility ....................... 247
9.4.2 Contribution to knowledge about e-government website development .... 249
9.5 Limitations of the research ............................................................................... 250
9.6 Future research ................................................................................................. 252
REFERENCES ......................................................................................................... 254
APPENDICES .......................................................................................................... 280
Appendix 1a: Task sheet for London Authority 1 in experiment 1 ........................ 280
Appendix 1b: Task sheet for London Authority 2 in experiment 1 ....................... 280
Appendix 1c: Task sheet for London Authority 3 in experiment 1 ........................ 282
Appendix 2a: Task sheet for the redesigned London Authority 1 in experiment 2 283
Appendix 2b: Task sheet for the redesigned London Authority 2 in experiment 2
................................................................................................................................ 284
Appendix 2c: Task sheet for the redesigned London Authority 3 in experiment 2 285
Appendix 3a: Pilot study 1 ..................................................................................... 286
ix
Appendix 3b: Pilot study 2 ..................................................................................... 289
Appendix 4a: Usability and credibility questionnaire for London Authority 1 in
experiment 1 ........................................................................................................... 292
Appendix 4b: Usability and credibility questionnaire for London Authority 2 in
experiment 1 ........................................................................................................... 300
Appendix 4c: Usability and credibility questionnaire for London Authority 3 in
experiment 1 ........................................................................................................... 308
Appendix 5a: Usability and credibility questionnaire for the redesigned London
Authority 1 in experiment 2 ................................................................................... 316
Appendix 5b: Usability and credibility questionnaire for the redesigned London
Authority 2 in experiment 2 ................................................................................... 318
Appendix 5c: Usability and credibility questionnaire for the redesigned London
Authority 3 in experiment 2 ................................................................................... 320
Appendix 6: Consent form ..................................................................................... 322
Appendix 7a: Information sheet for experiment 1 ................................................. 322
Appendix 7b: Information sheet for experiment 2 ................................................. 324
Appendix 8a: Results of users‟ perception of usability and credibility for London
Authority 1 in experiment 1 ................................................................................... 325
Appendix 8b: Results of users‟ perception of usability and credibility for London
Authority 2 in experiment 1 ................................................................................... 330
Appendix 8c: Results of users‟ perception of usability and credibility for London
Authority 3 in experiment 1 ................................................................................... 335
Appendix 9a: Results of users‟ performance with London Authority 1 in experiment
1 .............................................................................................................................. 340
Appendix 9b: Results of users‟ performance with London Authority 2 in
experiment 1 ........................................................................................................... 340
Appendix 9c: Results of users‟ performance with London Authority 3 in experiment
1 .............................................................................................................................. 340
Appendix 10a: Results of users‟ perception of usability and credibility for the
redesigned London Authority 1 in experiment 2 .................................................... 341
Appendix 10b: Results of users‟ perception of usability and credibility for the
redesigned London Authority 2 in experiment 2 .................................................... 343
Appendix 10c: Results of users‟ perception of usability and credibility for the
redesigned London Authority 3 in experiment 2 .................................................... 345
Appendix 11a: Results of users‟ performance with the redesigned London
Authority 1 in experiment 2 ................................................................................... 348
Appendix 11b: Results of users‟ performance with the redesigned London
Authority 2 in experiment 2 ................................................................................... 350
Appendix 11c: Results of users‟ performance with the redesigned London
Authority 3 in experiment 2 ................................................................................... 352
Appendix 12 Performance measurement form ....................................................... 354
Appendix 13a: Results of data distribution in terms of users‟ perception and
performance in experiment 1 .................................................................................. 355

x
Appendix 13b: Results of data distribution in terms of users‟ perception and
performance in experiment 2 .................................................................................. 357
Appendix 14 Overall users‟ perception of usability and credibility difference in the
three London Authorities in experiment 1 ............................................................. 363
Appendix 15 Users‟ performance difference in the three London Authorities in
experiment 1 ........................................................................................................... 364
Appendix 16 Ethics approval letter ........................................................................ 365

xi
LIST OF TABLES
Table 3.1 Nielsen‟s usability heuristics (Nielsen, 1994) .............................................. 45
Table 3.2 Extended usability heuristics ....................................................................... 47
Table 3.3 Fogg‟s credibility guidelines (Fogg, 2002) .................................................. 48
Table 3.4 Extended credibility guidelines .................................................................... 50
Table 4.1 Comparison of functional analysis and user analysis for task identification
...................................................................................................................................... 62
Table 4.2 Criteria identification and classification ...................................................... 66
Table 4.3 Website usability and credibility criteria within the target e-government
websites ........................................................................................................................ 69
Table 4.4 Data analysis used in relevant studies .......................................................... 80
Table 5.1 Distribution of the gender characteristic ...................................................... 85
Table 5.2 Distribution of the age characteristic ........................................................... 85
Table 5.3 Distribution of the Internet use .................................................................... 85
Table 5.4 Usability and credibility responses distribution in London Authority 1 ...... 87
Table 5.5 Usability and credibility responses distribution in London Authority 2 ...... 87
Table 5.6 Usability and credibility responses distribution in London Authority 3 ...... 87
Table 5.7 Performance distribution in London Authority 1 ......................................... 88
Table 5.8 Performance distribution in London Authority 2 ......................................... 88
Table 5.9 Performance distribution in London Authority 3 ......................................... 88
Table 5.10 Overall perception of usability in the target London Authorities .............. 90
Table 5.11 Overall perception of credibility in the target London Authorities ........... 90
Table 5.12 Usability strengths in London Authority 1 ................................................ 93
Table 5.13 Credibility strengths in London Authority 1 .............................................. 94
Table 5.14 Usability strengths in London Authority 2 ................................................ 96
Table 5.15 Credibility strengths in London Authority 2 .............................................. 99
Table 5.16 Usability strengths in London Authority 3 .............................................. 101
Table 5.17 Credibility strengths in London Authority 3 ............................................ 104
Table 5.18 Usability problems in London Authority 1 .............................................. 108
Table 5.19 Credibility problems in London Authority 1 ........................................... 109
Table 5.20 Usability problems in London Authority 2 .............................................. 111
Table 5.21 Credibility problems in London Authority 2 ........................................... 113
Table 5.22 Usability problems in London Authority 3 .............................................. 116
Table 5.23 Credibility problems in London Authority 3 ........................................... 118
Table 5.24 Successful and weak usability features in London Authority 1 ............... 123
Table 5.25 Successful and weak credibility features in London Authority 1 ............ 124
Table 5.26 Successful and weak usability features in London Authority 2 ............... 126
Table 5.27 Successful and weak credibility features in London Authority 2 ............ 127
Table 5.28 Successful and weak usability features in London Authority 3 ............... 129
Table 5.29 Successful and weak credibility features in London Authority 3 ............ 129
Table 5.30 Users‟ performance with London Authority 1 in experiment 1 ............... 131
Table 5.31 Users‟ performance with London Authority 2 in experiment 1 ............... 131
Table 5.32 Users‟ performance with London Authority 3 in experiment 1 ............... 132

xii
Table 5.33 Overall users‟ performance in experiment 1 ............................................ 132
Table 6.1 Usability problems and design solutions within three London Authorities
.................................................................................................................................... 150
Table 6.2 Credibility problems and design solutions within three London Authorities
.................................................................................................................................... 150
Table 7.1 Specific usability and credibility questions responses distribution in London
Authority 1 and the redesigned London Authority 1 ................................................. 156
Table 7.2 Specific usability and credibility questions responses distribution in London
Authority 2 and the redesigned London Authority 2 ................................................. 156
Table 7.3 Specific usability and credibility questions responses distribution in London
Authority 3 and the redesigned London Authority 3 ................................................. 157
Table 7.4 Performance distribution in London Authority 1 and the redesigned London
Authority 1 ................................................................................................................. 158
Table 7.5 Performance distribution in London Authority 2 and the redesigned London
Authority 2 ................................................................................................................. 158
Table 7.6 Performance distribution in London Authority 3 and the redesigned London
Authority 3 ................................................................................................................. 159
Table 7.7 Design solutions regarding the identified usability and credibility problems
for the redesigned London Authority 1 ...................................................................... 160
Table 7.8 Users‟ perception of links colours in experiment 1 and experiment 2....... 161
Table 7.9 Users‟ perception of online help functions in experiment 1 and experiment 2
.................................................................................................................................... 162
Table 7.10 Users‟ perception of the switch between online help and their current work
in experiment 1 and experiment 2 .............................................................................. 164
Table 7.11 Users‟ perception of colour consistency in experiment 1 and experiment 2
.................................................................................................................................... 165
Table 7.12 Design solutions regarding the identified usability and credibility problems
for the redesigned London Authority 2 ...................................................................... 167
Table 7.13 Users‟ perception of home page options presentation in experiment 1 and
experiment 2 ............................................................................................................... 167
Table 7.14 Users‟ perception of link colours in experiment 1 and experiment 2 ...... 169
Table 7.15 Users‟ perception of task progress in experiment 1 and experiment 2 .... 170
Table 7.16 Users‟ perception of visited links recognition in experiment 1 and
experiment 2 ............................................................................................................... 171
Table 7.17 Users‟ perception of jumping stages in the process in experiment 1 and
experiment 2 ............................................................................................................... 173
Table 7.18 Users‟ perception of level of relevance arrangement of search results in
experiment 1 and experiment 2 .................................................................................. 174
Table 7.19 Users‟ perception of layout consistency in experiment 1 and experiment 2
.................................................................................................................................... 176
Table 7.20 Users‟ perception of security message in experiment 1 and experiment 2
.................................................................................................................................... 177
Table 7.21 Design solutions regarding the identified usability and credibility problems
for the redesigned London Authority 3 ...................................................................... 178

xiii
Table 7.22 Users‟ perception of link colours in experiment 1 and experiment 2 ...... 179
Table 7.23 Users‟ perception of the order of categories arrangement in experiment 1
and experiment 2 ........................................................................................................ 181
Table 7.24 Users‟ perception of visited links in experiment 1 and experiment 2 ...... 182
Table 7.25 Users‟ perception of the number of options presented on the site in
experiment 1 and experiment 2 .................................................................................. 184
Table 7.26 Users‟ perception of detailed contact information presentation in
experiment 1 and experiment 2 .................................................................................. 185
Table 7.27 Users‟ perception of the site‟s credentials in experiment 1 and experiment
2 .................................................................................................................................. 187
Table 7.28 Users‟ perception of quick access to council information in experiment 1
and experiment 2 ........................................................................................................ 188
Table 7.29 Users‟ perception of security message display in experiment 1 and
experiment 2 ............................................................................................................... 190
Table 7.30 Users‟ perception of task progress indication in experiment 1 and
experiment 2 ............................................................................................................... 191
Table 7.31 Users‟ perception of site update in experiment 1 and experiment 2 ........ 193
Table 7.32 Users‟ perception of a sign-in option in experiment 1 and experiment 2 194
Table 7.33 Users‟ positive and negative comments on the proposed design solutions
for the redesigned London Authority 1 ...................................................................... 197
Table 7.34 Users‟ positive and negative comments on the proposed design solutions
for the redesigned London Authority 2 ...................................................................... 198
Table 7.35 Users‟ positive and negative comments on the proposed design solutions
for the redesigned London Authority 3 ...................................................................... 200
Table 7.36 Users‟ performance with the redesigned London Authority 1 ................. 203
Table 7.37 Users‟ performance with the redesigned London Authority 2 ................. 205
Table 7.38 Users‟ performance with the redesigned London Authority 3 ................. 206
Table 8.1 Summary of usability guidelines ............................................................... 224
Table 8.2 Summary of credibility guidelines ............................................................. 234
Table 9.1 Overview of research questions ................................................................. 241
xiv
LIST OF FIGURES
Figure 4.1 Research stages diagram ............................................................................. 53
Figure 4.2 Experimental room in the study .................................................................. 75
Figure 4.3 Deciding which statistical test to use (Foster, 2001; p.21) ......................... 79
Figure 5.1 Easy forward and backward movements within London Authority 1 ........ 93
Figure 5.2 “A-Z” quick service category provision in London Authority 1 ................ 94
Figure 5.3 Personal services protection by password in London Authority 1 ............. 96
Figure 5.4 Images with context in London Authority 2 ............................................... 97
Figure 5.5 Easy forward and backward movements in London Authority 2 ............... 98
Figure 5.6 Key information location in London Authority 3 ..................................... 102
Figure 5.7 Changing particular data in previous section without retyping all data in
London Authority 3 .................................................................................................... 103
Figure 5.8 Easy forward and backward movements in London Authority 3 ............. 103
Figure 5.9 Contact option indication in London Authority 3 .................................... 105
Figure 5.10 Links with many different colours in London Authority 1 .................... 108
Figure 5.11 Information presentation without consistent colours in London Authority
1 .................................................................................................................................. 110
Figure 5.12 Ambiguous and repeated options in London Authority 2 ...................... 111
Figure 5.13 Lack of task progress in London Authority 2 ......................................... 112
Figure 5.14 Search results without level of relevance arrangement in London
Authority 2 ................................................................................................................. 114
Figure 5.15 Information presentation without consistent layout in London Authority 2
.................................................................................................................................... 114
Figure 5.16 Links with many different colours in London Authority 3 .................... 116
Figure 5.17 Category options arrangement without a logical order in London
Authority 3 ................................................................................................................. 117
Figure 5.18 Breadth and depth balance in information arrangement in London
Authority 3 ................................................................................................................. 118
Figure 5.19 Contact presentation without department organisation in London
Authority 3 ................................................................................................................. 119
Figure 5.20 Lack of message to indicate task progress in London Authority 3......... 121
Figure 7.1 Usability problem 1 in London Authority 1 and the design solution in the
redesigned London Authority 1 ................................................................................. 162
Figure 7.2 Usability problem 2 in the London Authority 1 and the design solution in
the redesigned London Authority 1 ........................................................................... 163
Figure 7.3 Usability problem 3 in London Authority 1 and the design solution in the
redesigned London Authority 1 ................................................................................. 165
Figure 7.4 Credibility problem 1 in London Authority and the design solution in the
redesigned London Authority 1 ................................................................................. 166
Figure 7.5 Usability problem 1 in London Authority 2 and the design solution in the
redesigned London Authority 2 ................................................................................. 168

xv
Figure 7.6 Usability problem 2 in London Authority 2 and the design solution in the
redesigned London Authority 2 ................................................................................. 170
Figure 7.7 Usability problem 3 in London Authority 2 and the design solution in the
redesigned London Authority 2 ................................................................................. 171
Figure 7.8 Usability problem 4 in London Authority 2 and the design solution in the
redesigned London Authority 2 ................................................................................. 172
Figure 7.9 Usability problem 5 in London Authority 2 and the design solution in the
redesigned London Authority 2 ................................................................................. 174
Figure 7.10 Credibility problem 1 in London Authority 2 and the design solution in
the redesigned London Authority 2 ........................................................................... 175
Figure 7.11 Credibility problem 2 in London Authority 2 and the design solution in
the redesigned London Authority 2 ........................................................................... 177
Figure 7.12 Credibility problem 3 in London Authority 2 and the design solution in
the redesigned London Authority 2 ........................................................................... 178
Figure 7.13 Usability problem 1 in London Authority 3 and the design solution in the
redesigned London Authority 3 ................................................................................. 180
Figure 7.14 Usability problem 2 in London Authority 3 and the design solution in the
redesigned London Authority 3 ................................................................................. 182
Figure 7.15 Usability problem 3 in London Authority 3 and the design solution in the
redesigned London Authority 3 ................................................................................. 183
Figure 7.16 Usability problem 4 in London Authority 3 and the design solution in the
redesigned London Authority 3 ................................................................................. 185
Figure 7.17 Credibility problem 1 in London Authority 3 and the design solution in
the redesigned London Authority 3 ........................................................................... 186
Figure 7.18 Credibility problem 2 in London Authority 3 and the design solution in
the redesigned London Authority 3 ........................................................................... 188
Figure 7.19 Credibility problem 3 in London Authority 3 and the design solution in
the redesigned London Authority 3 ........................................................................... 189
Figure 7.20 Credibility problem 4 in London Authority 3 and the design solution in
the redesigned London Authority 3 ........................................................................... 191
Figure 7.21 Credibility problem 5 in London Authority 3 and the design solution in
the redesigned London Authority 3 ........................................................................... 192
Figure 7.22 Credibility problem 6 in London Authority 3 and the design solution in
the redesigned London Authority 3 ........................................................................... 194
Figure 7.23 Credibility problem 7 in London Authority 3 and the design solution in
the redesigned London Authority 3 ........................................................................... 195

Usability and credibility evaluation of electronic governments: users‟ perspective Zhao Huang
Chapter 1 Introduction 1
CHAPTER 1
INTRODUCTION
1.1 Introduction
The power of the Internet and web technology has been clearly demonstrated in the
private sectors, such as e-commerce. Governments worldwide have caught on to this
revolution and made significant efforts to develop electronic government (e-
government) in public sectors. More recently, among the 192 member countries of the
United Nations, nearly 98% of countries have built their web-based e-government
systems (UN Public Administration Programme, 2010). Such a rapid development
arises from the way that e-government has the potential to change the working
environment of the traditional government to enhance access and delivery of
government services. In such an environment, users have increasingly been able to
interact with e-government by searching for government information and conducting
government services without time and space limitations. Nowadays, there are a
significant number of e-governments operating at national and local levels that are
accessible via the Internet and provide a variety of online information and services
(Gil-Garcia and Martinez-Moyano, 2007).
However, such a huge amount of information and services require quality control
(Klischewski and Scholl, 2006). In particular, online information undergoes a process
that enables everyone to edit and publish information via the Internet, which increases
the possibility that information published is inaccurate, biased and misleading
(Flanagin and Metzger, 2000). Thus, users‟ acceptance and utilization of information
and services are largely dependent on source authority, accuracy and reliability. In
this respect, e-governments provide government information and services, which need
to indicate the trustworthiness of the governments behind them. Such trust can be
significantly influenced by whether e-governments have demonstrated their credibility
(Bélanger and Carter, 2008; Johnson and Kaye, 2009; Schmidt et al., 2007). As
indicated by Fogg and Tseng (1999a), credibility refers to users‟ believability. The
Usability and credibility evaluation of electronic governments: users‟ perspective Zhao Huang
Chapter 1 Introduction 2
strong users‟ belief that e-government provides reliable information generates greater
trust in government (Welch and Hinnant, 2003). Therefore, with higher credibility,
users may change their attitude (Wathen and Burkell, 2002), overcome uncertainty in
their use of e-government services and enhance their interaction with e-governments.
In this context, credibility is emerging as an important factor in determining e-
government success (Sidi and Junaini, 2006) and a number of studies have been
carried out to investigate credibility and trust of e-government. However, the results
indicate that usability difficulties have a significant impact on credibility and users‟
trust of e-government (Carter and Bélanger, 2005; Huang et al., 2009; Weerakkody
and Choudrie, 2005). It can be argued that there is a close interrelationship between
credibility and usability (Fogg et al., 2001; Garcia et al., 2005; Nielsen, 2000).
Usability generally refers to ease of use and usefulness (Bevan, 1995). It is typically
used to determine how easy and efficient it is for users to perform tasks by using the
system. In many e-government studies, usability has been seen as the underlying
catalyst for e-government adoption (Barnes and Vidgen, 2004; Kumar et al., 2007;
Thompson et al., 2003). E-government with higher usability can make better civil
service performance, increase users‟ satisfaction, and promote users‟ engagement with
e-government services. Thus, a number of studies have been conducted to examine
the usability in relation to e-government service quality (Gant and Gant, 2002;
Magoutas et al., 2010; Wang et al., 2005), to investigate the functionality of e-
government website (Donker-Kuijer et al., 2010; Garcia et al., 2005; Kossak et al.,
2001) and to explore the effects of usability on users‟ interaction with e-government
(Anthopoulos et al., 2006; Barnes, 2004; Magoutas and Mentzas, 2010). The findings
suggest that usability is also a key factor influencing e-government development,
which need to be explored. Without addressing usability in e-government
development, e-government will remain the challenging target of interacting with
users.
In this vein, both usability and credibility have been found to be the important factors
in determining e-government success, which need to be reflected to users through e-
government websites. In other words, usability and credibility need to be importantly
considered together and addressed on e-government websites. Therefore, usability and
Usability and credibility evaluation of electronic governments: users‟ perspective Zhao Huang
Chapter 1 Introduction 3
credibility investigation of e-government websites has become paramount. By doing
so, e-government can be accepted and used by a wider range of users. However,
current research has not paid enough attention to inspecting usability and credibility
of e-government. In addition, usability and credibility issues are not well understood
at the detailed level of e-government website design, neither are the effects of users‟
interaction with e-government. As suggested by Huang et al. (2009), more research is
needed in the aspect of usability and credibility evaluation of e-governments,
measuring users‟ task performance with e-government websites, identifying existing
usability and credibility problems and offering specific prescriptions for further
usability and credibility improvement of e-government.
1.2 Research aim and questions
Given that usability and credibility have a close interrelation and are becoming key
factors influencing users‟ interaction and engagement with e-government, it is
necessary to evaluate usability and credibility of current e-governments to provide
sound advice for designers to develop more usable and credible e-governments. In
addition, it is important to identify what e-government features can cause users to
have more concerns about usability and credibility, which is beneficial for designers
to better understand users and their usability and credibility needs. It is also important
for designers to understand users‟ interaction with e-governments when they perform
a set of tasks within e-governments. Therefore, there is a need to carry out the
usability and credibility evaluation of current e-governments, which not only provides
a deep insight into e-governments usability and credibility, but also indicates the level
of users‟ interaction with e-governments evaluated.
Thus, this research aims to evaluate usability and credibility of current e-governments,
focusing on the specific e-government websites in the UK. The research questions are
defined as:
RQ1: What are the existing usability problems in current e-government
websites?

Usability and credibility evaluation of electronic governments: users‟ perspective Zhao Huang
Chapter 1 Introduction 4
RQ2: What are the existing credibility problems in current e-government
websites?
In addition, in order to fulfil a thorough usability and credibility evaluation study,
according to the usability and credibility problems identified, this research provides
the proposed design solutions and examines the effects of these proposed design
solutions on each target e-government websites. The following research questions
frame this part of the evaluation:
RQ3: What are the effects of the proposed usability design solutions on the
usability problems on each target e-government website?
RQ4: What are the effects of the proposed credibility design solutions on the
credibility problems on each target e-government website?
RQ5: What are the effects of the proposed design solutions on users‟
interaction with each target e-government website?
1.3 Research scope
Usability and credibility have been found to be the important factors in determining e-
government success, which needs to be reflected to users through e-government
websites. In this context, an e-government website serves as a window to
communicate with users. It is representative of an e-government and provides both
sides of users and government agencies with a single point of contact for online
access to government information and services (Gant and Gant, 2002). A usable and
credible e-government website reflects e-government usability and credibility. In
other words, usability and credibility need to also be importantly addressed on e-
government websites. Without addressing usability and credibility issues in sufficient
detail to inform e-government website design, e-government will not be fully adopted
by users. In addition, developing e-government with an effective website has a

Usability and credibility evaluation of electronic governments: users‟ perspective Zhao Huang
Chapter 1 Introduction 5
significant impact on users‟ attitudes and their use. Accordingly, there is a need to
conduct usability and credibility evaluation of e-government websites in order to
increase e-government quality and promote users‟ acceptance of e-government.
However, e-government is used by diverse users with a variety of backgrounds, such
as knowledge, skills and experience, which leads to various requirements of usability
and credibility from e-government. Such different users‟ requirements raise the
challenge of identifying usability and credibility by designers when developing more
usable and credible e-government. In response to this challenge, user involvement
indicates the user viewpoint, which is helpful to understand users and their usability
and credibility needs. Furthermore, it can directly identify what e-government features
can cause users to have most concerns about usability and credibility. Hence, there
needs to be more attention directed towards users‟ assessment of usability and
credibility of e-government, because such evaluation can provide concrete
prescriptions to develop more user-centred e-governments that may support users
achieving the desired services outcomes and so generate greater users‟ engagement.
Therefore, this study attempts to evaluate usability and credibility of current e-
governments from users‟ perspective, focusing on the specific e-government websites
in the UK. Given that the website is the interface for a specific e-government, each
website can therefore be seen as a main channel for demonstrating its usability and
credibility. Among the various evaluation methods, the primary method used in this
study is the heuristic evaluation, as its usefulness has been validated by a number of
studies. The heuristic evaluation is conducted based on users‟ perception of the sets of
usability heuristics and credibility guidelines to implement a thorough and in-depth
assessment of e-governments. In addition, users‟ performance is also measured in
order to reveal the level of users‟ interaction with e-government websites when they
perform a set of practical tasks. By doing so, it can provide a more comprehensive
evaluation, which not only provides an insight into e-government websites usability
and credibility, but also indicates users‟ task performance within the e-government
websites evaluated.

Usability and credibility evaluation of electronic governments: users‟ perspective Zhao Huang
Chapter 1 Introduction 6
The usability and credibility evaluation of e-governments is achieved through two
linked experimental studies. Experiment 1 aims to evaluate the usability and
credibility of current e-government websites. This experiment focuses on the usability
and credibility evaluation in terms of the overall usability and credibility assessment,
usability and credibility strengths and problems identification, and the measurement
of users‟ task performance with the target e-government websites. In particular,
according to the usability and credibility problems identified in experiment 1, the
proposed design solutions are provided and designed for each target e-government
website in order to improve their usability and credibility. Experiment 2 attempts to
examine the effects of the proposed design solutions on the target e-government
websites. It focuses on the usability and credibility evaluation in terms of the effects
of the proposed design solutions on the usability and credibility problems in each
redesigned e-government website, and the level of users‟ interaction with these
redesigned e-government websites. Based on the findings of the experiments, this
research has developed a set of usability and credibility guidelines, addressing a
number of the specific usability and credibility elements at the detailed level of e-
government website design. To address their validity, the guidelines have been also
reviewed by professionals who are working in a local e-government. The value of this
study contributes to two areas of knowledge, which are knowledge about usability and
credibility, and knowledge about e-government website development.
1.4 Research methodology
To conduct the research, this study applies a quasi-experimental study as the research
method, which combines both quantitative and qualitative approaches to collect data
through the questionnaire and directed observation research techniques.
Experimental study is typically used to measure “cause and effect” relationship under
controlled conditions and environments (Leedy, 1997). Within an experimental study,
one situation can be altered by bringing an extraneous variable into it. Each situation
can be re-evaluated after the intervening alteration. The changes in re-evaluation can
be caused by the extraneous variable. This feature is particularly suitable for the

Usability and credibility evaluation of electronic governments: users‟ perspective Zhao Huang
Chapter 1 Introduction 7
purpose of this study because this study aims to evaluate the usability and credibility
of the e-government websites, identifying the usability and credibility problems.
Based on the problems found, the study provides the proposed design solutions. Then,
it attempts to re-evaluate the usability and credibility problems under the controlled
conditions in order to indicate whether or not the proposed design solutions cause the
problems to be solved. Generally, experimental methods are sorted into the true
experiment, the quasi-experiment and the ex post facto experiment (McQueen and
Knussen, 2002). The quasi-experimental study is considered as the appropriate
research method since the non-random sample is drawn from the population. In this
study, the participants are allocated and balanced in different treatment groups
according to the participants‟ demographic information, such as gender and age. In
addition, the researcher cannot dictate all circumstances and needs to take the role of
observing research event (Denscombe, 2007).
To carry out the evaluation, both quantitative and qualitative approaches are applied
to the study. As indicated before, the evaluation consists of the heuristic evaluation
and performance measurement. The former is based on users‟ perception to
implement a thorough and in-depth assessment of the e-government websites, while
the latter applies a set of performance criteria to measure users‟ task performance in
order to indicate the level of users‟ interaction with the e-government websites
evaluated. The mixed research approach with emphasis on quantitative approach can
provide a broad perspective to address the evaluation purposes. In addition, the
advantages of the mixed approach may help to gain the more comprehensive and
richer evaluation results.
To collect research data, the questionnaire and observation research techniques are
employed in the study. These research techniques can be used to approach the
research questions from different aspects. More specifically, the questionnaire aims to
capture users‟ perception to assess the usability and credibility of the e-government
websites. The observation is used to measure users‟ task performance in order to
indicate the level of users‟ interaction with the e-government websites.

Usability and credibility evaluation of electronic governments: users‟ perspective Zhao Huang
Chapter 1 Introduction 8
1.5 Structure of the thesis
The remainder of this thesis is structured as follows:
Chapter 2 reviews existing literature to demonstrate the importance of usability and
credibility to e-government development. This chapter starts with the provision of
general background of e-government. Then, it examines relevant studies to indicate
that usability and credibility are two key factors in determining e-government
development. After that, the interrelationship between usability and credibility has
been explored. This is followed by the research gaps identification and the research
questions development. Finally, it indicates that there is a need to conduct usability
and credibility evaluation of e-government websites in order to develop more user-
centred e-governments.
Chapter 3 identifies the evaluation methods used in the study. Two evaluation
methods consist of the evaluation, which are heuristic evaluation and performance
measurement. To conduct heuristic evaluation, Nielsen‟s set of usability heuristics
and Fogg‟s set of credibility guidelines have been used as a starting point. However,
in order to meet the particular needs of e-government, these existing Nielsen‟s
heuristics and Fogg‟s credibility guidelines are extended. In addition, a set of
performance criteria has also been identified in order to implement performance
measurement.
Chapter 4 indicates that the experimental study is considered as the appropriate
research strategy employed in this study. To conduct the study, a mixed research
approach with emphasis on the quantitative approach is implemented. Both
quantitative and qualitative data are collected through the questionnaire and
observation research techniques. In addition, the descriptions of the research
instruments and research design of two experiments are provided in this chapter.
These include e-government websites selection, the task sheet design, the usability
and credibility evaluation questionnaire design, variable measurement, participants,
research environment and material, experimental procedure, pilot study and data
analysis techniques employed for the study.

Usability and credibility evaluation of electronic governments: users‟ perspective Zhao Huang
Chapter 1 Introduction 9
Chapter 5 presents the results of experiment 1. It starts with the descriptions of the
participants and their responses in order to indicate that the distribution of the
participants and their responses is unbiased and follows a normal distribution
respectively. Then, the results of the usability and credibility assessment of each
target e-government website are reported. This assessment covers the overall usability
and credibility evaluation, the strengths of usability and credibility detection, and the
usability and credibility problems identification. After that, the results of users‟
performance with each target e-government website are presented.
Chapter 6 is based on the analysis in Chapter 5 with the purpose of solving the
usability and credibility problems detected from the target e-government websites. It
provides the detailed proposed design solutions for each usability and credibility
problem found in experiment 1 and designs these proposed solutions on each target e-
government website.
Chapter 7 reports the findings of experiment 2. It follows a similar pattern used in
Chapter 5, which begins with the descriptions of the participants and their responses
in order to indicate that the distribution of the participants and their responses in
experiment 2 is unbiased and follows a normal distribution respectively. Then, it
describes the results in terms of users‟ perception and users‟ performance. Users‟
perception is captured by both quantitative and qualitative data through the closed and
open-ended questions of the questionnaire to indicate the effects of the proposed
design solutions on the usability and credibility problems. Users‟ performance is
measured by observation in order to reveal the level of users‟ interaction with the
redesigned e-government websites.
Chapter 8 describes a general discussion of the findings from both experiment 1 and
experiment 2. Based on the analysis of the findings from the study, a set of usability
guidelines and a set of credibility guidelines are developed to guide designers to
address usability and credibility in relation to e-government website design.
Usability and credibility evaluation of electronic governments: users‟ perspective Zhao Huang
Chapter 1 Introduction 10
Chapter 9 provides the conclusion of the study, which consists of the review of the
research questions, contributions of this study, limitations of the research and further
suggestions for future research work.

Usability and credibility evaluation of electronic governments: users‟ perspective Zhao Huang
Chapter 2 Literature review 11
CHAPTER 2
LITERATURE REVIEW
2.1 Introduction
Following the Internet „revolution‟ and the widespread adoption of web technology,
web-based online systems have been increasingly developed in our daily life. In
particular, e-government is becoming the important part of the revolution applied in
the public sector. More recently, there are many e-governments operating at national
and local levels that are now accessible via the Internet and offer a variety of
information and services available online (Gil-García, 2005). Such a rapid growth
arises from the way that e-government has the potential to change the working
environment of the traditional government to enhance access and delivery of
government services. In this environment, users can search for government
information and interact with government services without time and space limitations.
Therefore, e-government nowadays has become an important channel to connect
government with users (Homburg, 2008).
A number of studies that investigate users‟ interaction with e-government indicate that
improving e-government‟s service in terms of trustworthiness (Bélanger and Carter,
2008; Tolbert and Mossberger, 2003; Warkentin et al., 2002), information reliability
(Welch and Hinnant, 2003), system credibility (Huang et al., 2009), site ease of use
(Kossak et al., 2001), and interface friendliness (Baker, 2009; Garcia et al., 2005) can
obtain a large number of benefits for the e-government development, especially
generating greater users participation. In this aspect, usability and credibility are
emerging as the key factors in influencing users‟ engagement with e-government
(Choudrie and Ghinea, 2005; Bélanger and Carter, 2008) and determining e-
government success (Barnes and Vidgen, 2004; Sidi and Junaini, 2006). However,
existing research has not paid enough attention to investigating usability and
credibility of current e-governments. With the rapid development of e-government, in
order to achieve that e-government can be used and accepted by a wider range of

Usability and credibility evaluation of electronic governments: users‟ perspective Zhao Huang
Chapter 2 Literature review 12
users, it is important to consider usability and credibility of e-government. In addition,
an e-government website serves as a window to communicate with users. It is
representative of an e-government and provides both users and government agencies
with a single point of contact for online access to government information and
services (Gant and Gant, 2002). A usable and credible e-government website reflects
e-government usability and credibility. In other words, usability and credibility need
to be also importantly addressed on e-government websites. This becomes an
important issue to be focused on in this research. This chapter therefore reviews
existing literature to scope the research areas and examines relevant studies to
demonstrate the importance of usability and credibility to e-government development.
Chapter 2 is structured as follows. Section 2.2 reviews relevant literature to provide
general background to e-government. This is followed by examining the effects of
usability and credibility on e-government and e-government users in section 2.3 and
2.4 respectively. Section 2.5 describes the interrelationship between usability and
credibility. Section 2.6 identifies the research gaps from previous studies and
indicates the research questions. Finally, a brief summary and conclusion is presented
in section 2.7.
2.2 E-government
With the rapid development of the Internet and web technology, users have
increasingly been able to interact with web-based online systems. Among a variety of
web-based online systems, e-government is becoming part of the revolution applied in
the public sector. Nowadays, e-government makes significant attempts to deliver their
services to citizens, business and other government agencies via the Internet
(Tambouris et al., 2001). There are many varying definitions of e-government. Some
explain e-government from an organisational focus (e.g. Heeks, 2002), some define it
from a functional focus (e.g. Homburg, 2008), some classify it from a governmental
focus (e.g. Wamukoya, 2000; OECD, 2003), and some define e-government from a
business process focus (e.g. Holmes, 2001). These definitions adopted by individuals
or organisations have slightly different, because the priorities and focuses of e-
government have shifted. In this study, for the purpose of addressing a dynamic area

Usability and credibility evaluation of electronic governments: users‟ perspective Zhao Huang
Chapter 2 Literature review 13
of e-government and its application for the general public, e-government is therefore
defined as the use of the Internet, especially web technology as a tool to deliver
government information and services to users (Muir and Oppenheim, 2002).
E-government initiatives are evolving from the national to the local level (West, 2005).
Generally, national governments have started adding technology and moved toward
more sophisticated e-government, and local government have followed (Gil-Garcia
and Martinez-Moyano, 2007). All e-government services within the national and local
levels can be conducted via information presentation, interaction, transaction and
integration (Layne and Lee, 2001; Yang and Paul, 2005). The benefits of e-
government can increase service delivery (Mutula and Wamukoya, 2007);
transparency (Ciborra, 2005); civil service performance (Kumar et al., 2007); policy
effectiveness (OECD, 2003); strengthen citizen trust (Eyob, 2004) and achieve big
cost savings (Culbertson, 2002).
2.2.1 E-government development
E-government development is strongly driven by both traditional government
requirements and information technology evolvement (Strejcek and Theil, 2002;
Torres et al., 2005). Regarding traditional government, organisation is complex and a
mammoth bureaucracy (Cairns et al., 2004). It makes access to information difficult
and makes provision of services cumbersome and frustrating for users (Cairns et al.,
2004). In particular, there has been much cynicism of government services, which
leads to low public participation and trust in government (Eyob, 2004). Users expect
to establish a new approach to achieve a better government, which enables easier
access, richer information resources, higher quality services and enjoyable
participation (OECD, 2003). As such, government is required to change the way of
administering and processing official business (Yang et al., 2005), delivering
government services (Barnes and Vidgen, 2004), and generating greater efficiency for
all participation (Kumar et al., 2007). In response to these requirements, e-government
becomes an outstanding solution (Kelly and Tastle, 2004; Metaxiotis and Psarras,
2004; OECD, 2003).

Usability and credibility evaluation of electronic governments: users‟ perspective Zhao Huang
Chapter 2 Literature review 14
In support of e-government initiatives, traditional government has released a number
of information policies and strategic plans, such as E-government Strategic
Framework; Security e-Government Strategy Framework Policy; E-government
Intermediaries Policy in the UK (Cabinet Office, 2000), the European Committee‟s
eEurope 2005 Action Plan, the US Federal Government‟s e-Government Action Plan,
the German Federal Government‟s BundOnline (Anthopoulos et al., 2006), which are
helpful to guide government from making information-based plan to building e-
government system, from implementing e-government application to improving e-
government functionality (Yang et al., 2005). Furthermore, traditional government
provides large financial support for e-government projects development. For example,
the government of Canada allocated $880 million from 2000 to 2005 to support e-
government projects (Kumar et al., 2007). In Singapore, the government demonstrated
strong economic support to ensure e-government program objectives, which
earmarked $932 million over three year (2000 to 2003) (Ke and Wei, 2004). The U.S.
government spent about $6.2 billion to support e-government development in 2005
(Gil-Garcia, 2006).
Moreover, the rise of information technology accelerates e-government development.
Initially, the use of technology in government organisation is based on personal
computers, which aims at improving the managerial effectiveness of public
administration and increasing government productivity (Yildiz, 2007). After a short
time, the automation of mass transaction is introduced for financial transaction
throughout mainframe computers in government (Schelin, 2003), which speeds up
government business processes. However, it remains an isolated environment, where
government agencies operate the computer system independently from each other
(Bouwman et al., 2005).
In the 1980s, a variety of efforts relating to internal communication were added to the
government information technology applications. These included development with
the purposes of supporting information sharing management and collaboration, for
example expert systems (ES) (Perru, 2004), electronic document interchange systems
(EDI), and geographic information systems (GIS) (Cinderby et al., 2002). With the
diffusion of personal computers in the early 1980s, each administrator was allocated a
PC with a personal information system. Such evolvement entered a new stage of

Usability and credibility evaluation of electronic governments: users‟ perspective Zhao Huang
Chapter 2 Literature review 15
information technology use in governments, in which the first step towards front and
back office function was established. This front and back office function becomes
fundamental to changing government “modus operandi” (Bellamy and Taylor, 1998).
However, the main technology issue indicates that technology management is
decentralised in government agencies. At this point, information technologies need to
be centralised and integrated to the core functions in governments (Yildiz, 2007).
In the 1990s, the emergence of the Internet can be seen as the underlying catalyst for
e-government development. In the first few years, the Intranet was widely applied to
government since it provided the networking infrastructure that connects numerous
government computers together. However, this managerial information technology
primarily focuses on the internal side of government (Yildiz, 2007). In support of the
external communication, electronic mail systems (e-mail) were introduced in many
departments and governments. Although it encourages external communication, when
users send questions or provide comments through e-mail, this still hardly influences
the internal government and its communication processes. One of the major reasons
for this lack of effect is email as a one-way contact (Bouwman et al., 2005).
With the advent of web technology and the availability of broadband services, the
way that users contact government has been significantly changed. In particular, the
web develops the service system that can be universally accessed through a web
browser (Mutula and Wamukoya, 2007). In this way, the web offers a means of
accessing and sharing information on the Internet for the general public. Since such
advantages have become apparent, governments worldwide have caught onto this
revolution and shown rapid development of web-based e-government in the public
sector. For example, the number of e-government websites worldwide has increased
from 142 in 1995 to more than 50,000 in 2001 (Kumar et al., 2007). The number of
worldwide e-government programs has increased from 3 in 1996 to more than 500
national initiatives in 2000 (Al-Kibsi et al., 2001). Today, among the 192 member
countries of the United Nations, nearly 98% of countries have built their web-based e-
government systems (UN Public Administration Programme, 2010).

Usability and credibility evaluation of electronic governments: users‟ perspective Zhao Huang
Chapter 2 Literature review 16
2.2.2 E-government development in the UK
In the UK, e-government is not only a matter of choice, but also a necessary strategy
for a country that wants to enter the 21st century as a competitive nation in the world.
The government at all levels implements information communication technologies
(ICT) to transform the structure, operation and the culture of traditional government
(Beynon-Davies and Williams, 2003). The central government employs a number of
activities to promote e-government development. For example, the national strategic
scheme of “Joined-up government” uses information technology tools to provide
information, engage in two-way interaction, establish and disseminate knowledge to a
network of stakeholders (Kolsaker and Lee-Kelley, 2006). The “Modernising
Government” project aims to make 100% of government services available online in
2005 (Cabinet Office, 2000). The “Implementing Electronic Government” program
requires e-government applications across all the local level of government in the UK
(Beaumont et al., 2005). By implementing these activities and programs, e-
government has been encouraged to develop nationwide and evolved from national
level to local level in the UK.
On the other hand, based on the e-government regulations and goals set by the central
government, local authorities in the UK have reformed network and developed their
own structure, and services delivery systems (Beynon-Daviesa and Williams, 2003).
For example, local authorities across Surrey County develop a joined e-government
project, with the constitution of the Surrey e-Partnership, which involves 47
organisations from local authorities, health services, higher education and crime and
disorder to deliver government services to users. Within the development, the service
delivery method in local governments was moved from a technology-centred
approach to a governance-centred approach (Medaglia, 2006).
These e-government developments draw much attention from academic research.
Many researchers propose the progressive stages of e-government evolution and
attempt to use these stages to identify the current e-government status. These stages
mainly involve information presentation; interaction; transaction and integration. (e.g.
Deloitte and Touche, 2001; Hiller and Bélanger, 2001; Layne and Lee; 2001; Moon,
2002; Murphy, 2005; Siau and Long, 2005). Daniel and Ward (2006) reported that the

Usability and credibility evaluation of electronic governments: users‟ perspective Zhao Huang
Chapter 2 Literature review 17
UK e-government have already built the infrastructure and offered a range of services.
Users can easily access e-government and engage in their service transaction through
a single portal. In particular, the portals provide an environment in which information
can be extracted from existing applications and shared with different departments.
Such provision indicates integrated services delivery. However, the challenge of
“joined-up” services exists. As such, they suggest that the UK e-government is in the
stages between transaction and integration. Furthermore, Dhillon et al. (2008) defined
four stages: access and connectivity, services provision, transformation and next
generation, and used them to observe e-government development in the UK. The
research shows that although e-government moves to a transformational stage, the
business process barriers exist, which still follows the inherent processes. In addition,
the use of information systems and technology is inefficient, which causes barriers in
collaboration between government agencies. As such, there is much scope for UK e-
government further development in order to achieve the fourth or final stage, in which
government business processes, services and systems can be entirely integrated at
different levels and from different departments.
Therefore, these e-government studies imply that there is a rapid development of e-
government in the UK. The UK governments at both national and local levels can be
accessed through the Internet (Weerakkody and Choudrie, 2005), and make a variety
of government information and services available online (Daniel and Ward, 2006). In
addition, it provides users with two-way interaction with government throughout e-
government websites (Senyucel, 2005).
2.2.3 E-government websites
Given that government information and services are delivered through e-government
websites, these websites can therefore be seen as the interface of the e-government,
serving as a window for users to communicate with government (Gant and Gant, 2002;
Weerakkody and Choudrie, 2005). The website is representative of an e-government
and provides both sides of users and government agencies with a single point of
contact for online access to government information and services (Thomas and Streib,
2003; Yang and Paul, 2005). In this respect, e-government websites play a central role

Usability and credibility evaluation of electronic governments: users‟ perspective Zhao Huang
Chapter 2 Literature review 18
in e-government development. Alongside e-government development, e-government
website functionality has significantly evolved. Initially, the website is simply used to
classify and publish government information. However, the website matures quickly
and increases functionality by adding advanced search facility (Horrocks and
Hambley, 1998), personalised website content (Mosse and Whitley, 2009), user
control (Barnes, 2004; Kossak et al., 2001) and online service transaction (Daniel and
Ward, 2006). In recent years, website functionality is underlying e-government
integration (Gant and Gant, 2002; Layne and Lee; 2001). With high levels of
integration, e-government websites can be developed as the government gateway that
enables seamless access to government services across different departments. In such
conditions, users can simply follow a single registration process to involve in online
government services, rather than visiting and registering with numerous different
websites according to their services required (Dwivedi and Williams, 2008). An e-
government website has the potential to change the way that users access and interact
with government, which can help with the provision of government services, improve
communication and encourage users‟ participation in government decision making
(Gil-Garcia, 2006; Howard, 2001; Kolsaker, 2006).
Today, e-government websites are a key priority for governments when they develop
their e-government system and create electronic relationships between government
and citizens, businesses, government employees and other agencies (Barnes, 2004;
Gant and Gant, 2002; Garcia et al., 2005; Tolbert and Mossberger, 2003; Wang et al.,
2005). Government have paid much attention to developing e-government websites.
For example, 30% of e-government projects are focused on website development in
the UK (Beynon-Davies and Williams, 2003). Furthermore, there are a large number
of users who are using and have been willing to engage in e-government website
services. For instance, Mosse and Whitley (2009) reported that over 300,000 users
visit the Department of Children, Schools and Families website every month in the
UK. In addition, a survey by Larsen and Rainie (2003) indicated that about 60% of
respondents prefer to choose e-government to deal with their requests.
However, with the rapid development of e-government and a large number of users
who are willing to use e-government, there is still a big challenge for e-government to
interact with users (Følstad et al., 2004; Kossak et al., 2001; Kumar et al., 2007;

Usability and credibility evaluation of electronic governments: users‟ perspective Zhao Huang
Chapter 2 Literature review 19
Weerakkody and Choudrie, 2005; Yildiz, 2007). Among the various reasons, evidence
from existing literature suggests that usability and credibility have been found to be
two of the major reasons influencing users‟ interaction and adoption of e-government
(Al-Omari and Al-Omari, 2006; Barnes, 2004; Bélanger and Carter, 2008; Donker-
Kuijer et al., 2010; Henriksson et al., 2007; Parent et al., 2005; Sidi and Junaini, 2006;
Thompson et al., 2003; Welch and Hinnant, 2003). The following sections look at
literature and relevant studies to detail the concept of usability and credibility and
indicate their effects on e-government development.
2.3 Usability
Usability is a well-known concept in Human-Computer Interaction research. It is
typically used to measure how easy and efficient it is for users to perform tasks when
using a product (Han et al., 2001). Evidence from previous studies indicates that
usability is an important factor in determining product quality (Bevan, 1995;
Karahoca et al., 2010; Park and Lim, 1999), and ensuring users‟ engagement (Lee and
Koubek, 2010; Sauer and Sonderegger, 2009). Therefore, usability has been widely
addressed in products and system design.
2.3.1 Usability concept
Usability is a very broad concept in system design (Gillan and Bias, 2001). According
to the International Standard Organisation (ISO, 1998), IT system usability refers to
the effectiveness, efficiency and satisfaction with which the specified users achieve
specific goals in the specified context of use. However, within the usability
engineering context, usability is defined as the quality of a computer system in terms
of ease of learning, ease of use and user satisfaction (Rosson and Carroll, 2002). In
the context of web-based online systems, usability reflects the perceived ease of
understanding the structure of a system, simplicity of use of the website, the speed of
locating the item, the perceived ease of navigating the site, and the ability of the users
to control their movement within the system (Flavián et al., 2006).
Usability and credibility evaluation of electronic governments: users‟ perspective Zhao Huang
Chapter 2 Literature review 20
With the widespread use of websites, websites serve as the interface to the web-based
online systems. Usability concepts have been also importantly addressed for website
interface (Ghaoui, 2000), which is defined as a measurement related to how useful
and user-friendly the system is. In detail, usefulness is the degree to which users think
that using the particular system can improve their performance (Kumar et al., 2007).
User-friendliness is the perception of aesthetic design with respect to website interface
features (Matera et al., 2002). However, such website interface usability can be
extended in order to obtain more comprehensive explanations. Therefore, some
studies use multiple criteria to explain usability concepts. For example, Nielsen (1993)
explained website usability as the ease of learning the site, memorising the site
functions, the efficiency of the website design, the degree of errors protection and the
general satisfaction of users. In addition, Henriksson et al. (2007) addressed six
categories in website usability, which are the content readability, the ease of websites‟
navigation, the robustness of forms within the site, disability access to the site,
compatibility with older systems and the user-friendliness of the site. Furthermore,
Lee and Koubek (2010) identified five criteria to measure usability of web design,
including content organisation, navigation systems, visual arrangements, typography
and colour application. Although the concepts of usability of a website have been
explained differently, these multiple criteria used in these studies allow researchers to
have a broad understanding of usability.
As a result, several studies suggest specific requirements or guidelines to assist in
website design (e.g. Head, 1999; Nielsen, 2000; Pearrow, 2000; Spool, 1999; Wang,
2001), in which their requirements or guidelines focus mainly lies within usability. By
detailing usability in these guidelines, the definition of usability moves away from
imprecise concepts, such as ease of use and usefulness, towards a more
comprehensive view that supports specific usability identification. For example,
Nielsen (1994) developed a set of guidelines, covering a range of the specific usability
features in relation to website design. These include visibility of system status; match
between system and the real world; user control and freedom; consistency and
standards; error prevention; recognition rather than recall; flexibility and efficiency of
use; aesthetic and minimalist design; errors recovery; and help functions. By
developing such guidelines, it can be helpful to focus usability on specific aspects and
create websites with high levels of usability.
Usability and credibility evaluation of electronic governments: users‟ perspective Zhao Huang
Chapter 2 Literature review 21
Although the aforementioned studies present the extensive concept of usability in a
variety of systems, it seems clear that usability is an important factor in construction
of the system design. As indicated by Lee and Koubek (2010), a successful and
preferable website generally refers to one with high usability. This is also supported
by Park and Lim (1999, p.379), who stated that “usability has become a primary
factor in determining the acceptability and consequent success of computer software.”
Furthermore, evidence from previous studies demonstrates that among a variety of
electronic systems, such as e-banking (Weir et al., 2007), digital libraries (Tsakonas
and Papatheodorou, 2008), health-care systems (Rose et al., 2005), e-commerce (Lee
and Koubek, 2010) and e-learning (Chiu et al., 2005), usability has been commonly
considered as a key element in determining system or service quality (Casaló et al.,
2008). For example, in order to ensure the quality of software developed for a Tablet
personal computer that can keep electronic health records of patients errorless and
accessible through mobile technologies in hospital, usability evaluation is primarily
focused on during product development (Karahoca et al., 2010). Equally, Bevan (1995)
emphasised usability in electronic system design. In particular, they identified that the
usability attributes which contribute to quality of system use include the style and
properties of user interface, the dialogue structure, and the nature of the functionality.
Accordingly, the study suggests measuring usability as quality of system use. Another
study conducted by Han et al. (2001) found that the system performance, such as
efficiency and effectiveness to achieve the target task goals, and image and
impression such as sense or feelings about a system are closely associated with
usability. Users generally focus on these aspects to judge the quality of system design.
Without an emphasis on usability, systems are often not accepted by users.
In essence, usability can directly influence users‟ preference, opinion and attitude. For
example, Lee and Koubek (2010) conducted a study to investigate the effects of
usability and web design attributes on user preference. The study found that a high
level of usability results in a high level of user preference toward the website. In
particular, user preference was largely dependent upon web attributes in terms of
content arrangement, navigation function, visual organisation, typography and colour
usage. Additionally, Casaló et al. (2008) demonstrated that website usability not only

Usability and credibility evaluation of electronic governments: users‟ perspective Zhao Huang
Chapter 2 Literature review 22
has a direct and positive influence on user satisfaction, but also builds user trust in the
website loyalty formation process.
Moreover, usability design also has big impacts on user performance and interaction
with systems. Sonderegger and Sauer (2010) detected a number of usability attributes,
such as the attractiveness and the visual appearance that influences users‟
performance in terms of task completion, interaction efficiency and error rate with
mobile phone systems. In addition, Benbunan-Fich (2001) showed that the major
aspects that hamper the efficiency of the users‟ interaction with the website are
content problems, such as cluttered design and poor readability, and navigation
problems, for example confused buttons. In particular, interactivity elements, such as
the length of the process negatively affect the possibility that users will return to the
site or make a purchase.
Furthermore, failure to provide usability design may also have negative economic
impact. Nielsen (2001) found that electronic shops lose about half of their potential
sales due to insufficient usability design. Tsakonas and Papatheodorou (2008), who
investigated the quality of a commercial website and analysed users interaction, found
that the quality of the website is concerned with usability, which in turn, significantly
influences users‟ performance with the website. In particular, users fail to choose
products because of crowded content and poor navigation design. In addition, Tilson
et al. (1998) required users to list the factors influencing their decision to purchase on
an e-commerce website. Among 50 different factors listed, 27 factors relate to the
usability of the website design, such as feedback to confirm that the order has been
received, the ability to go back and edit the purchase order list, and search results
presentation in a usable format.
2.3.2 Usability effects on e-government
In terms of e-government, usability has been shown to be important in services quality,
website design and e-government structure development. Regarding service quality,
Gant and Gant (2002) found that the provision of service in e-government relies on
web functionality since all sorts of government services are produced through e-

Usability and credibility evaluation of electronic governments: users‟ perspective Zhao Huang
Chapter 2 Literature review 23
government websites. A high level of website functionality can ensure service
delivery value for users. Such value can be achieved by giving attention to usability,
customization, openness and transparency. In particular, features, such as intuitive
menu systems, site maps, new information indicators, search tools, common
government logo, uniform masthead and help function are important for usability
construction in order to support service quality provision.
Similarly, Garcia et al. (2005) found that service quality is based on e-government
constitutive characteristics: information distribution, service offer and users‟
participation. Usability can effectively measure services offered in relation to these
three aspects. Thus, apart from the traditional usability criteria, such as user control,
visibility of system status and aesthetics design, Garcia et al. (2005) derive extra
usability criteria, including accessibility, interoperability, security and privacy,
information truth, service agility and transparency to assess the e-government service
quality.
Moreover, Magoutas et al. (2010) showed that the quality of e-government portal and
service represents e-government quality. To explore the quality of e-government
portal and service, four quality factors have been identified including usability, forms
interaction, support mechanisms and security. The results indicate that by focusing on
these quality factors, e-government quality is maintained. In particular, the system‟s
usefulness in an e-government portal adds to the value of e-government quality. To
achieve a useful e-government portal, the following features of portal structure, layout,
URL, search engine capability, site map and customization need to be addressed.
With respect to the requirements of usability of e-government website design, Baker
(2009) reported that without addressing usability in e-government websites, e-
government is still facing a major challenge in interacting with users. To understand
usability, six dimensions that impact on overall e-government website usability have
been explored, including online services, user-help, navigation, legitimacy,
information architecture and accessibility. More specifically, online services require
the services quality offered by e-government. User-help identifies mechanisms that
facilitate satisfactory electronic contact and interaction. Navigation provides user with
guidance through the website readily to specific destinations. Legitimacy features,

Usability and credibility evaluation of electronic governments: users‟ perspective Zhao Huang
Chapter 2 Literature review 24
such as security policy and privacy statement, are required to demonstrate that a
website is particularly designed to conduct official government business. Information
architecture addresses information structure and organisation so that it can be clear for
users. Accessibility allows easy access for users with disability.
Moreover, Kossak et al. (2001) investigated e-government application for a large and
diverse community of users. The results summarized that usability is becoming a key
factor for e-government applications, especially in the consideration of users‟
requirements of website. The study finds that the major usability issues are in terms of
users‟ control, users‟ memory load and interface consistent, which need to meet users‟
needs. Therefore, usability should be implemented not only in site design, but also in
content design to present different content legibly with acceptable response time.
The importance of usability to e-government website design is also reflected in a
study conducted by Donker-Kuijer et al. (2010), which indicated that an e-government
website is regarded as a promising means to increase users‟ involvement and promote
service efficiency. Usability is the factor that increases or ensures the quality of the e-
government website. To achieve high quality of e-government website, usability
needs to be regularly examined in all parts. This is also echoed by Henriksson et al.
(2007), who revealed that usability consists of the quality of government websites. To
pay attention to usability, there are a range of features that need to be carefully
considered, which includes text readability, consistent layout scheme, ease of
navigation and accessibility for various levels of user capability.
Furthermore, a number of studies have addressed usability in relation to e-government
structure development. A study conducted by Schedler and Summermatter (2007)
indicated that current e-government structure is required to switch from service
orientation to user orientation because users are the focus when developing e-
government. However, in order to focus on users and explore their needs, the
development of a website that is easy to use is a way to create users‟ value. Therefore,
for developing user-oriented e-government websites, usability features, such as site
maps, search facility, multilingualism and friendly printer version are important
components to support that the site easy to use. In addition, Searson and Johnson
(2010) showed that current e-government development strategy focuses on two-way

Usability and credibility evaluation of electronic governments: users‟ perspective Zhao Huang
Chapter 2 Literature review 25
symmetrical communication of e-government, so that government and the public
adjust and adapt to each other for mutual benefit, rather than government using one-
way persuasive communication to empower the organisation and force its goals onto
its stakeholders. However, in order to implement such two-way e-government
development, usability has been found to be one of the major aspects. Such usability
can be achieved by providing search facility, font adjustment options, FAQ section,
page formatting for printing and site map.
2.3.3 Usability effects on e-government users
The usability of e-government has profound impacts on users‟ satisfaction,
expectation and perception. For example, Magoutas and Mentzas (2010) conducted a
study that monitors the degree of users‟ satisfaction with e-government services. The
findings imply that users‟ satisfaction of e-government is significantly influenced by
forms interaction, website usability, security, information quality, service reliability
and support mechanisms. This is also reflected by Verdegem and Verleye (2009), who
investigated users‟ expectations about e-government. Based on a large sample (5590
respondents), the results show that users‟ preferences closely relate to usability in
terms of the degree of access of e-government services, findability of the e-
government website, loading speed of the pages, the usefulness of information
provided on the site and flexibility that is being offered through the e-government
website. A high level of usability makes better users‟ expectation, which have a
decisive effect on use of e-government services.
Another similar study by Kumar et al. (2007) emphasised that the key driver of users‟
e-government adoption is usability. Such usability reflects users‟ perception of
usefulness of the online information, services provided by e-government and how
easy it was for users to access, navigate and consume the information and services on
e-government.
Furthermore, providing effective usability design significantly influences users‟
interaction with e-government. Barnes (2004) investigated the elements impacting
users‟ intention to use the Inland Revenue website in the UK. The results showed that
Usability and credibility evaluation of electronic governments: users‟ perspective Zhao Huang
Chapter 2 Literature review 26
the users‟ intention to apply the e-government website is strongly determined by
whether the site demonstrates ease of learning, ease of navigation, ease of use,
provision of accurate, believable, understandable information, and safe transaction.
The majority of these elements lie in the usability. In another study, Barnes and
Vidgen (2004) observed users‟ interaction with an online government tax self-
assessment facility. These findings show that users‟ activities, such as online
submission of self-assessed tax returns and information seeking are largely concerned
with usability, navigation, and site communication. In order to generate greater users‟
interaction, there is a need to not only understand the usability requirements of users,
but provide tailored solutions to improve the usability of these e-government websites.
Anthopoulos et al. (2006) applied participatory design to discover user-oriented e-
government services. The study addresses the importance of users‟ needs in order to
guide service delivery improvement. Usability has been found to be the determinant in
consideration of users‟ requirements, because if users failed to access and execute the
proper service due to usability errors, their dissatisfaction increased. Such
dissatisfaction may prevent users‟ return to an e-government website, and even that
users do not recommend their use to others.
Similar results are reported by Kumar et al. (2007), who studied factors influencing
successful e-government adoption. The authors propose a conceptual model to analyse
the influence of users‟ acceptance of e-government, including website design, service
quality, users‟ satisfaction and users‟ characteristics. The results indicate that website
design, in terms of usefulness and ease of use, acts as the vital element, which not
only influences users‟ experience and satisfaction, but also positively affects users‟
interaction with e-government. Therefore, the authors suggest that improving website
design, especially in terms of navigation, aesthetics, content, accessibility and
personalisation is very likely to encourage users‟ adoption of e-government.
To summarise, the set of studies reviewed in this section indicate the importance of
usability to e-government, and the effects of usability on users‟ attitude, perception
and interaction. The findings of these studies suggest that usability is considered as a
key factor in determining e-government success, which needs to be addressed when
developing e-government.
Usability and credibility evaluation of electronic governments: users‟ perspective Zhao Huang
Chapter 2 Literature review 27
2.4 Credibility
Credibility is another important factor in determining users‟ engagement with e-
government (Al-Omari and Al-Omari, 2006; Bélanger and Carter, 2008; Parent et al.,
2005; Sidi and Junaini, 2006; Welch and Hinnant, 2003). Initially, credibility is
discussed as a theoretical construct in the field of communication under the name of
“source credibility theory” (Robins and Holmes, 2007). However, recent research has
adopted credibility in the field of Human-Computer Interaction (Flanagin and
Metzger, 2003), and expanded on source credibility to explain interaction with
information systems (Johnson and Kaye, 2009; Rains and Karmikel, 2009) and
interaction with information (Dutta-Bergman; 2004; McKnight and Kacmar, 2006;
Yang, 2007). The detailed concept of credibility and its effects on e-government are
presented in the following sub-sections.
2.4.1 Credibility concept
Although credibility is a complex concept (Liu and Huang, 2005), it can be simply
defined as “judgments made by a perceiver concerning the believability of a
communicator” (O‟Keefe, 2002, p.181). Rieh (2002) defined credibility as
trustfulness, reliability, accuracy, authority and quality. It can be argued that there are
two fundamental factors that are closely related to credibility: trustworthiness and
expertise (Hilligoss and Rieh, 2008). The former is about reliability (Fogg and Tseng,
1999a), while the latter is related to user‟ perception of source knowledge and skills
(Fogg, 2003). However, some studies tend to use multiple criteria to explain source
credibility, which allows for a more detailed judgment. For example, Burgoon et al.
(2000) identified five dimensions of credibility: competence, character, composure,
dynamism and sociability. In their explanation, competence refers to demonstrating
expertise and authoritativeness; character is related to communicator‟ truthfulness and
reliability; composure and dynamism may be implicated by indicating a dominant and
extroverted communicator; sociability is about friendly and likable perception.
Moreover, Fogg (2003) outlined four types of credibility, which are presumed

Usability and credibility evaluation of electronic governments: users‟ perspective Zhao Huang
Chapter 2 Literature review 28
credibility, earned credibility, surface credibility and reputed credibility. Presumed
credibility refers to automatic belief or trust in an information source. Earned
credibility is obtained when frequently positive changes happen. It represents what
occurs over time based on users‟ experiences (O‟Grady, 2006). Surface credibility
relates to appearance features. Reputed credibility is based on indication through
another secondary credible source. These studies build up a more comprehensive
understanding of credibility.
In addition, credibility can be described in terms of characteristics of information
(Flanagin and Metzger, 2003), features of content (Hong, 2006; Robins and Holmes,
2008), and delivery media (Metzger et al., 2003; Rains and Karmikel, 2009). In such
aspects, some studies of credibility have provided insights into different types of
information and content, such as political information (Johnson and Kaye, 2009),
scholarly information (Liu and Huang, 2005) and online news (Sundar, 1999). Other
research focuses on particular computer-based media, such as the Internet and web.
For instance, Fogg et al. (2003) conducted a study to examine website credibility.
Comments elicited from users address a number of web design factors influencing
user‟ perception of website credibility, such as design look, information
design/structure, information focus, company motive, accuracy of information,
reputation, etc. Although these studies investigate credibility in different contexts, it
seems clear that credibility has been considered as a key factor that users use to make
judgments about website quality and value of information. For example, Rains and
Karmikel (2009) reported that message characteristics such as statistical data and
references, and structural features such as images, third-party endorsements, a
physical address and privacy policy statement are importantly associated with website
credibility and users always use these elements as credibility cues to judge website
quality. Dutta-Bergman (2004) conducted a study to investigate the importance of
health information on the Internet. The findings reveal that the completeness and
credibility appear as the two critical factors determining quality of information on
health websites.
More importantly, credibility has a significant impact on users‟ perception, attitude
and behavior (Rains and Karmikel, 2009). Tormala et al. (2006) carried out a study to
explore the effect of source credibility on user attitude and persuasion. They compare

Usability and credibility evaluation of electronic governments: users‟ perspective Zhao Huang
Chapter 2 Literature review 29
the possibility of generating persuasion between high credibility sources and low
credibility sources. The findings indicate that higher source credibility leads to a more
favourable attitude and is more persuasive to users than lower source credibility.
Moreover, credibility is a fundamental aspect of trust development (Fogg and Tseng,
1999b). Johnson and Kaye (2009) examined trust within an online political
information context. The results show that users‟ trust relies on information they
receive from reliable resources. If political information published by a government is
perceived as credible, users trust in that government.
2.4.2 Credibility effects on e-government
With respect to e-government, credibility issues have been investigated in terms of e-
government services and e-government website design. Regarding e-government
services, Carter and Bélanger (2005) investigated the factors influencing usage of e-
government services. The findings suggest that service trustworthiness positively
affects users‟ intention to use e-government. Such trustworthiness requires a system
indicating that people who work behind e-government have integrity and competence
to provide information and services to meet users‟ needs. To achieve these
requirements, the system needs to describe users‟ role in e-government services in
online documentation and present images of people who supply the services on the
site. Likewise, a study by Welch and Hinnant (2003) showed that the provision of
reliable information on government websites is positively associated with overall
perception of e-government and thus it promotes e-government transparency.
Furthermore, Park et al. (2009) addressed the role of metadata credibility for
describing electronic resources, managing records and documents, discovering
information and ensuring their preservation in e-government metadata management
services. The study examines credibility of metadata with respect to interoperability
(the capability of different systems to exchange data via set of protocol), application
profiles (data elements drawn from namespace schemas combined together by
implementer and optimized for a particular application), and controlled vocabularies
(principle adopted for managing electronic information). The results indicate that in
order to achieve credible metadata, government and agencies need to ensure

Usability and credibility evaluation of electronic governments: users‟ perspective Zhao Huang
Chapter 2 Literature review 30
compliance and effective implementation of universal metadata standards and
frameworks.
With respect to e-government websites, Sidi and Junaini (2006) pointed out that
credibility of a website is a key element in determining e-government success. As an
e-government website is the interface and representative of the e-government, it needs
to reflect such credibility in its design. Therefore, they evaluated several e-
government websites‟ credibility in Malaysia. The results show that a number of e-
government website features have a strong impact on users‟ perception of credibility.
These include e-government website look, layout design, government information
update, accuracy of information, usa of animated banner, site information structure
and government website reputation. Moreover, Al-Omari and Al-Omari (2006)
conducted a study to build trust in e-government. The study particularly addresses the
service transaction in terms of security, privacy and authentication in e-government
website design. Accordingly, the study suggests that during a service transaction,
features such as digital certificate, encryption, user authentication provision and single
sign-on convenience need to be provided and presented through the site. Similarly,
Sillence et al. (2006) discovered factors influencing website reliability construction, in
terms of website interface and content design. Regarding interface design, the factors
include site layout, navigation aids, colour usage, adverts presentation, search
facilities, site introduction presentation and text density. Regarding content design,
the factors are in-depth information, expert information, relevant illustrations, wide
variety of topics covered, unbiased information, clear and simple language used,
frequently asked questions provision.
2.4.3 Credibility effects on e-government users
E-government credibility has significant effects on users‟ attitude and behaviour. For
example, Welch and Hinnant (2003) explored the interrelation between users‟ attitude
and e-government in terms of information quality, transparency and interactivity. The
study indicates that the stronger users perceive that an e-government website provides
reliable information, the greater belief in that government. In addition, higher levels of
transparency and interactivity generate higher levels of users‟ satisfaction, which in

Usability and credibility evaluation of electronic governments: users‟ perspective Zhao Huang
Chapter 2 Literature review 31
turn, contributes to belief in government. Further, Horst et al., (2007) examined the
integrity of information management capacities of e-government to users‟ behaviour.
The findings show that users have to decide to adopt the new e-government services
by weighting whether information management capacities demonstrate its
trustworthiness. This can be achieved by increasing perceived usefulness of e-services,
improving users‟ control of services and reducing perception of service risk. A similar
study conducted by Warkentin et al. (2002) investigated the issues that impact on
users‟ acceptance and usage of online government services. That study finds that the
lack of service trustworthiness influences users‟ behaviour, such as engagement
intentions, inquiry intentions and sharing personal information.
Furthermore, a number of studies have found that the failure of providing credibility
may also cause a serious impact on users‟ trust of e-government. Bélanger and Carter
(2008) examined trust relating to e-government adoption. The results indicate that
trustworthy e-government services, especially in aspects of online transaction strongly
support the formation of users‟ trust and reduce users‟ feeling of insecurity. It appears
that with higher trust, users may overcome perception of risk, strengthen their
confidence, and enhance their participation. This is also supported by Warkentin et al.
(2002), who suggested that improving institution-based trust, characteristic-based
trust, process-based trust and psychology-based trust helps users to reduce perceived
risk in online tax services and therefore, it encourages users‟ engagement with e-
government.
Bélanger and Carter (2008) found that users‟ trust can be easily influenced by whether
e-government services demonstrated their trustworthiness in aspects of online security
and privacy. Such trust can be increased by improving levels of security and
designing privacy seals, such as a branded trust mark and a seal of approval logo in
online transactions. Similarly, a study by Warkentin et al. (2002) found that users‟
trust can be created in the way that e-government presents visual certification from the
third parties on the website, such as credentials about their reliable services. Al-omari
and Al-omari (2006) emphasized that establishment of credibility of e-government
can earn user confidence, especially in areas of personal and confidential services,
which is helpful to build long-term trust. Tolbert and Mossberger (2003) studied the
effects of e-government on users‟ trust and confidence in government. Their study
Usability and credibility evaluation of electronic governments: users‟ perspective Zhao Huang
Chapter 2 Literature review 32
identified four e-government features that impact on users‟ attitude towards e-
government usage, which are reliable information, transparency of service,
accessibility of e-government and responsiveness of government. Additionally, Carter
and Bélanger (2005) investigated user trust and acceptance factors in the utilization of
e-government services. The findings indicate that ease of use, usefulness and
trustworthiness are significant predictors of users‟ intention to apply e-government
services. Similar results are also found in the study by Warkentin et al. (2002), in
which user trust, perceived ease of use and perceived usefulness are key attributes in
determining users‟ intention to engage in e-government.
In summary, evidence from previous studies show that credibility is another important
factor in e-government development. In addition, the research findings indicate that e-
government credibility significantly influences users‟ trust and attitude to their use.
Without addressing credibility in sufficient detail in e-government development, e-
government will remain a challenging target for users‟ acceptance. Therefore, it is
necessary to pay attention to credibility of e-government. More significantly, relevant
studies suggest that there is a close interrelation between usability and credibility. The
following sections examine the mutual effects of usability and credibility.
2.5 Usability and credibility combination
Usability and credibility have been found to have a close relationship in web-based
online systems and a growing number of studies are indicating the mutual interaction
among features associated with usability and credibility combinations in relation to
website design. For example, users‟ trust closely relates to credibility (Cassell and
Bickmore, 2000; Wang and Emurian, 2005), Flavián et al., (2006) conducted a study
to investigate the role played by perceived usability and user trust on website loyalty.
The results show that user trust increases when user perceives that the system is
usable. More significantly, both perceived usability and user trust can positively
influence user satisfaction, and generate great website loyalty. Their study therefore
suggests that when developing websites, design features in relation to usability and
user trust need to be addressed as a whole. Furthermore, Carter and Bélanger (2005)
suggested that by considering features associated with usability and trust together, it

Usability and credibility evaluation of electronic governments: users‟ perspective Zhao Huang
Chapter 2 Literature review 33
may be helpful to encourage users‟ intention to use e-government. As such, a research
model is developed, which proposes compatibility, relative advantage, image,
complexity, ease of use, usefulness and trustworthiness as the different conceptual
features to investigate the utilization of e-government services. The findings indicate
that only ease of use, trustworthiness and compatibility have the significant influence
to users‟ intention to use an e-government. In addition, trustworthiness can be seen as
a fundamental factor of credibility (Hilligoss and Rieh, 2008). Weerakkody and
Choudrie (2005) explored current challenges and complexities of e-government in the
UK. Among various technical and social challenges analysed, e-government services
trustworthiness and website usability have been found to be two important technical
challenges for e-government development. In particular, the social challenge, such as
users‟ trust has been significantly influenced by services trustworthiness and website
usability. As such, to develop e-government, there is a need to address usability and
credibility combination.
Although a number of studies focus on usability of website design, credibility has
been also importantly highlighted as a part of usability in these studies. Nielsen (1999,
p.1) had examined usability issues in relation to web design. However, within
usability, the communication trustworthiness in web design has been also highlighted.
For example, “Trust is a long-term proposition that builds slowly as people use a site
and get good results......a single violation of trust can destroy credibility”. Thus, to
support communication trustworthiness through usability design, four issues are
suggested, including design quality, up-front disclosure of all aspects of the user
relationship, comprehensive, correct and current content, and connection to the rest of
the web. Moreover, Nielsen (2000) later also addressed credibility as a part of
usability design of a website. This suggests establishing credibility on every page
design. In particular, visual appearance is a major opportunity for establishing
credibility. Another study by Tsakonas and Papatheodorou (2008) explored usefulness
and usability issues in open access digital libraries. This demonstrates the importance
and influence of both issues to users‟ satisfaction and interaction with the system.
However, on closer examination, usability contains ease of use, aesthetics, navigation,
terminology, learnability. Usefulness refers to provision of relevant and reliable
information. Specifically for e-government, Lowry et al. (2006) investigated website
usability. The results identify a strong link between usability and trust, and suggest
Usability and credibility evaluation of electronic governments: users‟ perspective Zhao Huang
Chapter 2 Literature review 34
that considering the design factors in relation to trust can improve website usability.
Furthermore, Garcia et al. (2005) carried out a study to assess the usability of an e-
government website. However, in consideration of the mutual influence between
usability and trust, the study adds reliability, credibility and security into the usability
assessment. As such, among 16 usability heuristics developed, 5 heuristics are
associated with trust, which are error preventions, security and privacy, information
reliability, service agility, and transparency.
Conversely, although some studies pay attention to credibility in website design,
usability features are also importantly indicated. For example, Fogg et al. (2001)
identified five types of elements that increase credibility perception of a website.
These are real-world feel, ease of use, expertise, trustworthiness, and tailoring.
Among them, ease of use is closely related to usability. This is further supported by
their later study (Fogg et al., 2003), which evaluated the credibility of websites. In the
list of the top 18 issues of website credibility, 7 issues are associated with the usability
of the website, which are design look, information design/structure, usefulness of
information, accuracy of information, tone of writing, functionality of site and content
readability. Moreover, Warkentin et al. (2002) investigated the factors encouraging
user adoption of e-government by building trust. The study indicates that except for
institution-based trust, characteristic-based trust, process-based trust establishment,
website interface ease of use and system usefulness also play key roles in deciding
users‟ intention to accept e-government.
Furthermore, it can be argued that there are some common features that are shared by
usability and credibility in website design. Hong (2006) studied the influence of
structural and message features on website credibility. Among the website credibility
features identified, some of them can be also used as usability features, such as
currency of information, navigation tools. These features are also studied by Barnes
(2004), who applied information currency and navigation functions as criteria in
usability evaluation. Similarly, Yang (2007) investigated credibility of news-related
blogs in Taiwan. Some criteria used for credibility perception are also closely related
to the usability features, for instance, the degree of provision of fair, unbiased and
objective information. These attributes can be also applied to measure usability in
aspects of information quality (Garcia et al., 2005). Another research conducted by

Usability and credibility evaluation of electronic governments: users‟ perspective Zhao Huang
Chapter 2 Literature review 35
Sillence et al. (2006) discovered the factors influencing trust in web-based health
advice system. There are a number of credibility features that have been identified.
However, among these credibility features, the overlapped features with usability
include visual appearance, layout, navigation, language style and tone, updated
content. Moreover, Robins and Holmes (2008) focused on aesthetics and credibility in
website design. Their results demonstrate that aesthetics design is the first credibility
cue. Users judge this credibility quickly because before other cognitive processes take
place, preconscious judgements based on visual design elements are already made.
However, aesthetics design is also commonly considered as a key aspect of usability
(Nielsen, 1994; 2000). High aesthetics treatment of interface directly affects users‟
perception of the devices‟ usability (Tractinsky et al., 2000).
In summary, evidence from existing research shows the close interrelation between
usability and credibility in website design. Although some studies show that usability
belongs to credibility, others indicate that credibility is a part of usability, while others
reveal that there are some common features between usability and credibility. It seems
clear that usability and credibility have a mutual influence. Therefore, it is necessary
to address usability and credibility together when developing future e-government
websites.
2.6 Research gaps in relation to usability and credibility in e-government
As indicated before, current research indicate the importance of usability to e-
government (Donker-Kuijer et al., 2010; Gant and Gant, 2002; Kossak et al., 2001;
Kumar et al., 2007; Magoutas and Mentzas, 2010; Magoutas et al., 2010). Although
some studies consider usability issues in relation to e-government service provision
(Baker, 2009; Henriksson et al., 2007; Kossak et al., 2001), some studies explain the
role of usability in aspects of e-government development (Magoutas et al., 2010;
Schedler and Summermatter, 2007), there is limited attention focusing on usability in
e-government website design. As addressed, an e-government website is a key priority
for governments when they develop their e-government systems (Barnes, 2004; Gant
and Gant, 2002; Garcia et al., 2005; Tolbert and Mossberger, 2003; Wang et al., 2005).
Even those few studies that investigated usability in relation to e-government website

Usability and credibility evaluation of electronic governments: users‟ perspective Zhao Huang
Chapter 2 Literature review 36
(Donker-Kuijer, 2010; Gant and Gant, 2002) still lack a thorough and in-depth
assessment of usability of e-government website. It can be argued that without
addressing usability at a detailed level in e-government website design, e-government
still retains the challenging target of how best to interact with users. Therefore, this
implies that usability should have been examined in detail in e-government website
design. Making up this gap may provide results which help designers and developers
gain a better understanding of usability at the detailed level in relation to e-
government and its website design.
The findings from previous studies (Al-omari and Al-omari, 2006; Bélanger and
Carter, 2008; Tolbert and Mossberger, 2003; Warkentin et al., 2002; Welch and
Hinnant, 2003) indicate that users‟ trust is an important relationship between users
and government. Some studies examine the provision of trustworthy e-government
services to improve trust (Bélanger and Carter, 2008; Carter and Bélanger, 2005;
Horst et al., 2007; Warkentin et al., 2002). Some studies investigate how publishing
reliable information on e-government websites to promote greater users‟ trust (Tolbert
and Mossberger, 2003; Welch and Hinnant, 2003). However, since all e-government
information and services are now delivered through e-government websites to users
(Layne and Lee, 2001; Yang and Paul, 2005), users‟ trust can be influenced by
whether e-government websites sufficiently demonstrates their credibility (Huang et
al., 2009). In this respect, e-government website credibility becomes a major factor
influencing users‟ trust of government (Bélanger and Carter, 2008) and determining e-
government success (Sidi and Junaini, 2006). However, very little research has been
paid attention to examine credibility of e-government websites. Examining this gap
may support designers and developers to obtain a deeper understanding of credibility
concepts in e-government context, especially in relation to e-government website
design.
Research findings have shown that there is a close interrelation among features
associated with usability and credibility in web-based online systems (Fogg et al.,
2001; Nielsen, 2000; Robins and Holmes, 2007; Tsakonas and Papatheodorou, 2008;
Weerakkody and Choudrie, 2005), and suggested that usability and credibility should
be considered together when developing websites (Carter and Bélanger, 2005; Fogg et
al., 2003; Garcia et al., 2005; Nielsen, 1999), which may improve website quality and

Usability and credibility evaluation of electronic governments: users‟ perspective Zhao Huang
Chapter 2 Literature review 37
generate greater users‟ participation (Gil-Garcia, 2006; Howard, 2001; Kolsaker,
2006). However, there is no specific study that investigates usability and credibility
combination and their interrelationship, especially in e-government. Examining this
gap can provide a much better understanding of relationship between usability and
credibility in e-government.
This research therefore attempts to evaluate usability and credibility of current e-
government websites. This aim leads the study to address the following research
questions:
RQ1: What are the existing usability problems in current e-government websites?
RQ2: What are the existing credibility problems in current e-government websites?
In addition, in order to carry out a thorough usability and credibility research, based
on the usability and credibility problems identified, the study provides the proposed
design solutions and examines the effects of these proposed design solutions on each
target e-government website. The following questions frame this part of research:
RQ3: What are the effects of the proposed usability design solutions on the usability
problems on each target e-government website?
RQ4: What are the effects of the proposed credibility design solutions on the
credibility problems on each target e-government website?
RQ5: What are the effects of the proposed design solutions on users‟ interaction with
each target e-government website?
2.7 Summary and conclusion
In this chapter, a review of relevant studies has been undertaken. The review and
analysis of existing literature, and empirical findings have identified the research
scope and demonstrated the importance of usability and credibility to e-government.

Usability and credibility evaluation of electronic governments: users‟ perspective Zhao Huang
Chapter 2 Literature review 38
Evidence from literature suggests that usability and credibility are two important
factors in determining e-government success, which need to be reflected to users
through e-government websites. Furthermore, there is an interrelation between
usability and credibility, which need to be considered together and addressed on e-
government websites. Without addressing usability and credibility in sufficient detail
to inform e-government website design, e-government will not be fully accepted by a
wider range of users. In this aspect, there is a need to investigate usability and
credibility of e-government.
This study conducts the usability and credibility evaluation of current e-governments,
focusing on specific e-government websites in the UK. By conducting such an
evaluation, it can provide deeper insight into e-government usability and credibility,
identifying existing problems and offering specific solutions for further usability and
credibility improvement. Chapter 3 will describe relevant theoretical background and
identify the evaluation methods used in this study.

Usability and credibility evaluation of electronic governments: users‟ perspective Zhao Huang
Chapter 3 Theoretical background 39
CHAPTER 3
THEORETICAL BACKGROUND
3.1 Introduction
The previous chapter has reviewed existing literature to indicate the importance of
usability and credibility to e-government websites. Relevant studies have suggested
that there is a need to conduct usability and credibility evaluation of current e-
government websites in order to develop more user-centred e-government. Chapter 3
identifies the evaluation methods used in the study and describes relevant theoretical
background of the usability and credibility inspection. More specifically, among the
various evaluation methods, the primary method adopted in this study is heuristic
evaluation, which is based on users‟ perception to implement a thorough and in-depth
evaluation of e-government websites. In addition, users‟ performance is measured in
order to reveal the level of users‟ interaction with the target e-government websites.
By doing so, it can provide a more comprehensive evaluation, which not only
provides insight into e-government websites usability and credibility, but also
indicates users‟ task performance with the e-government websites evaluated. To
conduct heuristic evaluation in the study, Nielsen‟s set of usability heuristics and
Fogg‟s set of credibility guidelines are used as a starting point, as their usefulness has
already been validated in a number of studies (Baker et al., 2001; Edwards et al., 2008;
Huang et al., 2009; Liu and Huang, 2005; Sidi and Junaini, 2006; Sutcliffe and Gault,
2004). However, these heuristics and guidelines were used for general website
usability and credibility purposes. In order to meet the specific requirements of e-
government, additional usability heuristics and credibility guidelines have been added.
Furthermore, to conduct performance measurement, a set of performance criteria have
been also identified to measure users‟ task performance with the specific e-
government websites.
Thus, the chapter starts with the discussion and identification of the evaluation
methods used in this study (section 3.2). This is followed by describing and
Usability and credibility evaluation of electronic governments: users‟ perspective Zhao Huang
Chapter 3 Theoretical background 40
expanding Nielsen‟ set of usability heuristics and Fogg‟s set of credibility guidelines
in sections 3.3 and 3.4, respectively. Finally, a brief summary and conclusion is
provided at the end of the chapter (section 3.5).
3.2 Usability and credibility evaluation methods
As indicated in the previous chapter (see section 2.3 and 2.4), usability and credibility
need to be importantly addressed on e-government websites. Therefore, usability and
credibility evaluation of web-based e-government becomes a necessary activity,
which can provide detailed insight into e-government usability and credibility,
identifying existing usability and credibility problems and offering specific solutions
for further usability and credibility improvement. However, e-government is used by
diverse users who have heterogeneous backgrounds, in terms of knowledge, skills and
experience, which lead to various requirements of usability and credibility from e-
government. Such different users‟ requirements increase the challenge of usability and
credibility identification by designers when developing more usable and credible e-
government. In response to this challenge, user involvement reveals the user point of
view (Dos-Santos and Reinhard, 2007; Schedler and Summermatter, 2007; Thompson
et al., 2003), which can help understand users and their usability and credibility needs.
Furthermore, it can directly identify what e-government features can cause users to
have most concerns about usability and credibility. This is also in line with user
centred design and evaluation in HCI, where one of the major tasks is to understand
user‟ needs (Følstad et al., 2004; Kossak, et al., 2001). Thus, there needs to be more
attention directed towards users‟ evaluation of usability and credibility of e-
government, because such evaluation can provide concrete prescriptions for
developing more user-centred e-governments that may support the user achieving the
desired services outcome and so generate greater users‟ participation.
In usability inspection, the major approaches include heuristic evaluation, cognitive
walkthrough and user testing (Chen and Macredie, 2005; Matera et al., 2002; Redish
et al., 2002; Tanaka et al., 2005). Heuristic evaluation asks evaluators to examine the
user interface features against a set of predefined criteria or guidelines (Wild and
Macredie, 2000). Cognitive walkthrough is based on cognitive theory (Rieman et al.,
Usability and credibility evaluation of electronic governments: users‟ perspective Zhao Huang
Chapter 3 Theoretical background 41
1995), which requires potential users to think aloud to explain system features while
working on specific tasks and examining its ease of learning (Haak et al., 2003). User
testing assesses user behaviour by observing how the system is actually used by some
representatives of the wider user group (Wood et al., 2003).
Regarding credibility evaluation, many methods, focusing on users‟ perspective have
been used in previous research. For example, Liu and Huang (2005) applied a users‟
feedback method to assess credibility of scholarly information on the web. Sidi and
Junaini (2006) conducted a guideline-based survey to examine the credibility of e-
government websites. In addition, Hilligoss and Rieh (2008) suggested that credibility
assessment is seen as an iterative process. They combined task behaviors observation
and the interview approaches to examine credibility.
3.2.1 Heuristic evaluation
Among these various evaluation methods, heuristic evaluation is a quicker, easier and
more effective approach for identifying potential problems (Allen et al., 2006; Baker
et al., 2001) and has been broadly used in many studies (Edwards et al., 2008;
Sutcliffe and Gault, 2004; Yehuda and McGinn, 2007). The results of the evaluation
are helpful to improve the interaction design and a number of studies show that the
design feedback provided by the heuristic evaluation is valid and useful (Baker et al.,
2001; Hvannberg et al., 2007; Yehuda and McGinn, 2007; Zabed Ahmed et al., 2006).
Heuristic evaluation involves evaluators discovering the interface problems based on
a set of design principles, guidelines or heuristics (Sutcliffe and Gault, 2004). The
popularity of heuristic evaluation is reflected by its cost-effectiveness. In detail,
heuristic evaluation can be effectively employed by both experts and novices although
it is sometimes called expert inspection (Muller et al., 1998). While it can be
conducted by a single inspector, its effectiveness can be improved by increasing the
number of evaluators (Nielsen, 1993).
Furthermore, heuristic evaluation can identify a high proportion of problems. For
example, Fu et al. (2002) used both heuristic evaluation and user testing approaches to
identify design problems in web-based software interfaces. Of 39 total problems

Usability and credibility evaluation of electronic governments: users‟ perspective Zhao Huang
Chapter 3 Theoretical background 42
found, heuristic evaluation identified 34 problems, whereas user testing only detected
21 problems. This strength of heuristic evaluation is also reflected by Jeffries et al.
(1991), who compared four different evaluation techniques to discover the user
interface problems of a software product. These evaluation techniques include
heuristic evaluation, cognitive walkthrough, software guidelines and user testing. The
results show that heuristic evaluation found the most problems among the four
evaluation techniques.
In addition, heuristic evaluation is flexible and can be used for in-depth inspection.
Garcia et al. (2005) applied heuristic evaluation for assessing Brazilian government
websites. In order to ensure that heuristics can discover entire e-government website
features and pay enough attention to the detailed design elements in the evaluation,
they extended the set of heuristics to meet the specific needs of e-government
websites. Furthermore, a number of detailed sub-items were also developed, based on
each extension heuristic. In such a way, the results indicate that a range of serious
problems were raised from all 16 heuristics. In particular, heuristics, such as security
and privacy; efficiency of use; information precision; visibility of system;
interoperability; transparency enable a more thorough and in-depth inspection. For
example, specific design issues, such as the lack of digital certification, the absence of
a virtual keyboard for password input for security and privacy, have been clearly
detected. Additionally, Allen et al. (2006) conducted heuristic evaluation to discover
the problems in a website interface design. The evaluators made a total of 108
comments on the design. These problems were sorted by four levels of severity, in
which 22% of them were rated as level 1 problems, 50% belonged to level 2 severity
problems, 22% were in level 3 seriousness and 6% of features were considered as
level 4 severity problems.
Overall, these studies have proved the applicability and usefulness of heuristic
evaluation for detecting potential problems. Accordingly, this study applies such an
approach to evaluate usability and credibility of the target e-government websites.
However, as indicated by Allen et al., (2006), the heuristic evaluation method requires
users to detect problems that may have a profound effect on users‟ ability to interact
with the system. As such, there is also a need to measure users‟ interaction with the
target e-government websites.

Usability and credibility evaluation of electronic governments: users‟ perspective Zhao Huang
Chapter 3 Theoretical background 43
3.2.2 Performance measurement
Performance measurement is another evaluation method used in this study. Its
usefulness and applicability have been validated in several studies (Han et al., 2001;
Matera et al., 2002; Sonderegger and Sauer, 2010). In general, it requires users to
perform a series of practical tasks using the system. Whilst they complete the tasks,
their task performance is measured by a number of performance criteria. In this way,
it can clearly indicate the level of users‟ interaction when they implement a set of
tasks with the system. For example, Park and Lim (1999) conducted performance
measurement to assess how capable the users are when using the system. The
attributes, such as effectiveness, efficiency and satisfaction have been quantified
through a number of performance criteria, such as error rate, number of references to
help and task completion time. Based on the observation of these performance criteria,
the detailed level of users‟ interaction with the system has been clearly indicated.
Furthermore, a growing number of studies have indicated that user performance
measurement gives more attention to users‟ perspective (Chattratichart and Brodie,
2004; Fu et al., 2002; Lee and Koubek, 2010; Sauer and Sonderegger, 2009; Zabed
Ahmed et al., 2006), which is beneficial for understanding users and their needs. Han
et al., (2001) carried out performance measurement in usability evaluation. This
performance measurement addresses users‟ perception and cognition, learning and
memorization, control and action. The findings identify a number of elements, which
either cause the users‟ most concern, or have significant influence on users‟
performance. Such elements can help designers capture users‟ requirements for
product usability.
Moreover, performance measurement is a flexible approach that can be used with
other evaluation methods (Matera et al., 2002; Park and Lim, 1999; Sonderegger and
Sauer, 2010; Tanaka, et al., 2005; Zabed Ahmed et al., 2006). Matera et al. (2002)
conducted a study, which combines usability inspection and performance
measurement. The results show that these two methods are complementary, and can
be effectively applied to obtain a reliable evaluation process. Such mixed evaluation

Usability and credibility evaluation of electronic governments: users‟ perspective Zhao Huang
Chapter 3 Theoretical background 44
ensures that users are better focused, and users‟ resources are better optimised, with
the overall consequence of making the evaluation less expensive. More importantly,
performance measurement can provide more comprehensive evaluation when
combine with heuristic evaluation. Zabed Ahmed et al., (2006) carried out an
information retrieval interface evaluation, using both heuristic evaluation and
performance measurement methods. The results identify that by using both methods,
it can not only find the interface problems, but also reveal users‟ task performance.
More significantly, users‟ performance indicates how the functionality of the interface
supports users‟ tasks, which can reflect the results obtained from the heuristic
evaluation. Therefore, the authors conclude that combining heuristic evaluation with
performance measurement can generate richer evaluation results.
The other advantage of performance measurement is that it is a straightforward
method to assess users‟ interaction with systems. For example, Sonderegger and
Sauer (2010) measured users‟ performance to reveal users‟ interaction. Users‟
performance can be easily and directly obtained by observing a set of performance
criteria. Research into performance measurement identifies that performance criteria
that have been commonly used to measure users‟ performance include successful
completion of tasks (Bevan, 1995; Haak et al., 2003; Park and Lim, 1999; Sauer and
Sonderegger, 2009; Tanaka et al., 2005; Zabed Ahmed et al., 2006), number of steps
in tasks completion (Park and Lim, 1999; Sauer and Sonderegger, 2009), number of
online helps required (Han, 2001; Park and Lim, 1999; Tanaka et al., 2005) and the
time to finish tasks (Benbunan-Fich, 2001; Bevan, 1995; Haak et al., 2003; Han et al.,
2001; Lee and Koubek, 2010; Zabed Ahmed et al., 2006). These criteria can be easily,
simply and quickly measured through observation, which can gain precise
performance results. Additionally, they are helpful to indicate the level of users‟
interaction with system. Therefore, these performance criteria are selected as the
measurable criteria used in performance measurement in this study.
3.3 Nielsen’s usability heuristics
Nielsen‟s usability heuristics (see Table 3.1) have been popularly used for usability
inspection and their applicability, validation and usefulness have been proved in a
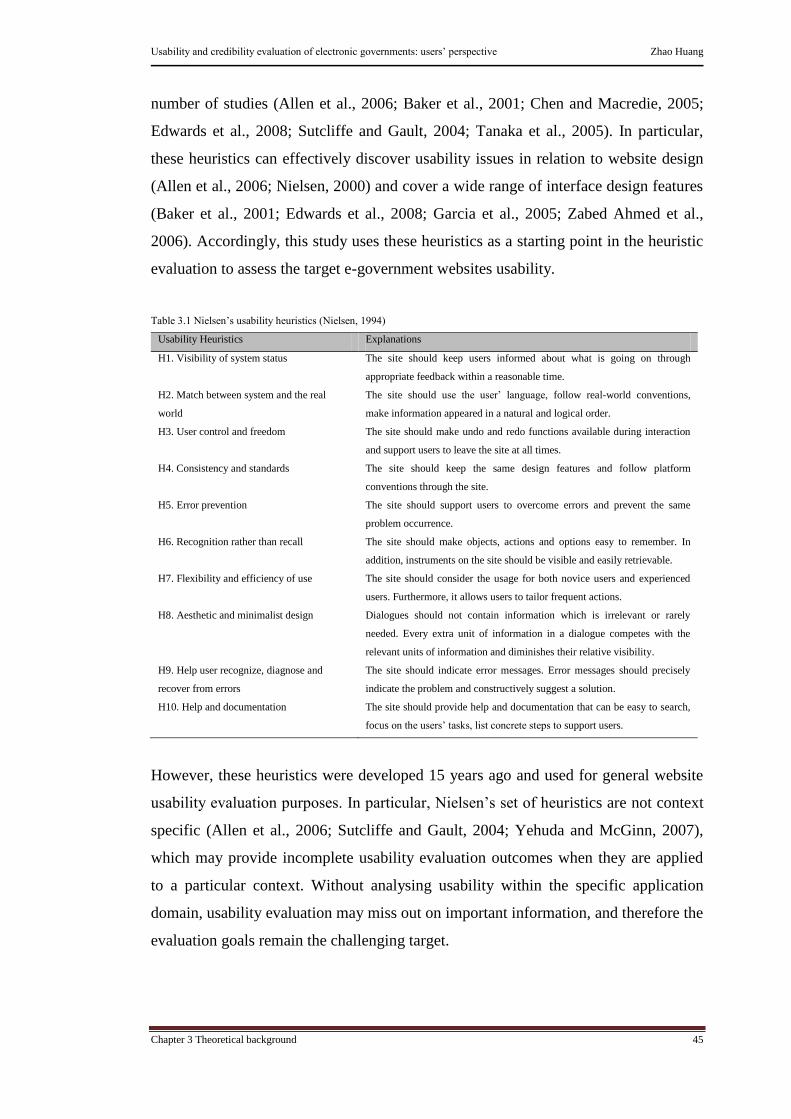
Usability and credibility evaluation of electronic governments: users‟ perspective Zhao Huang
Chapter 3 Theoretical background 45
number of studies (Allen et al., 2006; Baker et al., 2001; Chen and Macredie, 2005;
Edwards et al., 2008; Sutcliffe and Gault, 2004; Tanaka et al., 2005). In particular,
these heuristics can effectively discover usability issues in relation to website design
(Allen et al., 2006; Nielsen, 2000) and cover a wide range of interface design features
(Baker et al., 2001; Edwards et al., 2008; Garcia et al., 2005; Zabed Ahmed et al.,
2006). Accordingly, this study uses these heuristics as a starting point in the heuristic
evaluation to assess the target e-government websites usability.
Table 3.1 Nielsen‟s usability heuristics (Nielsen, 1994)
Usability Heuristics Explanations
H1. Visibility of system status The site should keep users informed about what is going on through
appropriate feedback within a reasonable time.
H2. Match between system and the real
world
The site should use the user‟ language, follow real-world conventions,
make information appeared in a natural and logical order.
H3. User control and freedom The site should make undo and redo functions available during interaction
and support users to leave the site at all times.
H4. Consistency and standards The site should keep the same design features and follow platform
conventions through the site.
H5. Error prevention The site should support users to overcome errors and prevent the same
problem occurrence.
H6. Recognition rather than recall The site should make objects, actions and options easy to remember. In
addition, instruments on the site should be visible and easily retrievable.
H7. Flexibility and efficiency of use The site should consider the usage for both novice users and experienced
users. Furthermore, it allows users to tailor frequent actions.
H8. Aesthetic and minimalist design Dialogues should not contain information which is irrelevant or rarely
needed. Every extra unit of information in a dialogue competes with the
relevant units of information and diminishes their relative visibility.
H9. Help user recognize, diagnose and
recover from errors
The site should indicate error messages. Error messages should precisely
indicate the problem and constructively suggest a solution.
H10. Help and documentation The site should provide help and documentation that can be easy to search,
focus on the users‟ tasks, list concrete steps to support users.
However, these heuristics were developed 15 years ago and used for general website
usability evaluation purposes. In particular, Nielsen‟s set of heuristics are not context
specific (Allen et al., 2006; Sutcliffe and Gault, 2004; Yehuda and McGinn, 2007),
which may provide incomplete usability evaluation outcomes when they are applied
to a particular context. Without analysing usability within the specific application
domain, usability evaluation may miss out on important information, and therefore the
evaluation goals remain the challenging target.

Usability and credibility evaluation of electronic governments: users‟ perspective Zhao Huang
Chapter 3 Theoretical background 46
3.3.1 Extension of usability heuristics
In order to meet the specific requirements of e-government, it is necessary to extend
Nielsen‟s existing heuristics. Evidence from previous studies indicates that e-
government is used by a wide range of people, while interoperability is importantly
required in terms of information and service exchange (Garcia et al., 2005). For
example ensuring news is kept current between e-government and government.
Similarly, Gottschalk (2009) stated that improved interoperability in e-government is
of critical importance to make e-government successful. The maturity levels of
interoperability in e-government not only determine the internal business process and
transaction, but also influence users to achieve their desirable services outcomes. This
is also supported by Dos-Santos and Reinhard (2007), who addressed the issue that
interoperability is the unique feature in e-government development because it enables
users to correctly receive, transfer and use data from e-government services. More
importantly, it may lead to an increase in the quality of public services and in users‟
interaction. Furthermore, Gottschalk and Solli-Sæther (2008) also pointed out the
significance of e-government interoperability in terms of work process, knowledge
sharing, value creation and strategy alignment. Without developing interoperability, e-
government remains facing the challenging target of becoming usable.
In addition, since e-government is used by diverse users who have heterogeneous
skills, e-government should therefore support users with different skills to access
services in a simple way. As indicated by Thompson et al., (2003), the key usability is
not only how well an e-government website works, but also the degree to which an e-
government website meets user needs and skills. Evangelidis et al., (2002) analysed
the risk and success factors for e-government development and identified that users‟
skills represent the human risk factor influencing e-government progress. Hence,
users‟ skill is becoming a necessary consideration when developing e-government.
Another study conducted by Følstad et al. (2004) demonstrated that a truly
overwhelming range of users may be involved in e-government services, with a
variety of skills. In order to encourage users‟ participation, e-government is
particularly required to increase usability that can support users‟ skills to complete
their tasks. Furthermore, Kossak et al. (2001) indicated that the e-government website
design principles should take the support of users‟ skills into account. Such users‟

Usability and credibility evaluation of electronic governments: users‟ perspective Zhao Huang
Chapter 3 Theoretical background 47
skills support can be achieved by placing users in control and reducing users‟ memory
load when interacting with e-government website.
Furthermore, the users‟ interaction with e-government is another important part,
which enhances the quality of users‟ experience. During users‟ interaction with online
services, e-government should present government organisation respect to users at all
times (Reddick, 2005; Montagna, 2005). This respectful interaction can be reflected in
an e-government website, indicating the professional role (Kolsaker and Lee-Kelley,
2006) such as the explanation of service provision duties and data protection terms,
verifying personal identity (Bélanger and Carter, 2008) or confirming users‟ intention
(Anthopoulos et al., 2006; Yang et al., 2005). In addition, the users‟ skills support and
respectful interaction provision are reflected by Muller et al. (1998), who supported
adding these heuristics to the existing Nielsen heuristics. As discussed by Muller et al.,
the „classic‟ Nielsen‟s heuristics are considered as “product-oriented”. In terms of
evaluation, the “product-oriented” paradigm is concerned with the system itself,
which lacks users‟ aspect of systems. To overcome these shortages, a “process-
oriented” perspective can be used to address systems to users and users‟ needs. In this
aspect, the users‟ skills support and provision of respectful interaction belong to the
“process-oriented” category, which addresses the systems that support, extend and
enhance users‟ skills, and treat users with respect. Therefore, based on the usability
requirements in the e-government context, the existing heuristics are extended by
adding three heuristics: interoperability, support and extend users‟ skills, and
pleasurable and respectful interaction with users (see Table 3.2).
Table 3.2 Extended usability heuristics
Extended Heuristics Explanations
H11. Interoperability The site should make all service parts, design elements, the site functions
work as a whole to support user task completion.
H12. Support and extend users‟ skills The site should support, extend and improve users‟ current skills and
knowledge when they perform the tasks.
H13. Pleasurable and respectful interaction
with users
The site should present a pleasant design and treat users with respect. User‟s
interaction with the site should be enhanced by the quality of the site.
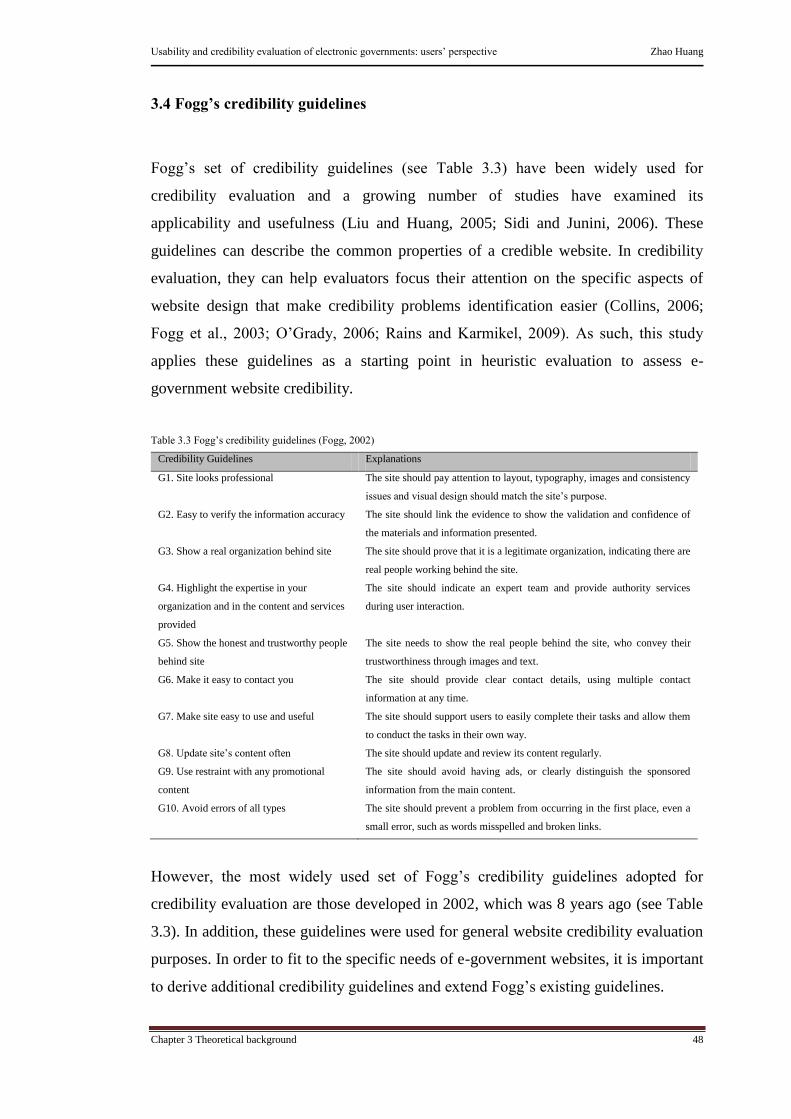
Usability and credibility evaluation of electronic governments: users‟ perspective Zhao Huang
Chapter 3 Theoretical background 48
3.4 Fogg’s credibility guidelines
Fogg‟s set of credibility guidelines (see Table 3.3) have been widely used for
credibility evaluation and a growing number of studies have examined its
applicability and usefulness (Liu and Huang, 2005; Sidi and Junini, 2006). These
guidelines can describe the common properties of a credible website. In credibility
evaluation, they can help evaluators focus their attention on the specific aspects of
website design that make credibility problems identification easier (Collins, 2006;
Fogg et al., 2003; O‟Grady, 2006; Rains and Karmikel, 2009). As such, this study
applies these guidelines as a starting point in heuristic evaluation to assess e-
government website credibility.
Table 3.3 Fogg‟s credibility guidelines (Fogg, 2002)
Credibility Guidelines Explanations
G1. Site looks professional The site should pay attention to layout, typography, images and consistency
issues and visual design should match the site‟s purpose.
G2. Easy to verify the information accuracy The site should link the evidence to show the validation and confidence of
the materials and information presented.
G3. Show a real organization behind site The site should prove that it is a legitimate organization, indicating there are
real people working behind the site.
G4. Highlight the expertise in your
organization and in the content and services
provided
The site should indicate an expert team and provide authority services
during user interaction.
G5. Show the honest and trustworthy people
behind site
The site needs to show the real people behind the site, who convey their
trustworthiness through images and text.
G6. Make it easy to contact you The site should provide clear contact details, using multiple contact
information at any time.
G7. Make site easy to use and useful The site should support users to easily complete their tasks and allow them
to conduct the tasks in their own way.
G8. Update site‟s content often The site should update and review its content regularly.
G9. Use restraint with any promotional
content
The site should avoid having ads, or clearly distinguish the sponsored
information from the main content.
G10. Avoid errors of all types The site should prevent a problem from occurring in the first place, even a
small error, such as words misspelled and broken links.
However, the most widely used set of Fogg‟s credibility guidelines adopted for
credibility evaluation are those developed in 2002, which was 8 years ago (see Table
3.3). In addition, these guidelines were used for general website credibility evaluation
purposes. In order to fit to the specific needs of e-government websites, it is important
to derive additional credibility guidelines and extend Fogg‟s existing guidelines.

Usability and credibility evaluation of electronic governments: users‟ perspective Zhao Huang
Chapter 3 Theoretical background 49
3.4.1 Extension of credibility guidelines
Evidence from relevant literature of e-government studies indicates that e-government
is used for public administration. E-government transparency is importantly required
in aspects of government operation processes and the provision of in-depth
government information, such as public expenditure (Welch and Hinnant, 2003). This
is also supported by De (2006), who indicated that e-government transparency is an
objective for almost all e-government projects. In particular, transparency needs to be
increased in providing services to users, such as offering the progress request
procedure, where users know the status of their requests from the queue detail. Similar
results are revealed by Dos-Santos and Reinhard (2007), who emphasised that among
the various purposes of e-government, one major purpose is to transform transparency
in the offer of service and provision of information to users and organisations.
Moreover, Tolbert and Mossberger (2003) pointed out the urgent demand of
transparency in building e-government. Such transparency significantly influences
users‟ confidence and trust in government. To achieve transparency, an e-government
website needs to post detailed information, such as policies, laws, meeting schedules
and contact information, and make information searches easier for users.
In addition, since a variety of information and services have become available on e-
government websites, e-government websites need to deliver their services with
flexible mechanisms that can support users developing their own ways to achieve the
desired outcomes (Gant and Gant, 2002). This is echoed by Wang et al. (2005), who
indicated that the current challenge in delivering e-government services is to design e-
government website to make it easier and more flexible for users to find desired
information. Furthermore, Kumar et al. (2007) addressed the role of service quality in
e-government success. They emphasise that the services quality is largely dependent
on understanding the needs of users and tailoring services to cater for those needs. In
such a condition, the services provided by e-government should be agile for usage
when users interact with the e-government websites. As such, service agility is
becoming an important characteristic of e-government.

Usability and credibility evaluation of electronic governments: users‟ perspective Zhao Huang
Chapter 3 Theoretical background 50
Furthermore, all information and services are delivered and transacted via the Internet.
Security and privacy are the key element in protecting such services in insecure areas
(Bélanger and Carter, 2008). Meneklis et al. (2005) analysed web services security
within an e-government architecture. The findings suggest that a secure service is
required throughout all aspects of e-government. In addition, Al-Omari and Al-Omari
(2006) indicated that information security issues, such as user authentication and
encryption, and privacy issues, such as confidentiality and online interaction validity,
are major concerns in e-government development. To develop an e-government that
can be accepted and used by a range of users, these issues must be prioritised.
Security and privacy issues are also addressed by Garcia et al. (2005), who identified
that e-government websites should be protected against hackers because users rely on
information on the site. Moreover, users‟ information should be protected when they
send it to these e-government websites. Furthermore, Thompson et al. (2003)
indicated that information security and privacy must be protected at all levels of e-
government websites for users. These concerns reflect the particular requirements of
e-government websites and are closely related to user trust (Gant and Gant, 2002;
Warkentin et al., 2002; Welch and Hinnant, 2003). Therefore, based on these issues,
three new guidelines for transparency, service agility and privacy and security are
added to Fogg‟s ten credibility guidelines for this study (see Table 3.4).
Table 3.4 Extended credibility guidelines
Extended Guidelines Explanations
G11. Transparency The site should keep users informed about a clear governmental operations
and make government budgeting and spending information available.
G12. Service agility The site should provide flexible services to fit different user paths.
G13. Privacy and security The site should help users protect personal information and secure their
private services.
3.5 Summary and conclusion
This chapter indicates that there is a need to evaluate usability and credibility of
current e-government websites in order to improve users‟ interaction and acceptance
of e-government. However, since e-government is used by diverse users with
heterogeneous backgrounds, such as knowledge, skills and experience, in order to
understand users‟ requirements, any usability and credibility evaluation of e-

Usability and credibility evaluation of electronic governments: users‟ perspective Zhao Huang
Chapter 3 Theoretical background 51
government websites needs to address the users‟ perspective. This study therefore
focuses attention mainly towards the users‟ evaluation of usability and credibility of
current e-governments, because such evaluation can provide concrete prescriptions for
developing more user-centred e-governments that may support the user achieving the
desired services outcome and so generate greater users‟ participation.
Among the possible evaluation approaches, the primary method used in this study is
heuristic evaluation, which involves users implementing a thorough and in-depth
evaluation. In addition, to obtain a more comprehensive evaluation, performance
measurement is selected as the appropriate evaluation method for assessing users‟ task
performance with the target e-government websites. In this way, it can not only offer
deeper insight into e-government website usability and credibility based on users‟
perceptions, but also indicate the level of users‟ interaction with these e-government
websites.
To conduct the usability and credibility evaluation, the study applies Nielsen‟s
usability heuristics and Fogg‟s credibility guidelines as a starting point. However, in
order to fit in with the particular needs of e-government, the existing Nielsen‟s
usability heuristics are extended by adding three heuristics: interoperability, support
and extend users‟ skills, and pleasurable and respectful interaction with users.
Similarly, three new credibility guidelines for transparency, service agility and
privacy and security are added to Fogg‟s ten credibility guidelines. Furthermore, to
measure the users‟ performance on a set of tasks with the e-government websites, a
set of performance criteria are identified in this study. These performance criteria
include number of successful tasks completion, number of steps to complete tasks,
number of online helps required and total time to finish tasks.
Having identified the evaluation methods and provided relevant theoretical
background to the usability and credibility evaluation, the next chapter will present
the research methodology employed for the study. This includes research strategy,
research approaches, research techniques, research design and the data analysis
techniques to be used.

Usability and credibility evaluation of electronic governments: users‟ perspective Zhao Huang
Chapter 4 Methodology 52
CHAPTER 4
METHODOLOGY
4.1 Introduction
Having indicated the theoretical background of the usability and credibility evaluation
of e-government websites in the previous chapter, Chapter 4 describes the research
methodology within which the research process will be conducted. The research
strategy used in this study is based on a quasi-experimental study. The purposes of the
experiments are: 1) to evaluate the usability and credibility of current e-government
websites, identifying the existing usability and credibility problems; 2) to assess the
effects of the proposed design solutions on the usability and credibility problems
detected in each target e-government website. As such, two experiments are
conducted in this study. Both quantitative and qualitative data are collected through
the questionnaire and observation research techniques to answer the research
questions set out in section 1.2. Figure 4.1 outlines the research stages through two
experiments and the detailed research design used in the experiments is explained in
the following sections.

Usability and credibility evaluation of electronic governments: users‟ perspective Zhao Huang
Chapter 4 Methodology 53
Figure 4.1 Research stages diagram
Therefore, this chapter begins with the identification and justification of the research
methodology in terms of the research strategy, approaches and techniques (section
4.2). It is followed by describing the research instruments used for the experimental
study (section 4.3), and the research design of the two experiments (section 4.4). Then,
section 4.5 presents and justifies the data analysis techniques employed for the study.
Finally, a brief summary and conclusion is provided at the end of the chapter (section
4.6).
4.2 Research strategy, approach and techniques
As indicated before (see section 1.2), the aim of this research is to evaluate the
usability and credibility of current e-government websites, identifying the existing
usability and credibility problems. Based on these identified usability and credibility
Extension of usability heuristics and credibility guidelines
Development of usability and credibility criteria
Selection of e-government websites
Usability and credibility evaluation
Usability and credibility problems identification
Provision of proposed design solutions
Assessment of proposed design solutions
Development of usability and credibility guidelines
To understand usability and credibility of e-
governments and produce sets of usability and
credibility heuristics to be used in evaluation
To identify specific usability and credibility criteria
of e-governments for usability and credibility
evaluation
To identify the target e-government websites
used in evaluation
To assess usability and credibility of the target e-
government websites
To identify the usability and credibility problems
on the target e-government websites
To understand the usability and credibility problems
found and provide the corresponding design
solutions
To examine the effects of the proposed design
solutions on the usability and credibility problems
and measure users‟ task performance with each
redesigned e-government website
To develop a set of usability and credibility
guidelines to guide usability and credibility in
relation to e-government website design
Research stages Explanations
Usability and credibility evaluation of electronic governments: users‟ perspective Zhao Huang
Chapter 4 Methodology 54
problems, design solutions are proposed and examined for each target e-government
website. The methodology used in this study is a quasi-experimental study, which
combines quantitative and qualitative approaches to collect data through the
questionnaire and observation research techniques. This section provides the detailed
justification of the research strategy, approaches and techniques employed in this
study.
4.2.1 Research strategy: experimental study
According to Denscombe (2003), there are four common research strategies to be
employed in practice: case study; historical research; survey research and
experimental study. Case study generally uses detailed contextual analysis of a single
individual, group and event to explore underlying principles (Yin, 2009). Historical
research refers to the process of systematically examining past and current events to
discern the meaning of events (Leedy, 1997). Survey research is regarded as a means
of determining and explaining practical phenomena (Rates, 2004), and experiment is a
study in which conditions are under the control of researchers to investigate causal
relationship (Boudreau et al., 2001). To choose the appropriate research strategy, it
largely depends upon the research questions being investigated. Leedy (1997, p.229)
pointed out that “the experiment study attempts to control the entire research situation,
expect for certain input variables that become suspects as the cause of whatever
change has been taken place within the investigation design”. In other words, the
experimental study applies a research activity under controlled conditions and
environments to explain “cause and effect” relationships (Walliman, 2001). In
particular, in the experimental study, one situation can be altered by bringing an
extraneous variable into it. Each situation can be re-evaluated after the intervening
alteration. The changes in re-evaluation can be shown to have been caused by the
extraneous variable. This feature is particularly suitable for the purpose of this study,
because this research attempts to evaluate the usability and credibility of the e-
government websites, detecting the usability and credibility problems. Based on the
problems found, it provides relevant proposed design solutions. After that, it aims to
re-evaluate the effects of the proposed design solutions on the usability and credibility
problems identified in the target e-government websites. Such effects can be

Usability and credibility evaluation of electronic governments: users‟ perspective Zhao Huang
Chapter 4 Methodology 55
measured within the rigorous control of conditions to indicate whether the proposed
design solutions can cause the problem to be solved. Therefore, the experimental
study is considered as the most appropriate research strategy for the purpose of this
study.
In this context, this research involves two linked experiments. Experiment 1 evaluates
the usability and credibility of current e-government websites, identifying the
usability and credibility problems. According to the problems found, design solutions
are proposed. Experiment 2 assesses the proposed design solutions regarding the
usability and credibility problems identified on each target e-government website. The
detailed experiment design is presented in section 4.4.
4.2.2 Research approach: quantitative and qualitative approaches
Traditionally, research approaches can be differentiated as either quantitative or
qualitative (Brannen, 1992). The quantitative approach generally examines
relationships among measurable variables with the purpose of explaining, predicting
and controlling the phenomena (Leedy, 1997). In contrast, the qualitative approach
usually attempts to investigate the nature of the phenomena with the purpose of
describing and understanding it (Leedy and Ormrod, 2001).
When comparing the characteristics of quantitative and qualitative approaches, the
former always allows researchers to objectively measure the study instead of their
“subjects” in order to have unbiased and universal results (Tashakkori and Teddlie,
1998). Whereas, the latter is usually employed when researchers want to have
exploration of the importance of the subjective and experiential “lifeworld” of human
beings (Burns, 2000).
Furthermore, the quantitative approach provides a deductive test for assumptions. It
isolates the variables, collects numerical data and applies statistical procedures to
analyse the results (Leedy and Ormrod, 2001). Such results are beneficial for
researchers to develop knowledge, such as cause and effect thinking, reduction to
specific variables, use of measurement and observation, and testing of theories

Usability and credibility evaluation of electronic governments: users‟ perspective Zhao Huang
Chapter 4 Methodology 56
(Creswell, 2009). Conversely, the qualitative approach generally assumes a reality,
which is socially constructed and complex (Glesne and Peshkin, 1992). This type of
study cannot easily be divided into discrete and measurable variables (Leedy, 1997).
It collects an extensive amount of verbal data to describe and interpret the situation
that researchers have investigated. Such results can lead to discovering, building or
developing theory, as opposed to testing it (Leedy and Ormrod, 2001).
Although distinctions can be drawn between qualitative and quantitative approaches
to scientific investigation, it can be argued that these two approaches can be combined
together in a single study. In an earlier study, Bryman (1988) suggested that
quantitative and qualitative approaches are valid and useful to achieve “breadth” and
“depth” purposes in a project and can be mixed in the same investigation. This is also
supported by Hazzan et al. (2006), who conducted a study into computer science
education. This pointed out that the quantitative approach is used to confirm
hypotheses that are formulated in the research, but it still faces the challenge of
describing and analysing the participants‟ thought processes. The authors emphasize
that the quantitative approach alone provides a limited viewpoint for research. There
is a need to gain deep insight into the research. Employing the qualitative approach
can overcome this shortage, which enables researchers to deepen and expand their
findings. On the other side, Creswell (2009) argued that there are also some
limitations to the qualitative approach. For example, it is subjective and time-
consuming. The samples selected are always small and not representative. To
overcome these limitations, Creswell suggested combining quantitative and
qualitative approaches in future studies.
This is also supported by Leedy and Ormrod (2001), who addressed the issue of
quantitative and qualitative approaches, showing how they represent complementary
components in the research process. For example, a quantitative study is always used
to confirm or reject the hypotheses tested at the end of the study. However, a
qualitative study is more likely to focus on tentative answers about what is studied.
These tentative answers can compose of the future study designed to test the proposed
hypotheses.
Usability and credibility evaluation of electronic governments: users‟ perspective Zhao Huang
Chapter 4 Methodology 57
In information system evaluation studies, the mixed approach is also widely employed.
Liu and Huang (2005) adopted both quantitative and qualitative approaches to
evaluate credibility of scholarly information on the web. The results showed that by
using both approaches, it can obtain a more comprehensive credibility evaluation,
which not only reveals the current situation of credibility of scholarly information on
the web, but also provides in-depth assessment of the effects of culture differences on
scholarly information credibility. Another study conducted by Jaeger (2006) assessed
accessibility of federal e-government websites. Both quantitative and qualitative
approaches are applied to identify problems. Although a quantitative approach in
automated testing did not find any accessibility errors, a qualitative approach in expert
and user testing detected a number of the problems, which enriched the research
findings. As such, the author addressed the importance of applying the mixed research
method in a single study. Additionally, Chen and Macredie (2005) also carried out a
web-based evaluation study using the mixed approach. The findings showed that there
are a number of usability problems that have been found by both quantitative and
qualitative approaches. In particular, the quantitative approach has missed some
problems that are identified by the qualitative approach. Therefore, previous research
suggests that the mixed quantitative and qualitative approach is an effective way to
ensure that the study is investigated thoroughly.
The purpose of this research is to evaluate the usability and credibility of current e-
government websites. This evaluation is based on users‟ perception and performance.
In order to obtain a more comprehensive evaluation, which not only provides insight
into e-government websites usability and credibility based on users‟ perception, but
also evaluates users‟ task performance within these e-government websites, the mixed
approach, with an emphasis on the quantitative approach, is considered as the most
appropriate for this research.
4.2.3 Research techniques: questionnaire and observation
To collect data, two research techniques are employed in this study: questionnaire and
observation. Both research techniques are used to approach the research questions, but
from different research perspectives. More specifically, questionnaires aim to capture

Usability and credibility evaluation of electronic governments: users‟ perspective Zhao Huang
Chapter 4 Methodology 58
users‟ perception and opinions to assess usability and credibility of the e-government
websites. Observation is used to obtain the level of users‟ interaction when they
perform a set of practical tasks within the e-government websites evaluated. The
following sub-sections present detailed descriptions of these research techniques.
Questionnaire
Questionnaire is a very flexible and useful method to collect data in scientific
investigations (Zaharias and Poylymenakou, 2009). It is widely used to identify
respondents‟ opinions, judgments and preferences. Using a questionnaire can drive
the participants directly to the research topics, which enable the participants to clearly
see the focuses. In addition, using a questionnaire can ensure that the same questions
are delivered to each participant and their responses can be obtained quickly. In
particular, with an anonymous response style, it encourages respondents to offer their
truthful reply, especially when the participants are talking about controversial issues
(Walliman, 2001). Moreover, questionnaire is also an economic method (Root and
Draper, 1983), which is cheaper to manage and takes less time to conduct than other
methods (Zaharias and Poylymenakou, 2009). Thus, the questionnaire is considered to
be an appropriate method to gather data related to users‟ perception of usability and
credibility of the e-government websites in this study. The purpose of applying the
questionnaire is to obtain users‟ assessment of usability and credibility towards the
target e-government websites. Both quantitative and qualitative data are collected
through the closed and open-ended questions of the questionnaire in the study. The
detailed design of the questionnaire is described in the research instruments (section
4.3.3).
Observation
Observation is a technique which records what people actual do (Gill and Johnson,
1991). Generally, it is classified as direct observation (e.g. writing notes) or indirect
observation (e.g. audiotapes or videotapes recording). Observation can be recorded in
detail information to capture particular aspects of people behaviour. This behaviour
can be quantified through a variety ways, for example counting each occurrence of the
behaviour to indicate its frequency, or rating the behaviour for accuracy (Leedy and

Usability and credibility evaluation of electronic governments: users‟ perspective Zhao Huang
Chapter 4 Methodology 59
Ormrod, 2001). In this research, direct observation is applied to collect quantitative
data in performance measurement. As indicated, performance measurement is one of
the variables investigated in this study. Observing users‟ performance with e-
government websites on the particular tasks is an important aspect in which the actual
users‟ interaction with the e-governments is objectively assessed. In addition,
observation can produce data that show much of the richness and complexity of user
interaction (Leedy and Ormrod, 2001), which leads to better understanding of the
research questions. The detailed performance measurement, through direct
observation, is presented in the research design (section 4.4.1).
4.3 Research instruments
There are three research instruments used in this study, which are the selected e-
government websites, the task sheet and the usability and credibility questionnaire.
The e-government website is selected as the representative of e-government and used
to measure its usability and credibility. The task sheet contains a set of tasks that is
developed for the participants to perform in the evaluation. The usability and
credibility questionnaire is designed to identify the participants‟ assessment of
usability and credibility. These instruments are described at the detailed level in the
following sub-sections.
4.3.1 E-government websites
As mentioned earlier (see section 2.2.3), an e-government website serves as a window
to communicate with users. It is the interface to e-government and regarded as a key
priority for governments when they develop their e-government systems (Gant and
Gant, 2002). Among a variety of e-government websites, the local level of e-
government website is selected in this study for a number of reasons. There are: firstly,
local level of e-government website is the closest level for users. Secondly, it is
frequently used by the general public since local e-government is more informational
for users and focuses on the needs of users in accessing information and services
(Reddick, 2009). Thirdly, local level of e-government can significantly indicate the

Usability and credibility evaluation of electronic governments: users‟ perspective Zhao Huang
Chapter 4 Methodology 60
effects of e-government on users (Tolbert and Mossberger, 2003). Fourthly, evidence
from previous studies finds that bigger challenges exist at the local level of e-
governments (e.g. Irani et al., 2005) and in their website design (e.g. Yang and Paul,
2005). Finally, since this research is carried out at Brunel University, it increases the
interest in exploring e-government websites development in local areas. Therefore,
experiment 1 uses three local e-government websites in the U.K: called London
Authority 1, London Authority 2 and London Authority 3 (LA1, LA2 and LA3).
In addition, the purpose of experiment 2 is to assess the effects of the proposed design
solutions on the usability and credibility problems found in experiment 1 on each
target London Authorities. In order to conduct experiment 2, the target London
Authorities used in experiment 1 will be redesigned based on the proposed design
solutions. Furthermore, to clearly indicate that the proposed design solutions
correspond to the problems found on the relevant e-government website, three
redesigned London Authorities will be developed.
These three redesigned e-government websites will be based on the three target e-
government websites used in experiment 1. Each redesigned e-government website
corresponds to each target e-government website used in experiment 1 and the
relevant proposed solutions will be designed for each of them. There are three phases
in the construction of the redesigned e-government websites. Firstly, according to the
problems identified in experiment 1, the corresponding proposed design solutions are
provided for the redesigned e-government websites. Secondly, each redesigned e-
government website is designed on the basis of the corresponding target e-
government website used in experiment 1, retaining the same structure, layout and
content. In addition, to consider that the redesigned e-government websites may
contain sufficient information and services in order to build the participants‟ general
perception in experiment 2, the redesigned e-government websites will cover rich
information and provide a range of services. As such, the redesigned London
Authority 1 is developed with a total of 133 web pages. The redesigned London
Authority 2 is designed with a total of 92 web pages and a total of 95 web pages are
designed in the redesigned London Authority 3. These web pages contain a variety of
e-government information and services. Finally, the proposed design solutions will be
applied to the redesigned e-government websites (the detailed design of the proposed

Usability and credibility evaluation of electronic governments: users‟ perspective Zhao Huang
Chapter 4 Methodology 61
solutions on each target London Authority is described in Chapter 6). All the
redesigned e-government websites are thoroughly pre-tested and further improved in a
pilot study before the experiment starts (see Appendix 3b).
4.3.2 Task sheet
To conduct the evaluation, the participants are required to perform a set of practical
tasks on the target e-government websites. Such tasks are representative activities that
users would be expected to carry out on an e-government website. The task sheet is
used to deliver these tasks to the participants for the usability and credibility
evaluation. The construction of the task sheet involves four parts. The first part aims
to identify the representative tasks in e-government services. In the second part, a time
issue is considered to justify whether the tasks selected are reasonable and acceptable
for the experiments. In the third part, a task description is addressed to ensure that the
tasks designed are explicitly presented, so that the participants can easily understand
their assignment in the experiments. The fourth part develops the task sheets in each
target e-government website evaluation for the two experiments. The following sub-
sections give detailed descriptions for each part of the task sheet design.
Task identification
Task identification attempts to analyse what tasks can be chosen from e-government
in the real world. In addition, the tasks selected should be representative activities that
users would be expected to conduct and can cover a range of e-government services.
According to Garcia et al. (2005), there are three categories of e-government services:
information distribution, products and services offered and user participation.
Information distribution is related to the provision of all kinds of government
information via the e-government website. Products and services offered refers to
delivering one-way services to users, such as documents download, job searching and
service registration. User participation involves users interacting with two-way
services on the site, for example, taxes payment, school application and house plan
decision making. The different types of tasks are identified according to these services
categories.

Usability and credibility evaluation of electronic governments: users‟ perspective Zhao Huang
Chapter 4 Methodology 62
However, there are a large number of tasks that can be identified from each service
category. It is impossible to use all the tasks offered by e-government for the
participants in the experiments. There are more tasks than there is time available. As a
result, only a limited set of representative tasks can be selected and designed for the
task sheet. In general, functional analysis (e.g. Lentz and Pander Maat, 2004) and user
analysis (e.g. Dumas and Redish, 1999) are used to identify representative tasks.
When comparing functional analysis and user analysis, the main difference is that the
former identifies representative tasks from an experts‟ viewpoint and experiences,
while the latter derives the tasks from applications that users normally engage with.
Table 4.1 summarizes the main features in these two methods. It may be more
reasonable to identify the tasks from a user perspective because all the tasks in e-
government are designed for users who are the actual people to perform these tasks.
Accordingly, user analysis is chosen for identifying representative tasks.
Table 4.1 Comparison of functional analysis and user analysis for task identification
Methods Features
Functional analysis
(Lentz and Pander Maat, 2004)
· Good idea to detect potential problems
· Clear understanding of the system
· Correct in knowing the major design problems
· Quick to select tasks
· Expert point of view
Users centred analysis
(Dumas and Redish, 1999)
· New or modified tasks
· The popular tasks
· Critical to the operation of the system
· Tasks done under pressure
· Frequency of use
· User viewpoint
Task selection time issues
Have identified the tasks, it is necessary to check whether those tasks identified can be
appropriately chosen for the participants to perform in the experiments. Time is
important in task selection. There are two time issues to consider as justification. The
first issue is to examine the time for each task completion in order to ensure that the
task selected is acceptable and appropriate in the experiments. If the time is too long,
the tasks have to be eliminated. The second issue is the length of running all tasks,
which needs to be reasonable for the participants to accept. Therefore, a pilot study

Usability and credibility evaluation of electronic governments: users‟ perspective Zhao Huang
Chapter 4 Methodology 63
will examine the tasks and estimate a baseline to provide the acceptable time for the
participants in the two experiments (see Appendices 3a, 3b).
Task description
To present the tasks to the participants, there are some considerations of the task
description. Firstly, there is a need to balance the task description. Rich description
provides more information about the tasks characters and assumed situation. However,
the participants prefer concise and clear task description with as little distracting
information as possible. Secondly, it is necessary to apply the simplest form, so that
the participants may quickly understand their work in the evaluation. Furthermore, in
order to indicate clear task arrangement for the participants, the study names “task 1”,
“task 2”, “task 3” and etc. in order on the task sheets. Finally, there is concern about
the support that discovers the participants‟ interaction in performing the tasks. The
task sheet itself does not indicate what problems the participants faced. It is important
to employ an observational technique at the same time as the task sheet to record the
measureable data (see Appendix 12).
Task sheet design
Given that the selected tasks have been designed to represent different types of
interaction that users normally engage in e-government services, a task sheet is used
to deliver and describe the selected tasks to the participants in London Authority 1
evaluation. In addition, the same types of the tasks have been developed for London
Authority 2 and London Authority 3 in experiment 1 (see Appendices 1a, 1b, 1c).
However, there is a slight variation to the tasks in order to tailor to that specific local
authority. Regarding experiment 2, in order to control the variables under the same
conditions to support comparative performance analysis, and reduce the effects of
prior task experience on users‟ task performance in experiment 2, the selected tasks
for experiment 2 remain the same type used in experiment 1, but tasks content differ
from the tasks used in experiment 1. Moreover, since experiment 2 aims to investigate
the effects of the proposed design solutions on the e-government websites usability
and credibility problems, therefore the selected tasks may reflect these design
solutions, so that users may be able to notice them on the redesigned e-government
Usability and credibility evaluation of electronic governments: users‟ perspective Zhao Huang
Chapter 4 Methodology 64
websites when they perform these tasks (see Appendices 2a, 2b, 2c). All the task
sheets designed for the two experiments are thoroughly checked and pre-tested in a
pilot study before the experiments start (see Appendices 3a, 3b).
4.3.3 Usability and credibility questionnaire
A questionnaire can be used to capture users‟ perception about usability and
credibility of the target e-government websites. The design of this usability and
credibility questionnaire is based on Nielsen‟s usability heuristics (Nielsen, 1994) and
Fogg‟s credibility guidelines (Fogg, 2002) since a number of studies have validated
the usefulness of these heuristics and guidelines in the evaluation of usability and
credibility (see section 3.3 and 3.4). There are three steps in the questionnaire design.
Firstly, there is a need to extend the existing usability heuristics and credibility
guidelines in order to fit in the specific requirements of e-government. Secondly, a set
of associated criteria for each heuristic and guideline are developed, in order to focus
on the detailed aspects of usability and credibility. Finally, the specific questions are
developed, based on these heuristic and guideline criteria.
Extension of heuristics and guidelines
Nielsen‟s usability heuristics and Fogg‟s credibility guidelines (see Table 3.1 and
Table 3.3) have been widely used for usability and credibility inspection and their
applicability and validation have been proved in a number of studies (e.g. Delice and
Güngör, 2009; Hvannberg et al., 2007; Liu and Huang, 2005; Sidi and Junaini, 2006).
In particular, these heuristics and guidelines can effectively discover usability and
credibility issues in relation to website design (Fogg et al., 2003; Nielsen, 2000). As
such, this study uses these heuristics and guidelines as a starting point to evaluate the
e-government websites usability and credibility. However, these heuristics and
guidelines were developed a number of years ago and in the context of general
website usability and credibility evaluation purposes. In order to meet the specific
needs of e-government websites, it is necessary to extend existing Nielsen‟s heuristics
and Fogg‟s guidelines (The specific justification of the heuristic and guideline
extension is presented in section 3.3 and 3.4).

Usability and credibility evaluation of electronic governments: users‟ perspective Zhao Huang
Chapter 4 Methodology 65
In terms of usability, evidence from previous studies indicates that e-government is
used by a wide range of people, while interoperability is important in terms of
information and service exchange (Garcia et al., 2005). For example ensuring news is
kept current between e-government and government. In addition, since e-government
is used by diverse users who have heterogeneous skills, therefore, e-government
should support users with different skills to access services in a simple way.
Furthermore, during users‟ interaction with online services, e-government should
respect their users at all times (Reddick, 2005). Therefore, the existing Nielsen‟s
usability heuristics are extended by adding three further heuristics: „Interoperability‟,
„Support and extend users‟ skills‟ and „Pleasurable and respectful interaction with
users‟ (see Table 3.2). The detailed requirements of these three heuristics are
described in section 3.3.1.
In terms of credibility, evidence from relevant literature of e-government studies
indicates that e-government is used for public administration. E-government
transparency is important in terms of government operation processes and the
provision of in-depth government information, such as public expenditure (Welch and
Hinnant, 2003). In addition, since a variety of information and services have become
available on e-government websites, therefore e-government websites need to deliver
their services with flexible mechanisms that can support users developing their own
ways to achieve the desired outcomes (Gant and Gant, 2002). Furthermore, all
information and services are delivered and transacted via the Internet. Security and
privacy are the key element in protecting such services in insecure areas (Bélanger
and Carter, 2008). These concerns reflect the particular requirements of e-government
websites and are closely related to user trust (Garcia et al., 2005). Therefore, based on
these issues, three new guidelines for „transparency‟, „service agility‟ and „privacy
and security‟ are added to Fogg‟s ten credibility guidelines (The detailed descriptions
of these extra guidelines are discussed in section 3.4.1).
Associated criteria development
Although Nielsen‟s usability heuristics and Fogg‟s credibility guidelines are extended
in consideration of the needs of e-government and its users, it still plays as a broad

Usability and credibility evaluation of electronic governments: users‟ perspective Zhao Huang
Chapter 4 Methodology 66
framework for usability and credibility evaluation. In other words, these heuristics and
guidelines are too general to develop the usability and credibility questions in the
questionnaire, so that e-government website usability and credibility might be
assessed without enough depth. Furthermore, the lack of detailed analysis may lead to
failure in specific usability and credibility problem identification. In this aspect, it is
important to develop a set of associated criteria for each usability heuristic and
credibility guideline. Such criteria are developed from relevant usability and
credibility studies (e.g. Collins, 2006; O'Grady, 2006; Sonderegger and Sauer, 2010;
Wathen and Burkell, 2002), and the interpretation of wider e-government studies (e.g.
Jaeger, 2006; Sidi and Junaini, 2006; Tolbert and Mossberger, 2003). The findings of
these studies are used to identify which website design factors and features may
influence users‟ perception of usability and credibility, users‟ task performance or
cause problems when users‟ interaction with the system. These factors and features
are extracted to develop the criteria, and then grouped into corresponding heuristics
and guidelines (see Table 4.2). By doing so, it can ensure that the maximum number
of usability and credibility problems could be detected for the target e-government
websites. In addition, it can provide a step by step process to closely focus on detailed
aspects of usability and credibility.
Table 4.2 Criteria identification and classification
Usability heuristics Associated criteria Relevant studies
H1. Visibility of system
status
- Every display has a title
- Subject categories are displayed clearly
- Different types of information are clearly separated from
each other on the screen
- Current status of page is clearly indicated
- Information on the screen is easy to see and read
Brinck et al., (2002); Barnes
and Vidgen, (2004); Garcia et
al., (2005); Henriksson et al.,
(2007); Huizingh, (2000);
Nielsen, (2000)
H2. Match between
system and the real
world
- User is kept informed of system‟s progress
- Selected colours correspond to common expectations
- When prompts imply a necessary action, the words in the
message are consistent with that action
- Menu choices fit logically into categories that have readily
understandable meanings
Barnes and Vidgen, (2004);
Brinck et al., (2002); Garcia et
al., (2005); Huizingh, (2000);
Nielsen, (2000)
H3. User control and
freedom
- It is easy to conduct the task in any order
- User control operations in progress
- If the system has multiple menu levels, there is a
mechanism that allows users to quickly start
- Menus are broad (many items on a menu) rather than deep
(many menu levels)
Baker, (2009); Barnes and
Vidgen, (2004); Brinck et al.,
(2002); Kappel et al., (2006);
Nielsen, (2000)
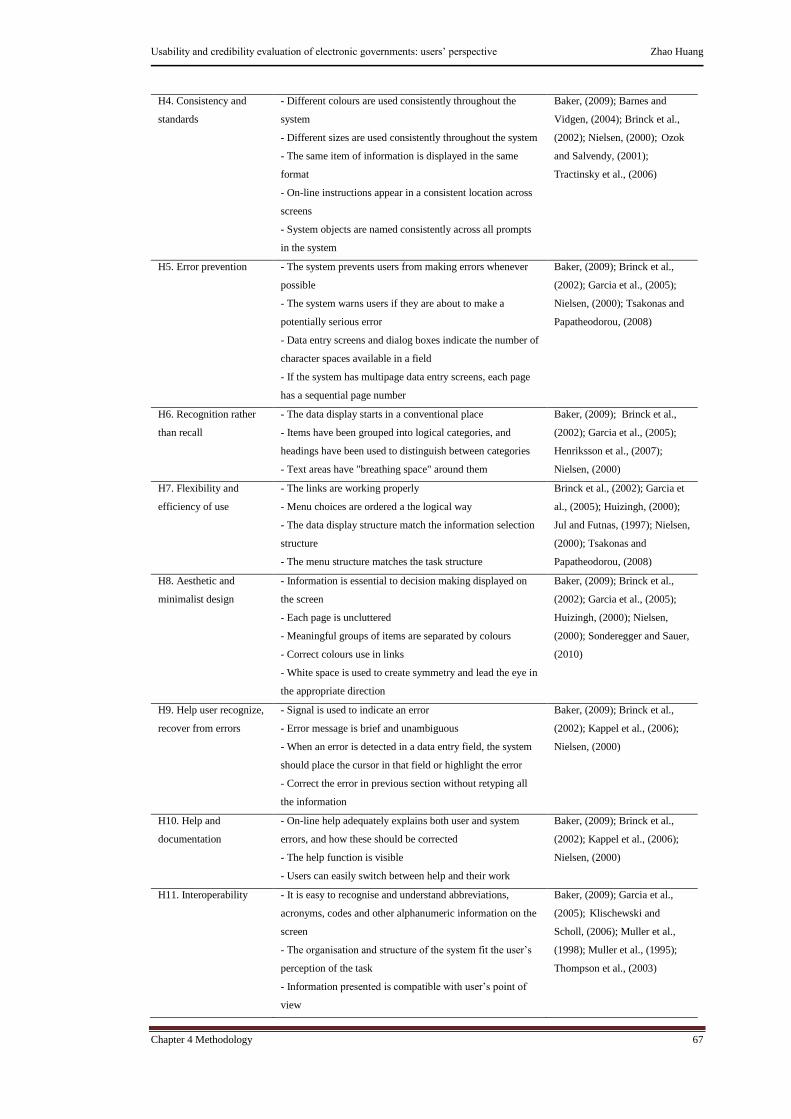
Usability and credibility evaluation of electronic governments: users‟ perspective Zhao Huang
Chapter 4 Methodology 67
H4. Consistency and
standards
- Different colours are used consistently throughout the
system
- Different sizes are used consistently throughout the system
- The same item of information is displayed in the same
format
- On-line instructions appear in a consistent location across
screens
- System objects are named consistently across all prompts
in the system
Baker, (2009); Barnes and
Vidgen, (2004); Brinck et al.,
(2002); Nielsen, (2000); Ozok
and Salvendy, (2001);
Tractinsky et al., (2006)
H5. Error prevention - The system prevents users from making errors whenever
possible
- The system warns users if they are about to make a
potentially serious error
- Data entry screens and dialog boxes indicate the number of
character spaces available in a field
- If the system has multipage data entry screens, each page
has a sequential page number
Baker, (2009); Brinck et al.,
(2002); Garcia et al., (2005);
Nielsen, (2000); Tsakonas and
Papatheodorou, (2008)
H6. Recognition rather
than recall
- The data display starts in a conventional place
- Items have been grouped into logical categories, and
headings have been used to distinguish between categories
- Text areas have "breathing space" around them
Baker, (2009); Brinck et al.,
(2002); Garcia et al., (2005);
Henriksson et al., (2007);
Nielsen, (2000)
H7. Flexibility and
efficiency of use
- The links are working properly
- Menu choices are ordered a the logical way
- The data display structure match the information selection
structure
- The menu structure matches the task structure
Brinck et al., (2002); Garcia et
al., (2005); Huizingh, (2000);
Jul and Futnas, (1997); Nielsen,
(2000); Tsakonas and
Papatheodorou, (2008)
H8. Aesthetic and
minimalist design
- Information is essential to decision making displayed on
the screen
- Each page is uncluttered
- Meaningful groups of items are separated by colours
- Correct colours use in links
- White space is used to create symmetry and lead the eye in
the appropriate direction
Baker, (2009); Brinck et al.,
(2002); Garcia et al., (2005);
Huizingh, (2000); Nielsen,
(2000); Sonderegger and Sauer,
(2010)
H9. Help user recognize,
recover from errors
- Signal is used to indicate an error
- Error message is brief and unambiguous
- When an error is detected in a data entry field, the system
should place the cursor in that field or highlight the error
- Correct the error in previous section without retyping all
the information
Baker, (2009); Brinck et al.,
(2002); Kappel et al., (2006);
Nielsen, (2000)
H10. Help and
documentation
- On-line help adequately explains both user and system
errors, and how these should be corrected
- The help function is visible
- Users can easily switch between help and their work
Baker, (2009); Brinck et al.,
(2002); Kappel et al., (2006);
Nielsen, (2000)
H11. Interoperability - It is easy to recognise and understand abbreviations,
acronyms, codes and other alphanumeric information on the
screen
- The organisation and structure of the system fit the user‟s
perception of the task
- Information presented is compatible with user‟s point of
view
Baker, (2009); Garcia et al.,
(2005); Klischewski and
Scholl, (2006); Muller et al.,
(1998); Muller et al., (1995);
Thompson et al., (2003)

Usability and credibility evaluation of electronic governments: users‟ perspective Zhao Huang
Chapter 4 Methodology 68
H12. Support and extend
users‟ skills
- Window operations are easy to use
- The system performs data translations for users
- Users can move forwards and backwards within a field
Barnes and Vidgen, (2004);
Garcia et al., (2005); Muller et
al., (1998); Muller et al, (1995)
H13. Pleasurable and
respectful interaction
with users
- Each individual image is a harmonious member of a family
of systems
- Excessive text in content design has been avoided
- Users turn on accessibility if necessary
Barnes and Vidgen, (2004);
Garcia et al., (2005); Muller et
al., (1998); Muller et al, (1995);
Reddick, (2005)
Credibility guidelines Associated criteria Relevant studies
G1. Site looks
professional
- The content designed matches the organisation
- Information is presented with the consistent colours
- Information appear to be organized logically on the screen
- Each page is labelled to show its relation to others
Fogg et al., (2000); O‟Grady,
(2006); Liu and Huang, (2005);
Robins and Holmes, (2008); Wathen and Burkell, (2002)
G2. Easy to verify the
information accuracy
- The information is at the right level of detail
- The information is well organised
- The information is accurate
- The URL is correct
Collins, (2005); Fogg et al.,
(2000); O‟Grady, (2006); Liu
and Huang, (2005); Rains and
Karmikel, (2009); Robins and
Holmes, (2008); Sidi and
Junaini, (2006)
G3. Show a real
organization behind site
- The system clearly shows a postal address of the
organisation
- The system displays photos of offices or staff member
- The system provides its accreditations with any other
governmental bodies
Collins, (2005); Fogg et al.,
(2000); Liu and Huang, (2005);
Robins and Holmes, (2008);
Sidi and Junaini, (2006)
G4. Highlight the
expertise in your
organization and in the
content and services
provided
- The system provides detailed information on its policies
and services
- The system is by an local council that is well trust
- Instruments and messages displayed by the system are
concise
Fogg et al., (2000); Liu and
Huang, (2005); Rains and
Karmikel, (2009); Robins and
Holmes, (2008); Sidi and
Junaini, (2006)
G5. Show that honest
and trustworthy people
behind site
- The system provides an “about us” page, including
information such as organisation history and its values
- The system displays any awards it has earned
- The system lists names of the people in charge of the local
authority
Burkell, (2002); Fogg et al.,
(2000); Robins and Holmes,
(2008); Wathen and Burkell,
(2002)
G6. Make it easy to
contact you
- The system provides a “Contact” facility
- The system offers different contact methods
- The system shows detailed contact information
Fogg et al., (2000); O‟Grady,
(2006); Liu and Huang, (2005);
Sidi and Junaini, (2006)
G7. Make site easy to
use and useful
- The system is easy to use
- Navigating the system is easy
- It is always clear what page I am on and how much of the
quote process remains
- The system is arranged in a way that makes sense to the
user
Fogg et al., (2000); O‟Grady,
(2006); Liu and Huang, (2005);
Wathen and Burkell, (2002)
G8. Update site‟s content
often
- The system is update to date O‟Grady, (2006); Wathen and
Burkell, (2002)
G9. Use restraint with
any promotional content
- The system has limited ads on each page
- The system make it easy to distinguish ads from content
O‟Grady, (2006); Huizingh;
(2000); Robins and Holmes,
(2008); Sidi and Junaini, (2006)

Usability and credibility evaluation of electronic governments: users‟ perspective Zhao Huang
Chapter 4 Methodology 69
G10. Avoid errors of all
types
- It is clear what this information should be when user enter
information on the screen
- The system has no broken links
- The system is free from typographical errors
Fogg et al., (2000); O‟Grady,
(2006); Robins and Holmes,
(2008); Sidi and Junaini,
(2006);
G11. Transparency - The system monitors the budgetary execution
- The system clearly states the system terms and conditions
- When a user‟s task is completed, the system send a
message to the user
- It is clear to see progress in a task
Ciborra, (2005); O‟Grady,
(2006); Robins and Holmes,
(2008); Sidi and Junaini,
(2006); Tolbert and
Mossberger, (2003)
G12. Service agility - The system allows the user to work at their own pace and
direction
- Ease to recall the information
- The system offers agile functions
Liu and Huang, (2005); Robins
and Holmes, (2008); Sidi and
Junaini, (2006)
G13. Privacy and
security
- Protected or confidential areas can be accessed with
certain passwords
- A secure message appears when the user accesses private
services
Henriksson et al., (2007); Liu
and Huang, (2005); Wathen
and Burkell, (2002)
Each criteria developed refers to a requirement for a specific usability and credibility
feature that should be conveyed and delivered by the questionnaire, which is used to
examine the target e-government websites design. However, those target e-
government websites differ in usability and credibility criteria. Thus, the researcher
systematically checks these usability and credibility criteria against each target e-
government website to indicate whether or not the target e-government websites meet
this criteria list (see Table 4.3 for the detailed distinctions). These variances provide
the basis for the usability and credibility questionnaire design for each target e-
government website evaluation.
Table 4.3 Website usability and credibility criteria within the target e-government websites
Usability criteria LA 1 LA 2 LA 3
1. Every display has a title
2. Subject categories are displayed clearly
3. Different types of information are clearly separated from each other on the
screen
4. Location of the page is clearly indicated
5. Information on the screen is easy to see and read
√
√
√
√
√
√
√
√
×
√
√
×
√
√
√
6. User is kept informed of system‟s progress
7. Selected colours correspond to common expectations
8. When prompts imply a necessary action, the words in the message are
consistent with that action
9. Menu choices fit logically into categories that have readily understandable
meanings
√
√
√
√
√
√
√
√
√
√
×
√

Usability and credibility evaluation of electronic governments: users‟ perspective Zhao Huang
Chapter 4 Methodology 70
10. It is easy to conduct the task in any order
11. User control operations in progress
12. If the system has multiple menu levels, there is a mechanism that allows
users to quickly start
13. Menus are broad (many items on a menu) rather than deep (many menu
levels)
√
√
√
√
√
√
√
√
√
√
√
√
14. Different colours are used consistently throughout the system
15. Different sizes are used consistently throughout the system
16. The same item of information is displayed in the same format
17. On-line instructions appear in a consistent location across screens
18. System objects are named consistently across all prompts in the system
√
√
√
√
√
√
√
×
√
√
√
×
×
√
√
19. The system prevents users from making errors whenever possible
20. The system warns users if they are about to make a potentially serious
error
21. Data entry screens and dialog boxes indicate the number of character
spaces available in a field
22. If the system has multipage data entry screens, each page has a sequential
page number
√
√
×
√
×
√
×
√
√
√
×
×
23. The data display starts in a conventional place
24. Items have been grouped into logical categories, and headings have been
used to distinguish between categories
25. Text areas have "breathing space" around them
√
√
√
√
√
√
√
√
√
26. The links are working properly
27. Menu choices are ordered in a logical way
28. The data display structure match the information selection structure
29. The menu structure matches the task structure
√
×
√
√
√
√
√
√
√
√
×
√
30. Information is essential to decision making displayed on the screen
31. Each page is uncluttered
32. Meaningful groups of items are separated by colours
33. Correct colours use in links
34. White space is used to create symmetry and lead the eye in the appropriate
direction
√
√
√
√
√
√
√
√
√
√
√
√
√
√
√
35. Signal is used to indicate an error
36. Error message is brief and unambiguous
37. When an error is detected in a data entry field, the system should place the
cursor in that field or highlight the error
38. Correct the error in previous section without retyping all the information
√
√
√
√
√
√
√
√
√
√
√
√
39. On-line help adequately explains both user and system errors, and how
these should be corrected
40. The help function is visible
41. Users can easily switch between help and their work
√
√
√
√
√
√
√
√
√
42 It is easy to recognise and understand abbreviations, acronyms, codes and
other alphanumeric information on the screen
43. The organisation and structure of the system fit the user‟s perception of
the task
44. Information presented is compatible with user‟s point of view
√
√
√
√
√
√
√
√
√
45. Window operations are easy to use
46. The system performs data translations for users
47. Users can move forwards and backwards within a field
√
√
√
√
√
√
√
√
√

Usability and credibility evaluation of electronic governments: users‟ perspective Zhao Huang
Chapter 4 Methodology 71
48. Each individual image is a harmonious member of a family of systems
49. Excessive text in content design has been avoided
50. Users turn on accessibility if necessary
√
√
√
√
√
√
√
√
√
Credibility criteria LA 1 LA 2 LA 3
1. The content designed matches the organisation
2. Information is presented with the consistent colours
3. Information appear to be organized logically on the screen
4. Each page is labelled to show its relation to others
√
√
√
√
√
√
√
√
√
√
√
√
5. The information is at the right level of detail
6. The information is well organised
7. The information is accurate
8. The URL is correct
√
√
√
√
√
√
√
√
√
×
√
√
9. The system clearly shows a postal address of the organisation
10. The system displays photos of offices or staff member
11. The system provides its accreditations with any other governmental bodies
√
√
√
√
√
√
√
√
√
12. The system provides detailed information on its policies and services
13. The system is by an local council that is well trust
14. Instruments and messages displayed by the system are concise
√
√
√
√
√
√
√
√
√
15. The system provides an “about us” page, including information such as
organisation history and its values
16. The system displays any awards it has earned
17. The system lists names of the people in charge of the local authority
√
√
√
×
×
√
×
√
√
18. The system provides a “Contact” facility
19. The system offers different contact methods
20. The system shows detailed contact information
√
√
√
√
√
×
√
√
×
21. The system is easy to use
22. Navigating the system is easy
23. It is always clear what page I am on and how much of the quote process
remains
24. The system is arranged in a way that makes sense to the user
√
√
√
√
√
×
√
√
√
√
×
√
25. The system is up to date √ √ √
26. The system has limited ads on each page
27. The system make it easy to distinguish ads from content
√
√
√
√
√
√
28. It is clear what this information should be when user enter information on
the screen
29. The system has no broken links
30. The system is free from typographical errors
√
√
√
√
√
√
√
√
√
31. The system monitors the budgetary execution
32. The system clearly states the system terms and conditions
33. When a user‟s task is completed, the system send a message to the user
34. It is clear to see progress in a task
√
√
√
√
√
√
√
√
√
√
√
×
35. The system allows the user to work at their own pace and direction
36. Ease to recall the information
37. The system offers agile functions
√
√
√
√
√
√
√
√
√
38. Protected or confidential areas can be accessed with certain passwords
39. A secure message appears when the user accesses private services
√
√
×
√
×
√
(√ = covered, × = not covered, LA 1 = London Authority 1, LA 2 = London Authority 2, LA 3 = London Authority 3)

Usability and credibility evaluation of electronic governments: users‟ perspective Zhao Huang
Chapter 4 Methodology 72
Usability and credibility questionnaire
Based on this development of associated criteria, a paper-based usability and
credibility questionnaire is created for the purpose of capturing the participants‟
perception about usability and credibility of the target e-government websites.
However, there is a slight variation in the questions designed in order to tailor to the
differences of the website usability and credibility criteria detected in each London
Authority. Furthermore, the same questions used in experiment 1 will also form the
basis for the usability and credibility questionnaire in experiment 2. The participants
are required to respond using a five-point Likert scale, which can indicate the
participants‟ agreement level to the statements (strongly agree=5; strongly
disagree=1). The main advantage of using five-point scales is that an odd number of
responses format with a neutral level (neither agree nor disagree) in the middle does
not force the participants to choice a positive (agree) or negative (disagree) option
when they really do not have. Moreover, the quantitative results through a five-point
Likert scale can be easily collected and analyzed.
In order to have a better understanding of the participants‟ perception of usability and
credibility towards the target e-government websites, a qualitative approach through
open-ended questions in the questionnaire is also developed to support the
questionnaire results in the two experiments. The questionnaires are further improved
and tested through a pilot study (see Appendices 3a, 3b). The usability and credibility
questionnaires developed for experiment 1 and 2 are presented in Appendices 4a, 4b,
4c and Appendices 5a, 5b, 5c respectively.
4.4 Research design
As described in the research strategy (section 4.2.1), two experiments are designed in
this study to gather data to investigate the research questions. Experiment 1 aims to
evaluate usability and credibility of the target e-government websites, identifying
existing usability and credibility problems. Experiment 2 attempts to evaluate the
effects of the proposed design solutions on the usability and credibility problems
identified in experiment 1 for each target e-government website. The evaluation of

Usability and credibility evaluation of electronic governments: users‟ perspective Zhao Huang
Chapter 4 Methodology 73
usability and credibility of the target e-government websites is based on users‟
perception and performance in both experiments. This section presents the detailed
research design of the two experiments.
4.4.1 Variables measurement
Perception measurement
Perception is the effects of perceiving while attitude is strongly agreeing with
something (Gallagher, 2008). This study applies a heuristic evaluation, which is based
on users‟ perception of sets of extensions of Nielsen‟s usability heuristics and Fogg‟s
credibility guidelines, to implement a thorough and in-depth assessment of the e-
government websites. In this context, users‟ perception is reflected in the participants‟
opinions and resulting choices from a range of options expressed through the usability
and credibility questionnaire. It can provide the participants‟ insight into the e-
government websites usability and credibility, indicating what e-government website
features can cause the participants‟ most concern about usability and credibility.
Users‟ perception is identified by both quantitative and qualitative approaches through
the questionnaire. The quantitative approach uses the results from the closed questions
of the questionnaire to reveal the participants‟ judgments of the e-government
websites usability and credibility, while, the qualitative approach uses the results from
the open-ended questions to indicate the participants‟ further thoughts about the
usability and credibility of the e-government websites.
Performance measurement
Performance measurement is a process of assessing performance achievement. Within
the evaluation, the participants are required to accomplish a set of tasks on the target
e-government websites. It attempts to reveal the level of users‟ interaction with the
target e-government websites when users perform a set of practical tasks. Users‟
performance is measured by a set of performance criteria through observation. These
measurable criteria include the amount of online help required; time spent completing
tasks; number of steps to finish tasks and number of successful tasks completion. By
focusing on such criteria, it is helpful to measure the users‟ interaction with each

Usability and credibility evaluation of electronic governments: users‟ perspective Zhao Huang
Chapter 4 Methodology 74
target e-government website. In addition, to support comparative data analysis of the
performance results between experiment 1 and 2, the same measurable criteria used in
experiment 1 are applied to experiment 2. To observe the same aspects of the
participants‟ performance, the same performance measurement is followed for all the
tasks in experiment 1 and 2. Additionally, to avoid the potential problems of
differences among the participants due to different observers, the same observer is
involved in the two experiments.
4.4.2 Participants
To choose the number of the participants for the evaluation, Nielsen and Molich
(1990) found that half of the major problems can be identified by three participants.
Virzi (1992) detected that 80% of the problems will be found with between 4 and 5
participants and 90% of the problems can be found with 10 participants. Dumas and
Redish (1999) suggested 6 to 12 participants to join in evaluation, and argued that
additional participants are less and less likely to detect new information. Furthermore,
there is a need to consider research time, budget and importance of statistical
significance for the results. 36 participants are assigned to evaluate three target e-
government websites in experiment 1. Each target e-government website evaluation
involves 12 participants. In addition, to control research conditions and support
comparative data analysis between experiments 1 and 2, the same participants have
been also invited for experiment 2. 12 participants are allocated for each redesigned e-
government website, and they are the same participants who have taken part in
experiment 1. The participants who are enthusiastic to do evaluation are preferable
since this can reduce any motivation differences. To recruit the participants, some of
them are found from personal networks, which is an inexpensive way to get the
participants from the general public. In addition, other participants are recruited from
the public places such as local libraries, leisure centres, and universities.

Usability and credibility evaluation of electronic governments: users‟ perspective Zhao Huang
Chapter 4 Methodology 75
4.4.3 Research environment and materials
Research environment
To carry out the experiments, there is a need to define the research environment and
conditions (Rates, 2004), including the physical requirements. Firstly, it requires a
closed and quiet experimental room where only the participants and observer sit in.
Furthermore, necessary hardware, such as personal computer, Internet access, Internet
cable and wireless network card and software need to be pre-prepared in the
experimental study (see Figure 4.2).
Figure 4.2 Experimental room in the study
Research materials
To carry out the assessment, it is necessary to prepare all relevant materials for the
participants and the experiments. To protect the participants, the ethics approval letter
is applied and received (see Appendix 16). In addition, a consent form is developed
which provides detailed information about the participants‟ rights during the study
period (see Appendix 6). To introduce the experiment, an information sheet is offered
that briefly presents the study aim and experimental procedure (see Appendices 7a,
7b). To observe the participants‟ performance, a performance measurement form is
developed for the observer (see Appendix 12). Furthermore, in order to assess the
usability and credibility of the e-government websites, the task sheet, the usability and
credibility questionnaire have already been prepared.

Usability and credibility evaluation of electronic governments: users‟ perspective Zhao Huang
Chapter 4 Methodology 76
4.4.4 Experimental procedure
Experiments 1 and 2 follow the same experimental procedure. Each experiment is run
individually. It normally took one and half hours to complete the whole assessment.
Before the experiment commences, the participants are given a brief introduction to
the purpose of this experiment (see Appendices 7a, 7b). This is followed by an
evaluation protocol given to each participant with greeting words and consent form
(see Appendix 6). After that, the participants start their assessment, which consists of
three phases: free-flow inspection, task-based interaction and completing the
questionnaire. Free-flow inspection allows the participants to look through the target
e-government website several times. They can freely either look at the overall e-
government website or focus on the specific website design elements. In this way, it
can provide the participants with the initial interaction with e-government websites
and their general perception may be developed. Subsequently, the participants are
required to complete a set of tasks on the target e-government website. To deliver
these tasks to the participants, a task sheet is provided as an instrument to transfer and
describe the selected tasks to the participants (see Appendices 1a, 1b, 1c; 2a, 2b, 2c).
The participants are asked to implement the tasks one by one without time limit.
While the participants perform these tasks, their performance is observed. Having
accomplished all the tasks, the participants are finally asked to fill in the usability and
credibility questionnaire, in order to indicate their assessment of the target e-
government websites (see Appendices 4a, 4b, 4c; 5a, 5b, 5c).
4.4.5 Pilot study
A pilot study is a rehearsal which is conducted prior to the experiments
commencement (e.g. Cunliffe et al., 2001; Sonderegger and Sauer, 2010; Zaharias and
Poylymenakou, 2009). It aims to determine whether the experiments are appropriate
on a number of measures. The measures used in experiment 1 are as follows:
1. To examine the time for each task completion in order to provide reasonable
task selection
2. To examine the time taken to run the experiment so that this can be controlled

Usability and credibility evaluation of electronic governments: users‟ perspective Zhao Huang
Chapter 4 Methodology 77
at an acceptable level for the participants
3. To test whether the user task sheets are appropriate
4. To check whether the questions in the questionnaires are understandable and
will not be misinterpreted
5. To test whether the experimental procedure is appropriate
If any potential problems are found in the research pilot, corresponding adjustment
will take place. In addition, for the same purpose of experiment 2, a pilot study is also
carried out before experiment 2 starts. Although the experimental procedure used in
experiment 2 is same as experiment 1, the usability and credibility questionnaire, the
task sheet are different from experiment 1. In addition, the target e-government
websites will be redesigned based on the usability and credibility problems found in
experiment 1. Therefore, it is necessary to conduct another pilot study to determine
whether experiment 2 is appropriate on a number of measures. These measures for
experiment 2 are as follows:
1. To examine the time for each task completion in order to provide reasonable
task selection
2. To examine the time taken to run the experiment so that this can be controlled
at an acceptable level for the participants
3. To test whether the user task sheets are appropriate
4. To check whether the questions in the questionnaires are understandable and
will not be misinterpreted
5. To check whether the proposed design solutions are integrated well with the e-
government websites from experiment 1
6. To check the function of the redesigned e-government websites
7. To test whether the experimental procedure is appropriate
4.5 Data analysis
Having described and justified the research method and the experimental design in the
previous sections, both data obtained from the questionnaire and the performance
observation are analysed. This section discusses the data analysis techniques used in

Usability and credibility evaluation of electronic governments: users‟ perspective Zhao Huang
Chapter 4 Methodology 78
the study. It starts with the analysis of the statistical tests needed for this study. Then,
it identifies the appropriate data analysis method employed in this study by reviewing
relevant studies. Finally, it presents the specific statistical techniques for data analysis
used in the two experiments.
4.5.1 Selecting the appropriate analysis method
When analysing data, it is important to select the appropriate statistical tests. As
indicated by Foster (2001), choosing appropriate data analysis techniques are largely
dependent on the research aim. This research is an empirical study with two linked
experiments. Experiment 1 aims to evaluate usability and credibility based on users‟
perception and their performance toward three target London Authorities in the UK.
The aim of experiment 2 is to examine the effects of the proposed design solutions on
the usability and credibility problems found in experiment 1 on three redesigned
London Authorities.
More specifically, experiment 1 attempts to look for whether there are differences of
users‟ perception and performance among three target London Authorities. In addition,
it attempts to identify the usability and credibility strengths and problems by
indicating whether the participants‟ perception of specific feature of usability and
credibility has a difference on their perception of overall usability and credibility in
each target London Authority respectively. Regarding experiment 2, it attempts to
look for whether there is a significant difference in the participants‟ perception of the
specific usability and credibility feature between experiment 1 and 2. In terms of
users‟ performance, it attempts to investigate whether users‟ performance with the
redesigned e-government websites in experiment 2 has differences compared with
their performance in experiment 1.
Figure 4.3 identifies the statistical tests needed for this study. Based on the analysis
requirements, a one-way ANOVA is the most appropriate data analysis technique in
experiment 1 for analysing the differences among three sets of data (Pallant, 2001);
such as determining the differences of users‟ perception among three London
Authorities, and the differences of users‟ performance in three London Authorities.

Usability and credibility evaluation of electronic governments: users‟ perspective Zhao Huang
Chapter 4 Methodology 79
Furthermore, a one-sample T-test is most appropriate for the analysis of the
differences in two sets of data in experiment 1 (Hinton et al., 2004); such as the
differences between users‟ perception of overall usability and their perception of
specific usability features, and the differences between users‟ perception of overall
credibility and their perception of specific credibility features. In experiment 2, a
Paired-Samples T-test is most appropriate for comparing and analysing data between
two sets of data (Kinnear, 2008); such as comparing the differences in users‟
perception of the specific usability features between experiment 1 and experiment 2,
comparing the differences in users‟ perception of the specific credibility features
between experiments 1 and 2, and comparing the users‟ performance differences
between experiments 1 and 2.
Figure 4.3 Deciding which statistical test to use (Foster, 2001; p.21)
Furthermore, the one-way ANOVA; the one-sample T-test and the Paired-Samples T-
test have been popularly employed in a number of studies. Table 4.4 indicates relevant
Are you looking for a difference or a
relationship between scores?
Difference
Are you comparing a mean
with a single standard value? Yes
No
Do all the sets of scores come from different
respondents or are some sets from the same
respondents?
All from different respondents
How many sets of scores?
3 or more
One-way ANOVA One-sample t-test Paired-samples t-test
2
Same respondents
How many sets of scores?

Usability and credibility evaluation of electronic governments: users‟ perspective Zhao Huang
Chapter 4 Methodology 80
studies and presents the variables measured within relevant studies and data analysis
used. Evidence from these previous studies has suggested the usefulness of the one-
way ANOVA analysis for three sets of data or more, the one-sample T-test analysis
for two sets of data, and the Paired-Samples T-test for comparing the difference
between two variables.
Table 4.4 Data analysis used in relevant studies
Relevant studies Variables measurement Data analysis used
Ahmed et al. (2006) - Comparing performance differences between Novice and
experienced searchers
- Comparing performance differences among age, gender,
training, computer experience and status groups
- Independent
sample t-test
- One-way ANOVA
Choudrie and Gheorghita (2005) - Comparing user perceptions among age groups - One-way ANOVA
Cho, (2004) - Analysing the relationship between two designated factors - T-test
Dutta-Bergman (2004) - Examining the relationship among three variables of
completeness manipulation
- One-way ANOVA
Petrie and Kheir (2007) - Comparing mean ratings of severity of problems encountered
by blind and sighted participants
- Paired-Samples T-
test
Tormala et al., (2006) - Analysing the variance with source credibility as
independent variables and attitudes, perceived expertise, self-
reported elaboration, thought favourability as dependent
variables
- One-sample T-test
- Analysis variance
(ANOVA)
Fogg et al., (2001) - Investigating the participants‟ perception of credibility
features between age groups, gender groups, country groups
and education groups
- T-test
Collins, (2006) - Examining perceptions of web pages trust between two
participant groups
- Independent-
samples T-test
Ivory et al., (2001) - Exploring the different effects of the two groups of the
participants on each usability metric
- T-test
Tractinsky et al. (2006) - Comparing perceptions of website attractiveness among
three target groups
- ANOVA
4.5.2 Analysis methods
Analysis methods for experiment 1
As indicated, the data analysis techniques used for experiment 1 are the one-way
ANOVA and the one-sample T-test. Statistical analysis of the data is conducted using
the Statistical Package for Social Science (spss) for windows (version 13). The
significant value (P) is pre-defined as less than 0.05. The following is a detailed
explanation of the specific statistical techniques for data analysis in experiment 1:

Usability and credibility evaluation of electronic governments: users‟ perspective Zhao Huang
Chapter 4 Methodology 81
To indicate whether the three London Authorities have a difference towards the
participants‟ overall perception of usability and credibility, a one-way ANOVA is
conducted with three London Authorities as independent variables and usability and
credibility perception as dependent variables respectively.
To indicate whether there is a difference between the perception of overall usability
and the perception of specific usability features in each target London Authority, a
one-sample T-test is conducted. This analysis technique is also used to show whether
the perception of specific credibility features make a difference towards the
perception of overall credibility in each target London Authority.
To indicate whether the three London Authorities show differences in the participants‟
performance, a one-way ANOVA is employed with the three target London
Authorities as independent variables and performance in terms of the amount of
online help required; time spent completing tasks; number of steps to finish tasks and
number of successful tasks completion as dependent variables respectively.
To analyse the results from the open-ended questions of the questionnaire (i.e. the
qualitative data), a form of content analysis based on frequency of the participants‟
responses is used to indicate usability and credibility strengths and weaknesses in
each target London Authority respectively.
Analysis methods for experiment 2
A Paired-Samples T-test is used to analyse the data for experiment 2. The significant
value (P) is defined as less than 0.05. The detailed information for data analysis in
experiment 2 is:
For the each redesigned London Authority, to determine whether there is a difference
in users‟ perception of the specific usability features between experiment 1 and
experiment 2, a Paired-Samples T-test is used. This analysis technique is also used to
indicate whether users‟ perception of the specific credibility features in experiment 2
is different from their perception in experiment 1.

Usability and credibility evaluation of electronic governments: users‟ perspective Zhao Huang
Chapter 4 Methodology 82
In addition, for the each redesigned London Authority, to determine whether there is a
difference of users‟ performance in terms of the amount of online help required; time
spent completing tasks; number of steps to finish tasks and number of successful tasks
completion between experiment 1 and experiment 2, a Paired-Samples T-test is also
used.
To analyse the results from the open-ended questions of the questionnaire (i.e. the
qualitative data), a form of content analysis based on frequency of the participants‟
responses is used to indicate users‟ further thoughts about the proposed usability and
credibility design solutions in each redesigned e-government website respectively.
4.6 Summary and conclusion
This chapter describes the research methodology used in this study. It identifies and
justifies the experimental study as the most appropriate research strategy to be
employed in this study. To conduct the study, a mixed approach with an emphasis on
the quantitative elements is implemented. In addition, both quantitative data and
qualitative data are collected through the questionnaire and observation research
techniques. Moreover, research instruments and research design for the two
experiments are also indicated. The main research instruments are the selected e-
government websites, the tasks sheet and the usability and credibility questionnaire.
The research design covers the variables measurement, the participants, research
environment and materials, the experimental procedure and the pilot study. Data
analysis techniques employed in this research are also described based on the data
analysis requirements and the suggestions from relevant studies, which identifies that
the one-way ANOVA and the one-sample T-test are the most appropriate analysis
method for analysing data in experiment 1, and the Paired-Samples T-test is the most
suitable analysis technique for analysing data in experiment 2.
Having indicated the research methodology employed in this study, the following
chapters will present the research results. More specifically, the results of experiment
1 that evaluates the usability and credibility of the target e-government websites will
be presented in Chapter 5. Based on the identified usability and credibility problems,
Usability and credibility evaluation of electronic governments: users‟ perspective Zhao Huang
Chapter 4 Methodology 83
the proposed design solutions will be described in Chapter 6, and the results of
experiment 2 that assesses the improved usability and credibility will be presented in
Chapter 7.

Usability and credibility evaluation of electronic governments: users‟ perspective Zhao Huang
Chapter 5 Experiment 1: usability and credibility evaluation 84
CHAPTER 5
EXPERIMENT 1: USABILITY AND CREDIBILITY EVALUATION
5.1 Introduction
Having described in Chapter 4 the research methodology of the study, Chapter 5
presents and discusses the results of experiment 1. This chapter is designed to
investigate research questions 1 and 2 (RQ1: What are the existing usability problems
in current e-government websites? RQ2: What are the existing credibility problems in
current e-government websites?). More specifically, it aims to evaluate usability and
credibility on the basis of users‟ perception and performance toward three target
London Authorities. Users‟ perception employs the results from the questionnaires to
present usability and credibility assessment of each target e-government website,
while users‟ performance is measured through observation in order to indicate the
level of users‟ interaction with the target e-government websites. More significantly,
the effects of users‟ perception of usability and credibility on their performance are
also indicated.
This chapter is structured as follows. It starts with describing the participants (section
5.2), this is followed by presenting and discussing the results in terms of users‟
perception (section 5.3) and users‟ performance (section 5.4). Finally, the summary
and conclusion is presented in section 5.5.
5.2 Description of the participants and their responses
This section provides the description of the participants in relation to their
demographic information and responses. More specifically, the former is based on the
participants‟ characteristics in terms of gender, age and Internet use to indicate the
distribution of the participants in the three target e-government websites, while the
latter is used to reveal the distribution of data obtained from users‟ perception and

Usability and credibility evaluation of electronic governments: users‟ perspective Zhao Huang
Chapter 5 Experiment 1: usability and credibility evaluation 85
performance in each target e-government website. The following sub-sections present
the detailed description.
5.2.1 Description of the participants
Participants‟ demographic information includes gender, age and Internet use and is
collected through the questionnaire. A total of 36 participants took part in experiment
1, with 12 participants being randomly allocated for each target e-government website.
Tables 5.1 and 5.2 show the distribution of the participants‟ gender and age
characteristics in each e-government website assessed.
Table 5.1 Distribution of the gender characteristic
Male Female
N % N %
London Authority 1 6 50.0 6 50.0
London Authority 2 6 50.0 6 50.0
London Authority 3 7 58.3 5 41.7
Table 5.2 Distribution of the age characteristic
20-25 years old 26-30 years old 31-35 years old 36-40 years old 40+ years old
N % N % N % N % N %
London Authority 1 0 0 6 50 4 33.3 2 16.7 0 0
London Authority 2 1 8.3 4 33.3 4 33.3 1 8.3 2 16.7
London Authority 3 4 33.3 2 16.7 4 33.3 1 8.3 1 8.3
In addition, the participants‟ level of Internet use is also assessed through the
questionnaire in terms of the hours per week spent on the Internet. More specifically,
the mean of the participant level of Internet use in London Authority 1 is 3.75 hours
with a standard deviation of 1.42 hours. Regarding London Authority 2, the mean of
the participant level of Internet use is 3.58 hours with a standard deviation of 1.68
hours. In addition, the mean of the participant level of Internet use in London
Authority 3 is 4.33 hours with a standard deviation of 1.23 hours. Table 5.3 shows the
distribution of the participants‟ level of Internet use in three London Authorities.
Table 5.3 Distribution of the Internet use
Less than 4 hours 5-9 hours 10-14 hours 15-20 hours More than 20 hours
N % N % N % N % N %
London Authority 1 1 8.3 2 16.7 1 8.3 3 25.0 5 41.7

Usability and credibility evaluation of electronic governments: users‟ perspective Zhao Huang
Chapter 5 Experiment 1: usability and credibility evaluation 86
London Authority 2 2 16.7 2 16.7 1 8.3 1 8.3 6 50.0
London Authority 3 1 8.3 0 0 1 8.3 2 16.7 8 66.7
According to the participants‟ demographic information in terms of gender, age and
Internet use in each target London Authority, it seems that the participants are equally
allocated across the three target e-government websites. As a result, it may imply that
the distribution of the participants in each target London Authority is by and large
unbiased.
5.2.2 Description of the participants’ responses
The statistical analysis techniques used in this study (e.g. one-way ANOVA and one-
sample T-test) are only meaningful for the set of data that follows a normal
distribution. Thus, this section describes data obtained from users‟ perception and
performance to reveal whether the distribution of these sets of data follows a normal
distribution. To assess distribution normality, the one sample Kolmogorov-Smirnov
test (K-S test) is considered appropriate since it is commonly used to statistically
analyze data normality (Foster, 2001; Hinton et al., 2004), and a number of studies
have proven its usefulness and validity (Kinnear, 2008; Pallant, 2001). Thus, a one
sample K-S test is used for determining whether or not the participants‟ responses to
the usability and credibility questionnaires in each target e-government website follow
a standard normal distribution. Equally, a one sample K-S test is employed to indicate
whether or not the set of data from the participants‟ performance with each e-
government website assessed is a standard normal distribution. Within the one sample
K-S test, significant P-value indicates the probability that the sample distribution is
different from an expected probability distribution (e.g. a normal distribution). If the
significant value (P-value) is greater than 0.05, it indicates that the data set follows a
normal distribution. Conversely, results suggest the distribution of the set of data is
not a normal distribution when the significant value (P-value) is less than 0.05.
Tables 5.4, 5.5 and 5.6 present the results of one sample K-S test regarding the
participants‟ responses of the usability and credibility questions in London Authority
1, 2 and 3 respectively. As shown in Table 5.4, the results of one sample K-S test
indicate that the significances of the participants‟ responses to the usability questions

Usability and credibility evaluation of electronic governments: users‟ perspective Zhao Huang
Chapter 5 Experiment 1: usability and credibility evaluation 87
and the credibility questions in London Authority 1 are greater than the P-value of
0.05. Therefore, it implies that the distribution of the participants‟ responses to the
usability and credibility questions in London Authority 1 follows a normal
distribution. With respect to London Authority 2, the one sample K-S test results
reveal that the significances of the participants‟ responses to the usability questions
and the credibility questions are both more than P=0.05 (see Table 5.5). It suggests
that the distribution of the participants‟ responses to the usability and credibility
questions in London Authority 2 is a normal distribution. With regard to London
Authority 3, the significances of the one sample K-S test in terms of the participants‟
responses to the usability questions and the credibility questions are presented in
Table 5.6, which are both greater than the predefined P-value 0.05. As such, it appears
to indicate that the distribution of the participants‟ responses to the usability and
credibility questions in London Authority 3 follows a normal distribution (see
Appendix 13a for the detailed one sample K-S test results).
Table 5.4 Usability and credibility responses distribution in London Authority 1
London Authority 1 Usability questions responses Credibility questions responses
Significance 0.512 0.701
Table 5.5 Usability and credibility responses distribution in London Authority 2
London Authority 2 Usability questions responses Credibility questions responses
Significance 0.241 0.820
Table 5.6 Usability and credibility responses distribution in London Authority 3
London Authority 3 Usability questions responses Credibility questions responses
Significance 0.279 0.238
Additionally, Tables 5.7, 5.8 and 5.9 present the one sample K-S test results of the
participants‟ performance in London Authority 1, 2 and 3 respectively. In detail, as
shown in Table 5.7, the significance of the participants‟ performance in terms of time
spent completing tasks; number of steps to finish tasks; the amount of online help
required and number of successful tasks completion in London Authority 1 is greater
than the predefined P-value 0.05. Accordingly, the findings suggest that the
distribution of the participants‟ performance with London Authority 1 follows a
normal distribution (see Appendix 13a for the detailed one sample K-S test results).

Usability and credibility evaluation of electronic governments: users‟ perspective Zhao Huang
Chapter 5 Experiment 1: usability and credibility evaluation 88
Regarding London Authority 2, Table 5.8 shows that the significance of the
participants‟ performance in aspects of time spent completing tasks; number of steps
to finish tasks; the amount of online help required, and number of successful tasks
completion is more than P=0.05. Thus, it indicates that the distribution of the
participants‟ performance with London Authority 2 follows a normal distribution (see
Appendix 13a for the detailed one sample K-S test results).
Furthermore, the one sample K-S test results reveal that the significance of the
participants‟ performance with London Authority 3 in terms of time spent completing
tasks; number of steps to finish tasks, and number of successful tasks completion is
greater than P-value 0.05. However, as there is no help required for tasks completion
in London Authority 3, this significant value becomes not available (see Table 5.9).
Accordingly, these findings imply that the distribution of the participants‟
performance in terms of time spent completing tasks; number of steps to finish tasks,
and number of successful tasks completion with London Authority 3 follows a normal
distribution (see Appendix 13a for the detailed one sample K-S test results).
Table 5.7 Performance distribution in London Authority 1
London Authority 1 Total time for all
tasks completion
Number of steps to
complete tasks
Helps required for
tasks completion
Number of successful
tasks completion
Significance 0.841 0.968 0.130 0.390
Table 5.8 Performance distribution in London Authority 2
London Authority 2 Total time for all
tasks completion
Number of steps to
complete tasks
Helps required for
tasks completion
Number of successful
tasks completion
Significance 0.371 0.818 0.203 0.141
Table 5.9 Performance distribution in London Authority 3
London Authority 3 Total time for all
tasks completion
Number of steps to
complete tasks
Helps required for
tasks completion
Number of successful
tasks completion
Significance 0.949 0.750 N/A 0.102

Usability and credibility evaluation of electronic governments: users‟ perspective Zhao Huang
Chapter 5 Experiment 1: usability and credibility evaluation 89
5.3 Users’ perception
Users‟ perception is the participants‟ opinion and choices from a range of options
through the usability and credibility questionnaire. It aims to evaluate usability and
credibility of the target e-government websites. Both quantitative and qualitative data
are collected to indicate users‟ perception of usability and credibility for each target e-
government website. More specifically, the former applies the results from the closed
questions of the questionnaire to indicate the participants‟ assessments of usability
and credibility (section 5.3.1), while, the latter presents the participants‟ further
thoughts on the successful and problematic features of the e-government websites
from the open-ended questions of the questionnaire to point out the usability and
credibility strengths and weaknesses (section 5.3.2).
5.3.1 Users’ perception: quantitative data
This section details the participants‟ perception of usability and credibility of each
target e-government website from quantitative data. This section contains three parts,
which are the overall users‟ perception, users‟ perception of strengths and users‟
perception of problems. The overall perception describes the overview assessment of
usability and credibility of the three target e-government websites. Users‟ perception
of strengths and problems presents the detailed level of assessment, in which the sets
of usability and credibility strengths and problems have been identified in each target
e-government website respectively. The following sub-sections report the results in
these areas.
5.3.1.1 Overall users’ perception of usability and credibility
The overall perception is used to indicate the participants‟ overview evaluation of
usability and credibility for each target e-government website. In addition, it can
comparatively analyse the overall usability and credibility assessment among the three
e-government websites. As shown in Table 5.10, the results of the one-way ANOVA
show that there is a significant difference in the overall participants‟ perception of
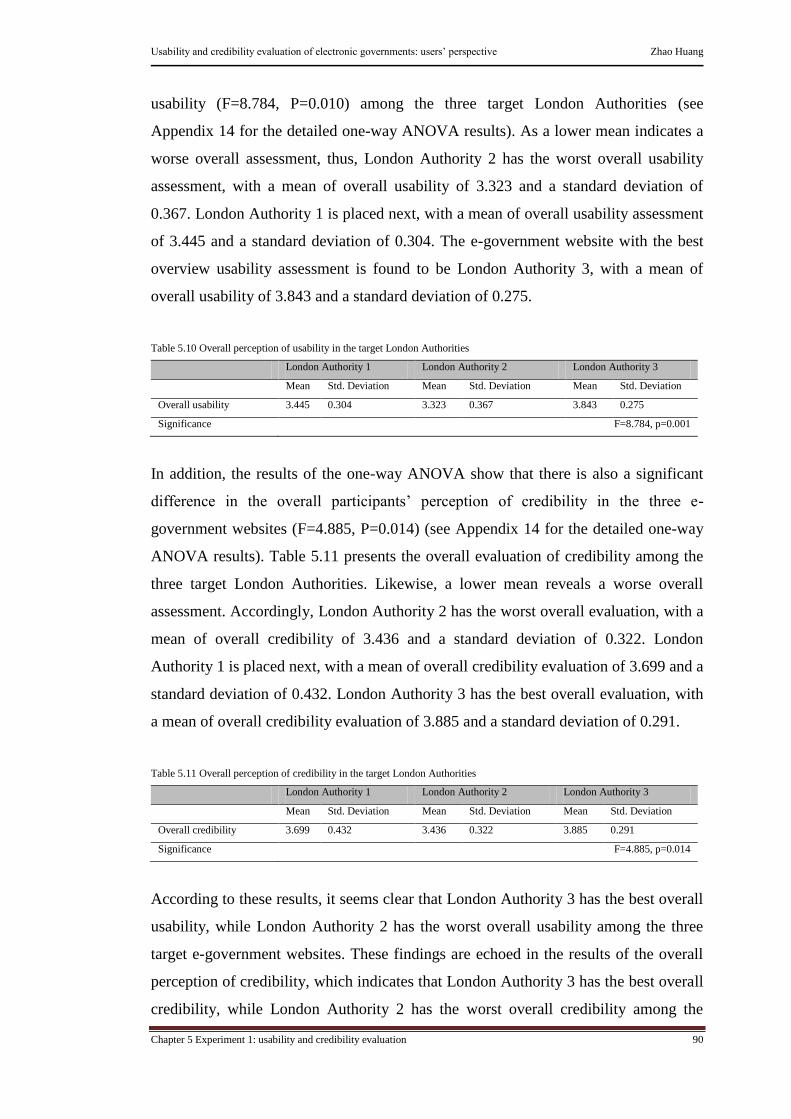
Usability and credibility evaluation of electronic governments: users‟ perspective Zhao Huang
Chapter 5 Experiment 1: usability and credibility evaluation 90
usability (F=8.784, P=0.010) among the three target London Authorities (see
Appendix 14 for the detailed one-way ANOVA results). As a lower mean indicates a
worse overall assessment, thus, London Authority 2 has the worst overall usability
assessment, with a mean of overall usability of 3.323 and a standard deviation of
0.367. London Authority 1 is placed next, with a mean of overall usability assessment
of 3.445 and a standard deviation of 0.304. The e-government website with the best
overview usability assessment is found to be London Authority 3, with a mean of
overall usability of 3.843 and a standard deviation of 0.275.
Table 5.10 Overall perception of usability in the target London Authorities
London Authority 1 London Authority 2 London Authority 3
Mean Std. Deviation Mean Std. Deviation Mean Std. Deviation
Overall usability 3.445 0.304 3.323 0.367 3.843 0.275
Significance F=8.784, p=0.001
In addition, the results of the one-way ANOVA show that there is also a significant
difference in the overall participants‟ perception of credibility in the three e-
government websites (F=4.885, P=0.014) (see Appendix 14 for the detailed one-way
ANOVA results). Table 5.11 presents the overall evaluation of credibility among the
three target London Authorities. Likewise, a lower mean reveals a worse overall
assessment. Accordingly, London Authority 2 has the worst overall evaluation, with a
mean of overall credibility of 3.436 and a standard deviation of 0.322. London
Authority 1 is placed next, with a mean of overall credibility evaluation of 3.699 and a
standard deviation of 0.432. London Authority 3 has the best overall evaluation, with
a mean of overall credibility evaluation of 3.885 and a standard deviation of 0.291.
Table 5.11 Overall perception of credibility in the target London Authorities
London Authority 1 London Authority 2 London Authority 3
Mean Std. Deviation Mean Std. Deviation Mean Std. Deviation
Overall credibility 3.699 0.432 3.436 0.322 3.885 0.291
Significance F=4.885, p=0.014
According to these results, it seems clear that London Authority 3 has the best overall
usability, while London Authority 2 has the worst overall usability among the three
target e-government websites. These findings are echoed in the results of the overall
perception of credibility, which indicates that London Authority 3 has the best overall
credibility, while London Authority 2 has the worst overall credibility among the

Usability and credibility evaluation of electronic governments: users‟ perspective Zhao Huang
Chapter 5 Experiment 1: usability and credibility evaluation 91
three e-government websites evaluated. Therefore, it suggests that overall London
Authority 2 has the worst assessment of usability and credibility in the three target e-
government websites. This is followed by London Authority 1. The e-government
website with best overall usability and credibility assessment is shown to be London
Authority 3.
Furthermore, based on these overall findings, it is interesting to see the relationship
between usability and credibility. More specifically, the results show that London
Authority 3 has the best overall usability, which is associated with the best overall
credibility, and vice versa. Similarly, London Authority 2 has the worst overall
usability, which is associated with the worst overall credibility, and vice versa.
Accordingly, it may imply that usability and credibility have a close correlation. In
other words, users‟ perception of usability and credibility positively influence each
other. Such findings appear to support the results from previous studies (Fogg et al.,
2001; Carter and Bélanger, 2005; Garcia et al., 2005), which found that there is an
interrelationship between usability and credibility in web-based online systems. As
suggested by Fogg et al. (2000), usability improvement is very likely to enhance
credibility. Equally, credibility closely relates to usability in web design, which has
the mutual impact between them (Nielsen, 1999). As such, usability and credibility
may need to be considered together.
5.3.1.2 Users’ perception of usability and credibility strengths
Having indicated the overall perception of usability and credibility, this section
describes the detailed level of the participants‟ perception in terms of usability and
credibility strengths for each target London Authority. To identify the usability and
credibility strengths, a one-sample T-test is firstly used to determine whether each
usability and credibility feature perceived has a significant difference towards the
perception of overall usability and credibility respectively. If a significant difference
is indicated, the usability feature with a mean score greater than the overall usability
mean score is selected as a usability strength. Likewise, the credibility feature with a
mean score greater than the overall credibility mean score is selected as a credibility
strength. In addition, among the usability and credibility strengths identified, a higher

Usability and credibility evaluation of electronic governments: users‟ perspective Zhao Huang
Chapter 5 Experiment 1: usability and credibility evaluation 92
mean score presents a more outstanding strength. In this way, a number of the
usability and credibility strengths have been found in each target e-government
website. Tables 5.12, 5.13, 5.14, 5.15, 5.16 and 5.17 display all the usability and
credibility strengths identified in London Authority 1, 2 and 3 respectively. The
following sub-sections present and discuss these usability and credibility strengths.
London Authority 1
Based on the one-sample T-test results, there are a number of usability and credibility
strengths that have been found in London Authority 1, which are presented in Tables
5.12 and 5.13 (see Appendix 8a for the detailed one-sample T-test results). Table 5.12
presents all the identified usability strengths in London Authority 1. As shown in the
table, the most significant usability strength detected is that users can easily move
forward and backward within the different fields of the e-government website. For
example, the left side menu bar on every page presents the links of the visited places
and provides further movement options, so that users can easily go backward and
forward by clicking relevant links or options within the site (see Figure 5.1). The
provision of forward and backward function is used to form navigation cues, which
can facilitate site orientation. It can reinforce users‟ ability to ascertain their
navigational control, so that users can guide their movement around the site to locate
related objects. As indicated by Lemahieu (2002), forward and backward navigation
buttons are very efficient means for navigating, which supports users‟ efficiency of
information retrieval (Tung et al., 2003). Accordingly, the usability strength of easy
forward and backward movement within the different fields of London Authority 1
strengthens the site navigation capability, which may support users‟ movement
around the site to achieve their desirable services outcomes.

Usability and credibility evaluation of electronic governments: users‟ perspective Zhao Huang
Chapter 5 Experiment 1: usability and credibility evaluation 93
Figure 5.1 Easy forward and backward movements within London Authority 1
Table 5.12 Usability strengths in London Authority 1
Usability strengths Mean (Std. deviation )
Users can move forward and backward within different fields of the site. 4.33 (0.49)
Significance T=6.215, P=0.000
Site offers “A-Z” service that supports users to quick find the relevant information for the
specific tasks.
4.08 (0.79)
Significance T=2.767, P=0.018
Different displays on each page are compatible through the site 3.92 (0.52)
Significance T=3.139, P=0.009
In addition, a usability strength found in London Authority 1 is that the site offers an
“A-Z” service category that supports users to quickly find the relevant information
and service (see Figure 5.2). An “A-Z” service category is used to aid services access,
performing two main functions: organising a variety of services offered by the e-
government into alphabetical order, and helping users to access the relevant service
quickly and easily. By providing such a feature, users can speed up their subject
identification (Brinck et al., 2002), and easily access relevant services without going
through the multiple menu levels. Therefore, it may improve users‟ subject searching
effectiveness.
Moving
backward
links
Moving
forward
options

Usability and credibility evaluation of electronic governments: users‟ perspective Zhao Huang
Chapter 5 Experiment 1: usability and credibility evaluation 94
Figure 5.2 “A-Z” quick service category provision in London Authority 1
Furthermore, a usability strength identified is that different display elements on each
page are compatible through the site. For example, text font, font size, text density
and white space are employed appropriately for content presentation. Display
compatibility refers to harmonious presentation in terms of text size, content space,
chosen colour and images on the site. It can visually build effective communication
with users, supporting the site‟s overall aesthetics and reducing content complexity.
As indicated by Tuch (2009), visual complexity results in users‟ reaction time delay
and object cognition difficulty. Therefore, when different aesthetic elements are
compatible on the London Authority 1 website, it can reduce the website‟s visual
complexity and promote the content presentation, so that users may more easily read
information and conduct services within the site.
Table 5.13 Credibility strengths in London Authority 1
Credibility strengths Mean (Std. deviation )
The URL properly presents the domain name of the local council. 4.33 (0.65)
Significance T=3.368, P=0.006
The content of the site matches with information user expect to obtain from a local council. 4.25 (0.45)
Significance T=4.213, P=0.001
Some personal services are protected with a password. 4.17 (0.72)
Significance T=2.252, P=0.046
Moreover, Table 5.13 shows all the credibility strengths detected in London Authority
1. Among these credibility strengths, the most significant one is that the URLs
properly present the domain name of London Authority 1. For instance, URL on each
page is clearly presented by “http://www. London Authority 1.gov.uk”. The URL is
used to specify the resource address on the World Wide Web. It generally starts with
the protocol specification and ends with the domain name. The correct URL ensures
the correct access to the corresponding website, which is regarded as a visual
“A-Z”
services
category
provision

Usability and credibility evaluation of electronic governments: users‟ perspective Zhao Huang
Chapter 5 Experiment 1: usability and credibility evaluation 95
reference to decipher information source (Nielsen, 2000). As such, the proper URL
indication of London Authority 1 may help users to validate the resource location, so
that users can easily judge whether information and services retrieved are provided by
the relevant physical government organization.
The next credibility strength found in London Authority 1 is that the content of the
site matches with information users expect to obtain from a local council. For
example, a range of services, such as council tax, housing advice and building control,
provide relevant and detailed information to meet users‟ needs. Content design is a
key component in determining website usage (Huizingh, 2000). It requires offering
quality information and services to indicate the real government organisation working
behind the site. When users get to the site, they look in the main content area of the
site and want to know what the content is about. If they find that the content fits their
expectations, they may take the further action within the site. Therefore, the feature
that the content matches with information users expect may encourage users‟ service
involvement within London Authority 1.
Another credibility strength identified in London Authority 1 is that some personal
services are protected by a password. For example, when users track the progress of a
single person council tax discount application, a login mechanism is required on the
site (see Figure 5.3). Private information and services on e-government need to be
protected (Al-Omari and Al-Omari, 2006), so that only authorized users gain access to
the information. A login requirement is used as a common protection mechanism for
user authentication, which ensures such information and services safety (Vu et al.,
2007) and reduces users‟ perception of risk. As such, the credibility feature of users‟
personal services being protected by a password increases services security, which
may encourage users‟ engagement with information exchange and online services
transaction within London Authority 1.
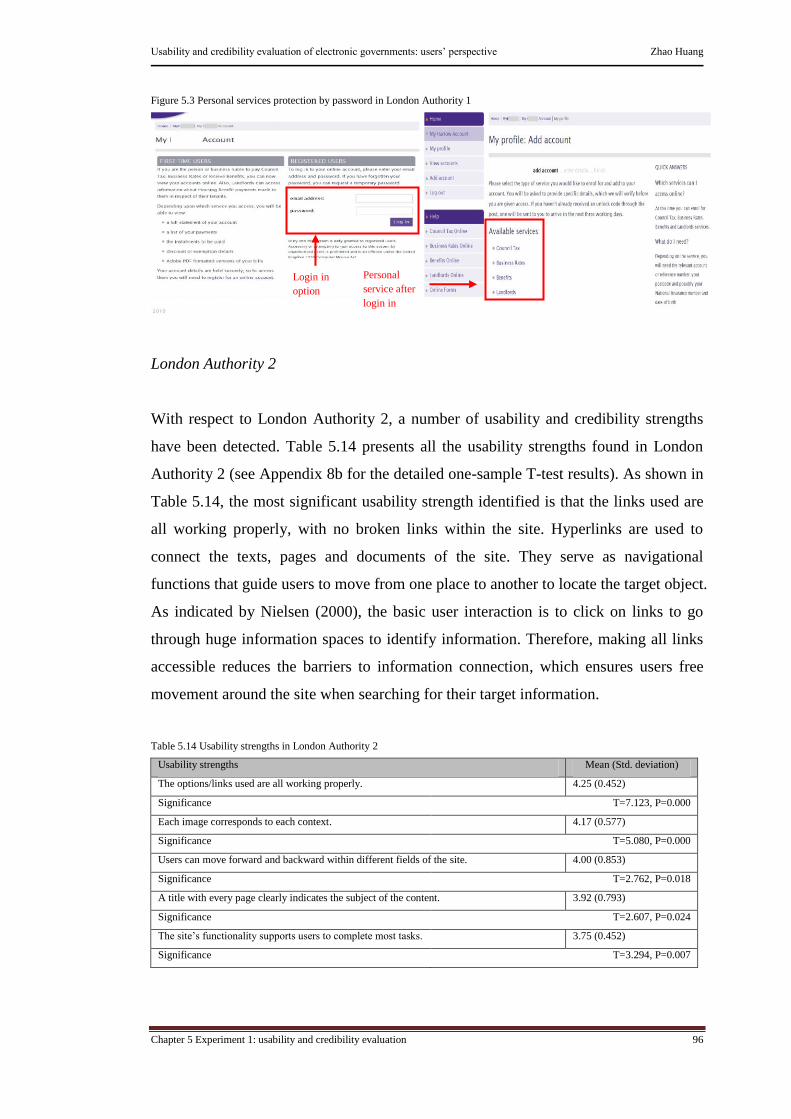
Usability and credibility evaluation of electronic governments: users‟ perspective Zhao Huang
Chapter 5 Experiment 1: usability and credibility evaluation 96
Figure 5.3 Personal services protection by password in London Authority 1
London Authority 2
With respect to London Authority 2, a number of usability and credibility strengths
have been detected. Table 5.14 presents all the usability strengths found in London
Authority 2 (see Appendix 8b for the detailed one-sample T-test results). As shown in
Table 5.14, the most significant usability strength identified is that the links used are
all working properly, with no broken links within the site. Hyperlinks are used to
connect the texts, pages and documents of the site. They serve as navigational
functions that guide users to move from one place to another to locate the target object.
As indicated by Nielsen (2000), the basic user interaction is to click on links to go
through huge information spaces to identify information. Therefore, making all links
accessible reduces the barriers to information connection, which ensures users free
movement around the site when searching for their target information.
Table 5.14 Usability strengths in London Authority 2
Usability strengths Mean (Std. deviation)
The options/links used are all working properly. 4.25 (0.452)
Significance T=7.123, P=0.000
Each image corresponds to each context. 4.17 (0.577)
Significance T=5.080, P=0.000
Users can move forward and backward within different fields of the site. 4.00 (0.853)
Significance T=2.762, P=0.018
A title with every page clearly indicates the subject of the content. 3.92 (0.793)
Significance T=2.607, P=0.024
The site‟s functionality supports users to complete most tasks. 3.75 (0.452)
Significance T=3.294, P=0.007
Login in
option
Personal
service after
login in

Usability and credibility evaluation of electronic governments: users‟ perspective Zhao Huang
Chapter 5 Experiment 1: usability and credibility evaluation 97
The next usability strength identified in London Authority 2 is that the images used
correspond to relevant context (see Figure 5.4). Images are used to support graphic
design. With proper content-related image utilization, it can facilitate text presentation
and increase the site‟s visual communication. Marsico and Levialdi (2004) indicated
that, using images related to content provides cognitive support, which can lighten the
cognitive load and speed up interaction. Thus, the usability strength that the images
used in London Authority 2 correspond to relevant context supports content
presentation, so that users can quickly capture and understand subject content
information presented on the site.
Figure 5.4 Images with context in London Authority 2
Additionally, a usability strength found in London Authority 2 is the easy forward and
backward movement within the different fields of the site. For example, when users
complete online forms, the next and review buttons are clearly presented to support
going forward and backward (see Figure 5.5). As indicated before, the provision of
forward and backward function is used to strengthen the site orientation, which
increases users‟ navigational control to move around the site to identify the target
object. Lemahieu (2002) showed that forward and backward navigation buttons are
very efficient means for navigating, which helps users‟ efficiency of information
searching (Tung et al., 2003). Consequently, the usability strength that users can
easily move forward and backward within the different fields of London Authority 2
may increase the site navigation, so that users can easily guide their movement around
the site to find the target information.
Image used
corresponds to
text
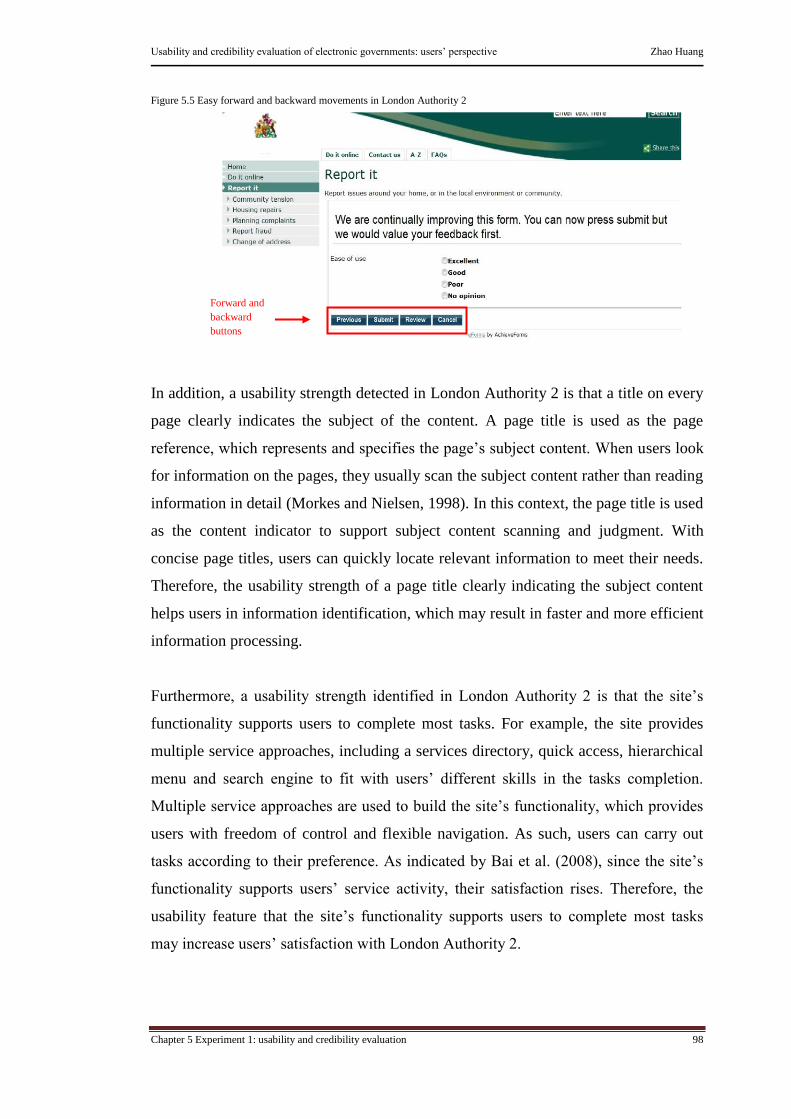
Usability and credibility evaluation of electronic governments: users‟ perspective Zhao Huang
Chapter 5 Experiment 1: usability and credibility evaluation 98
Figure 5.5 Easy forward and backward movements in London Authority 2
In addition, a usability strength detected in London Authority 2 is that a title on every
page clearly indicates the subject of the content. A page title is used as the page
reference, which represents and specifies the page‟s subject content. When users look
for information on the pages, they usually scan the subject content rather than reading
information in detail (Morkes and Nielsen, 1998). In this context, the page title is used
as the content indicator to support subject content scanning and judgment. With
concise page titles, users can quickly locate relevant information to meet their needs.
Therefore, the usability strength of a page title clearly indicating the subject content
helps users in information identification, which may result in faster and more efficient
information processing.
Furthermore, a usability strength identified in London Authority 2 is that the site‟s
functionality supports users to complete most tasks. For example, the site provides
multiple service approaches, including a services directory, quick access, hierarchical
menu and search engine to fit with users‟ different skills in the tasks completion.
Multiple service approaches are used to build the site‟s functionality, which provides
users with freedom of control and flexible navigation. As such, users can carry out
tasks according to their preference. As indicated by Bai et al. (2008), since the site‟s
functionality supports users‟ service activity, their satisfaction rises. Therefore, the
usability feature that the site‟s functionality supports users to complete most tasks
may increase users‟ satisfaction with London Authority 2.
Forward and
backward
buttons

Usability and credibility evaluation of electronic governments: users‟ perspective Zhao Huang
Chapter 5 Experiment 1: usability and credibility evaluation 99
Table 5.15 Credibility strengths in London Authority 2
Credibility strengths Mean (Std. deviation )
The content of the site matches with information user expect to obtain from a local council. 4.08 (0.515)
Significance T=4.328, P=0.001
The site does not present too many irrelevant promotion contents. 4.00 (0.739)
Significance T=2.627, P=0.024
The URL properly presents the domain name of the local council. 3.83 (0.577)
Significance T=2.360, P=0.038
There are also a number of credibility strengths that have been found in London
Authority 2 and they are presented in Table 5.15 (see Appendix 8b for the detailed
one-sample T-test results). Among these credibility strengths, the most significant
credibility strength identified is that the content of the site matches with information
users expect to obtain from the local council. For example, a wide range of
government services, such as education, health and social care are offered with
detailed information to meet users‟ requirements. Content is the foremost website
design guideline (Nielsen, 2000), which requires providing quality information and
services to indicate the real government organisation working behind the site. When
users get to the site, they always look at the content first and make quick judgments
about what the site is about. If they find that the content fits with their expectations,
they may continue with further tasks within the site. Therefore, the credibility feature
that the content matches with users expectations may encourage users‟ services
engagement within London Authority 2.
Furthermore, a credibility strength identified in London Authority 2 is that limited
promotional content is presented on the site. Promotional content is online
advertisement that delivers commercial messages for business purposes. Such
promotional content needs to be restricted on the site because too many adverts can be
distracting for users, and lead to the consideration of the commercial implications of
the site (Sillence et al., 2006). As such, with limited promotional content presentation
on London Authority 2, users can easily distinguish information from advertisement
content, and keep their concentration on the subject information during information
seeking.
Additionally, a credibility strength detected in London Authority 2 is that the URL
appropriately presents the domain name of the local council. For example, each

Usability and credibility evaluation of electronic governments: users‟ perspective Zhao Huang
Chapter 5 Experiment 1: usability and credibility evaluation 100
page‟s URL in London Authority 2 starts with “http://www.London Authority
2.gov.uk”. The URL is commonly used to specify the resource address on the World
Wide Web. It generally consists of the protocol specification and the domain name.
The correct URL ensures correct access to the website, therefore it is regarded as a
visual reference to decipher the information source (Nielsen, 2000). As such, the
proper indication of the URL on London Authority 2 may help users to validate the
resource location, so that they can quickly match and judge whether information and
services retrieved are offered by the relevant physical government organization.
London Authority 3
Based on the one-sample T-test, there are a number of usability and credibility
strengths that have been found in London Authority 3 (see Appendix 8c for the
detailed one-sample T-test results). Table 5.16 reveals all the usability strengths
identified in London Authority 3. Among them, the most significant usability
strengths identified are the consistent display format cross the pages, and the
provision of multiple service approaches for tasks completion. The consistent display
format is used to establish the consistent layout, strengthening visual unity throughout
the e-government website. It visually helps users understand that the information
arranged is presented in the same way across the pages. As indicated by Tractinsky et
al. (2006), a consistent website increases aesthetics expression, which affects users‟
cognitive reactions and usage patterns throughout the website. As such, the usability
feature of the consistent display format in London Authority 3 may help users‟
understanding of information presentation, so that they may quickly follow the
consistent display to locate the information to meet their needs. Another most
significant usability strength is the provision of multiple service approaches for tasks
completion. Multiple service approaches, such as a services directory, quick access
and search engines, are used to support the site‟s functionality, which provides users
with freedom of control and flexible navigation. These functions can help users
conduct tasks in their preferred way. As indicated by Bai et al. (2008), since the site‟s
functionality supports users‟ service activity, users‟ satisfaction raises. Therefore, the
usability feature that the site‟s functionality supports users to complete most tasks
may increase users‟ satisfaction with London Authority 3.

Usability and credibility evaluation of electronic governments: users‟ perspective Zhao Huang
Chapter 5 Experiment 1: usability and credibility evaluation 101
Table 5.16 Usability strengths in London Authority 3
Usability strengths Mean (Std. deviation )
Each page is always followed the same display format. 4.67 (0.492)
Significance T=5.816, P=0.000
The site‟ functionality supports users to complete most tasks. 4.67 (0.492)
Significance T=5.816, P=0.000
A title on every page clearly indicates the subject of the content. 4.58 (0.669)
Significance T=3.852, P=0.003
Key information/subject is placed in a central location on the page. 4.50 (0.674)
Significance T=3.391, P=0.006
It is easy to operate the e-government website. 4.42 (0.669)
Significance T=2.988, P=0.012
It is quick to change the particular data in a previous section so users do not need to retype all
the data when they go back.
4.42 (0.793)
Significance T=2.519, P=0.029
Users can move forward and backward within the site. 4.25 (0.622)
Significance T=2.285, P=0.043
In addition, a usability strength found in London Authority 3 is that a title on every
page clearly indicates the subject of the content. A page title is used as the page
reference, which represents and specifies the page‟s subject content. When searching
for information through the site, users usually scan the subject content rather than
reading information words by words (Morkes and Nielsen, 1998). In this regards, the
page title acts as an indicator for users in scanning the subject content. With concise
page titles, users can quickly capture the subject information of the pages and locate
relevant information to meet their needs. Therefore, the usability feature of a page title
clearly indicating the subject content helps users in information identification, which
may result in faster and more efficient information seeking.
Moreover, a usability strength identified in London Authority 3 is that the key
information/subject is placed in a central location on the page (see Figure 5.6). Central
location is a focal point where it is used to emphasise the key element of a page. Since
information/subject is presented in such a location, it makes the information/subject
stand out and controls the users‟ gaze, drawing attention to the main area of the page.
Hence, users may quickly get the important information/subject.

Usability and credibility evaluation of electronic governments: users‟ perspective Zhao Huang
Chapter 5 Experiment 1: usability and credibility evaluation 102
Figure 5.6 Key information location in London Authority 3
Another usability strength found in London Authority 3 is that the e-government
website is easy to operate. For example, users can simply type key words in the search
engine within the site to locate the target information. Furthermore, the site provides
users with clear instructions in support of online service transactions. Ease of
operation refers to ease of use, in which users can easily use a variety of functions
within the site to achieve their service goal. It influences users‟ service performance
and subjective satisfaction. As indicated by Hung et al. (2006), users‟ attitude and
performance toward e-government services is determined by the site‟ ease of use,
which in turn, affects users‟ acceptance of e-government websites. As a result,
features of the site ease of operation supports the site utilization, so that users can
easily use the site to achieve their desirable service outcomes.
The next usability strength detected in London Authority 3 is that users can quickly
change the particular data in the previous section without retyping all the data when
they go back. For example, during completing of the online complaint form, users can
quickly change the errors in the previous pages without retyping data in other fields
(see Figure 5.7). Changing the specific errors without influencing other data is used to
help users recognize and recover data from errors. It can attract users‟ attention on
particular fields of errors and help them in error recovery. Meanwhile, it can also
reduce the chances that users make new errors when they retype data in other fields.
As such, when a specific piece of information is in error, users can quickly
concentrate on the error field and correct the errors, which may lead to effective error
recovery in London Authority 3.
Key information is
placed in a central
location

Usability and credibility evaluation of electronic governments: users‟ perspective Zhao Huang
Chapter 5 Experiment 1: usability and credibility evaluation 103
Figure 5.7 Changing particular data in previous section without retyping all data in London Authority 3
Furthermore, a usability strength found in London Authority 3 is that users can easily
move forward and backward within the site. For example, during information seeking,
the breadcrumbs bar and the multiple menu levels allow easily accessible to the
previous and following pages (see Figure 5.8). The provision of forward and
backward function is used to strengthen site orientation, which supports users‟
navigational control to move around the site to locate target information. As indicated
by Lemahieu (2002), moving forward and backward function is a very efficient way
for navigating, which helps users‟ efficiency in information seeking (Tung et al.,
2003). Accordingly, easy moving forward and backward within London Authority 3
may improve the site navigation, so that users may easily guide their movement to
find the target information.
Figure 5.8 Easy forward and backward movements in London Authority 3
An error
Original data remains
in other fields after
moving back
Moving
backward
links
Moving
forward
links

Usability and credibility evaluation of electronic governments: users‟ perspective Zhao Huang
Chapter 5 Experiment 1: usability and credibility evaluation 104
Table 5.17 Credibility strengths in London Authority 3
Credibility strengths Mean (Std. deviation )
The site does not present too much irrelevant promotional content. 4.92 (0.289)
Significance T=12.320, P=0.000
The URL properly presents the domain name of the local council. 4.83 (0.389)
Significance T=8.395, P=0.000
The “Contact” option has been clearly indicated. 4.75 (0.452)
Significance T=6.587, P=0.000
A postal address for the local council offices clearly presents on the site. 4.67 (0.492)
Significance T=5.464, P=0.000
Information presented in a page matches the names of the categories. 4.58 (0.669)
Significance T=3.592, P=0.004
Users can quickly start their tasks because site is easy to use. 4.58 (0.793)
Significance T=3.029, P=0.011
Information presented on the site can encourage users to believe in the reliability of the local
council.
4.50 (0.674)
Significance T=3.134, P=0.010
The results of the one-sample T-test also indicate a number of credibility strengths in
London Authority 3 (see Appendix 8c for the detailed one-sample T-test results). As
shown in Table 5.17, among these credibility strengths, the most significant one is
that there is not too much irrelevant promotional content in London Authority 3. As
described, promotional content is used to deliver commercial adverts for business
purposes. Such promotional content needs to be limited, since too many adverts can
be distracting for users. Thus, with limited presentation of promotional content in
London Authority 3, users may easily distinguish information from advertising
content, and keep their focus on the subject information during information seeking.
Furthermore, a credibility strength found in London Authority 3 is that the URL
properly presents the domain name of the local council. For example, each pages‟
URL clearly indicates “http://www.London Authority 3.gov.uk”. The URL is used to
specify the resource address on the World Wide Web. It generally consists of the
protocol specification and the domain name. The correct URL ensures correct access
to the website and is regarded as a visual reference to decipher the information source
(Nielsen, 2000). As such, with the proper indication of the URL on London Authority
3, users may gain access to corresponding website and easily validate the resource
location. In particular, it may support users‟ judgment about whether information and
services retrieved are supplied by relevant government organization as expected.

Usability and credibility evaluation of electronic governments: users‟ perspective Zhao Huang
Chapter 5 Experiment 1: usability and credibility evaluation 105
Another credibility strength identified in London Authority 3 is that the “contact us”
option is clearly indicated on the e-government website (see Figure 5.9). The contact
option is used to link contact details, including telephone number, feedback form and
email address. It serves for quick access to e-government contact information for
users. As indicated by Kappel et al. (2006), the provision of contact information can
strengthen users‟ confidence in a vendor‟s reliability. Therefore, with availability of
the contact information on London Authority 3, it clearly delivers the message that the
e-government is ready and welcome to be contacted by users whenever they need,
which may be beneficial for users to develop trustworthiness in the site.
Figure 5.9 Contact option indication in London Authority 3
The feature of presenting a physical address of the local council on pages is the next
credibility strength identified in London Authority 3. A physical address is used to
indicate a location in the real world. With the provision of the physical address on the
e-government website, it attempts to reveal that the site is legitimate, which is helpful
to build real-world presence on the site (Sidi and Junaini, 2006). In addition, the
indication of the physical address is a structural feature of the website, which provides
information about the quality of the site and influences trust development (Rains and
Karmikel, 2009). Thus, with the clear presence of the physical address on London
Authority 3, it supports users to match the e-government website with the real world,
which may be helpful to build trust in the site.
The next credibility strength detected in London Authority 3 is that information
presented in a page matches with the names of the categories. Category name is used

Usability and credibility evaluation of electronic governments: users‟ perspective Zhao Huang
Chapter 5 Experiment 1: usability and credibility evaluation 106
to represent the category subject content, which can give users a preview of where the
subject information will lead to. If category name clearly indicates relevant subject
information, users can easily know what they will get before going to the detailed
information. Therefore, information presented on a page matching with the name of
the categories can support subject content cognition and identification, so that users
may spend less time going through the levels of information to locate the target in a
subject searching process.
Another credibility strength found in London Authority 3 is that users can quickly
start their tasks because the site is easy to use. For example, the site offers shortcuts to
services access that arranges all online services in alphabetical order, so that users can
easily locate and access the target service quickly. In addition, subject options are
named meaningfully, which is easy for users to understand and so select the options
through multiple menu levels. Ease of use is used to describe how users can easily
employ a variety of functions within the site to achieve their target goal. It can
influence users‟ interaction with the services and subjective satisfaction. As indicated
by Hung et al. (2006), users‟ attitude and performance toward e-government services
is largely dependent on the site‟ ease of use, which can determine users‟ acceptance of
the e-government website. Accordingly, the feature of the site‟s ease of use may
increase users‟ performance efficiency as in London Authority 3.
Additionally, a credibility strength detected in London Authority 3 is that information
presented on the site can encourage users to believe in the reliability of the local
council. For example, online news reports are complete, precise and reflect official
information about the events that took place around the local council. Information
relevancy, completeness and authority are used to establish information quality
(Magoutas and Mentzas, 2010). With quality information, users‟ trust and satisfaction
with e-government raises. As indicated by Eschenfelder and Miller (2007), when
quality information is provided on government website, it can facilitate a desired
relationship between users and government organization. As such, the credibility
feature that information presented on London Authority 3 can encourage users to
believe in the reliability of the local council may influence the relationship between
users and the local council, which is helpful to build long term trust.
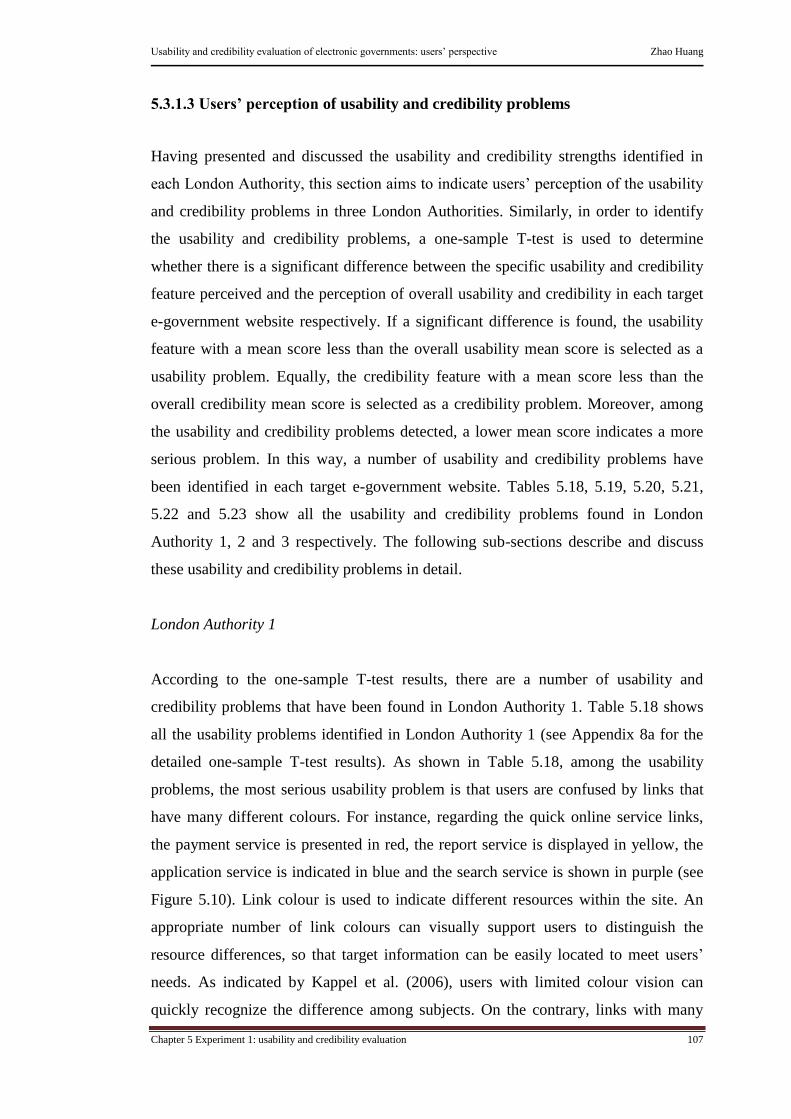
Usability and credibility evaluation of electronic governments: users‟ perspective Zhao Huang
Chapter 5 Experiment 1: usability and credibility evaluation 107
5.3.1.3 Users’ perception of usability and credibility problems
Having presented and discussed the usability and credibility strengths identified in
each London Authority, this section aims to indicate users‟ perception of the usability
and credibility problems in three London Authorities. Similarly, in order to identify
the usability and credibility problems, a one-sample T-test is used to determine
whether there is a significant difference between the specific usability and credibility
feature perceived and the perception of overall usability and credibility in each target
e-government website respectively. If a significant difference is found, the usability
feature with a mean score less than the overall usability mean score is selected as a
usability problem. Equally, the credibility feature with a mean score less than the
overall credibility mean score is selected as a credibility problem. Moreover, among
the usability and credibility problems detected, a lower mean score indicates a more
serious problem. In this way, a number of usability and credibility problems have
been identified in each target e-government website. Tables 5.18, 5.19, 5.20, 5.21,
5.22 and 5.23 show all the usability and credibility problems found in London
Authority 1, 2 and 3 respectively. The following sub-sections describe and discuss
these usability and credibility problems in detail.
London Authority 1
According to the one-sample T-test results, there are a number of usability and
credibility problems that have been found in London Authority 1. Table 5.18 shows
all the usability problems identified in London Authority 1 (see Appendix 8a for the
detailed one-sample T-test results). As shown in Table 5.18, among the usability
problems, the most serious usability problem is that users are confused by links that
have many different colours. For instance, regarding the quick online service links,
the payment service is presented in red, the report service is displayed in yellow, the
application service is indicated in blue and the search service is shown in purple (see
Figure 5.10). Link colour is used to indicate different resources within the site. An
appropriate number of link colours can visually support users to distinguish the
resource differences, so that target information can be easily located to meet users‟
needs. As indicated by Kappel et al. (2006), users with limited colour vision can
quickly recognize the difference among subjects. On the contrary, links with many
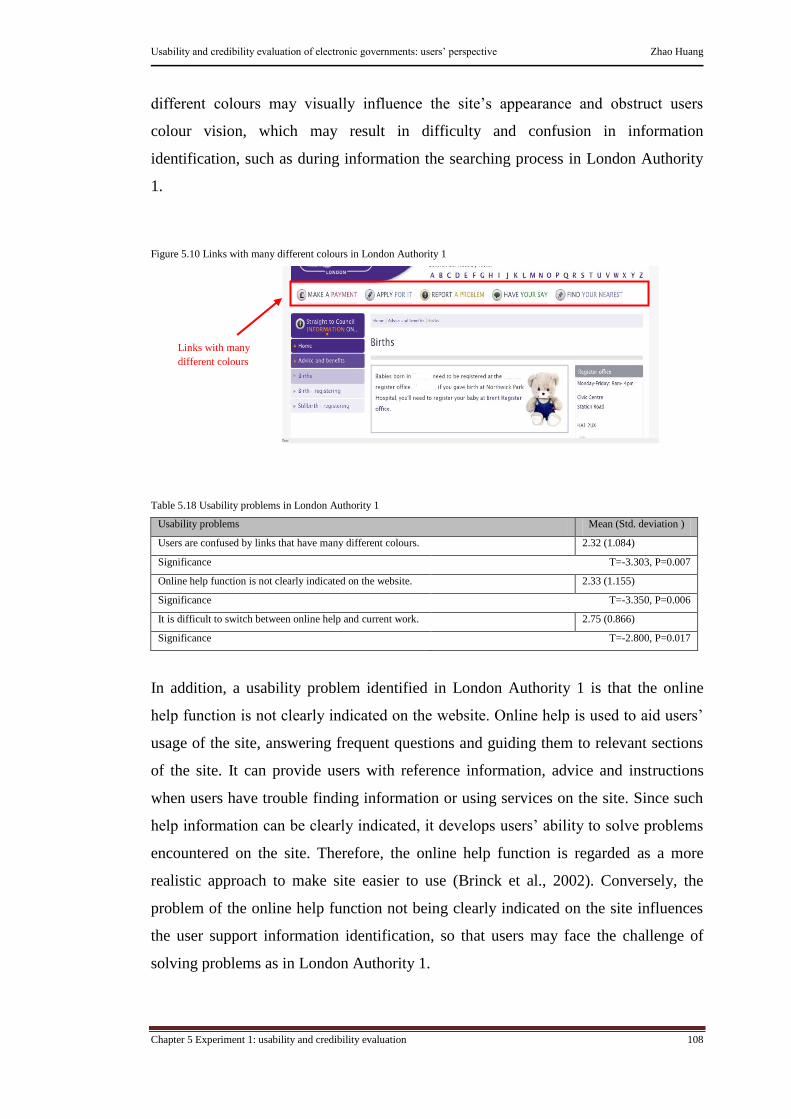
Usability and credibility evaluation of electronic governments: users‟ perspective Zhao Huang
Chapter 5 Experiment 1: usability and credibility evaluation 108
different colours may visually influence the site‟s appearance and obstruct users
colour vision, which may result in difficulty and confusion in information
identification, such as during information the searching process in London Authority
1.
Figure 5.10 Links with many different colours in London Authority 1
Table 5.18 Usability problems in London Authority 1
Usability problems Mean (Std. deviation )
Users are confused by links that have many different colours. 2.32 (1.084)
Significance T=-3.303, P=0.007
Online help function is not clearly indicated on the website. 2.33 (1.155)
Significance T=-3.350, P=0.006
It is difficult to switch between online help and current work. 2.75 (0.866)
Significance T=-2.800, P=0.017
In addition, a usability problem identified in London Authority 1 is that the online
help function is not clearly indicated on the website. Online help is used to aid users‟
usage of the site, answering frequent questions and guiding them to relevant sections
of the site. It can provide users with reference information, advice and instructions
when users have trouble finding information or using services on the site. Since such
help information can be clearly indicated, it develops users‟ ability to solve problems
encountered on the site. Therefore, the online help function is regarded as a more
realistic approach to make site easier to use (Brinck et al., 2002). Conversely, the
problem of the online help function not being clearly indicated on the site influences
the user support information identification, so that users may face the challenge of
solving problems as in London Authority 1.
Links with many
different colours

Usability and credibility evaluation of electronic governments: users‟ perspective Zhao Huang
Chapter 5 Experiment 1: usability and credibility evaluation 109
Another usability problem found in London Authority 1 is that it is difficult to switch
between online help and current work. For example, the current work window is
replaced by the online help window when users click the online help option. However,
after users finish online help, it is hard to retrieve the previous work. Ease of
switching between online help and current work is used to ensure that help
information can be easily reviewed in order to support users in task completion. As
such, users want to be able to conduct their work and review online help information
whenever they need. However, the difficulty of switching between online help and
current work hampers the task completion process, so that users may have to spend
more time and memory to get back to their previous work after using online help
information.
Table 5.19 Credibility problems in London Authority 1
Credibility problems Mean (Std. deviation )
Information is presented without consistent colours. 2.58 (0.996)
Significance T=-3.883, P=0.003
Furthermore, the credibility problem in London Authority 1 has been found and it is
presented in Table 6.19. The credibility problem identified is that information is
presented without consistent colours. For example, options on the menu bar are
normally presented in black with a blue background. However, in the subpage about
council meetings, options on the menu bar are presented differently, which has a
white font with a yellow background (see Figure 5.11). Colour consistency is used to
establish unity across pages of the e-government website, strengthening visual subject
recognition and reducing layout clutter. It helps users understand that information
visually provided is organised and presented in the same way throughout the site. As
such, after the initial experience with the site, consistent colours usage enables users
to easily locate information to meet their needs. As indicated by Ozok and Salvendy
(2001), consistent colours form an important part of overall web consistency, which
may lead to better user performance and lower error rates. Conversely, failure of
information presentation with consistent colours may affect visual continuity of the
site, which may cause users difficulties in searching information through London
Authority 1.

Usability and credibility evaluation of electronic governments: users‟ perspective Zhao Huang
Chapter 5 Experiment 1: usability and credibility evaluation 110
Figure 5.11 Information presentation without consistent colours in London Authority 1
London Authority 2
Based on the results of the one-sample T-test, there are a number of usability and
credibility problems that have been found in London Authority 2. Table 5.20 presents
all the usability problems found in London Authority 2 (see Appendix 8b for the
detailed one-sample T-test results). As shown in Table 5.20, among these usability
problems, the most serious problem found is that the options on the home page are not
clearly enough presented for users. For example, an “A-Z” option is too ambiguous to
indicate its subject and a “Do it online” option is repeatedly used on the home page
(see Figure 5.12). Users‟ subject recognition would be better supported by having
clearly presented more understandable options. It can simplify the content
presentation and improve its readability. As such, it can help users to quickly
understand the subject presented on pages and easily select the relevant option to
obtain their expected information. However, options without clear presentation can
lead to page content complexity. As indicated by Tuch et al. (2009), a starting page
with high complexity makes users less pleasurable and users perform worse on search
and recognition subjects on such pages. Therefore, the problem of the subject options
not being clearly presented on the home page of London Authority 2 affects subject
content presentation, which may cause users difficulty with information seeking.
Inconsistent
colours

Usability and credibility evaluation of electronic governments: users‟ perspective Zhao Huang
Chapter 5 Experiment 1: usability and credibility evaluation 111
Figure 5.12 Ambiguous and repeated options in London Authority 2
Table 5.20 Usability problems in London Authority 2
Usability problems Mean (Std. deviation )
Some options on the home page are not clearly presented. 2.17 (1.030)
Significance T=-3.879, P=0.003
Users are confused by links that have many different colours. 2.25 (0.866)
Significance T=-4.280, P=0.001
The site sometimes does not indicate a task‟s progress. 2.33 (0.888)
Significance T=-3.851, P=0.003
Links already visited are not clearly marked. 2.50 (1.243)
Significance T=-2.285, P=0.043
The site allows users to skip over the order of the process. 2.67 (0.778)
Significance T=-2.907, P=0.014
Additionally, a usability problem identified in London Authority 2 is that users are
confused by links that have many different colours. As indicated before, link colour is
applied to show different resources within the site. Links with the appropriate number
of colours can visually help users distinguish the resources so as to easily identify
relevant subject information. As indicated by Kappel et al. (2006), users with limited
colour vision can quickly recognize the differences among subject content. In contrast,
links with many different colours can visually hamper users‟ resource recognition,
which may make it more difficult for users to locate information during information
searching process.
Moreover, a usability problem detected in London Authority 2 is that the site
sometimes does not indicate a task‟s progress. For example, when users complete and
submit the online report form, there is no message to indicate the task progress (see
Figure 5.13). The indication of task progress is used to help users through two main
functions: presenting the total task steps that need to be completed and informing
Ambiguous
option
Repeated
options

Usability and credibility evaluation of electronic governments: users‟ perspective Zhao Huang
Chapter 5 Experiment 1: usability and credibility evaluation 112
users how many steps have been done and how many steps are left. As such, users can
easily monitor their task progress and measure task completion situation. However,
the absence of presenting the task progress may influence task completion process
transparency, so that users may find it difficult to locate their task step during the task
process.
Figure 5.13 Lack of task progress in London Authority 2
Another usability problems identified in London Authority 2 is that the links already
visited are not clearly marked. Marking visited links is used to support users‟ ability
to distinguish which parts of the site they have already visited and which parts remain
to be explored. It can help users in information searching. As indicated by Nielsen,
(2000), visited links that have been clearly marked can provide users‟ sense of
structure and location in the site and help users quickly find subject information.
Nevertheless, when visited links are not clearly marked as within London Authority 2,
it can weaken navigational recognition, so that users may waste time visiting the same
place repeatedly, or even give up their searching purpose prematurely.
Finally, a usability problem found in London Authority 2 is that the site allows users
to skip over an order of the process. For example, when completing the vehicle
crossing online form, users can jump to the final section of the form and submit it
without providing the necessary information in previous pages. An order of the
process refers to a sequence of pages, which provides a linear experience for users
(Brinck et al., 2002). In this linear experience, users are required going through a set
of pages in order, in order to ensure that all necessary information that the site

Usability and credibility evaluation of electronic governments: users‟ perspective Zhao Huang
Chapter 5 Experiment 1: usability and credibility evaluation 113
requires is provided. In particular, within an online service procedure, each page is
dependent on information gathered from previous pages. As such, following the order
of the process can prevent users from making mistakes, such as missing data. On the
contrary, when the site allows users to skip over an order of the process, the sequence
of pages is broken, which may increase the error rate, or even result in failure of task
completion as in London Authority 2.
Table 5.21 Credibility problems in London Authority 2
Credibility problems Mean (Std. deviation )
Search results are not organised by the level of relevance. 2.43 (0.937)
Significance T=-2.242, P=0.047
Content is displayed without consistent layout. 2.67 (0.985)
Significance T=-2.720, P=0.020
There is no clear security message when users access some confidential information. 2.92 (0.515)
Significance T=-3.521, P=0.005
Furthermore, a set of the credibility problems in London Authority 2 have been also
found and all the credibility problems are presented in Table 5.21 (see Appendix 8b
for the detailed one-sample T-test results). As shown in Table 5.21, the problem with
highest seriousness is that search results are not organised by the level of relevance.
For example, when users type the key words of “personal tax” in the search engine
box, the search engine lists a result relating to working parents prior to a result
relating to a single person‟s tax discount form (see Figure 5.14). Search results need
to be arranged in a logical order, which places the best hits at the top (Nielsen, 2000),
so that users can quickly scan the results and easily identify their target. The level of
relevance is commonly used as the logical sequence for search results arrangement. It
can help users build sound understanding of the search results organisation. As
indicated by Brinck et al. (2002), search results arrangement shown with the level of
relevance enables users to easily locate items and reduces memory load problems. In
contrast, failure to organize search results by level of relevance influences search
engine capability, so that users may face the challenge of determining and choosing
relevant items from a large number of search results.
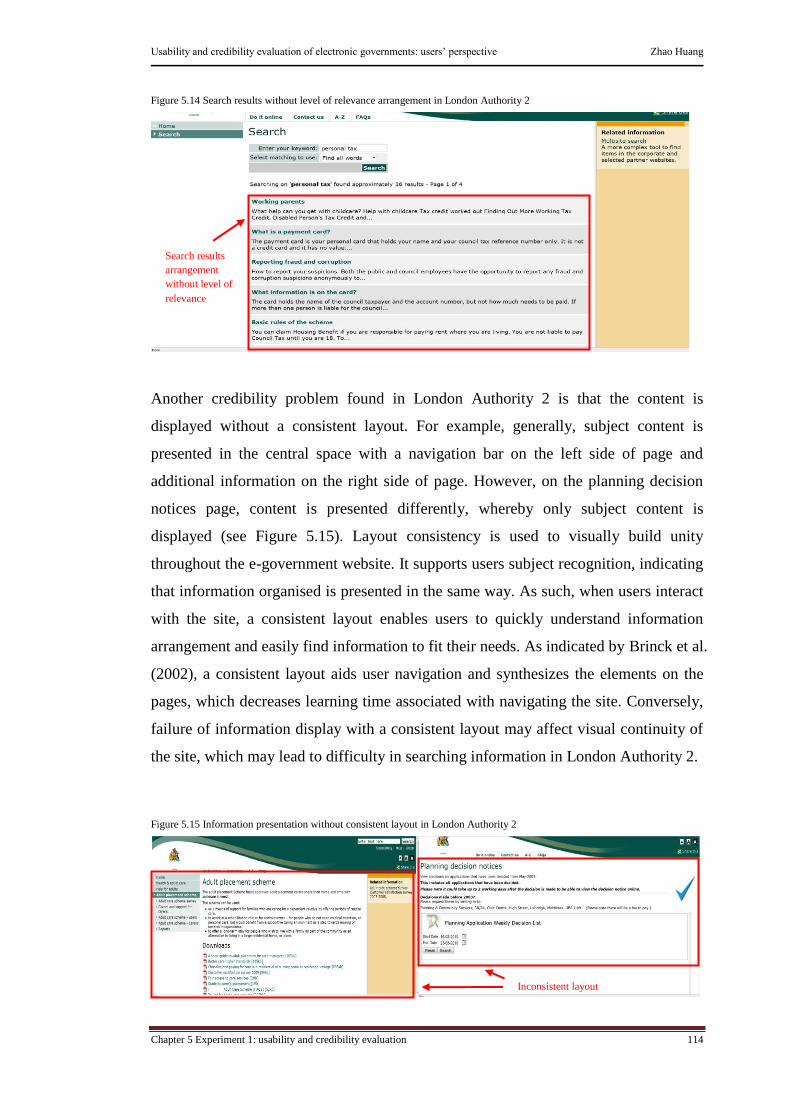
Usability and credibility evaluation of electronic governments: users‟ perspective Zhao Huang
Chapter 5 Experiment 1: usability and credibility evaluation 114
Figure 5.14 Search results without level of relevance arrangement in London Authority 2
Another credibility problem found in London Authority 2 is that the content is
displayed without a consistent layout. For example, generally, subject content is
presented in the central space with a navigation bar on the left side of page and
additional information on the right side of page. However, on the planning decision
notices page, content is presented differently, whereby only subject content is
displayed (see Figure 5.15). Layout consistency is used to visually build unity
throughout the e-government website. It supports users subject recognition, indicating
that information organised is presented in the same way. As such, when users interact
with the site, a consistent layout enables users to quickly understand information
arrangement and easily find information to fit their needs. As indicated by Brinck et al.
(2002), a consistent layout aids user navigation and synthesizes the elements on the
pages, which decreases learning time associated with navigating the site. Conversely,
failure of information display with a consistent layout may affect visual continuity of
the site, which may lead to difficulty in searching information in London Authority 2.
Figure 5.15 Information presentation without consistent layout in London Authority 2
Search results
arrangement
without level of
relevance
Inconsistent layout

Usability and credibility evaluation of electronic governments: users‟ perspective Zhao Huang
Chapter 5 Experiment 1: usability and credibility evaluation 115
Finally, a credibility problem identified in London Authority 2 is that there is no clear
security message when users access certain confidential information. For instance,
when users access the primary schools admission online form, there is no message to
indicate that users‟ personal information is protected. Private information and services
on e-government need to be protected (Al-Omari and Al-Omari, 2006), and inform
users during online transaction processes. A security message is used as the notice
that informs users about personal information safety and reliability. As such, it can
reduce users‟ perception of risk. As indicated by Bélanger and Carter (2008), users‟
perception of risk can hamper users‟ intentions to transact online services on e-
government. Consequently, the absence of the security message when users access
confidential services may affect the site‟s reliability, so that users may worry about
private information safety, and even decrease their intentions to interact with online
services within the e-government website.
London Authority 3
Based on the results of the one-sample T-test, a number of usability and credibility
problems in London Authority 3 have been identified and presented in Tables 5.22
and 5.23 respectively (see Appendix 8c for the detailed one-sample T-test results). As
shown in Table 5.22, among all the usability problems identified, the most serious
problem found is that users are confused by links that have many different colours.
For example, on the council tax page, some links are shown in black, some links are
displayed in blue and other links are indicated in white (see Figure 5.16). Link colour
is used to present different resources within the site. Links with limited colours can
visually help users distinguish between the resources so as to easily identify relevant
subject information. As indicated by Kappel et al. (2006), users with limited colour
vision can quickly recognise the differences among subjects. In contrast, failure to
provide limited link colours can visually influence resource recognition, so that users
may feel it difficult to locate target information among subject content.
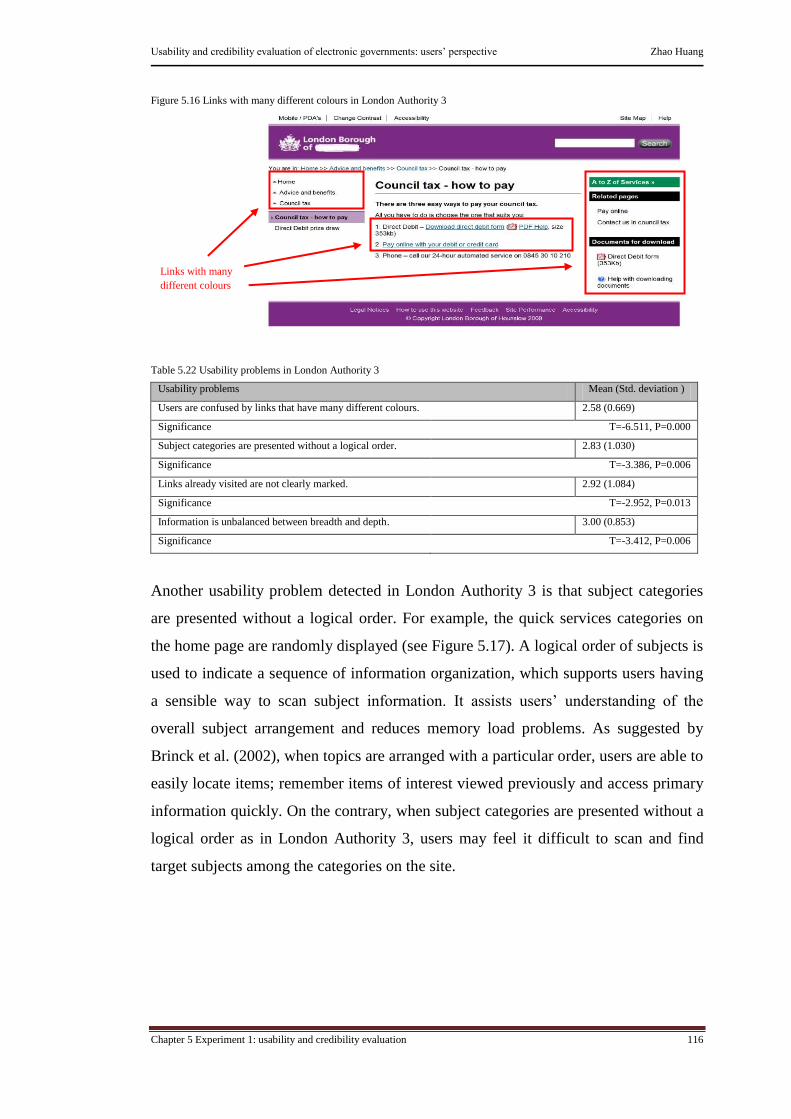
Usability and credibility evaluation of electronic governments: users‟ perspective Zhao Huang
Chapter 5 Experiment 1: usability and credibility evaluation 116
Figure 5.16 Links with many different colours in London Authority 3
Table 5.22 Usability problems in London Authority 3
Usability problems Mean (Std. deviation )
Users are confused by links that have many different colours. 2.58 (0.669)
Significance T=-6.511, P=0.000
Subject categories are presented without a logical order. 2.83 (1.030)
Significance T=-3.386, P=0.006
Links already visited are not clearly marked. 2.92 (1.084)
Significance T=-2.952, P=0.013
Information is unbalanced between breadth and depth. 3.00 (0.853)
Significance T=-3.412, P=0.006
Another usability problem detected in London Authority 3 is that subject categories
are presented without a logical order. For example, the quick services categories on
the home page are randomly displayed (see Figure 5.17). A logical order of subjects is
used to indicate a sequence of information organization, which supports users having
a sensible way to scan subject information. It assists users‟ understanding of the
overall subject arrangement and reduces memory load problems. As suggested by
Brinck et al. (2002), when topics are arranged with a particular order, users are able to
easily locate items; remember items of interest viewed previously and access primary
information quickly. On the contrary, when subject categories are presented without a
logical order as in London Authority 3, users may feel it difficult to scan and find
target subjects among the categories on the site.
Links with many
different colours

Usability and credibility evaluation of electronic governments: users‟ perspective Zhao Huang
Chapter 5 Experiment 1: usability and credibility evaluation 117
Figure 5.17 Category options arrangement without a logical order in London Authority 3
The next usability problem identified in London Authority 3 is that links already
visited are not clearly marked. Marking visited links is used to support users‟ ability
to distinguish which parts of the site they have already visited and which parts remain
to be explored. As such, it can help users to locate information during information
searching. As indicated by Nielsen (2000), visited links that have been clearly marked
can provide users with a sense of structure and location in the site and enable users to
quickly find the subject information. However, failure to mark visited links can
weaken navigational recognition, which may result in users visiting the same place
repeatedly, or even abandoning their searching purpose prematurely as in London
Authority 3.
Finally, a usability problem found in London Authority 3 is that the information
arrangement is out of balance between breadth and depth. For example, in order to
find information about free school meals, users have to select a link from 50 options
within the page of school and colleges. On the other hand, when locating specific
information about student financial assistance, users need to pass through 5 levels of
information depth on the site (see Figure 5.18). Breadth and depth are used to
distribute e-government content by designing a number of subject categories and a
number of information levels. A medium condition of breadth and depth is considered
as an optimal trade-off, which can help information retrieval (Larson and Czerwinski,
1998). It is because the appropriate number of categories displayed can keep content
from getting cluttered and reduce the chance that users are confused by a vast number
of options (Jennifer, 1998). While, as the moderate levels of information is designed,
it can avoid over-length subject information through site so that users can follow a
Subject
options are
presented
without a
logical order

Usability and credibility evaluation of electronic governments: users‟ perspective Zhao Huang
Chapter 5 Experiment 1: usability and credibility evaluation 118
short path into the site in order to find the detailed information. However, as
suggested by Larson and Czerwinski (1998), unbalanced breadth and depth can cause
problems in information acquisition. In such conditions, users are frustrated by
increasing levels of depth or feeling lost in content space, when there are a large
numbers of categories. As such, the problem that information arrangement is out of
the balance between breadth and depth in London Authority 3 may cause more
difficulties and errors for users searching for available information resources on a
page and locating detailed information through multiple information levels.
Figure 5.18 Breadth and depth balance in information arrangement in London Authority 3
Table 5.23 Credibility problems in London Authority 3
Credibility problems Mean (Std. deviation)
Detailed contact information has not been organised by different departments of the council. 2.75 (0.866)
Significance T=-4.560, P=0.001
It is not clear to see the site‟s credentials because the site does not display awards it has earned. 2.75 (0.754)
Significance T=-5.239, P=0.000
The site does not provide a shortcut option for access to information about the local council. 3.08 (0.996)
Too many levels
of information
depth
Too many information
category options

Usability and credibility evaluation of electronic governments: users‟ perspective Zhao Huang
Chapter 5 Experiment 1: usability and credibility evaluation 119
Significance T=-2.805, P=0.017
There is no clear secure message when users access some confidential information. 3.08 (0.515)
Significance T=-5.427, P=0.000
It is not clear to indicate how much users have done and how much remains when completing
tasks.
3.17 (0.937)
Significance T=-2.673, P=0.022
The information about the site update is not clearly presented. 3.17 (1.030)
Significance T=-2.433, P=0.033
It is difficult to see a sign-in option when users access some personal services. 3.17 (0.937)
Significance T=-2.673, P=0.022
Furthermore, a set of the credibility problems in London Authority 3 have been also
identified and presented in Table 5.23. Among all the credibility problems, the
problem with highest severity is that the detailed contact information is not organised
by different departments of the council (see Figure 5.19). Arranging contact
information by departments is used to represent an order of information organisation.
It can provide users with a logical way to search contact information. As such, it
increases users‟ understanding of information arrangements and reduces memory load
problems. On the contrary, when detailed contact information is not arranged by
different departments, users may feel it is difficult to locate target contact details to
meet their needs as in London Authority 3.
Figure 5.19 Contact presentation without department organisation in London Authority 3
The next credibility problem found in London Authority 3 is that the awards, such as
web or Internet standard awards, won by an e-government website are not displayed
properly. Displaying awards won by e-governments is useful for enhancing its
reputation. In particular, it can build a positive reputation since the nature of awards is
Detailed contact
information is organised
by different departments
Usability and credibility evaluation of electronic governments: users‟ perspective Zhao Huang
Chapter 5 Experiment 1: usability and credibility evaluation 120
only positive (Whitmeyer, 2000). As addressed by Resnick et al. (2000), reputation
promotes the formation of trust. Therefore, the problem that the awards won by
London Authority 3 are not displayed clearly may affect its reputation, which in turn,
may lead to lower user trust.
Furthermore, a credibility problem detected in London Authority 3 is that it is hard to
find the local council quick access information. The provision of information about
local council is used to introduce e-government in terms of history, missions and
services. It provides users with an opportunity to know that there are real people and
real government organisations working behind the site. As a result, it can develop
users‟ trust. However, where the information about local council becomes difficult to
see, it may obstruct the delivery of real world feel, so that users may be challenging to
develop their trust with the site.
Another credibility problem identified in London Authority 3 is that there is no clear
security message when users access some confidential information. For instance,
when users access the online complaint form, there is no security message to indicate
how users‟ personal information is protected. Private information and services on e-
government need to be protected (Al-Omari and Al-Omari, 2006), and such protection
needs to be notified to users. A security message is used as the notice that informs
users about personal information safety. As such, it can reduce users‟ perception of
risk. As indicated by Bélanger and Carter (2008), users‟ perception of risk can hamper
their intentions to exchange information on e-government. Therefore, the absence of
the security message when users access confidential services may affect building
reliability, so that users may be concerned about the safety of private information, or
even fail to engage in online services as in London Authority 3.
In addition, a credibility problem found in London Authority 3 is that it is not clear to
see how much users have done and how much was left to complete the task. For
example, when users complete the abandoned vehicle form, there is no message to
indicate task progress within the site (see Figure 5.20). The indication of task progress
is used to support users‟ task completion process on the site. It can help users
accomplish their tasks, performing two main functions: presenting the total task steps
that need to be completed and informing users how many steps have been done and

Usability and credibility evaluation of electronic governments: users‟ perspective Zhao Huang
Chapter 5 Experiment 1: usability and credibility evaluation 121
how many steps remain. As such, users can understand the overall task process and
easily monitor it. However, the lack of the task progress indication may influence task
completion and reduce task process transparency, so that users may feel it is difficult
to capture their task movement within the site.
Figure 5.20 Lack of message to indicate task progress in London Authority 3
Additionally, a credibility problem identified in London Authority 3 is that
information about the site update is not clearly presented. For example, the most
recent updated date for specific content is not clearly indicated. Site update is used to
maintain information and services of e-government regularly and keep them up-to-
date. All updated information needs to be clearly presented through visual cues on the
e-government websites. A recently updated date is regarded as a key visual cue
offering significant reference, which helps users to determine the quality of
information received. As suggested by Brinck et al. (2002), the last update date
indicates regular attention to the site. Such an indication is beneficial for those who
can judge whether information or services obtained are current. Therefore, the
problem of the updated date not being explicitly presented in London Authority 3 may
cover up its information quality and result in users facing challenges in judging the
reliability and accuracy of information and services obtained from London Authority
3.
Finally, a credibility problem detected in London Authority 3 is that it is difficult to
see a log-in option when users access some personal services. For instance, online
submission for library card application is accessible without a password requirement.
Private information and services on e-government need to be protected (Al-Omari and

Usability and credibility evaluation of electronic governments: users‟ perspective Zhao Huang
Chapter 5 Experiment 1: usability and credibility evaluation 122
Al-Omari, 2006), so that only authorized users can gain access to the information.
Password allocation is used as a common protection mechanism for user
authentication, which ensures such information and services safety (Vu et al., 2007).
Meanwhile, it can reduce users‟ perception of risk. Bélanger and Carter (2008) found
that users‟ perception of risk can limit their interaction with e-government, especially
users‟ intentions to exchange information and transact online services. As such, the
problem of access to confidential services without a password requirement increases
the risk of personal information loss as in London Authority 3, which may result in
the user failing to engage in any private services on the e-government website.
5.3.2 Users’ perception: qualitative data
Apart from quantitative data of users‟ perception through the closed questions of the
questionnaire, qualitative data is also collected during the experiment through the
open-ended questions to support the questionnaire results. These aim to gain an
insight into the participants‟ thoughts about usability and credibility. In the open-
ended questions, the participants are encouraged to indicate their further
considerations under the broad headings of: the successful and weak features of
usability; and the successful and weak features of credibility. This section reports the
findings in these areas for each target London Authority. However, in order to avoid
unnecessary duplication of previously described usability and credibility features, this
section details the usability and credibility successful and weak features that are
outside the scope of the usability and credibility strengths and problems identified by
the quantitative analysis.
London Authority 1
Based on the frequently recorded features in terms of usability and credibility in
London Authority 1, some common successful and weak features emerge from the
open-ended questions and these are presented in Tables 5.24 and 5.25 respectively. As
shown in Table 5.24, among the successful features of usability, those that are not
indicated by quantitative data, are the provision of clear text formatting and use of
simple language. Text formatting is used to manage text within the site in terms of

Usability and credibility evaluation of electronic governments: users‟ perspective Zhao Huang
Chapter 5 Experiment 1: usability and credibility evaluation 123
font, font size and style sheets. Clear text formatting strengthens text presentation and
facilitates information readability. The following quotes indicate the participants‟
responses regarding text formatting:
“I found that text font and font size are comfortable in the site.”
“Font and text size are all right and white space used is helpful to read the text between the
lines.”
“The clear style and format are used in each page; they help me to look for information
through the site.”
In addition, writing content in simple language is used to make information easy to
read. It can assist users‟ subject understanding and reduce cognitive load. As such,
users can quickly process information and locate relevant information to meet their
needs. The following quotes show the participants‟ thoughts about this feature:
“The system uses simple language, so it is easy to read information.”
“I can easy to see categories because simple and clear information is presented at the home
page.”
“The information is easy to read.”
Table 5.24 Successful and weak usability features in London Authority 1
Successful features
Clear layout design
Provision of A-Z services function
Clear text formatting
Use of simple language
Weak features
Overloaded information
Weak search engine function
Link with many colours
On the other hand, among the usability weaknesses (see Table 5.24), the features that
are outside the scope of the usability problems identified by quantitative data include
overloaded information and the weak search engine function. The appropriate amount
of information presentation is used to keep content from getting cluttered, so that
users can easily read information and quickly locate the subject. Meanwhile, memory
load problems can also be reduced. However, when excessive information is
presented on the site, it increases the content display burden, which may lead to users

Usability and credibility evaluation of electronic governments: users‟ perspective Zhao Huang
Chapter 5 Experiment 1: usability and credibility evaluation 124
feeling frustration in reading information from the large amount of subject content.
The following quotes show the participants‟ responses regarding overloaded
information feature:
“It is very likely to get lost by giving a lot of options on the page.”
“There are too many links/categories, so that I could not choose the relevant options.”
“There is too much information presented at the same time.”
“The home page is cluttered and I do not know where to start my job.”
“The home page lacks of focus.”
Another weak usability feature is that the search function does not fully support the
searching purpose. The search engine is used to retrieve information. A high search
capability can generate precise, comprehensive and relevant search results, which can
help users easily locate the target object. Conversely, the search engine with weak
searching capability influences the search effectiveness, so that users may feel it is
difficult to find useful information to meet their search requirements. The following
quotes present the participants‟ comments regarding weak search engine feature:
“Advanced search does not necessarily give me the right answer.”
“The search engine on the top is not working well.”
“The search results are not clear to identify relevant information.”
Table 5.25 Successful and weak credibility features in London Authority 1
Successful features
Provision of quality information
Log-in protection
Provision of mandatory field in online forms
Weak features
Lack of images
Absence of multi-language support
Table 5.25 presents the frequently recorded successful and weak credibility features in
London Authority 1. In terms of successful features, one feature that is outside the
scope of the credibility strengths found by quantitative data is the provision of
mandatory fields in online forms. A mandatory field refers to a compulsory answer,
which requires users to provide necessary information that the site needs. Once
information in these mandatory fields meets the site‟s requirements, then users are

Usability and credibility evaluation of electronic governments: users‟ perspective Zhao Huang
Chapter 5 Experiment 1: usability and credibility evaluation 125
allowed to move to the next step. As such, it can prevent users from making errors,
such as missing data when they fill in online forms. The following quotes present the
participants‟ responses regarding this feature:
“The mandatory field in the online form ensure the answers are given.”
“I like that the form require mandatory answers, because it would not allow me jumping the
process without providing necessary answers.”
In terms of the weak credibility features in London Authority 1, the features that are
outside the scope of the credibility problems found by quantitative data are the lack of
image usage and the absence of multi-language support (see Table 5.25). Images are
used to establish visual communication. They can aesthetically strengthen page layout
and facilitate content presentation. Conversely, the lack of images may affect
information presentation, so that users may easily lose their interest in reading pure
text on the screen. The following quotes present the participants‟ responses regarding
the lack of images:
“Relevant pictures are only shown on the home page, but there is no picture on other pages.”
“There are not relevant pictures with text when I read information on other sub-pages.”
“In some pages, only text is presented.”
Another weak credibility feature is that the site does not provide multi-language
support. Language support is used to build the site‟s accessibility. It can translate a
specific page from English into the users‟ preferred language, so that users with
different language requirements are able to conduct their task on the same e-
government website. However, the absence of multi-language support function may
hamper the access to the e-government website, so that users with language
requirements may face a challenge when interacting with e-government services. The
following quotes from the participants‟ responses illustrate this weakness:
“Only English is available, it should provide multiple-language supports.”
“The site should have language translation function in accessibility.”
“Language support is missing, sometimes I need language translation.”
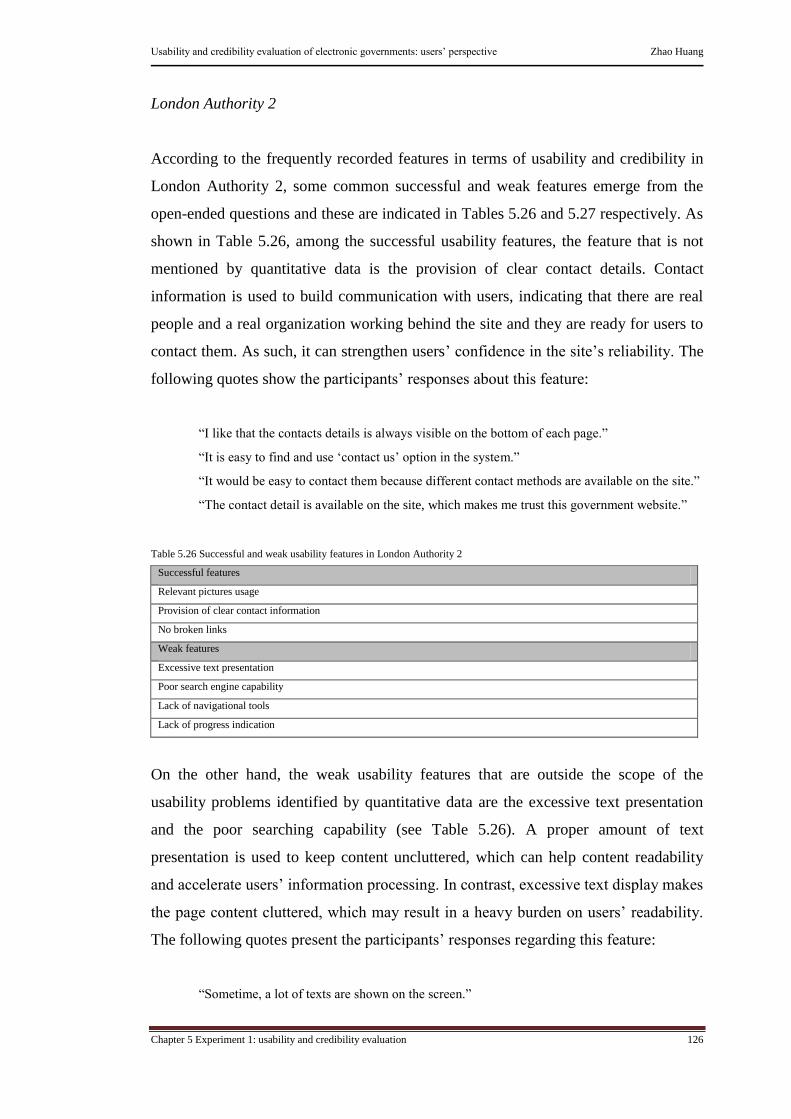
Usability and credibility evaluation of electronic governments: users‟ perspective Zhao Huang
Chapter 5 Experiment 1: usability and credibility evaluation 126
London Authority 2
According to the frequently recorded features in terms of usability and credibility in
London Authority 2, some common successful and weak features emerge from the
open-ended questions and these are indicated in Tables 5.26 and 5.27 respectively. As
shown in Table 5.26, among the successful usability features, the feature that is not
mentioned by quantitative data is the provision of clear contact details. Contact
information is used to build communication with users, indicating that there are real
people and a real organization working behind the site and they are ready for users to
contact them. As such, it can strengthen users‟ confidence in the site‟s reliability. The
following quotes show the participants‟ responses about this feature:
“I like that the contacts details is always visible on the bottom of each page.”
“It is easy to find and use „contact us‟ option in the system.”
“It would be easy to contact them because different contact methods are available on the site.”
“The contact detail is available on the site, which makes me trust this government website.”
Table 5.26 Successful and weak usability features in London Authority 2
Successful features
Relevant pictures usage
Provision of clear contact information
No broken links
Weak features
Excessive text presentation
Poor search engine capability
Lack of navigational tools
Lack of progress indication
On the other hand, the weak usability features that are outside the scope of the
usability problems identified by quantitative data are the excessive text presentation
and the poor searching capability (see Table 5.26). A proper amount of text
presentation is used to keep content uncluttered, which can help content readability
and accelerate users‟ information processing. In contrast, excessive text display makes
the page content cluttered, which may result in a heavy burden on users‟ readability.
The following quotes present the participants‟ responses regarding this feature:
“Sometime, a lot of texts are shown on the screen.”
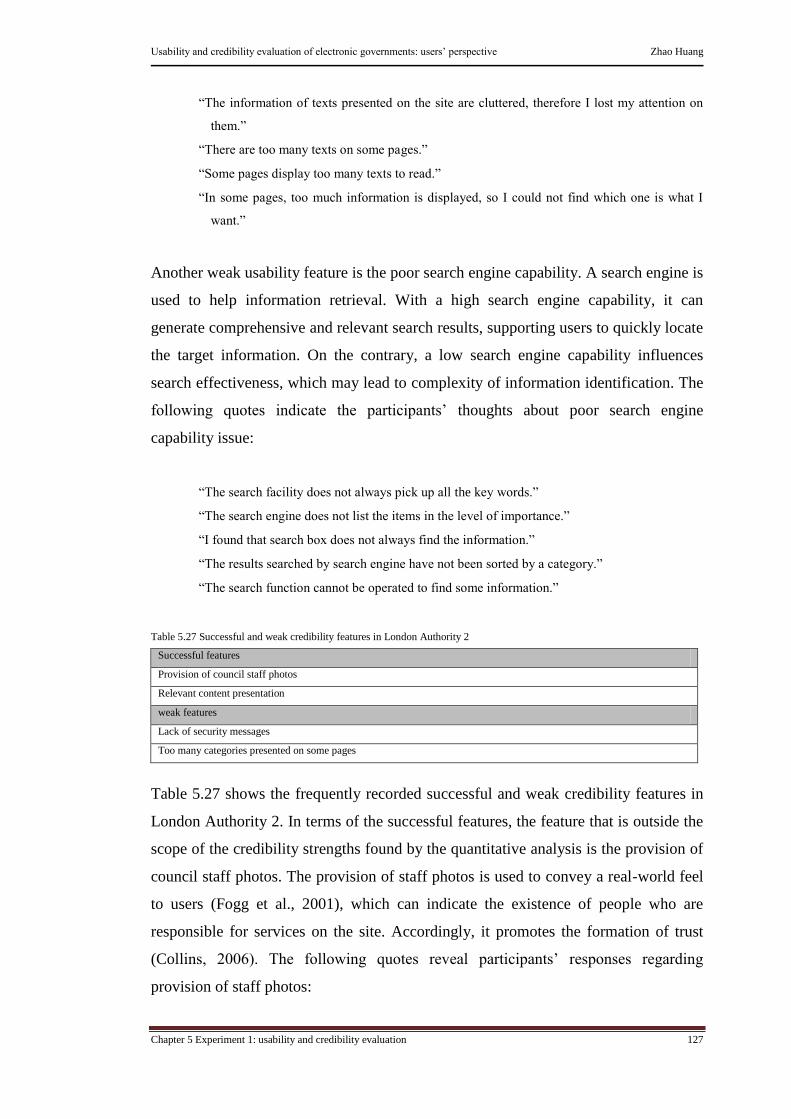
Usability and credibility evaluation of electronic governments: users‟ perspective Zhao Huang
Chapter 5 Experiment 1: usability and credibility evaluation 127
“The information of texts presented on the site are cluttered, therefore I lost my attention on
them.”
“There are too many texts on some pages.”
“Some pages display too many texts to read.”
“In some pages, too much information is displayed, so I could not find which one is what I
want.”
Another weak usability feature is the poor search engine capability. A search engine is
used to help information retrieval. With a high search engine capability, it can
generate comprehensive and relevant search results, supporting users to quickly locate
the target information. On the contrary, a low search engine capability influences
search effectiveness, which may lead to complexity of information identification. The
following quotes indicate the participants‟ thoughts about poor search engine
capability issue:
“The search facility does not always pick up all the key words.”
“The search engine does not list the items in the level of importance.”
“I found that search box does not always find the information.”
“The results searched by search engine have not been sorted by a category.”
“The search function cannot be operated to find some information.”
Table 5.27 Successful and weak credibility features in London Authority 2
Successful features
Provision of council staff photos
Relevant content presentation
weak features
Lack of security messages
Too many categories presented on some pages
Table 5.27 shows the frequently recorded successful and weak credibility features in
London Authority 2. In terms of the successful features, the feature that is outside the
scope of the credibility strengths found by the quantitative analysis is the provision of
council staff photos. The provision of staff photos is used to convey a real-world feel
to users (Fogg et al., 2001), which can indicate the existence of people who are
responsible for services on the site. Accordingly, it promotes the formation of trust
(Collins, 2006). The following quotes reveal participants‟ responses regarding
provision of staff photos:

Usability and credibility evaluation of electronic governments: users‟ perspective Zhao Huang
Chapter 5 Experiment 1: usability and credibility evaluation 128
“I like the factor that the council logo and staff photos are easy to see.”
“I can see a lot of staff photos on the site.”
“It is good idea to present people photos on the site, so that I feel close to them.”
In terms of the weak credibility features, the feature that is not indicated by
quantitative data is that too many categories are presented on some pages. Subject
category is commonly used to structure e-government information. The appropriate
number of categories can keep content from getting cluttered and reduce the chance
that users are confused by a vast number of options. Nevertheless, too many
categories cause problems in information acquisition (Nielsen, 2000), so that users
may find it hard to identify appropriate information in a large number of categories.
The following quotes indicate the participants‟ responses relating to excessive
categories issue:
“I could not find the specific information because there are too many options on the page.”
“There is excessive information indicated on some pages.”
“Sometimes, the information is allocated in a large number of categories.”
London Authority 3
Based on the frequently recorded features in terms of usability and credibility in
London Authority 3, some common successful and weak features emerge from the
open-ended questions and these are presented in Tables 5.28 and 5.29 respectively. As
shown in Table 5.28, among the successful usability features, the feature that is
outside the scope of usability strengths detected by quantitative data is the provision
of useful navigational tools. Navigation is the process of determining the movement
around an environment, orienting at each step where to go (Jul and Furnas, 1997).
Navigational tools aid users in finding the particular object and navigating through the
site with three functions: indicating how information on the site is organized; helping
users to get to information needed and informing users where they have been and
where they are (McDonald and Stevenson, 1998). Therefore, with useful navigational
tools, it provides users with flexible routes through the site and supports their
information retrieval, especially affecting users‟ orientation and search efficiency. The
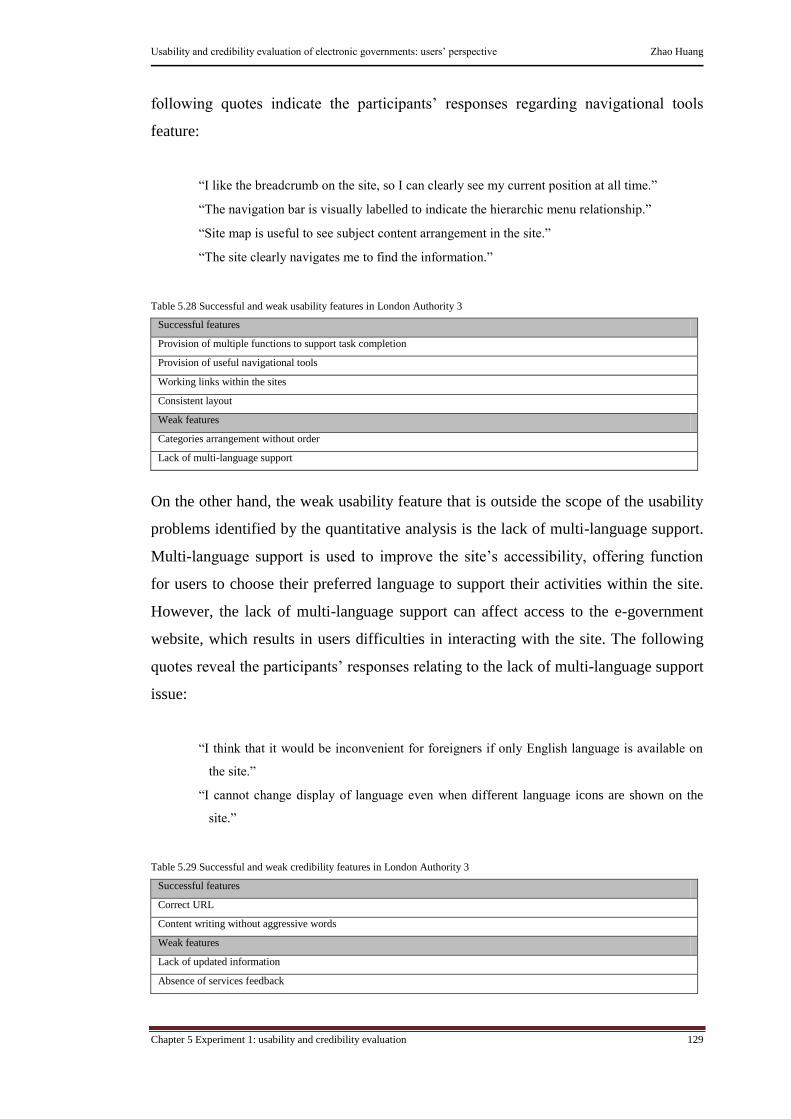
Usability and credibility evaluation of electronic governments: users‟ perspective Zhao Huang
Chapter 5 Experiment 1: usability and credibility evaluation 129
following quotes indicate the participants‟ responses regarding navigational tools
feature:
“I like the breadcrumb on the site, so I can clearly see my current position at all time.”
“The navigation bar is visually labelled to indicate the hierarchic menu relationship.”
“Site map is useful to see subject content arrangement in the site.”
“The site clearly navigates me to find the information.”
Table 5.28 Successful and weak usability features in London Authority 3
Successful features
Provision of multiple functions to support task completion
Provision of useful navigational tools
Working links within the sites
Consistent layout
Weak features
Categories arrangement without order
Lack of multi-language support
On the other hand, the weak usability feature that is outside the scope of the usability
problems identified by the quantitative analysis is the lack of multi-language support.
Multi-language support is used to improve the site‟s accessibility, offering function
for users to choose their preferred language to support their activities within the site.
However, the lack of multi-language support can affect access to the e-government
website, which results in users difficulties in interacting with the site. The following
quotes reveal the participants‟ responses relating to the lack of multi-language support
issue:
“I think that it would be inconvenient for foreigners if only English language is available on
the site.”
“I cannot change display of language even when different language icons are shown on the
site.”
Table 5.29 Successful and weak credibility features in London Authority 3
Successful features
Correct URL
Content writing without aggressive words
Weak features
Lack of updated information
Absence of services feedback
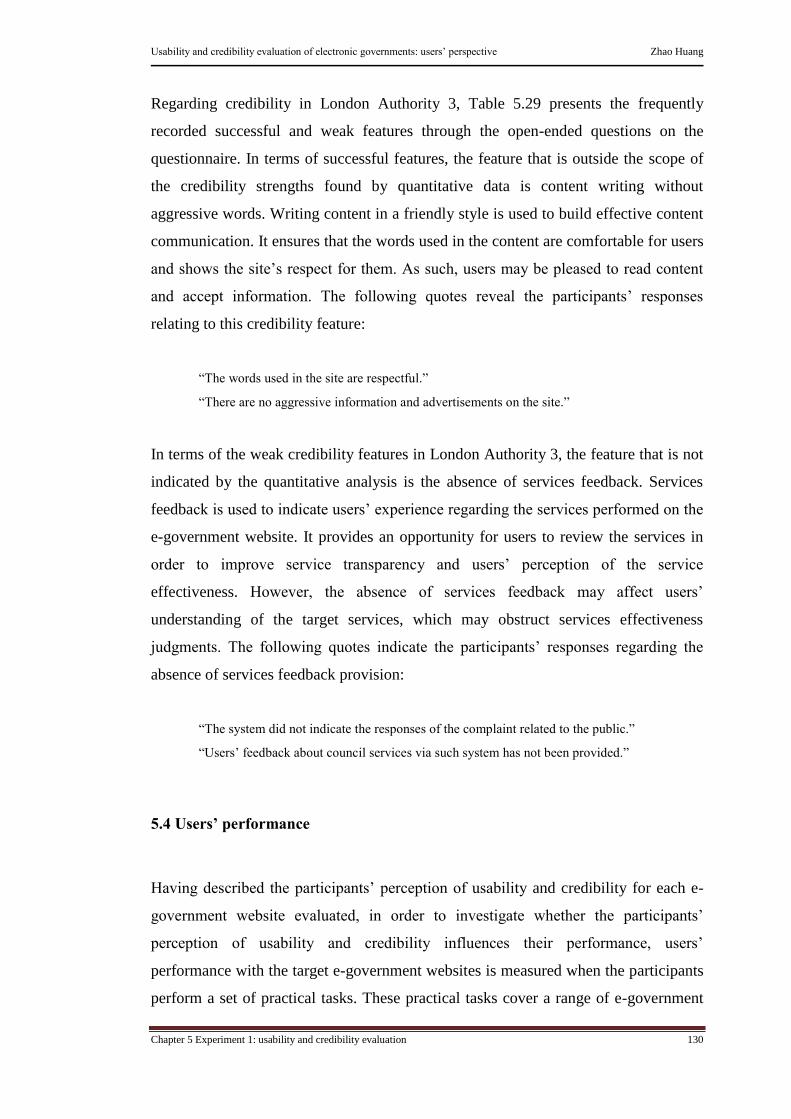
Usability and credibility evaluation of electronic governments: users‟ perspective Zhao Huang
Chapter 5 Experiment 1: usability and credibility evaluation 130
Regarding credibility in London Authority 3, Table 5.29 presents the frequently
recorded successful and weak features through the open-ended questions on the
questionnaire. In terms of successful features, the feature that is outside the scope of
the credibility strengths found by quantitative data is content writing without
aggressive words. Writing content in a friendly style is used to build effective content
communication. It ensures that the words used in the content are comfortable for users
and shows the site‟s respect for them. As such, users may be pleased to read content
and accept information. The following quotes reveal the participants‟ responses
relating to this credibility feature:
“The words used in the site are respectful.”
“There are no aggressive information and advertisements on the site.”
In terms of the weak credibility features in London Authority 3, the feature that is not
indicated by the quantitative analysis is the absence of services feedback. Services
feedback is used to indicate users‟ experience regarding the services performed on the
e-government website. It provides an opportunity for users to review the services in
order to improve service transparency and users‟ perception of the service
effectiveness. However, the absence of services feedback may affect users‟
understanding of the target services, which may obstruct services effectiveness
judgments. The following quotes indicate the participants‟ responses regarding the
absence of services feedback provision:
“The system did not indicate the responses of the complaint related to the public.”
“Users‟ feedback about council services via such system has not been provided.”
5.4 Users’ performance
Having described the participants‟ perception of usability and credibility for each e-
government website evaluated, in order to investigate whether the participants‟
perception of usability and credibility influences their performance, users‟
performance with the target e-government websites is measured when the participants
perform a set of practical tasks. These practical tasks cover a range of e-government

Usability and credibility evaluation of electronic governments: users‟ perspective Zhao Huang
Chapter 5 Experiment 1: usability and credibility evaluation 131
services categories, including information distribution, products and services offered
and user participation. For example, in terms of information distribution, the tasks
require the participants searching for specific information and news; in terms of
products and services, the participants are asked to download documents and search
for job; in terms of user participation, the tasks involve the participants paying taxes
and applying for a school position online (see Appendixes 1a-1c for the detailed
tasks). Such tasks are representative activities that users would be expected to carry
out on an e-government website. This task performance is analysed on the basis of a
set of performance data, including the amount of online help required; time spent
completing tasks; number of steps to finish tasks and number of successful tasks
completion. By focusing on such criteria, it is helpful to measure the level of users‟
interaction with the target e-government websites when they perform a set of tasks.
Tables 5.30, 5.31 and 5.32 show the results of users‟ task performance with each
London Authorities 1, 2 and 3 respectively.
Table 5.30 Users‟ performance with London Authority 1 in experiment 1
London
Authority 1
Online help required Number of steps to
complete the task
Successful task
completion
Time spent for the task
Mean SD Mean SD Mean SD Mean SD
Task 1 0.000 0.000 6.330 2.839 1.170 0.389 2.693 1.333
Task 2 0.000 0.000 7.750 5.011 1.080 0.289 2.588 2.317
Task 3 0.000 0.000 4.500 4.739 1.080 0.289 1.471 1.290
Task 4 0.000 0.000 4.920 2.575 1.000 0.000 1.344 0.822
Task 5 0.000 0.000 3.580 1.564 1.080 0.289 1.293 0.717
Task 6 0.000 0.000 6.250 2.179 1.000 0.000 4.626 1.375
Task 7 0.080 0.289 5.830 3.834 1.580 0.515 2.362 2.102
Task 8 0.000 0.000 10.500 5.617 1.250 0.452 3.934 2.365
Task 9 0.170 0.389 10.750 3.494 1.000 0.000 6.317 2.184
Total tasks 0.250 0.452 60.417 13.104 1.139 0.117 26.627 8.905
Table 5.31 Users‟ performance with London Authority 2 in experiment 1
London
Authority 2
Online help required Number of steps to
complete the task
Successful task
completion
Time spent for the task
Mean SD Mean SD Mean SD Mean SD
Task 1 0.170 0.577 4.080 3.204 1.080 0.289 1.523 1.663
Task 2 0.000 0.000 4.420 1.929 1.000 0.000 1.428 0.717
Task 3 0.170 0.389 9.000 6.424 1.080 0.289 2.180 1.689
Task 4 0.000 0.000 4.750 4.288 1.000 0.000 0.920 0.724
Task 5 0.000 0.000 2.170 0.389 1.000 0.000 0.649 0.441
Task 6 0.170 0.389 22.170 11.769 1.750 0.452 4.518 2.575
Task 7 0.080 0.289 8.580 7.856 1.250 0.452 2.374 2.701
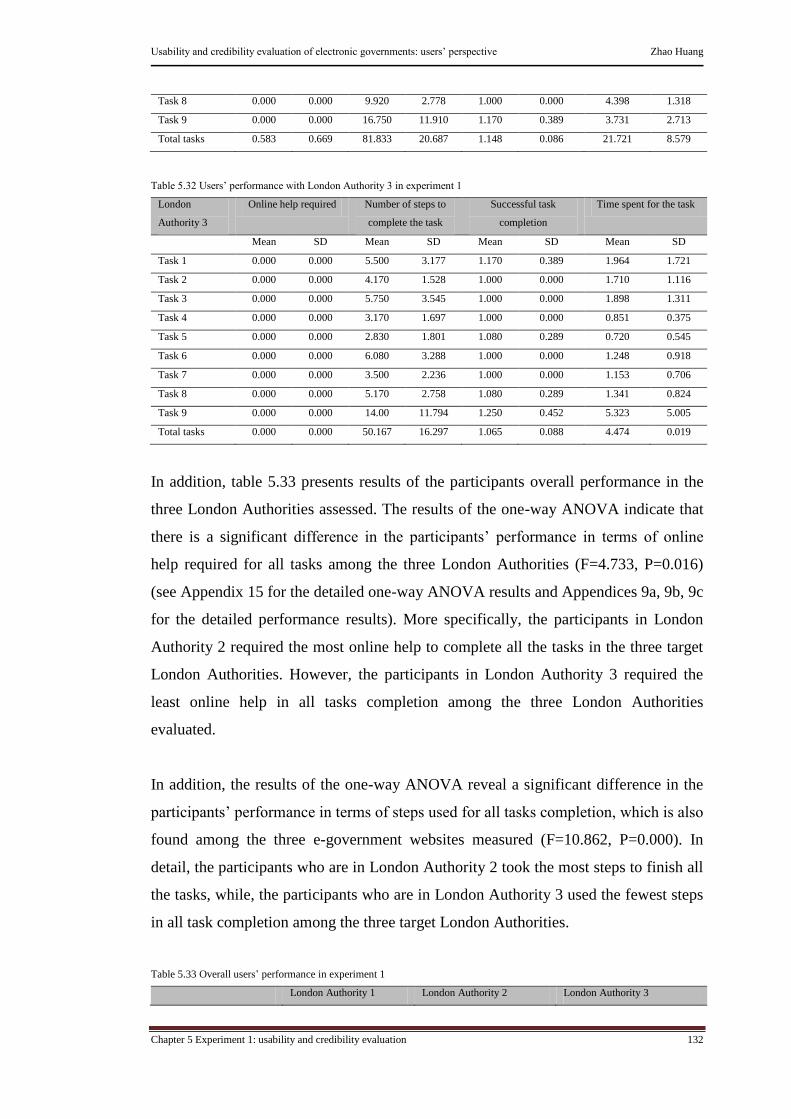
Usability and credibility evaluation of electronic governments: users‟ perspective Zhao Huang
Chapter 5 Experiment 1: usability and credibility evaluation 132
Task 8 0.000 0.000 9.920 2.778 1.000 0.000 4.398 1.318
Task 9 0.000 0.000 16.750 11.910 1.170 0.389 3.731 2.713
Total tasks 0.583 0.669 81.833 20.687 1.148 0.086 21.721 8.579
Table 5.32 Users‟ performance with London Authority 3 in experiment 1
London
Authority 3
Online help required Number of steps to
complete the task
Successful task
completion
Time spent for the task
Mean SD Mean SD Mean SD Mean SD
Task 1 0.000 0.000 5.500 3.177 1.170 0.389 1.964 1.721
Task 2 0.000 0.000 4.170 1.528 1.000 0.000 1.710 1.116
Task 3 0.000 0.000 5.750 3.545 1.000 0.000 1.898 1.311
Task 4 0.000 0.000 3.170 1.697 1.000 0.000 0.851 0.375
Task 5 0.000 0.000 2.830 1.801 1.080 0.289 0.720 0.545
Task 6 0.000 0.000 6.080 3.288 1.000 0.000 1.248 0.918
Task 7 0.000 0.000 3.500 2.236 1.000 0.000 1.153 0.706
Task 8 0.000 0.000 5.170 2.758 1.080 0.289 1.341 0.824
Task 9 0.000 0.000 14.00 11.794 1.250 0.452 5.323 5.005
Total tasks 0.000 0.000 50.167 16.297 1.065 0.088 4.474 0.019
In addition, table 5.33 presents results of the participants overall performance in the
three London Authorities assessed. The results of the one-way ANOVA indicate that
there is a significant difference in the participants‟ performance in terms of online
help required for all tasks among the three London Authorities (F=4.733, P=0.016)
(see Appendix 15 for the detailed one-way ANOVA results and Appendices 9a, 9b, 9c
for the detailed performance results). More specifically, the participants in London
Authority 2 required the most online help to complete all the tasks in the three target
London Authorities. However, the participants in London Authority 3 required the
least online help in all tasks completion among the three London Authorities
evaluated.
In addition, the results of the one-way ANOVA reveal a significant difference in the
participants‟ performance in terms of steps used for all tasks completion, which is also
found among the three e-government websites measured (F=10.862, P=0.000). In
detail, the participants who are in London Authority 2 took the most steps to finish all
the tasks, while, the participants who are in London Authority 3 used the fewest steps
in all task completion among the three target London Authorities.
Table 5.33 Overall users‟ performance in experiment 1
London Authority 1 London Authority 2 London Authority 3
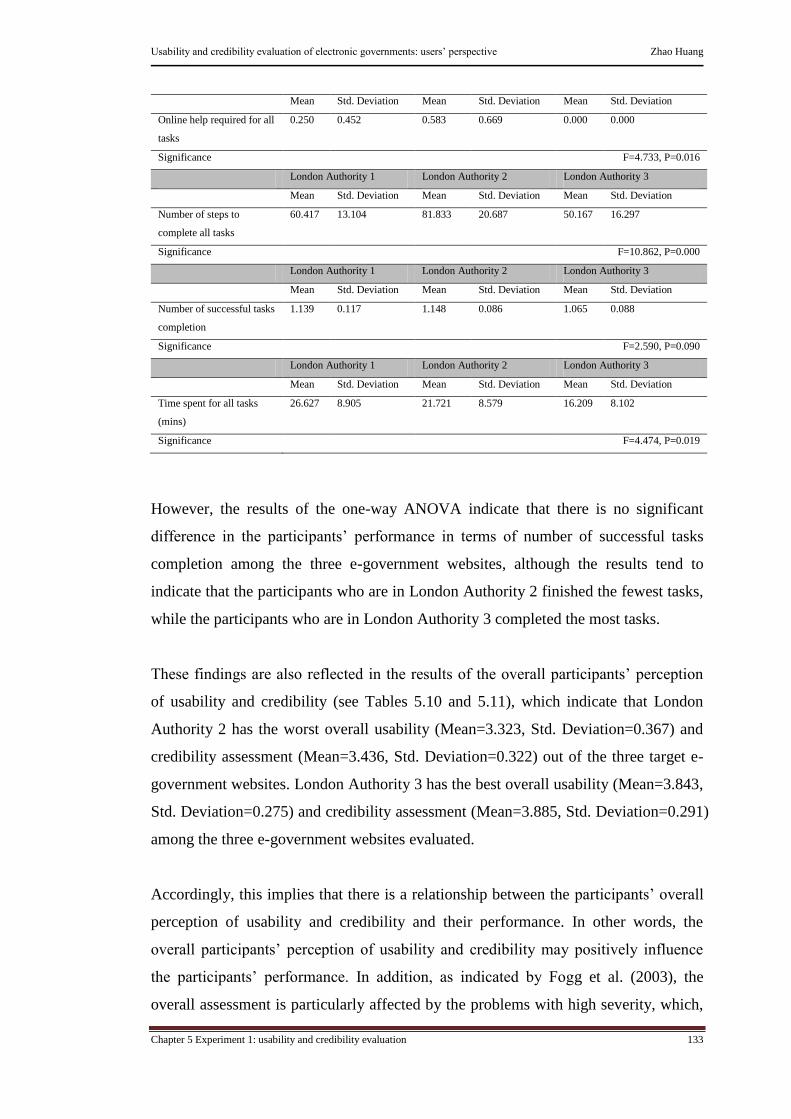
Usability and credibility evaluation of electronic governments: users‟ perspective Zhao Huang
Chapter 5 Experiment 1: usability and credibility evaluation 133
Mean Std. Deviation Mean Std. Deviation Mean Std. Deviation
Online help required for all
tasks
0.250 0.452 0.583 0.669 0.000 0.000
Significance F=4.733, P=0.016
London Authority 1 London Authority 2 London Authority 3
Mean Std. Deviation Mean Std. Deviation Mean Std. Deviation
Number of steps to
complete all tasks
60.417 13.104 81.833 20.687 50.167 16.297
Significance F=10.862, P=0.000
London Authority 1 London Authority 2 London Authority 3
Mean Std. Deviation Mean Std. Deviation Mean Std. Deviation
Number of successful tasks
completion
1.139 0.117 1.148 0.086 1.065 0.088
Significance F=2.590, P=0.090
London Authority 1 London Authority 2 London Authority 3
Mean Std. Deviation Mean Std. Deviation Mean Std. Deviation
Time spent for all tasks
(mins)
26.627 8.905 21.721 8.579 16.209 8.102
Significance F=4.474, P=0.019
However, the results of the one-way ANOVA indicate that there is no significant
difference in the participants‟ performance in terms of number of successful tasks
completion among the three e-government websites, although the results tend to
indicate that the participants who are in London Authority 2 finished the fewest tasks,
while the participants who are in London Authority 3 completed the most tasks.
These findings are also reflected in the results of the overall participants‟ perception
of usability and credibility (see Tables 5.10 and 5.11), which indicate that London
Authority 2 has the worst overall usability (Mean=3.323, Std. Deviation=0.367) and
credibility assessment (Mean=3.436, Std. Deviation=0.322) out of the three target e-
government websites. London Authority 3 has the best overall usability (Mean=3.843,
Std. Deviation=0.275) and credibility assessment (Mean=3.885, Std. Deviation=0.291)
among the three e-government websites evaluated.
Accordingly, this implies that there is a relationship between the participants‟ overall
perception of usability and credibility and their performance. In other words, the
overall participants‟ perception of usability and credibility may positively influence
the participants‟ performance. In addition, as indicated by Fogg et al. (2003), the
overall assessment is particularly affected by the problems with high severity, which,

Usability and credibility evaluation of electronic governments: users‟ perspective Zhao Huang
Chapter 5 Experiment 1: usability and credibility evaluation 134
in turn, have a larger impact on user perception. The usability and credibility
problems with high severity found in London Authority 2 are that some options on the
home page are not clearly presented and search results are not organised by the level
of relevance. In other words, these problems may seriously affect the overall
perception of usability and credibility of London Authority 2.
On the other hand, the results of the one-way ANOVA indicate that a significant
difference in the participants‟ performance in terms of time spent completing all tasks
is also detected among the three e-government websites measured (F=4.474, P=0.019).
As presented in Table 5.30, the participants who are in London Authority 1 took
longer to complete the tasks than those who are in London Authority 2 and 3.
However, this is not reflected in the findings of the overall participants‟ perception of
usability and credibility, which indicate that London Authority 1 is not the worst
overall usability and credibility e-government website in the three e-government
websites assessed. Based on these results, a possible explanation is that the
participants‟ performance may be not only influenced by the overall perception of
usability and credibility, but also affected by the particular perception of usability and
credibility. The problems with highest severity found in London Authority 1 are that
the links within the site use many different colours and subject information is
presented without consistent colours, both of these problems are closely related to site
look (see Tables 3.1 and 3.3, usability heuristic 8: aesthetic and minimalist design and
credibility guideline 1: site looks professional). Site look is the set of visual design
elements of e-government website, which has a considerable impact on users‟
perception of usability and credibility. Lavie and Tractinsky (2004) demonstrated that
aesthetics is strongly correlated with perceived usability, which is a key determinant
of users‟ satisfaction and pleasure. This is also supported by Tractinsky (1997), who
found that system aesthetics can be seen as apparent usability, which is perceived
more quickly than other attributes of usability. In terms of credibility, Fogg et al.
(2003) identified that the most prominent issue found in credibility evaluation is site
look, which can cause users the most concern about credibility. More importantly,
users‟ judgments of credibility are initially based on site look. As suggested by
Robins and Holmes (2008), the first impression of credibility comes from the site
look, which results in a faster judgment of credibility compared with other credibility
cognitive processes. As such, these may suggest that users‟ perception of the e-
Usability and credibility evaluation of electronic governments: users‟ perspective Zhao Huang
Chapter 5 Experiment 1: usability and credibility evaluation 135
government websites look may also influence their performance, especially in London
Authority 1.
5.5 Summary and conclusion
The purpose of experiment 1 was to evaluate usability and credibility of the three
target e-government websites in the UK. The results of users‟ perception in
experiment 1 suggest that there is much room for current e-governments to improve
their usability and credibility. In particular, with respect to usability, the most serious
usability problems identified in the target e-government websites lie within the areas
of “aesthetic and minimalist design”, “recognition rather than recall” and “consistency
and standards”. For example, regarding aesthetic and minimalist design, the links
within the site use many different colours. Regarding recognition rather than recall,
some options on the home page are not clearly presented. Regarding consistency and
standards, subject categories are always presented without a logical order. In terms of
credibility, the credibility problems with highest severity lie within the areas of “site
looks professional”, “make site easy to use and useful” and “show the honest and
trustworthy people behind the site”. For instance, regarding the site professional look,
information is presented without consistent colours. Regarding site ease of use and
usefulness, search results are not organised by the level of relevance. Regarding
showing the honest and trustworthy people behind the site, the detailed contact
information has not been clearly organised by different council departments and it is
not clear to see the e-government website‟s credentials. These problems suggest that
usability and credibility have not been considered in adequate detail in current e-
government website design. It can be argued that without addressing usability and
credibility in sufficient detail to inform e-government website design, it still remains a
challenging target for users‟ interaction with e-government.
In addition, the results of users‟ perception indicate that among the three target e-
government websites, the one that has the best overall usability is associated with the
best overall credibility, and vice versa. Similarly, the e-government website that has
the worst overall usability is associated with the worst overall credibility among the
three target e-government websites, and vice versa. Accordingly, this suggests that

Usability and credibility evaluation of electronic governments: users‟ perspective Zhao Huang
Chapter 5 Experiment 1: usability and credibility evaluation 136
usability and credibility have a close correlation. In other words, users‟ perception of
usability and credibility may positively influence each other, which need to be
considered as a whole in e-government development.
Furthermore, the results of users‟ performance in experiment 1 reveal that users have
different levels of interaction with each target e-government website when they
perform a set of the practical tasks. More significantly, the performance results imply
that there is a relationship between users‟ perception of usability and credibility and
their performance. In other words, users‟ perception of usability and credibility
positively influences their performance with the e-government websites evaluated. In
detail, users‟ performance is not only influenced by the overall users‟ perception of
usability and credibility, but also affected by the particular perception of usability and
credibility, such as the e-government website look.
Experiment 1 has evaluated usability and credibility of the three target e-government
websites based on users‟ perception and their tasks performance. According to the
evaluation, there are a number of usability and credibility problems that have been
identified in each target London Authority. In order to improve usability and
credibility of these target London Authorities to meet users‟ requirements, and
promote users‟ interaction with the e-government websites evaluated, there is a need
to provide the proposed design solutions regarding these usability and credibility
problems found in experiment 1. As such, the next chapter presents the detailed
design solutions for the identified usability and credibility problems for each target
London Authority.
Usability and credibility evaluation of electronic governments: users‟ perspective Zhao Huang
Chapter 6 Proposed design solutions 137
CHAPTER 6
PROPOSED DESIGN SOLUTIONS
6.1 Introduction
The findings presented in Chapter 5 indicate that there are a number of usability and
credibility problems that have been identified in each target e-government website.
These problems suggest that usability and credibility have not been considered in
sufficient detail in e-government website design. Without addressing usability and
credibility at the detailed level of e-government website design, the challenge of
users‟ engagement with e-government may still remain. For the target e-government
websites to be accepted and used by a wider range of users, these three evaluated e-
government websites need to improve their usability and credibility. This is also
supported by previous studies (e.g. Garcia et al., 2005), which indicated that
improving the usability of e-government can enhance service effectiveness and users‟
satisfaction, so that it can enable more users‟ participation. Furthermore, the success
of e-government is strongly influenced by highly credible e-government websites,
which in turn, promotes user trust of government (Sidi and Junaini, 2006). Therefore,
it is important to improve the identified usability and credibility problems in order to
develop the usability and credibility of the target e-government websites. To achieve
this goal, Chapter 6 proposes design solutions for the usability and credibility
problems found in experiment 1 for each target London Authority. The purpose is to
develop more usable and credible e-government websites that can meet the
requirements of different users and so enhance their interaction with the e-government
websites evaluated.
Therefore, this chapter starts with a description of the proposed design solutions in
relation to the identified usability and credibility problems for London Authority 1
(section 6.2). Then, it presents the proposed design solutions regarding the detected
usability and credibility problems for London Authority 2 (section 6.3) and London
Usability and credibility evaluation of electronic governments: users‟ perspective Zhao Huang
Chapter 6 Proposed design solutions 138
Authority 3 respectively (section 6.4). Finally, a brief summary of this chapter follows
in section 6.5.
6.2 Proposed design solutions for London Authority 1
Usability problem 1: Users are confused by links that have many different colours
The results show that one usability problem found in London Authority 1 is that users
are confused by links that have many different colours. Link colour is used to indicate
different resources. A limited number of link colours can visually support users
distinguishing the resource differences and so quickly locate relevant information.
However, links with many different colours obstruct subject recognition, so that users
may feel it is difficult to search for information within the site. As a result, the
suggestion would be that e-government websites should apply the minimum number
of link colours that can support users‟ subject recognition. One proposed design
solution is to reduce link colours used in London Authority 1. More specifically, some
link colours are reduced and changed to purple, especially in the quick online service,
since purple is the most frequently used link colour within the site. In addition, in
order to keep this link colour scheme, such a change is consistently implemented
through London Authority 1. In this way, it may make users comfortable with links
across the pages and visually reduce the colour distraction during their information
seeking.
Usability problem 2: Online help function is not clearly indicated on the website
Another usability problem identified in London Authority 1 is that it is difficult to see
the online help function on the site. Online help is used to provide user support
information, which can help users solve problems encountered on the site. Conversely,
the problem of the online help function not being clearly presented on the site
influences identification of help information, so that users may face the challenge of
solving problems as in London Authority 1. This suggests that online help
information should be clearly identifiable within the site, which will allow users to
use it at all times. One proposed design solution is to provide an online help option on

Usability and credibility evaluation of electronic governments: users‟ perspective Zhao Huang
Chapter 6 Proposed design solutions 139
every page of London Authority 1 linking user support information, and place such an
online help option in a fixed location on each page. In this way, the online help
function can be clearly presented on the site, which may help users quickly find and
access user support information to solve problems whenever they need.
Usability problem 3: It is difficult to switch between online help and current work
The results indicate that the next usability problem identified in London Authority 1 is
that it is difficult to switch between online help and current work. The ease of
switching between online help and current work is used to ensure that user support
information can be easily reviewed to assist users in their task completion. On the
contrary, the difficulty of switching between online help and current work hampers
the task completion, so that users may have to spend more time and memory on
retrieving their previous work after using online help information. Therefore,
designers of e-government websites should consider providing an approach that will
allow users to easily switch between online help and their current work without
confusion. One proposed design solution is to open online help information in a
separate window when users click on the online help option. In this way, it enables
users to read user support information in a different window without any changes to
their current work. After using it, users can simply close the online help window, and
go back to their work window.
Credibility problem 1: Information is presented without consistent colours
On the issue of credibility, the results reveal that the credibility problem found in
London Authority 1 is that information is presented without consistent colours. As
discussed (see section 5.3.1.3), colour consistency is used to establish unity across the
pages of e-government websites, strengthening visual subject recognition and
reducing layout clutter. It can help users easily locate information to meet their needs.
On the contrary, failure to present information with consistent colours affects overall
website consistency, which may cause users difficulty in information identification.
Accordingly, the suggestion is that e-government websites should keep a consistent
colour scheme. One proposed design solution is to use the same colours pattern to
present information across the pages of London Authority 1.

Usability and credibility evaluation of electronic governments: users‟ perspective Zhao Huang
Chapter 6 Proposed design solutions 140
6.3 Proposed design solutions for London Authority 2
Usability problem 1: Some options on the home page are not clearly presented
One usability problem detected in London Authority 2 is that some options on the
home page are not clearly presented. Users‟ subject recognition would be better
supported by having clearly presented more understandable options. It can help users
quickly understand subject content presented on the page and easily select relevant
options to locate their expected information. In contrast, subject options without clear
presentation can lead to page complexity, which may make it difficult for users to
search and recognise subject content. As such, designers of e-government websites
should consider providing an approach that can improve users‟ understanding of the
options presented on the home page. One proposed design solution is to provide
additional brief information to explain each option presented on the home page.
However, to avoid annoying users, this interpretation message only appears when
users move the mouse over the option. In this way, users will be given further
information to increase their understanding of the option subject.
Usability problem 2: Users are confused by links that have many different colours
The next usability problem found in London Authority 2 is that users are confused by
links that have many different colours. Specific link colours are used to indicate
different resources within the site. A limited number of link colours can help users
quickly locate relevant information. Conversely, links with many different colours
may hinder information seeking, so that users may find difficulty in recognizing
information differences between subject options. Therefore, the suggestion would be
that e-government websites should use the minimum number of link colours that will
support users‟ subject recognition. One proposed design solution is to reduce the
current number of link colours used within London Authority 2. In such a way, it can
reduce the link colours visual burden, so that users are able to quickly search and
process information presented on the site.
Usability and credibility evaluation of electronic governments: users‟ perspective Zhao Huang
Chapter 6 Proposed design solutions 141
Usability problem 3: The site sometimes does not indicate a task’s progress
Another usability problem identified in London Authority 2 is that the site sometime
does not indicate a task‟s progress. As discussed previously (see section 5.3.1.3), the
indication of the task progress helps users understand their task completion process in
two ways: indicating the total steps to complete a task and informing users how much
has been done and how much is left. As such, users can easily monitor their task
progress and measure the overall task completion status. In contrast, the absence of
presenting the task progress influences the task completion process, so that users may
wonder about their task movement within the task process. Therefore, it suggests that
e-government websites should keep users informed of the task process to increase
service transparency. One proposed design solution is to provide users with visual
cues to indicate the task progress. More specifically, these visual cues should not only
present the total steps of the task, but also highlight the current step that users are
engaged in. In this way, it will improve service transparency and help users determine
their task progress more easily.
Usability problem 4: Links already visited are not clearly marked
Further usability problem found in London Authority 2 is that links already visited are
not clearly marked. As indicated (see section 5.3.1.3), marking visited links is used to
help users distinguish which parts of the site they have already visited and which parts
remain to be explored, therefore users can increase their sense of structure and
location in the site and quickly find target information. However, when visited links
are not clearly marked, it may weaken the site‟s navigational recognition, so that users
may spend more time visiting the same place repeatedly and be confused by the
complexity of information identification. Therefore, designers of e-government
websites should consider providing an approach that will help users easily recognise
visited links within the site. One proposed design solution is to mark visited links in
italics within London Authority 2. In this way, it increases the site‟s navigational
recognition, so that users may quickly know the places where they have already
visited and where they have not been before, which can support their information
seeking.
Usability and credibility evaluation of electronic governments: users‟ perspective Zhao Huang
Chapter 6 Proposed design solutions 142
Usability problem 5: The site allows users to skip over the order of the process
Additionally, a usability problem found in London Authority 2 is that the site allows
users to skip over the order of the process. Following the order of the process ensures
that information in each step is provided, which can prevent users from missing data.
However, the problem of the site allowing users to skip over the order of the process
may break the sequence of task processing, which may result in failure to complete
the task. The suggestion is that e-government websites should provide an approach
that does not allow users to move to the next step until the necessary information on
the current step is provided. One proposed design solution is to offer mandatory fields
on each step and require users to complete compulsory information that the site asks
for. Furthermore, to address these mandatory fields for users, compulsory information
is marked by red asterisks (*). If users jump over the steps without completing
compulsory information, the reminder information will be presented in a message
window. In this way, users will be asked to provide information that the site needs
and follow the process in the correct order.
Credibility problem 1: Search results are not organised by the level of relevance
Regarding credibility problems, the results show that one problem found in London
Authority 2 is that search results are not organised by the level of relevance. As
indicated (see section 5.3.1.3), the level of relevance refers to a logical order of
information arrangement, which supports users in building a sensible way to search
subject information. However, search results without this level of relevance
arrangement may influence users‟ understanding of subject information organisation,
so that it may be difficult to locate relevant subjects. This suggests that e-government
websites should organise search results in a logical order that will aid users when
searching subjects. One proposed design solution is to organise search results in order
of relevance. Additionally, such relevance levels should be highlighted by using
visual cues, such as a five-star rating. In this way, users will easily understand the
arrangement of search results, and quickly locate subject information.

Usability and credibility evaluation of electronic governments: users‟ perspective Zhao Huang
Chapter 6 Proposed design solutions 143
Credibility problem 2: Content is displayed without consistent layout
The next credibility problem identified in London Authority 2 is that content is
displayed without consistent layout. Consistent layout is used to build unity
throughout the site, which supports users in information seeking. Conversely, failure
to display information with consistent layout affects overall website consistency,
which may lead to difficulty in information identification. Thus, this suggests using a
consistent layout pattern to present information across pages of e-government
websites. One proposed design solution is to apply the same layout scheme to each
subpage of London Authority 2. In this way, it can visually help users understand that
information is organised and presented in the same way throughout the site. After
initial experience with the site, users can quickly locate target information.
Credibility problem 3: There is no clear security message when users access some
confidential information
Finally, a credibility problem detected in London Authority 2 is that there is no clear
security message when users access some confidential information. Private
information and services on e-government website need to be protected, so that users
may feel safe when they transfer personal information within the site. A security
message is used to inform users about personal information safety, which is helpful
for users to develop trust. However, failure to provide security messages may reduce
the site‟s reliability, so that users may worry about losing private information
throughout the site. Thus, this suggests that e-government websites should inform
users about data protection when they access private services. One proposed design
solution is to provide security messages, indicating that users‟ personal information
will be treated safely and not be shared with any third-parties. To inform users, this
security message will be presented once users access any private services provided on
London Authority 2. In this way, it will increase the e-government website private
services protection and reduce users‟ concern about losing personal information.

Usability and credibility evaluation of electronic governments: users‟ perspective Zhao Huang
Chapter 6 Proposed design solutions 144
6.4 Proposed design solutions for London Authority 3
Usability problem 1: Users are confused by links that have many different colours
The results show that one usability problem found in London Authority 3 is that users
are confused by links that have many different colours. Link colour is used to indicate
different resources within the site. A limited number of link colours can visually help
users distinguish resource differences so as to easily identify relevant subject
information. Conversely, links with many different colours hamper resource
recognition, which may result in users difficulty with information identification. As
such, designers of e-government websites should consider applying the minimum
number of link colours and support users‟ subject recognition during information
seeking. One proposed design solution is to reduce link colours used in London
Authority 3. In this way, it may reduce users colour visual confusion and visually
support users when locating information objects.
Usability problem 2: Subject categories are presented without a logical order
Another usability problem found in London Authority 3 is that subject categories are
presented without a logical order. A logical order is used to show a sequence of
information arrangement, which helps users to be able to quickly scan subject
information to identify objects and reduce memory load problems. Similarly, failure
to present subject categories with the logical order hinders information arrangement,
which may lead to complexity of information seeking. Accordingly, designers of e-
government websites should consider organising subject categories in a particular
order to support users identifying a sensible way to scan subject information. One
proposed design solution is to arrange subject categories in an alphabetical order on
each page of London Authority 3. In this way, users may quickly understand the
overall subject arrangement and easily identify relevant information to meet their
needs.
Usability problem 3: Links already visited are not clearly marked

Usability and credibility evaluation of electronic governments: users‟ perspective Zhao Huang
Chapter 6 Proposed design solutions 145
The results show that one usability problem identified in London Authority 3 is that
links already visited are not clearly marked. As discussed previously (see section
5.3.1.3), marking visited links is used to indicate which parts of the site users have
already visited and which parts remain to be explored. It can help users build the
sense of structure and location in the site, and navigate them quickly to their target
information. However, when visited links are not clearly marked, it weakens the site‟s
navigational recognition, so that users may very likely visit the same page repeatedly
and have difficulty locating information. Therefore, designers of e-government
websites should consider providing an approach that will help users recognise the
unused and used links within the site during the information seeking process. One
proposed design solution is to mark visited links in italics within London Authority 3.
In this way, users can quickly distinguish the places they have visited before and
guide their movement around the site to locate relevant subject information.
Usability problem 4: Users get lost due to being given too many choices during
information seeking
Additionally, a usability problem detected in London Authority 3 is that users get lost
due to being given too many choices during information seeking. The appropriate
number of options can be used to keep content from getting cluttered and reduce the
chance that users are confused by the large number of choices. Hence, it helps
information retrieval. On the contrary, an excessive number of choices may cause
difficulty in information acquisition (Nielsen, 2000), so that users may feel frustration
when searching for information in a particular content space. Therefore, designers of
e-government websites should consider providing an approach that will allow users to
feel comfortable with the number of subject options. One proposed design solution is
to design a drop-down menu for each subject category that visually hides its sub
options. When users move the mouse to the subject category, a type of stretch sub list
is used to present the various sub options associated with this subject category. In this
way, the number of choices is visually reduced on the page, which is not only helpful
in preventing content from getting cluttered, but also beneficial for users to read and
locate information.
Usability and credibility evaluation of electronic governments: users‟ perspective Zhao Huang
Chapter 6 Proposed design solutions 146
Credibility problem 1: Detailed contact information has not been organised by
different departments of the council
With respect to credibility, the results show that one credibility problem found in
London Authority 3 is that detailed contact information has not been organised by
different departments of the council. Contact information arranged by different
departments is used to present an order of information organisation, which provides
users with a logical way to search contact information. Conversely, when detailed
contact information is not arranged by different departments, it may make it difficult
for users to search the specific contact information. As such, it suggests that detailed
contact information should be organised by different departments and presented in a
clear way that will support users searching for objects. One proposed design solution
is to provide the contact details with two levels. In the first level, it provides general
contact content with associated links to the detailed level of contact information. In
the second level, the detailed contact information is organised by the different
departments of the council. In this way, users can quickly read information and locate
the target contact information to fit in their needs.
Credibility problem 2: It is not clear to see the site’s credentials because the site does
not display awards it has earned
The results reveal that another credibility problem detected in London Authority 3 is
that any awards won by the e-government website are not clearly displayed. As
discussed (see section 5.3.1.3), displaying awards won by an e-government
organisation is useful for enhancing its reputation, which promotes users‟ trust. On the
contrary, the problem of the site‟s credentials not being clearly presented may affect
reputation presentation, which in turn, may lead to lower users‟ trust. As such,
designers of e-government websites should consider presenting the reputation of e-
government by using visual cues. One proposed design solution is to present the
awards, such as web and Internet standard awards; best council awards won by
London Authority 3 on the web pages, which may be helpful for users to develop
long-term trust.

Usability and credibility evaluation of electronic governments: users‟ perspective Zhao Huang
Chapter 6 Proposed design solutions 147
Credibility problem 3: The site does not provide a shortcut option for access to
information about the local council
Furthermore, a credibility problem identified in London Authority 3 is that it is hard
to find quick access to information about the local council. The provision of
information about the local council is used to introduce e-government. It provides
users with an opportunity to know that there are real people and an organization
working behind the site. As such, it develops users‟ trust. Conversely, without easy
access to such information, it may influence the delivery of a real world feel, so that it
may be hard for users to develop their trust. Consequently, the suggestion is that e-
government websites should provide a link that will support users to easily and
quickly access information about the local council. One proposed design solution is to
design a shortcut option on every page within the site, linking the information about
the local council. In addition, in order to make such information to be easily found,
this shortcut option is consistently located on a fixed place within London Authority 3.
In this way, users may easily access local council information at all times, which is
helpful for them to enhance trust.
Credibility problem 4: There is no clear security message when users access some
confidential information
Moreover, the results indicate that one credibility problem found in London Authority
3 is that there is no clear security message when users access some confidential
services. A security message is used to inform users about their personal information
protection, which can increase users‟ perception of safety on the site. However, the
absence of such security messages when users access confidential services may
reduce the site‟s reliability, so that users may worry about losing private data and find
it difficult to engage in online transaction services. Therefore, designers of e-
government websites should inform users about data protection during the use of
private services. One proposed design solution is to provide security messages,
indicating that users‟ personal information will be treated safely and not be shared
with any third-parties. Furthermore, in order to inform users timely, such a security
message will be presented once users click any private services provided by London

Usability and credibility evaluation of electronic governments: users‟ perspective Zhao Huang
Chapter 6 Proposed design solutions 148
Authority 3. In this way, it will help users understand their personal information
protection and reduce any concerns about losing their personal information.
Credibility problem 5: It is not clear how much users have done and how much
remains when completing tasks
Another credibility problem found in London Authority 3 is that it is not clear how
much users have done and how much remains to do when completing tasks. As
discussed (see section 5.3.1.3), task progress indications are used to support users task
completion, presenting the total steps of the task and informing users about the current
stage that they are engaged in. Conversely, the lack of task progress indications may
influence task completion support, so that users may find it difficult to monitor their
task movement within the site. Therefore, designers of e-government websites should
consider improving the task progress transparency, which will allow users to easily
review their task progress in the task process. One proposed design solution is to
provide visual cues that indicate the total steps of the task and highlight the current
stage that users have reached. In this way, users can easily review their task progress
and quickly judge how much is left in their task completion.
Credibility problem 6: Information about the site update is not clearly presented
The next credibility problem identified in London Authority 3 is that the information
about the site update is not clearly presented. Updated information is regarded as a
significant reference, which helps users determine whether information and services
obtained are current. On the contrary, the problem that the updated information is not
explicitly presented in London Authority 3 may cover up information quality and
result in users facing a challenge in deciding the level of reliability and accuracy of
content on the site. As a result, this suggests that all updated information on e-
government websites should be clearly presented. One proposed design solution is to
present a recently updated date on every page of London Authority 3. In addition, in
order to ensure that the updated date can be easily found by users, this updated date is
placed in a fixed position across the pages. In this way, users will easily find the
updated information and quickly judge how current the information is within the site.

Usability and credibility evaluation of electronic governments: users‟ perspective Zhao Huang
Chapter 6 Proposed design solutions 149
Credibility problem 7: It is difficult to see a log-in option when users access some
personal services
Additionally, the results show that the final credibility problem detected in London
Authority 3 is that it is difficult to see a log-in option when users conduct some
personal services. A sign-in option is a common protection mechanism for users‟
authentication, which ensures private information and services safety. This can reduce
users‟ perception of risk. However, the problem of accessing confidential services
without a sign-in requirement increases the risk of personal information and services,
which may result in users failing to engage in services within the site. Therefore,
designers of e-government websites should consider applying a log-in approach that
will protect users when conducting personal services. One proposed design solution is
to provide a sign-in/register option within the site. More specifically, when users
access personal services, the site requires users to sign in or register services in the
first place. After logging in to the site, it enables users to continue their service tasks.
In this way, only authorized users gain access to private information and services,
which can increase the security of the personal services.
6.5 Summary and conclusion
Having evaluated the usability and credibility of the three target e-government
websites in experiment 1 (Chapter 5), the findings suggest that there is much room for
the target e-government websites to improve both their usability and credibility. In
particular, there are a number of specific usability and credibility problems that have
been identified in each target London Authority (see Tables 6.1 and 6.2). These
problems imply that usability and credibility have not been considered in adequate
detail in current e-government website design. Without addressing usability and
credibility in sufficient detail in e-government website design, it may still remain a
challenge for users‟ engagement with e-government websites. Thus, there is a need to
develop more usable and credible e-government websites that support users to achieve
their desirable services outcomes. In this vein, this chapter describes a set of proposed
design solutions regarding the usability and credibility problems found in experiment
1 for each target London Authority. These proposed design solutions can provide

Usability and credibility evaluation of electronic governments: users‟ perspective Zhao Huang
Chapter 6 Proposed design solutions 150
concrete prescriptions for improving the identified usability and credibility problems
in each evaluated e-government website. The purpose is to increase overall usability
and credibility of the target e-government websites, which can meet with users‟ needs
and enhance their interaction with the e-government websites evaluated.
Table 6.1 Usability problems and design solutions within three London Authorities
Usability problems and design solutions LA 1 LA 2 LA 3
Problem: Users are confused by links that have many different colours.
Solution: Link colours used within the target e-government websites are reduced.
√ √ √
Problem: Online help function is not clearly indicated on the website.
Solution: An online help option is provided on every page of the e-government
website linking user support information, and placed in a fixed location on each
page.
√
Problem: It is difficult to switch between online help and current work.
Solution: Online help information is opened in a separate window when users click
on the online help option.
√
Problem: Some options on the home page are not clearly presented.
Solution: Additional brief information is provided to explain each option presented
on the home page. However, to avoid annoying users, this interpretation message
only appears when users move the mouse to the option.
√
Problem: The site sometimes does not indicate a task‟s progress.
Solution: Visual cues to indicate a task‟s progress are provided on the site.
√
Problem: Links already visited are not clearly marked.
Solution: The visited links are marked in italics within the e-government websites.
√ √
Problem: The site allows users to skip over the order of the process.
Solution: The mandatory fields are offered in each step for users. Additionally, to
address these mandatory fields for users, compulsory information is marked by a red
asterisk (*).
√
Problem: Subject categories are presented without a logical order.
Solution: Subject categories are arranged in an alphabetical order on each page of
the e-government website.
√
Problem: Users get lost due to being given too many choices during information
seeking.
Solution: Drop-down menu is designed for the subject category that visually hides
its sub options. When users move the mouse to the subject category, a type of stretch
sub list is used to present the various sub options associated with this subject
category.
√
(√ = problem and solution identified, LA 1 = London Authority 1, LA 2 = London Authority 2, LA 3 = London Authority 3)
Table 6.2 Credibility problems and design solutions within three London Authorities
Credibility problems and design solutions LA 1 LA 2 LA 3
Problem: Information is presented without consistent colours.
Solution: The same colours pattern is applied to present information across the
pages of the site.
√
Problem: Search results are not organised by the level of relevance.
Solution: Search results are organised by the level of relevance. Additionally, such
relevance levels are highlighted by using visual cues, such as a five-star rating.
√

Usability and credibility evaluation of electronic governments: users‟ perspective Zhao Huang
Chapter 6 Proposed design solutions 151
Problem: Content is displayed without consistent layout.
Solution: The same layout scheme is applied to each subpage of the e-government
website.
√
Problem: There is no clear security message when users access some confidential
information.
Solution: A security message is provided, indicating that users‟ personal
information will be treated safely and not be shared with any third-party. To inform
users, this security message is presented once users access any private services
provided on the e-government websites.
√ √
Problem: Detailed contact information has not been organised by different
departments of the council.
Solution: The contact details are designed into two levels. In the first level, it
provides general contact information with associated links to the detailed level of
contact information. In the second level, the detailed contact information will be
organised by the different departments of the council.
√
Problem: It is not clear to see the site‟s credentials because the site does not display
awards it has earned.
Solution: Awards, such as web and Internet standard awards; best council awards;
etc., won by the e-government are presented on the web pages.
√
Problem: The site does not provide a shortcut option for access to information about
the local council.
Solution: A shortcut option is shown on every page within the site, linking the
information about the local council. In addition, in order to make such information to
be easily found, this shortcut option is consistently located at a fixed place within the
site.
√
Problem: It is not clear to indicate how much users have done and how much
remains when completing tasks.
Solution: Visual cues are provided, which indicate the total steps of the task and
highlight the current stage that users are engaged in.
√
Problem: The information about the site update is not clearly presented.
Solution: A recently updated date is presented on every page of the e-government
website.
√
Problem: It is difficult to see a sign-in option when users access some personal
services.
Solution: A sign-in/register option is provided within the site. More specifically,
when users access some personal services, the site requires users to sign in or
register the service in the first place. After logging into the site, it enables users to
continue their tasks.
√
(√ = problem and solution identified, LA 1 = London Authority 1, LA 2 = London Authority 2, LA 3 = London Authority 3)
Given the proposed design solutions detailed in this chapter, the issue is to investigate
whether or not these proposed design solutions can improve the usability and
credibility problems detected in each target London Authority. Therefore, the next
chapter presents and discusses the results for experiment 2. Experiment 2 implements
these proposed design solutions into the three redesigned e-government websites and
invites the participants to assess these usability and credibility design solutions. The

Usability and credibility evaluation of electronic governments: users‟ perspective Zhao Huang
Chapter 6 Proposed design solutions 152
assessment is based on users‟ perception and their performance. The results obtained
from both users‟ perception and performance are used to compare with the results in
experiment 1 in order to indicate the effects of the proposed design solutions on the
redesigned e-government websites.

Usability and credibility evaluation of electronic governments: users‟ perspective Zhao Huang
Chapter 7 Experiment 2: improved usability and credibility assessment 153
CHAPTER 7
EXPERIMENT 2: IMPROVED USABILITY AND CREDIBILITY
ASSESSMENT
7.1 Introduction
Chapter 7 presents and discusses the results for experiment 2. This experiment aims to
examine whether the proposed design solutions can improve the usability and
credibility problems identified in Chapter 5, using the design solutions presented in
Chapter 6. More specifically, this chapter attempts to investigate research questions 3,
4 and 5 (RQ3: What are the effects of the proposed usability design solutions on the
usability problems on each target e-government website? RQ4: What are the effects of
the proposed credibility design solutions on the credibility problems on each target e-
government website? RQ5: What are the effects of the proposed design solutions on
users‟ interaction with each target e-government website?). It assesses the proposed
design solutions based on users‟ perception and their performance when using the
three redesigned e-government websites. In detail, users‟ perception is identified from
the results of experiment 2‟s usability and credibility evaluation questionnaire
(showing users‟ opinions about the proposed design solutions for each redesigned
London Authority), while users‟ performance is measured through observation to
indicate the level of users‟ interaction with the redesigned e-government websites.
Therefore, this chapter starts with the descriptions of the participants and their
responses (section 7.2). This is followed by presenting the results in terms of users‟
perception (section 7.3) and users‟ performance (section 7.4). Finally, a discussion
and conclusion about the improved usability and credibility of the redesigned e-
government websites is provided at the end of the chapter (section 7.5).

Usability and credibility evaluation of electronic governments: users‟ perspective Zhao Huang
Chapter 7 Experiment 2: improved usability and credibility assessment 154
7.2 Description of the participants and their responses
This section describes the participants‟ demographic information and their responses
in experiment 2. The demographic information is based on the participants‟
characteristics in terms of gender, age and Internet use to show the distribution of the
participants across the three redesigned e-government websites. In addition, the
participants‟ responses are used to show the distribution of the sets of data obtained
from users‟ perception and performance in each redesigned e-government website.
The detailed descriptions are presented in the following sub-sections.
7.2.1 Description of the participants
The purpose of a description of the participants‟ demographic information is to show
that the distribution of the participants across the three redesigned e-government
websites in experiment 2 is unbiased. As indicated previously (see section 6.5),
experiment 2 aims to assess the effects of the proposed design solutions on the
identified usability and credibility problems based on the comparative measurement in
terms of the participants‟ perception and their task performance. In order to support
the comparative analysis before and after the proposed design solutions have been
implemented in experiment 1 and experiment 2 respectively, and identify the
participants‟ perception and performance changes, the same number of the
participants in experiment 1 is allocated for each redesigned e-government website in
experiment 2 (N=12). In addition, they are the same participants who have taken part
in experiment 1. Therefore, as it is shown by the analysis of the participants‟
demographic information in terms of gender, age and Internet use in experiment 1
(see Chapter 5.2.1), it indicates that the participants are equally allocated across the
three target London Authorities. Accordingly, it suggests that the distribution of the
participants in the three redesigned e-government websites is by and large unbiased.

Usability and credibility evaluation of electronic governments: users‟ perspective Zhao Huang
Chapter 7 Experiment 2: improved usability and credibility assessment 155
7.2.2 Description of the participants’ responses
Having indicated the participants‟ distribution in experiment 2, to conduct data
analysis techniques for experiment 2, such as a Paired-Samples T-test, the normality
of data sets is perquisite (Foster, 2001). In other words, the parametric statistics used
for experiment 2 is only meaningful for the sets of data that follows a normal
distribution. Therefore, there is a need to analyse the distribution of the data sets used
in experiment 2. This part describes the distribution of data obtained from both users‟
perception and performance. To examine data distribution normality, the one sample
Kolmogorov-Smirnov test (K-S test) is selected since it is commonly used to analyse
distribution normality (Foster, 2001), and its validity has been proven by a large
number of studies (e.g. Hinton et al., 2004; Kinnear, 2008; Pallant, 2001). Thus, a one
sample K-S test is used to determine whether the participants‟ responses to the
specific usability and credibility questions regarding each redesigned e-government
website follow a normal distribution. Similarly, a one sample K-S test is also
employed to indicate whether the sets of data from the participants‟ performance with
each redesigned e-government website is a normal distribution. Within the one sample
K-S test results, a significant P-value indicates a probability that the sample
distribution is different from an expected probability distribution (e.g. a normal
distribution). If the significant value (P-value) is greater than 0.05, it indicates that the
data set follows a normal distribution. On the contrary, the results suggest the
distribution is not a normal distribution when the significant value (P-value) is less
than 0.05.
Table 7.1 presents the results of the K-S test with respect to participants‟ responses
regarding the specific usability and credibility questions in London Authority 1 and
the redesigned London Authority 1 respectively. As shown in Table 7.1, the
significant value in each specific question is greater than P=0.05. Therefore, it implies
that the distribution of the participants‟ responses to the specific usability and
credibility questions regarding London Authority 1 and the redesigned London
Authority 1 follows a normal distribution (see Appendix 13b for the detailed K-S test
results).

Usability and credibility evaluation of electronic governments: users‟ perspective Zhao Huang
Chapter 7 Experiment 2: improved usability and credibility assessment 156
Table 7.1 Specific usability and credibility questions responses distribution in London Authority 1 and the redesigned London
Authority 1
Usability question 40 Usability question 33 Usability question 41 Credibility question 2
Experiment 1 - London Authority 1
Significance 0.732 0.181 0.303 0.465
Experiment 2 - Redesigned London Authority 1
Significance 0.145 0.170 0.145 0.505
Table 7.2 shows the results of the K-S test regarding participants‟ responses to the
specific usability and credibility questions in London Authority 2 and the redesigned
London Authority 2 respectively. As shown in Table 7.2, the significant value of each
specific question responses in London Authority 2 and the redesigned London
Authority 2 is also more than P=0.05. This suggests that the distribution of
participants‟ responses regarding the specific usability and credibility questions in
London Authority 2 and the redesigned London Authority 2 follows a normal
distribution (see Appendix 13b for the detailed K-S test results).
Table 7.2 Specific usability and credibility questions responses distribution in London Authority 2 and the redesigned London
Authority 2
Usability question 33 Usability question 24 Usability question 6 Usability question 32
Experiment 1 - London Authority 2
Significance 0.303 0.450 0.551 0.164
Experiment 2 - Redesigned London Authority 2
Significance 0.139 0.668 0.310 0.068
Usability question 19 Credibility question 2 Credibility question 24 Credibility question 39
Experiment 1 - London Authority 2
Significance 0.217 0.287 0.509 0.455
Experiment 2 - Redesigned London Authority 2
Significance 0.164 0.329 0.070 0.145
Table 7.3 presents the results of the K-S test regarding the participants‟ responses to
the specific usability and credibility questions in London Authority 3 and the
redesigned London Authority 3. As shown in Table 7.3, the significant value of each
specific question responses in London Authority 3 and the redesigned London
Authority 3 is greater than P=0.05. As such, this suggests that the distribution of the
participants‟ responses of each specific usability and credibility questions regarding
London Authority 3 and the redesigned London Authority 3 follows a normal
distribution (see Appendix 13b for the detailed K-S test results).

Usability and credibility evaluation of electronic governments: users‟ perspective Zhao Huang
Chapter 7 Experiment 2: improved usability and credibility assessment 157
Table 7.3 Specific usability and credibility questions responses distribution in London Authority 3 and the redesigned London
Authority 3
Usability question 33 Usability question 32 Usability question 9 Usability question 16
Experiment 1 - London Authority 3
Significance 0.203 0.222 0.262 0.262
Experiment 2 - Redesign London Authority 3
Significance 0.310 0.210 0.370 0.084
Usability question 13 Credibility question 39 Credibility question 20 Credibility question 16
Experiment 1 - London Authority 3
Significance 0.139 0.450 0.209 0.407
Experiment 2 - Redesign London Authority 3
Significance 0.451 0.070 0.092 0.130
Credibility question 15 Credibility question 23 Credibility question 25 Credibility question 38
Experiment 1 - London Authority 3
Significance 0.079 0.509 0.187 0.509
Experiment 2 - Redesigned London Authority 3
Significance 0.145 0.139 0.145 0.130
Furthermore, Tables 7.4, 7.5 and 7.6 present the distribution of the participants‟
performance with the target London Authorities in experiments 1 and 2 respectively.
As shown in Table 7.4, the results of the K-S test indicate that the significant value of
the participants‟ performance with London Authority 1, in terms of time spent
completing tasks; number of steps to accomplish tasks; online help required and
number of successful tasks completion, is greater than P-value 0.05, which suggest
that the distribution of the participants‟ performance with London Authority 1 follows
a normal distribution. Moreover, the significant value of the participants‟ performance
with the redesigned London Authority 1, in terms of total time spent completing tasks
and number of steps to finish tasks is greater than P=0.05. Thus, the findings suggest
that the participants‟ performance in terms of total time spent for task completion and
number of steps to finish all tasks with the redesigned London Authority 1 follows a
normal distribution. However, there is no online help required for tasks completion
and all tasks are completed successfully in the redesigned London Authority 1. Thus
the significant value in terms of amount of online help required and number of
successful tasks completion is not available (see Appendix 13b for the detailed K-S
test results).

Usability and credibility evaluation of electronic governments: users‟ perspective Zhao Huang
Chapter 7 Experiment 2: improved usability and credibility assessment 158
Table 7.4 Performance distribution in London Authority 1 and the redesigned London Authority 1
Total time for all
tasks completion
Number of steps to
complete tasks
Helps required for
tasks completion
Number of successful
tasks completion
Experiment 1 - London Authority 1
Significance 0.841 0.968 0.130 0.390
Experiment 2 - Redesigned London Authority 1
Significance 0.980 0.819 N/A N/A
As shown in Table 7.5, the results of the K-S test indicate that the significant value of
the participants‟ performance, in terms of time spent completing tasks; number of
steps to accomplish tasks; online help required and number of successful tasks
completion, in experiment 1 is greater than P-value 0.05. Such findings suggest that
the distribution of the participants‟ performance with London Authority 2 follows a
normal distribution. Regarding experiment 2, the significant value of the participants‟
performance in terms of total time spent completing tasks and number of steps to
finish tasks, is greater than P=0.05. As such, the findings suggest that the participants‟
performance, in terms of total time spent completing the tasks and number of steps to
finish the tasks with the redesigned London Authority 2 follows a normal distribution.
However, there is no help required for tasks completion and all tasks are completed
successfully in the redesigned London Authority 2. Thus, the significance of the
participants‟ performance in terms of amount of online help required and number of
successful tasks completion is not available (see Appendix 13b for the detailed K-S
test results).
Table 7.5 Performance distribution in London Authority 2 and the redesigned London Authority 2
Total time for all
tasks completion
Number of steps to
complete tasks
Helps required for
tasks completion
Number of successful
tasks completion
Experiment 1 - London Authority 2
Significance 0.371 0.818 0.203 0.141
Experiment 2 - Redesigned London Authority 2
Significance 0.386 0.996 N/A N/A
Table 7.6 shows the distribution of the participants‟ performance with London
Authority 3 and the redesigned London Authority 3. As indicated in Table 7.6, the
results of the K-S test show that the significant value of the participants‟ performance,
in terms of time spent completing tasks; number of steps to accomplish tasks and
number of successful tasks completion, with London Authority 3 is greater than
P=0.05. It implies that the distribution of the participants‟ performance in terms of

Usability and credibility evaluation of electronic governments: users‟ perspective Zhao Huang
Chapter 7 Experiment 2: improved usability and credibility assessment 159
time spent completing tasks; number of steps to accomplish tasks and number of
successful tasks completion with London Authority 3 follows a normal distribution.
However, there is no help required for tasks completion. The significance of the
participants‟ performance in terms of amount of online help required is not available.
Regarding the participants‟ performance with the redesigned London Authority 3, the
significant value of the participants‟ performance, in terms of total time spent
completing tasks and number of steps to finish tasks, is greater than P-value 0.05.
Therefore, it suggests that the participants‟ performance in terms of total time for
tasks completion and number of steps completing the tasks with the redesigned
London Authority 3 follows a normal distribution. However, there is no help
requirement for tasks completion and all tasks are completed successfully in the
redesigned London Authority 3. Thus, the significance of the participants‟
performance in terms of amount of online help required and number of successful
tasks completion is not available (see Appendix 13b for the detailed K-S test results).
Table 7.6 Performance distribution in London Authority 3 and the redesigned London Authority 3
Total time for all
tasks completion
Number of steps to
complete tasks
Helps required for
tasks completion
Number of successful
tasks completion
Experiment 1 - London Authority 3
Significance 0.949 0.750 N/A 0.102
Experiment 2 - Redesigned London Authority 3
Significance 0.983 0.645 N/A N/A
7.3 Users’ perception
Users‟ perception is reflected in the participants‟ judgments and resulting choices
from a range of options expressed throughout the questionnaire. It aims to assess
whether the proposed design solutions can solve the usability and credibility problems
found in experiment 1. To have a better understanding of the participants‟ perception,
both quantitative and qualitative data are collected. More specifically, quantitative
data uses the results from the closed questions in the questionnaire to reveal the
participants‟ assessments of the proposed design solutions. Qualitative data presents
the participants‟ further thoughts about the proposed design solutions for the
redesigned e-government websites from the open-ended questions in the questionnaire.
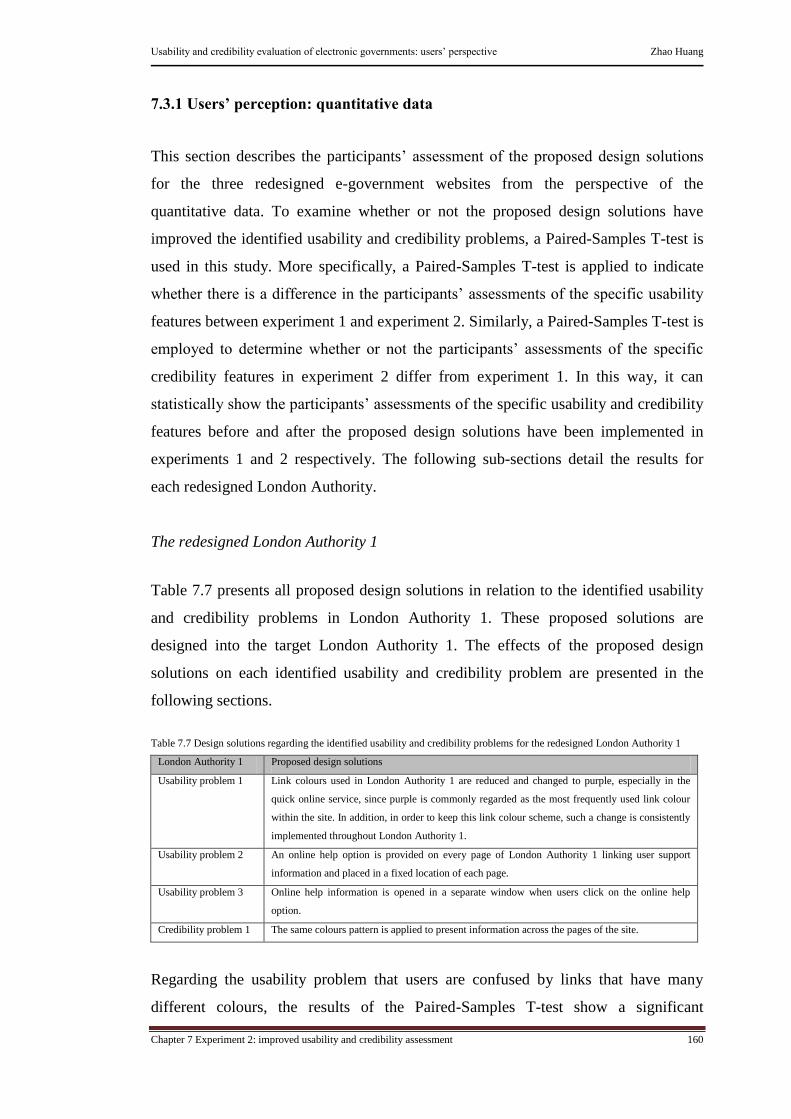
Usability and credibility evaluation of electronic governments: users‟ perspective Zhao Huang
Chapter 7 Experiment 2: improved usability and credibility assessment 160
7.3.1 Users’ perception: quantitative data
This section describes the participants‟ assessment of the proposed design solutions
for the three redesigned e-government websites from the perspective of the
quantitative data. To examine whether or not the proposed design solutions have
improved the identified usability and credibility problems, a Paired-Samples T-test is
used in this study. More specifically, a Paired-Samples T-test is applied to indicate
whether there is a difference in the participants‟ assessments of the specific usability
features between experiment 1 and experiment 2. Similarly, a Paired-Samples T-test is
employed to determine whether or not the participants‟ assessments of the specific
credibility features in experiment 2 differ from experiment 1. In this way, it can
statistically show the participants‟ assessments of the specific usability and credibility
features before and after the proposed design solutions have been implemented in
experiments 1 and 2 respectively. The following sub-sections detail the results for
each redesigned London Authority.
The redesigned London Authority 1
Table 7.7 presents all proposed design solutions in relation to the identified usability
and credibility problems in London Authority 1. These proposed solutions are
designed into the target London Authority 1. The effects of the proposed design
solutions on each identified usability and credibility problem are presented in the
following sections.
Table 7.7 Design solutions regarding the identified usability and credibility problems for the redesigned London Authority 1
London Authority 1 Proposed design solutions
Usability problem 1 Link colours used in London Authority 1 are reduced and changed to purple, especially in the
quick online service, since purple is commonly regarded as the most frequently used link colour
within the site. In addition, in order to keep this link colour scheme, such a change is consistently
implemented throughout London Authority 1.
Usability problem 2 An online help option is provided on every page of London Authority 1 linking user support
information and placed in a fixed location of each page.
Usability problem 3 Online help information is opened in a separate window when users click on the online help
option.
Credibility problem 1 The same colours pattern is applied to present information across the pages of the site.
Regarding the usability problem that users are confused by links that have many
different colours, the results of the Paired-Samples T-test show a significant

Usability and credibility evaluation of electronic governments: users‟ perspective Zhao Huang
Chapter 7 Experiment 2: improved usability and credibility assessment 161
difference in the participants‟ perception between experiments 1 and 2. Table 7.8
presents the view of the participants about link colours in experiments 1 and 2. As
shown in Table 7.8, over half of the participants (66.7%) in experiment 1 indicated
their confusion about links with many different colours. In contrast, a majority of the
participants (91.7%) have a negative opinion about confusion with links that have
many different colours in experiment 2 (see Appendix 10a for the detailed Paired-
Samples T-test results).
Table 7.8 Users‟ perception of links colours in experiment 1 and experiment 2
I am confused with links that have many different colours.
Experiment 1 (N=12) Experiment 2 (N=12)
N % N %
Strongly disagree 0 0% 9 75%
Disagree 3 25% 2 16.7%
Neutral 1 8.3% 1 8.3%
Agree 6 50% 0 0%
Strongly agree 2 16.7% 0 0%
Significance T=-7.386, P=0.000
As suggested (see section 6.2), to decrease link colours distraction when users interact
with the site, the proposed design solution that reduces link colours has been applied
to the redesigned London Authority 1 in experiment 2. As shown in Figure 7.1a,
initially, there are many different link colours that have been used in London
Authority 1. However, as shown in Figure 7.1b, link colours used in London
Authority 1 are reduced, especially, in the quick online service links. The results of
experiment 2 reveal that the participants‟ confusion resulting from links with many
different colours is significantly reduced in the redesigned London Authority 1. In
other words, the usability problem of links with many different colours has been
significantly improved by the proposed design solution.

Usability and credibility evaluation of electronic governments: users‟ perspective Zhao Huang
Chapter 7 Experiment 2: improved usability and credibility assessment 162
Figure 7.1 Usability problem 1 in London Authority 1 and the design solution in the redesigned London Authority 1
With respect to the next usability problem of the online help function not being
clearly presented on the site, the results of the Paired-Samples T-test show that there
is a significant difference in the participants‟ assessments between experiments 1 and
2. Table 7.9 shows the view of the participants on the online help function
presentation in experiments 1 and 2. As revealed in Table 7.9, more than half of the
participants (58.3%) in experiment 1 think that it is difficult to find the online help
function on the site. On the contrary, all participants (100%) in experiment 2 assess it
differently, which the online help function can be easily found in the redesigned
London Authority 1.
Table 7.9 Users‟ perception of online help functions in experiment 1 and experiment 2
It is easy to find help functions in the system.
Experiment 1 (N=12) Experiment 2 (N=12)
N % N %
Strongly disagree 3 25% 0 0%
Disagree 4 33.3% 0 0%
Neutral 4 33.3% 0 0%
Agree 0 0% 6 50%
Strongly agree 1 8.3% 6 50%
a
b
Link colours
are reduced

Usability and credibility evaluation of electronic governments: users‟ perspective Zhao Huang
Chapter 7 Experiment 2: improved usability and credibility assessment 163
Significance T=-5.922, P=0.000
As suggested, in order to increase the online help function identification, the proposed
design solution provides a shortcut option linking user support information and places
this option in a fixed position throughout the site. Figure 7.2a presents an example of
the website before the proposed design solution has been applied to London Authority
1. Figure 7.2b shows how an online help option is positioned on the top right of the
page throughout London Authority 1. In this way, the online help function can be
easily detected and accessed by users at any time. The results of experiment 2 show
that the participants‟ perception of the online help function indication has improved in
the redesigned London Authority 1. Therefore, the usability problem of the online
help function not being clearly indicated on the site may be solved by the proposed
design solution.
Figure 7.2 Usability problem 2 in the London Authority 1 and the design solution in the redesigned London Authority 1
With regards to the usability problem of the difficult switch between online help and
current work, the results of the Paired-Samples T-test show that there is a significant
a
b
Online help
function is
presented
across the
pages

Usability and credibility evaluation of electronic governments: users‟ perspective Zhao Huang
Chapter 7 Experiment 2: improved usability and credibility assessment 164
difference in the participants‟ assessments between experiment 1 and experiment 2.
Table 7.10 presents the view of the participants on the difficulty of switching between
online help and current work in experiments 1 and 2. As shown in Table 7.10, very
few participants (16.7%) in experiment 1 think there is an ease of switching between
online help and their current work. However, the participants perceive it to be the
opposite case in experiment 2, where all participants (100%) find the switch between
online help and their current work easy to make on the redesigned London Authority
1 website.
Table 7.10 Users‟ perception of the switch between online help and their current work in experiment 1 and experiment 2
It is easy to switch between online-help and my current work.
Experiment 1 (N=12) Experiment 2 (N=12)
N % N %
Strongly disagree 1 8.3% 0 0%
Disagree 3 25% 0 0%
Neutral 6 50% 0 0%
Agree 2 16.7% 6 50%
Strongly agree 0 0% 6 50%
Significance T=-5.745, P=0.000
The results show that the difficulty of switching between online help and current work
is improved in experiment 2. As proposed, once users click on the online help option,
online help information is opened in a separate window on the redesigned London
Authority 1. Figure 7.3a shows that when users select the online help link, the current
work content is replaced by online help information. However, in Figure 7.3b, online
help information and users‟ current work are presented in the separate windows when
users choose the online help option, so that users can easily switch between them. In
this way, it can reduce users‟ memory load problems and support users‟ current work
page retrieval. According to the results, this implies that the usability problem of the
difficult switch between online help and current work has been improved by the
proposed design solution.

Usability and credibility evaluation of electronic governments: users‟ perspective Zhao Huang
Chapter 7 Experiment 2: improved usability and credibility assessment 165
Figure 7.3 Usability problem 3 in London Authority 1 and the design solution in the redesigned London Authority 1
Regarding the credibility problem that information is presented without consistent
colours, the results of the Paired-Sample T-test show that the participants‟
assessments of this in experiment 2 have a significant difference from their
assessments in experiment 1. Table 7.11 shows the view of the participants on colours
consistency in experiments 1 and 2. As shown in Table 7.11, very few participants
(16.7%) think that information is presented with consistent colours in experiment 1,
whereas over half of the participants (66.7%) in experiment 2 think information
presentation with consistent colours on the redesigned London Authority 1 website
(see Appendix 10a for the detailed Paired-Samples T-test results).
Table 7.11 Users‟ perception of colour consistency in experiment 1 and experiment 2
I can easily find relevant information because different colours are used consistently to present different kinds of information.
Experiment 1 (N=12) Experiment 2 (N=12)
N % N %
Strongly disagree 2 16.7% 0 0%
Disagree 3 25% 3 25%
Neutral 5 41.6% 1 8.3%
Agree 2 16.7% 3 25%
a
b

Usability and credibility evaluation of electronic governments: users‟ perspective Zhao Huang
Chapter 7 Experiment 2: improved usability and credibility assessment 166
Strongly agree 0 0% 5 41.7%
Significance T=-2.611, P=0.024
The results show that information presentation with colours consistency is improved
in experiment 2. As proposed, the design solution is to keep the consistent colour
scheme throughout the redesigned London Authority 1. As shown in Figure 7.4a,
generally, the options on the menu bar are presented in a white font with blue
background on the subpages of London Authority 1. However, on the subpage of the
council meeting, options, the menu bar are presented differently, with a white font and
yellow background (see Figure 7.4b). Figure 7.4c indicates the consistent colours
scheme that is used to present information on this subpage. According to the results, it
suggests that the credibility problem of information presentation without consistent
colours has been improved by the proposed design solution.
Figure 7.4 Credibility problem 1 in London Authority and the design solution in the redesigned London Authority 1
The redesigned London Authority 2
Table 7.12 presents all the proposed design solutions regarding the identified usability
and credibility problems for the redesigned London Authority 2. The following
a b
c
Inconsistent
colours scheme
Consistent
colours
scheme
Initial colours
scheme
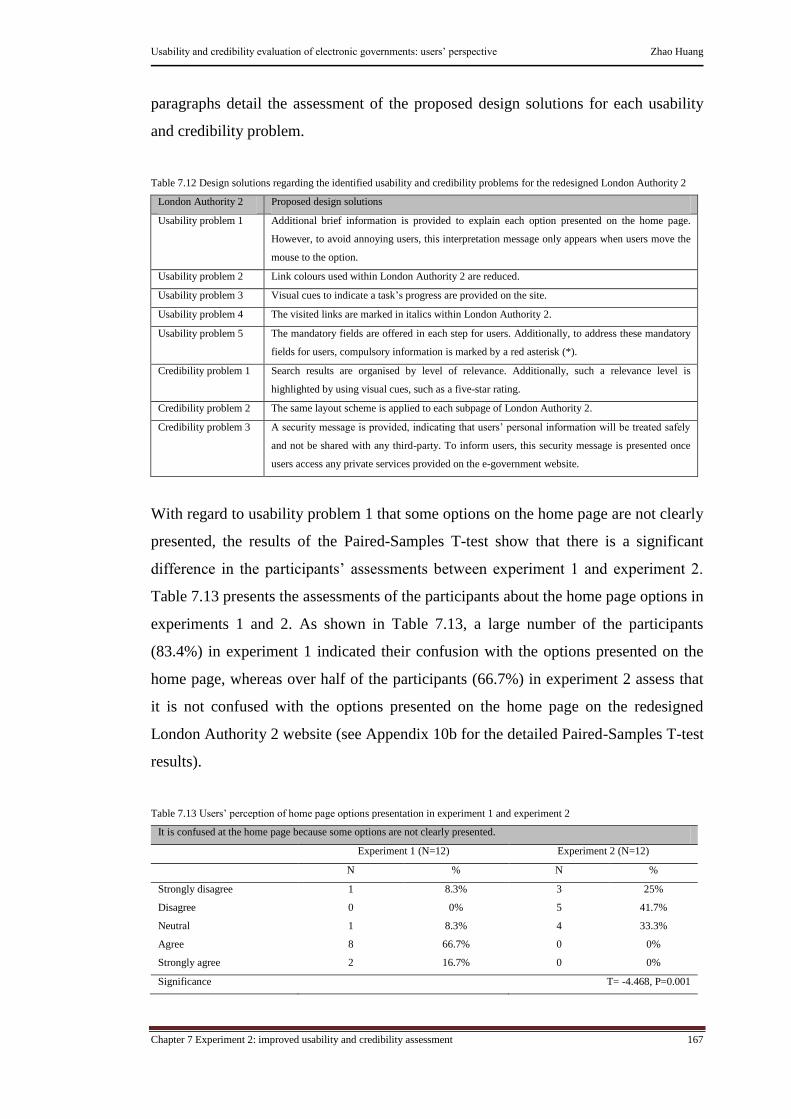
Usability and credibility evaluation of electronic governments: users‟ perspective Zhao Huang
Chapter 7 Experiment 2: improved usability and credibility assessment 167
paragraphs detail the assessment of the proposed design solutions for each usability
and credibility problem.
Table 7.12 Design solutions regarding the identified usability and credibility problems for the redesigned London Authority 2
London Authority 2 Proposed design solutions
Usability problem 1 Additional brief information is provided to explain each option presented on the home page.
However, to avoid annoying users, this interpretation message only appears when users move the
mouse to the option.
Usability problem 2 Link colours used within London Authority 2 are reduced.
Usability problem 3 Visual cues to indicate a task‟s progress are provided on the site.
Usability problem 4 The visited links are marked in italics within London Authority 2.
Usability problem 5 The mandatory fields are offered in each step for users. Additionally, to address these mandatory
fields for users, compulsory information is marked by a red asterisk (*).
Credibility problem 1 Search results are organised by level of relevance. Additionally, such a relevance level is
highlighted by using visual cues, such as a five-star rating.
Credibility problem 2 The same layout scheme is applied to each subpage of London Authority 2.
Credibility problem 3 A security message is provided, indicating that users‟ personal information will be treated safely
and not be shared with any third-party. To inform users, this security message is presented once
users access any private services provided on the e-government website.
With regard to usability problem 1 that some options on the home page are not clearly
presented, the results of the Paired-Samples T-test show that there is a significant
difference in the participants‟ assessments between experiment 1 and experiment 2.
Table 7.13 presents the assessments of the participants about the home page options in
experiments 1 and 2. As shown in Table 7.13, a large number of the participants
(83.4%) in experiment 1 indicated their confusion with the options presented on the
home page, whereas over half of the participants (66.7%) in experiment 2 assess that
it is not confused with the options presented on the home page on the redesigned
London Authority 2 website (see Appendix 10b for the detailed Paired-Samples T-test
results).
Table 7.13 Users‟ perception of home page options presentation in experiment 1 and experiment 2
It is confused at the home page because some options are not clearly presented.
Experiment 1 (N=12) Experiment 2 (N=12)
N % N %
Strongly disagree 1 8.3% 3 25%
Disagree 0 0% 5 41.7%
Neutral 1 8.3% 4 33.3%
Agree 8 66.7% 0 0%
Strongly agree 2 16.7% 0 0%
Significance T= -4.468, P=0.001

Usability and credibility evaluation of electronic governments: users‟ perspective Zhao Huang
Chapter 7 Experiment 2: improved usability and credibility assessment 168
The design solution that provides additional information to explain each option
presented on the home page has been implemented on the redesigned London
Authority 2. Figure 7.5a shows an example of some options that are not clearly
presented on the home page. However, Figure 7.5b presents an interpretation message
that is displayed to improve recognition when the mouse is moved to an option. It
gives the participants further information to increase their understanding of the option.
The results of experiment 2 indicate that confusion of options presentation is reduced
in the redesigned London Authority 2. Therefore, it appears that the proposed design
solution has improved the usability problem that some options are not clearly
presented on the home page.
Figure 7.5 Usability problem 1 in London Authority 2 and the design solution in the redesigned London Authority 2
Regarding the usability problem of confusion from links that have many different
colours, the results of the Paired-Samples T-test find that there is a significant
difference in the participants‟ assessments between experiment 1 and experiment 2.
Table 7.14 shows the view of the participants on link colours in experiments 1 and 2.
As shown in Table 7.14, over half of the participants (66.7%) find it confusing that
a
b
Interpretation
message

Usability and credibility evaluation of electronic governments: users‟ perspective Zhao Huang
Chapter 7 Experiment 2: improved usability and credibility assessment 169
links have many different colours in experiment 1, whereas the majority of
participants (83.4%) in experiment 2 find that they are not confused with link colours
on the redesigned London Authority 2 website.
Table 7.14 Users‟ perception of link colours in experiment 1 and experiment 2
I am confused with links that have many different colours.
Experiment 1 (N=12) Experiment 2 (N=12)
N % N %
Strongly disagree 0 0% 3 25%
Disagree 1 8.3% 7 58.4%
Neutral 3 25% 1 8.3%
Agree 6 50% 1 8.3%
Strongly agree 2 16.7% 0 0%
Significance T= -4.706, P=0.001
The results show that the participants‟ assessments of link colours are significantly
changed in experiment 2. The design solution of reducing link colours has been
applied to the redesigned London Authority 2. As shown in Figure 7.6a, originally,
some links on London Authority 2 are presented in light green, and some links are
displayed in dark green. However, as indicated in Figure 7.6b, the links displayed in
dark green have been changed to light green. This can reduce link colours distraction
when users search for information throughout the site. Based on the results in
experiment 2, this implies that the proposed design solution has improved the
usability problem of confusion with links having many different colours.

Usability and credibility evaluation of electronic governments: users‟ perspective Zhao Huang
Chapter 7 Experiment 2: improved usability and credibility assessment 170
Figure 7.6 Usability problem 2 in London Authority 2 and the design solution in the redesigned London Authority 2
In terms of the usability problem that the site sometimes does not indicate a task‟s
progress, the results of the Paired-Sample T-test show that the participants‟
assessments in experiment 2 have a significant difference compared to their
assessments in experiment 1. Table 7.15 presents the participants‟ perception about
task progress indication in experiments 1 and 2. As shown in Table 7.15, more than
half of the participants (58.4%) find a difficulty in seeing their task progress in
experiment 1. However, all participants (100%) in experiment 2 can clearly identify
task progress on the redesigned London Authority 2.
Table 7.15 Users‟ perception of task progress in experiment 1 and experiment 2
I can clearly see task process because task progress has been indicated.
Experiment 1 (N=12) Experiment 2 (N=12)
N % N %
Strongly disagree 2 16.7% 0 0%
Disagree 5 41.7% 0 0%
Neutral 4 33.3% 0 0%
Agree 1 8.3% 8 66.7%
Strongly agree 0 0% 4 33.3%
Significance T= -8.124, P=0.000
a
b
Link is displayed
in dark green
Link colour is
changed to light
green

Usability and credibility evaluation of electronic governments: users‟ perspective Zhao Huang
Chapter 7 Experiment 2: improved usability and credibility assessment 171
The results indicate that the participants‟ perception of the absence of task progress
indication is significantly improved in experiment 2. The design solution of providing
a task status bar has been implemented on the redesigned London Authority 2. This
can visually help the participants measure their task progress (Figure 7.7a presents an
example of the online service without the task progress indication. Figure 7.7b shows
task progress within the online service, as visually presented on the site). The findings
indicate that this proposed design solution is useful for solving the usability problem
of task progress not being indicated on the site.
Figure 7.7 Usability problem 3 in London Authority 2 and the design solution in the redesigned London Authority 2
In the usability problem of visited links not being clearly marked, the results of the
Paired-Samples T-test indicate that there is a significant difference in the participants‟
assessments between experiment 1 and experiment 2. Table 7.16 presents the view of
the participants on visited links recognition in experiments 1 and 2. As shown in
Table 7.16, only a small number of the participants (25%) can distinguish used and
unused links in experiment 1, whereas in experiment 2, about 83.4% of the
participants can recognise visited links on the redesigned London Authority 2 website.
Table 7.16 Users‟ perception of visited links recognition in experiment 1 and experiment 2
a
b Task progress
indicator

Usability and credibility evaluation of electronic governments: users‟ perspective Zhao Huang
Chapter 7 Experiment 2: improved usability and credibility assessment 172
It clearly indicates which choices/links are already used because visited links have been marked.
Experiment 1 (N=12) Experiment 2 (N=12)
N % N %
Strongly disagree 2 16.7% 0 0%
Disagree 6 50% 1 8.3%
Neutral 1 8.3% 1 8.3%
Agree 2 16.7% 8 66.7%
Strongly agree 1 8.3% 2 16.7%
Significance T= -6.189, P=0.000
In experiment 2, the proposed design solution of marking all visited links in italics has
been applied to the redesigned London Authority 2 website (Figure 7.8a shows that
the links already visited in London Authority 2 have not been clearly marked; Figure
7.8b indicates that the visited links on the site are clearly marked in italics). Such a
solution can increase visited links recognition. The results show that the participants‟
recognition of visited links is significantly improved in the redesigned London
Authority 2 website. Accordingly, it suggests that the proposed design solution has
improved the usability problem of visited links not being clearly marked on the site.
Figure 7.8 Usability problem 4 in London Authority 2 and the design solution in the redesigned London Authority 2
a
b
Visited links
are marked in
italics

Usability and credibility evaluation of electronic governments: users‟ perspective Zhao Huang
Chapter 7 Experiment 2: improved usability and credibility assessment 173
With respect to the usability problem that the site allows users to skip over the order
of the process, the results of the Paired-Samples T-test show that there is a significant
difference in the participants‟ assessments between experiment 1 and experiment 2.
Table 7.17 shows the view of the participants on jumping stages in the process in
experiments 1 and 2. As presented in Table 7.17, most participants (91.7%) in
experiment 2 think that it is not easy to skip over the order of the process, which is
much higher than the participants‟ assessment in experiment 1 (50%).
Table 7.17 Users‟ perception of jumping stages in the process in experiment 1 and experiment 2
It is easy to make errors in an action because the system allows me to skip over the order of the process.
Experiment 1 (N=12) Experiment 2 (N=12)
N % N %
Strongly disagree 0 0% 4 33.4%
Disagree 6 50% 7 58.3%
Neutral 4 33.3% 1 8.3%
Agree 2 16.7% 0 0%
Strongly agree 0 0% 0 0%
Significance T= 3.527, P=0.005
Such results indicate that the participants‟ assessments of skipping stages in the
process have been significantly changed in the redesigned London Authority 2. The
design solution is to design the mandatory fields in each step of a service process on
the redesigned London Authority 2 website, which forces users to follow the order of
the process (Figure 7.9a shows an example of London Authority 2 in which users can
skip over the order of the process. However, as indicated in Figure 7.9b, the
mandatory fields are clearly marked by red asterisks (*) and a warning message is
presented to remind users to complete necessary information in the mandatory fields).
Based on the results, it implies that the proposed design solution has improved the
usability problem of the site allowing users to skip over the order of the process.

Usability and credibility evaluation of electronic governments: users‟ perspective Zhao Huang
Chapter 7 Experiment 2: improved usability and credibility assessment 174
Figure 7.9 Usability problem 5 in London Authority 2 and the design solution in the redesigned London Authority 2
In terms of the credibility problem of search results not being organized by level of
relevance, the results of the Paired-Samples T-test show that there is a significant
difference in the participants‟ assessments between experiments 1 and 2. Table 7.18
presents the view of the participants on search results arrangement in experiments 1
and 2. As revealed in Table 7.18, the major participants (66.7%) in experiment 1
indicate that the search results are not organized by level of relevance, whereas all
participants (100%) in experiment 2 find that the search results are arranged by level
of relevance in the redesigned London Authority 2 (see Appendix 10b for the detailed
Paired-Samples T-test results).
Table 7.18 Users‟ perception of level of relevance arrangement of search results in experiment 1 and experiment 2
It is easy to choose a suitable option because the search results are organised by the level of relevance.
Experiment 1 (N=12) Experiment 2 (N=12)
N % N %
Strongly disagree 1 8.3% 0 0%
Disagree 3 25% 0 0%
Neutral 5 41.7% 0 0%
Agree 3 25% 5 41.7%
Strongly agree 0 0% 7 58.3%
a
b
Mandatory
fields
Warning message

Usability and credibility evaluation of electronic governments: users‟ perspective Zhao Huang
Chapter 7 Experiment 2: improved usability and credibility assessment 175
Significance T= -5.326, P= 0.000
Figure 7.10a shows an example of search results in London Authority 2 that are not
organised by the level of relevance. However, as presented in Figure 7.10b, search
results are arranged by level of relevance and visually indicated for users. This can
support the participants understanding of the overall arrangement of the search results
and so quickly identify target objects. The findings show that the participants‟
assessments of search results arrangement is enhanced in experiment 2. Thus, the
proposed design solution has improved the credibility problem of search results not
being organised by level of relevance.
Figure 7.10 Credibility problem 1 in London Authority 2 and the design solution in the redesigned London Authority 2
For the credibility problem of information presentation without a consistent layout,
the results of the Paired-Samples T-test reveal that there is a significant difference in
the participants‟ assessments between experiments 1 and 2. Table 7.19 presents the
a
b
Search results are
arranged by level of
relevance

Usability and credibility evaluation of electronic governments: users‟ perspective Zhao Huang
Chapter 7 Experiment 2: improved usability and credibility assessment 176
view of the participants on layout consistency in experiments 1 and 2. As shown in
Table 7.19, very few participants (8.3%) in experiment 1 think that information is
presented with a consistent layout, whereas a majority of the participants (83.3%) in
experiment 2 find information presentation with consistent layout in the redesigned
London Authority 2.
Table 7.19 Users‟ perception of layout consistency in experiment 1 and experiment 2
I can easily find information because the consistent layout is used to present information.
Experiment 1 (N=12) Experiment 2 (N=12)
N % N %
Strongly disagree 1 8.3% 0 0%
Disagree 4 33.4% 2 16.7%
Neutral 6 50% 0 0%
Agree 0 0% 4 33.3%
Strongly agree 1 8.3% 6 50%
Significance T= -4.180, P=0.002
The results show that the participants‟ assessments of layout consistency are enhanced
in experiment 2. As proposed, the design solution that uses the consistent layout
pattern has been applied to the redesigned London Authority 2. As shown in Figure
7.11a, generally, the main content is displayed in the central location of a page with
the hierarchal menu bar on the left side and related information on the right side.
However, on the subpage of planning decision notices, information is presented
without consistent layout (Figure 7.11b). Figure 7.11c indicates that the consistent
layout pattern is used on this subpage, which may help users to understand that
information provided is organised and presented in the same way throughout the site.
Based on the findings, the credibility problem of information presentation without
consistent layout has been significantly improved by the proposed design solution.
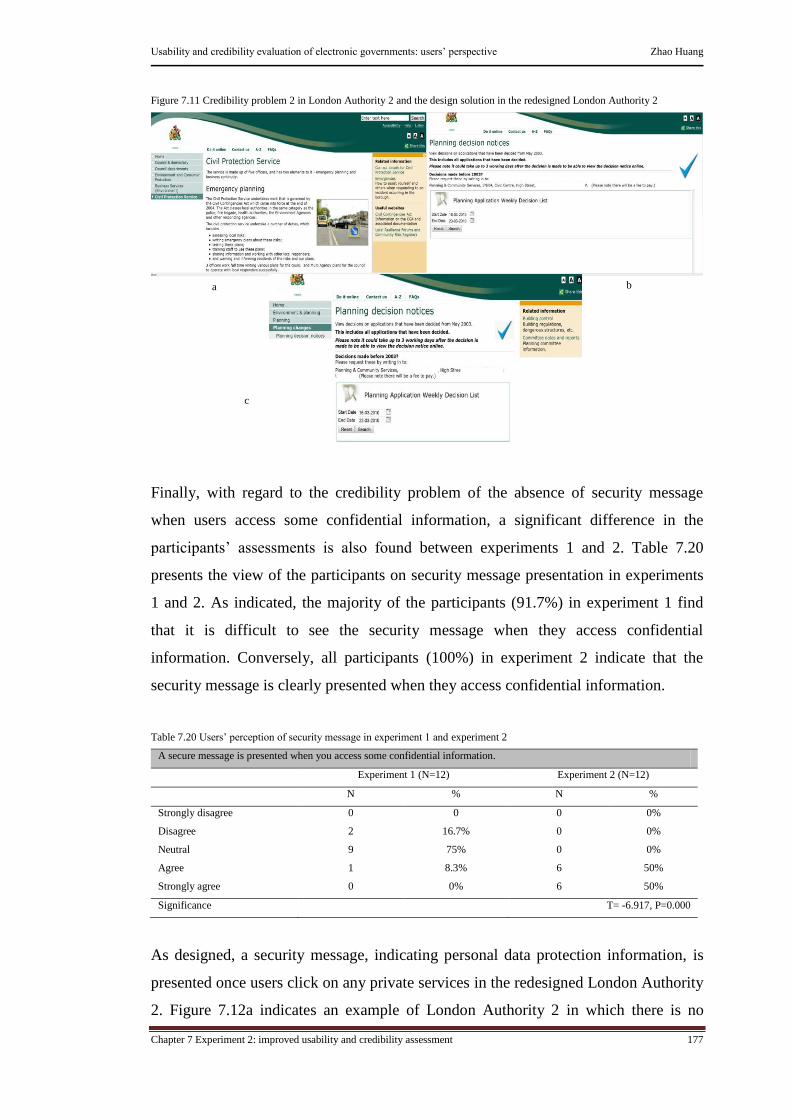
Usability and credibility evaluation of electronic governments: users‟ perspective Zhao Huang
Chapter 7 Experiment 2: improved usability and credibility assessment 177
Figure 7.11 Credibility problem 2 in London Authority 2 and the design solution in the redesigned London Authority 2
Finally, with regard to the credibility problem of the absence of security message
when users access some confidential information, a significant difference in the
participants‟ assessments is also found between experiments 1 and 2. Table 7.20
presents the view of the participants on security message presentation in experiments
1 and 2. As indicated, the majority of the participants (91.7%) in experiment 1 find
that it is difficult to see the security message when they access confidential
information. Conversely, all participants (100%) in experiment 2 indicate that the
security message is clearly presented when they access confidential information.
Table 7.20 Users‟ perception of security message in experiment 1 and experiment 2
A secure message is presented when you access some confidential information.
Experiment 1 (N=12) Experiment 2 (N=12)
N % N %
Strongly disagree 0 0 0 0%
Disagree 2 16.7% 0 0%
Neutral 9 75% 0 0%
Agree 1 8.3% 6 50%
Strongly agree 0 0% 6 50%
Significance T= -6.917, P=0.000
As designed, a security message, indicating personal data protection information, is
presented once users click on any private services in the redesigned London Authority
2. Figure 7.12a indicates an example of London Authority 2 in which there is no
a b
c

Usability and credibility evaluation of electronic governments: users‟ perspective Zhao Huang
Chapter 7 Experiment 2: improved usability and credibility assessment 178
security message when users access an online report service. However, as presented in
Figure 7.12b, a clear security message about data protection is presented when users
click on the online report service in the redesigned London Authority 2. The results
show that the participants‟ assessments of the security message presentation are
significantly improved in the redesigned London Authority 2. Accordingly, this
suggests that the proposed design solution has improved the credibility problem of the
absence of security message when users access confidential information.
Figure 7.12 Credibility problem 3 in London Authority 2 and the design solution in the redesigned London Authority 2
The redesigned London Authority 3
Table 7.21 shows all the proposed design solutions regarding the identified usability
and credibility problems for the redesigned London Authority 3. The results of the
proposed design solutions for each identified usability and credibility problem are
indicated in the following sub-sections.
Table 7.21 Design solutions regarding the identified usability and credibility problems for the redesigned London Authority 3
London Authority 3 Proposed design solutions
Usability problem 1 Link colours used in London Authority 3 are reduced.
Usability problem 2 Subject categories are arranged in an alphabetical order on each page.
a
b Security message
presentation

Usability and credibility evaluation of electronic governments: users‟ perspective Zhao Huang
Chapter 7 Experiment 2: improved usability and credibility assessment 179
Usability problem 3 The visited links are marked in italics.
Usability problem 4 Drop-down menu for the subject category is designed, which visually hides its sub options. When
users move the mouse to the subject category, a type of stretch sub list is used to present the
various sub options associated with this subject category.
Credibility problem 1 The contact details are designed into two levels. In the first level, it provides general contact
information with an associated link to the detailed level of contact information. In the second
level, the detailed contact information will be organised by the different departments of the
council.
Credibility problem 2 Awards, such as web and Internet standard awards; best council awards, etc., won by London
Authority 3 are presented on the web pages.
Credibility problem 3 A shortcut option is designed on every page within the site, linking the information about the
local council. In addition, in order to make such information to be easily found, this shortcut
option is consistently located at a fixed place within the site.
Credibility problem 4 A security message is provided, indicating that users‟ personal information will be treated safely
and not be shared with any third-parties. Furthermore, in order to inform users in time, such
security message is presented once users click any private services provided by the e-government
website.
Credibility problem 5 Visual cues are provided, which indicate the total steps of the task and highlight the current stage
that users are engaged in.
Credibility problem 6 A recently updated date is presented on every page.
Credibility problem 7 A sign-in/register option is provided within the site. More specifically, when users access some
personal services, the site requires users to sign in or register the service in the first place. After
logging into the site, it enables users to continue their tasks.
With respect to usability problem 1 that users are confused by links that have many
different colours, the results of the Paired-Samples T-test reveal that there is a
significant difference in the participants‟ assessments between experiment 1 and
experiment 2. Table 7.22 presents the view of the participants on link colours in
experiments 1 and 2. As shown in Table 7.22, half of the participants (50%) feel
confusion about links that have many different colours in experiment 1, whereas all
participants (100%) in experiment 2 have a negative opinion that it is not confused by
links having many colours in the redesigned London Authority 3 website (see
Appendix 10c for the detailed Paired-Samples T-test results).
Table 7.22 Users‟ perception of link colours in experiment 1 and experiment 2
I am confused with links that have many different colours.
Experiment 1 (N=12) Experiment 2 (N=12)
N % N %
Strongly disagree 0 0% 4 33.3%
Disagree 1 8.3% 8 66.7%
Neutral 5 41.7% 0 0%
Agree 6 50% 0 0%
Strongly agree 0 0% 0 0%
Significance T= -8.042, P=0.000

Usability and credibility evaluation of electronic governments: users‟ perspective Zhao Huang
Chapter 7 Experiment 2: improved usability and credibility assessment 180
As proposed, to decrease link colours distraction when users interact with the site, the
design solution is to reduce link colours in the redesigned London Authority 3 website.
Figure 7.13a presents an example of links that have many different colours in London
Authority 3. However, Figure 6.13b shows that some link colours are reduced in the
redesigned London Authority 3 website. The results indicate that the participants‟
assessments of link colours confusion are significantly changed after the design
solution has been applied to the redesigned London Authority 3. Therefore, this
implies that the usability problem of users‟ confusion by links having many different
colours has been improved by the proposed design solution.
Figure 7.13 Usability problem 1 in London Authority 3 and the design solution in the redesigned London Authority 3
In the usability problem of the subject categories not being presented in a logical
order, the results of the Paired-Samples T-test show that there is a significant
difference in the participants‟ assessments between experiment 1 and experiment 2.
Table 7.23 shows the view of the participants on the subject categories arrangement in
experiments 1 and 2. As shown in Table 7.23, half of the participants (50%) in
a
b
Link colours
are reduced

Usability and credibility evaluation of electronic governments: users‟ perspective Zhao Huang
Chapter 7 Experiment 2: improved usability and credibility assessment 181
experiment 1 find difficulty in choosing an option due to the options being arranged
without a logical order. However, a majority of the participants (91.7%) in experiment
2 assess it differently, indicating that it is not hard to choose an option because the
options are now arranged in a logical order in the redesigned London Authority 3
website.
Table 7.23 Users‟ perception of the order of categories arrangement in experiment 1 and experiment 2
It is difficult to choose the option in subcategories because no logical order of sub options is used in subcategories.
Experiment 1 (N=12) Experiment 2 (N=12)
N % N %
Strongly disagree 1 8.3% 3 25%
Disagree 2 16.7% 8 66.7%
Neutral 3 25% 1 8.3%
Agree 6 50% 0 0%
Strongly agree 0 0% 0 0%
Significance T= -4.000, P=0.002
As proposed, the design solution is to organise and present the subject categories in an
alphabetical order throughout the redesigned London Authority 3. Figure 7.14a shows
that initially, the subject categories are randomly presented on London Authority 3.
However, Figure 7.14b indicates an example of the subject categories that are
organised and presented in an alphabetical order. This helps users understand the
overall options arrangement and quickly locate the target subject. The results reveal
that the participants‟ assessments of categories arranged without a logical order are
significantly enhanced in experiment 2. Accordingly, it suggests that the proposed
design solution has improved the usability problem of subject categories being
presented without any logical order.

Usability and credibility evaluation of electronic governments: users‟ perspective Zhao Huang
Chapter 7 Experiment 2: improved usability and credibility assessment 182
Figure 7.14 Usability problem 2 in London Authority 3 and the design solution in the redesigned London Authority 3
In the usability problem of visited links not being clearly marked, the results of the
Paired-Samples T-test reveal that there is not a significant difference in the
participants‟ assessments between experiments 1 and 2. Table 7.24 presents the view
of the participants on visited links in experiments 1 and 2. As shown in Table 7.24,
only a few participants (16.6%) can recognise visited links in experiment 1, whereas
over half of the participants (66.7%) in experiment 2 can clearly see visited links in
the redesigned London Authority 3.
Table 7.24 Users‟ perception of visited links in experiment 1 and experiment 2
It clearly indicates which choices/links are already visited because they have been marked.
Experiment 1 (N=12) Experiment 2 (N=12)
N % N %
Strongly disagree 0 0% 1 8.3%
Disagree 5 41.7% 1 8.3%
Neutral 5 41.7% 2 16.7%
Agree 0 0% 6 50%
Strongly agree 2 16.6% 2 16.7%
Significance T= -1.685, P=0.120
To support visited links identification, the design solution that marks visited links in
italics has been applied to the redesigned London Authority 3. As shown in Figure
a
b
Subject categories
are organised and
presented in an
alphabetical order

Usability and credibility evaluation of electronic governments: users‟ perspective Zhao Huang
Chapter 7 Experiment 2: improved usability and credibility assessment 183
7.15a, initially, the visited links in London Authority 3 have not been clearly marked.
However, Figure 7.15b shows that the visited links are clearly marked in italics on the
site. Although a significant difference in the participants‟ assessments is not
statistically found between experiments 1 and 2, the results still show that the
usability problem of visited links not being clearly marked has been influenced by the
proposed design solution.
Figure 7.15 Usability problem 3 in London Authority 3 and the design solution in the redesigned London Authority 3
With regard to the usability problem of being given too many choices over sequences,
the results of the Paired-Samples T-test find that there is not a significant difference in
the participants‟ assessments between experiment 1 and experiment 2. Table 7.25
shows the view of the participants on the number of choices over sequences in
experiments 1 and 2. As shown in Table 7.25, more than half of the participants
(58.4%) in experiment 1 have a neutral opinion of being given too many choices over
sequences. In contrast, the majority of the participants (66.6%) in experiment 2
present a negative opinion of being given too many choices throughout the redesigned
London Authority 3 website.
a
b
Visited links
are marked in
italics
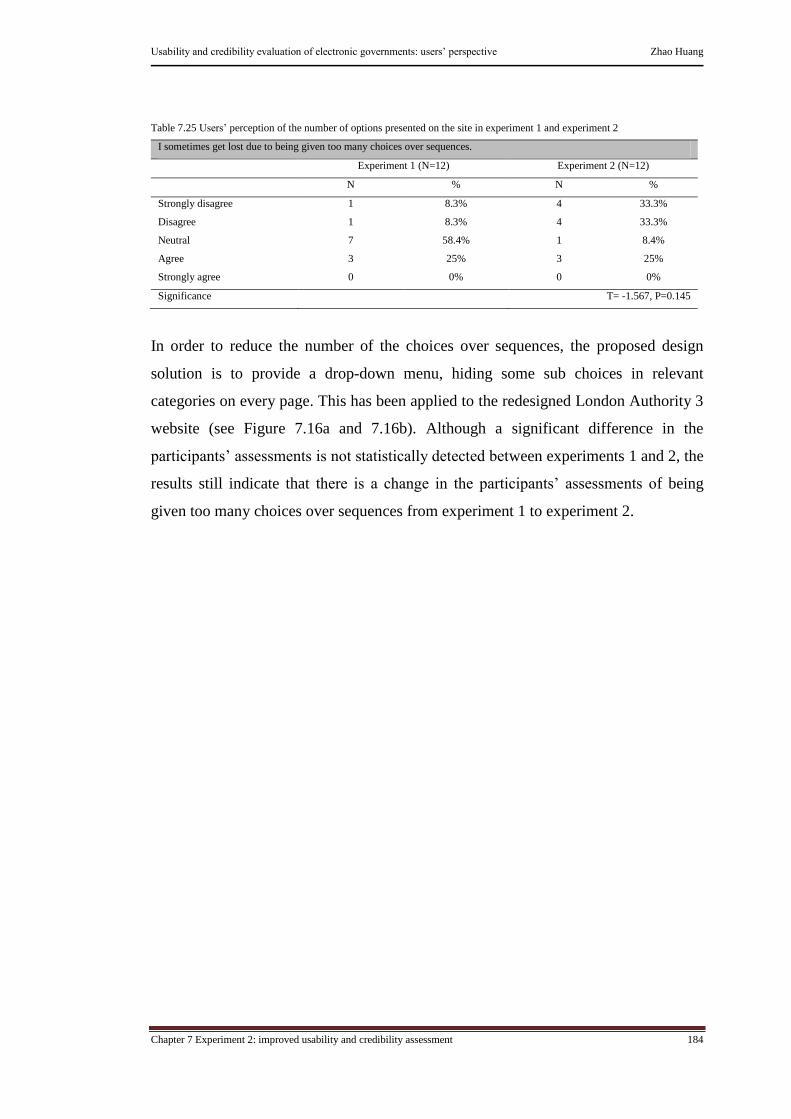
Usability and credibility evaluation of electronic governments: users‟ perspective Zhao Huang
Chapter 7 Experiment 2: improved usability and credibility assessment 184
Table 7.25 Users‟ perception of the number of options presented on the site in experiment 1 and experiment 2
I sometimes get lost due to being given too many choices over sequences.
Experiment 1 (N=12) Experiment 2 (N=12)
N % N %
Strongly disagree 1 8.3% 4 33.3%
Disagree 1 8.3% 4 33.3%
Neutral 7 58.4% 1 8.4%
Agree 3 25% 3 25%
Strongly agree 0 0% 0 0%
Significance T= -1.567, P=0.145
In order to reduce the number of the choices over sequences, the proposed design
solution is to provide a drop-down menu, hiding some sub choices in relevant
categories on every page. This has been applied to the redesigned London Authority 3
website (see Figure 7.16a and 7.16b). Although a significant difference in the
participants‟ assessments is not statistically detected between experiments 1 and 2, the
results still indicate that there is a change in the participants‟ assessments of being
given too many choices over sequences from experiment 1 to experiment 2.
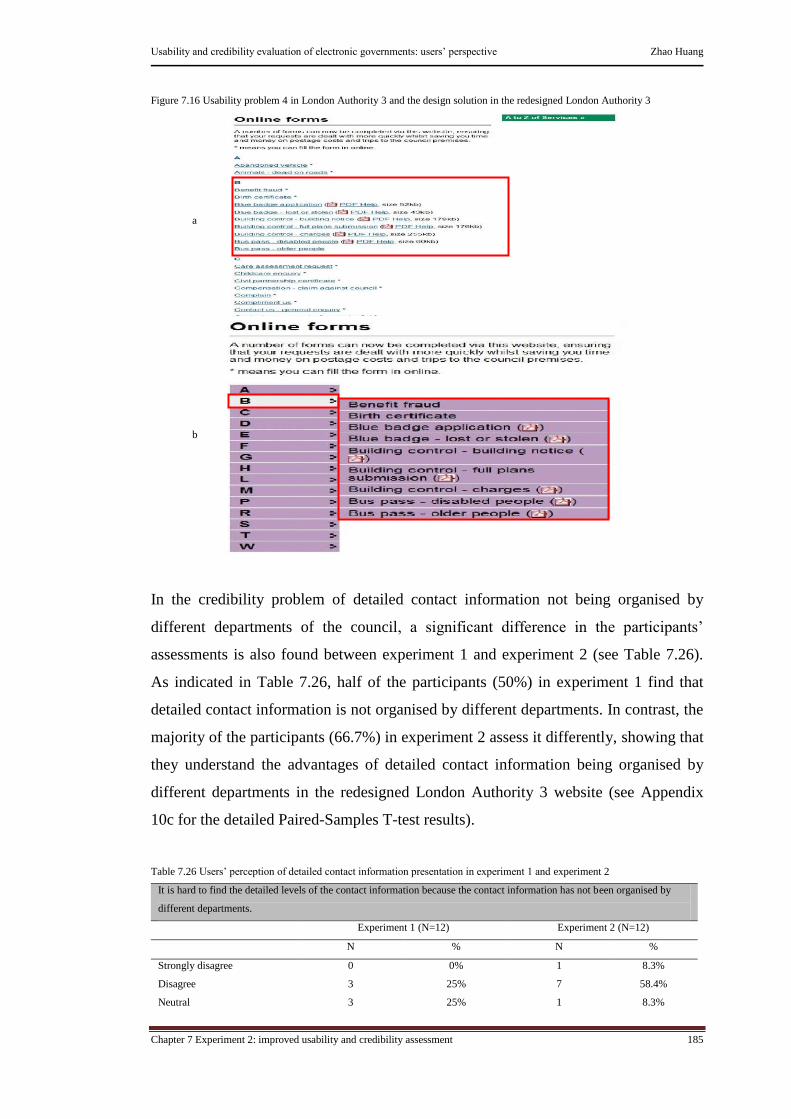
Usability and credibility evaluation of electronic governments: users‟ perspective Zhao Huang
Chapter 7 Experiment 2: improved usability and credibility assessment 185
Figure 7.16 Usability problem 4 in London Authority 3 and the design solution in the redesigned London Authority 3
In the credibility problem of detailed contact information not being organised by
different departments of the council, a significant difference in the participants‟
assessments is also found between experiment 1 and experiment 2 (see Table 7.26).
As indicated in Table 7.26, half of the participants (50%) in experiment 1 find that
detailed contact information is not organised by different departments. In contrast, the
majority of the participants (66.7%) in experiment 2 assess it differently, showing that
they understand the advantages of detailed contact information being organised by
different departments in the redesigned London Authority 3 website (see Appendix
10c for the detailed Paired-Samples T-test results).
Table 7.26 Users‟ perception of detailed contact information presentation in experiment 1 and experiment 2
It is hard to find the detailed levels of the contact information because the contact information has not been organised by
different departments.
Experiment 1 (N=12) Experiment 2 (N=12)
N % N %
Strongly disagree 0 0% 1 8.3%
Disagree 3 25% 7 58.4%
Neutral 3 25% 1 8.3%
a
b

Usability and credibility evaluation of electronic governments: users‟ perspective Zhao Huang
Chapter 7 Experiment 2: improved usability and credibility assessment 186
Agree 6 50% 3 25%
Strongly agree 0 0% 0 0%
Significance T= -2.691, P=0.021
As suggested, to support contact information seeking, the design solution is to provide
contact detail with two levels of information in the redesigned London Authority 3
website. The first level contains general contact information with an associated link to
the detailed level. The second level presents the detailed contact arranged by different
departments of the council (Figure 7.17a shows the contact information that is not
organised by departments. Figure 7.17b presents an example of the design solution).
The results reveal that the participants‟ assessments in relation to detailed contact
arrangement are significantly changed in the redesigned London Authority 3 website.
In other words, this suggests that the credibility problem of detailed contact
information not being organised by different departments has been improved by the
proposed design solution.
Figure 7.17 Credibility problem 1 in London Authority 3 and the design solution in the redesigned London Authority 3
Furthermore, regarding the credibility problem of the site‟s credentials not being
clearly presented, the results of the Paired-Samples T-test indicate that there is a
a
b
A link to detailed
level of contact
information
Detailed
contact is
organised by
different
departments

Usability and credibility evaluation of electronic governments: users‟ perspective Zhao Huang
Chapter 7 Experiment 2: improved usability and credibility assessment 187
significant difference in the participants‟ assessments between experiments 1 and 2.
Table 7.27 reflects the participants‟ views on the site‟s credentials presentation in
experiments 1 and 2. As shown in Table 7.27, a number of the participants (41.7%) in
experiment 1 feel that it is difficult to see the site‟s credentials (see Figure 7.18a). In
contrast, the participants‟ perception is significantly changed in experiment 2, in
which all participants (100%) can find the site‟s credentials in the redesigned London
Authority 3 website (see Figure 7.18b).
Table 7.27 Users‟ perception of the site‟s credentials in experiment 1 and experiment 2
It is clear to see the site credentials because the system displays awards it has earned.
Experiment 1 (N=12) Experiment 2 (N=12)
N % N %
Strongly disagree 0 0% 0 0%
Disagree 5 41.7% 0 0%
Neutral 5 41.7% 0 0%
Agree 2 16.6% 9 75%
Strongly agree 0 0% 3 25%
Significance T= -6.514, P=0.000
To indicate the site‟s credentials, the proposed design solution is that any awards,
such as web and Internet standard awards and best council awards won by the
organisation are clearly shown in the redesigned London Authority 3 website in
experiment 2. The results show that the participants‟ assessments of the site‟s
credentials are significantly changed in the redesigned London Authority 3. Therefore,
this suggests that the credibility problem of the site credentials not being clearly
presented has been improved by the proposed design solution.

Usability and credibility evaluation of electronic governments: users‟ perspective Zhao Huang
Chapter 7 Experiment 2: improved usability and credibility assessment 188
Figure 7.18 Credibility problem 2 in London Authority 3 and the design solution in the redesigned London Authority 3
In the credibility problem of the absence of the quick access to the local council
information, the results of the Paired-Samples T-test indicate that there is a significant
difference in the participants‟ assessments between experiments 1 and 2. Table 7.28
presents the view of the participants on the quick access to the local council
information in experiments 1 and 2. As shown in Table 7.28, a large number of the
participants (58.3%) in experiment 1 find a difficulty in locating the local council
information (see Figure 7.19a). However, all participants (100%) in experiment 2 can
easily find information about the local council on the redesigned London Authority 3
website.
Table 7.28 Users‟ perception of quick access to council information in experiment 1 and experiment 2
It is difficult to see the information about the local council because the site does not provide a shortcut option.
Experiment 1 (N=12) Experiment 2 (N=12)
N % N %
Strongly disagree 2 16.7% 6 50%
Disagree 0 0% 6 50%
Neutral 3 25% 0 0%
Agree 7 58.3% 0 0%
Strongly agree 0 0% 0 0%
Significance T= -4.214, P=0.001
a
b
Site‟s
credentials
presentation
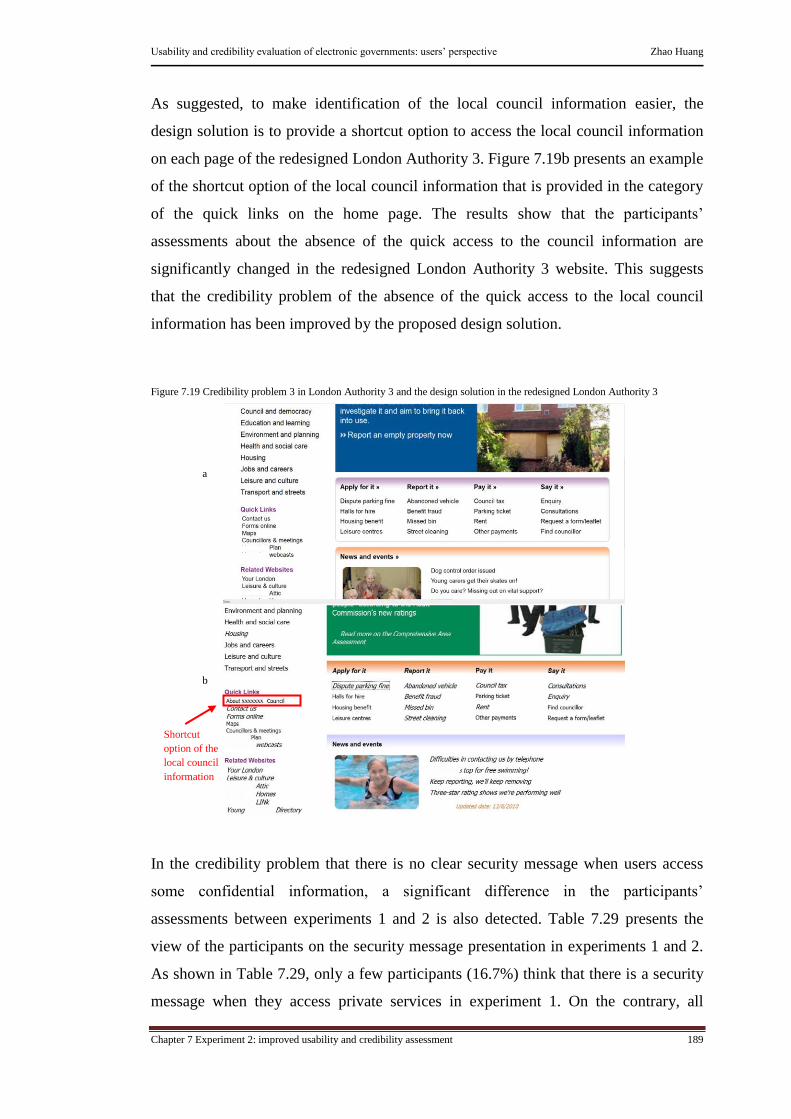
Usability and credibility evaluation of electronic governments: users‟ perspective Zhao Huang
Chapter 7 Experiment 2: improved usability and credibility assessment 189
As suggested, to make identification of the local council information easier, the
design solution is to provide a shortcut option to access the local council information
on each page of the redesigned London Authority 3. Figure 7.19b presents an example
of the shortcut option of the local council information that is provided in the category
of the quick links on the home page. The results show that the participants‟
assessments about the absence of the quick access to the council information are
significantly changed in the redesigned London Authority 3 website. This suggests
that the credibility problem of the absence of the quick access to the local council
information has been improved by the proposed design solution.
Figure 7.19 Credibility problem 3 in London Authority 3 and the design solution in the redesigned London Authority 3
In the credibility problem that there is no clear security message when users access
some confidential information, a significant difference in the participants‟
assessments between experiments 1 and 2 is also detected. Table 7.29 presents the
view of the participants on the security message presentation in experiments 1 and 2.
As shown in Table 7.29, only a few participants (16.7%) think that there is a security
message when they access private services in experiment 1. On the contrary, all
a
b
Shortcut
option of the
local council
information
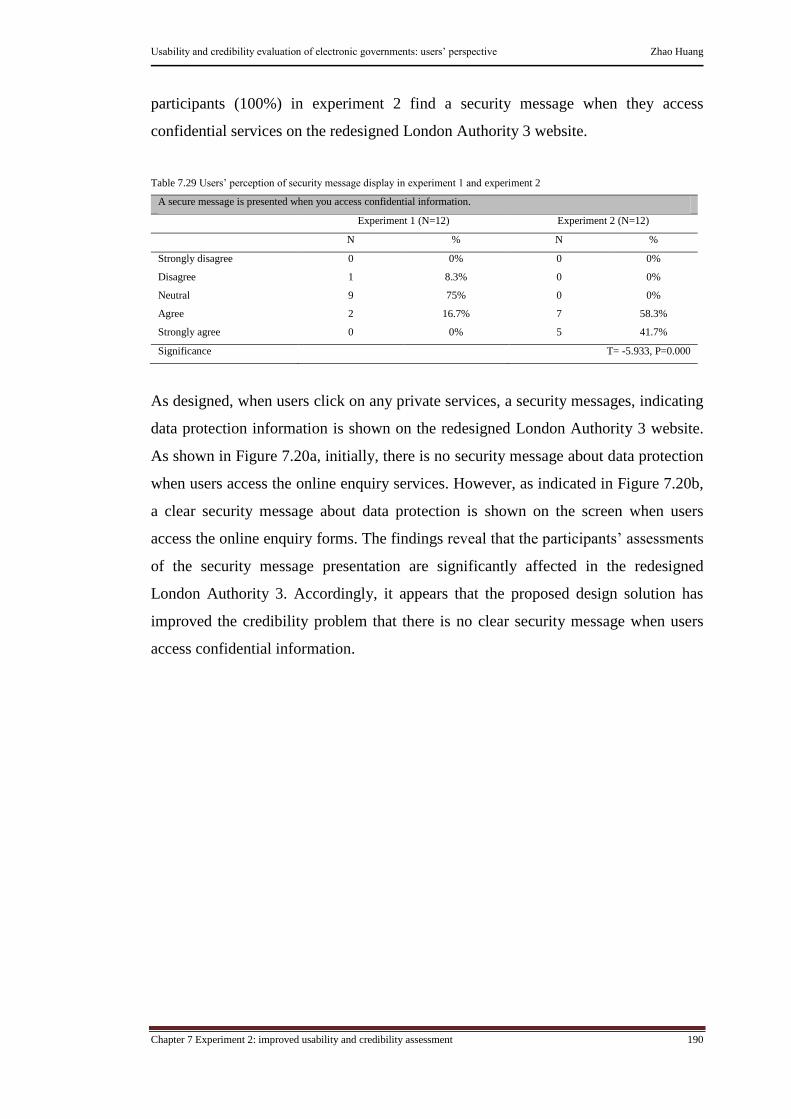
Usability and credibility evaluation of electronic governments: users‟ perspective Zhao Huang
Chapter 7 Experiment 2: improved usability and credibility assessment 190
participants (100%) in experiment 2 find a security message when they access
confidential services on the redesigned London Authority 3 website.
Table 7.29 Users‟ perception of security message display in experiment 1 and experiment 2
A secure message is presented when you access confidential information.
Experiment 1 (N=12) Experiment 2 (N=12)
N % N %
Strongly disagree 0 0% 0 0%
Disagree 1 8.3% 0 0%
Neutral 9 75% 0 0%
Agree 2 16.7% 7 58.3%
Strongly agree 0 0% 5 41.7%
Significance T= -5.933, P=0.000
As designed, when users click on any private services, a security messages, indicating
data protection information is shown on the redesigned London Authority 3 website.
As shown in Figure 7.20a, initially, there is no security message about data protection
when users access the online enquiry services. However, as indicated in Figure 7.20b,
a clear security message about data protection is shown on the screen when users
access the online enquiry forms. The findings reveal that the participants‟ assessments
of the security message presentation are significantly affected in the redesigned
London Authority 3. Accordingly, it appears that the proposed design solution has
improved the credibility problem that there is no clear security message when users
access confidential information.
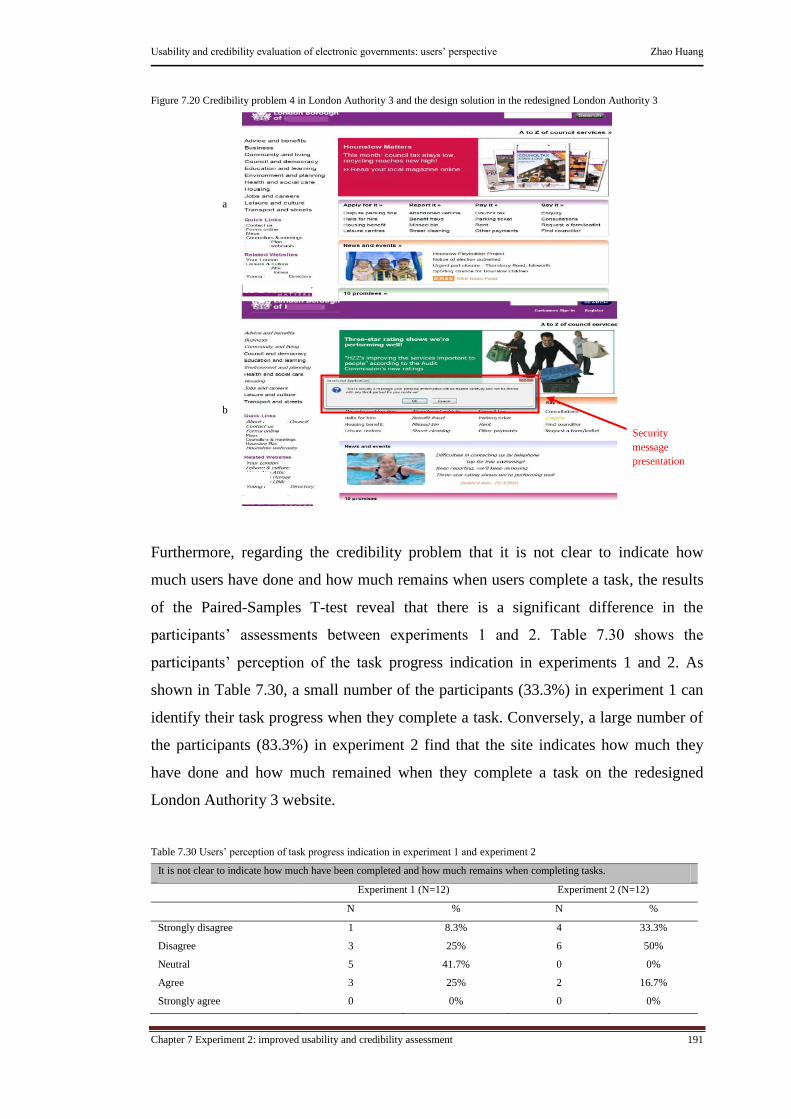
Usability and credibility evaluation of electronic governments: users‟ perspective Zhao Huang
Chapter 7 Experiment 2: improved usability and credibility assessment 191
Figure 7.20 Credibility problem 4 in London Authority 3 and the design solution in the redesigned London Authority 3
Furthermore, regarding the credibility problem that it is not clear to indicate how
much users have done and how much remains when users complete a task, the results
of the Paired-Samples T-test reveal that there is a significant difference in the
participants‟ assessments between experiments 1 and 2. Table 7.30 shows the
participants‟ perception of the task progress indication in experiments 1 and 2. As
shown in Table 7.30, a small number of the participants (33.3%) in experiment 1 can
identify their task progress when they complete a task. Conversely, a large number of
the participants (83.3%) in experiment 2 find that the site indicates how much they
have done and how much remained when they complete a task on the redesigned
London Authority 3 website.
Table 7.30 Users‟ perception of task progress indication in experiment 1 and experiment 2
It is not clear to indicate how much have been completed and how much remains when completing tasks.
Experiment 1 (N=12) Experiment 2 (N=12)
N % N %
Strongly disagree 1 8.3% 4 33.3%
Disagree 3 25% 6 50%
Neutral 5 41.7% 0 0%
Agree 3 25% 2 16.7%
Strongly agree 0 0% 0 0%
a
b
Security
message
presentation

Usability and credibility evaluation of electronic governments: users‟ perspective Zhao Huang
Chapter 7 Experiment 2: improved usability and credibility assessment 192
Significance T= -2.419, P=0.034
As proposed, the design solution is to provide visual cues that indicate the total steps
of the task and highlight the current stage that users are engaged in. As shown in
Figure 7.21a, initially, it is not clear how much users have done and how much was
left when they complete an online enquiry form. However, as presented in Figure
7.21b, task progress is visually indicated in the online enquiry form. The results show
that the participants‟ assessments of task progress indication are significantly
increased on the redesigned London Authority 3 website. Therefore, the proposed
design solution has improved the credibility problem of task progress not being
clearly indicated when completing tasks.
Figure 7.21 Credibility problem 5 in London Authority 3 and the design solution in the redesigned London Authority 3
With regard to the credibility problem of information about the site update not being
clearly presented, a significant difference in the participants‟ assessments between
experiment 1 and experiment 2 is also indicated. Table 7.31 shows the views of the
participants on the site update in experiments 1 and 2. As presented in Table 7.31, few
participants (25%) in experiment 1 can identify how current the information presented
a
b
Task progress
indicator

Usability and credibility evaluation of electronic governments: users‟ perspective Zhao Huang
Chapter 7 Experiment 2: improved usability and credibility assessment 193
on the site is, whereas all participants (100%) in experiment 2 can easily find the
update information on the redesigned London Authority 3 website.
Table 7.31 Users‟ perception of site update in experiment 1 and experiment 2
It is clear to identify how current the information presented in the site is, because the update date is presented.
Experiment 1 (N=12) Experiment 2 (N=12)
N % N %
Strongly disagree 0 0% 0 0%
Disagree 3 25% 0 0%
Neutral 6 50% 0 0%
Agree 1 8.3% 6 50%
Strongly agree 2 16.7% 6 50%
Significance T= -3.546, P=0.005
As proposed, the design solution of indicating the update date has been implemented
on each page of the redesigned London Authority 3. As shown in Figure 7.22a,
initially, the site update is not clearly presented on London Authority 3. Whereas,
Figure 7.22b reveals that the site update date is presented at the top of the page within
the redesigned London Authority 3. The results show that participants‟ assessments of
site update are significantly improved in experiment 2. Accordingly, this suggests that
the proposed design solution improves the credibility problem of the information
about the site update not being clearly presented.

Usability and credibility evaluation of electronic governments: users‟ perspective Zhao Huang
Chapter 7 Experiment 2: improved usability and credibility assessment 194
Figure 7.22 Credibility problem 6 in London Authority 3 and the design solution in the redesigned London Authority 3
Finally, with regard to the credibility problem of lack of a sign-in option when users
access some personal services, a significant difference in the participants‟ assessments
between experiments 1 and 2 is also found. Table 7.32 shows the participants‟
perception of sign-in options in experiments 1 and 2. As shown in Table 7.32, a small
number of the participants (33.3%) in experiment 1 think that there is a sign-in option
when they conduct some personal services. However, the participants assess it
differently in experiment 2, in which all participants (100%) can find the sign-in
option when they conduct their personal services on the redesigned London Authority
3 website.
Table 7.32 Users‟ perception of a sign-in option in experiment 1 and experiment 2
It is hard to see a sign-in option when accessing some personal services.
Experiment 1 (N=12) Experiment 2 (N=12)
N % N %
Strongly disagree 1 8.3% 3 25%
Disagree 3 25% 9 75%
Neutral 5 41.7% 0 0%
Agree 3 25% 0 0%
Strongly agree 0 0% 0 0%
Significance T= -3.223, P=0.008
a
b
A recently
updated
date
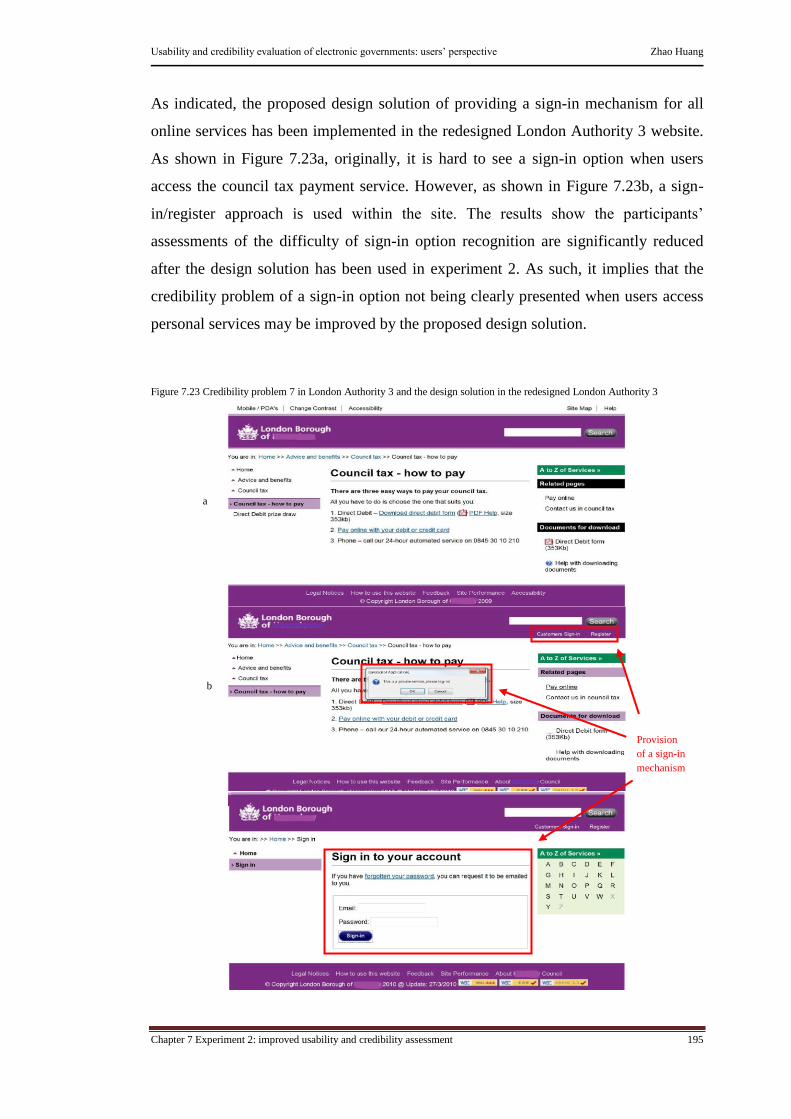
Usability and credibility evaluation of electronic governments: users‟ perspective Zhao Huang
Chapter 7 Experiment 2: improved usability and credibility assessment 195
As indicated, the proposed design solution of providing a sign-in mechanism for all
online services has been implemented in the redesigned London Authority 3 website.
As shown in Figure 7.23a, originally, it is hard to see a sign-in option when users
access the council tax payment service. However, as shown in Figure 7.23b, a sign-
in/register approach is used within the site. The results show the participants‟
assessments of the difficulty of sign-in option recognition are significantly reduced
after the design solution has been used in experiment 2. As such, it implies that the
credibility problem of a sign-in option not being clearly presented when users access
personal services may be improved by the proposed design solution.
Figure 7.23 Credibility problem 7 in London Authority 3 and the design solution in the redesigned London Authority 3
a
b
Provision
of a sign-in
mechanism
Usability and credibility evaluation of electronic governments: users‟ perspective Zhao Huang
Chapter 7 Experiment 2: improved usability and credibility assessment 196
7.3.2 Users’ perception: qualitative data
In order to gain an insight into the participants‟ perception of the proposed design
solutions for the redesigned London Authorities, qualitative data is also collected
through the open-ended questions to support the questionnaire results. In the open-
ended questions, the participants are encouraged to develop their thoughts in-depth
and indicate their further comments on the proposed design solutions. Such comments
are summarized in the positive and negative categories. This section reports the
findings of the frequently recorded comments regarding the proposed design solutions
for each redesigned London Authority.
The redesigned London Authority 1
To indicate the participants‟ further thoughts on the proposed design solutions for the
redesigned London Authority 1, the frequently recorded positive and negative
comments are summarized in Table 7.33. In terms of the positive comments, a
number of the participants address the usability feature of link colours. As proposed
(see section 6.2), regarding the usability problem of links having many different
colours, the design solution is to reduce link colours on the site. In this way, users
may feel comfortable with links interaction and quickly locate information without
colours distraction. The following quotes indicate the views of the participants:
“The website is easy to use, and the links colours are very nice, which is useful for me to
search for the information.”
“The colours were used in a good way to identify where the link is.”
“There is the limited links colours used, which is helpful for my information seeking.”
“I like that the links do not have too many colours, so that I feel the whole website is in the
same colour scheme.”
In addition, some participants positively comment on the credibility feature of colour
consistency. As found, with respect to the credibility problem of information
presentation without consistent colours, the design solution is to keep the same colour
scheme to present information throughout the redesigned London Authority 1. It can
build unity across the pages, which help users understand that information provided is

Usability and credibility evaluation of electronic governments: users‟ perspective Zhao Huang
Chapter 7 Experiment 2: improved usability and credibility assessment 197
organised and presented in the same way, and quickly locate target information. The
following quotes from the participants‟ responses indicate their views:
“It is clear that colours are consistently used on the site.”
“Consistent colours are used to present information on every page, so I can follow such
colours to search for information.”
“The same colours scheme is applied to each page, which is helpful for the website
consistency. Therefore, I could easily recognise my subject information.”
“I like that colours are used consistently.”
Table 7.33 Users‟ positive and negative comments on the proposed design solutions for the redesigned London Authority 1
Positive comments on the design solutions
Link colours
Colour consistency
Negative comments on the design solutions
Online help functions indicators
However, in terms of negative comments, some participants present their further
thoughts on the usability feature of online help function indicators. Regarding the
usability problem of online help not being clearly indicated, the design solution is to
offer an online help option, linking user support information, and place this option on
a fixed position on each page of the redesigned London Authority 1. Although the
online help information become available on the site, some participants still think that
the display for the online help option is too small. These quotes from the participants‟
responses show their views:
“The online help function is available on the site, but the link is too small.”
“It would be better if help icon and name can be bigger.”
“It is hard to see the online help option because it is too small.”
The redesigned London Authority 2
The participants‟ further thoughts on the proposed design solutions of the redesigned
London Authority 2 in presented in Table 7.34. As shown in Table 7.34, the common
positive comments focus on the features of marking visited links, arranging search
results by level of relevance and security messages presentation. Regarding the
usability problem that visited links are not clearly marked, the design solution is to

Usability and credibility evaluation of electronic governments: users‟ perspective Zhao Huang
Chapter 7 Experiment 2: improved usability and credibility assessment 198
mark visited links in italics throughout the site. It helps users distinguish which parts
of the site they have already visited and which parts remain to be explored. The
following quotes from the participants‟ responses indicate their views:
“The links in italics help to see where I have been before.”
“The indication of used links is clear.”
“The links that are already visited can be recognized by the italics style.”
“I think that marking visited links in italic can help me to see which places I have visited
before.”
With regard to the credibility problem of search results not being organised by level
of relevance, the proposed design solution is to organise search results according to
level of relevance, and use visual cues to indicate relevant level for each search item.
In this way, users may easily understand the overall arrangement of the search results
and quickly locate the relevant item. The following quotes from the participants‟
responses indicate their views:
“This will be easy to find the information when search results are presented in clear
relevance.”
“I feel that it is clear and easy to see the level of relevance in search results.”
“The five-star rating can help me to identify the information that is the most relevant with my
searching purpose.”
Table 7.34 Users‟ positive and negative comments on the proposed design solutions for the redesigned London Authority 2
Positive comments on the design solutions
Marking visited links
Indicating level of relevance for search results
Security messages presentation
With respect to the credibility problem of the absence of security messages in some
online services, the proposed design solution is to provide a security message for all
private services, indicating that user personal information will be treated safely and
not be shared with any third-parties. It can keep users informed of their data
protection, which may increase users‟ perception of data safety and reduce their
concerns about losing personal information. The following quotes from the
participants‟ responses indicate their views:

Usability and credibility evaluation of electronic governments: users‟ perspective Zhao Huang
Chapter 7 Experiment 2: improved usability and credibility assessment 199
“It is especially important that the website presents the security messages, which is helpful to
make credible site. I am pleased to see it on the site.”
“I like that the security message is presented, telling that users‟ personal details are not being
sold on.”
“The indication of the security message will increase my trust, therefore it is good when
ethical issues regarding personal information are considered.”
The redesigned London Authority 3
Table 7.35 presents the participants‟ further thoughts on the proposed design solutions
for the redesigned London Authority 3. In terms of the positive comments, the more
frequently recorded features are logical order of subject categories arrangement and
task progress indication. As suggested, regarding the usability problem of the subject
options not being presented with a logical order, the design solution is to arrange the
subject categories in an alphabetical order on every page of the redesigned London
Authority 3. It helps users understand the overall subject arrangement and supports
them to quickly identify target information. The following quotes from the
participants‟ comments indicate their views:
“I like that the category options are in an alphabetical order, so that I can easily find the
information among a number of options.”
“Clear category order helps me to get target information quickly.”
“Categories are organized well in the particular order.”
Furthermore, regarding the credibility problem that a task‟s progress is not clearly
indicated, the design solution provides a task status bar, visually indicating the total
steps of the task and highlighting the current step that users are engaged in. This
increases tasks transparency and support users to measure their task progress. The
following quotes from the open-ended questions present their opinions of this design
solution:
“The staged approach clearly indicates where I am in a given process.”
“By indicating the task progress, I can easily see how much I have done and how much I have
left in the task.”
“I can easily control my progress when I see such task progress indicators.”

Usability and credibility evaluation of electronic governments: users‟ perspective Zhao Huang
Chapter 7 Experiment 2: improved usability and credibility assessment 200
Table 7.35 Users‟ positive and negative comments on the proposed design solutions for the redesigned London Authority 3
Positive comments on the design solutions
Logical order of subject categories presentation
Task progress indication
Negative comments on the design solutions
Difficult recognition of visited links
However, some participants make negative comments on the design solution of
marking visited links (see Table 7.35). As suggested, regarding the usability problem
that the links already visited are not clearly marked, the design solution is to mark
visited links in italics within the site. In such a way, it may help users distinguish
which parts of the site have been visited, and which parts of the site remain to be
explored. However, some participants find that it is still difficult to recognise visited
links in the redesigned London Authority 3 website. The following quotes from the
participants‟ responses indicate their negative views:
“I do not like the italic font because it is not clear to see the difference between unused and
used links.”
“Italics are not suitable for visited links in my opinion. I have to pay extra attention to it if I
want to see the difference.”
“It is not obvious to see the links in italics on the site.”
7.3.3 Summary of the results in relation to users’ perception
Overall, the results of users‟ perception in experiment 2 indicate that the identified
usability and credibility problems has been improved after the proposed design
solutions have been applied to the three redesigned London Authorities. More
specifically, with respect to the redesigned London Authority 1, quantitative data
shows that the participants‟ assessments of the specific usability problems (including
links with many different colours, difficulty of finding the online help function,
difficulty of switching between online help and current work) are influenced after the
relevant design solutions have been implemented in experiment 2. In addition, the
participants‟ perception of the specific credibility problem (including information
presentation without colour consistency) has been also significantly changed in
experiment 2. In terms of the qualitative results, it shows the participants positive
comments on the proposed design solutions, which supports the findings of the

Usability and credibility evaluation of electronic governments: users‟ perspective Zhao Huang
Chapter 7 Experiment 2: improved usability and credibility assessment 201
quantitative results. As such, it suggests that the proposed design solutions have
improved the usability and credibility problems identified in experiment 1 in the
redesigned London Authority 1 website.
With regard to the redesigned London Authority 2, quantitative data indicates that the
participants‟ assessments of the identified usability problems (including vague options
on the home page, links with many different colours, absence of task progress
indication, difficult recognition of visited links, skipping over the order of the process)
have been significantly improved in experiment 2. Similarly, the participants‟
assessments of the identified credibility problems (including search results without the
level of relevance arrangement, information presentation without layout consistency
and no security messages presentation) are enhanced after the proposed design
solutions have been applied to the redesigned London Authority 2. In terms of
qualitative data, the participants point out their further positive comments on the
proposed design solutions, which support the quantitative results. Accordingly, it
suggests that the proposed design solutions have improved the usability and
credibility problems detected in experiment 1 in the redesigned London Authority 2
website.
Regarding the redesigned London Authority 3, quantitative data reveals that the
participants‟ assessments of the identified usability problems (including links with
many different colours, subject categories arrangement without a logical order) have
been significantly improved in experiment 2. Moreover, the participants‟ assessments
in relation to the identified credibility problems (including illogical detailed contact
information arrangement, lack of the site‟s credentials display, difficulty of finding
the council information, absence of security messages display, absence of task
progress indication, difficulty of identifying site update, absence of a sign-in option)
have been also improved in experiment 2. However, although no significant
difference is found between experiment 1 and 2 with regard to the usability problems
that visited links are not clearly marked and users get lost due to being given too
many choices over sequences, the results still show that the participants‟ assessments
have been influenced after the design solutions have been applied to the redesigned
London Authority 3. Furthermore, the qualitative results indicate the participants
further thoughts on the proposed design solutions through the open-ended questions

Usability and credibility evaluation of electronic governments: users‟ perspective Zhao Huang
Chapter 7 Experiment 2: improved usability and credibility assessment 202
of the questionnaire, addressing the positive comments on the design solutions in the
redesigned London Authority 3. Therefore, it may suggest that the proposed design
solutions have improved the usability and credibility problems found in experiment 1
in the redesigned London Authority 3 website.
7.4 Users’ performance
The results of users‟ perception indicate the effects of the proposed design solutions
on the identified usability and credibility problems for each redesigned London
Authority in experiment 2. In order to investigate the effects of the proposed design
solution on users‟ interaction with the redesign London Authorities, users‟
performance is also measured on the basis of the same performance criteria used in
experiment 1. These criteria include the amount of online help required; time spent
completing tasks; number of steps to finish tasks and number of successful tasks
completion. By using such criteria, it is helpful to indicate the level of users‟
interaction with the redesigned London Authorities when they perform a set of
practical tasks. Moreover, it can comparatively analyse performance results before
and after the proposed design solutions have been implemented in experiment 1 and
experiment 2 respectively. This section reports the results of users‟ performance
within each redesigned London Authority.
The redesigned London Authority 1
Table 7.36 presents the participants‟ performance in terms of total time spent
completing tasks; number of steps to complete tasks; amount of online help required
and number of successful tasks completion with London Authority 1 in experiments 1
and 2 respectively. As shown in Table 7.36, the results of the Paired-Samples T-test
show that there is a significant difference in terms of time spent completing all tasks
between experiments 1 and 2 (T=4.157, P=0.002). More specifically, the participants
in experiment 2 take less time to complete the tasks than experiment 1. In addition, a
significant difference in terms of number of steps used for all tasks completion is also
found between experiments 1 and 2 (T=4.894, P=0.000). In detail, the participants

Usability and credibility evaluation of electronic governments: users‟ perspective Zhao Huang
Chapter 7 Experiment 2: improved usability and credibility assessment 203
take fewer steps to finish all tasks in experiment 2 than experiment 1 (see Appendix
11a for the detailed Paired-Samples T-test results).
Furthermore, the results of the Paired-Samples T-test show that a significant
difference in terms of online help required for all tasks and number of successful tasks
completion are not shown between experiment 1 and experiment 2. It may be because
the distribution of these data sets in experiment 2 does not follow a normal
distribution (see section 7.2.2). However, according to the mean scores in terms of
online help required for all tasks, it still indicates that the participants in experiment 2
require less online help to complete all the tasks than experiment 1. Similarly, based
on the mean scores in terms of number of successful tasks completion, it shows that
the participants in experiment 2 can complete more tasks successfully than experiment
1.
The results indicate that participants‟ performance with the redesigned London
Authority 1 is enhanced in experiment 2. These findings are also reflected in the
results of users‟ perception, which indicates that the identified usability and credibility
problems are improved by the proposed design solutions in the redesigned London
Authority 1 website in experiment 2. Therefore, this implies that the proposed design
solutions have increased the overall usability and credibility of the redesigned London
Authority 1, which in turn is reflected in better users‟ performance with the
redesigned e-government website.
Table 7.36 Users‟ performance with the redesigned London Authority 1
Total time spent completing tasks
Experiment 1 (N=12) Experiment 2 (N=12)
Mean 26.627 15.427
Std. Deviation 8.905 2.494
Significance T=4.157, P=0.002
Number of steps to finish tasks
Experiment 1 (N=12) Experiment 2 (N=12)
Mean 60.417 41.167
Std. Deviation 13.104 4.648
Significance T=4.894, P=0.000
The amount of online help required
Experiment 1 (N=12) Experiment 2 (N=12)
Mean 0.250 0.000
Std. Deviation 0.452 0.000

Usability and credibility evaluation of electronic governments: users‟ perspective Zhao Huang
Chapter 7 Experiment 2: improved usability and credibility assessment 204
Significance T= N/A, P= N/A
Number of successful tasks completion
Experiment 1 (N=12) Experiment 2 (N=12)
Mean 1.139 1.000
Std. Deviation 0.117 0.000
Significance T= N/A, P= N/A
The redesigned London Authority 2
Table 7.37 shows the participants‟ performance in terms of total time spent
completing tasks; number of steps to accomplish tasks; amount of online help
required and number of successful tasks completion with London Authority 2 in
experiments 1 and 2 respectively. As shown in Table 7.37, a significant difference in
terms of time spent completing all tasks is found between experiments 1 and 2
(T=5.489, P=0.000). In other words, the participants in experiment 2 use less time to
complete all tasks than in experiment 1. Additionally, a significant difference in terms
of number of steps used for all tasks completion is also detected between experiments
1 and 2 (T=6.878, P=0.000). More specifically, the participants in experiment 2 take
fewer steps to finish all the tasks than in experiment 1 (see Appendix 11b for the
detailed Paired-Samples T-test results).
However, the results of the Paired-Samples T-test show that a significant difference in
terms of online help required for all tasks and number of successful tasks completion
is not shown between experiments 1 and 2. A possible explanation is that the
distribution of these data sets does not follow a normal distribution (see section 7.2.2).
However, according to the mean scores of online help required for all tasks, it
emerges that the participants in experiment 2 require less online help to complete all
the tasks than those in experiment 1. Equally, although a significant difference in
terms of number of successful tasks completion is not seen, it still shows that the
participants in experiment 2 complete more tasks than those in experiment 1.
The findings show that the participants‟ performance with the redesigned London
Authority 2 is promoted in experiment 2. These findings are also echoed in the results
of users‟ perception, which reveals that the participants‟ assessments of the specific
usability and credibility problems are improved in the redesigned London Authority 2

Usability and credibility evaluation of electronic governments: users‟ perspective Zhao Huang
Chapter 7 Experiment 2: improved usability and credibility assessment 205
in experiment 2. Accordingly, the findings suggest that the proposed design solutions
improve the overall usability and credibility of the redesigned London Authority 2,
which in turn, enhances users‟ performance.
Table 7.37 Users‟ performance with the redesigned London Authority 2
Total time spent completing tasks
Experiment 1 (N=12) Experiment 2 (N=12)
Mean 21.721 8.803
Std. Deviation 8.579 1.796
Significance T=5.489, P=0.000
Number of steps to finish tasks
Experiment 1 (N=12) Experiment 2 (N=12)
Mean 81.833 40.917
Std. Deviation 20.687 5.160
Significance T=6.878, P=0.000
The amount of online help required
Experiment 1 (N=12) Experiment 2 (N=12)
Mean 0.583 0.000
Std. Deviation 0.669 0.000
Significance T= N/A, P= N/A
Number of successful tasks completion
Experiment 1 (N=12) Experiment 2 (N=12)
Mean 1.148 1.000
Std. Deviation 0.086 0.000
Significance T= N/A, P= N/A
The redesigned London Authority 3
Table 7.38 presents the participants‟ performance with London Authority 3 and the
redesigned London Authority 3 in experiments 1 and 2 respectively. As shown in
Table 7.38, the results of the Paired-Samples T-test indicate that there is a significant
difference in terms of time spent completing all tasks between experiment 1 and
experiment 2 (T=2.523, P=0.028). More specifically, the participants in experiment 2
take less time to complete the tasks than in experiment 1. Moreover, a significant
difference in terms of number of steps used for all tasks completion is also found
between experiments 1 and 2 (T=2.046, P=0.065). In detail, the participants in
experiment 2 take fewer steps to finish all the tasks, compared with experiment 1 (see
Appendix 11c for the detailed Paired-Samples T-test results).

Usability and credibility evaluation of electronic governments: users‟ perspective Zhao Huang
Chapter 7 Experiment 2: improved usability and credibility assessment 206
In terms of online help required for all tasks, the results of the Paired-Samples T-test
show that a significant difference is not seen between experiments 1 and 2. It may be
because the distribution of these data sets does not follow a normal distribution (see
section 7.2.2). However, according to the mean scores, it seems that the participants in
experiment 2 require less online help to complete all the tasks than in experiment 1.
Similarly, although a significant difference in terms of number of successful tasks
completion is not shown between experiments 1 and 2, the mean scores also indicate
that the participants in experiment 2 finish more tasks than those in experiment 1.
Based on these findings, it appears that the participants perform better in experiment 2
than experiment 1. These are also reflected in the results of the participants‟
perception, which shows that the participants‟ assessments of the identified usability
and credibility problems are improved in experiment 2. Consequently, it implies that
the proposed design solutions have enhanced the overall usability and credibility of
the redesigned London Authority 3, which in turn, enhances users‟ performance.
Table 7.38 Users‟ performance with the redesigned London Authority 3
Total time spent completing tasks
Experiment 1 (N=12) Experiment 2 (N=12)
Mean 16.209 10.009
Std. Deviation 8.102 2.334
Significance T=2.523, P=0.028
Number of steps to finish tasks
Experiment 1 (N=12) Experiment 2 (N=12)
Mean 50.167 40.333
Std. Deviation 16.297 4.141
Significance T=2.046, P=0.065
The amount of online help required
Experiment 1 (N=12) Experiment 2 (N=12)
Mean 0.000 0.000
Std. Deviation 0.000 0.000
Significance T=N/A, P=N/A
Number of successful tasks completion
Experiment 1 (N=12) Experiment 2 (N=12)
Mean 1.065 1.000
Std. Deviation 0.088 0.000
Significance T= N/A, P= N/A

Usability and credibility evaluation of electronic governments: users‟ perspective Zhao Huang
Chapter 7 Experiment 2: improved usability and credibility assessment 207
7.5 Summary and conclusion
Experiment 2 aims to examine the effects of proposed design solutions on the
usability and credibility problems found in experiment 1 for each target e-government
website. To conduct the assessment of the proposed design solutions, both users‟
perception and performance are measured in experiment 2. Overall, the findings of
users‟ perception show that the assessments of the participants on the specific
usability and credibility problems on each redesigned London Authority have been
significantly improved after the proposed design solutions have been implemented in
experiment 2. In other words, these proposed design solutions may improve the
usability and credibility problems found in experiment 1 for each target e-government
website. Furthermore, the results of users‟ performance show that the level of the
participants‟ interaction with each redesigned London Authority in experiment 2 is
better than their interaction in experiment 1. Thus, it may suggest that the improved
usability and credibility may influence users‟ performance. More specifically, the
proposed design solutions have solved the usability and credibility problems in the
target London Authorities. These improved usability and credibility features may
increase the overall usability and credibility of the redesigned e-government websites,
which in turn, enhances users‟ performance with these redesigned e-government
websites. This is also supported by previous studies (Baker, 2009; Garcia et al., 2005;
Verdegem and Verleye, 2009), which indicated that improved e-government website
usability can enhance service effectiveness and users‟ satisfaction, and then improve
users‟ interaction. Furthermore, Wathen and Burkell, (2002) showed that more
credible websites encourage users‟ trust and attitudes and behaviour development,
which can enhance users‟ performance with websites.
Therefore, it is important to ensure that usability and credibility of e-government
websites meet the requirements of the users, so that users‟ interaction with e-
governments may be enhanced. To achieve this goal, this study draws on the results of
experiments 1 and 2 to develop a set of usability and credibility guidelines. These
guidelines can help designers identify existing usability and credibility problems and
provide design guidance for usability and credibility development for e-government

Usability and credibility evaluation of electronic governments: users‟ perspective Zhao Huang
Chapter 7 Experiment 2: improved usability and credibility assessment 208
websites. Thus, the next chapter describes the detailed usability and credibility
guidelines for e-government website design.

Usability and credibility evaluation of electronic governments: users‟ perspective Zhao Huang
Chapter 8 General discussion and guidelines development 209
CHAPTER 8
GENERAL DISCUSSION AND GUIDELINES DEVELOPMENT
8.1 Introduction
The aim of this study is to evaluate the usability and credibility of current e-
government websites, which has been achieved through two experimental studies.
Chapter 5 presents the findings of experiment 1 in terms of users‟ perception and
users‟ performance. Regarding users‟ perception, a set of usability and credibility
strengths have been found in the target e-government websites. In addition, there are a
number of usability and credibility problems that have been identified in each e-
government website evaluated. With respect to users‟ performance, the level of users‟
interaction with the e-government websites evaluated has also been indicated. To
provide a thorough usability and credibility evaluation, the proposed design solutions
regarding the identified usability and credibility problems have been provided and
designed into the target e-government websites in Chapter 6. Chapter 7 reports on the
results of experiment 2 to indicate the effects of the proposed design solutions on the
usability and credibility problems found in experiment 1. The purpose of Chapter 8 is
twofold: a) to provide a general discussion of the findings of experiment 1 and
experiment 2; b) based on the results of the two experiments, to develop a set of
usability and credibility guidelines for e-government website design, which is focused
on developing more user-centred e-government.
This chapter is structured as follows: section 8.2 provides a general discussion of the
findings from experiment 1 and experiment 2, which are based on the analysis
presented in Chapter 5 and Chapter 7. Then, a set of usability and credibility
guidelines is developed to guide the usability and credibility design of e-government
websites (section 8.3). Finally, a brief summary and conclusion is presented at the end
of the chapter (section 8.4).

Usability and credibility evaluation of electronic governments: users‟ perspective Zhao Huang
Chapter 8 General discussion and guidelines development 210
8.2 General discussion of the findings from experiments 1 and 2
8.2.1 Discussion of the results from experiment 1
The findings from experiment 1 indicate that usability and credibility issues have been
considered in current e-government websites because a set of usability and credibility
strengths have been found. In particular, the common usability strengths lay within
the areas of “visibility of system status”, “consistency and standards” and “support
and extend users‟ skills”. For example, regarding visibility of system status, a title on
every page clearly indicates the relevant subject. In terms of consistency and
standards, each page always follows the same display format. With regard to support
and extend users‟ skills, the site supports users moving forwards and backwards
within different fields on the site. Furthermore, the common credibility strengths are
within the areas of “site looks professional”, “easy to verify the information accuracy”
and “use restraint with any promotional content”. For instance, regarding the site
looks professional, the content of the site matches with information that users expect
to obtain from a local council. In terms of ease of verifying the information accuracy,
the URL properly presents the domain name of the local council. With respect to use
restraint with any promotional content, the site does not present too many irrelevant
promotion contents. These identified usability and credibility strengths are important
features to establish usable and credible e-government websites.
On the other hand, there are a number of usability and credibility problems that have
been found in each target e-government websites. These findings reinforce previous
usability or credibility studies of e-government, which suggest that there is much
room for current e-government websites to improve their usability and credibility
(Gant and Gant, 2002; Garcia et al., 2005; Sidi and Junaini, 2006). In particular,
among the usability and credibility problems detected, the most serious usability
problems identified in the target e-government websites are within the areas of
“aesthetic and minimalist design”, “recognition rather than recall” and “consistency
and standards”. For example, regarding aesthetic and minimalist design, the links
have many different colours on the site. With respect to recognition rather than recall,
some options on the home page are not clearly presented. In terms of consistency and
standards, subject categories are presented in an illogical order. In addition, the
Usability and credibility evaluation of electronic governments: users‟ perspective Zhao Huang
Chapter 8 General discussion and guidelines development 211
credibility problems with highest severity are within the areas of “site looks
professional”, “make site easy to use and useful” and “show the honest and
trustworthy people behind the site”. For instance, with respect to the site professional
look, information is presented without consistent colours. Regarding the site ease of
use and usefulness, search results are not organised and presented by level of
relevance. In terms of showing honest and trustworthy people behind the site, the
detailed contact information has not been organised by the different council
departments, and it is not clear to see the e-government website‟s credentials. These
problems suggest that usability and credibility have not been considered in adequate
detail in these current e-government website designs. The findings are also supported
by previous studies (Barnes, 2004; Donker-Kuijer et al., 2010; Kossak et al., 2001;
Kumar et al., 2007), which show that usability and credibility have not had enough
attention paid to them in e-government, especially e-government website design.
Without addressing usability and credibility in sufficient detail to inform e-
government website design, the target of increasing users‟ interaction with e-
governments remains a challenge. Therefore, this implies that current e-government
websites need to improve their usability and credibility.
The results from experiment 1 also reinforce previous findings on the link between
usability and credibility (Fogg et al., 2001; 2003; Garcia et al., 2005; Nielsen, 1999;
2000), which implies that there is an interrelation between them. The findings of the
study indicate that the e-government website with the best overall usability is
associated with the best overall credibility, and vice versa. Equally, the e-government
website that has the lowest overall usability is associated with the lowest overall
credibility, and vice versa. These results suggest that usability and credibility have
mutual effects, and there is a need to consider both usability and credibility together
when developing e-governments.
Furthermore, the results of users‟ performance reinforce previous research, which
indicate that there is a relationship between users‟ perception and their performance
(Han et al., 2001; Sonderegger and Sauer, 2010). Based on the experimental results, it
appears that the overall users‟ perception of usability and credibility positively
influences their performance with the e-government websites. This is also supported
by Sauer and Sonderegger (2009), who indicated that users‟ perception of usability

Usability and credibility evaluation of electronic governments: users‟ perspective Zhao Huang
Chapter 8 General discussion and guidelines development 212
influences users‟ attitude, emotion and behaviour. In addition, Rains and Karmikel
(2009) indicated that users‟ perception of credibility significantly affects users‟
performance and their interaction with the systems.
Moreover, the results show that users‟ performance is not only influenced by the
overall users‟ perception of usability and credibility, but also affected by the particular
perception of usability and credibility, especially the e-government website look. This
is also supported by previous studies, which indicate that the website aesthetics design
provides the first impression in users‟ perception. As reported by Lavie and
Tractinsky (2004), aesthetics is strongly correlated with perceived usability, which is
a key determinant of users‟ satisfaction and pleasure. This is also supported by an
early study by Tractinsky (1997), who found that system aesthetics can be seen as
apparent usability, which is perceived more quickly than other attributes of usability.
Additionally, Fogg et al. (2003) identified that the most prominent issue found in
credibility evaluation is site look, which can cause users most concern about
credibility. More importantly, users‟ judgments of credibility are also firstly based on
site look. As suggested by Robins and Holmes (2008), the first impression of
credibility comes from the site look, which results in a faster judgment of credibility
compared with other credibility cognitive processes. Therefore, the findings imply
that users‟ perception of usability and credibility can be affected by a number of
design features. Any specific features violation can influence users‟ perception, which
in turn affects users‟ interaction with the site. Therefore, in the construction of
usability and credibility of e-governments, it is important to pay attention to the
specific usability and credibility features at the detailed level.
8.2.2 Discussion of the results from experiment 2
Experiment 2 has examined users‟ perception of the proposed design solutions
regarding the usability and credibility problems in relation to the redesigned e-
government websites. In addition, users‟ task performance with the redesigned e-
government websites has also been measured in order to reveal the level of users‟
interaction. Overall, the results indicate that there is a significant difference in users‟
perception of the specific usability and credibility features between experiment 1 and

Usability and credibility evaluation of electronic governments: users‟ perspective Zhao Huang
Chapter 8 General discussion and guidelines development 213
experiment 2. In addition, a significant difference has been also found in users‟
performance between experiments 1 and 2. More specifically, in terms of users‟
perception, the findings show that users‟ perception of the usability and credibility
problems in each target e-government website is significantly alleviated after the
proposed design solutions have been implemented in the redesigned e-government
websites in experiment 2. In other words, it may imply that the identified usability and
credibility problems have been improved by the proposed design solutions. This is
also supported by the qualitative results in experiment 2, which reveal the users‟
positive feedback about the improved usability and credibility features. These results
suggest that with precise problems analysis and appropriate solutions design, the
usability and credibility problems of current e-government websites can be enhanced.
Such enhancement will be beneficial for the overall usability and credibility of e-
government websites.
In addition, the results of users‟ performance show that the level of users‟ interaction
with each redesigned e-government website in experiment 2 is better than their
interaction with the target e-government websites in experiment 1. Based on these
results, a possible explanation is that the proposed design solutions have improved the
usability and credibility problems of the target e-government websites. Such
improvements may lead to the increase in the overall usability and credibility of the
target e-government websites, which in turn, makes it better for users‟ performance
with these e-government websites. These results confirm previous studies, which
indicate that usability or credibility significantly influence users‟ attitudes and
behaviour (Al-Omari and Al-Omari, 2006; Bélanger and Carter, 2008; Donker-Kuijer
et al., 2010; Parent et al., 2005; Sidi and Junaini, 2006; Thompson et al., 2003; Welch
and Hinnant, 2003). In particular, a higher level of usability may produce better users‟
performance (Zabed Ahmed et al., 2006). As a result, usability and credibility are two
important factors influencing users‟ interaction with e-governments. Furthermore,
these results also suggest the efficacy of the users‟ perspective evaluation. In this way,
it can focus on users‟ viewpoints to identify usability and credibility problems,
examine the proposed design solutions and measure their task performance, which is
helpful to understand users and their usability and credibility needs. The results can
provide a concrete prescription for developing more user-centred e-government that

Usability and credibility evaluation of electronic governments: users‟ perspective Zhao Huang
Chapter 8 General discussion and guidelines development 214
may expect to support users to achieve the desirable service outcomes, and generate
greater users‟ participation.
8.3 Usability and credibility guidelines development
Given that a number of usability and credibility problems have been found in the
target e-government websites, it indicates that usability and credibility have not been
considered in adequate detail in e-government website design. In other words, it
suggests that the designers do not pay enough attention to usability and credibility of
current e-governments, and lack the knowledge to develop consistently usable and
credible e-government websites. Based on the findings of the usability and credibility
evaluation, this section provides a set of guidelines that address the specific usability
and credibility design features for e-government website development.
The importance of the guidelines is that they can provide a framework that supports
designers in creating quality design (Henninger, 2000). As such, many guidelines for
interface and website design have been indicated in previous studies (Reed et al., 1999;
Rosenweig, 1996; Weinschenk and Yeo 1995), and evidence from literature has
demonstrated the usefulness of such guidelines for the effective design of computer-
based systems. In this research, with the proposed sets of usability and credibility
guidelines (see Tables 8.1 and 8.2), designers can have a better understanding of the
users‟ requirements for usability and credibility. In addition, each guideline covers a
number of specific design features, which provides designers with concrete guidance
when they design usability and credibility e-government websites. As indicated by
Henninger (2000, p.228), “the more specific the guideline, the better the support for
the developer.” Furthermore, these guidelines can be also used to help designers in
evaluating usability and credibility of existing e-government websites, based on
whether the website design meets these guidelines, with the final goal being to
achieve more usable and credible e-governments. These guidelines are generated from
associated usability heuristics and credibility guidelines used in the study, containing
a range of the design considerations. The design considerations reflect the existing
successful features, the problems identified and the proposed design solutions in

Usability and credibility evaluation of electronic governments: users‟ perspective Zhao Huang
Chapter 8 General discussion and guidelines development 215
experiment 1 and experiment 2. The following sections present the detailed
description of the usability and credibility guidelines.
8.3.1 Usability guidelines development
Usability guideline 1: E-government websites should provide users with a high level
of status visibility to support their information seeking.
The results indicate that when users travel around e-government websites, they
usually scan the page titles or subject headings to identify information rather than
reading through the detailed level of information content. They need to have clear
subject headers and page titles to support quick information processing. Therefore, the
subject headers and page titles should be clearly displayed to represent the
corresponding content.
During information seeking, users require visibility of the option selected and its
relation within multiple category levels. In order to make information easy to
remember and identify, the option selected and its relevant multiple levels of options
need to be visually labelled and consistently applied across pages.
Furthermore, when users search the target information via the screen, their attention is
moved from one part of content to another part. In order to support information
identification, different kinds of content should be separated from each other and
clearly located in distinct zones on an e-government website.
During interaction, users rely on navigational tools to help them in getting the object
needed and informing where they have been and where they currently are.
Accordingly, in order to keep users informed of their current position within the site
and support site orientation, e-government websites should visualize users‟ current
location and alternative movements relative to the structure of the underlying
information space.
In the course of information seeking, users select relevant options through multiple
category levels to locate their target information. Thus, in order to make options easily

Usability and credibility evaluation of electronic governments: users‟ perspective Zhao Huang
Chapter 8 General discussion and guidelines development 216
identifiable, an e-government website should present meaningful options and ensure
that options and sub options are interdependent.
Usability guideline 2: E-government websites should match with the real world,
speaking users’ language with words and concepts familiar to users.
When interacting with e-government services, users need to be aware of the system
reaction. In particular, the system needs to notify users if there are observable delays
in the system response time. Therefore, in order to keep users informed of the system
progress, e-governments should display clear processing status messages for users,
including delay time and how much more/longer there is to go.
Users compare the colours used between e-governments and local councils. They
expect that the same colour scheme can be consistently applied on both e-government
representation and physically in local councils. Consequently, in order to satisfy
users‟ expectation of colour application, colours used in e-government websites
should correspond to the colour scheme in physical local councils, including logo
colours and header colours.
At every time during the interaction, users need to be aware of how to proceed with
their actions. In order to make the action easily understandable for users, e-
government websites should offer clear prompts to indicate how the action is to be
conducted at all times.
Users follow links to identify the target information. In order to make links readily
understood, link names should be descriptive, meaningful and explicit to represent
information provided. In addition, using relevant images with links can support users‟
subject understanding and facilitate text readability.
Usability guideline 3: E-government websites should support users’ free movement
and ensure that undo and redo functions are available.
Users search for information or complete tasks by using different approaches, such as
following through multiple levels of menus, or using a search engine. In order to give

Usability and credibility evaluation of electronic governments: users‟ perspective Zhao Huang
Chapter 8 General discussion and guidelines development 217
users the freedom to select their preferred approach to locate information or conduct
tasks, e-government websites should allow users to revise their selected approach or
change earlier options whenever they want. Meanwhile, an undo function should
always be available for users during interaction.
Users move around e-government websites to locate target information. In particular,
going back to the previous pages is an important part of personal control and a way to
organise a searching strategy. As such, to allow users to go back and review previous
information, e-government websites should provide and highlight the back option on
every page, to further support information hunting.
Subject options arrangements influence users understanding of the overall information
arrangement. In order to make a sensible way for users to look through subject
information and reduce memory load, subject options should be arranged in a logical
order to indicate a natural sequence of information organization.
Information breadth and depth are used to distribute e-government content by
designing the number of subject categories and the number of information levels. The
appropriate number of categories keeps content from getting cluttered and reduces the
chance of users being confused by a vast number of options. With the proper levels of
information, users can follow a short path through the site to find the detailed
information. Therefore, a medium condition of breadth and depth should be
considered as an optimal trade-off, which can help with information retrieval.
Usability guideline 4: E-government websites should have consistent design, and
users should not have to wonder whether different words, presentations, or actions
mean the same thing.
Colour consistency establishes unity across the pages of an e-government website,
strengthening visual subject recognition and reducing layout clutter. In order to help
users understand that information provided is organised and presented in the same
way throughout the site, consistent colours should be used throughout the e-
government site.

Usability and credibility evaluation of electronic governments: users‟ perspective Zhao Huang
Chapter 8 General discussion and guidelines development 218
In addition, having consistent layout within an e-government website strengthens the
structural relations among elements. In order to maintain consistency throughout their
websites, e-governments should follow consistent standards in terms of font, size and
display formatting for interaction design.
In the course of information seeking, users may require online help to solve their
problems. In order to make online help instructions easy to identify, online help
options should appear in a consistent location across the pages within the site.
Moreover, to reinforce consistency and reduce cognitive load on users, menu choices
should be named consistently, both within each menu and across pages of e-
government websites.
Usability guideline 5: E-government websites should design better error messages
that prevent a problem from occurring in the first place.
During the online tasks completion, users are required to fill in information in each
step of the task. In order to reduce the possibility of errors occurring and ensure that
all necessary information is provided, e-government websites should not allow users
to skip over the order of the task process.
When errors have been made in data entry fields, there is a need to inform users in
order to correct these errors. As such, to draw users‟ particular attention to errors, e-
government websites should show a highlighted message around errors in data entry
fields.
Furthermore, users need to be aware of the requirements in data entry fields, such as
the character spaces limitation in order to input right data. To make clear and
understandable data entry fields to prevent errors, the requirements of data entry
should be clearly presented on every page where possible.
During the interaction with tasks, in order to ensure that users have completed the
appropriate information, e-government websites should present a warning message if
users are making a potentially serious error.

Usability and credibility evaluation of electronic governments: users‟ perspective Zhao Huang
Chapter 8 General discussion and guidelines development 219
Usability guideline 6: E-government websites should make objects, actions and
options visible and users should not have to remember information from one part of
the dialogue to another.
Since a range of information is presented on each page of an e-government website, in
order to make information easy to recognise and decrease cognitive load on users, the
key information or subject should always be placed in a central location on the pages.
When users conduct tasks from the home page, in order to support users‟ orientation
and increase users‟ understanding of menu choices, a corresponding prompt should be
presented to briefly explain every choice on the pages.
Moreover, in order to support text readability on e-government websites, breathing
space should be appropriately used in text areas.
Usability guideline 7: E-government websites should support tasks completion and
speed up interaction for both experienced and inexperienced users.
Hyperlinks connect the text, pages and documents of e-government websites, serving
as a function that guides users‟ movement around the site in order to locate their target
information. To reduce the barriers to information connection, all sorts of links within
e-government websites should be working properly, and link to corresponding
information.
Users select the relevant options through multiple levels of information to locate the
target subject. In order to make sub options easy to understand and identify, e-
government website should provide detailed information in multiple options levels.
When looking through the search results, users need to establish their understanding
of subject arrangement sequence. In order to help users quickly identify their
searching object and reduce memory load problems, search results should be arranged
according to the level of relevance and such relevance should be visually presented
for users.

Usability and credibility evaluation of electronic governments: users‟ perspective Zhao Huang
Chapter 8 General discussion and guidelines development 220
Sometimes, users are task-orientated when they travel around e-government websites.
In order to cater for quick task interaction, e-government websites should provide
shortcuts or quick links for highly frequent usage tasks on the site.
Users require the appropriate hierarchy structure to fit in with their progressive level
of sub-tasks to complete the overall tasks. Therefore, in order to navigate users‟
movement to achieve the desirable tasks, e-government should match menu structure
with task structure within its site.
Usability guideline 8: E-government websites should provide aesthetic and minimalist
design.
When users look at more specific subject content, images can support their awareness
of topics and facilitate communication of the subject information. In order to make
images easily understandable for users, e-government websites should apply clear
images. In addition, such images should be closely linked with corresponding text.
When users read information on e-government websites, the appropriate amount of
information displayed can keep content from getting cluttered and reduce the chance
that users are confused by information heavy subjects. Therefore, content on each e-
government page should be presented in an uncluttered manner.
During information searching, users need to recognise the visited and unvisited places
to fit in their searching strategy to locate their target information. Consequently, to
clearly distinguish between visited and unvisited links, they should be clearly marked
and indicated, for adding support to users‟ information searching process.
Users need to distinguish the differences among information resources to locate
expected information. In order to support users‟ recognition of information resources,
distinct colours should be applied for the links. However, in order to integrate links
colours to the overall layout aesthetic display, and reduce unnecessary colours
distraction, the number of link colours should be carefully considered.

Usability and credibility evaluation of electronic governments: users‟ perspective Zhao Huang
Chapter 8 General discussion and guidelines development 221
When users look through e-government websites, it is critical to lead their eyes in the
appropriate direction on subject content. Therefore, white space should be used to
separate meaningful groups of information and create symmetry in content display.
Usability guideline 9: E-government websites should provide error messages that
precisely indicate the problem and constructively suggest a solution.
During interaction with e-governments, users may make some mistakes when
completing online forms. In order to help users to recover from errors to achieve their
desirable services outcomes, e-government should provide clear error messages that
suggest what further actions users need to take to overcome errors.
In addition, users need to know the reasons behind the errors in order to avoid such
errors in the following process. Therefore, to effectively deliver the causes of the
problems, error messages should be meaningful, constructive and unambiguous.
When filling in information in data entry fields, users are required to provide some
crucial information. In order to prevent missing data, the compulsory and optional
fields should be clearly marked for users.
If an error is detected in a date entry field, in order to attract users‟ attention to the
particular field in error and avoid retyping all information, e-governments should
place the cursor in that problem field and highlight the error without changing other
initial data.
Usability guideline 10: E-government websites should provide help and
documentation to support users’ tasks completion.
During interaction, users may check online help to know how best to use an e-
government website. In order to make associated information easily understandable
for users, e-government should give guidance in clear and simple language.
Users may require online help to support their tasks completion at any time. In order
to ensure that users can easily find online help whenever they need, e-government
Usability and credibility evaluation of electronic governments: users‟ perspective Zhao Huang
Chapter 8 General discussion and guidelines development 222
websites provide quick access to online instruction on every page. Furthermore, in
order to make such help access easily detected, it should be always located in a fixed
position on pages.
When users access online help, they expect to find the relevant answers to solve the
problems encountered on e-government websites. In order to increase problem solving
capability, online help instruction should cover a wider range of guidance and advices.
In the course of multiple tasks process, users need to easily retrieve their previous task
after using online help information. In order to allow users to easily switch between
online help and their current work, online help information should be distinctly
presented in a separated window within e-government websites.
Usability guideline 11: E-government websites should make service functions, design
elements and site content work as a whole to support users’ tasks completion.
In order to support users‟ tasks completion, e-governments should increase their
collaboration ability in order to understand the abbreviations, acronyms, codes and
formats used by users.
E-government should define standard communication protocols to support
information and services exchange.
Users‟ first impression comes from the site look. Thus, in order to make an attractive
site for users, e-governments should ensure that displays on each page are compatible
throughout their websites.
Usability guideline 12: E-government websites should support, extend and improve
users’ skills and knowledge when they perform tasks.
E-government is used by diverse users who have heterogeneous skills. In order to
make the key options highly visible, subject options should stand out clearly on each
page of the e-government website.
Usability and credibility evaluation of electronic governments: users‟ perspective Zhao Huang
Chapter 8 General discussion and guidelines development 223
In addition, users with different skills take different lengths of time to read
information. In order to make information quick to understand and identify, e-
government websites should summarize the most important content at the beginning
of the paragraph, following the detailed information.
All users need to easily control their information pace within an e-government
website. Therefore, in order to increase control of movement around e-government
websites, forward and backward functions should be made available in all fields of e-
governments.
Usability guideline 13: E-government websites should present a pleasant design and
treat users with respect.
Users prefer to use relevant images with text, which can enrich content presentation
and facilitate communication. Therefore, in order to keep enjoyable interaction with
information presentation, relevant images should be presented throughout the site.
In addition, users are happier reading short information. As a result, in order to make
content easy to read, e-governments should make text short without reducing depth of
content, by splitting the information into multiple nodes connected by links.
Furthermore, information on each page should be written in clear and simple language.
When users interact with e-government websites, they may have different
requirements in terms of access. In order to increase the quality of interaction, e-
government websites should provide accessibility options consistently on every page.
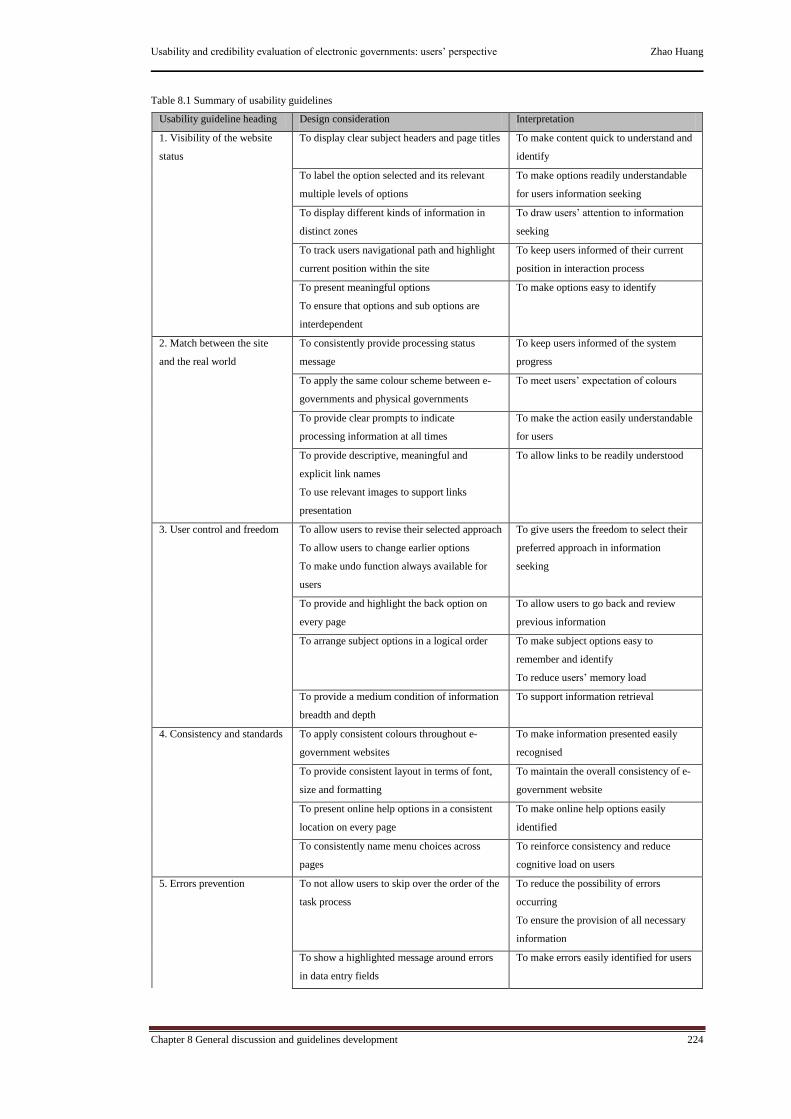
Usability and credibility evaluation of electronic governments: users‟ perspective Zhao Huang
Chapter 8 General discussion and guidelines development 224
Table 8.1 Summary of usability guidelines
Usability guideline heading Design consideration Interpretation
1. Visibility of the website
status
To display clear subject headers and page titles To make content quick to understand and
identify
To label the option selected and its relevant
multiple levels of options
To make options readily understandable
for users information seeking
To display different kinds of information in
distinct zones
To draw users‟ attention to information
seeking
To track users navigational path and highlight
current position within the site
To keep users informed of their current
position in interaction process
To present meaningful options
To ensure that options and sub options are
interdependent
To make options easy to identify
2. Match between the site
and the real world
To consistently provide processing status
message
To keep users informed of the system
progress
To apply the same colour scheme between e-
governments and physical governments
To meet users‟ expectation of colours
To provide clear prompts to indicate
processing information at all times
To make the action easily understandable
for users
To provide descriptive, meaningful and
explicit link names
To use relevant images to support links
presentation
To allow links to be readily understood
3. User control and freedom To allow users to revise their selected approach
To allow users to change earlier options
To make undo function always available for
users
To give users the freedom to select their
preferred approach in information
seeking
To provide and highlight the back option on
every page
To allow users to go back and review
previous information
To arrange subject options in a logical order To make subject options easy to
remember and identify
To reduce users‟ memory load
To provide a medium condition of information
breadth and depth
To support information retrieval
4. Consistency and standards To apply consistent colours throughout e-
government websites
To make information presented easily
recognised
To provide consistent layout in terms of font,
size and formatting
To maintain the overall consistency of e-
government website
To present online help options in a consistent
location on every page
To make online help options easily
identified
To consistently name menu choices across
pages
To reinforce consistency and reduce
cognitive load on users
5. Errors prevention To not allow users to skip over the order of the
task process
To reduce the possibility of errors
occurring
To ensure the provision of all necessary
information
To show a highlighted message around errors
in data entry fields
To make errors easily identified for users

Usability and credibility evaluation of electronic governments: users‟ perspective Zhao Huang
Chapter 8 General discussion and guidelines development 225
To indicate the requirements of data entry on
every page where possible
To prevent errors
To clarify data entry fields for
completing correct data
To present a warning message if users are
making a potentially serious error
To make sure that users complete
appropriate information
6. Recognition rather than
recall
To locate key information/subject in a central
position on every page
To make information/subject easy to
recognise and identify
To decrease cognitive load on users
To offer clear and brief prompts for choices
explanation
To support site orientation
To increase users‟ understanding of menu
choices
To appropriately use breathing space in text
areas
To help users in text readability
7. Flexibility and efficiency
of use
To ensure that all links are accessible, and link
to relevant information
To reduce the barriers to information
connection
To provide detailed information in multiple
options levels
To make sub options easy to understand
and identify
To arrange search results according to level of
relevance
To visually display the level of relevance
To make searching items quickly
identified
To reduce memory load problems
To provide shortcuts or quick links for highly
frequent usage tasks
To cater for quick tasks interaction
To match menu structure with task structure
within the site
To navigate users‟ movement to achieve
tasks
8. Aesthetic and minimalist
design
To apply clear, simple and meaningful images
within corresponding text
To make images easily understandable
for users
To present content in an uncluttered manner To increase content readability
To mark visited links To distinguish between visited and
unvisited places
To provide links with different colours To recognise resources differences
To offer an appropriate number of link colours To reduce unnecessary colours
distraction
To use appropriate white space to separate
information groups, and create symmetry in
content display
To lead users‟ eyes in the appropriate
direction on subject content
9. Help users recognize,
diagnose and recover from
errors
To present clear error messages to suggest
further actions
To recover from errors
To show meaningful, constructive and
unambiguous error messages
To effectively deliver the causes of the
problems to users
To mark compulsory and optional data entry
fields
To prevent missing data
To highlight an error in particular field without
changing other original data
To attract users‟ attention on an error
To avoid retyping information
10. Help and documentation To give guidance in clear and simple language To make help information easily
understandable for users
To provide a quick online help access on every
page where possible
To always locate help in a fixed position on
pages
To ensure that users can easily find
online help whenever they need
To make online help access easily
identified

Usability and credibility evaluation of electronic governments: users‟ perspective Zhao Huang
Chapter 8 General discussion and guidelines development 226
To provide online help instruction covering a
wider range of guidance and advices
To increase problem solving capability
To open a separated window to present online
help information
To allow users to easily switch between
online help and current work
11. Interoperability To increase collaboration ability to understand
the abbreviations, codes and formats used
To support tasks completion
To define standard communication protocols To support information and services
exchange
To ensure that different displays on each page
are compatible
To make attractive site for users
12. Support and extend
users‟ skills
To make subject options stand out on each
page
To make the key options highly visible
To present the most important content at the
beginning of the paragraph
To make information quick to understand
and identify
To make forward and backward functions
available in all fields of e-governments
To increase control of movement around
the site
13. Pleasurable and
respectful interaction with
users
To offer relevant images with text To keep enjoyable interaction with
information presentation
To make text short
To write information in clear and simple
language
To make content easy to read
To provide accessibility options and
consistently indicate it on every page
To increase the quality of interaction
Usability and credibility evaluation of electronic governments: users‟ perspective Zhao Huang
Chapter 8 General discussion and guidelines development 227
8.3.2 Credibility guidelines development
Credibility guideline 1: Since the overall impression builds the initial credibility,
therefore e-government websites should be designed in a clean and professional
layout that fits with its purpose of giving a good first impression.
When users access the site, content is the focus of users‟ attention. Indeed, users first
look at the main content area of the page and judge what the page is about. Therefore,
in order to make quality content for users, content displayed on e-government
websites should match with information users expect to obtain from a local council.
During information searching, users need to clearly identify relevant information
among a number of subject options. In order to distinguish information between
subject options, colour should be used to group related information.
When following the links to locate objects across pages, users need consistent layout,
strengthening visual subject recognition and reducing content clutter. Consequently,
in order to establish the unity throughout the site and support information
identification, e-government websites should use consistent colours in information
presentation.
Users use subject categories to narrow down subject topics for searching purposes. In
order to support quick and accurate information identification, information should be
logically categorised into subject groups and distinctly presented.
The indication of the relationship between pages is required by users in information
processing. Therefore, in order to clearly distinguish pages relationship, e-government
websites should visually label every page on the site.
Credibility guideline 2: E-government websites should make information accuracy
and easy to verify.

Usability and credibility evaluation of electronic governments: users‟ perspective Zhao Huang
Chapter 8 General discussion and guidelines development 228
While reading information across pages, in order to make information easily
understandable by users, e-government websites should present information at the
right level of detail on each page.
E-government websites should provide third party references to support information
presented and prove that information comes from a trusted source.
Among subject arrangement, users require a sequence of information organization to
support quick subject searching. Therefore, in order to allow users to easily scan and
locate the relevant subject among a number of subject options, subject options should
be arranged in a logical order, for example, an alphabetical order.
The category name is the first thing users look at before they choose information. It
enables information selection to meet the target subject. Accordingly, in order to
locate appropriate subject information, it is necessary to provide the category name
that matches with information presented in a page.
Users can use the URL as a visual reference to decipher information source. They
need comprehensible URLs to verify information location. Therefore, in order to
make the URL more easily understandable by users, e-governments should use
common natural language words to present the URL, indicating the protocol
specification and the domain name.
Credibility guideline 3: E-government websites should provide information to prove
that the government organization is real and legitimate, for example, detailed
government background and clear contact details.
Users are encouraged to contact the e-government organisation to obtain timely
responses to their questions. Therefore, in order to meet users contact needs, multiple
contact methods should appear on every page of e-government websites.
E-governments need to show the real people working behind the site, who convey
their trust through images and text. As such, the role of users and staff in e-

Usability and credibility evaluation of electronic governments: users‟ perspective Zhao Huang
Chapter 8 General discussion and guidelines development 229
government services should be described in online documentation, names and images
of people who supply the services should be presented on the site.
Furthermore, in order to advertise e-governments credits and recognition, e-
government should make references to other governmental bodies by providing links
and listing logos on the site.
Credibility guideline 4: E-government websites should highlight their organisational
expertise in the content and services provided.
Service policies are important whenever information is being collected about users‟
services. In order to make service policies readily understandable and increase trust,
e-government should specify service policies information at a detailed level.
Users prefer information presented with legitimacy. In particular, information needs
to convey a sense of authority. In order to make reliable information for users, e-
government should provide precise, detailed and honest information with source
references and dates whenever possible.
During interaction with e-government services, users need messages/prompts to help
them complete the services. Therefore, in order to allow messages/prompts to be
readily understood for users, messages/prompts displayed should be complete and
concise.
Credibility guideline 5: E-government websites should show that there are honest,
trustworthy people working behind the site.
E-government needs to introduce itself to improve users‟ understanding. Therefore, in
order to make such introduction information available for users, there is a need to
provide clear links; for example an “About us” page to present information in terms of
political balance, major committees and government services.

Usability and credibility evaluation of electronic governments: users‟ perspective Zhao Huang
Chapter 8 General discussion and guidelines development 230
In addition, presenting e-government‟s credentials can increase users‟ trust. Therefore,
e-government websites should make references by showing any awards that the
organization has earned, or listing credits from government partners.
Moreover, users need to be aware of the people who work behind e-government to
provide information and services. Therefore, in order to enhance staff recognition, e-
government websites should provide as detailed as possible description for staff, with
standard photos.
Credibility guideline 6: E-government websites should provide contact details to give
the impression that there are people available to help queries.
During interaction, users are warmly welcomed to contact e-governments whenever
they need. Therefore, in order to make contact information easy to identify, a quick
contact option should always be presented and in a fixed position on every page.
Moreover, in order to make contact information convenient for users, e-government
should provide multiple types of contact information, such as address, phone, email
and feedback forms.
When users look for detailed contact information, there is a need to help them quickly
locate the relevant information. Therefore, in order to make contact information easy
to identify, detailed contact information should be arranged in a logical order on the
site, for example, organising contact information by different departments.
Credibility guideline 7: E-government websites should provide a friendly interface
that is easy to use and help users to complete their tasks.
When users conduct their specific tasks, they can develop their own way to complete
the task. Therefore, in order to make the site easy to use, e-government websites
should provide multiple functions to support users‟ tasks completion, such as quick
links, services directories and a search engine.

Usability and credibility evaluation of electronic governments: users‟ perspective Zhao Huang
Chapter 8 General discussion and guidelines development 231
While interacting with e-government, users need to identify their current location in a
services process. Therefore, in order to keep users informed of their service position,
e-government should provide messages to indicate where the users are within the site.
In addition, during all tasks, in order to indicate to users how much remains to
complete, e-government websites should break down steps required to complete the
task, and highlight current steps completed in the process.
When using the search engine, the search results page should have a sorted list
showing the best hits at the top. Therefore, in order to make search results easy to
remember and locate, the search results should be organised by the level of relevance,
and such level of relevance should be visually indicated for users.
Credibility guideline heading 8: E-government websites should provide evidence that
the content on the site is timely.
Updated information is valuable to users and should be clearly indicated as current.
Therefore, in order to indicate that information and services provided on the e-
government website is maintained regularly and kept up-to-date, the site update date,
and information and services update date should be clearly presented through visual
cues on e-government websites.
Credibility guideline 9: E-government websites should show restraint with any
promotional content.
During information seeking, users need to focus their search on subject information.
Therefore, in order to maintain users‟ subject attention, the amount of promotional
content should be restrained.
In addition, in order to allow subject content to be easy to distinguish, promotional
content should be grouped and presented in non-important areas.
Credibility guideline 10: E-government websites should avoid all types of errors.

Usability and credibility evaluation of electronic governments: users‟ perspective Zhao Huang
Chapter 8 General discussion and guidelines development 232
When users fill in online forms, in order to reduce the likelihood of errors occurring,
e-government websites should provide proper instructions for users.
In addition, in order to support users‟ movement around the site to find the target
information, e-governments should ensure that all links on the site can properly
connect to corresponding pages.
When users read information on every page, in order to prevent misunderstanding, e-
government websites should use clear, simple language without typographical errors.
Credibility guideline 11: E-governments should indicate government transparency
through the site.
An open e-government is required by users. In order to develop e-government
transparency, in-depth government information, such as public expenditure and
budgetary execution should be provided on an e-government website.
Additionally, users may be concerned with data protection and copyright policy when
they interact with e-governments. In order to make such information available for
users, e-government should provide a clear option linking terms and disclaimer
information.
After completing online services, users need to be informed about online transaction
confirmation. Therefore, in order to show that an online service has been completed,
e-government should send a clear confirmation message at the end of the process.
At every time during users‟ online services, users need to feel in control. In order to
allow users to check their action progress, e-government websites should clearly
indicate task status within services, using visual cues.
Credibility guideline 12: E-government websites should provide agile services to
support users’ tasks completion.

Usability and credibility evaluation of electronic governments: users‟ perspective Zhao Huang
Chapter 8 General discussion and guidelines development 233
Users have their own strategies for searching for information and to complete tasks on
e-government websites. In order to meet the different requirements of users, all
functions of e-government websites should work as a whole to support users to work
at their own pace.
In addition, users select categories and subcategories to find the target information. In
order to allow users to identify relationships among categories, information should be
organised in a hierarchical way that matches with users‟ searching structures.
Furthermore, in order to avoid users getting stuck on e-government services, an e-
government website should show the way out for users to exit the services at any time.
Credibility guideline 13: E-governments should protect users’ privacy and services
security.
At every point when users interact with personal services and information, their
services need to be protected. Accordingly, in order to ensure that protected areas are
secure, e-government websites should provide password allocation mechanisms for
users‟ authentication.
During information transaction, users can be concerned about whether their personal
information is treated safely. Thus, in order to make transaction processes
understandable for users, e-government websites should show a data protection
message before transferring data.
In order to protect confidential information, a warning message should be presented
on e-government sites if users are allowed to access confidential services.

Usability and credibility evaluation of electronic governments: users‟ perspective Zhao Huang
Chapter 8 General discussion and guidelines development 234
Table 8.2 Summary of credibility guidelines
Credibility guideline heading Design consideration Interpretation
1. Site looks professional To display content that matches with
information users expect to obtain from a local
council
To make quality content for users
To employ colours to group related
information
To distinguish information among subject
options
To use consistent colours in information
presentation
To build unity through the site to support
information identification
To logically categorise information into
subjects group and distinctly present
To support quick and accurate
information identification
To visually label every page where possible To clearly distinguish pages relationship
2. Easy to verify the
information accuracy
To present information at the right level of
detail on every page
To make information easily
understandable for users
To provide third part references To support information source authority
To arrange subject options in an alphabetical
order
To make users to easily scan and locate
the relevant subject
To provide the category name that matches
with information presented in a page
To locate appropriate subject information
To use common natural language words to
present the URL
To make URL easily understandable for
users
3. Show a real organization
behind site
To show multiple contact methods on every
page
To meet users contact needs
To describe the role of users and staff
To present staffs‟ names and images
To show the real people working behind
the site
To make references to other governmental
bodies by providing links and listing logos
To advertise e-governments credits and
recognition
4. Highlight the expertise in
your organization and in the
content and services
provided
To specify services policies information at a
detailed level
To make service policies readily
understandable
To increase trust
To provide precise, detailed and truthful
information with source references and dates
To make reliable information for users
To display messages/prompts in completeness
and conciseness
To allow messages/prompts to be readily
understood
5. Show honest and
trustworthy people behind
your site
To provide “About us” information To make introduction information
available for user
To make references to other government
agencies
To display any awards earned by the
organization
To form users‟ trust
To provide detailed staff information with
proper photographs
To enhance staff recognition
6. Make it easy to contact the
e-government
To offer a quick contact option on every page To make contact information easy to
identify
To provide multiple types of contact To make contact information convenient
for users

Usability and credibility evaluation of electronic governments: users‟ perspective
Zhao Huang
Chapter 8 General discussion and guidelines development 235
To organise contact information by different
departments
To make contact information easy to
identify
7. Make site easy to use and
useful
To provide multiple functions to support users‟
tasks completion
To make site easy to use
To provide messages to indicate where users
are within the site
To keep users informed of their service
position
To break down steps required to complete
tasks
To highlight current step completed in the
process
To indicate to users how much remains to
complete
To arrange search results in the level of
relevance
To visually present the level of relevance
To make search results easy to remember
and locate
8. Update site‟s content often To indicate site update date
To present information and services update
date
To support users to judge
information/services quality
9. Use restraint with any
promotional content
To limit the number of promotional content To maintain users‟ subject attention
To present promotional content in non-
important areas
To allow subject content easy to
distinguish
10. Avoid errors of all types To provide proper instructions for users To reduce the likelihood of errors
occurring
To ensure that all links properly connect to
corresponding pages
To support users‟ movement to find
target information
To use clear, simple language without
typographical errors
To prevent misunderstanding for users
11. Transparency To provide in-depth government information To develop e-government transparency
To provide a clear option linking terms and
disclaimer information
To make data protection and copyright
policy information available for users
To send a clear confirmation message at the
end of the process
To confirm that an online service has
been finished
To indicate task status using visual cues To allow users to check their action
progress
12. Service agility To ensure that all functions of e-government
work as a whole
To meet the different requirements of
users
To organise information in a hierarchical way To identify relationships among
categories
To show the way out for users to exit the
services at all times
To avoid users getting stuck on e-
government services
13. Privacy and security To provide password allocation mechanism for
users‟ authentication
To ensure that protected areas are secure
To indicate a data protection message before
transferring data
To make transaction processes
understandable for users
To present a warning message if users are
allowed to access confidential services
To protect confidential information

Usability and credibility evaluation of electronic governments: users‟ perspective Zhao Huang
Chapter 8 General discussion and guidelines development 236
8.4 Practical issues in guidelines implementation
Furthermore, in order to address their validity, the usability and credibility guidelines
have been reviewed by three professionals who are working in one of the local
authorities (one person is an e-government website senior designer; two of them are e-
government developers). Their feedback indicates that the guidelines are clear,
specific, understandable and applicable. They cover a range of usability and
credibility features in relation to e-government website design and are useful and
helpful. Therefore, it is possible that they could apply these guidelines to e-
government website evaluation in the real world.
However, in order to implement these usability and credibility guidelines successfully,
there are some aspects that need to be considered. Firstly, senior members of the
organisation, such as senior managers or senior designers responsible for e-
government, need to develop a sound plan, in which user-centred design is critical. In
other words, users need to be involved in e-government development. Secondly, when
the guidelines are used for designing a new e-government website, designers need to
present and explain these guidelines to users at the detailed level and ask users to
check whether these guidelines can meet their usability and credibility requirements.
Designers should carefully consider users‟ comments and feedback and address the
particular needs of the guidelines in the e-government website design. In this way, it
can reflect the utility of these guidelines as flexible references. Thirdly, in the process
of e-government website design, if the specific design elements conflict with each
other, for example, the design element that information should be organised in a
hierarchical way that matches with users‟ searching structure might contradict with
users having their own strategies for searching for information. In other words, it is
impossible to get a structure that matches with all users. In this way, designers should
consider the circumstances under which the specific design feature should be followed.
In addition, a balance must be found between obligatory design features and providing
an adequate amount of flexible design features for designers. Furthermore, designers
should use their previous experience or good examples to judge the specific design
needs. Fourthly, when the guidelines are used for evaluating an existing e-government
website, the evaluation results can generate two design options. One is to produce a

Usability and credibility evaluation of electronic governments: users‟ perspective Zhao Huang
Chapter 8 General discussion and guidelines development 237
new e-government website and another one is to redesign the e-government website
based on the existing e-government website. The final decision mainly depends upon
the number of problems detected. When producing a new website, designers can
develop an initial prototype to address all the problems found in the existing e-
government website and carry out a heuristic evaluation and performance measure of
the initial prototype. The results can be used to improve the initial prototype. If
finance allows, this improvement can be conducted as an interactive process until a
refined website design is achieved.
8.5 Summary and conclusion
This chapter provides a general discussion of the results from experiment 1 and
experiment 2. The results from experiment 1 indicate a number of usability and
credibility problems that have been identified in the target e-government websites,
and these usability and credibility problems influence users‟ interaction. Based on the
findings, it suggests that usability and credibility have not been paid enough attention
in e-government development. Therefore, it has been argued that there is much room
to improve usability and credibility of the target e-government websites. To improve
the identified usability and credibility problems, the proposed design solutions are
provided and examined in experiment 2. The results from experiment 2 imply that the
usability and credibility problems have been improved by the proposed design
solutions. Such improvements suggest the increase of the overall usability and
credibility of the target e-government websites, which in turn, makes it better for
users‟ performance with these e-government websites evaluated.
Based on the analysis of the findings from the two experiments, a set of usability
guidelines and a set of credibility guidelines are developed to guide designers in e-
government website design. These guidelines can help effective e-government
website design, by addressing usability and credibility combinations at the detailed
level. In addition, these guidelines can also be used to help designers in evaluating
usability and credibility of existing e-government websites, based on whether the

Usability and credibility evaluation of electronic governments: users‟ perspective Zhao Huang
Chapter 8 General discussion and guidelines development 238
website design meets these guidelines, with the final goal being to develop more
usable and credible e-governments.
Usability and credibility evaluation of electronic governments: users‟ perspective Zhao Huang
Chapter 9 Conclusions 239
CHAPTER 9
CONCLUSIONS
9.1 Introduction
This research aims to evaluate the usability and credibility of current e-governments,
focusing on specific e-government websites in the UK. To accomplish this aim, this
research employs heuristic evaluation and performance measurement to identify
usability and credibility problems in existing e-governments and provide design
solutions to improve the identified problems. The purpose of this chapter is to
summarise this research, which is structured as follows: section 9.2 reflects the overall
ideas of the thesis. Section 9.3 reviews the research questions set in Chapter 1. Then,
the contributions of the research are presented in section 9.4 and section 9.5 discusses
the limitations and reflection on the research. Finally, potential future studies are
suggested in section 9.6.
9.2 Research summary
With the rapid development of the Internet and web technology, e-government is
becoming more widespread in the public sector and makes significant attempts to
deliver government information and services to users. Users have increasingly been
able to interact with e-governments by searching for government information and
accessing government services without time and space limitations. However, e-
government is still facing the challenge of generating greater users‟ interaction in
terms of accessing information, utilizing services and participating in e-government
decision making. Evidence from relevant research indicates that users‟ acceptance and
adoption of e-governments can be significantly influenced by whether e-governments
have sufficiently demonstrated their usability and credibility. In other words, usability
and credibility are therefore considered as two important factors in determining e-
government success, which needs to be explored.

Usability and credibility evaluation of electronic governments: users‟ perspective Zhao Huang
Chapter 9 Conclusions 240
Given that the website is the interface for a specific e-government (whether national
or local level), this can now be seen as the main channel for demonstrating usability
and credibility. As such, this research has evaluated usability and credibility of current
e-government websites. After an initial literature review and background study, the
study has adopted heuristic evaluation, which is based on users‟ perception, to
implement a thorough and in-depth assessment of e-government websites. In addition,
to obtain a more comprehensive evaluation, users‟ performance has measured in order
to reveal the level of users‟ interaction with e-government websites when they
perform a set of practical tasks. The research design was a quasi-experimental,
consisting of two linked experiments. Experiment 1 has evaluated the usability and
credibility of the target e-government websites, identifying the existing usability and
credibility problems. Experiment 2 has examined the effects of the proposed design
solutions on the usability and credibility problems identified on the redesigned e-
government websites. The research findings imply that usability and credibility have
not been addressed at the detailed level of e-government website design. Moreover, it
suggests that current e-government websites need to improve their usability and
credibility. The improvements in usability and credibility may affect users‟ attitudes,
which in turn, can lead to better interaction with e-governments. Therefore, usability
and credibility are two important factors influencing users‟ interaction with e-
government. In other words, it is important to ensure that usability and credibility of
e-government meets the requirements of different users, so that users‟ engagement
with e-government may be promoted. To achieve this goal, this research focuses on
the users‟ perspective, which can help to understand the usability and credibility
requirements of users, clearly identify existing usability and credibility problems that
cause concern and effectively improve the identified usability and credibility
problems. In this way, it can provide concrete prescriptions for developing more user-
centred e-government that may meet different users‟ requirements and support users
achieving the desired services outcome and so generate greater users‟ participation.
Furthermore, this study has extended Nielsen‟s set of usability heuristics and Fogg‟s
set of credibility guidelines, which can be useful for assessing e-government usability
and credibility. Meanwhile, the study has developed a set of guidelines, containing a
number of detailed design features in relation to usability and credibility for e-
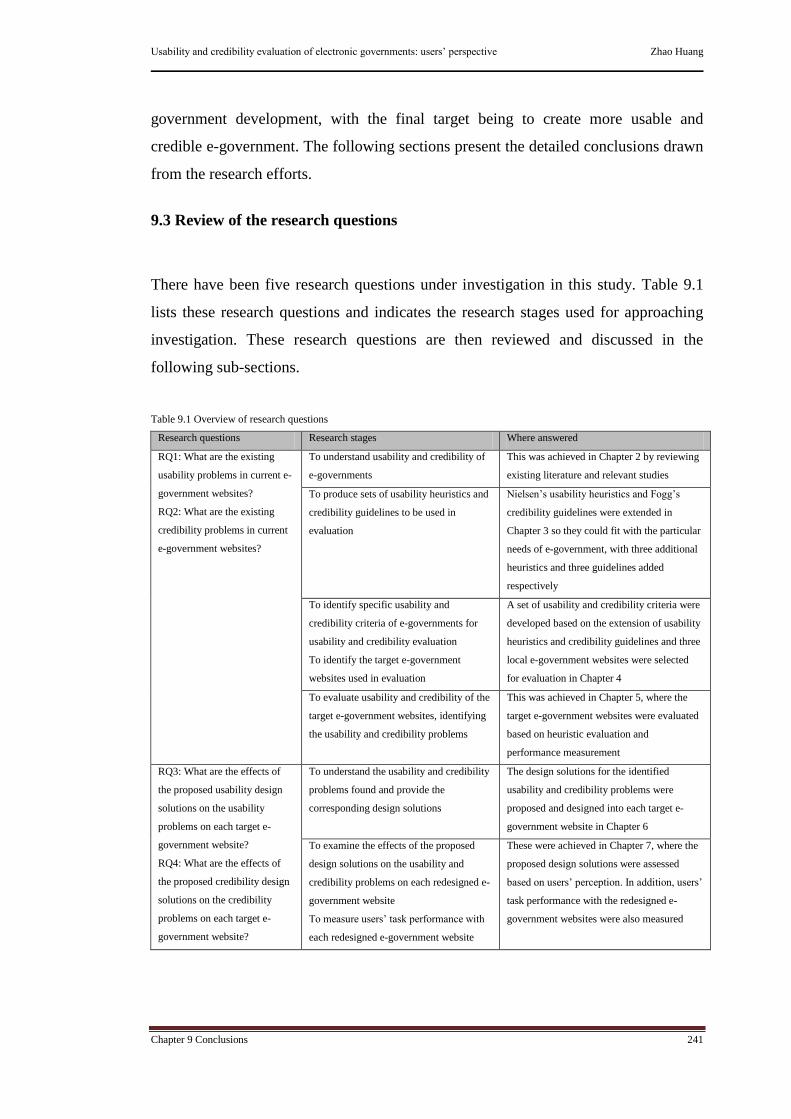
Usability and credibility evaluation of electronic governments: users‟ perspective Zhao Huang
Chapter 9 Conclusions 241
government development, with the final target being to create more usable and
credible e-government. The following sections present the detailed conclusions drawn
from the research efforts.
9.3 Review of the research questions
There have been five research questions under investigation in this study. Table 9.1
lists these research questions and indicates the research stages used for approaching
investigation. These research questions are then reviewed and discussed in the
following sub-sections.
Table 9.1 Overview of research questions
Research questions Research stages Where answered
RQ1: What are the existing
usability problems in current e-
government websites?
RQ2: What are the existing
credibility problems in current
e-government websites?
To understand usability and credibility of
e-governments
This was achieved in Chapter 2 by reviewing
existing literature and relevant studies
To produce sets of usability heuristics and
credibility guidelines to be used in
evaluation
Nielsen‟s usability heuristics and Fogg‟s
credibility guidelines were extended in
Chapter 3 so they could fit with the particular
needs of e-government, with three additional
heuristics and three guidelines added
respectively
To identify specific usability and
credibility criteria of e-governments for
usability and credibility evaluation
To identify the target e-government
websites used in evaluation
A set of usability and credibility criteria were
developed based on the extension of usability
heuristics and credibility guidelines and three
local e-government websites were selected
for evaluation in Chapter 4
To evaluate usability and credibility of the
target e-government websites, identifying
the usability and credibility problems
This was achieved in Chapter 5, where the
target e-government websites were evaluated
based on heuristic evaluation and
performance measurement
RQ3: What are the effects of
the proposed usability design
solutions on the usability
problems on each target e-
government website?
RQ4: What are the effects of
the proposed credibility design
solutions on the credibility
problems on each target e-
government website?
To understand the usability and credibility
problems found and provide the
corresponding design solutions
The design solutions for the identified
usability and credibility problems were
proposed and designed into each target e-
government website in Chapter 6
To examine the effects of the proposed
design solutions on the usability and
credibility problems on each redesigned e-
government website
To measure users‟ task performance with
each redesigned e-government website
These were achieved in Chapter 7, where the
proposed design solutions were assessed
based on users‟ perception. In addition, users‟
task performance with the redesigned e-
government websites were also measured
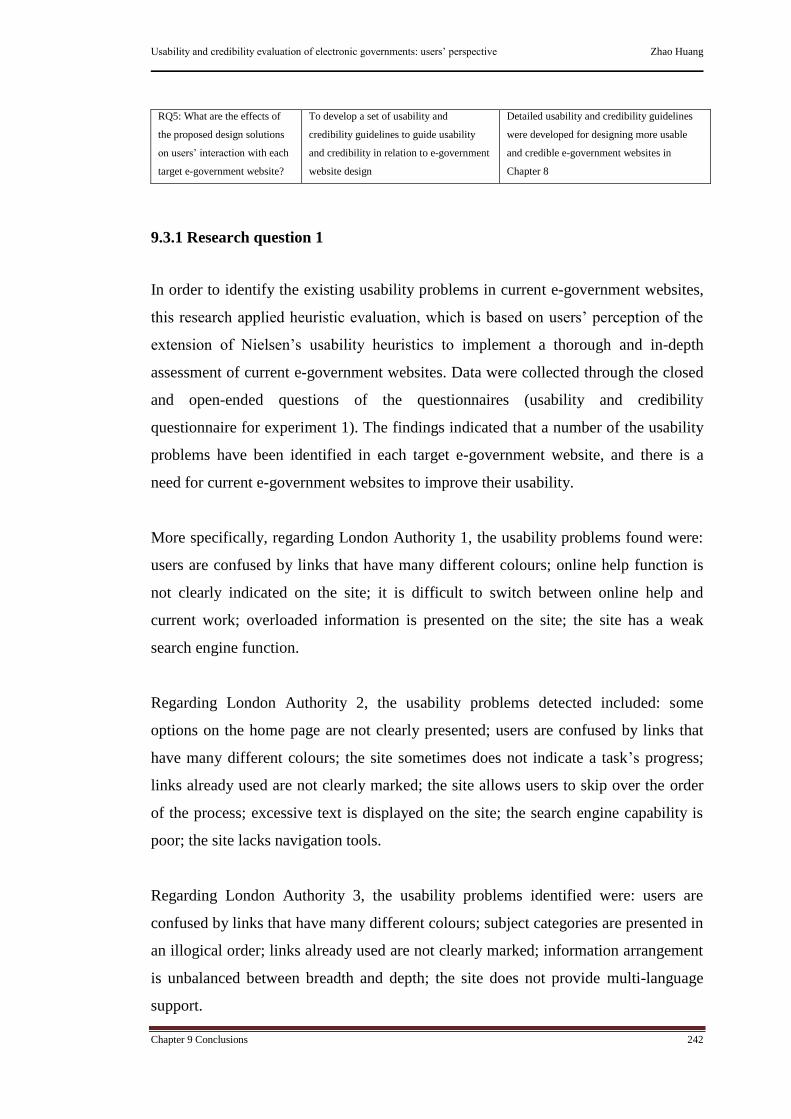
Usability and credibility evaluation of electronic governments: users‟ perspective Zhao Huang
Chapter 9 Conclusions 242
RQ5: What are the effects of
the proposed design solutions
on users‟ interaction with each
target e-government website?
To develop a set of usability and
credibility guidelines to guide usability
and credibility in relation to e-government
website design
Detailed usability and credibility guidelines
were developed for designing more usable
and credible e-government websites in
Chapter 8
9.3.1 Research question 1
In order to identify the existing usability problems in current e-government websites,
this research applied heuristic evaluation, which is based on users‟ perception of the
extension of Nielsen‟s usability heuristics to implement a thorough and in-depth
assessment of current e-government websites. Data were collected through the closed
and open-ended questions of the questionnaires (usability and credibility
questionnaire for experiment 1). The findings indicated that a number of the usability
problems have been identified in each target e-government website, and there is a
need for current e-government websites to improve their usability.
More specifically, regarding London Authority 1, the usability problems found were:
users are confused by links that have many different colours; online help function is
not clearly indicated on the site; it is difficult to switch between online help and
current work; overloaded information is presented on the site; the site has a weak
search engine function.
Regarding London Authority 2, the usability problems detected included: some
options on the home page are not clearly presented; users are confused by links that
have many different colours; the site sometimes does not indicate a task‟s progress;
links already used are not clearly marked; the site allows users to skip over the order
of the process; excessive text is displayed on the site; the search engine capability is
poor; the site lacks navigation tools.
Regarding London Authority 3, the usability problems identified were: users are
confused by links that have many different colours; subject categories are presented in
an illogical order; links already used are not clearly marked; information arrangement
is unbalanced between breadth and depth; the site does not provide multi-language
support.
Usability and credibility evaluation of electronic governments: users‟ perspective Zhao Huang
Chapter 9 Conclusions 243
9.3.2 Research question 2
In order to detect the credibility problems, heuristic evaluation is also conducted,
which is based on users‟ perception of the extension of Fogg‟s credibility guidelines
to assess credibility of the target e-government websites. Data was obtained through
the closed and open-ended questions of the questionnaires (usability and credibility
questionnaire for experiment 1). The findings found a number of the credibility
problems in each target e-government website, which suggests that current e-
governments have not paid enough attention to credibility in relation to their website
design.
In detail, with respect to London Authority 1, the credibility problems found were:
information is presented without consistent colours; the site lacks of images.
Regarding London Authority 2, the credibility problems identified were: search
results are not organised by the level of relevance; content is displayed without
consistent layout; there is no security message when users access some confidential
information; there are too many categories options presented on some pages.
Regarding London Authority 3, the credibility problems detected included: detailed
contact information has not been organised by different departments of the council;
awards, it is difficult to see the site‟s credentials, the site does not provide a shortcut
option to access information about the local council, there is no clear secure message
when users access some confidential information; it is not clear to see how much
users have completed and how much remains when completing tasks; the information
about the site update is not clearly presented; it is difficult to see a log-in option when
users conduct some personal services; the site does not provide service feedback for
users.

Usability and credibility evaluation of electronic governments: users‟ perspective Zhao Huang
Chapter 9 Conclusions 244
9.3.3 Research question 3
In order to examine the effects of the proposed design solutions on the usability
problems on each target e-government website, data was gathered by the closed and
open-ended questions of the questionnaires (usability and credibility questionnaire for
experiment 2). The results indicated that the proposed design solutions have improved
the usability problems found in experiment 1 on each redesigned e-government
website.
In detail, regarding the redesigned London Authority 1, users‟ perception of the
usability problems (including links with many different colours, difficulty of finding
the online help function, difficulty of switching between online help and current work)
had been significantly alleviated after the proposed design solutions had been applied
to the redesigned e-government website. In addition, users‟ feedback from the open-
ended questions also revealed their positive attitude towards the improved usability
features.
Regarding the redesigned London Authority 2, users‟ perception of the usability
problems (including vague options presentation on the home page, links with many
different colours, absence of task progress indication, difficult recognition of visited
links, skipping over the order of the process) had been significantly improved in
experiment 2. Moreover, users‟ positive feedback obtained from the open-ended
questions of the questionnaire addressed the usefulness of the redesigned usability
features.
Regarding the redesigned London Authority 3, users‟ perception of the usability
problems (including links with many different colours, subject categories arrangement
in an illogical order) had been also significantly alleviated after the proposed design
solutions had been implemented in experiment 2. Furthermore, the results from open-
ended questions also revealed users‟ positive feedback of the redesigned usability
features. However, although no significant difference was found between experiments
1 and 2 with regards to the usability features that visited links are not clearly marked
and users get lost due to being given too many choices over sequences, the results still

Usability and credibility evaluation of electronic governments: users‟ perspective Zhao Huang
Chapter 9 Conclusions 245
showed that the participants‟ assessments had been influenced after the design
solutions had been applied to the redesigned London Authority 3.
9.3.4 Research question 4
In order to examine the effects of the proposed design solutions on the credibility
problems on each target e-government website, data was collected through the closed
and open-ended questions of the questionnaires in experiment 2 (usability and
credibility questionnaire for experiment 2). The results indicated that there is a
significant difference in users‟ perception of the specific credibility features between
experiments 1 and 2. More specifically, regarding the redesigned London Authority 1,
users‟ perception of the credibility problem (information presentation without colour
consistency) was significantly alleviated after the proposed design solutions had been
applied to experiment 2. Regarding the redesigned London Authority 2, users‟
perception of the credibility problems (including search results without level of
relevance arrangement, information presentation without layout consistency, and no
security message presentation) were also significantly improved. Regarding the
redesigned London Authority 3, users‟ perception of the credibility problems
(including illogical detailed contact information arrangement, lack of the site‟s
credentials display, difficulty of finding the council information, absence of security
messages display, absence of task progress indication, difficulty of identifying site
update, absence of a sign-in option) were significantly alleviated after the proposed
design solutions had been implemented in experiment 2. Additionally, the results
from open-ended questions of the questionnaires also indicated users‟ positive
feedback about the improved credibility features in three redesigned e-government
websites. Therefore, it implies that the proposed design solutions improve the
credibility problems found in each redesigned e-government website.
9.3.5 Research question 5
In order to find out the effects of the proposed design solutions on users‟ interaction
with each redesigned e-government website, users‟ task performance with the

Usability and credibility evaluation of electronic governments: users‟ perspective Zhao Huang
Chapter 9 Conclusions 246
redesigned e-government websites was measured. The performance measurement
applied the same performance criteria used in experiment 1, which includes the
amount of online help required, time spent completing tasks, number of steps to finish
tasks and number of successful tasks completion. Data was collected through
observation. The findings revealed that users‟ interaction with each redesigned e-
government website in experiment 2 significantly differ from their interaction with the
target e-government websites in experiment 1.
Within each redesigned London Authority, the findings indicated that users‟
performance in terms of time spent completing all tasks, and number of steps used for
all tasks completion in experiment 2 is better than their performance in experiment 1.
In detail, the participants in experiment 2 took less time to complete the tasks than
experiment 1. In addition, the participants took fewer steps to finish all tasks in
experiment 2 than experiment 1. However, although a significant difference in users‟
performance in terms of the amount of online help required and number of successful
tasks completion was not found between experiments 1 and 2, the results still showed
that the participants in experiment 2 required less online help to complete all the tasks
than those in experiment 1. Similarly, the participants in experiment 2 completed
more tasks successfully than those in experiment 1. Therefore, this implies that users‟
interaction with each redesigned e-government website is enhanced after the proposed
design solutions have been implemented in experiment 2.
9.4 Research contributions
This research has evaluated the usability and credibility of current e-government
websites in the UK. The evaluation has found a number of usability and credibility
problems in the target e-government websites. Based on the problems identified, the
research has provided the proposed design solutions to improve usability and
credibility. The results indicate that the proposed design solutions have improved the
usability and credibility problems. These improvements may increase the overall
usability and credibility of the target e-government websites, which can result in
better users‟ interaction with the e-government websites. According to these research

Usability and credibility evaluation of electronic governments: users‟ perspective Zhao Huang
Chapter 9 Conclusions 247
findings, it demonstrates the importance of the usability and credibility to e-
government. In addition, it raises the issues that usability and credibility have not
been considered in sufficient detail to inform e-government websites design.
Moreover, it also suggests that current e-government websites need to improve their
usability and credibility. In this context, this research has developed a set of usability
and credibility guidelines for developing more usable and credible e-government
websites. Therefore, this study has made contributions in two areas of knowledge.
They are knowledge about usability and credibility and knowledge about e-
government website development.
9.4.1 Contribution to knowledge about usability and credibility
The contribution to knowledge about usability and credibility is indicated by the
following four aspects. Firstly, this study has deepened understanding of usability and
credibility concepts within an e-government context. Although the importance of
usability to e-government has been suggested in existing literature (e.g. Baker, 2009;
Henriksson et al., 2007; Kossak et al., 2001; Magoutas et al., 2010; Schedler and
Summermatter, 2007), and credibility has been indicated in terms of government
information (e.g. Tolbert and Mossberger, 2003; Welch and Hinnant, 2003) and
government services provision (e.g. Bélanger and Carter, 2008; Horst et al., 2007;
Warkentin et al., 2002), there is inconclusive evidence as to the usability and
credibility investigation of e-government, especially with regards to e-government
website design. This study has focused on specific aspects of usability and credibility
relating to design features of e-government websites. Moreover, in order to meet the
particular requirements of e-government, this study has extended the usability concept
by adding extra factors: “interoperability”; “support and extend users‟ skills”;
“pleasurable and respectful interaction with users”, and expanded the credibility
concept by deriving additional factors: “transparency”; “service agility”; and “privacy
and security”. Such usability and credibility extension provides a deeper
understanding about the usability and credibility in e-government environment.
Secondly, this study investigates e-government usability and credibility from the
users‟ perspective, focusing on users‟ perception and performance. By focusing on

Usability and credibility evaluation of electronic governments: users‟ perspective Zhao Huang
Chapter 9 Conclusions 248
users‟ perception and performance, it can directly identify what e-government features
can cause users to have most concerns about usability and credibility, and clearly
indicate the level of users‟ interaction with the target e-governments. Such user
involvement can provide better understanding of users‟ requirements of usability and
credibility. More specifically, with better improvement of usability from the users‟
viewpoint, users are more satisfied by their interaction with e-government websites
and can more easily and effectively accomplish what they want to do on the e-
government websites. With better enhancement of credibility based on users‟
requirements, users are more sure that the e-government website is current and a
legitimate site that they can trust, and can more confidently participate in e-
government services.
Thirdly, this study provides empirical evidence that there is a close relationship
between users‟ perception of usability and credibility and their performance. In other
words, users‟ perception of usability and credibility positively influence users‟
performance when they perform a set of practical tasks on e-government websites. In
existing literature, studies have revealed the influence of usability to users‟ perception
and satisfaction (e.g. Hornbæk, 2006). Equally, other studies have examined the effect
of credibility on users‟ attitude (e.g. Tormala et al., 2006). However, there is a lack of
empirical evidence as to whether users‟ perception of usability and credibility
influence their task performance. The results of this study have confirmed previous
findings and have also shown that users‟ performance may not only be influenced by
the overall perception of usability and credibility, but also affected by the particular
perception of usability and credibility, such as how professional the site looks.
Additionally, the results also imply that with increase usability and credibility of e-
government websites, users‟ task performance is promoted. Thus, it strengthens the
understanding that usability and credibility are crucial factors influencing users‟
performance.
Fourthly, this study has empirically indicated the relevant importance between
usability and credibility. Usability and credibility are factors that are frequently
considered in the literature on computer-based system studies. Some studies
suggested that improving usability is very likely to enhance credibility (Fogg et al.,

Usability and credibility evaluation of electronic governments: users‟ perspective Zhao Huang
Chapter 9 Conclusions 249
2001). Some studies indicated that increased credibility can significantly strengthen
usability (Nielsen, 2000). However, there is a lack of empirical evidence as to their
relevant importance. This study has empirically provided evidence to indicate a close
correlation between usability and credibility. The findings have revealed that better
overall usability of the target e-government website is associated with better overall
credibility, and vice versa. Equally, lowest overall usability of the target e-
government website is associated with lowest overall credibility, and vice versa. Such
findings suggest that usability and credibility have mutual influence, which needs to
be considered together in e-government development.
9.4.2 Contribution to knowledge about e-government website development
Another important contribution of this study is to knowledge about e-government
website development. This research has developed a set of usability and credibility
guidelines, addressing the detailed design considerations from users‟ perspective.
These guidelines can help designers to understand users and their usability and
credibility needs. In particular, each guideline covers a number of the specific design
features, which can provide designers with concrete usability and credibility guidance
when they design e-government websites. Furthermore, these guidelines can also be
used to support designers in evaluating whether or not a current e-government website
is desirable based on whether the site design features meet these guidelines. In
existing literature, some usability guidelines have been developed for interface design
(e.g. Gerhardt-Powals, 1996; Henninger, 2000), and some credibility guidelines are
available for general website development (e.g. Fogg and Tseng, 1999a). However,
there are no specific guidelines to fit with the particular needs of e-government for
designing or assessing its usability and credibility, especially for e-government
website. As e-government shows rapid growth in the public sector, and usability and
credibility have been increasingly recognised as the prominent factors in determining
users‟ engagement with e-government, empirically based usability and credibility
guidelines are vitally needed to support designers in designing, evaluating and
improving e-government websites. In this aspect, a set of usability and credibility
guidelines, addressing users‟ requirements provide designers with supportive

Usability and credibility evaluation of electronic governments: users‟ perspective Zhao Huang
Chapter 9 Conclusions 250
guidance to develop e-government websites. The final goal is to develop more usable
and credible e-government that can meet users‟ needs and increase their participation.
Furthermore, this study has found a number of specific usability and credibility
problems in existing e-government websites. More specifically, the usability problems
identified are within the area of “aesthetic and minimalist design”; “help and
documentation”; “recognition rather than recall”; “match between system and the real
world”; “error prevention”; “flexibility and efficiency of use”. Furthermore, the
credibility problems are found to lie in the boundaries of “site looks professional”;
“make site easy to use and useful”; “privacy and security”; “make it easy to contact”;
“show the honest and trustworthy people behind the site”; “update site‟s content”. The
detailed usability and credibility problems identified in these areas can be directly
used by designers to focus attention on specific features of e-government websites,
and further enhance the usability and credibility of their existing e-governments.
9.5 Limitations of the research
There are some limitations of this research, which are discussed in this section. These
limitations include effects of evaluation of knowledge, usability and credibility
evaluation criteria identification, e-government website selection and the redesigned
e-government websites.
The first limitation of the research is that the participants have different knowledge of
evaluation and of e-government websites, which may influence their evaluation
outcomes. Although the research provides the participants with a clear explanation of
purpose, and the participants understand their specific tasks in the evaluation, the
results indicated that the participants had different capabilities to assess usability and
credibility. The participants who had a higher level of knowledge in terms of
evaluation and subject domain led to more comprehensive evaluation results.
Therefore, further research may provide participants with a short training in terms of
specific knowledge of subject domain, which may improve evaluation outcomes.

Usability and credibility evaluation of electronic governments: users‟ perspective Zhao Huang
Chapter 9 Conclusions 251
The second limitation concerns the usability and credibility evaluation criteria
identification. The process of selecting appropriate usability and credibility criteria
and grouping them into the associated usability heuristics and credibility guidelines
were based on the reviewed relevant studies. Some criteria might be found to relate to
more than one heuristic or guideline, however the study grouped these criteria into
one heuristic or guideline based on their key features.
The third limitation concerns the target e-government websites that were used to
measure usability and credibility in this experimental study. This study has selected
three e-government websites in the UK as the representative of e-government to
investigate their usability and credibility. Although the results provide an insight into
current e-government websites usability and credibility and give a good set of issues,
this study, choosing three target e-government websites, is a starting point. Further
work may be carried out with more distributed e-government websites to have a more
comprehensive evaluation.
The fourth limitation relates to the redesigned e-government websites used in
experiment 2. In order to examine the effects of the proposed design solutions on the
usability and credibility problems identified from the target e-government websites,
this research has redesigned the three target e-government websites according to the
proposed design solutions. Each redesigned e-government website was designed on
the basis of the corresponding target e-government website used in experiment 1,
retaining the same structure, layout and content. The main purposes of the redesigned
e-government websites were to provide rich information and services, support users‟
task performance and reflect the redesigned features. However, the redesigned e-
government websites did not include all the website pages from the target e-
government websites. This may affect users‟ general perception when users conduct a
free-flow inspection of the redesigned e-government websites.

Usability and credibility evaluation of electronic governments: users‟ perspective Zhao Huang
Chapter 9 Conclusions 252
9.6 Future research
The findings of the research and the reflection on the study‟s limitations suggest some
areas for future research. Firstly, future work may conduct further evaluations of e-
governments located by administrative regions, such as England, Wales, Scotland and
Northern Ireland. As the nature of these administrative regions are significantly
different, especially in terms of government organisation structure, institution and
information policies strategy, it is important to explore e-government development
within these administrative regions. The results may indicate unique characteristics of
e-government in the particular administrative regions, and such characteristics of e-
governments can be also comparatively analysed. The findings may be helpful to
increase understanding of e-government development across the UK and beneficial
for governments in different regions to learn from each other in order to develop more
effective e-governments.
Secondly, e-government has been applied worldwide. Future study may extend the
usability and credibility inspection of e-government websites across different nations
(allowing for social, political, cultural differences, etc.). The evaluation findings can
indicate usability and credibility development of e-governments in a variety of nations,
detecting their existing usability and credibility problems. These problems can be
used to compare the identified problems in the UK, which may help researchers
understand usability and credibility issues outside the UK. In addition, it can benefit
researchers to understand e-government usability and credibility within cultural
differences contexts.
Thirdly, a number of studies have revealed that individual differences, such as age,
gender, and prior experiences, affect users‟ perception of websites (Fogg et al., 2001).
Regarding e-government, Dwivedi and Williams (2008) also indicated that
demographic characteristics, including age, gender and education backgrounds
influence users‟ e-government adoption. This is also reflected in the study by
Choudrie and Ghinea (2005), which showed that users‟ perception of usability of e-
government websites has been affected by user age and education levels. It raises the
importance of individual differences in users‟ perception of e-government. Therefore,

Usability and credibility evaluation of electronic governments: users‟ perspective Zhao Huang
Chapter 9 Conclusions 253
it would be useful to carry out future research to investigate what are the effects of
individual differences on users‟ attitudes and perception towards usability and
credibility in e-government websites. Such findings will be valuable to develop
flexible e-government websites that can be accepted by and useful to a variety of
individuals.
Fourthly, this research has developed a set of usability and credibility guidelines for
improving usability and credibility of e-government websites. It is important to
further measure the efficiency of these guidelines usage in practice. Accordingly,
future studies may involve investigating the use of these usability and credibility
guidelines in terms of designing or evaluating e-government websites. In addition,
based on these guidelines, future studies may develop an evaluation framework for e-
government, especially focused on the interaction of usability and credibility. The
results can be helpful to achieve both a higher level of flexibility and reliability of
these guidelines and better and more engaging e-government websites.
Fifthly, this study has investigated usability and credibility of e-governments from the
users‟ perspective. Government organisations may have different opinions and
considerations of usability and credibility when developing the e-governments. It is
interesting to explore usability and credibility of e-governments from the government
organisations‟ perspective. Therefore, future studies may carry out an investigation
into usability and credibility, focusing on the government organisations‟ side. The
findings can indicate the government viewpoint about usability and credibility. In
addition, the results from both users‟ perspective and organisations‟ perspective can
be comparatively analysed, which may be beneficial for obtaining a more
comprehensive understanding of usability and credibility in order to develop more
usable and credible e-governments.

254
REFERENCES
Ahmed, S. M. Z., Mcknight, C. & Oppenheim, C. (2006) A user-centred design and
evaluation of IR interface, Journal of Librarianship and Information Science, Vol. 38,
3, pp.157 – 172.
Al-Kibsi, G., De Boer, K., Mourshed, M. & Rea, N. (2001) Putting citizens online not
in line, The McKinsley Quarterly, Vol. 2, pp.65-73.
Al-Omari, H. & Al-Omari, A. (2006) Building an e-government e-trust infrastructure,
American Journal of Applied Science, Vol. 3, 11, pp.2122-2130.
Allen, M., Currie, L. M., Bakken, S., Patel, V. L. & Cimino, J. J. (2006) Heuristic
evaluation of paper-based Web pages: a simplified inspection usability methodology,
Journal of Biomedical Informatics, Vol. 39, 4, pp.412-423.
Anthopoulos, L. G., Siozos, P. & Tsoukalas, I. A. (2006) Applying participatory
design and collaboration in digital public services for discovering and re-designing e-
government services, Government Information quarterly, Vol. 24, 2, pp.353-376.
Bai, B., Law, R. & Wen, I. (2008) The impact of website quality on customer
satisfaction and purchase intentions: evidence from Chinese online visitors,
International Journal of Hospitality Management, Vol. 27, pp.391-402.
Baker, D. L. (2009) Advancing e-government performance in the United States
through enhanced usability benchmarks, Government Information Quarterly, Vol. 2,
pp.82-88.
Baker, K., Greenberg, S. & Gutwin, C. (2001) Heuristics evaluation of groupware
based on the mechanics of collaboration, Lecture Notes in Computer Science, Vol.
2254/2001, pp.123-139.

255
Barnes, S. J. (2004) Interactive e-government: evaluating the web site of the UK
Inland Revenue, Journal of Electronic Commerce in Organizations, Vol. 2, 1, pp.42-
63.
Barnes, S. & Vidgen, R. (2004) Interactive e-government services: modelling user
perceptions with eQual, Electronic Government, Vol.1, 2, pp.213-228.
Beaumont, P., Longley, P. A. & Maguire, D. J. (2005) Geographic information portals
- a UK perspective, Computers, Environment and Urban System, Vol. 29, pp.49-69.
Bélanger, F & Carter, C. (2008) Trust and risk in e-government adoption, Journal of
Strategic Information System, Vol.17, pp.165-176.
Bellamy, C. & Taylor, J. A. (1998) Government in the information age, Buckingham,
Open University Press.
Benbunan-Fich, R. (2001) Using protocol analysis to evaluate the usability of a
commercial web site, Information & Management, Vol. 39, 2, pp.151-163.
Bevan, N. (1995) Measuring usability as quality of use, Software Quality Journal,
Vol.4, pp.115-130.
Beynon-Davies, P. & Williams, M. D. (2003) Evaluating electronic local government
in the UK, Journal of Information Technology, Vo. 18, 2, pp.137 - 149.
Boudreau, M. C., Gefen, D. & Straub, D. (2001) Validation in IS research: a state-of-
the-art assessment, MIS Quarterly, Vol. 25, 1, pp.1-16.
Bouwman, H., Hooff, B., Wijngaert, L. & Dijk, J. (2005) Information and
communication technology in organizations, SAGE publications, London.
Brannen, J. (1992) Mixing methods: qualitative and quantitative research, Avebury,
England.

256
Brinck, T., Gergle, D. & Wood, S. D. (2002) Usability for the web: designing web
site that work, Morgan Kaufmann Publishers, San Francisco, CA.
Bryman, A. (1988) Quantity and quality in social research, London, Unwin Hyman.
Burgoon, J. K., Bonito, J. A., Bengtsson, B., Cederberg, C., Lundeberg, M. &
Allspach, L. (2000) Interactivity in human-computer interaction: a study of credibility,
understanding, and influence, Computers in Human Behavior, Vol. 16, pp.553-574.
Burns, R. B. (2000) Introduction to research methods, London: Sage.
Cabinet Office (2000) e-government: a strategic framework for public services in the
information age, Cabinet Office, London.
Cairns, G., Wright, G., Bradfield, R., Heijden, K. & Burt, G.(2004) Exploring e-
government futures through the application of scenario planning, Technological
Forecasting and Social Change, Vol. 71, 3. pp.217-238.
Carter, L. & Bélanger, F. (2005) The utilization of e-government services: citizen
trust, innovation and acceptance factors, Information System Journal, Vol. 5, pp.5-25.
Casaló, L., Flavián, C. & Guinalíu, M. (2008) The role of perceived usability,
reputation, satisfaction and consumer familiarity on the website loyalty formation
process, Computers in Human Behavior, Vol. 24, 2, pp.325-345.
Cassell, J. & Bickmore, T. (2000) External manifestations of trustworthiness in the
interface, Communication of the ACM, Vol. 43, 12, pp.50-56.
Chattratichart, J. & Brodie, B. (2004) Applying user testing data to UEM
performance metrics, Conference on Human Factors in Computing Systems, CHI '04
extended abstracts on human factors in computing systems, pp.1119-1122.

257
Chen, S. Y. & Macredie, R. D. (2005) the assessment of usability of electronic
shopping: a heuristic evaluation, International Journal of Information Management,
Vol. 25, pp.516-532.
Chiu, C., Hsu, M., Sun, S., Lin, T. & Sun, P. (2005) Usability, quality, value and e-
learning continuance decisions, Computers & Education, Vol. 45, 4, pp.399-416.
Cho, J. (2004) Likelihood to abort an online transaction: influences from cognitive
evaluation, attitudes and behavioural variables, Information and Management, Vol. 42,
pp.827-838.
Choudrie, J. & Ghinea, G. (2005) Integrated views of e-government website usability:
perspectives from users and web diagnostic tools, International Journal of Electronic
Government, Vol. 2, 3, pp.318-333.
Ciborra, C. (2005) Interpreting e-government and development efficiency,
transparency or governance at a distance, Information Technology & People, Vol.18,
3, pp.260-279.
Cinderby, S., Forrester, J., Rosen, P. & Yearley, S. (2002) Participation, models and
the local governance of air pollution, the European Association for the Study of
Science and Technology Conference, York.
Collins, J. (2006) An investigation of web-page credibility, Journal of Computing
Sciences in Colleges, Vol. 21, 4, pp.16-21.
Creswell, J. W. (2009) Research design: qualitative, quantitative, and mixed method
approaches, 3rd
edition, SAGE Publications.
Culbertson, S. (2002) Transformed government: case studies on the impact of e-
government in public administration, Idea Group Publishing, pp.110-149.
Cunliffe, D., Kritou, E. & Tudhope, D. (2001) Usability evaluation for museum web
sites, Museum Management and Curatorship, Vol. 19, 3, pp.229-252.

258
Daniel, E. & Ward, J. (2006) Integrated service delivery: exploratory case studies of
enterprise portal adoption in UK local government, Business Process Management
Journal, Vol. 12, 1, pp.113 - 123.
De, R. (2006) Evaluation of e-government systems: project assessment vs
development assessment, Lecture Notes in Computer Science, Vol. 4084, pp.317-328.
Delice, E. & Güngör, Z. (2009) The usability analysis with heuristic evaluation and
analytic hierarchy process, International Journal of Industrial Ergonomics, Vol. 39, 6,
pp.934-939.
Deloitte & Touche (2001) The Citizen as Customer, CMA Management, Vol. 74, 10,
pp.58.
Denscombe, M. (2003) The good research guide for small-scale social research
projects, 2nd
edition, Open University Press, Maidenhead, Philadelphia.
Denscombe, M. (2007) The good research guide for small-scale social research
projects, 3rd
edition, Open University Press.
Dhillon, G.S.,Weerakkody, V. and Dwivedi, Y.K. (2008) Realising transformational
stage e-government: a UK local authority perspective, International Journal of
Electronic Government, Vol. 5, 2, pp.162–180.
Donker-Kuijer, M. W., Jong, M. & Lentz, L. (2010) Usable guidelines for usable
websites: an analysis of five e-government heuristics, Government Information
Quarterly, Vol. 27, pp.254-263.
Dos-Santos, E. M. & Reinhard, N. (2007) Setting interoperability standards for e-
government: an exploratory case study, International Journal of Electronic
Government, Vol. 4, 4, pp.379-394.

259
Dumas, J. S. & Redish, J. C. (1999) A practical guide to usability testing, Intellect Ltd,
USA.
Dutta-Bergman, M, J. (2004) The impact of completeness and Web use motivation on
the credibility of e-health information, Journal of Communication, Vol. 54, pp.253-
269.
Dwivedi, Y. K. & Williams, M. D. (2008) Demographic influence on UK citizens‟ e-
government adoption, International Journal of Electronic Government, Vol. 5, 3, pp.
261-274.
Edwards, P. J., Moloney, K. P., Jacko, J. A. & Sainfort, F. (2008) Evaluating usability
of a commercial health record: a case study, International Journal of Human-
Computer Studies, Vol. 66, pp.718-728.
Eschenfelder, K. R. & Miller, C. A. (2007) Examining the role of Web site
information in facilitating different citizen–government relationships: a case study of
state chronic wasting disease web sites, Government Information Quarterly, Vol. 24,
1, pp.64-88.
Evangelidis, A., Akomode, J., Taleb-Bendiab, A. & Taylor, M. (2002) Risk
assessment & success factors for e-government in a UK establishment, Lecture Notes
in Computer Science, Vol. 2456, pp.395-402.
Eyob, E. (2004) E-government: breaking the frontiers of inefficiencies in the public
sector, International Journal of Electronic Government, Vol. 1, 1, pp.107-114.
Flanagin, A. J. & Metzger, M. J. (2000) Perceptions of Internet Information
Credibility, Journalism and Mass Communication Quarterly, Vol. 77, 3, pp.515-540.
Flanagin, A. J. & Metzger, M. J. (2003) The perceived credibility of personal web
page information as influenced by the sex of the source, Computers in Human
Behavior, Vol. 19, pp.683-701.

260
Flavián, C., Guinalĭu, M. & Gurrea, R. (2006) The role played by perceived usability,
satisfaction and consumer trust on website loyalty, Information & Management, Vol.
43, pp.1-14.
Fogg, B. J. & Tseng, S. (1999a) credibility and computing technology,
Communication of the ACM, Vol. 42, 5, pp.39-44.
Fogg, B. J. & Tseng, H. (1999b) The elements of computer credibility, Proceedings of
CHI99 Conference on Human Factors and Computer System, ACM: New York,
pp.80-86.
Fogg, B. J., Marshall, J., Laraki,O., Osipovich, A., Varma, C., Fang, N., Paul, J.,
Rangnekar, A., Shon, J., Swani, P. Treinen, M. (2000) Elements that affect web
credibility: early results from a self-report study, CHI 2000, pp.287-288.
Fogg, B. J., Marshall, J., Laraki, O., Osipovich, A., Varma, C., Fang, N., Paul, J.,
Rangnekar, A., Shon, J., Swani, P. & Treinen, M. (2001) What makes we sites
credible? a report on a large quantitative study, Proceedings of the SIGCHI
Conference on Human Factors in Computing Systems, pp.61-68.
Fogg, B. J. (2002) Stanford Guidelines for web credibility, A Research Summary
from the Stanford Persuasive Technology Lab, Available at:
http://credibility.stanford.edu/guidelines/index.html, (accessed August 2010).
Fogg, B. J. (2003) Persuasive technology: using computers to change what we think
and do, San Francisco, Morgan Kaufmann.
Fogg, B. J., Soohoo, C., Danielson, D. R., Marable, L., Stanford, J. & Tauber, E. R.
(2003) How do users evaluate the credibility of Web sites?: a study with over 2,500
participants, Proceedings of the 2003 Conference on Designing for User Experiences,
pp.1-15.
Foster, J. J. (2001) Data analysis using SPSS for windows, London, SAGE
Publications.

261
Følstad, A., Jørgensen, H. D. & Krogstie, J. (2004) User involvement in e-government
development projects, Nordic Conference on Human-Computer Interaction, Vol. 82,
pp.217–224.
Fu, L., Salvendy, G. & Turley, L. (2002) Effectiveness of user testing and heuristic
evaluation as a function of performance classification, Behaviour and Information
Technology, Vol. 21, 2, pp.137-143.
Gallagher, S. (2008) Direct perception in the intersubjective context, Consciousness
and Cognition, Vol. 17, 2, pp.535-543.
Gant, J. P. & Gant, D. B. (2002) Web portal functionality and state government e-
services, Proceedings of the 35th
Hawaii International Conference on System Science,
pp.1627-1636.
Garcia, A. C. B., Maciel, C. & Pinto, F. B. (2005) A quality inspection method to
evaluate e-government sites, Lecture Notes in Computer Science, Vol. 3591, pp.198-
209.
Gerhardt-Powals, J. (1996) Cognitive engineering principles for enhancing human-
computer performance, International Journal of Human-Computer Interaction, Vol. 8,
pp.189–211.
Ghaoui, C. (2000) Document icon bar for the support of authoring, learning and
navigation on the web: usability issues, Journal of Network and Computer
Applications, Vol. 23, pp.455-475.
Gil-García, J. R. (2005) Exploring the success factors of state website functionality:
an empirical investigation, Proceedings of the 2005 national conference on Digital
government research, Vo. 89, pp.121-130.
262
Gil- García, J. R. (2006) Enacting state websites: a mixed method study exploring e-
government success in multi-organizational settings, Proceedings of the 39th Annual
Hawaii International Conference on system science, Vol. 4, pp.76
Gil-Garcia, J. R. & Martinez-Moyano, I. J. (2007) Understanding the evolution of e-
government: The influence of systems of rules on public sector dynamics,
Government Information Quarterly, Vol. 24, 2, pp.266-290.
Gill, J. & Johnson, P. (1991) Research methods for managers, Paul Chapman
Publishing Ltd, pp.85.
Gillan, D. J. & Bias, R. G. (2001) usability science I: foundations, International
Journal of Human Computer Interaction, Vol. 13, 4, pp.351-372.
Glesne, C. & Peshkin, A. (1992) Becoming qualitative researcher: an introduction,
White Plains, NY: Longman.
Gottschalk, P. (2009) Maturity levels for interoperability in digital government,
Government Information Quarterly, Vol. 26, pp.75-81.
Gottschalk, P. & Solli-Sæther, H. (2008) Stages of e-government interoperability,
International Journal of Electronic Government, Vol. 5, 3, pp.310-320.
Grover, V., Lee, C. C., Durand, D. & Douglas, D. (1993) Analyzing methodological
rigor of MIS survey research from 1980–1989, Information & Management, Vol. 24, 6,
pp.305-317.
Haak, M., Jong, M. D. & Schellens, P. J. (2003) Retrospective versus concurrent
think-aloud protocols: testing the usability of an online library catalogue. Behaviour
& Information Technology, Vol. 22, pp.339–351.
Han, S. H., Yun, M. H., Kwahk, J. & Hong, S. W. (2001) Usability of consumer
electronic products, International Journal of Industrial Ergonomics, Vol. 28, pp.143-
151.

263
Hazzan, O., Dubinsky, Y. Eidelman, L. Sakhnini, V. & Teif, M. (2006) Qualitative
research in computer science education, SIGCSE '06: Proceedings of the 37th
SIGCSE Technical Symposium on Computer Science Education.
Head, A. J. (1999) Design wise: a guide for evaluating the interface design of
information resources, Information Today Inc., Medford, NJ.
Heeks, R. (2002) E-government in Africa: promise and practice, Manchester: Institute
for Development Policy and Management, University of Manchester.
Henninger, S. (2000) A methodology and tools for applying context-specific usability
guidelines to interface design, Interacting with Computing, Vol. 12, pp.225-243.
Henriksson, A., Yi, Y., Frost, B. & Middleton, M. (2007) Evaluation instrument for e-
government websites, International Journal of Electronic Government, Vol. 4, 2,
pp.204-226.
Hiller, J. & Bélanger, F. (2001) Privacy strategies for electronic government, E-
government Series, PricewaterhouseCoopers Endowment for the Business of
Government, Arlington, VA.
Hilligoss, B. & Rieh, S. Y. (2008) Developing a unifying framework of credibility
assessment: construct, heuristics, and interaction in context, Information Processing
and Management, Vol. 44, pp.1467-1484.
Hinton, P. R., Brownlow, C., McMurrary, I. & Cozens, B. (2004) SPSS explained,
Routledge, East Sussex.
Hong, T. (2006) The influence of structural and message features on web site
credibility, Journal of the American Society for Information Science and Technology,
Vol. 57, 1, pp.114-127.

264
Homburg, V. (2008) Understanding e-government: information systems in public
administration, Routledge, Oxon.
Holmes, D. (2001) Egov, ebusiness strategies for government, Nicholas Brealey
Publishing, London.
Hornbæk, K. (2006) Current practice in measuring usability: challenges to usability
studies and research, International Journal of Human-Computer Studies, Vol. 64, pp.
79-102.
Horrocks, I. & Hambley, N. (1998) The `webbing' of British local government, Public
Money & Management, Vol. 18, 2, pp.39-44.
Horst, M., Kuttschreuter, M. & Gutteling, J. M. (2007) Perceived useful, personal
experience, risk perception and trust as determinants of adoption of e-government
services in the Netherlands, Computers in Human Behavior, Vol. 23, pp.1838-1852.
Howard, M. (2001) E-government across the globe: how will „e‟ change government?,
Government Finance Review, Vol. 17, 4, pp.6-9.
Hu, P., Cui, D. & Sherwood, A. (2006) Examining across-agency collaborations in e-
government initiatives, Proceedings of the 39th
Hawaii International Conference on
System and Sciences, pp. 1-11.
Huang, Z., Brooks, L. & Chen, S. (2009) The assessment of credibility of e-
government: users‟ perspective, Lecture Notes in Computer Science, Vol. 5618, pp.
26-35.
Huizingh, E. K. R. E. (2000) The content and design of web sites: an empirical study,
Information & Management, Vol. 37, pp.123-134.
Hung, S., Chang, C. & Yu, T. (2006) Determinants of user acceptance of the e-
government services: the case of online tax filing and payment system, Government
Information Quarterly, Vol. 23, pp.97-122.

265
Hvannberg, E. T., Law, E. L. & Larusdottir, M. K. (2007) Heuristic evaluation:
comparing ways of finding and reporting usability problems, Interacting with
Computers, Vol. 19, pp.225-240.
Irani, Z., Love, P. E. D., Elliman, T., Jones, S. & Themistocleous, M. (2005)
Evaluating e-government: learning from the experiences of two UK local authorities,
Information System Journal, Vol. 15, pp.61-82.
ISO (1998) Ergonomic requirements for office work with visual display terminals,
Part 11, Guidance on Usability.
Ivory, M. Y., Sinha, R. R. & Hearst, M. A. (2001) Empirically validated web page
design metrics, Proceedings of the SIGCHI Conference on Human Factors in
Computing Systems, pp.53-60.
Jaeger, P. T. (2006) Assessing section 508 compliance on federal e-government
websites: a multi-method, user-centered evaluation of accessibility for persons with
disabilities, Government Information Quarterly, Vol. 23, pp.169-190.
Jeffries, R., Miller, J. R., Wharton, C. & Uyeda, K. M. (1991) User interface
evaluation in the real world: a comparison of four techniques, Conference on Human
Factors in Computing Systems, pp.119–124.
Johnson, T. J. & Kaye, B. K. (2009) In blog we trust, deciphering credibility of
components of the internet among politically interested internet users, Computers in
Human Behavior, Vol.25, pp.175-182.
Jul, S. & Futnas, G. W. (1997) Navigation in electronic worlds: a CHI‟ 97 workshop,
SIGCHI Bulletin, Vol. 29, 4, pp. 44-49.
Kappel, G., Pröll, B., Reich, S. & Retschitzegger, W. (2006) Web engineering, the
discipline of systematic development of web applications, John Wiley & Sons.
266
Karahoca, A., Bayraktar, E., Tatoglu, E. & Karahoca, D. (2010) Information system
design for a hospital emergency department: a usability analysis of software
prototypes, Journal of Biomedical Informatics, Vol. 43, pp.224-232.
Ke, W. & Wei, K. K. (2004) Successful e-government in Singapore, Communication
of the ACM, Vol. 47, 6, pp.95-99.
Kelly, E. P. & Tastle, W. J. (2004) E-government and the judicial system: online
access to case information, International Journal of Electronic Government, Vol. 1, 2,
pp.166-178.
Kinnear, P. R. (2008) SPSS 15 made simple, Psychology Press.
Klischewski, R. & Scholl, H. J. (2006) Information quality as a common ground for
key players in e-government integration and interoperability, Proceedings of the 39th
Hawaii International Conference on System Science, pp. 1-10.
Kolsaker, A. and Lee-Kelley, L. (2006) Citizen-centric e-government: a critique of the
UK Model, Electronic Government, Vol. 3, 2, pp.127–138.
Kolsaker, A. (2006) Reconceptualising e-government as a tool of governance: the UK
case, Electronic Government, Vol. 3, 4, pp.347-355.
Kossak, F., Essmayr, W. & Winiwarter, W. (2001) Applicability of HCI research to e-
government, 9th European Conference on Information Systems, pp.957-968.
Kumar, V., Mukerji, B., Butt, I. & Persaud, A. (2007) Factors for successful e-
government adoption: a conceptual framework, Electronic Journal of E-government,
Vol. 5, 1, pp. 63-76.
Larsen, E. & Rainie, L. (2003) The rise of the e-citizen: how people use e-government
agencies‟ websites, Pew Internet & American Life Project.

267
Larson, K. and Czerwinski, M. (1998) Web page design: implications of memory,
structure and scent for information retrieval, Proceedings of CHI‟ 98 Conference on
Human Factors in Computing Systems, pp.25-32.
Lavie, T. & Tractinsky, N. (2004) Assessing dimensions of perceived visual
aesthetics of web sites, International Journal of Human–Computer Studies, Vol. 60,
pp.269–298.
Layne, K. & Lee, J. (2001) Developing fully functional e-government: a four stage
model, Government Information Quarterly, Vol. 18, pp.126-136.
Lee, S. & Koubek, R. J. (2010) The effects of usability and web design attributes on
user preference for e-commerce web sites, Computers in Industry, In Press,
doi:10.1016/j.compind.2009.12.004.
Leedy, P. D. (1997) Practical research: planning and design, 6th
edition, Von
Hoffmann Press, pp. 229.
Leedy, P. D. & Ormrod, J. E. (2001) Practical research: planning and design,
International edition, Pearson Education International.
Lemahieu, W. (2002) Context-based navigation in the web by means of dynamically
generated guided tours, Computer Networks, Vol. 39, pp.311-328.
Lentz, L. & Pander Maat, H. (2004) Functional analysis for document design,
Technical Communication, Vol. 51, pp.387-398.
Liu, Z. M. & Huang, X. B. (2005) Evaluating the credibility of scholarly information
on the web: a cross cultural study, International Information and Library Review, Vol.
37, 2, pp.99-106.
Lowry, P. B., Spaulding, T., Wells, T., Moody, G., Moffit, K. & Madariaga, S. (2006)
A theoretical model and empirical results linking website interactivity and usability

268
satisfaction, Proceedings of the 39th Annual Hawaii International Conference on
System Sciences, Track 6.
Magoutas, B. & Mentzas, G. (2010) SALT: a semantic adaptive framework for
monitoring citizen satisfaction from e-government services, Expert Systems with
Applications, Vol. 37, 6, pp.4292-4300.
Magoutas, B., Schmidt, K., Mentzas, G. & Stojanovic, L. (2010) An adaptive e-
questionnaire for measuring user perceived portal quality, International Journal of
Human-Computer Studies, Vol. 68, 10, pp.729-745.
Marsico, M. D. & Levialdi, S. (2004) Evaluating web sites: exploiting user‟s
expectations, International Journal of Human-Computer Studies, Vol. 60, pp.381-416.
Matera, M., Costabile, M. F., Garzotto, F. & Paolini, P. (2002) SUE inspection: an
effective method for systematic usability evaluation of hypermedia, IEEE Transaction
on System, Man, and Cybernetics – Part A: Systems and Human, Vol. 32, 1, pp.93-
103.
McDonald, S. & Stevenson, R. J. (1998) Navigation in hyperspace: an evaluation of
the effects of navigational tools and subject matter expertise on browsing and
information retrieval in hypertext, Interacting with Computer, Vol. 10, pp.129-142.
McKnight, H. & Kacmar, C. (2006) Factors of Information Credibility for an Internet
Advice Site, Proceedings of the 39th Annual Hawaii International Conference on
System Sciences, Track 6.
McQueen, R. & Knussen, C. (2002) Research methods for social science a practical
introduction, Pearson Education Limited, Essex.
Medaglia, R. (2006) Local networking for e-services: a UK case study, Lecture Notes
in Computer Science, Vol. 4084, pp.256-268.

269
Meneklis, B., Kaliontzoglou, A., Douligeris, C. & Polemi, D. (2005) Engineering and
technology aspects of an e-government architecture based on web services,
Proceeings of the 3rd
European Conference on Web Services, pp.118-130.
Metaxiotis, K. & Psarras, J. (2004) E-government: new concept, big challenge,
success stories, International Journal of Electronic Government, Vol. 1, 2, pp.141-151.
Metzger, M. J., Flanagin, A., Eyal, K., Lemus, D. R. & McCann, R. M. (2003)
Credibility for the 21 century: integrating perspectives on source, message, and media
credibility in the contemporary media environment, Communication Yearbook, Vol.
27, pp.293-335, Mahwah, NJ: Lawrence Erlbaum Associates Inc.
Montagna, J. M. (2005) A framework for the assessment and analysis of electronic
government proposals, Electronic Commerce Research and Applications, Vol. 4, 3,
pp.204-219.
Moon, M. J. (2002) The Evolution of e-government among municipalities: rhetoric or
reality?, Public Administration Review, Vol. 62, 4, pp.424–433.
Morkes, J & Nielsen, J. (1998) Applying writing guidelines to web page, CHI 98
Conference Summary on Human Factors in Computing Systems, pp.321 – 322.
Mosse, B. & Whitley, E. A. (2009) Critically classifying: UK e-government website
benchmarking and the recasting of the citizen as customer, Information Systems
Journal, Vol. 19, 2, pp.149-173.
Muir, A. & Oppenheim, C. (2002) National Information policy developments
worldwide in electronic government, Journal of Information Science, Vol. 28, 3,
pp.173-186.
Muller, M., Matheson, L., Page, C. & Gallup, R. (1998) Methods and tools:
Participatory heuristic evaluation, Interaction, Vol. 5, pp.13–18.

270
Muller, M. J., McClard, A., Bell, B., Dooley, S., Meiskey, L., Meskill, J. A., Sparks,
R. & Tellam, D. (1995) In participatory heuristic evaluation: process-oriented
extensions to discount usability, Proceeding of CHI 1995, pp.115–116.
Murphy, J. (2005) Beyond e-government: the world‟s most successful technology-
enabled transformations, (MP Parliamentary Secretary Cabinet Office Report)
Executive summary, INSEAD-The Business School for the World, pp.1-124.
Mutula, S. M. & Wamukoya, J. M. (2007) Web information management: a cross-
disciplinary textbook, Chandos Publishing, Oxford, England.
Nielsen, J. & Molich, R. (1990) Heuristic evaluation of user interface, Proceedings of
the ACM CHI‟92, pp. 249-256.
Nielsen, J. (1993) Usability engineering, Academic Press, New York.
Nielsen, J. (1994) Heuristic evaluation: usability inspection methods, New York.
Nielsen, J. (1999) Trust or bust: communicating trustworthiness in web design,
available at: www.useit.com/alertbox/990307.html (accessed September 2010).
Nielsen, J. (2000) Deigning web usability: the practice of simplicity, New Riders
Publishing, Indiana, USA.
Nielsen, J. (2001). Did poor usability kill E-Commerce? Available at:
http://www.useit.com (accessed September 2010).
OECD (2003) OECD E-Government Studies: the e-government imperative, OECD,
Paris.
O'Grady, L. (2006) Future directions for depicting credibility in health care web sites,
International Journal of Medical Informatics, Vol. 75, pp.58-65.

271
O‟Keefe, D. J. (2002) Persuasion: theory and research, Thousand Oaks, CA: Sage, 2nd
Edition.
Ozok, A. A. & Salvendy, G. (2001) How consistent is your web design? Behaviour
and Information Technology, Vol. 20, 6, pp.433-447.
Pallant, J. (2001) SPSS survival manual, Open University Press, Buckingham,
Philadelphia.
Parent, M., Vandebeek, C. A. & Gemino, A C. (2005) Building citizen trust through
e-government, Government Information Quarterly, Vol. 22, pp.720-736.
Park, K. S. & Lim, C. H. (1999) A structured methodology for comparative
evaluation of user interface designs using usability criteria and measures, International
Journal of Industrial Ergonomics, Vol. 23, pp.379-389.
Park, E. G., Lamontagne, M., Perez, A., Melikhova, I. & Bartlett, G. (2009) Running
ahead toward interoperable e-government: the e-government of Canada metadata
framework, International Journal of Information Management, Vol. 29, pp.145-150.
Pearrow, M. (2000) Website handbook, Charles River Media Inc., Rockland, MA.
Perru, 6 (2004) E-governance: styles of political judgment in the information age,
Palgrave Macmillan, Hampshire.
Petrie, H. & Kheir, O. (2007) The relationship between accessibility and usability of
website, CHI 2007 Proceedings, Empirical Studies of Web Interaction, pp.397-406.
Rains, S. A. & Karmikel, C. D. (2009) Health information-seeking and perceptions of
website credibility: examining web-use orientation, message characteristics, and
structural features of websites, Computers in Human Behavior, Vol. 25, pp.544–553.
Rates, S. J. (2004) Doing social science research, SAGE Publications, London.

272
Reddick, C. G. (2005) Citizen interaction with e-government: from the streets to
servers?”, Government Information Quarterly, Vol. 22, 1, pp.38-57.
Reddick, C. G. (2009) The adoption of centralized customer service systems: a survey
of local governments, Government Information Quarterly, Vol. 26, 1, pp.219-226.
Redish, J., Bias, R. G., Bailey, R., Molich, R., Dumas, J. & Spool, J. M. (2002)
Usability in practice: formative usability evaluations - evolution and revolution,
Conference on Human Factors in Computing Systems, pp.885 - 890.
Reed, P., Holdaway, S., Isensee, E., Buie, J., Fox, J. & Williams, A. L. (1999) User
interface guidelines and standards: progress, issues, and prospects, Interacting with
Computers, Vol. 12, 2, pp.119-142.
Resnick, P., Zeckhauser, R., Friedman, E. & Kuwabara, K. (2000) Reputation systems,
Communications of the ACM, Vol. 43, 12, pp.45–48.
Rieh, S. Y. (2002) Judgment of information quality and cognitive authority in the web,
Journal of the American Society for Information Science and Technology, Vol. 53, 2,
pp.145–161.
Rieman, J., Franzke, M. & Redmiles, D. (1995) Usability evaluation with the
cognitive walkthrough, Proceedings of CHI 95 Conference, pp.387–388.
Robins, D. & Holmes, J. (2008) Aesthetics and credibility in web site design,
Information Processing & Management, Vol. 44, 1, pp.386-399.
Root, R. W. & Draper, S. (1983) Questionnaires as a software evaluation tool,
Proceedings of the CHI 83, pp.83–87, New York.
Rose, A. F., Schnipper, J. L., Park, E. R., Poon, E. G., Li, Q. & Middleton, B. (2005)
Using qualitative studies to improve the usability of an EMR, Journal of Biomedical
Informatics, Vol. 38, 1, pp.51-60.

273
Rosenweig, E. (1996) A common look and feel or a fantasy?, Interaction, Vol. 3,
pp.21-26.
Rosson, M. B. & Carroll, J. M. (2002) Usability engineering: scenario-based
development of Human-Computer Interaction, Morgan Kaufmann, CA.
Sauer, J. & Sonderegger, A. (2009) The influence of prototype fidelity and aesthetics
of design in usability tests: effects on users behaviour, subjective evaluation and
emotion, Applied Ergonomics, Vol. 40, pp.670-677.
Schedler, K. & Summermatter, L. (2007) Customer orientation in electronic
government: motives and effects, Government Information Quarterly, Vol. 24, 2,
pp.291-311.
Schelin, S. H. (2003) E-government: an overview, Hershey, PA: Idea Group
Publishing.
Schmidt, S., Steele, R. Dillon, T. S. & Chang, E. (2007) Fuzzy trust evaluation and
credibility development in multi-agent systems, Applied Soft Computing, Vol. 7,
pp.492-505.
Searson, E. M. & Johnson, M. A. (2010) Transparency laws and interactive public
relations: an analysis of Latin American government Web sites, Public Relations
Review, Vol. 36, 2, pp.120-126.
Senyucel, Z. (2005) Towards successful e government facilitation in UK local
authorities, eGovernment workshop, Brunel University, London.
Siau, K. & Long, Y. (2005) Synthesizing e-government stage models – a meta-
synthesis based on meta-ethnography approach, Industrial Management & Data
Systems, Vol. 105, 4, pp.443-458.
Sidi, J. & Junaini, S. N. (2006) Credibility review of the Malaysian states e-
government websites, Public Sector ICT Management Review, Vol.1, 1, pp.41-45.

274
Sillence, E., Briggs, P., Harris, P. & Fishwick, L. (2006) A framework for
understanding trust factors in web-based health advice, International Journal of
Human-Computer Studies, Vol. 64, pp.697-713.
Sonderegger, A. & Sauer, J. (2010) The influence of design aesthetics in usability
testing: effects on user performance and perceived usability, Applied Ergonomics,
Vol. 41, 3, pp. 403-410.
Spool, J. M. (1999) Web site usability: a designers‟ guide, Morgan Kaufmann, San
Francisco, CA.
Strejcek, G. & Theil, M. (2002) Technology push, legislation pull? e-government in
the European Union, Decision Support Systems, Vol. 34, 3, pp.305-313.
Sundar, S.S. (1999) Exploring receivers‟ criteria for perception of print and online
news, Journalism and Mass Communication Quarterly, Vol. 76, pp.373-386.
Sutcliffe, A. & Gault, B. (2004) Heuristic evaluation of virtual reality applications,
Interacting with Computers, Vol. 16, pp.831-849.
Tambouris, S., Gorilas, S., Spanos, E., Loannidis, A. & Gomar, G. I. L. (2001)
European cities platform for online transaction services: the EURO-CITI project, 14th
Bled Electronic Commerce Conference, pp.198-214.
Tanaka, E. H., Bim, S. A. & Rocha, H. V. (2005) Comparing accessibility evaluation
and usability evaluation in HagáQuê, Proceedings of the 2005 Latin American
Conference on Human-Computer Interaction, Vol. 124, pp.139-147.
Tashakkori, A. & Teddlie, C. (1998) Combining qualitative and quantitative
approaches, Applied Social Research Methods Series, Vol. 46, SAGE Publication,
California.
275
Thomas, J. C. & Streib, G. (2003) The new face of government: citizen-initiated
contacts in the era of e-Government, Journal of Public Administration Research &
Theory, Vol. 13, 1, pp.83-102.
Thompson, K. M., McClure, C. R. & Jaeger, P. T. (2003) Evaluating federal websites:
improving e-government for the people, Computers in Society: Privacy, Ethics & the
Internet, Upper Saddle River, Prentice-Hall.
Tilson, R., Dong, J., Martin, S. & Kieche, E. (1998) Factors and principles affecting
the usability of four e-commerce sites, Proceedings of Human Factors and the Web,
Basking Ridge, NJ, USA.
Tolbert, C. & Mossberger, K. (2003) The effects of e-government on trust and
confidence in government, Proceedings of the 2003 Annual National Conference on
Digital Government Research, Digital Government Research Center, pp.1-7.
Tormala, Z.L., Briňol, P. & Petty, R. E. (2006) When credibility attacks: the reverse
impact of source credibility on persuasion, Journal of Experimental Social
Psychology, Vol. 42, pp.684-691.
Torres, L., Pina, V. & Acerete, B. (2005) E-government developments on delivering
public services among EU cities, Government Information Quarterly, Vol. 22, 2,
pp.217-238.
Tractinsky, N. (1997) Aesthetics and apparent usability: empirically assessing cultural
and methodological issues, Proceedings of ACM Conference on Human Factors in
Computing Systems. ACM Press, New York, pp.115–122.
Tractinsky, N., Katz, A. S. & Ikar, D. (2000) What is beautiful is usable, Interacting
with Computers, Vol. 13, pp.127-145.
Tractinsky, N., Cokhavi, A., Kirschenbaum, M. & Sharfi, T. (2006) Evaluating the
consistency of immediate aesthetic perceptions of web pages, International Journal of
Human-Computer Studies, Vol. 64, pp.1071-1083.

276
Tsakonas, G & Papatheodorou, C. (2008) Explore usefulness and usability in the
evaluation of open access digital libraries, Information Processing and Management,
Vol. 44, pp.1234-1250.
Tuch, A. N., Bargas-Avila, J. A., Opwis, K. & Wilhelm, F. H. (2009) Visual
complexity of websites: effects on users‟ experience, physiology, performance, and
memory, International Journal of Human-Computer Studies, Vol. 67, 9, pp.703-715.
Tung, L., Debreceny, R., Chan, Y., Chan, A. T., Le, S. E. (2003) Interacting with
hypertext: an experimental investigation of navigation tools, Electronic Commerce
Research and Application, Vol. 2, pp.61-72.
UN Public Administration Programme (2010) United Nations e-government survey
2010, available at: http://www2.unpan.org/egovkb/global_reports/10report.htm,
(accessed September 2010).
Verdegem, P. & Verleye, G. (2009) User-centered e-government in practice: a
comprehensive model for measuring user satisfaction, Government Information
Quarterly, Vol. 26, 3, pp.487-497.
Virzi, R. (1992) Refining the test phase of usability evaluation: how many subjects is
enough? Human Factors, Vol. 24, pp.457-468.
Vu, K. L., Proctor, R. W., Bhargav-Spantzel, A., Tai, B., Cook, J. & Engene Schultz,
E. (2007) Improving password security and memorability to protect personal and
organizational information, International Journal of Human-Computer Studies, Vol.
65, pp.744-757.
Walliman, N. (2001) Your research project: a step-by-step guide for the first-time
researcher, Thousand Oaks, London, Sage Publications.

277
Wamukoya, J. (2000) Record and archives as a basis for good government:
implications and challenges for records managers and archivists in Africa, Records
Management Journal, Vol. 10, 1, pp.23-33.
Wang, C. H. (2001) A survey of design guidelines for usability of web sites, in: Smith,
M.J , Salvendy, G., Harris, D., Koubek, R. J. (Eds), Usability evaluation and interface
design: cognitive engineering, Intelligent Agents and Virtual Reality, pp.183-187.
Wang, L., Bretschneider, S. & Gant, J. (2005) Evaluating web-based e-government
services with a citizen-centric approach, Proceedings of the 38th Annual Hawaii
International Conference on System Sciences, Vol. 5, pp.129-139.
Wang, Y. D. & Emurian, H. H. (2005) An overview of online trust: concepts,
elements, and implications, Computers in Human Behavior, Vol. 21, pp.105-125.
Warkentin, M., Gefen, D., Pavlou, P. A., and Rose, Gregory M. (2002) Encouraging
citizen adoption of e-Government by building trust, Electronic Markets, Vol. 12, 3,
pp.157-162.
Wathen, C. N. & Burkell, J. (2002) Believe it or not: factors influencing credibility on
the Web, Journal of the American Society for Information Science and Technology,
Vol. 53, 2, pp.134-144.
Weerakkody, V. & Choudrie, J. (2005) Exploring e-government in the UK:
challenges, issues and complexities, Journal of Information Science and Technology,
Vol. 2, 2, pp.26-45.
Weinschenk, S. & Yeo, S. C. (1995) Guidelines for enterprise-wide GUI design,
Wiley, New York.
Weir, C., McKay, I. & Jack, M. (2007) Functionality and usability in design for
eStatements in eBanking services, Interacting with Computers, Vol. 19, 2, pp.241-256.
278
Welch, E. W. & Hinnant, C. C. (2003) Internet use, transparency, and interactivity
effects on trust in government, Proceeding of the 36th
Hawaii International
Conference on System Science, Vol. 5, pp. 144-151.
West, D. M. (2005) Digital government, technology and public sector performance,
Princeton, NJ: Princeton University Press.
Whitmeyer, J. M. (2000) Effects of positive reputation systems, Social Science
Research, Vol. 29, 2, pp.188-207.
Wild, P., & Macredie, R. (2000) Usability evaluation and interactive systems
maintenance, Proceedings of OZCHI 2000: interfacing reality in the new millennium,
pp.143–149.
Wood, F. B., Siegel, E. R., LaCroix, E., Lyon, B. J., Benson, D. A., Cid, V. & Fariss,
S. (2003) A practical approach to e-government Web evaluation, IT Professional, Vol.
5, 3, pp.22-28.
Yang, K. C. C. (2007) Factors influencing Internet users' perceived credibility of
news-related blogs in Taiwan, Telematics and Informatics, Vol. 24, pp.69-85.
Yang, L., Lu, Y. & Fu, G. (2005) Study on e-government construction, Proceeding of
the 4th International Conference on Entertainment Computing, pp.542-548.
Yang, J. & Paul, S. (2005) E-government application at local level: issues and
challenges: an empirical study, Electronic Government, Vol. 2, 1, pp.56-76.
Yehuda, H. & McGinn, J. (2007) Coming to terms: comparing and combining the
results of multiple evaluators performing heuristic evaluation, Conference on Human
Factors in Computing Systems, pp.1899-1904.
Yildiz, M. (2007) E-government research: reviewing the literature, limitations and
ways forward, Government Information Quarterly, Vol. 24, pp.646-665.

279
Yin, R. K. (2009) Case study research: design and methods, 4th
edition, SAGE
Publications, California.
Zabed Ahmed, S. M., McKnight, C. & Oppenheim, C. (2006) A user-centred design
and evaluation of IR interface, Journal of Librarianship and Information Science, Vol.
38, 3, pp.157-172.
Zaharias, P. & Poylymenakou, A. (2009) Developing a usability evaluation method
for e-learning applications: beyond functional usability, International Journal of
Human-Computer Interaction, Vol. 25, 1, pp.75-98.

280
APPENDICES
Appendix 1a: Task sheet for London Authority 1 in experiment 1
Dear participants:
Many thanks for agreeing to take part in the experiment! During the experiment, you
are required to carry out some tasks using an e-government website. I would be
grateful if you could do the tasks below in the order shown:
1. Find the name of Chief Executive officer of Harrow council;
2. Find the title of any jobs related to social work in Harrow council, including
their reference number and job description;
3. Find the telephone number of the Planning Department in Harrow council;
4. Find the Revenue Budget 2008-09 of Harrow council;
5. Use the search engine on this site to find the place to apply for “Free School
Meals”;
6. Use “A to Z service” to find information about how to join the local library,
fill in the adult library membership form and submit the form via the site;
(using the user details provided)
7. Find the latest news about the reopening date of the Harrow Leisure centre;
8. Download the Primary School Guide 2009-10 to the computer (Drive C:\Form
download);
9. Please sign-in the system firstly and fill in a “compliments, comments and
complaints online form” to complain no street lamp on Kentmail Road and
submit to Harrow council;
Enjoying completing these tasks!
Personal Details
Name: Jack Ben
Employed: Research
DOB: 15/09/1980
Address: 2 St David Close
Cowley
Uxbridge
UB8 3SE
Email: [email protected]
Mobile phone: 079 8818 0866
Sign-in password: experiment
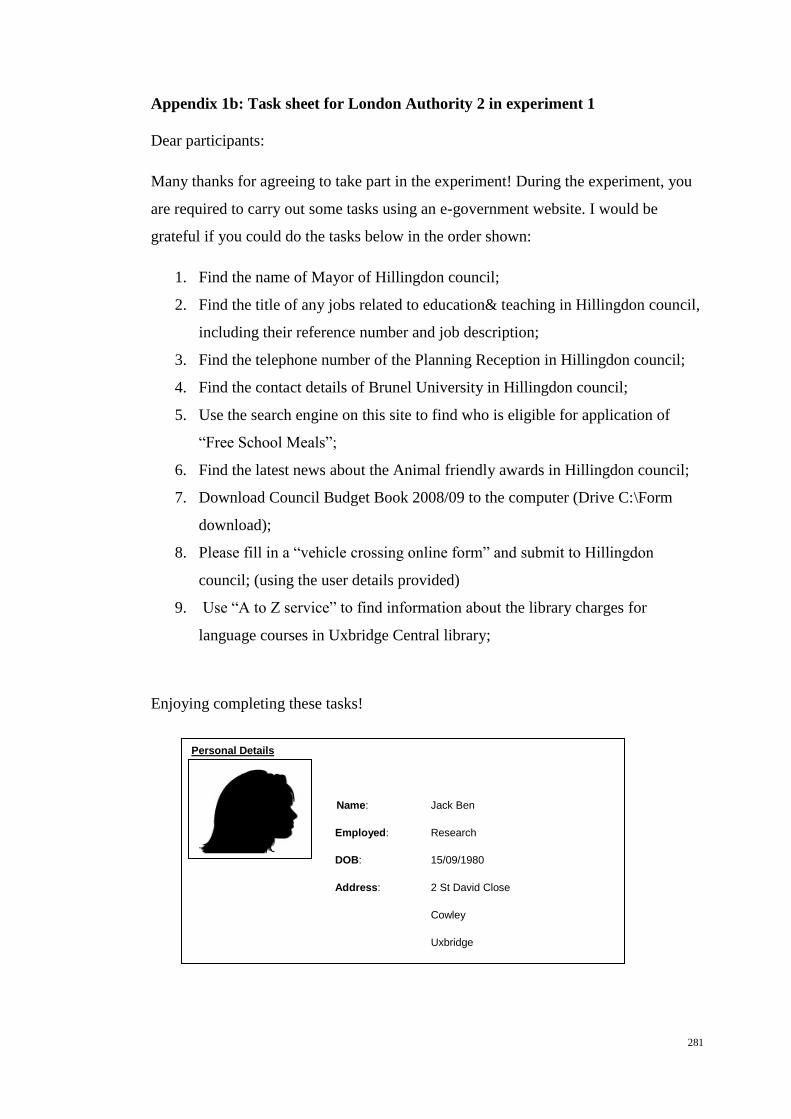
281
Appendix 1b: Task sheet for London Authority 2 in experiment 1
Dear participants:
Many thanks for agreeing to take part in the experiment! During the experiment, you
are required to carry out some tasks using an e-government website. I would be
grateful if you could do the tasks below in the order shown:
1. Find the name of Mayor of Hillingdon council;
2. Find the title of any jobs related to education& teaching in Hillingdon council,
including their reference number and job description;
3. Find the telephone number of the Planning Reception in Hillingdon council;
4. Find the contact details of Brunel University in Hillingdon council;
5. Use the search engine on this site to find who is eligible for application of
“Free School Meals”;
6. Find the latest news about the Animal friendly awards in Hillingdon council;
7. Download Council Budget Book 2008/09 to the computer (Drive C:\Form
download);
8. Please fill in a “vehicle crossing online form” and submit to Hillingdon
council; (using the user details provided)
9. Use “A to Z service” to find information about the library charges for
language courses in Uxbridge Central library;
Enjoying completing these tasks!
Personal Details
Name: Jack Ben
Employed: Research
DOB: 15/09/1980
Address: 2 St David Close
Cowley
Uxbridge
UB8 3SE
Email: [email protected]
Mobile phone: 079 8818 0866
Sign-in password: experiment

282
Appendix 1c: Task sheet for London Authority 3 in experiment 1
Dear participants:
Many thanks for agreeing to take part in the experiment! During the experiment, you
are required to carry out some tasks using an e-government website. I would be
grateful if you could do the tasks below in the order shown:
1. Find the name of Mayor of Hounslow council;
2. Find the latest jobs related to health care in Hounslow council, including their
reference number and job description;
3. Find the contact details of the Cleansing Services in Hounslow council;
4. Find when the online admissions system for secondary school transfer 2009
available is in Hounslow council;
5. Use the search engine on this site to find who is eligible for application of
“Free School Meals”;
6. Use “A to Z service” to find the application process for joining the children‟s
library services in Hounslow Council;
7. Find the latest news about the Heston House Open Day in Hounslow council;
8. Download the Street Drinking Report 2005 to the computer (Drive C:\Form
download);
9. Please fill in a “general enquiry online form” to query how can I order a
recycling bags and submit to Hounslow council; (using the user details
provided)
Enjoying completing these tasks!
Personal Details
Name: Jack Ben
Employed: Research
DOB: 15/09/1980
Address: 2 St David Close
Cowley
Uxbridge
UB8 3SE
Email: [email protected]
Mobile phone: 079 8818 0866
Sign-in password: experiment

283
Appendix 2a: Task sheet for the redesigned London Authority 1 in experiment 2
Dear participants:
Many thanks for agreeing to take part in the experiment! During the experiment, you
are required to carry out some tasks using an e-government website. I would be
grateful if you could do the tasks below in the order shown:
1. Find the telephone number of the Harrow Council (Adult social care);
2. Please use the online help option to find how to use this website, and then go
back home page to find the general information about council tax in Harrow
Council;
3. Find the latest news about Harrow crews fill 60 potholes a day;
4. Use “A-Z services” to find information about free school meals, fill in the free
school meals application online form and submit it via the site (using the user
details provided) ;
5. Find the information about school admissions in Harrow council;
6. Use the search engine on this site to find the information about library
branches list in Harrow;
7. Please find the information about birth-registering in Harrow Council;
8. Please download “An economic profile of Harrow” to the computer (Drive
C:\Documents download);
9. Please fill in a “compliments, comments and complaints online form” to
complain no rubbish bins on church road and submit it to Harrow Council
(using the user details provided);
Enjoying completing these tasks!
Personal Details
Name: Jack Ben
Employed: Research
DOB: 15/09/1980
Address: 2 St David Close
Cowley
Uxbridge
UB8 3SE
Email: [email protected]
Mobile phone: 079 8818 0866
Sign-in password: experiment

284
Appendix 2b: Task sheet for the redesigned London Authority 2 in experiment 2
Dear participants:
Many thanks for agreeing to take part in the experiment! During the experiment, you
are required to carry out some tasks using an e-government website. I would be
grateful if you could do the tasks below in the order shown:
1. Please find the name of Mayor of Hillingdon Council;
2. Please find the information about rubbish, waste and recycling in Hillingdon
Council;
3. Find the latest news about HillingdonFirst Supporting Businesses in
Hillingdon Council;
4. Use the search engine on this site to find the information about the assistance
with council tax;
5. Please fill in “online report form” regarding an abandoned vehicle on church
road and submit it to Hillingdon Council;
6. Please use “A-Z services” to find the information about Uxbridge High School
contact details;
7. Download council tax guide 2010-2011 to the computer (Drive C:\Documents
download);
8. Find the title of any job related to build control in Hillingdon council,
including their reference number and job description;
9. Find the information about your local libraries;
Enjoying completing these tasks!
Personal Details
Name: Jack Ben
Employed: Research
DOB: 15/09/1980
Address: 2 St David Close
Cowley
Uxbridge
UB8 3SE
Email: [email protected]
Mobile phone: 079 8818 0866
Sign-in password: experiment

285
Appendix 2c: Task sheet for the redesigned London Authority 3 in experiment 2
Dear participants:
Many thanks for agreeing to take part in the experiment! During the experiment, you
are required to carry out some tasks using an e-government website. I would be
grateful if you could do the tasks below in the order shown:
1. Find the names of the councillors in Hounslow council;
2. Find the latest news about £1.5 millions for new local authority housing in
Hounslow council;
3. Find the contact details of Hounslow council, especially their telephone
number for different departments/services;
4. Use the search engine on this site to find how to join a local library in
Hounslow;
5. Please find the introduction information about Hounslow council;
6. Use “A-Z services” to find the parking tickets information in Hounslow
council;
7. Please sign in the system firstly, and fill in “an online enquiry form” to query
how to get a student discount of council tax and submit this form to Hounslow
council (using the user details provided);
8. Please download the document of council tax 2009/2010 to the computer
(Drive C:\Documents download);
9. Find who is eligible for home care services in Hounslow council;
Enjoying completing these tasks!
Personal Details
Name: Jack Ben
Employed: Research
DOB: 15/09/1980
Address: 2 St David Close
Cowley
Uxbridge
UB8 3SE
Email: [email protected]
Mobile phone: 079 8818 0866
Sign-in password: experiment
286
Appendix 3a: Pilot study 1
Pilot study 1
A pilot study is conducted in experiment 1 to assess whether the research instruments,
measurements, produce and timing are properly designed and detect whether there are
any mistakes during the experiment. According to the findings in the pilot study,
some relevant changes are needed for experiment 1. Four PhD students at Brunel take
part in the pilot study. They are randomly assigned to three different e-government
sites (two in London Authority 1, one in London Authority 2 and one in London
Authority 3). During the pilot study, the researcher acts as an observer to identify
problems in the design, instruments and process of the experiment. The pilot study
follows the experimental procedure which requires each participant to complete all the
tasks assigned in an arranged order and fill out the usability and credibility
questionnaires. Several changes are made for experiment 1 based on the observation
results and the feedback from the participants‟ discussions. Table 1 summarises the
instruments‟ problems identified from the pilot study and relevant changes for
experiment 1.
In addition, there is some missing information that needs to be addressed to the
participants in the experimental introduction. Therefore, the pilot study suggests extra
detailed information which can support the participant to carry out their tasks during
the experiment. These suggestions will be clearly presented in the information sheet.
As shown in Table 2, some issues are suggested from the pilot study and changed in
the information sheet for experiment 1.
Furthermore, data obtained in the pilot study is necessarily analysed in order to judge
whether the expected results can be generated in the designed experiment. Therefore,
data analysis in the pilot study briefly justifies that the research instruments are useful
to identify some usability and credibility problems in order to answer the research
questions. Table 3 below shows some relevant data to indicate that the research
instruments employed in the pilot study can be used for the purpose of problems
identification in experiment 1.

287
Table 1 Changes to the research instruments based on the pilot study 1
Research instruments Issues description Evidences Proposed changes
Usability questionnaire Spelling mistakes
Grammatical mistakes
Vague statement
UQ28(site 1,2 3): “search
engineer”
UQ4,11,46(site1,2,3): “it is easily
to do”
UQ 45(site 1,2 ,3): “easy to use
the window operation”
UQ48(site 1,2,3,): “I like that
every image is a harmonious
member of a family of system”
UQ28(site 1,2,3): “search
engine”
UQ4,11,46(site1,2,3): “it is
easy to do” or “I can easily do”
UQ 45(site 1,2,3): “easy to
operate the e-government site”
UQ48(site1,2,3): “I like that
every image is related to the
topic of article in the system”
Credibility
questionnaire
Vague statement
Vague words
Spelling mistakes
CQ 16(site 1,2,3): “it is clear to
see the system‟s credentials
because the system displays
awards it has owned”
CQ21,37(site1,2,3): “my work”
CQ 19(site 1,2,3): “contract”
CQ16(site1,2,3): “awards it has
earned”
CQ 21,37(site1,2,3): “my task”
CQ 19(site1,2,3): “contact”
Task sheet Spelling mistakes
Task not cover the
question
Lack of a subject
Personal information
need
Vague task
Task5 (site1,2,3): “search
engineer”
Task9(site 1): Did not cover
CQ38
Task9(site 1): Did not mention
the complaint subject
Task6,9(site 1,2,3): Need
personal information
Task5(site 3): “use search engine
to fine the cost for adoption
application of „Free School
Meals‟”
Task5(site 1,2,3): “search
engine”
Task9(site 1): add sign-in sub
task in the task 9
Task9(site 1): specify “no street
lamp” as the complaint subject
Task 6,9(site1,2,3) : A personal
ID is offered on separate sheet
Task5(site 3): Delete
“adoption”
Table 2 Changes to the information sheet based on the pilot study
Information sheet Issues description Proposed changes
Time assigned section Did not mention the time assigned
before starting the tasks
Five minutes assigned to practise with e-
government site
Observation section Difficult to observe a task completion
The participants are required to show each
task result to the observer
Once the result is confirmed, the participants
are required to go back home page to restart
the next task
Questionnaire section Did not mention whether e-government
can be interacted with to support filling
out the questionnaire
The participants are allowed to play with e-
government during the questionnaire time
Table 3 Problems identification based on the pilot study
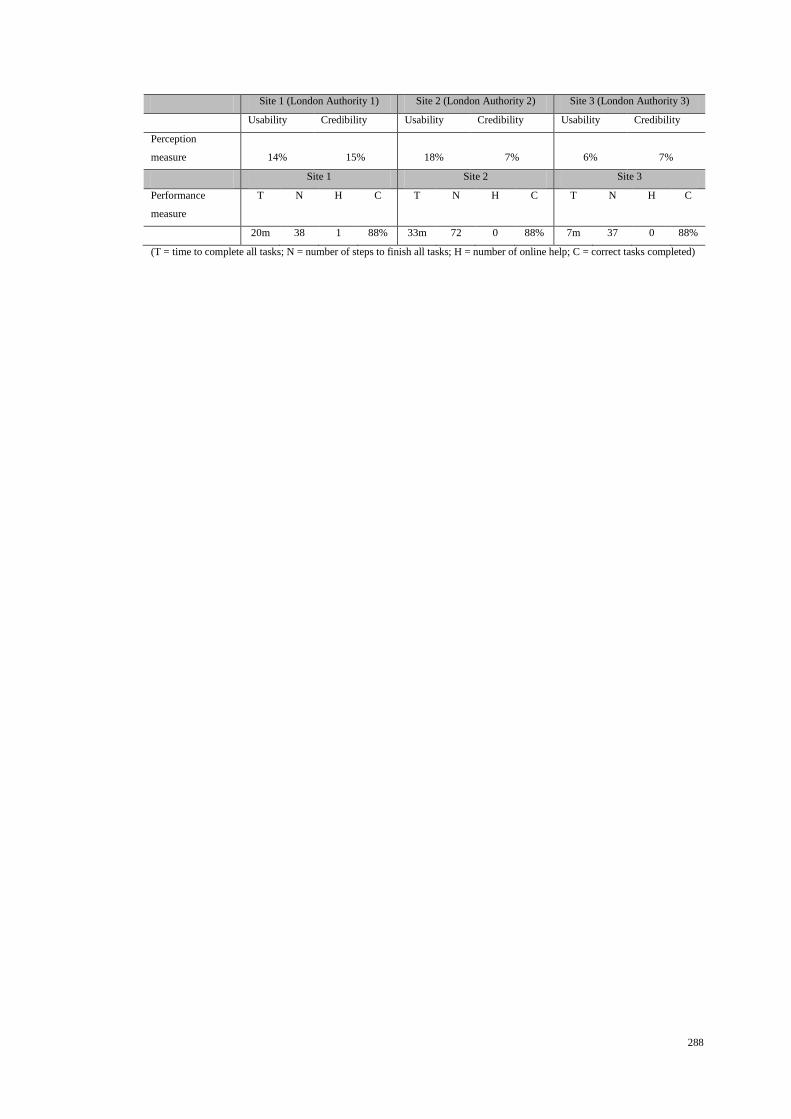
288
Site 1 (London Authority 1) Site 2 (London Authority 2) Site 3 (London Authority 3)
Usability Credibility Usability Credibility Usability Credibility
Perception
measure 14% 15% 18% 7% 6% 7%
Site 1 Site 2 Site 3
Performance
measure
T N H C T N H C T N H C
20m 38 1 88% 33m 72 0 88% 7m 37 0 88%
(T = time to complete all tasks; N = number of steps to finish all tasks; H = number of online help; C = correct tasks completed)

289
Appendix 3b: Pilot study 2
Pilot study 2
The second pilot study is used to assess whether the research instruments,
measurements, experimental procedure and timing are appropriately designed in
experiment 2. In addition, it attempts to look for whether there are any mistakes
during the experiment. Therefore, this pilot study is conducted prior to the formal
experiment 2 commencement. Three PhD students at Brunel University take part in
the pilot study and are randomly allocated to three redesigned e-government websites
(one participant for each redesigned e-government website). During the pilot study,
the researcher acts as an observer to detect the potential problems in aspects of the
design, instruments and process of experiment 2. The process of the pilot study
follows the experimental procedure, which requires each participant to have three
phases: free-flow inspection; task-based interaction and completing the questionnaire.
Based on the findings from the observation and the feedback of the participants, some
important changes are made for experiment 2. Table 1 summarises the problems
identified in terms of the research instruments and experimental introduction from the
pilot study, and the corresponding changes are also indicated.
Table 1 Changes to the research instruments based on the findings in the pilot study 2
Research
instruments
Issues description Evidences Proposed changes
Questionnaire Vague statement
UQ3 (site 2): “I can clearly see the
task process because the system‟s
progress has been indicated”
UQ3 (site 2): “I can clearly see my task
progress because a progress indicator
has been presented”
Task sheet Personal
information need
Vague task
Overloaded subjects
Task 4 (site 1): need extra personal
information about user‟ kid
Task 2 (site 1): “please check the
online help option, and then find the
general information about council tax
in Harrow Council”
Task 3 (site 2): “find the latest news
about Hillingdon First in Hillingdon
Council”
Task 7 (site 3): “a general enquiry
online form”
Task 2 (site 2) “please find the
Task 4 (site 1): kid‟s name and school
information are provied on personal ID
Task 2 (site 1): “please use the online
help option to find how to use this
website, and then go back home page to
find the general information about
council tax in Harrow Council”
Task 3 (site 2): “find the latest news
about Hillingdon First supporting
business in Hillingdon Council”
Task 7 (site 3): “an online enquiry form”
Task 2 (site 2) “please find the
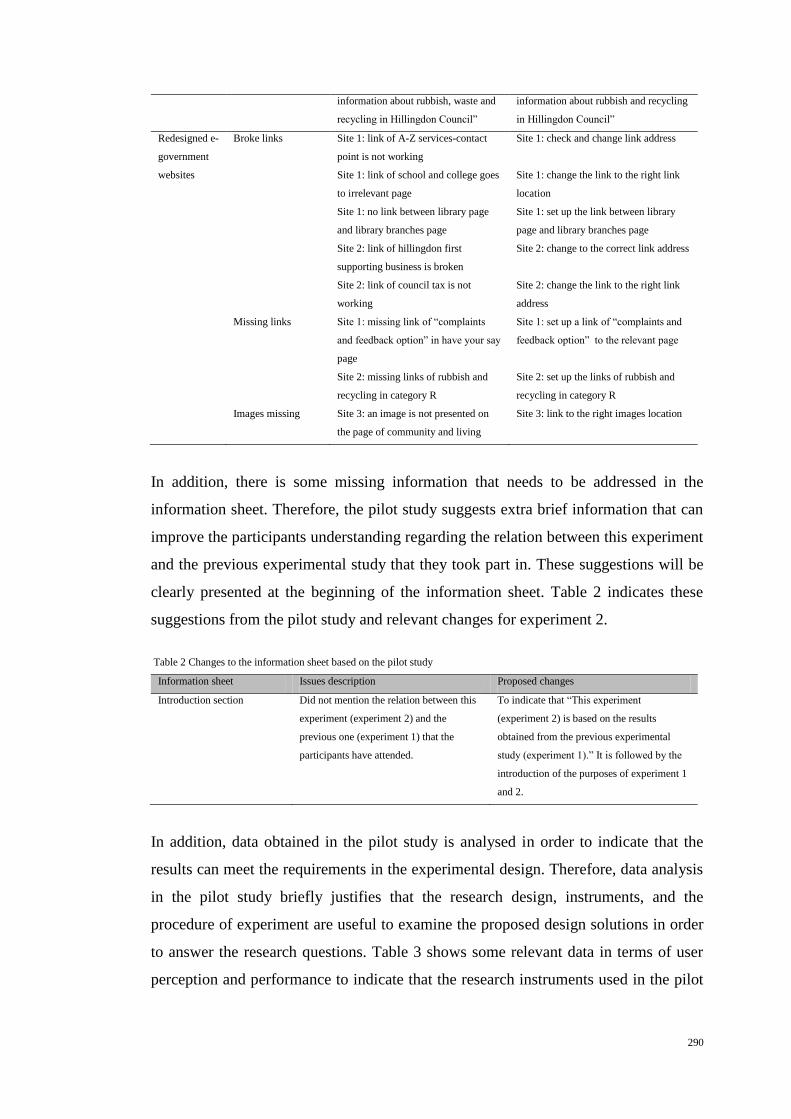
290
information about rubbish, waste and
recycling in Hillingdon Council”
information about rubbish and recycling
in Hillingdon Council”
Redesigned e-
government
websites
Broke links
Missing links
Images missing
Site 1: link of A-Z services-contact
point is not working
Site 1: link of school and college goes
to irrelevant page
Site 1: no link between library page
and library branches page
Site 2: link of hillingdon first
supporting business is broken
Site 2: link of council tax is not
working
Site 1: missing link of “complaints
and feedback option” in have your say
page
Site 2: missing links of rubbish and
recycling in category R
Site 3: an image is not presented on
the page of community and living
Site 1: check and change link address
Site 1: change the link to the right link
location
Site 1: set up the link between library
page and library branches page
Site 2: change to the correct link address
Site 2: change the link to the right link
address
Site 1: set up a link of “complaints and
feedback option” to the relevant page
Site 2: set up the links of rubbish and
recycling in category R
Site 3: link to the right images location
In addition, there is some missing information that needs to be addressed in the
information sheet. Therefore, the pilot study suggests extra brief information that can
improve the participants understanding regarding the relation between this experiment
and the previous experimental study that they took part in. These suggestions will be
clearly presented at the beginning of the information sheet. Table 2 indicates these
suggestions from the pilot study and relevant changes for experiment 2.
Table 2 Changes to the information sheet based on the pilot study
Information sheet Issues description Proposed changes
Introduction section Did not mention the relation between this
experiment (experiment 2) and the
previous one (experiment 1) that the
participants have attended.
To indicate that “This experiment
(experiment 2) is based on the results
obtained from the previous experimental
study (experiment 1).” It is followed by the
introduction of the purposes of experiment 1
and 2.
In addition, data obtained in the pilot study is analysed in order to indicate that the
results can meet the requirements in the experimental design. Therefore, data analysis
in the pilot study briefly justifies that the research design, instruments, and the
procedure of experiment are useful to examine the proposed design solutions in order
to answer the research questions. Table 3 shows some relevant data in terms of user
perception and performance to indicate that the research instruments used in the pilot

291
study can be used for examining the effects of proposed design solutions in
experiment 2.
Table 3 Results obtained from the pilot study
Site 1
(redesigned London Authority 1)
Site 2
(redesigned London Authority 2)
Site 3
(redesigned London Authority 3)
Usability
problems
Credibility
problems
Usability
problems
Credibility
problems
Usability
problems
Credibility
problems
Perception
measure Improved Improved Improved Improved Improved Improved
Site 1 Site 2 Site 3
Performance
measure
T N H C T N H C T N H C
12.08m 34 0 100% 7.05m 25 0 100% 12.45m 32 0 100
%
(T = time to complete all tasks; N = number of steps to finish all tasks; H = number of online help; C = correct tasks completed)

292
Appendix 4a: Usability and credibility questionnaire for London Authority 1 in
experiment 1
Usability and credibility questionnaire
The purpose of this questionnaire is to assess the users‟ perception of usability and credibility of e-
government. The information you give will be entirely confidential and will not be shared with any
people not directly connected with this project. Please answer honestly and as accurately as you can.
Your contribution is much appreciated.
Many thanks
Zhao Huang
---------------------------------------------------------------------------------------------------------
Please choose the one most appropriate response to each statement
Personal information
Please select your gender:
Male□
□
Please select your age
range:
20-25□ -30□ -35□ -45□ □
On average, how many
hours a week do you
spend on the Internet?
0-5□ -10□ -15□ -20 □ □
Usability evaluation
Visibility of system status Strongly
Agree
Agree Neutral Disagree Strongly
Disagree
1. A title with every page clearly
indicates the subject of the content.
□
□
□
□
□
2. It is easy to know the option in
subcategories because the labels used are
helpful to identify the option.
□
□
□
□
□
3. It is easy to distinguish information
because different parts of the screen
present different sorts of information.
□
□
□
□
□
4. It is clear to see where I have been
because the navigational path has been
indicated.
□
□
□
□
□
5. It is clear to see related information in
a subject area because interdependent
options appear on the same screen.
□
□
□
□
□
Match between system and the real
world Strongly
Agree
Agree Neutral Disagree Strongly
Disagree
6. I can clearly see the site‟s response
time delay because the site‟s progress
has been indicated.
□
□
□
□
□
7. I like that the selected colours
correspond to my expectations.
□ □ □ □ □
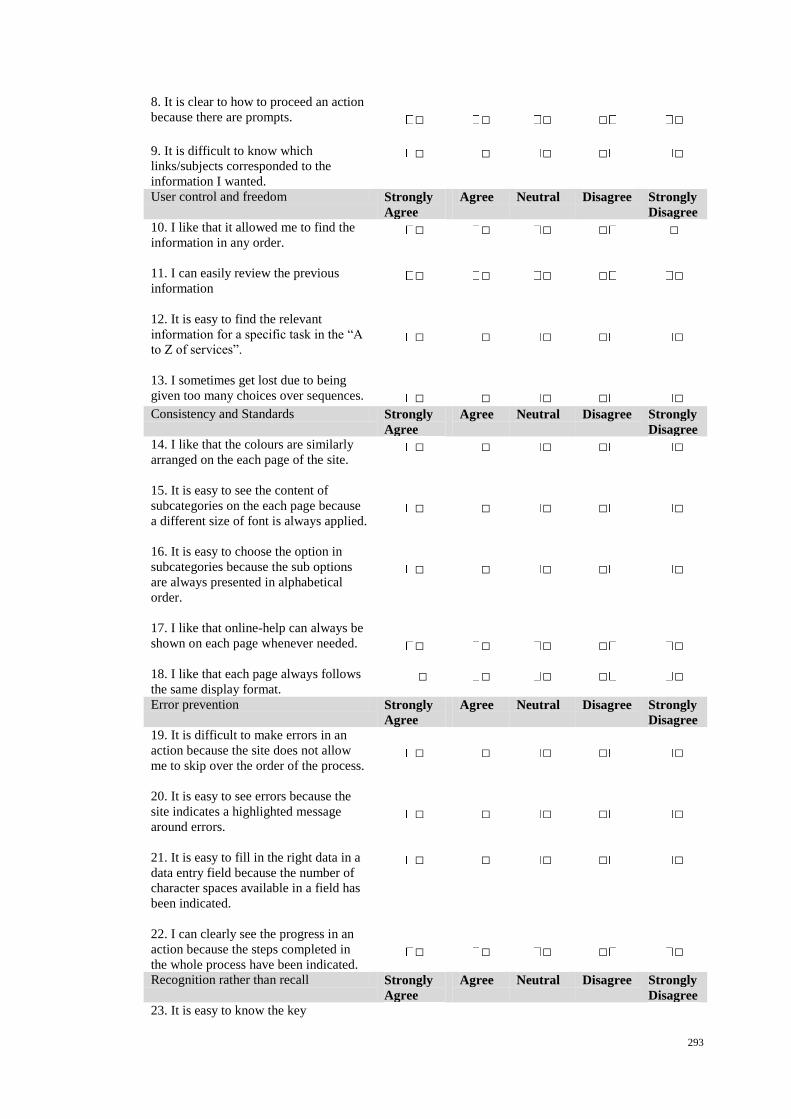
293
8. It is clear to how to proceed an action
because there are prompts.
□
□
□
□
□
9. It is difficult to know which
links/subjects corresponded to the
information I wanted.
□
□
□
□
□
User control and freedom Strongly
Agree
Agree Neutral Disagree Strongly
Disagree
10. I like that it allowed me to find the
information in any order.
□ □ □ □ □
11. I can easily review the previous
information
□ □ □ □ □
12. It is easy to find the relevant
information for a specific task in the “A
to Z of services”.
□
□
□
□
□
13. I sometimes get lost due to being
given too many choices over sequences.
□
□
□
□
□
Consistency and Standards Strongly
Agree
Agree Neutral Disagree Strongly
Disagree
14. I like that the colours are similarly
arranged on the each page of the site.
□ □ □ □ □
15. It is easy to see the content of
subcategories on the each page because
a different size of font is always applied.
□
□
□
□
□
16. It is easy to choose the option in
subcategories because the sub options
are always presented in alphabetical
order.
□
□
□
□
□
17. I like that online-help can always be
shown on each page whenever needed.
□
□
□
□
□
18. I like that each page always follows
the same display format. □ □ □ □ □
Error prevention Strongly
Agree
Agree Neutral Disagree Strongly
Disagree
19. It is difficult to make errors in an
action because the site does not allow
me to skip over the order of the process.
□
□
□
□
□
20. It is easy to see errors because the
site indicates a highlighted message
around errors.
□
□
□
□
□
21. It is easy to fill in the right data in a
data entry field because the number of
character spaces available in a field has
been indicated.
□
□
□
□
□
22. I can clearly see the progress in an
action because the steps completed in
the whole process have been indicated.
□
□
□
□
□
Recognition rather than recall Strongly
Agree
Agree Neutral Disagree Strongly
Disagree
23. It is easy to know the key

294
information/subject sought because it is
placed in a central location on the page.
□ □ □ □ □
24. It is confused at the home page
because some options are not clear.
□
□
□
□
□
25. It is easy to read text because
“breathing space” has been appropriately
used in text areas.
□
□
□
□
□
Flexibility and efficiency of use Strongly
Agree
Agree Neutral Disagree Strongly
Disagree
26. The options/links used are all
working properly.
□ □ □ □ □
27. It is difficult to choose the option in
the subcategories because no detailed
information is provided for these
options.
□ □ □ □ □
28. It is difficult to see the most relevant
result using the search engine because
arrangement of results is not in level of
relevance.
□ □ □ □ □
29. It is easy to find detailed information
because the menu presents options in an
hierarchical way.
□
□
□
□
□
Aesthetic and minimalist design Strongly
Agree
Agree Neutral Disagree Strongly
Disagree
30. Each image corresponds to each
context because it is relevant to the
subject.
□ □ □ □ □
31. Each page is uncluttered in content
presentation.
□ □ □ □ □
32. It clearly indicates which
choices/links are already used. □ □ □ □ □
33. I am confused with links that have
different colours.
□
□
□
□
□
34. It can lead my eyes in the
appropriate direction because white
space is used to create symmetry.
□
□
□
□
□
Help users recognize, diagnose, and
recover from errors Strongly
Agree
Agree Neutral Disagree Strongly
Disagree
35. It is easy to correct the errors when
filling out forms because the system
indicates what is causing the error.
□ □ □ □ □
36. It is easy to understand the errors
because the site interprets what causes
the errors.
□ □ □ □ □
37. It is clear to distinguish a
compulsory or optional field because a
marker has been indicated.
□ □ □ □ □
38. It is quick to change the particular □ □ □ □ □
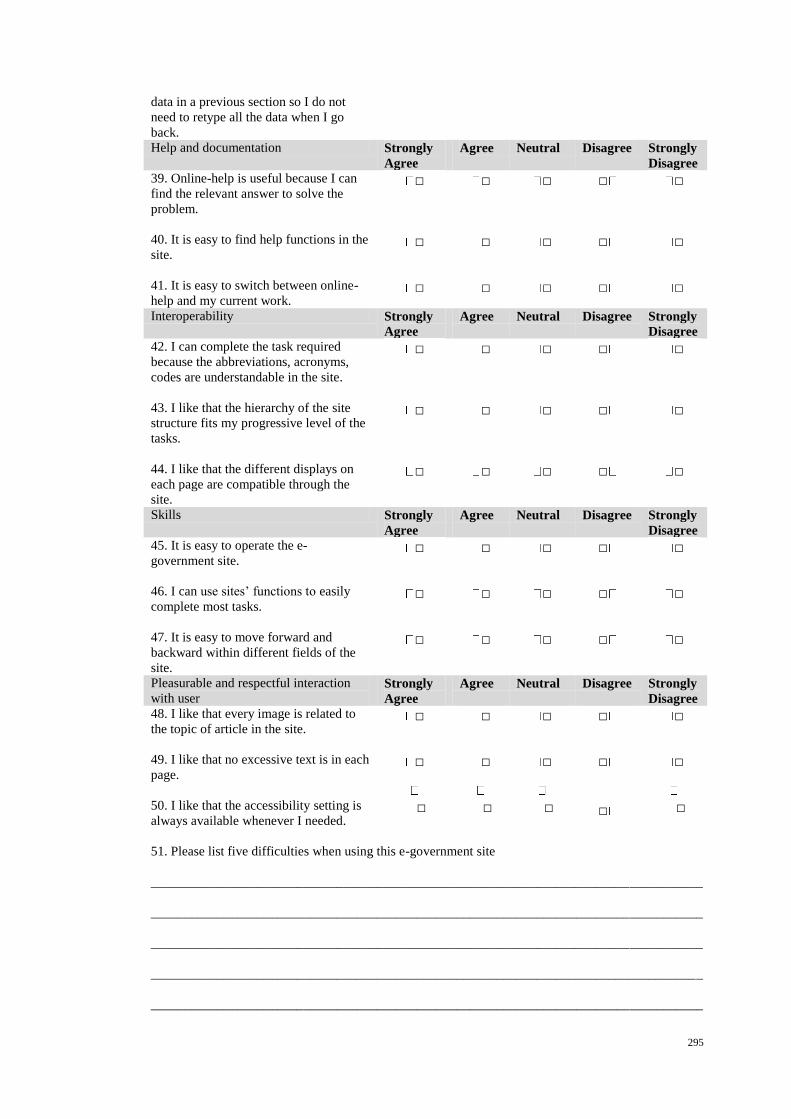
295
data in a previous section so I do not
need to retype all the data when I go
back.
Help and documentation Strongly
Agree
Agree Neutral Disagree Strongly
Disagree
39. Online-help is useful because I can
find the relevant answer to solve the
problem.
□ □ □ □ □
40. It is easy to find help functions in the
site.
□ □ □ □ □
41. It is easy to switch between online-
help and my current work. □ □ □ □ □
Interoperability Strongly
Agree
Agree Neutral Disagree Strongly
Disagree
42. I can complete the task required
because the abbreviations, acronyms,
codes are understandable in the site.
□ □ □ □ □
43. I like that the hierarchy of the site
structure fits my progressive level of the
tasks.
□ □ □ □ □
44. I like that the different displays on
each page are compatible through the
site.
□ □ □ □ □
Skills Strongly
Agree
Agree Neutral Disagree Strongly
Disagree
45. It is easy to operate the e-
government site.
□ □ □ □ □
46. I can use sites‟ functions to easily
complete most tasks.
□ □ □ □ □
47. It is easy to move forward and
backward within different fields of the
site.
□ □ □ □ □
Pleasurable and respectful interaction
with user Strongly
Agree
Agree Neutral Disagree Strongly
Disagree
48. I like that every image is related to
the topic of article in the site.
□ □ □ □ □
49. I like that no excessive text is in each
page. □ □ □ □ □
50. I like that the accessibility setting is
always available whenever I needed.
□
□
□
□
□
51. Please list five difficulties when using this e-government site
___________________________________________________________________________________
___________________________________________________________________________________
___________________________________________________________________________________
___________________________________________________________________________________
___________________________________________________________________________________

296
52. Please list five usability strengths of this e-government site
___________________________________________________________________________________
___________________________________________________________________________________
___________________________________________________________________________________
___________________________________________________________________________________
___________________________________________________________________________________
53. Please list five usability weaknesses of this e-government site
___________________________________________________________________________________
___________________________________________________________________________________
___________________________________________________________________________________
___________________________________________________________________________________
Credibility evaluation
System looks professional Strongly
agree
Agree Neutral Disagree Strongly
Disagree
1. The content of the site matches with
information you expect to obtain from a local
council.
□ □ □ □ □
2. I can easily find relevant information
because information is presented with
consistent colours.
□ □ □ □ □
3. It is easy to read information in the site
because the content is organised by subject
categories.
□ □ □ □ □
4. It is easy to see relationships between the
pages because each page is labelled. □ □ □ □ □
Easy to verify the information accuracy Strongly
agree
Agree Neutral Disagree Strongly
Disagree
5. I like that the information on each page is at
the right level of details.
□ □ □ □ □
6. It is easy to locate a relevant subcategory
because the subcategories are arranged in an
alphabetical order.
□ □ □ □ □
7. Information presented in a page matches
with the name of the categories.
□ □ □ □ □
8. The URL properly presents the domain
name of the local council, e.g. ending with
“gov.uk”
□ □ □ □ □
Show a real organization behind site Strongly
agree
Agree Neutral Disagree Strongly
Disagree
9. It is easy to find a postal address of the local □ □ □ □ □

297
council offices in the site.
10. I like that the site displays photos of offices
or staff members.
□ □ □ □ □
11. It is easy to see the site‟s accreditations
because the site links with other governmental
bodies.
□ □ □ □ □
Highlight the expertise in your organization
and in the content and services provided Strongly
agree
Agree Neutral Disagree Strongly
Disagree
12. It is clear to understand the policies and
services offered by the site because detailed
information is provided.
□ □ □ □ □
13. Information presented in the site can make
you believe in the reliability of the local
council.
□ □ □ □ □
14. Prompts /messages displayed are concise to
help you complete the tasks. □ □ □ □ □
Show that honest, trustworthy people stand
your site Strongly
agree
Agree Neutral Disagree Strongly
Disagree
15. It is easy to see the information about the
local council because the site provides an
“About use” option.
□ □ □ □ □
16. It is clear to see the site‟s credentials
because the site displays awards it has earned.
□ □ □ □ □
17. It is easy to find information about people
who are working or in charge of the local
council.
□ □ □ □ □
Make it easy to contact you Strongly
agree
Agree Neutral Disagree Strongly
Disagree
18. It is easy to find contact information
because the “Contact” option has been clearly
indicated.
□ □ □ □ □
19. I like that different contact methods are
provided.
□ □ □ □ □
20. It is easy to find the detailed levels of the
contact information because the contact
information has been organised by different
departments.
□ □ □ □ □
Make site ease to use and useful Strongly
agree
Agree Neutral Disagree Strongly
Disagree
21. I can quickly start my task because the site
is easy to use.
□ □ □ □ □
22. There is a clear description to help me
identify where I am in the site.
□ □ □ □ □
23. It is clear to indicate how much I have done
and how much was left when I complete the
tasks.
□ □ □ □ □
24. It is easy to choose a suitable option from
search results because the option is organised
by the level of relevance.
□ □ □ □ □
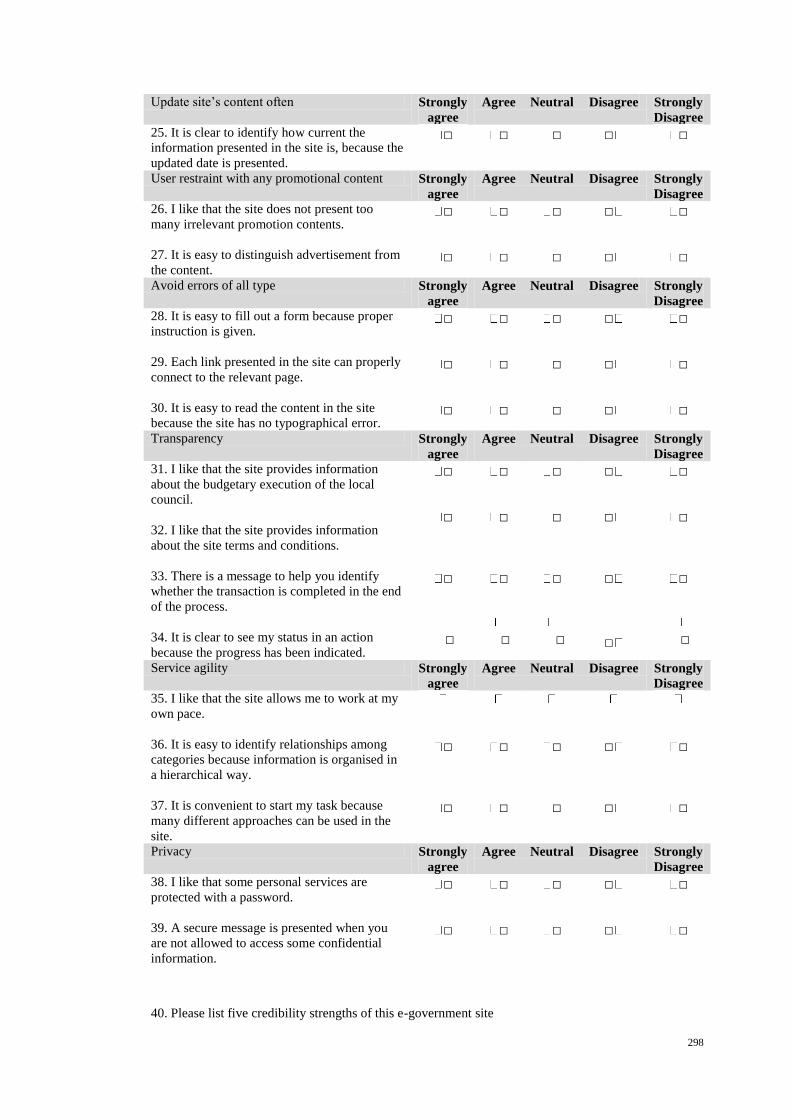
298
Update site‟s content often Strongly
agree
Agree Neutral Disagree Strongly
Disagree
25. It is clear to identify how current the
information presented in the site is, because the
updated date is presented.
□ □ □ □ □
User restraint with any promotional content Strongly
agree
Agree Neutral Disagree Strongly
Disagree
26. I like that the site does not present too
many irrelevant promotion contents.
□ □ □ □ □
27. It is easy to distinguish advertisement from
the content. □ □ □ □ □
Avoid errors of all type Strongly
agree
Agree Neutral Disagree Strongly
Disagree
28. It is easy to fill out a form because proper
instruction is given.
□ □ □ □ □
29. Each link presented in the site can properly
connect to the relevant page.
□ □ □ □ □
30. It is easy to read the content in the site
because the site has no typographical error. □ □ □ □ □
Transparency Strongly
agree
Agree Neutral Disagree Strongly
Disagree
31. I like that the site provides information
about the budgetary execution of the local
council.
□ □ □ □ □
32. I like that the site provides information
about the site terms and conditions.
□ □ □ □ □
33. There is a message to help you identify
whether the transaction is completed in the end
of the process.
□ □ □ □ □
34. It is clear to see my status in an action
because the progress has been indicated.
□
□
□
□
□
Service agility Strongly
agree
Agree Neutral Disagree Strongly
Disagree
35. I like that the site allows me to work at my
own pace.
36. It is easy to identify relationships among
categories because information is organised in
a hierarchical way.
□ □ □ □ □
37. It is convenient to start my task because
many different approaches can be used in the
site.
□ □ □ □ □
Privacy Strongly
agree
Agree Neutral Disagree Strongly
Disagree
38. I like that some personal services are
protected with a password.
□ □ □ □ □
39. A secure message is presented when you
are not allowed to access some confidential
information.
□ □ □ □ □
40. Please list five credibility strengths of this e-government site

299
_____________________________________________________________________
_____________________________________________________________________
_____________________________________________________________________
_____________________________________________________________________
_____________________________________________________________________
41. Please list five credibility weaknesses of this e-government site
_____________________________________________________________________
_____________________________________________________________________
_____________________________________________________________________
_____________________________________________________________________
_____________________________________________________________________

300
Appendix 4b: Usability and credibility questionnaire for London Authority 2 in
experiment 1
Usability and credibility questionnaire
The purpose of this questionnaire is to assess the users‟ perception of usability and credibility of e-
government. The information you give will be entirely confidential and will not be shared with any
people not directly connected with this project. Please answer honestly and as accurately as you can.
Your contribution is much appreciated.
Many thanks
Zhao Huang
--------------------------------------------------------------------------------------------------------
Please choose the one most appropriate response to each statement
Personal information
Please select your
gender:
□
□
Please select your age
range:
-25□ -30□ -35□ -45□ □
On average, how many
hours a week do you
spend on the Internet?
-5□ -10□ -15□ -20□ □
Usability evaluation
Visibility of system status Strongly
Agree
Agree Neutral Disagree Strongly
Disagree
1. A title with every page clearly indicates the
subject of the content.
□
□
□
□
□
2. It is easy to know the option in subcategories
because the graphics used are helpful to
identify the option.
□
□
□
□
□
3. It is easy to distinguish information because
different parts of the screen present different
sorts of information.
□
□
□
□
□
4. It is difficult to see where I have been
because the navigational path has not been
clearly indicated.
□
□
□
□
□
5. It is clear to see related information in a
subject area because interdependent options
appear on the same screen.
□
□
□
□
□
Match between system and the real world Strongly
Agree
Agree Neutral Disagree Strongly
Disagree
6. I can clearly see the site‟s response time
delay because the site‟s progress has been
indicated.
□
□
□
□
□
7. I like that the selected colours correspond to
my expectations. □ □ □ □ □

301
8. It is clear to how to proceed an action
because there are prompts. □
□
□
□
□
9. It is difficult to know which links/subjects
corresponded to the information I wanted.
□
□
□
□
□
User control and freedom Strongly
Agree
Agree Neutral Disagree Strongly
Disagree
10. I like that it allowed me to find the
information in any order.
□
□
□
□
□
11. I can easily review the previous
information
□
□
□
□
□
12. It is easy to find the relevant information
for a specific task in the “A to Z of services”.
□
□
□
□
□
13. I sometimes get lost due to being given too
many choices over sequences. □
□
□
□
□
Consistency and Standards Strongly
Agree
Agree Neutral Disagree Strongly
Disagree
14. I like the fact that the colours are similarly
arranged on the each page of the site.
□
□
□
□
□
15. It is easy to see the content of subcategories
on the each page because a different size of
font is always applied.
□
□
□
□
□
16. It is easy to choose the option in
subcategories because the sub options are
always presented in alphabetical order.
□
□
□
□
□
17. I like that online-help can always be shown
on each page whenever needed.
□
□
□
□
□
18. I like that each page always follows the
same display format. □
□
□
□
□
Error prevention Strongly
Agree
Agree Neutral Disagree Strongly
Disagree
19. It is easy to make errors in an action
because the site allows me to skip over the
order of the process.
□
□
□
□
□
20. It is easy to see errors because the site
indicates a highlighted message around errors. □
□
□
□
□
21. It is easy to fill in the right data in a data
entry field because the number of character
spaces available in a field has been indicated.
□
□
□
□
□
22. I can clearly see the progress in an action
because the steps completed in the whole
process have been indicated.
□
□
□
□
□
Recognition rather than recall Strongly
Agree
Agree Neutral Disagree Strongly
Disagree
23. It is easy to know the key
information/subject sought because it is placed
in a central location of the page.
□
□
□
□
□

302
24. It is confused at the home page because
some options are not clear.
□
□
□
□
□
25. It is easy to read text because “breathing
space” has been appropriately used in text
areas.
□
□
□
□
□
Flexibility and efficiency of use Strongly
Agree
Agree Neutral Disagree Strongly
Disagree
26. The options/links used are all working
properly.
□
□
□
□
□
27. It is easy to choose the option in the
subcategories because the brief information is
provided for these options.
□
□
□
□
□
28. It is difficult to see the most relevant result
using the search engine because arrangement
of results is not in level of relevance.
□
□
□
□
□
29. It is easy to find detailed information
because the menu presents options in a
hierarchical way.
□
□
□
□
□
Aesthetic and minimalist design Strongly
Agree
Agree Neutral Disagree Strongly
Disagree
30. Each image corresponds to each context
because it is relevant to the subject.
□
□
□
□
□
31. Each page is uncluttered in content
presentation.
□
□
□
□
□
32. It clearly indicates which choices/links are
already used. □
□
□
□
□
33. I am confused with links that have different
colours.
□
□
□
□
□
34. It can lead my eyes in the appropriate
direction because white space is used to create
symmetry.
□
□
□
□
□
Help users recognize, diagnose, and recover
from errors Strongly
Agree
Agree Neutral Disagree Strongly
Disagree
35. It is easy to correct the errors when filling
out forms because the system indicates what is
causing the error.
□
□
□
□
□
36. It is easy to understand the errors because
the site interprets what causes the errors.
□
□
□
□
□
37. It is clear to distinguish a compulsory or
optional field because a marker has been
indicated.
□
□
□
□
□
38. It is quick to change the particular data in a
previous section so I do not need to retype all
the data when I go back.
□
□
□
□
□
Help and documentation Strongly
Agree
Agree Neutral Disagree Strongly
Disagree
39. Online-help are useful because I can find
the relevant answer to solve the problem.
□
□
□
□
□

303
40. It is easy to find help functions in the site.
□
□
□
□
□
41. It is easy to switch between online-help and
my current work. □
□
□
□
□
Interoperability Strongly
Agree
Agree Neutral Disagree Strongly
Disagree
42. I can complete the task required because
the abbreviations, acronyms, codes are
understandable in the site.
□
□
□
□
□
43. I like that the hierarchy of the site structure
fits my progressive level of the tasks.
□
□
□
□
□
44. I like that the different displays on each
page are compatible through the site. □
□
□
□
□
Skills Strongly
Agree
Agree Neutral Disagree Strongly
Disagree
45. It is easy to operate the e-government site.
□
□
□
□
□
46. I can use sites‟ functions to easily complete
most tasks.
□
□
□
□
□
47. It is easy to move forward and backward
within different fields of the site. □
□
□
□
□
Pleasurable and respectful interaction with user Strongly
Agree
Agree Neutral Disagree Strongly
Disagree
48. I like that every image is related to the
topic of article in the site.
□
□
□
□
□
49. I like that no excessive text is in each page. □
□
□
□
□
50. I like that the accessibility setting is always
available whenever I needed.
□
□
□
□
□
51. Please list five difficulties when using this e-government site
_____________________________________________________________________
_____________________________________________________________________
_____________________________________________________________________
_____________________________________________________________________
_____________________________________________________________________
52. Please list five usability strengths of this e-government site
_____________________________________________________________________
_____________________________________________________________________
_____________________________________________________________________

304
_____________________________________________________________________
_____________________________________________________________________
53. Please list five usability weaknesses of this e-government site
_____________________________________________________________________
_____________________________________________________________________
_____________________________________________________________________
_____________________________________________________________________
_____________________________________________________________________
Credibility evaluation
System looks professional Strongly
agree
Agree Neutral Disagree Strongly
Disagree
1. The content of the site matches with
information you expect to obtain from a local
council.
□
□
□
□
□
2. I can easily find relevant information
because content is presented with consistent
layout.
□
□
□
□
□
3. It is easy to read information in the site
because the content is organised by subject
categories.
□
□
□
□
□
4. It is easy to see relationships between the
pages because each page is labelled. □
□
□
□
□
Easy to verify the information accuracy Strongly
agree
Agree Neutral Disagree Strongly
Disagree
5. I like that the information on each page is at
the right level of details.
□
□
□
□
□
6. It is easy to locate a relevant subcategory
because the subcategories are arranged in an
alphabetical order.
□
□
□
□
□
7. Information presented in a page matches
with the name of the categories.
□
□
□
□
□
8. The URL properly presents the domain
name of the local council, e.g. ending with
“gov.uk”
□
□
□
□
□
Show a real organization behind site Strongly
agree
Agree Neutral Disagree Strongly
Disagree
9. It is easy to find a postal address of the local
council offices in the site.
□
□
□
□
□
10. I like that the site displays photos of offices
or staff members.
□
□
□
□
□
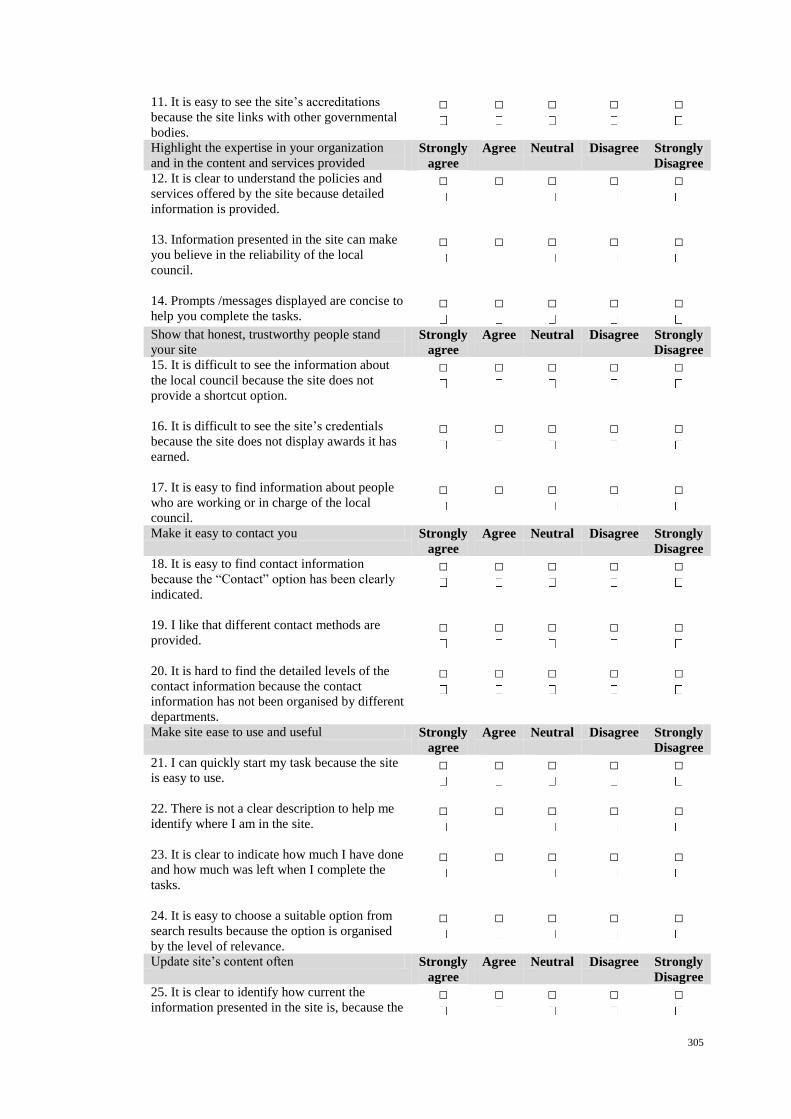
305
11. It is easy to see the site‟s accreditations
because the site links with other governmental
bodies.
□
□
□
□
□
Highlight the expertise in your organization
and in the content and services provided Strongly
agree
Agree Neutral Disagree Strongly
Disagree
12. It is clear to understand the policies and
services offered by the site because detailed
information is provided.
□
□
□
□
□
13. Information presented in the site can make
you believe in the reliability of the local
council.
□
□
□
□
□
14. Prompts /messages displayed are concise to
help you complete the tasks. □
□
□
□
□
Show that honest, trustworthy people stand
your site Strongly
agree
Agree Neutral Disagree Strongly
Disagree
15. It is difficult to see the information about
the local council because the site does not
provide a shortcut option.
□
□
□
□
□
16. It is difficult to see the site‟s credentials
because the site does not display awards it has
earned.
□
□
□
□
□
17. It is easy to find information about people
who are working or in charge of the local
council.
□
□
□
□
□
Make it easy to contact you Strongly
agree
Agree Neutral Disagree Strongly
Disagree
18. It is easy to find contact information
because the “Contact” option has been clearly
indicated.
□
□
□
□
□
19. I like that different contact methods are
provided.
□
□
□
□
□
20. It is hard to find the detailed levels of the
contact information because the contact
information has not been organised by different
departments.
□
□
□
□
□
Make site ease to use and useful Strongly
agree
Agree Neutral Disagree Strongly
Disagree
21. I can quickly start my task because the site
is easy to use.
□
□
□
□
□
22. There is not a clear description to help me
identify where I am in the site.
□
□
□
□
□
23. It is clear to indicate how much I have done
and how much was left when I complete the
tasks.
□
□
□
□
□
24. It is easy to choose a suitable option from
search results because the option is organised
by the level of relevance.
□
□
□
□
□
Update site‟s content often Strongly
agree
Agree Neutral Disagree Strongly
Disagree
25. It is clear to identify how current the
information presented in the site is, because the □
□
□
□
□

306
updated date is presented.
User restraint with any promotional content Strongly
agree
Agree Neutral Disagree Strongly
Disagree
26. I like that the site does not present too
many irrelevant promotion contents.
□
□
□
□
□
27. It is easy to distinguish advertisement from
the content. □
□
□
□
□
Avoid errors of all type Strongly
agree
Agree Neutral Disagree Strongly
Disagree
28. It is easy to fill out a form because proper
instruction is given.
□
□
□
□
□
29. Each link presented in the site can properly
connect to the relevant page.
□
□
□
□
□
30. It is easy to read the content in the site
because the site has no typographical error. □
□
□
□
□
Transparency Strongly
agree
Agree Neutral Disagree Strongly
Disagree
31. I like that the site provides information
about the budgetary execution of the local
council.
□
□
□
□
□
32. I like that the site provides information
about the site terms and conditions.
□
□
□
□
□
33. There is a message to help you identify
whether the transaction is completed in the end
of the process.
□
□
□
□
□
34. It is clear to see my status in an action
because the progress has been indicated.
□
□
□
□
□
Service agility Strongly
agree
Agree Neutral Disagree Strongly
Disagree
35. I like that the site allows me to work at my
own pace.
□
□
□
□
□
36. It is easy to identify relationships among
categories because information is organised in
a hierarchical way.
□
□
□
□
□
37. It is convenient to start my task because
many different approaches can be used in the
site.
□
□
□
□
□
Privacy Strongly
agree
Agree Neutral Disagree Strongly
Disagree
38. It is hard to see a sign-in option when I do
some personal services.
□
□
□
□
□
39. A secure message is presented when you
are not allowed to access some confidential
information.
□
□
□
□
□
40. Please list five credibility strengths of this e-government site
_____________________________________________________________________

307
_____________________________________________________________________
_____________________________________________________________________
_____________________________________________________________________
_____________________________________________________________________
41. Please list five credibility weaknesses of this e-government site
_____________________________________________________________________
_____________________________________________________________________
_____________________________________________________________________
_____________________________________________________________________
_____________________________________________________________________

308
Appendix 4c: Usability and credibility questionnaire for London Authority 3 in
experiment 1
Usability and credibility questionnaire
The purpose of this questionnaire is to assess the users‟ perception of usability and credibility of e-
government. The information you give will be entirely confidential and will not be shared with any
people not directly connected with this project. Please answer honestly and as accurately as you can.
Your contribution is much appreciated.
Many thanks
Zhao Huang
--------------------------------------------------------------
Please choose the one most appropriate response to each statement
Personal information
Please select your
gender:
Male□
□
Please select your age
range:
20-25□ -30□ -35□ -45□ □
On average, how many
hours a week do you
spend on the Internet?
0-5□ -10□ -15□ -20□ □
Usability evaluation
Visibility of system status Strongly
Agree
Agree Neutral Disagree Strongly
Disagree
1. A title with every page clearly indicates the
subject of the content.
□
□
□
□
□
2. It is difficult to know the option in
subcategories because only text is used to
identify the option.
□
□
□
□
□
3. It is easy to distinguish information because
different parts of the screen present different
sorts of information.
□
□
□
□
□
4. It is clear to see where I have been because
the navigational path has been indicated. □
□
□
□
□
5. It is clear to see related information in a
subject area because interdependent options
appear on the same screen.
□
□
□
□
□
Match between system and the real world Strongly
Agree
Agree Neutral Disagree Strongly
Disagree
6. I can clearly see the site‟s response time
delay because the site‟s progress has been
indicated.
□
□
□
□
□
7. I like that the selected colours correspond to
my expectations. □
□
□
□
□

309
8. It is not clear to how to proceed an action
because there is no prompt. □
□
□
□
□
9. It is difficult to know which links/subjects
corresponded to the information I wanted.
□
□
□
□
□
User control and freedom Strongly
Agree
Agree Neutral Disagree Strongly
Disagree
10. I like that it allowed me to find the
information in any order.
□
□
□
□
□
11. I can easily review the previous
information
□
□
□
□
□
12. It is easy to find the relevant information
for a specific task in the “A to Z of services”.
□
□
□
□
□
13. I sometimes get lost due to being given too
many choices over sequences. □
□
□
□
□
Consistency and Standards Strongly
Agree
Agree Neutral Disagree Strongly
Disagree
14. I like that the colours are similarly arranged
on the each page of the site.
□
□
□
□
□
15. It is easy to see the content of subcategories
on the each page because a different colour of
subtitle is always indicated.
□
□
□
□
□
16. It is difficult to choose the option in
subcategories because no fix order of sub
options is used in subcategories.
□
□
□
□
□
17. I like that online-help can always be shown
on each page whenever needed.
□
□
□
□
□
18. I like the fact that each page is always
followed the same display format. □
□
□
□
□
Error prevention Strongly
Agree
Agree Neutral Disagree Strongly
Disagree
19. It is difficult to make errors in an action
because the site does not allow me to skip over
the order of the process.
□
□
□
□
□
20. It is easy to see errors because the site
indicates a highlighted message around errors. □
□
□
□
□
21. It is easy to fill in the right data in a data
entry field because the number of character
spaces available in a field has been indicated.
□
□
□
□
□
22. It is difficult to see the progress in an
action because the site does not indicate the
steps completed in the whole process.
□
□
□
□
□
Recognition rather than recall Strongly
Agree
Agree Neutral Disagree Strongly
Disagree
23. It is easy to know the key
information/subject sought because it is placed
in a central location of the page.
□
□
□
□
□
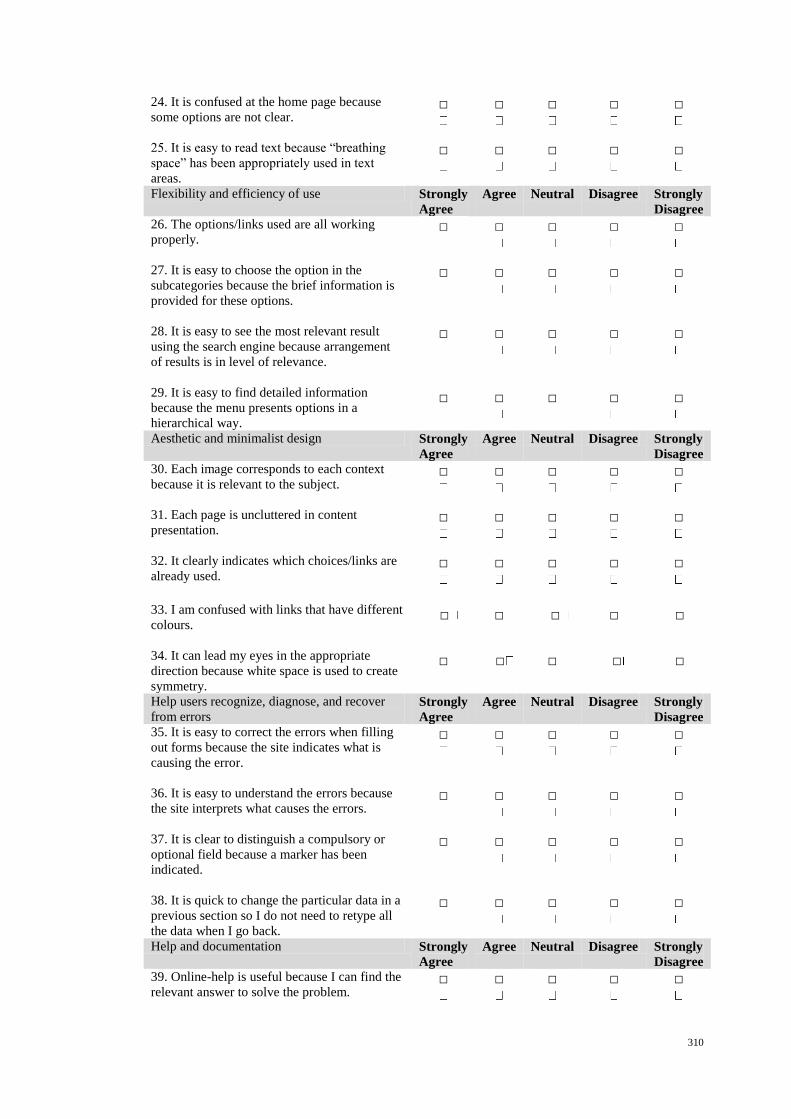
310
24. It is confused at the home page because
some options are not clear.
□
□
□
□
□
25. It is easy to read text because “breathing
space” has been appropriately used in text
areas.
□
□
□
□
□
Flexibility and efficiency of use Strongly
Agree
Agree Neutral Disagree Strongly
Disagree
26. The options/links used are all working
properly.
□
□
□
□
□
27. It is easy to choose the option in the
subcategories because the brief information is
provided for these options.
□
□
□
□
□
28. It is easy to see the most relevant result
using the search engine because arrangement
of results is in level of relevance.
□
□
□
□
□
29. It is easy to find detailed information
because the menu presents options in a
hierarchical way.
□
□
□
□
□
Aesthetic and minimalist design Strongly
Agree
Agree Neutral Disagree Strongly
Disagree
30. Each image corresponds to each context
because it is relevant to the subject.
□
□
□
□
□
31. Each page is uncluttered in content
presentation.
□
□
□
□
□
32. It clearly indicates which choices/links are
already used. □
□
□
□
□
33. I am confused with links that have different
colours.
□
□
□
□
□
34. It can lead my eyes in the appropriate
direction because white space is used to create
symmetry.
□
□
□
□
□
Help users recognize, diagnose, and recover
from errors Strongly
Agree
Agree Neutral Disagree Strongly
Disagree
35. It is easy to correct the errors when filling
out forms because the site indicates what is
causing the error.
□
□
□
□
□
36. It is easy to understand the errors because
the site interprets what causes the errors.
□
□
□
□
□
37. It is clear to distinguish a compulsory or
optional field because a marker has been
indicated.
□
□
□
□
□
38. It is quick to change the particular data in a
previous section so I do not need to retype all
the data when I go back.
□
□
□
□
□
Help and documentation Strongly
Agree
Agree Neutral Disagree Strongly
Disagree
39. Online-help is useful because I can find the
relevant answer to solve the problem.
□
□
□
□
□

311
40. It is easy to find help functions in the site.
□
□
□
□
□
41. It is easy to switch between online-help and
my current work. □
□
□
□
□
Interoperability Strongly
Agree
Agree Neutral Disagree Strongly
Disagree
42. I can complete the task required because
the abbreviations, acronyms, codes are
understandable in the site.
□
□
□
□
□
43. I like that the hierarchy of the site structure
fits my progressive level of the tasks.
□
□
□
□
□
44. I like that the different displays on each
page are compatible through the site. □
□
□
□
□
Skills Strongly
Agree
Agree Neutral Disagree Strongly
Disagree
45. It is easy to operate the e-government site.
□
□
□
□
□
46. I can use sites‟ functions to easily complete
most tasks.
□
□
□
□
□
47. It is easy to move forward and backward
within different fields of the site. □ □ □ □ □
Pleasurable and respectful interaction with user Strongly
Agree
Agree Neutral Disagree Strongly
Disagree
48. I like that every image is related to the
topic of article in the site.
□
□
□
□
□
49. I like that no excessive text is in each page. □ □ □ □ □
50. I like that the accessibility setting is always
available whenever I needed.
□
□
□
□
□
51. Please list five difficulties when using this e-government site
_____________________________________________________________________
_____________________________________________________________________
_____________________________________________________________________
_____________________________________________________________________
_____________________________________________________________________
52. Please list five usability strengths of this e-government site
_____________________________________________________________________
_____________________________________________________________________
_____________________________________________________________________
_____________________________________________________________________

312
_____________________________________________________________________
53. Please list five usability weaknesses of this e-government site
_____________________________________________________________________
_____________________________________________________________________
_____________________________________________________________________
_____________________________________________________________________
_____________________________________________________________________
Credibility evaluation
System looks professional Strongly
agree
Agree Neutral Disagree Strongly
Disagree
1. The content of the site matches with
information you expect to obtain from a local
council.
□
□
□
□
□
2. I can easily find relevant information
because information is presented with
consistent colours.
□
□
□
□
□
3. It is easy to read information in the site
because the content is organised by subject
categories.
□
□
□
□
□
4. It is easy to see relationships between the
pages because each page is labelled. □
□
□
□
□
Easy to verify the information accuracy Strongly
agree
Agree Neutral Disagree Strongly
Disagree
5. I like that the information on each page is
at the right level of details.
□
□
□
□
□
6. It is difficult to locate a relevant
subcategory because no fixed order of the
subcategory is arranged.
□
□
□
□
□
7. Information presented in a page matches
with the name of the categories.
□
□
□
□
□
8. The URL properly presents the domain
name of the local council, e.g. ending with
“gov.uk”
□
□
□
□
□
Show a real organization behind site Strongly
agree
Agree Neutral Disagree Strongly
Disagree
9. It is easy to find a postal address of the
local council offices in the site.
□
□
□
□
□
10. I like that the site displays photos of
offices or staff members.
□
□
□
□
□
11. It is easy to see the site‟s accreditations □ □ □ □ □

313
because the site links with other
governmental bodies.
Highlight the expertise in your organization
and in the content and services provided Strongly
agree
Agree Neutral Disagree Strongly
Disagree
12. It is clear to understand the policies and
services offered by the site because detailed
information is provided.
□
□
□
□
□
13. Information presented in the site can
make you believe in the reliability of the local
council.
□
□
□
□
□
14. Prompts /messages displayed are concise
to help you complete the tasks. □
□
□
□
□
Show that honest, trustworthy people stand
your site Strongly
agree
Agree Neutral Disagree Strongly
Disagree
15. It is difficult to see the information about
the local council because the site does not
provide a shortcut option.
□
□
□
□
□
16. It is clear to see the site‟s credentials
because the site displays awards it has earned.
□
□
□
□
□
17. It is easy to find information about people
who are working or in charge of the local
council.
□
□
□
□
□
Make it easy to contact you Strongly
agree
Agree Neutral Disagree Strongly
Disagree
18. It is easy to find contact information
because the “Contact” option has been clearly
indicated.
□
□
□
□
□
19. I like that the different contact methods
are provided.
□
□
□
□
□
20. It is hard to find the detailed levels of the
contact information because the contact
information has not been organised by
different departments.
□
□
□
□
□
Make site ease to use and useful Strongly
agree
Agree Neutral Disagree Strongly
Disagree
21. I can quickly start my task because the
site is easy to use.
□
□
□
□
□
22. There is a clear description to help me
identify where I am in the site.
□
□
□
□
□
23. It is not clear to indicate how much I have
done and how much was left when I complete
the tasks.
□
□
□
□
□
24. It is easy to choose a suitable option from
search results because the option is organised
by the level of relevance.
□
□
□
□
□
Update site‟s content often Strongly
agree
Agree Neutral Disagree Strongly
Disagree
25. It is clear to identify how current the
information presented in the site is, because
the updated date is presented.
□
□
□
□
□
User restraint with any promotional content Strongly Agree Neutral Disagree Strongly

314
agree Disagree
26. I like that the site does not present too
many irrelevant promotion contents.
□
□
□
□
□
27. It is easy to distinguish advertisement
from the content. □ □ □ □ □
Avoid errors of all type Strongly
agree
Agree Neutral Disagree Strongly
Disagree
28. It is easy to fill out a form because proper
instruction is given.
□
□
□
□
□
29. Each link presented in the site can
properly connect to the relevant page.
□
□
□
□
□
30. It is easy to read the content in the site
because the site has no typographical error. □
□
□
□
□
Transparency Strongly
agree
Agree Neutral Disagree Strongly
Disagree
31. I like that the site provides information
about the budgetary execution of the local
council.
□
□
□
□
□
32. I like that the site provides information
about the site terms and conditions.
□
□
□
□
□
33. There is a message to help you identify
whether the transaction is completed in the
end of the process.
□
□
□
□
□
34. It is not clear to see my status in an action
because the progress has not been indicated.
□
□
□
□
□
Service agility Strongly
agree
Agree Neutral Disagree Strongly
Disagree
35. I like that the site allows me to work at
my own pace.
□
□
□
□
□
36. It is easy to identify relationships among
categories because information is organised in
a hierarchical way.
□
□
□
□
□
37. It is convenient to start my task because
many different approaches can be used in the
site.
□
□
□
□
□
Privacy Strongly
agree
Agree Neutral Disagree Strongly
Disagree
38. It is hard to see a sign-in option when I do
some personal services.
□
□
□
□
□
39. A secure message is presented when you
are not allowed to access some confidential
information.
□
□
□
□
□
40. Please list five credibility strengths of this e-government site
_____________________________________________________________________
_____________________________________________________________________
_____________________________________________________________________

315
_____________________________________________________________________
_____________________________________________________________________
41. Please list five credibility weaknesses of this e-government site
_____________________________________________________________________
_____________________________________________________________________
_____________________________________________________________________
_____________________________________________________________________
_____________________________________________________________________

316
Appendix 5a: Usability and credibility questionnaire for the redesigned London
Authority 1 in experiment 2
Usability and credibility questionnaire
The purpose of this questionnaire is to assess the users‟ perception of the proposed design implication
of usability and credibility on an e-government website. The information you give will be entirely
confidential and will not be shared with any people not directly connected with this project. Please
answer honestly and as accurately as you can. Your contribution is much appreciated.
Many thanks
Zhao Huang
---------------------------------------------------------------------------------------------------------
Please choose the one most appropriate response to each statement
Personal information
Please select your gender:
Male □
Female □
Please select your age range:
20-25 □ -30 □ -35 □ -45 □ 50+ □
On average, how many hours a
week do you spend on the Internet?
0-5 □ 6-10 □ 11-15 □ -20 □ 21+ □
Usability features evaluation
Strongly
Agree
Agree Neutral Disagree Strongly
Disagree
1. It is easy to find help functions in the
system.
□ □ □ □ □
2. I am confused with links that have
different colours.
□ □ □ □ □
3. It is easy to switch between online-
help and my current work.
□
□
□
□
□
4. Please provide some comments regarding the usability features indicated above
___________________________________________________________________________________
___________________________________________________________________________________
___________________________________________________________________________________
___________________________________________________________________________________
___________________________________________________________________________________
___________________________________________________________________________________
Credibility features evaluation
Strongly
Agree
Agree Neutral Disagree Strongly
Disagree
1. I can easily find relevant information
317
because different colours are used
consistently to present different kinds of
information.
□
□
□
□
□
2. Please provide some comments regarding the credibility feature indicated above
_____________________________________________________________________
_____________________________________________________________________
_____________________________________________________________________
_____________________________________________________________________
_____________________________________________________________________
_____________________________________________________________________

318
Appendix 5b: Usability and credibility questionnaire for the redesigned London
Authority 2 in experiment 2
Usability and credibility questionnaire
The purpose of this questionnaire is to assess the users‟ perception of the proposed design implication
of usability and credibility on an e-government website. The information you give will be entirely
confidential and will not be shared with any people not directly connected with this project. Please
answer honestly and as accurately as you can. Your contribution is much appreciated.
Many thanks
Zhao Huang
---------------------------------------------------------------------------------------------------------
Please choose the one most appropriate response to each statement
Personal information
Please select your gender:
Male □
Female □
Please select your age
range:
20-25 □ -30 □ -35 □ -45 □ □
On average, how many
hours a week do you spend
on the Internet?
0-5 □ 6-10 □ 11-15 □ -20 □ 21+ □
Usability features evaluation
Strongly
Agree
Agree Neutral Disagree Strongly
Disagree
1. I am confused with links that have
different colours.
□ □ □ □ □
2. It is confused at the home page
because I do not know where I can start.
□
□
□
□
□
3. I can clearly see my task progress
because a progress indicator has been
presented.
□
□
□
□
□
4. It clearly indicates which choices/links
are already used because italic has been
applied.
□
□
□
□
□
5. It is easy to make errors in an action
because the system allows me to skip
over the order of the process.
□
□
□
□
□
6. Please provide some comments regarding the usability features indicated above
_____________________________________________________________________
_____________________________________________________________________
_____________________________________________________________________

319
___________________________________________________________________________________
___________________________________________________________________________________
___________________________________________________________________________________
Credibility features evaluation
Strongly
Agree
Agree Neutral Disagree Strongly
Disagree
1. I can easily find relevant information
because different colours are used
consistently to present different kinds of
information.
□
□
□
□
□
2. It is easy to choose a suitable option
because the option is organised by the
level of relevance.
□
□
□
□
□
3. A security message is presented when
you are allowed to access some
confidential information.
□
□
□
□
□
4. Please provide some comments regarding the credibility features indicated above _____________________________________________________________________
_____________________________________________________________________
_____________________________________________________________________
_____________________________________________________________________
_____________________________________________________________________
_____________________________________________________________________
_____________________________________________________________________

320
Appendix 5c: Usability and credibility questionnaire for the redesigned London
Authority 3 in experiment 2
Usability and credibility questionnaire
The purpose of this questionnaire is to assess the users‟ perception of the proposed design implication
of usability and credibility on an e-government website. The information you give will be entirely
confidential and will not be shared with any people not directly connected with this project. Please
answer honestly and as accurately as you can. Your contribution is much appreciated.
Many thanks
Zhao Huang
---------------------------------------------------------------------------------------------------------
Please choose the one most appropriate response to each statement
Personal information
Please select your gender:
Male □
Female □
Please select your age range:
20-25 □ -30 □ -35 □ -45 □ □
On average, how many hours a
week do you spend on the
Internet?
0-5 □ 6-10 □ 11-15 □ -20 □ 21+ □
Usability features evaluation
Strongly
Agree
Agree Neutral Disagree Strongly
Disagree
1. I am confused with links that have
different colours.
□ □ □ □ □
2. It clearly indicates which choices/links
are already used because italic has been
applied.
□
□
□
□
□
3. It is difficult to know which
links/subjects corresponded to the
information I wanted.
□
□
□
□
□
4. It is difficult to choose the option in
subcategories because no fix order of sub
options is used in subcategories.
□
□
□
□
□
5. I sometimes get lost due to being
given too many choices over sequences.
□
□
□
□
□
6. Please provide some comments regarding the usability features indicated above
_____________________________________________________________________
_____________________________________________________________________
_____________________________________________________________________
___________________________________________________________________________________

321
___________________________________________________________________________________
___________________________________________________________________________________
Credibility features evaluation
Strongly
Agree
Agree Neutral Disagree Strongly
Disagree
1. A security message is presented when
you are allowed to access some
confidential information.
□
□
□
□
□
2. It is hard to find the detailed levels of
the contact information because the
contact information has not been
organised by different departments.
□
□
□
□
□
3. It is clear to see the system‟s
credentials because the system displays
awards it has earned.
□
□
□
□
□
4. It is difficult to see the information
about the local council because the
system does not provide a shortcut
option.
□
□
□
□
□
5. It is not clear to indicate how much I
have done and how much was left when I
complete the tasks.
□
□
□
□
□
6. It is clear to identify how current the
information presented in the system is,
because the updated date is presented.
□
□
□
□
□
7. It is hard to see a sign-in option when I
do some personal services.
□
□
□
□
□
8. Please provide some comments regarding the credibility features indicated above
_____________________________________________________________________
_____________________________________________________________________
_____________________________________________________________________
_____________________________________________________________________
_____________________________________________________________________

322
The participant should complete the whole of this sheet him/herself Please tick appropriate box
YES NO
Have you read the Research Participant Information Sheet?
Have you had an opportunity to ask questions and discuss
this study?
Have you received satisfactory answers to all your questions?
Who have you spoken to?……………………………………………..
Do you understand that you will not be referred to by name
in any report concerning the study?
Do you understand that you are free to withdraw from the study:
- at any time
- without having to give a reason for withdrawing?
Do you agree to take part in this study?
Signature of Research Participant…………………………………..……
Date……………………….
Name in capitals………………………………………………………………………
Appendix 6: Consent form
MODEL CONSENT FORM
Please note that more information about obtaining consent can be found in the General
Ethical Guidelines and Procedures which is available on the university website of the
Research Ethic Committee
(http://intranet.brunel.ac.uk/registry/minutes/researchethics/home.shtml)

323
Appendix 7a: Information sheet for experiment 1
Information sheet
Dear participants:
Many thanks for agreeing to take part in the experiment! My name is Zhao Huang
([email protected]), a second year PhD student in the Information System
and Computing Department, Brunel University. This project is conducted under the
supervision of Dr. Laurence Brooks, Dr. Sherry Chen and Dr. George Ghinea (Dr.
Laurence Brooks: [email protected]; Dr. Sherry Chen: Dr.
[email protected]; Dr. George Ghinea: [email protected]). The
purpose of this experiment is to assess the usability and credibility of e-government
from the users‟ perspective.
At the beginning of the experiment, you will be given five minutes to look through an
e-government website. Subsequently, you are required to do some tasks using the e-
government website. It would be grateful if you could do the tasks in order. Once you
finish one task, please show your task result to the observer. When you are ready for
the next task, please go to e-government home page to start again. If any tasks refer to
your personal information, a user ID is provided. As you complete all the tasks, please
fill out the usability and credibility questionnaires. During the questionnaire period,
the e-government site will still be available for you to interact with to support
answering the questions.
The information you give will be entirely confidential and will not be shared with any
other people not directly connected with this study. Your contribution is much
appreciated. If you have any questions, please feel free to contact us.
Enjoying completing the experiment!
Many thanks
Zhao Huang
324
Appendix 7b: Information sheet for experiment 2
Information sheet
Dear participants:
Many thanks for agreeing to take part in the experiment! My name is Zhao Huang
([email protected]), a second year PhD student in the Information System
and Computing Department, Brunel University. This project is conducted under the
supervision of Dr. Laurence Brooks, Dr. Sherry Chen and Dr. George Ghinea (Dr.
Laurence Brooks: Laurence. [email protected]; Dr. Sherry Chen: Dr.
[email protected]; Dr. George Ghinea: [email protected]). This is
the second experiment. The purpose of this experiment is to assess the effects of the
proposed design solutions on the target e-government websites.
At the beginning of the experiment, you will be given five minutes to look through an
e-government website. Subsequently, you are required to do some tasks using the e-
government website. It would be grateful if you could do the tasks in order. Once you
finish one task, please show your task result to the observer. When you are ready for
the next task, please go to e-government home page to start again. If any tasks refer to
your personal information, a user ID is provided. As you complete all the tasks, please
fill out the usability and credibility questionnaires. During the questionnaire period,
the e-government site will still be available for you to interact with to support
answering the questions.
The information you give will be entirely confidential and will not be shared with any
other people not directly connected with this study. Your contribution is much
appreciated. If you have any questions, please feel free to contact us.
Enjoying completing the experiment!
Many thanks
Zhao Huang

325
Appendix 8a: Results of users’ perception of usability and credibility for London
Authority 1 in experiment 1
Mean of each usability and credibility question
N Mean Std. Deviation
Valid Missing
Usability question1 12 0 3.83 .835
Usability question2 12 0 3.50 1.000
Usability question3 12 0 3.42 1.084
Usability question4 12 0 3.67 1.371
Usability question5 12 0 3.58 .996
Usability question6 12 0 3.08 1.084
Usability question7 12 0 3.25 1.055
Usability question8 12 0 3.17 1.030
Usability question9 12 0 3.25 1.288
Usability question10 12 0 3.75 .622
Usability question11 12 0 3.67 1.073
Usability question12 12 0 4.08 .793
Usability question13 12 0 3.83 .937
Usability question14 12 0 3.83 .937
Usability question15 12 0 3.17 1.115
Usability question16 12 0 3.58 .996
Usability question17 12 0 3.25 1.138
Usability question18 12 0 3.67 .985
Usability question19 12 0 3.25 1.138
Usability question20 12 0 3.42 1.240
Usability question21 12 0 3.17 .835
Usability question22 12 0 3.75 .754
Usability question23 12 0 3.17 1.115
Usability question24 12 0 3.00 1.477
Usability question25 12 0 3.83 .835
Usability question26 12 0 4.00 1.128
Usability question27 12 0 2.75 1.215
Usability question28 12 0 2.83 1.267
Usability question29 12 0 3.08 .669
Usability question30 12 0 3.50 1.000
Usability question31 12 0 3.50 .798
Usability question32 12 0 3.58 1.084
Usability question33 12 0 2.32 1.084
Usability question34 12 0 2.83 1.115
Usability question35 12 0 3.58 .996
Usability question36 12 0 3.58 .793
Usability question37 12 0 3.67 1.155
Usability question38 12 0 3.50 .674
Usability question39 12 0 3.42 .996
Usability question40 12 0 2.33 1.155
Usability question41 12 0 2.75 .866
Usability question42 12 0 3.42 .900
Usability question43 12 0 3.33 .778
Usability question44 12 0 3.92 .515
Usability question45 12 0 3.92 .900

326
Usability question46 12 0 3.75 .866
Usability question47 12 0 4.33 .492
Usability question48 12 0 3.58 .793
Usability question49 12 0 3.83 .937
Usability question50 12 0 3.67 .651
Credibility question1 12 0 4.25 .452
Credibility question2 12 0 2.58 .996
Credibility question3 12 0 4.00 .739
Credibility question4 12 0 3.58 .669
Credibility question5 12 0 3.67 1.155
Credibility question6 12 0 3.50 .905
Credibility question7 12 0 3.50 .798
Credibility question8 12 0 4.33 .651
Credibility question9 12 0 3.83 1.193
Credibility question10 12 0 3.75 .754
Credibility question11 12 0 3.58 .900
Credibility question12 12 0 3.83 1.030
Credibility question13 12 0 3.83 .937
Credibility question14 12 0 3.33 1.303
Credibility question15 12 0 4.00 .953
Credibility question16 12 0 3.75 .965
Credibility question17 12 0 3.75 1.215
Credibility question18 12 0 3.67 1.303
Credibility question19 12 0 3.75 .965
Credibility question20 12 0 3.75 1.357
Credibility question21 12 0 3.33 1.155
Credibility question22 12 0 3.42 1.084
Credibility question23 12 0 3.17 1.193
Credibility question24 12 0 3.42 .900
Credibility question25 12 0 3.17 1.030
Credibility question26 12 0 3.83 .718
Credibility question27 12 0 3.50 .798
Credibility question28 12 0 3.83 .937
Credibility question29 12 0 3.83 1.030
Credibility question30 12 0 3.67 .985
Credibility question31 12 0 3.83 1.030
Credibility question32 12 0 3.92 .669
Credibility question33 12 0 4.00 .739
Credibility question34 12 0 3.92 .900
Credibility question35 12 0 4.17 .835
Credibility question36 12 0 3.58 .900
Credibility question37 12 0 3.58 .900
Credibility question38 12 0 4.17 .718
Credibility question39 12 0 3.67 .778
Usability strengths and problems identification
Test Value = 3.45
t df Sig. (2-tailed)
Mean
Difference
95% Confidence
Interval of the
Difference
Lower Upper
Usability question1 1.591 11 .140 .383 -.15 .91

327
Usability question2 .173 11 .866 .050 -.59 .69
Usability question3 -.107 11 .917 -.033 -.72 .66
Usability question4 .548 11 .595 .217 -.65 1.09
Usability question5 .464 11 .652 .133 -.50 .77
Usability question6 -1.172 11 .266 -.367 -1.06 .32
Usability question7 -.657 11 .525 -.200 -.87 .47
Usability question8 -.953 11 .361 -.283 -.94 .37
Usability question9 -.538 11 .601 -.200 -1.02 .62
Usability question10 1.672 11 .123 .300 -.09 .69
Usability question11 .699 11 .499 .217 -.47 .90
Usability question12 2.767 11 .018 .633 .13 1.14
Usability question13 1.417 11 .184 .383 -.21 .98
Usability question14 1.417 11 .184 .383 -.21 .98
Usability question15 -.881 11 .397 -.283 -.99 .42
Usability question16 .464 11 .652 .133 -.50 .77
Usability question17 -.609 11 .555 -.200 -.92 .52
Usability question18 .762 11 .462 .217 -.41 .84
Usability question19 -.609 11 .555 -.200 -.92 .52
Usability question20 -.093 11 .927 -.033 -.82 .75
Usability question21 -1.176 11 .265 -.283 -.81 .25
Usability question22 1.379 11 .195 .300 -.18 .78
Usability question23 -.881 11 .397 -.283 -.99 .42
Usability question24 -1.055 11 .314 -.450 -1.39 .49
Usability question25 1.591 11 .140 .383 -.15 .91
Usability question26 1.689 11 .119 .550 -.17 1.27
Usability question27 -1.995 11 .071 -.700 -1.47 .07
Usability question28 -1.686 11 .120 -.617 -1.42 .19
Usability question29 -1.900 11 .084 -.367 -.79 .06
Usability question30 .173 11 .866 .050 -.59 .69
Usability question31 .217 11 .832 .050 -.46 .56
Usability question32 .426 11 .678 .133 -.56 .82
Usability question33 -3.303 11 .007 -1.033 -1.72 -.34
Usability question34 -1.916 11 .082 -.617 -1.32 .09
Usability question35 .464 11 .652 .133 -.50 .77
Usability question36 .582 11 .572 .133 -.37 .64
Usability question37 .650 11 .529 .217 -.52 .95
Usability question38 .257 11 .802 .050 -.38 .48
Usability question39 -.116 11 .910 -.033 -.67 .60
Usability question40 -3.350 11 .006 -1.117 -1.85 -.38
Usability question41 -2.800 11 .017 -.700 -1.25 -.15
Usability question42 -.128 11 .900 -.033 -.61 .54
Usability question43 -.519 11 .614 -.117 -.61 .38
Usability question44 3.139 11 .009 .467 .14 .79
Usability question45 1.796 11 .100 .467 -.11 1.04
Usability question46 1.200 11 .255 .300 -.25 .85
Usability question47 6.215 11 .000 .883 .57 1.20
Usability question48 .582 11 .572 .133 -.37 .64
Usability question49 1.417 11 .184 .383 -.21 .98
Usability question50 1.152 11 .274 .217 -.20 .63
Credibility strengths and problems identification
Test Value = 3.70

328
t df Sig. (2-tailed)
Mean
Difference
95% Confidence
Interval of the
Difference
Lower Upper
Credibility question1 4.213 11 .001 .550 .26 .84
Credibility question2 -3.883 11 .003 -1.117 -1.75 -.48
Credibility question3 1.407 11 .187 .300 -.17 .77
Credibility question4 -.605 11 .558 -.117 -.54 .31
Credibility question5 -.100 11 .922 -.033 -.77 .70
Credibility question6 -.766 11 .460 -.200 -.77 .37
Credibility question7 -.868 11 .404 -.200 -.71 .31
Credibility question8 3.368 11 .006 .633 .22 1.05
Credibility question9 .387 11 .706 .133 -.62 .89
Credibility question10 .230 11 .822 .050 -.43 .53
Credibility question11 -.449 11 .662 -.117 -.69 .46
Credibility question12 .448 11 .663 .133 -.52 .79
Credibility question13 .493 11 .632 .133 -.46 .73
Credibility question14 -.975 11 .350 -.367 -1.19 .46
Credibility question15 1.090 11 .299 .300 -.31 .91
Credibility question16 .179 11 .861 .050 -.56 .66
Credibility question17 .143 11 .889 .050 -.72 .82
Credibility question18 -.089 11 .931 -.033 -.86 .79
Credibility question19 .179 11 .861 .050 -.56 .66
Credibility question20 .128 11 .901 .050 -.81 .91
Credibility question21 -1.100 11 .295 -.367 -1.10 .37
Credibility question22 -.906 11 .384 -.283 -.97 .41
Credibility question23 -1.548 11 .150 -.533 -1.29 .22
Credibility question24 -1.090 11 .299 -.283 -.86 .29
Credibility question25 -1.794 11 .100 -.533 -1.19 .12
Credibility question26 .644 11 .533 .133 -.32 .59
Credibility question27 -.868 11 .404 -.200 -.71 .31
Credibility question28 .493 11 .632 .133 -.46 .73
Credibility question29 .448 11 .663 .133 -.52 .79
Credibility question30 -.117 11 .909 -.033 -.66 .59
Credibility question31 .448 11 .663 .133 -.52 .79

329
Credibility question32 1.123 11 .285 .217 -.21 .64
Credibility question33 1.407 11 .187 .300 -.17 .77
Credibility question34 .834 11 .422 .217 -.36 .79
Credibility question35 1.936 11 .079 .467 -.06 1.00
Credibility question36 -.449 11 .662 -.117 -.69 .46
Credibility question37 -.449 11 .662 -.117 -.69 .46
Credibility question38 2.252 11 .046 .467 .01 .92
Credibility question39 -.148 11 .885 -.033 -.53 .46
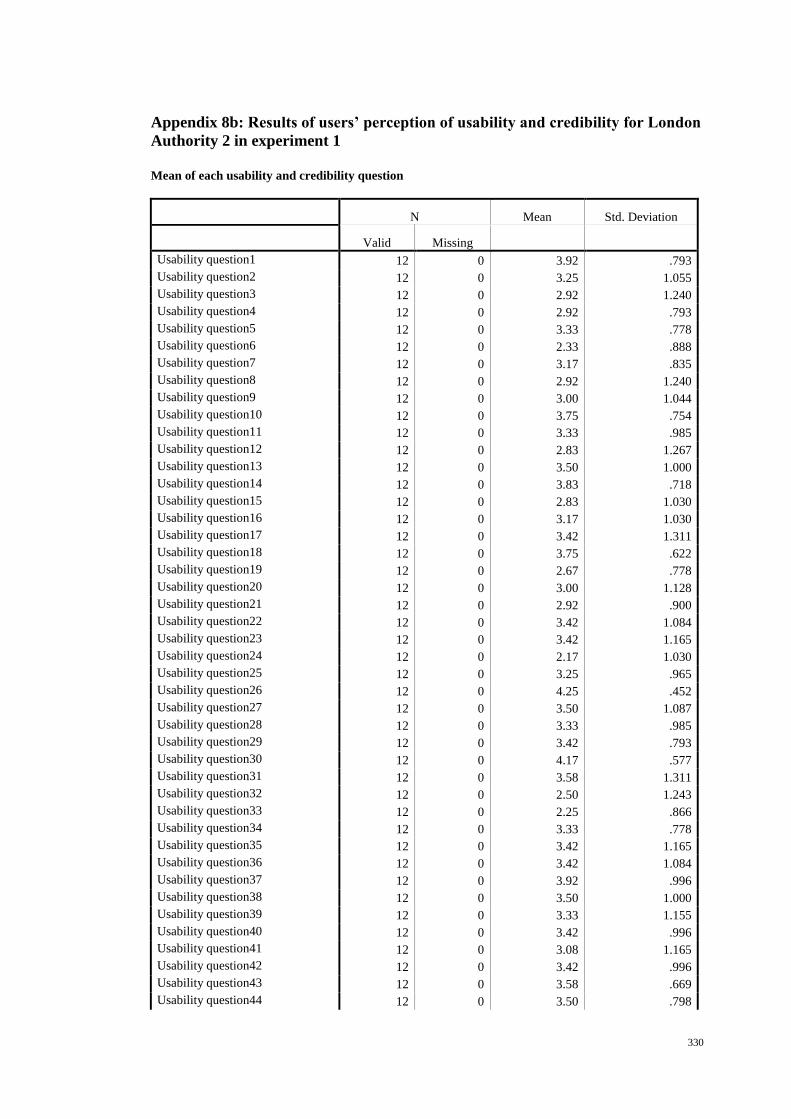
330
Appendix 8b: Results of users’ perception of usability and credibility for London
Authority 2 in experiment 1
Mean of each usability and credibility question
N Mean Std. Deviation
Valid Missing
Usability question1 12 0 3.92 .793
Usability question2 12 0 3.25 1.055
Usability question3 12 0 2.92 1.240
Usability question4 12 0 2.92 .793
Usability question5 12 0 3.33 .778
Usability question6 12 0 2.33 .888
Usability question7 12 0 3.17 .835
Usability question8 12 0 2.92 1.240
Usability question9 12 0 3.00 1.044
Usability question10 12 0 3.75 .754
Usability question11 12 0 3.33 .985
Usability question12 12 0 2.83 1.267
Usability question13 12 0 3.50 1.000
Usability question14 12 0 3.83 .718
Usability question15 12 0 2.83 1.030
Usability question16 12 0 3.17 1.030
Usability question17 12 0 3.42 1.311
Usability question18 12 0 3.75 .622
Usability question19 12 0 2.67 .778
Usability question20 12 0 3.00 1.128
Usability question21 12 0 2.92 .900
Usability question22 12 0 3.42 1.084
Usability question23 12 0 3.42 1.165
Usability question24 12 0 2.17 1.030
Usability question25 12 0 3.25 .965
Usability question26 12 0 4.25 .452
Usability question27 12 0 3.50 1.087
Usability question28 12 0 3.33 .985
Usability question29 12 0 3.42 .793
Usability question30 12 0 4.17 .577
Usability question31 12 0 3.58 1.311
Usability question32 12 0 2.50 1.243
Usability question33 12 0 2.25 .866
Usability question34 12 0 3.33 .778
Usability question35 12 0 3.42 1.165
Usability question36 12 0 3.42 1.084
Usability question37 12 0 3.92 .996
Usability question38 12 0 3.50 1.000
Usability question39 12 0 3.33 1.155
Usability question40 12 0 3.42 .996
Usability question41 12 0 3.08 1.165
Usability question42 12 0 3.42 .996
Usability question43 12 0 3.58 .669
Usability question44 12 0 3.50 .798

331
Usability question45 12 0 3.42 .793
Usability question46 12 0 3.75 .452
Usability question47 12 0 4.00 .853
Usability question48 12 0 3.83 .835
Usability question49 12 0 3.67 .778
Usability question50 12 0 3.58 .900
Credibility question1 12 0 4.08 .515
Credibility question2 12 0 2.67 .985
Credibility question3 12 0 3.67 .888
Credibility question4 12 0 3.33 1.073
Credibility question5 12 0 3.50 .522
Credibility question6 12 0 3.42 .900
Credibility question7 12 0 3.75 .622
Credibility question8 12 0 3.83 .577
Credibility question9 12 0 3.92 .996
Credibility question10 12 0 3.50 1.000
Credibility question11 12 0 3.58 .669
Credibility question12 12 0 3.67 .778
Credibility question13 12 0 3.33 .985
Credibility question14 12 0 3.25 .965
Credibility question15 12 0 3.08 .900
Credibility question16 12 0 3.50 1.087
Credibility question17 12 0 3.25 1.288
Credibility question18 12 0 3.33 .985
Credibility question19 12 0 3.42 .793
Credibility question20 12 0 3.08 .996
Credibility question21 12 0 3.08 .793
Credibility question22 12 0 3.25 1.055
Credibility question23 12 0 2.75 1.138
Credibility question24 12 0 2.43 .937
Credibility question25 12 0 2.67 1.231
Credibility question26 12 0 4.00 .739
Credibility question27 12 0 3.58 .900
Credibility question28 12 0 3.83 .718
Credibility question29 12 0 3.83 .835
Credibility question30 12 0 3.75 .622
Credibility question31 12 0 3.58 .793
Credibility question32 12 0 3.25 .965
Credibility question33 12 0 3.83 1.030
Credibility question34 12 0 3.75 .754
Credibility question35 12 0 3.83 .835
Credibility question36 12 0 3.25 .866
Credibility question37 12 0 3.42 .900
Credibility question38 12 0 3.42 .900
Credibility question39 12 0 2.92 .515
Usability strengths and problems identification
Test Value = 3.32
t df Sig. (2-tailed)
Mean
Difference
95% Confidence
Interval of the
Difference
Lower Upper

332
Usability question1 2.607 11 .024 .597 .09 1.10
Usability question2 -.230 11 .822 -.070 -.74 .60
Usability question3 -1.127 11 .284 -.403 -1.19 .38
Usability question4 -1.762 11 .106 -.403 -.91 .10
Usability question5 .059 11 .954 .013 -.48 .51
Usability question6 -3.851 11 .003 -.987 -1.55 -.42
Usability question7 -.636 11 .538 -.153 -.68 .38
Usability question8 -1.127 11 .284 -.403 -1.19 .38
Usability question9 -1.061 11 .311 -.320 -.98 .34
Usability question10 1.976 11 .074 .430 -.05 .91
Usability question11 .047 11 .963 .013 -.61 .64
Usability question12 -1.330 11 .210 -.487 -1.29 .32
Usability question13 .624 11 .546 .180 -.46 .82
Usability question14 2.478 11 .031 .513 .06 .97
Usability question15 -1.637 11 .130 -.487 -1.14 .17
Usability question16 -.516 11 .616 -.153 -.81 .50
Usability question17 .255 11 .803 .097 -.74 .93
Usability question18 2.396 11 .035 .430 .04 .82
Usability question19 -2.907 11 .014 -.653 -1.15 -.16
Usability question20 -.983 11 .347 -.320 -1.04 .40
Usability question21 -1.552 11 .149 -.403 -.98 .17
Usability question22 .309 11 .763 .097 -.59 .79
Usability question23 .288 11 .779 .097 -.64 .84
Usability question24 -3.879 11 .003 -1.153 -1.81 -.50
Usability question25 -.251 11 .806 -.070 -.68 .54
Usability question26 7.123 11 .000 .930 .64 1.22
Usability question27 .574 11 .578 .180 -.51 .87
Usability question28 .047 11 .963 .013 -.61 .64
Usability question29 .422 11 .681 .097 -.41 .60
Usability question30 5.080 11 .000 .847 .48 1.21
Usability question31 .696 11 .501 .263 -.57 1.10
Usability question32 -2.285 11 .043 -.820 -1.61 -.03
Usability question33 -4.280 11 .001 -1.070 -1.62 -.52
Usability question34 .059 11 .954 .013 -.48 .51
Usability question35 .288 11 .779 .097 -.64 .84
Usability question36 .309 11 .763 .097 -.59 .79
Usability question37 2.075 11 .062 .597 -.04 1.23
Usability question38 .624 11 .546 .180 -.46 .82
Usability question39 .040 11 .969 .013 -.72 .75
Usability question40 .336 11 .743 .097 -.54 .73
Usability question41 -.704 11 .496 -.237 -.98 .50
Usability question42 .336 11 .743 .097 -.54 .73
Usability question43 1.364 11 .200 .263 -.16 .69
Usability question44 .782 11 .451 .180 -.33 .69
Usability question45 .422 11 .681 .097 -.41 .60
Usability question46 3.294 11 .007 .430 .14 .72
Usability question47 2.762 11 .018 .680 .14 1.22
Usability question48 2.130 11 .057 .513 -.02 1.04
Usability question49 1.543 11 .151 .347 -.15 .84
Usability question50 1.013 11 .333 .263 -.31 .84
Credibility strengths and problems identification
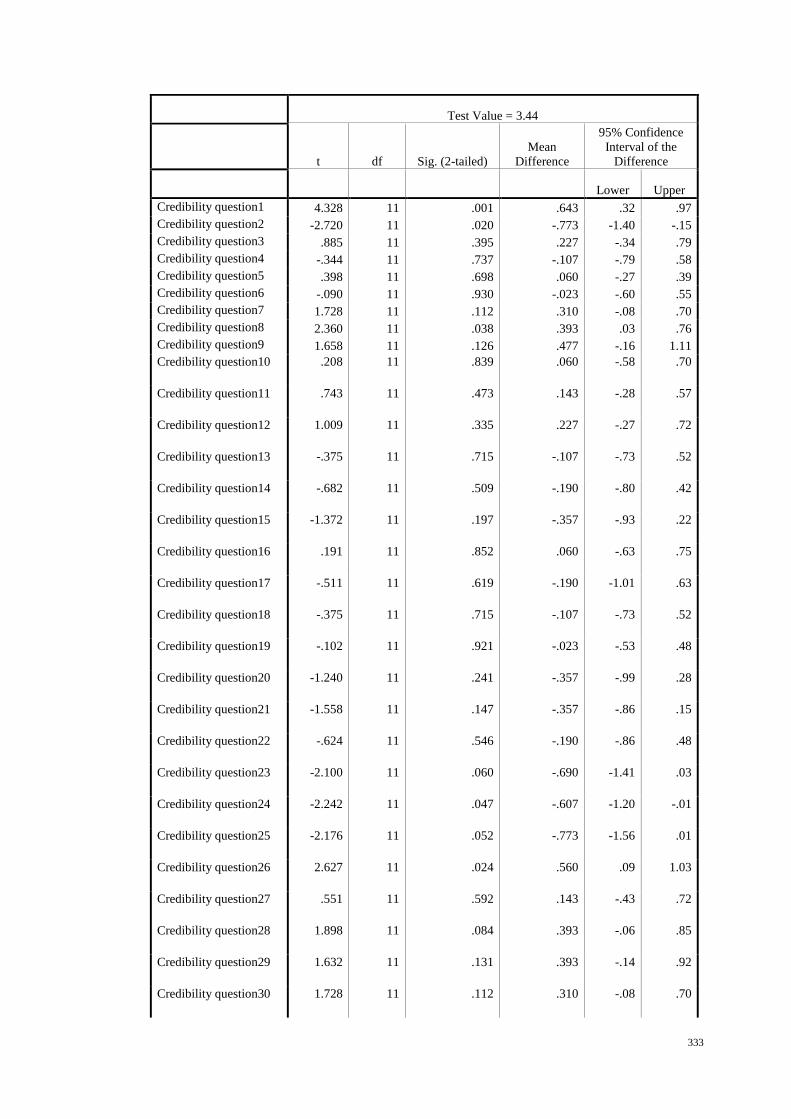
333
Test Value = 3.44
t df Sig. (2-tailed)
Mean
Difference
95% Confidence
Interval of the
Difference
Lower Upper
Credibility question1 4.328 11 .001 .643 .32 .97
Credibility question2 -2.720 11 .020 -.773 -1.40 -.15
Credibility question3 .885 11 .395 .227 -.34 .79
Credibility question4 -.344 11 .737 -.107 -.79 .58
Credibility question5 .398 11 .698 .060 -.27 .39
Credibility question6 -.090 11 .930 -.023 -.60 .55
Credibility question7 1.728 11 .112 .310 -.08 .70
Credibility question8 2.360 11 .038 .393 .03 .76
Credibility question9 1.658 11 .126 .477 -.16 1.11
Credibility question10 .208 11 .839 .060 -.58 .70
Credibility question11 .743 11 .473 .143 -.28 .57
Credibility question12 1.009 11 .335 .227 -.27 .72
Credibility question13 -.375 11 .715 -.107 -.73 .52
Credibility question14 -.682 11 .509 -.190 -.80 .42
Credibility question15 -1.372 11 .197 -.357 -.93 .22
Credibility question16 .191 11 .852 .060 -.63 .75
Credibility question17 -.511 11 .619 -.190 -1.01 .63
Credibility question18 -.375 11 .715 -.107 -.73 .52
Credibility question19 -.102 11 .921 -.023 -.53 .48
Credibility question20 -1.240 11 .241 -.357 -.99 .28
Credibility question21 -1.558 11 .147 -.357 -.86 .15
Credibility question22 -.624 11 .546 -.190 -.86 .48
Credibility question23 -2.100 11 .060 -.690 -1.41 .03
Credibility question24 -2.242 11 .047 -.607 -1.20 -.01
Credibility question25 -2.176 11 .052 -.773 -1.56 .01
Credibility question26 2.627 11 .024 .560 .09 1.03
Credibility question27 .551 11 .592 .143 -.43 .72
Credibility question28 1.898 11 .084 .393 -.06 .85
Credibility question29 1.632 11 .131 .393 -.14 .92
Credibility question30 1.728 11 .112 .310 -.08 .70

334
Credibility question31 .626 11 .544 .143 -.36 .65
Credibility question32 -.682 11 .509 -.190 -.80 .42
Credibility question33 1.323 11 .213 .393 -.26 1.05
Credibility question34 1.425 11 .182 .310 -.17 .79
Credibility question35 1.632 11 .131 .393 -.14 .92
Credibility question36 -.760 11 .463 -.190 -.74 .36
Credibility question37 -.090 11 .930 -.023 -.60 .55
Credibility question38 -.090 11 .930 -.023 -.60 .55
Credibility question39 -3.521 11 .005 -.523 -.85 -.20

335
Appendix 8c: Results of users’ perception of usability and credibility for London
Authority 3 in experiment 1
Mean of each usability and credibility question
N Mean Std. Deviation
Valid Missing
Usability question1 12 0 4.58 .669
Usability question2 12 0 3.17 1.267
Usability question3 12 0 3.75 1.055
Usability question4 12 0 4.08 .900
Usability question5 12 0 4.33 .985
Usability question6 12 0 3.58 1.165
Usability question7 12 0 3.67 .985
Usability question8 12 0 3.25 1.055
Usability question9 12 0 2.83 1.030
Usability question10 12 0 3.92 1.084
Usability question11 12 0 4.00 1.206
Usability question12 12 0 3.58 1.379
Usability question13 12 0 3.00 .853
Usability question14 12 0 4.08 .793
Usability question15 12 0 4.00 .953
Usability question16 12 0 2.83 1.030
Usability question17 12 0 3.75 .965
Usability question18 12 0 4.67 .492
Usability question19 12 0 3.75 1.055
Usability question20 12 0 3.75 1.055
Usability question21 12 0 4.00 1.044
Usability question22 12 0 4.00 1.044
Usability question23 12 0 4.50 .674
Usability question24 12 0 2.92 .793
Usability question25 12 0 4.08 .793
Usability question26 12 0 4.33 .888
Usability question27 12 0 4.08 .996
Usability question28 12 0 4.08 1.084
Usability question29 12 0 3.83 .835
Usability question30 12 0 4.25 1.055
Usability question31 12 0 4.00 1.044
Usability question32 12 0 2.92 1.084
Usability question33 12 0 2.58 .669
Usability question34 12 0 3.50 1.000
Usability question35 12 0 3.33 .888
Usability question36 12 0 3.33 .985
Usability question37 12 0 3.83 1.030
Usability question38 12 0 4.42 .793
Usability question39 12 0 3.42 1.084
Usability question40 12 0 4.00 .953
Usability question41 12 0 4.17 .835
Usability question42 12 0 3.92 .793
Usability question43 12 0 4.33 .985
Usability question44 12 0 4.33 .778
Usability question45 12 0 4.42 .669
Usability question46 12 0 4.67 .492

336
Usability question47 12 0 4.25 .622
Usability question48 12 0 4.00 .953
Usability question49 12 0 4.25 .866
Usability question50 12 0 3.83 1.030
Credibility question1 12 0 4.25 .754
Credibility question2 12 0 3.25 .754
Credibility question3 12 0 4.25 .754
Credibility question4 12 0 4.00 1.348
Credibility question5 12 0 3.92 .669
Credibility question6 12 0 2.83 .835
Credibility question7 12 0 4.58 .669
Credibility question8 12 0 4.83 .389
Credibility question9 12 0 4.67 .492
Credibility question10 12 0 3.42 .996
Credibility question11 12 0 4.17 .937
Credibility question12 12 0 4.33 .985
Credibility question13 12 0 4.50 .674
Credibility question14 12 0 3.42 .793
Credibility question15 12 0 3.08 .996
Credibility question16 12 0 2.75 .754
Credibility question17 12 0 3.33 .651
Credibility question18 12 0 4.75 .452
Credibility question19 12 0 4.25 .866
Credibility question20 12 0 2.75 .866
Credibility question21 12 0 4.58 .793
Credibility question22 12 0 4.25 .965
Credibility question23 12 0 3.17 .937
Credibility question24 12 0 3.50 1.000
Credibility question25 12 0 3.17 1.030
Credibility question26 12 0 4.92 .289
Credibility question27 12 0 4.00 .853
Credibility question28 12 0 3.50 .905
Credibility question29 12 0 4.25 .754
Credibility question30 12 0 4.25 .866
Credibility question31 12 0 4.08 1.084
Credibility question32 12 0 3.92 1.084
Credibility question33 12 0 4.17 .835
Credibility question34 12 0 3.42 .900
Credibility question35 12 0 4.33 .778
Credibility question36 12 0 4.25 .866
Credibility question37 12 0 4.17 .937
Credibility question38 12 0 3.17 .937
Credibility question39 12 0 3.08 .515
Usability strengths and problems identification
Test Value = 3.84
t df
Sig. (2-
tailed)
Mean
Difference
95% Confidence
Interval of the
Difference
Lower Upper
Usability question1 3.852 11 .003 .743 .32 1.17
Usability question2 -1.841 11 .093 -.673 -1.48 .13

337
Usability question3 -.295 11 .773 -.090 -.76 .58
Usability question4 .936 11 .369 .243 -.33 .82
Usability question5 1.735 11 .111 .493 -.13 1.12
Usability question6 -.764 11 .461 -.257 -1.00 .48
Usability question7 -.610 11 .554 -.173 -.80 .45
Usability question8 -1.937 11 .079 -.590 -1.26 .08
Usability question9 -3.386 11 .006 -1.007 -1.66 -.35
Usability question10 .245 11 .811 .077 -.61 .77
Usability question11 .460 11 .655 .160 -.61 .93
Usability question12 -.645 11 .532 -.257 -1.13 .62
Usability question13 -3.412 11 .006 -.840 -1.38 -.30
Usability question14 1.063 11 .311 .243 -.26 .75
Usability question15 .581 11 .573 .160 -.45 .77
Usability question16 -3.386 11 .006 -1.007 -1.66 -.35
Usability question17 -.323 11 .753 -.090 -.70 .52
Usability question18 5.816 11 .000 .827 .51 1.14
Usability question19 -.295 11 .773 -.090 -.76 .58
Usability question20 -.295 11 .773 -.090 -.76 .58
Usability question21 .531 11 .606 .160 -.50 .82
Usability question22 .531 11 .606 .160 -.50 .82
Usability question23 3.391 11 .006 .660 .23 1.09
Usability question24 -4.034 11 .002 -.923 -1.43 -.42
Usability question25 1.063 11 .311 .243 -.26 .75
Usability question26 1.925 11 .080 .493 -.07 1.06
Usability question27 .846 11 .416 .243 -.39 .88
Usability question28 .778 11 .453 .243 -.45 .93
Usability question29 -.028 11 .978 -.007 -.54 .52
Usability question30 1.346 11 .205 .410 -.26 1.08
Usability question31 .531 11 .606 .160 -.50 .82
Usability question32 -2.952 11 .013 -.923 -1.61 -.23
Usability question33 -6.511 11 .000 -1.257 -1.68 -.83
Usability question34 -1.178 11 .264 -.340 -.98 .30
Usability question35 -1.977 11 .074 -.507 -1.07 .06
Usability question36 -1.782 11 .102 -.507 -1.13 .12
Usability question37 -.022 11 .983 -.007 -.66 .65
Usability question38 2.519 11 .029 .577 .07 1.08
Usability question39 -1.353 11 .203 -.423 -1.11 .27
Usability question40 .581 11 .573 .160 -.45 .77
Usability question41 1.355 11 .202 .327 -.20 .86
Usability question42 .335 11 .744 .077 -.43 .58
Usability question43 1.735 11 .111 .493 -.13 1.12
Usability question44 2.195 11 .051 .493 .00 .99
Usability question45 2.988 11 .012 .577 .15 1.00
Usability question46 5.816 11 .000 .827 .51 1.14
Usability question47 2.285 11 .043 .410 .02 .80
Usability question48 .581 11 .573 .160 -.45 .77
Usability question49 1.640 11 .129 .410 -.14 .96
Usability question50 -.022 11 .983 -.007 -.66 .65
Credibility strengths and problems identification
Test Value = 3.89

338
t df
Sig. (2-
tailed)
Mean
Difference
95% Confidence
Interval of the
Difference
Lower Upper
Credibility question1 1.654 11 .126 .360 -.12 .84
Credibility question2 -2.941 11 .013 -.640 -1.12 -.16
Credibility question3 1.654 11 .126 .360 -.12 .84
Credibility question4 .283 11 .783 .110 -.75 .97
Credibility question5 .138 11 .893 .027 -.40 .45
Credibility question6 -4.385 11 .001 -1.057 -1.59 -.53
Credibility question7 3.592 11 .004 .693 .27 1.12
Credibility question8 8.395 11 .000 .943 .70 1.19
Credibility question9 5.464 11 .000 .777 .46 1.09
Credibility question10 -1.646 11 .128 -.473 -1.11 .16
Credibility question11 1.022 11 .329 .277 -.32 .87
Credibility question12 1.560 11 .147 .443 -.18 1.07
Credibility question13 3.134 11 .010 .610 .18 1.04
Credibility question14 -2.068 11 .063 -.473 -.98 .03
Credibility question15 -2.805 11 .017 -.807 -1.44 -.17
Credibility question16 -5.239 11 .000 -1.140 -1.62 -.66
Credibility question17 -2.961 11 .013 -.557 -.97 -.14
Credibility question18 6.587 11 .000 .860 .57 1.15
Credibility question19 1.440 11 .178 .360 -.19 .91
Credibility question20 -4.560 11 .001 -1.140 -1.69 -.59
Credibility question21 3.029 11 .011 .693 .19 1.20
Credibility question22 1.292 11 .223 .360 -.25 .97
Credibility question23 -2.673 11 .022 -.723 -1.32 -.13
Credibility question24 -1.351 11 .204 -.390 -1.03 .25
Credibility question25 -2.433 11 .033 -.723 -1.38 -.07
Credibility question26 12.320 11 .000 1.027 .84 1.21
Credibility question27 .447 11 .664 .110 -.43 .65
Credibility question28 -1.494 11 .163 -.390 -.96 .18
Credibility question29 1.654 11 .126 .360 -.12 .84
Credibility question30 1.440 11 .178 .360 -.19 .91
Credibility question31 .618 11 .549 .193 -.50 .88
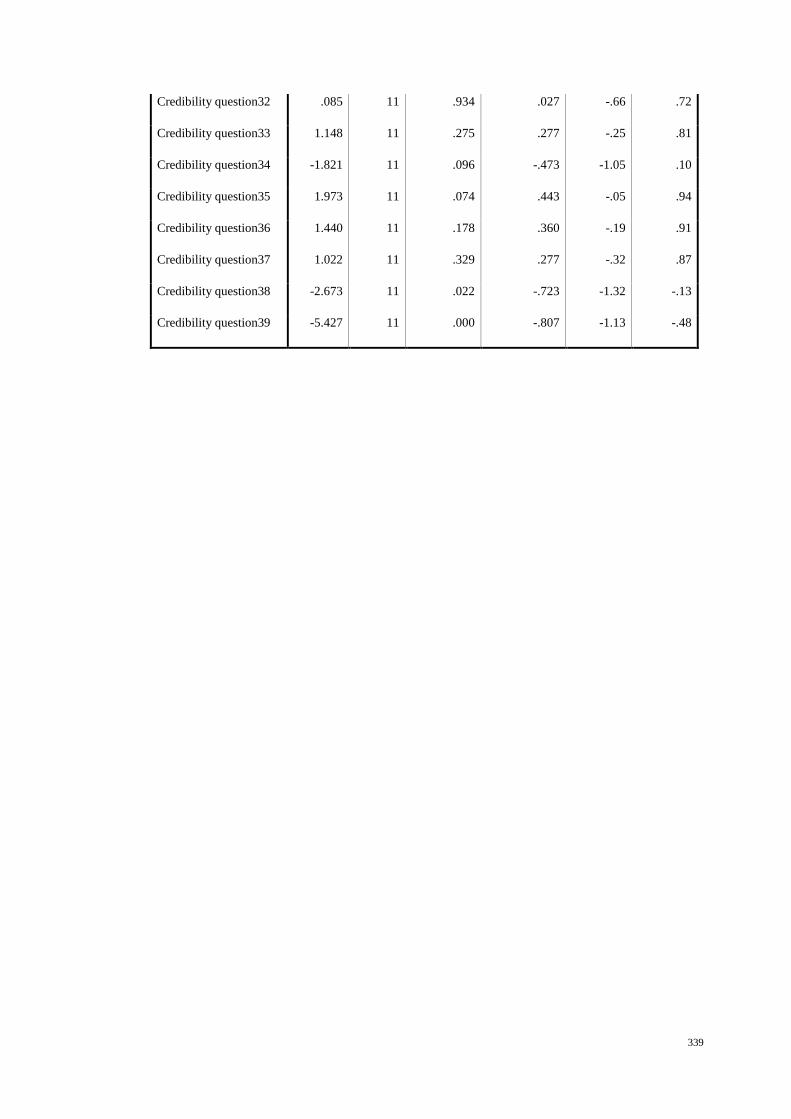
339
Credibility question32 .085 11 .934 .027 -.66 .72
Credibility question33 1.148 11 .275 .277 -.25 .81
Credibility question34 -1.821 11 .096 -.473 -1.05 .10
Credibility question35 1.973 11 .074 .443 -.05 .94
Credibility question36 1.440 11 .178 .360 -.19 .91
Credibility question37 1.022 11 .329 .277 -.32 .87
Credibility question38 -2.673 11 .022 -.723 -1.32 -.13
Credibility question39 -5.427 11 .000 -.807 -1.13 -.48

340
Appendix 9a: Results of users’ performance with London Authority 1 in
experiment 1
Performance results
N Minimum Maximum Mean Std. Deviation
total time for all tasks 12 13.20 43.91 26.6267 8.90527
total steps for all tasks 12 44.00 86.00 60.4167 13.10419
total helps for all tasks 12 .00 1.00 .2500 .45227
overall completion for
all tasks 12 9.00 12.00 10.2500 1.05529
Valid N (listwise) 12
Appendix 9b: Results of users’ performance with London Authority 2 in
experiment 1
Performance results
N Minimum Maximum Mean Std. Deviation
total time for all tasks 12 12.61 38.71 21.7208 8.57907
total steps for all asks 12 49.00 115.00 81.8333 20.68743
total helps for all tasks 12 .00 2.00 .5833 .66856
overall completion for all
tasks 12 9.00 12.00 10.3333 .77850
Valid N (listwise) 12
Appendix 9c: Results of users’ performance with London Authority 3 in
experiment 1
Performance results
N Minimum Maximum Mean Std. Deviation
total time for all tasks 12 7.39 31.14 16.2092 8.10166
total steps for all tasks 12 28.00 84.00 50.1667 16.29742
total helps for all tasks 12 .00 .00 .0000 .00000
overall completion for
all tasks 12 9.00 11.00 9.5833 .79296
Valid N (listwise) 12

341
Appendix 10a: Results of users’ perception of usability and credibility for the
redesigned London Authority 1 in experiment 2
Paired Samples Statistics
Mean N Std. Deviation
Std. Error
Mean
Pair 1 Usability question40 2.33 12 1.155 .333
experiment 2 usability
1 - uq40 4.50 12 .522 .151
Pair 2 Usability question33 2.42 12 1.084 .313
experiment 2 usability
2 - uq33 4.67 12 .651 .188
Pair 3 Usability question41 2.75 12 .866 .250
experiment 2 usability
3 - uq41 4.50 12 .522 .151
Pair 4 Credibility question2 2.58 12 .996 .288
experiment 2
credibility 1 - cq2 3.83 12 1.267 .366
Paired Samples Correlations
N Correlation Sig.
Pair 1 Usability question40 &
experiment 2 usability
1 - uq40 12 .000 1.000
Pair 2 Usability question33 &
experiment 2 usability
2 - uq33 12 .343 .274
Pair 3 Usability question41 &
experiment 2 usability
3 - uq41 12 -.101 .756
Pair 4 Credibility question2 &
experiment 2 credibility
1 - cq2 12 -.060 .853
Paired Samples Test
Paired Differences t df
Sig. (2-
tailed)
Mean
Std.
Deviat
ion
Std.
Error
Mean
95% Confidence
Interval of the
Difference
Lower Upper
Pair
1
Usability
question40 -
experiment
2 usability 1
- uq40
-2.167 1.267 .366 -2.972 -1.361 -5.922 11 .000
Pair
2
Usability
question33 -
experiment
2 usability 2
- uq33
-2.250 1.055 .305 -2.920 -1.580 -7.386 11 .000

342
Pair
3
Usability
question41 -
experiment
2 usability 3
- uq41
-1.750 1.055 .305 -2.420 -1.080 -5.745 11 .000
Pair
4
Credibility
question2 -
experiment
2 credibility
1 - cq2
-1.250 1.658 .479 -2.304 -.196 -2.611 11 .024
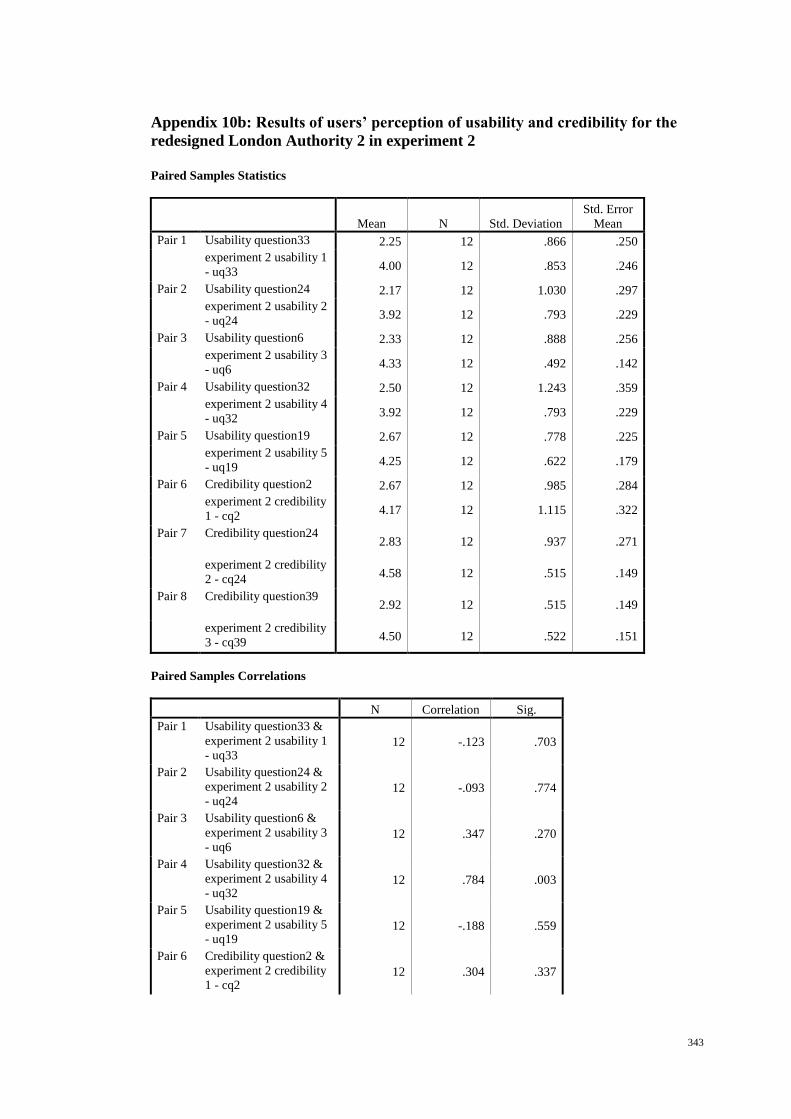
343
Appendix 10b: Results of users’ perception of usability and credibility for the
redesigned London Authority 2 in experiment 2
Paired Samples Statistics
Mean N Std. Deviation
Std. Error
Mean
Pair 1 Usability question33 2.25 12 .866 .250
experiment 2 usability 1
- uq33 4.00 12 .853 .246
Pair 2 Usability question24 2.17 12 1.030 .297
experiment 2 usability 2
- uq24 3.92 12 .793 .229
Pair 3 Usability question6 2.33 12 .888 .256
experiment 2 usability 3
- uq6 4.33 12 .492 .142
Pair 4 Usability question32 2.50 12 1.243 .359
experiment 2 usability 4
- uq32 3.92 12 .793 .229
Pair 5 Usability question19 2.67 12 .778 .225
experiment 2 usability 5
- uq19 4.25 12 .622 .179
Pair 6 Credibility question2 2.67 12 .985 .284
experiment 2 credibility
1 - cq2 4.17 12 1.115 .322
Pair 7 Credibility question24 2.83 12 .937 .271
experiment 2 credibility
2 - cq24 4.58 12 .515 .149
Pair 8 Credibility question39 2.92 12 .515 .149
experiment 2 credibility
3 - cq39 4.50 12 .522 .151
Paired Samples Correlations
N Correlation Sig.
Pair 1 Usability question33 &
experiment 2 usability 1
- uq33 12 -.123 .703
Pair 2 Usability question24 &
experiment 2 usability 2
- uq24 12 -.093 .774
Pair 3 Usability question6 &
experiment 2 usability 3
- uq6 12 .347 .270
Pair 4 Usability question32 &
experiment 2 usability 4
- uq32 12 .784 .003
Pair 5 Usability question19 &
experiment 2 usability 5
- uq19 12 -.188 .559
Pair 6 Credibility question2 &
experiment 2 credibility
1 - cq2 12 .304 .337

344
Pair 7 Credibility question24 &
experiment 2 credibility
2 - cq24 12 -.157 .626
Pair 8 Credibility question39 &
experiment 2 credibility
3 - cq39 12 -.169 .599
Paired Samples Test
Paired Differences t df
Sig. (2-
tailed)
Mean
Std.
Deviatio
n
Std.
Error
Mean
95% Confidence
Interval of the
Difference
Lower Upper
Pair
1
Usability
question33 -
experiment
2 usability 1
- uq33
-1.750 1.288 .372 -2.568 -.932 -4.706 11 .001
Pair
2
Usability
question24 -
experiment
2 usability 2
- uq24
-1.750 1.357 .392 -2.612 -.888 -4.468 11 .001
Pair
3
Usability
question6 -
experiment
2 usability 3
- uq6
-2.000 .853 .246 -2.542 -1.458 -8.124 11 .000
Pair
4
Usability
question32 -
experiment
2 usability 4
- uq32
-1.417 .793 .229 -1.920 -.913 -6.189 11 .000
Pair
5
Usability
question19 -
experiment
2 usability 5
- uq19
-1.583 1.084 .313 -2.272 -.895 -5.062 11 .000
Pair
6
Credibility
question2 -
experiment
2 credibility
1 - cq2
-1.500 1.243 .359 -2.290 -.710 -4.180 11 .002
Pair
7
Credibility
question24 -
experiment
2 credibility
2 - cq24
-1.750 1.138 .329 -2.473 -1.027 -5.326 11 .000
Pair
8
Credibility
question39 -
experiment
2 credibility
3 - cq39
-1.583 .793 .229 -2.087 -1.080 -6.917 11 .000

345
Appendix 10c: Results of users’ perception of usability and credibility for the
redesigned London Authority 3 in experiment 2
Paired Samples Statistics
Mean N Std. Deviation
Std. Error
Mean
Pair 1 Usability question33 2.58 12 .669 .193
experiment 2 usability 1
- uq33 4.33 12 .492 .142
Pair 2 Usability question32 2.92 12 1.084 .313
experiment 2 usability 2
- uq32 3.58 12 1.165 .336
Pair 3 Usability question9 2.83 12 1.030 .297
experiment 2 usability 3
- uq9 3.42 12 .900 .260
Pair 4 Usability question16 2.83 12 1.030 .297
experiment 2 usability 4
- uq16 4.17 12 .577 .167
Pair 5 Usability question13 3.00 12 .853 .246
experiment 2 usability 5
- uq13 3.75 12 1.215 .351
Pair 6 Credibility question39 3.08 12 .515 .149
experiment 2 credibility
1 - cq39 4.42 12 .515 .149
Pair 7 Credibility question20 2.75 12 .866 .250
experiment 2 credibility
2 - cq20 3.50 12 1.000 .289
Pair 8 Credibility question16 2.75 12 .754 .218
experiment 2 credibility
3 - cq16 4.25 12 .452 .131
Pair 9 Credibility question15 3.08 12 .996 .288
experiment 2 credibility
4 - cq15 4.50 12 .522 .151
Pair
10
Credibility question23 3.17 12 .937 .271
experiment 2 credibility
5 - cq23 4.00 12 1.044 .302
Pair
11
Credibility question25 3.17 12 1.030 .297
experiment 2 credibility
6 - cq25 4.50 12 .522 .151
Pair
12
Credibility question38 3.17 12 .937 .271
experiment 2 credibility
7 - cq38 4.25 12 .452 .131
Paired Samples Correlations
N Correlation Sig.
Pair 1 Usability question33 &
experiment 2 usability 1
- uq33 12 .184 .567

346
Pair 2 Usability question32 &
experiment 2 usability 2
- uq32 12 .258 .418
Pair 3 Usability question9 &
experiment 2 usability 3
- uq9 12 .180 .576
Pair 4 Usability question16 &
experiment 2 usability 4
- uq16 12 .051 .875
Pair 5 Usability question13 &
experiment 2 usability 5
- uq13 12 -.263 .409
Pair 6 Credibility question39 &
experiment 2 credibility
1 - cq39 12 -.143 .658
Pair 7 Credibility question20 &
experiment 2 credibility
2 - cq20 12 .472 .121
Pair 8 Credibility question16 &
experiment 2 credibility
3 - cq16 12 .200 .533
Pair 9 Credibility question15 &
experiment 2 credibility
4 - cq15 12 -.087 .787
Pair
10
Credibility question23 &
experiment 2 credibility
5 - cq23 12 .279 .381
Pair
11
Credibility question25 &
experiment 2 credibility
6 - cq25 12 -.338 .282
Pair
12
Credibility question38 &
experiment 2 credibility
7 - cq38 12 -.322 .308
Paired Samples Test
Paired Differences t df
Sig. (2-
tailed)
Mean
Std.
Deviatio
n
Std.
Error
Mean
95% Confidence
Interval of the
Difference
Lower Upper
Pair
1
Usability
question33 -
experiment 2
usability 1 -
uq33
-1.750 .754 .218 -2.229 -1.271 -8.042 11 .000
Pair
2
Usability
question32 -
experiment 2
usability 2 -
uq32
-.667 1.371 .396 -1.538 .204 -1.685 11 .120
Pair
3
Usability
question9 -
experiment 2
usability 3 -
uq9
-.583 1.240 .358 -1.371 .205 -1.629 11 .131

347
Pair
4
Usability
question16 -
experiment 2
usability 4 -
uq16
-1.333 1.155 .333 -2.067 -.600 -4.000 11 .002
Pair
5
Usability
question13 -
experiment 2
usability 5 -
uq13
-.750 1.658 .479 -1.804 .304 -1.567 11 .145
Pair
6
Credibility
question39 -
experiment 2
credibility 1 -
cq39
-1.333 .778 .225 -1.828 -.839 -5.933 11 .000
Pair
7
Credibility
question20 -
experiment 2
credibility 2 -
cq20
-.750 .965 .279 -1.363 -.137 -2.691 11 .021
Pair
8
Credibility
question16 -
experiment 2
credibility 3 -
cq16
-1.500 .798 .230 -2.007 -.993 -6.514 11 .000
Pair
9
Credibility
question15 -
experiment 2
credibility 4 -
cq15
-1.417 1.165 .336 -2.157 -.677 -4.214 11 .001
Pair
10
Credibility
question23 -
experiment 2
credibility 5 -
cq23
-.833 1.193 .345 -1.592 -.075 -2.419 11 .034
Pair
11
Credibility
question25 -
experiment 2
credibility 6 -
cq25
-1.333 1.303 .376 -2.161 -.506 -3.546 11 .005
Pair
12
Credibility
question38 -
experiment 2
credibility 7 -
cq38
-1.083 1.165 .336 -1.823 -.343 -3.223 11 .008

348
Appendix 11a: Results of users’ performance with the redesigned London
Authority 1 in experiment 2
Paired Samples Statistics
Mean N Std. Deviation
Std. Error
Mean
Pair 1 total time for all tasks 26.6267 12 8.90527 2.57073
experiment 2 total time
for all tasks 15.4267 12 2.49448 .72009
Pair 2 total steps for all tasks 60.4167 12 13.10419 3.78285
experiment 2 total steps
for all tasks 41.1667 12 4.64823 1.34183
Pair 3 total helps for all tasks .2500 12 .45227 .13056
experiment 2 total helps
for all tasks .0000 12 .00000 .00000
Pair 4 overall completion for all
tasks 1.1389 12 .11725 .03385
experiment 2 overall
completion for all tasks 1.0000 12 .00000 .00000
Paired Samples Correlations
N Correlation Sig.
Pair 1 total time for all tasks &
experiment 2 total time
for all tasks 12 -.035 .913
Pair 2 total steps for all tasks &
experiment 2 total steps
for all tasks 12 .063 .846
Pair 3 total helps for all tasks &
experiment 2 total helps
for all tasks 12 . .
Pair 4 overall completion for all
tasks & experiment 2
overall completion for all
tasks
12 . .
Paired Samples Test
Paired Differences t df
Sig. (2-
tailed)
Mean
Std.
Deviat
ion
Std.
Error
Mean
95% Confidence
Interval of the
Difference
Lower Upper
Pair 1 total time for
all tasks -
experiment 2
total time for
all tasks
11.2000
0
9.3324
2
2.6940
4
5.2704
7
17.1295
3
4.157 11 .002
Pair 2 total steps for
all tasks -
experiment 2
total steps for
all tasks
19.2500
0
13.625
68
3.9333
9
10.592
66
27.9073
4
4.894 11 .000

349
Pair 3 total helps for
all tasks -
experiment 2
total helps for
all tasks
.25000 .45227 .13056 -
.03736
.53736 1.915 11 .082
Pair 4 overall
completion for
all tasks -
experiment 2
overall
completion for
all tasks
.13889 .11725 .03385 .06439 .21339 4.103 11 .002
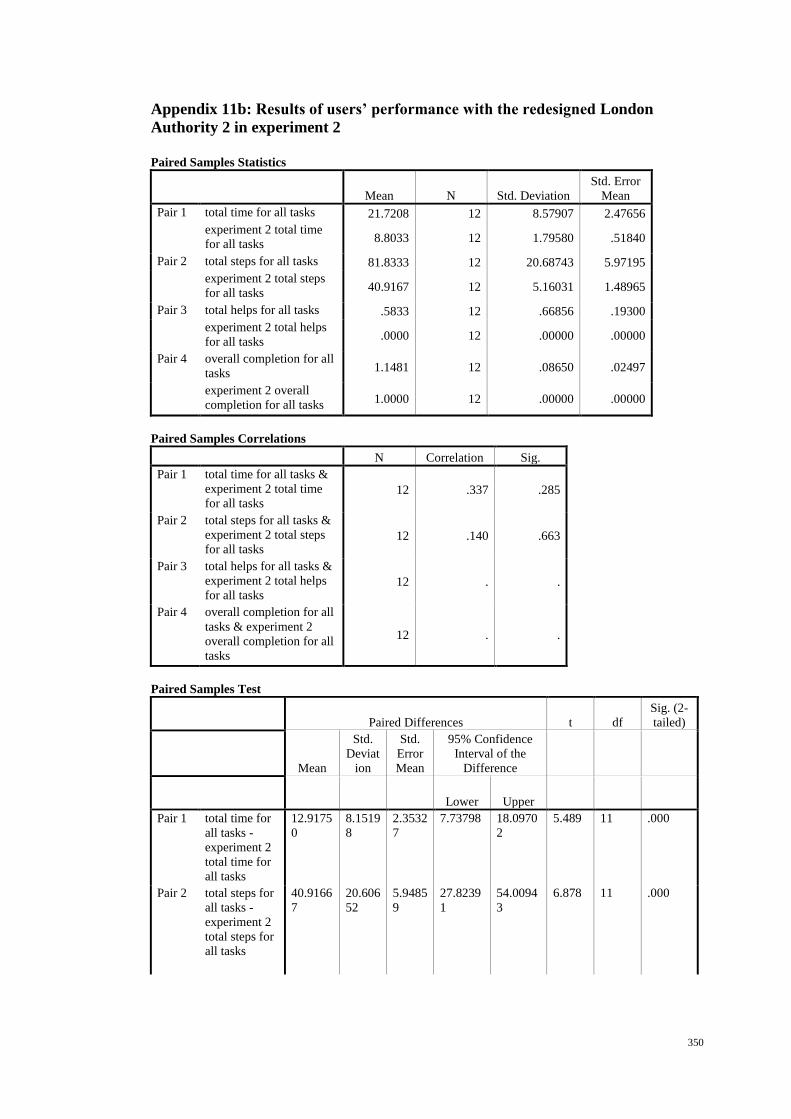
350
Appendix 11b: Results of users’ performance with the redesigned London
Authority 2 in experiment 2
Paired Samples Statistics
Mean N Std. Deviation
Std. Error
Mean
Pair 1 total time for all tasks 21.7208 12 8.57907 2.47656
experiment 2 total time
for all tasks 8.8033 12 1.79580 .51840
Pair 2 total steps for all tasks 81.8333 12 20.68743 5.97195
experiment 2 total steps
for all tasks 40.9167 12 5.16031 1.48965
Pair 3 total helps for all tasks .5833 12 .66856 .19300
experiment 2 total helps
for all tasks .0000 12 .00000 .00000
Pair 4 overall completion for all
tasks 1.1481 12 .08650 .02497
experiment 2 overall
completion for all tasks 1.0000 12 .00000 .00000
Paired Samples Correlations
N Correlation Sig.
Pair 1 total time for all tasks &
experiment 2 total time
for all tasks 12 .337 .285
Pair 2 total steps for all tasks &
experiment 2 total steps
for all tasks 12 .140 .663
Pair 3 total helps for all tasks &
experiment 2 total helps
for all tasks 12 . .
Pair 4 overall completion for all
tasks & experiment 2
overall completion for all
tasks
12 . .
Paired Samples Test
Paired Differences t df
Sig. (2-
tailed)
Mean
Std.
Deviat
ion
Std.
Error
Mean
95% Confidence
Interval of the
Difference
Lower Upper
Pair 1 total time for
all tasks -
experiment 2
total time for
all tasks
12.9175
0
8.1519
8
2.3532
7
7.73798 18.0970
2
5.489 11 .000
Pair 2 total steps for
all tasks -
experiment 2
total steps for
all tasks
40.9166
7
20.606
52
5.9485
9
27.8239
1
54.0094
3
6.878 11 .000
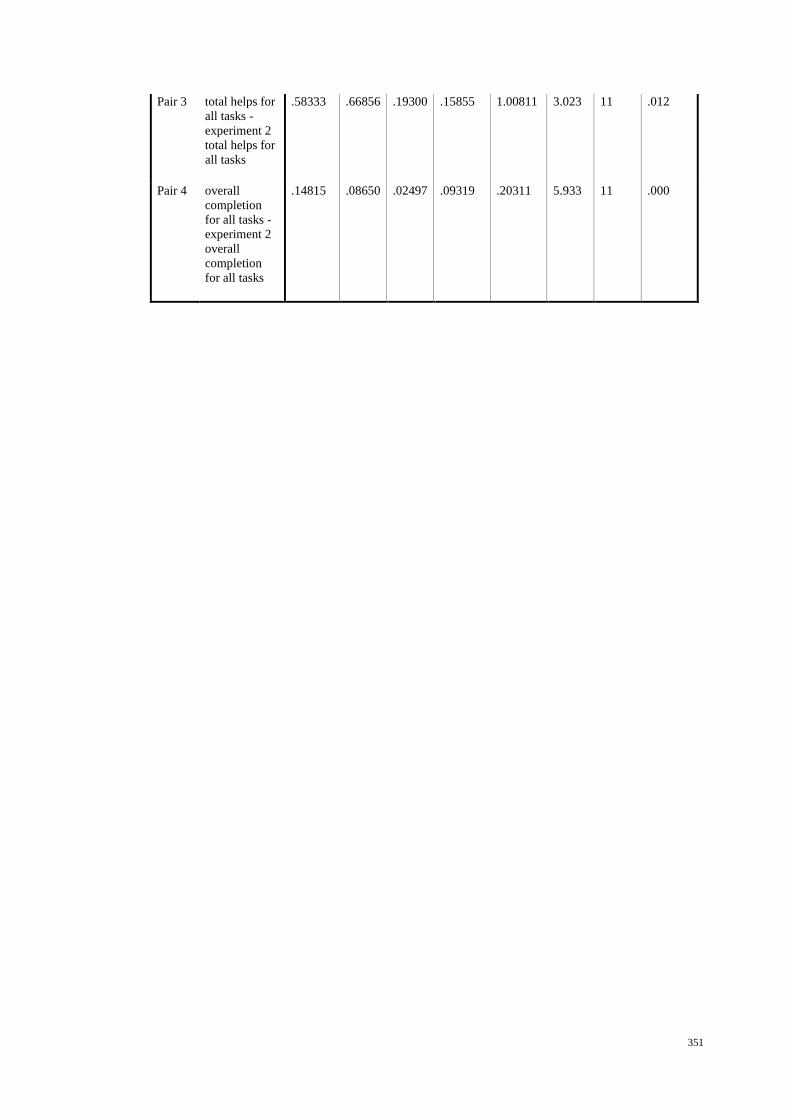
351
Pair 3 total helps for
all tasks -
experiment 2
total helps for
all tasks
.58333 .66856 .19300 .15855 1.00811 3.023 11 .012
Pair 4 overall
completion
for all tasks -
experiment 2
overall
completion
for all tasks
.14815 .08650 .02497 .09319 .20311 5.933 11 .000
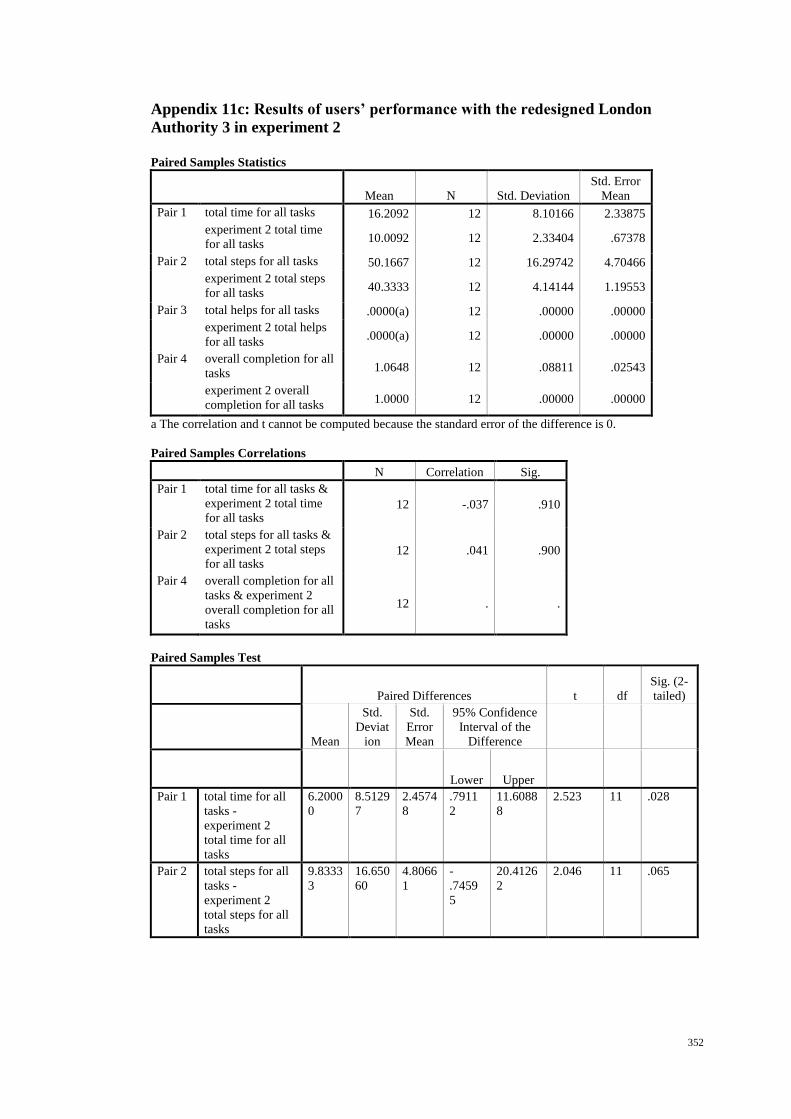
352
Appendix 11c: Results of users’ performance with the redesigned London
Authority 3 in experiment 2
Paired Samples Statistics
Mean N Std. Deviation
Std. Error
Mean
Pair 1 total time for all tasks 16.2092 12 8.10166 2.33875
experiment 2 total time
for all tasks 10.0092 12 2.33404 .67378
Pair 2 total steps for all tasks 50.1667 12 16.29742 4.70466
experiment 2 total steps
for all tasks 40.3333 12 4.14144 1.19553
Pair 3 total helps for all tasks .0000(a) 12 .00000 .00000
experiment 2 total helps
for all tasks .0000(a) 12 .00000 .00000
Pair 4 overall completion for all
tasks 1.0648 12 .08811 .02543
experiment 2 overall
completion for all tasks 1.0000 12 .00000 .00000
a The correlation and t cannot be computed because the standard error of the difference is 0.
Paired Samples Correlations
N Correlation Sig.
Pair 1 total time for all tasks &
experiment 2 total time
for all tasks 12 -.037 .910
Pair 2 total steps for all tasks &
experiment 2 total steps
for all tasks 12 .041 .900
Pair 4 overall completion for all
tasks & experiment 2
overall completion for all
tasks
12 . .
Paired Samples Test
Paired Differences t df
Sig. (2-
tailed)
Mean
Std.
Deviat
ion
Std.
Error
Mean
95% Confidence
Interval of the
Difference
Lower Upper
Pair 1 total time for all
tasks -
experiment 2
total time for all
tasks
6.2000
0
8.5129
7
2.4574
8
.7911
2
11.6088
8
2.523 11 .028
Pair 2 total steps for all
tasks -
experiment 2
total steps for all
tasks
9.8333
3
16.650
60
4.8066
1
-
.7459
5
20.4126
2
2.046 11 .065

353
Pair 4 overall
completion for all
tasks -
experiment 2
overall
completion for all
tasks
.06481 .08811 .02543 .0088
3
.12080 2.548 11 .027

354
Appendix 12 Performance measurement form
performance measurement form
E-government name:
Date: T = time to complete each task C = correct task completed
N = number of steps to finish each
task
H = number of online help
Task T N H C NOTES
1 Start:
Finish:
2 Start:
Finish:
3 Start:
Finish:
4 Start:
Finish:
5 Start:
Finish:
6 Start:
Finish:
7 Start:
Finish:
8 Start:
Finish:
9 Start:
Finish:
Total
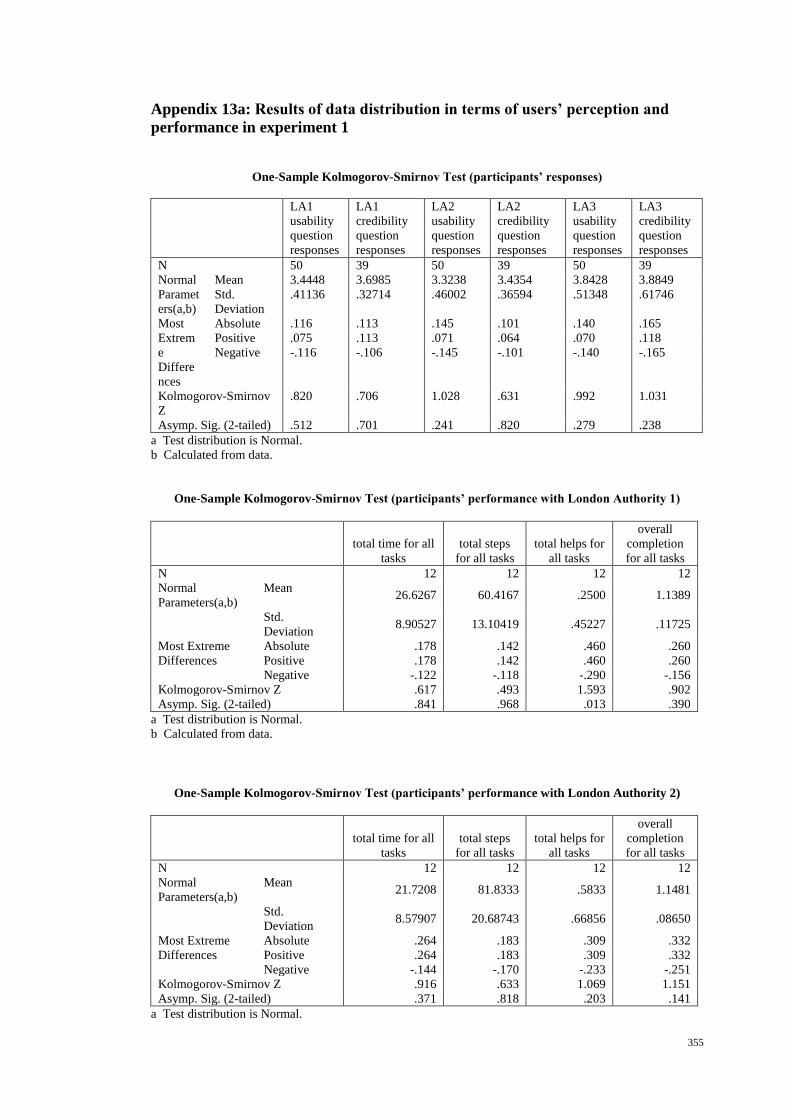
355
Appendix 13a: Results of data distribution in terms of users’ perception and
performance in experiment 1
One-Sample Kolmogorov-Smirnov Test (participants’ responses)
LA1
usability
question
responses
LA1
credibility
question
responses
LA2
usability
question
responses
LA2
credibility
question
responses
LA3
usability
question
responses
LA3
credibility
question
responses
N 50 39 50 39 50 39
Normal
Paramet
ers(a,b)
Mean 3.4448 3.6985 3.3238 3.4354 3.8428 3.8849
Std.
Deviation
.41136 .32714 .46002 .36594 .51348 .61746
Most
Extrem
e
Differe
nces
Absolute .116 .113 .145 .101 .140 .165
Positive .075 .113 .071 .064 .070 .118
Negative -.116 -.106 -.145 -.101 -.140 -.165
Kolmogorov-Smirnov
Z
.820 .706 1.028 .631 .992 1.031
Asymp. Sig. (2-tailed) .512 .701 .241 .820 .279 .238
a Test distribution is Normal.
b Calculated from data.
One-Sample Kolmogorov-Smirnov Test (participants’ performance with London Authority 1)
total time for all
tasks
total steps
for all tasks
total helps for
all tasks
overall
completion
for all tasks
N 12 12 12 12
Normal
Parameters(a,b)
Mean 26.6267 60.4167 .2500 1.1389
Std.
Deviation 8.90527 13.10419 .45227 .11725
Most Extreme
Differences
Absolute .178 .142 .460 .260
Positive .178 .142 .460 .260
Negative -.122 -.118 -.290 -.156
Kolmogorov-Smirnov Z .617 .493 1.593 .902
Asymp. Sig. (2-tailed) .841 .968 .013 .390
a Test distribution is Normal.
b Calculated from data.
One-Sample Kolmogorov-Smirnov Test (participants’ performance with London Authority 2)
total time for all
tasks
total steps
for all tasks
total helps for
all tasks
overall
completion
for all tasks
N 12 12 12 12
Normal
Parameters(a,b)
Mean 21.7208 81.8333 .5833 1.1481
Std.
Deviation 8.57907 20.68743 .66856 .08650
Most Extreme
Differences
Absolute .264 .183 .309 .332
Positive .264 .183 .309 .332
Negative -.144 -.170 -.233 -.251
Kolmogorov-Smirnov Z .916 .633 1.069 1.151
Asymp. Sig. (2-tailed) .371 .818 .203 .141
a Test distribution is Normal.
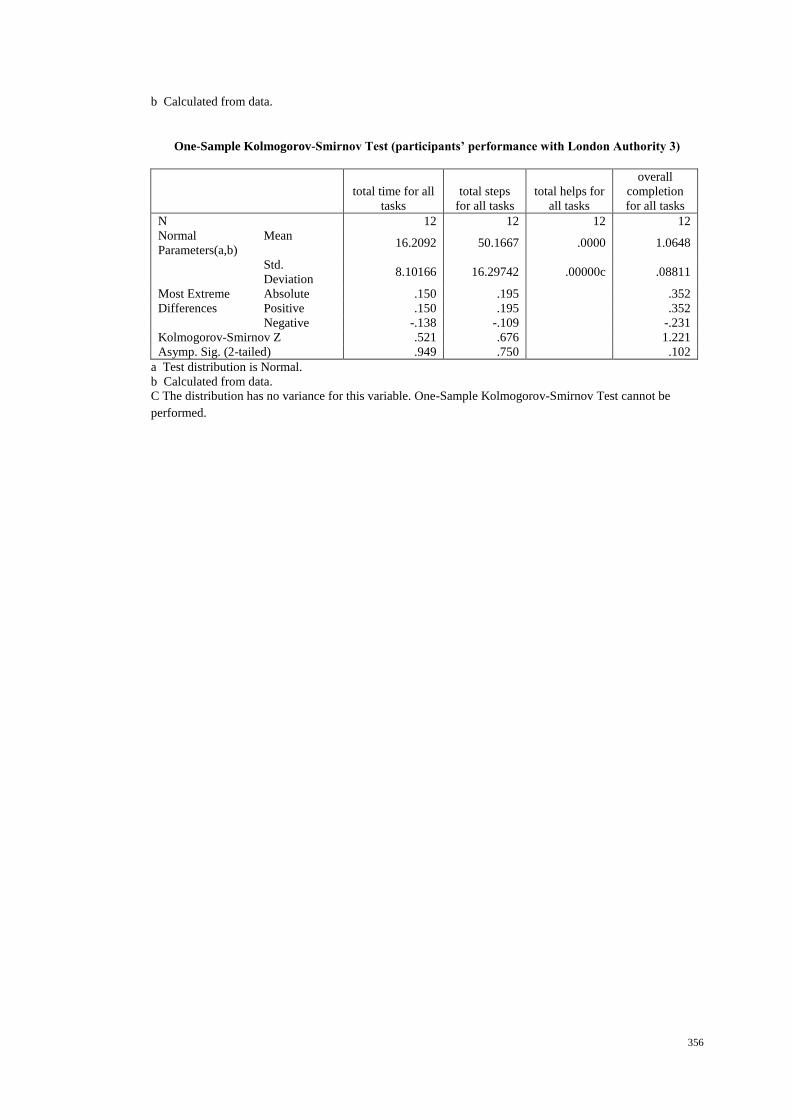
356
b Calculated from data.
One-Sample Kolmogorov-Smirnov Test (participants’ performance with London Authority 3)
total time for all
tasks
total steps
for all tasks
total helps for
all tasks
overall
completion
for all tasks
N 12 12 12 12
Normal
Parameters(a,b)
Mean 16.2092 50.1667 .0000 1.0648
Std.
Deviation 8.10166 16.29742 .00000c .08811
Most Extreme
Differences
Absolute .150 .195 .352
Positive .150 .195 .352
Negative -.138 -.109 -.231
Kolmogorov-Smirnov Z .521 .676 1.221
Asymp. Sig. (2-tailed) .949 .750 .102
a Test distribution is Normal.
b Calculated from data.
C The distribution has no variance for this variable. One-Sample Kolmogorov-Smirnov Test cannot be
performed.

357
Appendix 13b: Results of data distribution in terms of users’ perception and
performance in experiment 2
One-Sample Kolmogorov-Smirnov Test (participants’ responses in London Authority 1 and the
redesigned London Authority 1)
Exp.1
Usability
question4
0
Exp.1
Usability
question33
Exp.1
Usability
question4
1
Exp.1
Credibility
question2
Exp.2
usability
1 (uq40)
Exp.2
usability 2
(uq33)
N 12 12 12 12 12 12
Normal
Paramet
ers(a,b)
Mean 2.33 2.42 2.75 2.58 4.50 4.67
Std.
Deviation
1.155 1.084 .866 .996 .522 .651
Most
Extrem
e
Differe
nces
Absolute .199 .316 .280 .245 .331 .446
Positive .199 .316 .220 .171 .331 .304
Negative -.136 -.184 -.280 -.245 -.331 -.446
Kolmogorov-Smirnov
Z
.688 1.096 .971 .850 1.146 1.544
Asymp. Sig. (2-tailed) .732 .181 .303 .465 .145 .017
a Test distribution is Normal.
b Calculated from data.
Exp. 2
usability
3 (uq41)
Exp. 2
credibility
1 (cq2)
N 12 12
Normal
Paramet
ers(a,b)
Mean 4.50 3.83
Std.
Deviation
.522 1.267
Most
Extrem
e
Differe
nces
Absolute .331
.238
Positive .331
.179
Negative -.331
-.238
Kolmogorov-Smirnov
Z
1.146
.825
Asymp. Sig. (2-tailed) .145 .505
a Test distribution is Normal.
b Calculated from data.
One-Sample Kolmogorov-Smirnov Test (participants’ responses in London Authority 2 and the
redesigned London Authority 2)
Exp.1
Usability
question3
3
Exp.1
Usability
question24
Exp.1
Usability
question6
Exp.1
Usability
question32
Exp.1
Usability
question1
9
Exp.1
Credibility
question2
N 12 12 12 12 12 12
Normal
Paramet
ers(a,b)
Mean 2.25
2.17
2.33
2.50
2.67
2.67
Std.
Deviation
.866 1.030
.888
1.243
.778
.985
Most
Extrem
Absolute .280
.398
.230
.323
.304
.284
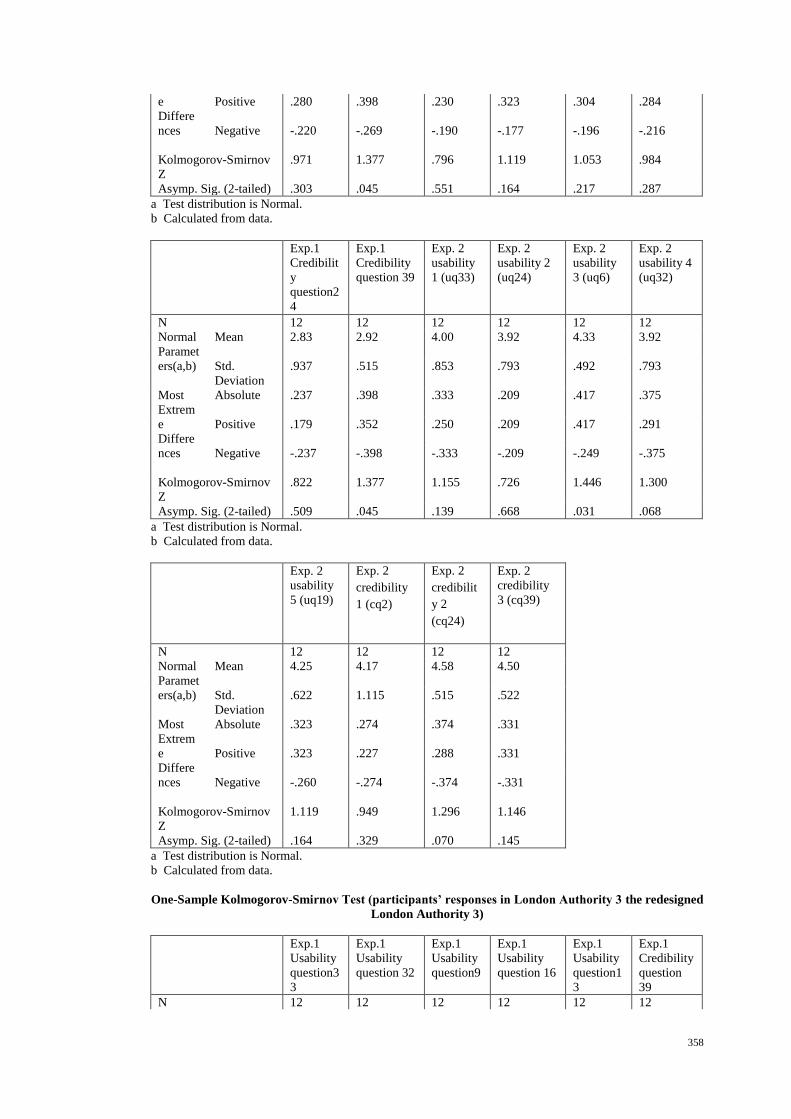
358
e
Differe
nces
Positive .280
.398
.230
.323
.304
.284
Negative -.220
-.269
-.190
-.177
-.196
-.216
Kolmogorov-Smirnov
Z
.971
1.377
.796
1.119
1.053
.984
Asymp. Sig. (2-tailed) .303 .045 .551 .164 .217 .287
a Test distribution is Normal.
b Calculated from data.
Exp.1
Credibilit
y
question2
4
Exp.1
Credibility
question 39
Exp. 2
usability
1 (uq33)
Exp. 2
usability 2
(uq24)
Exp. 2
usability
3 (uq6)
Exp. 2
usability 4
(uq32)
N 12 12 12 12 12 12
Normal
Paramet
ers(a,b)
Mean 2.83
2.92
4.00
3.92
4.33
3.92
Std.
Deviation
.937
.515
.853
.793
.492
.793
Most
Extrem
e
Differe
nces
Absolute .237
.398
.333
.209 .417 .375
Positive .179
.352
.250
.209
.417
.291
Negative -.237
-.398 -.333
-.209
-.249
-.375
Kolmogorov-Smirnov
Z
.822
1.377
1.155
.726
1.446
1.300
Asymp. Sig. (2-tailed) .509 .045 .139 .668 .031 .068
a Test distribution is Normal.
b Calculated from data.
Exp. 2
usability
5 (uq19)
Exp. 2
credibility
1 (cq2)
Exp. 2
credibilit
y 2
(cq24)
Exp. 2
credibility
3 (cq39)
N 12 12 12 12
Normal
Paramet
ers(a,b)
Mean 4.25
4.17
4.58
4.50
Std.
Deviation
.622
1.115
.515
.522
Most
Extrem
e
Differe
nces
Absolute .323
.274
.374
.331
Positive .323
.227
.288
.331
Negative -.260
-.274
-.374
-.331
Kolmogorov-Smirnov
Z
1.119
.949
1.296
1.146
Asymp. Sig. (2-tailed) .164 .329 .070 .145
a Test distribution is Normal.
b Calculated from data.
One-Sample Kolmogorov-Smirnov Test (participants’ responses in London Authority 3 the redesigned
London Authority 3)
Exp.1
Usability
question3
3
Exp.1
Usability
question 32
Exp.1
Usability
question9
Exp.1
Usability
question 16
Exp.1
Usability
question1
3
Exp.1
Credibility
question
39
N 12 12 12 12 12 12

359
Normal
Paramet
ers(a,b)
Mean 2.58
2.92
2.83
2.83
3.00
3.08
Std.
Deviation
.669
1.084
1.030
1.030
.853
.515
Most
Extrem
e
Differe
nces
Absolute .309
.303
.291
.291
.333
.398
Positive .309
.303
.291
.291
.333
.398
Negative -.233
-.199
-.209
-.209
-.250
-.352
Kolmogorov-Smirnov
Z
1.069
1.049 1.007
1.007
1.155
1.377
Asymp. Sig. (2-tailed) .203 .222 .262 .262 .139 .045
a Test distribution is Normal.
b Calculated from data.
Exp.1
Credibilit
y
question2
0
Exp.1
Credibility
question 16
Exp.1
Credibilit
y
question1
5
Exp.1
Credibility
question 23
Exp.1
Credibilit
y
question2
5
Exp.1
Credibility
question
38
N 12 12 12 12 12 12
Normal
Paramet
ers(a,b)
Mean 2.75
2.75
3.08
3.17
3.17
3.17
Std.
Deviation
.866
.754
.996
.937
1.030
.937
Most
Extrem
e
Differe
nces
Absolute .307
.257
.367
.237 .314
.237
Positive .307
.257
.367
.237
.314
.237
Negative -.193
-.213
-.217
-.179
-.186
-.179
Kolmogorov-Smirnov
Z
1.063
.890
1.270
.822
1.089
.822
Asymp. Sig. (2-tailed) .209 .407 .079 .509 .187 .509
a Test distribution is Normal.
b Calculated from data.
Exp.2
usability
1 (uq33)
Exp.2
usability 2
(uq32)
Exp.2
usability
3 (uq9)
Exp.2
usability 4
(uq16)
Exp.2
usability
5 (uq13)
Exp.2
credibility
1 (cq39)
N 12 12 12 12 12 12
Normal
Paramet
ers(a,b)
Mean 4.33
3.58
3.42
4.17
3.75
4.42
Std.
Deviation
.492
1.165
.900
.577 1.215
.515
Most
Extrem
e
Differe
nces
Absolute .417 .306
.408
.364
.248
.374
Positive .417
.194
.259
.364
.175
.374
Negative -.249
-.306
-.408
-.303
-.248
-.288
Kolmogorov-Smirnov
Z
1.446
1.061
1.414
1.259
.860
1.296
Asymp. Sig. (2-tailed) .031 .210 .037 .084 .451 .070
a Test distribution is Normal.
b Calculated from data.
Exp.2
credibilit
y 2
(cq20)
Exp.2
credibility
3 (cq16)
Exp.2
credibilit
y 4
(cq15)
Exp.2
credibility
5 (cq23)
Exp.2
credibilit
y 6
(cq25)
Exp.2
credibility
7 (cq38)
N 12 12 12 12 12 12

360
Normal
Paramet
ers(a,b)
Mean 3.50
4.25
4.50
4.00
4.50
4.25
Std.
Deviation
1.000 .452 .522 1.044 .522 .452
Most
Extrem
e
Differe
nces
Absolute .358 .460 .331 .333 .331 .460
Positive .225 .460 .331 .169 .331 .460
Negative -.358 -.290 -.331 -.333 -.331 -.290
Kolmogorov-Smirnov
Z
1.241 1.593 1.146 1.155 1.146 1.593
Asymp. Sig. (2-tailed) .092 .013 .145 .139 .145 .013
a Test distribution is Normal.
b Calculated from data.
One-Sample Kolmogorov-Smirnov Test (participants’ performance with London Authority 1 the
redesigned London Authority 1)
Exp.1 total
time for all
tasks
Exp.1 total
steps for all
tasks
Exp.1 total
helps for all
tasks
Exp.1 overall
completion for
all tasks
N 12 12 12 12
Normal
Parameters(a,b)
Mean 26.6267 60.4167 .2500 1.1389
Std.
Deviation
8.90527 13.10419 .45227 .11725
Most Extreme
Differences
Absolute .178 .142 .460 .260
Positive .178 .142 .460 .260
Negative -.122 -.118 -.290 -.156
Kolmogorov-Smirnov Z .617 .493 1.593 .902
Asymp. Sig. (2-tailed) .841 .968 .013 .390
a Test distribution is Normal.
b Calculated from data.
Exp.2 total
time for all
tasks
Exp.2 total
steps for all
tasks
Exp.2 total
helps for all
tasks
Exp.2 overall
completion for
all tasks
N 12 12 12 12
Normal
Parameters(a,b)
Mean 15.4267 41.1667 .0000 1.0000
Std.
Deviation
2.49448 4.64823 .00000c .00000c
Most Extreme
Differences
Absolute .136 .182
Positive .136 .182
Negative -.135 -.102
Kolmogorov-Smirnov Z .471 .632
Asymp. Sig. (2-tailed) .980 .819
a Test distribution is Normal.
b Calculated from data.
C The distribution has no variance for this variable. One-Sample Kolmogorov-Smirnov Test cannot be
performed.
One-Sample Kolmogorov-Smirnov Test (participants’ performance with London Authority 2 the
redesigned London Authority 2)
Exp.1 total
time for all
tasks
Exp.1 total
steps for all
tasks
Exp.1 total
helps for all
tasks
Exp.1 overall
completion for
all tasks
N 12 12 12 12
Normal
Parameters(a,b)
Mean 21.7208 81.8333 .5833 1.1481

361
Std.
Deviation
8.57907 20.68743 .66856 .08650
Most Extreme
Differences
Absolute .264 .183 .309 .332
Positive .264 .183 .309 .332
Negative -.144 -.170 -.233 -.251
Kolmogorov-Smirnov Z .916 .633 1.069 1.151
Asymp. Sig. (2-tailed) .371 .818 .203 .141
a Test distribution is Normal.
b Calculated from data.
Exp.2 total
time for all
tasks
Exp.2 total
steps for all
tasks
Exp.2 total
helps for all
tasks
Exp.2 overall
completion for
all tasks
N 12 12 12 12
Normal
Parameters(a,b)
Mean 8.8033 40.9167 .0000 1.0000
Std.
Deviation
1.79580 5.16031 .00000c .00000c
Most Extreme
Differences
Absolute .261 .119
Positive .261 .085
Negative -.116 -.119
Kolmogorov-Smirnov Z .905 .412
Asymp. Sig. (2-tailed) .386 .996
a Test distribution is Normal.
b Calculated from data.
C The distribution has no variance for this variable. One-Sample Kolmogorov-Smirnov Test cannot be
performed.
One-Sample Kolmogorov-Smirnov Test (participants’ performance with London Authority 3 the
redesigned London Authority 3)
Exp.1 total
time for all
tasks
Exp.1 total
steps for all
tasks
Exp.1 total
helps for all
tasks
Exp.1 overall
completion for
all tasks
N 12 12 12 12
Normal
Parameters(a,b)
Mean 16.2092 50.1667 .0000 1.0648
Std.
Deviation
8.10166 16.29742 .00000c .08811
Most Extreme
Differences
Absolute .150 .195 .352
Positive .150 .195 .352
Negative -.138 -.109 -.231
Kolmogorov-Smirnov Z .521 .676 1.221
Asymp. Sig. (2-tailed) .949 .750 .102
a Test distribution is Normal.
b Calculated from data.
C The distribution has no variance for this variable. One-Sample Kolmogorov-Smirnov Test cannot be
performed.
Exp.2 total
time for all
tasks
Exp.2 total
steps for all
tasks
Exp.2 total
helps for all
tasks
Exp.2 overall
completion for
all tasks
N 12 12 12 12
Normal
Parameters(a,b)
Mean 10.0092 40.3333 .0000 1.0000
Std.
Deviation
2.33404 4.14144 .00000c .00000c
Most Extreme
Differences
Absolute .134 .213
Positive .134 .213
Negative -.125 -.164
Kolmogorov-Smirnov Z .463 .739
Asymp. Sig. (2-tailed) .983 .645

362
a Test distribution is Normal.
b Calculated from data.
C The distribution has no variance for this variable. One-Sample Kolmogorov-Smirnov Test cannot be
performed

363
Appendix 14 Overall users’ perception of usability and credibility difference in
the three London Authorities in experiment 1
ANOVA (usability and credibility comparison in London Authorities 1, 2, 3)
Sum of Squares df Mean Square F Sig.
overall
usability
perception
Between Groups 1.775 2 .888 8.784 .001
Within Groups 3.335 33 .101
Total 5.111 35
overall
credibility
perception
Between Groups 1.220 2 .610 4.885 .014
Within Groups 4.120 33 .125
Total 5.340 35

364
Appendix 15 Users’ performance difference in the three London Authorities in
experiment 1
ANOVA (performance comparison in London Authorities 1, 2, 3)
Sum of Squares df Mean Square F Sig.
total time for
all tasks
Between Groups 651.880 2 325.940 4.474 .019
Within Groups 2403.953 33 72.847
Total 3055.833 35
total steps for
all tasks
Between Groups 6266.056 2 3133.028 10.862 .000
Within Groups 9518.250 33 288.432
Total 15784.306 35
total online
helps for all
tasks
Between Groups 2.056 2 1.028 4.733 .016
Within Groups 7.167 33 .217
Total 9.222 35
Successful
tasks
completion
Between Groups .050 2 .025 2.590 .090
Within Groups .319 33 .010
Total .369 35

365
Appendix 16 Ethics approval letter
Date: 25.09.2008
STATEMENT OF ETHICS APPROVAL
Proposer: Zhao Huang
Title: Evaluation of usability and credibility of Web-based e-governments
The school’s research ethics committee has considered the proposal recently submitted by
you. Acting under delegated authority, the committee is satisfied that there is no objection
on ethical grounds to the proposed study. Approval is given on the understanding that you
will adhere to the terms agreed with participants and to inform the committee of any change
of plans in relations to the information provided in the application form.
Yours sincerely,
Dr. Annette Payne Chair of the Research Ethics Committee SISCM
School of Information Systems, Computing and Mathematics K Darby-Dowman, Head of School, Professor of Operations Research G Fitzgerald Head of IS&C, Professor of Information Systems J Kaplunov, Head of Mathematical Science, Professor of Applied
Mathematics
Brunel University, Uxbridge, Middlesex UB8 3PH, UK Telephone: +44(0) 1895274000 Fax: +44(0) 1895 251686 Email: [email protected]


