
Open-File Report 2010–1231
U.S. Geological Survey Science for the Wyoming Landscape Conservation Initiative—2009 Annual Report
fold
U.S. Department of the InteriorU.S. Geological Survey

Cover photo credits: Pronghorn antelope (photo by Harvey Doerksen, U.S. Fish and Wildlife Service). Smaller photos from left to right: (1) adult Greater Sage-Grouse (photo by Cameron Aldridge, U.S. Geological Survey and Colorado State University); (2) Michelle Gilbert checking a Brewer’s sparrow nest (photo by Sarah Laske, University of Wyoming); (3) Indian Paintbrush (photo by Michelle Gilbert, University of Wyoming); and (4) well pad in the Jonah natural gas field (photo by Caleb Mitchell, University of Wyoming).

U.S. Geological Survey Science for the Wyoming Landscape Conservation Initiative—2009 Annual Report
By Zachary H. Bowen, Cameron L. Aldridge, Patrick J. Anderson, Timothy J. Assal, Laura R. H. Biewick, Steven W. Blecker, Sky Bristol, Natasha B. Carr, Anna D. Chalfoun, Geneva W. Chong, Jay E. Diffendorfer, Bradley C. Fedy, Steven L. Garman, Stephen Germaine, Richard I. Grauch, JoAnn Holloway, Collin Homer, Matthew J. Kauffman, Douglas Keinath, Natalie Latysh, Daniel Manier, Robert R. McDougal, Cynthia P. Melcher, Kirk A. Miller, Jessica Montag, Constance J. Nutt, Christopher J. Potter, Hall Sawyer, Spencer Schell, Sarah L. Shafer, David B. Smith, Lisa L. Stillings, Michele Tuttle, and Anna B. Wilson
Open-File Report 2010-1231
U.S. Department of the Interior U.S. Geological Survey

U.S. Department of the Interior KEN SALAZAR, Secretary
U.S. Geological Survey Marcia K. McNutt, Director
U.S. Geological Survey, Reston, Virginia 2010
For product and ordering information:
World Wide Web: http://www.usgs.gov/pubprod
Telephone: 1-888-ASK-USGS
For more information on the USGS—the Federal source for science about the Earth,
its natural and living resources, natural hazards, and the environment:
World Wide Web: http://www.usgs.gov
Telephone: 1-888-ASK-USGS
Any use of trade, product, or firm names is for descriptive purposes only and does not imply endorsement
by the U.S. Government.
Although this report is in the public domain, permission must be secured from the individual copyright
owners to reproduce any copyrighted material contained within this report.
Suggested citation:
Bowen, Z.H., Aldridge, C.L., Anderson, P.J., Assal, T.J., Biewick, L.R.H., Blecker, S.W., Bristol, S., Carr,
N.B., Chalfoun, A.D., Chong, G.W., Diffendorfer, J.E., Fedy, B.C., Garman, S.L., Germaine, S., Grauch, R.I.,
Holloway, J., Homer, C., Kauffman, M.J., Keinath, D., Latysh, N., Manier, D., McDougal, R.R., Melcher,
C.P., Miller, K.A., Montag, J., Nutt, C.J., Potter, C.J., Sawyer, H., Schell, S., Shafer, S.L., Smith, D.B.,
Stillings, L.L., Tuttle, M., and Wilson, A.B., 2010, U.S. Geological Survey Science for the Wyoming
Landscape Conservation Initiative—2009 Annual Report: U.S. Geological Survey
Open-File Report 2010-1231, 106 p.

iii
Contents
Conversion Factors ................................................................................................................. vii Acronyms Used in this Report ................................................................................................... viii Acknowledgments .................................................................................................................... ix
Abstract ................................................................................................................................. 1
Introduction ............................................................................................................................. 3 USGS WLCI Science Strategy Continues to Guide Science and Technical Assistance Activities in FY2009: Towards an Integrated Assessment .............................................................................................. 4 USGS WLCI Annual Report for FY2009 ......................................................................................................... 4
Science and Technical Assistance Summaries ................................................................................. 6 Baseline Synthesis .......................................................................................................................................... 6
Summary ..................................................................................................................................................... 6 Application of Comprehensive Assessment Data to Support WLCI Decisionmaking and
Conservation Actions ...................................................................................................................... 9 Assessing Land Use/Cover Change ................................................................................................. 12 Assessing Energy Futures ................................................................................................................ 14 Assessing Mineral Resources .......................................................................................................... 20 Developing Methods for Assessing Soil Organic Matter and Mercury at Variable Spatial
Scales ........................................................................................................................................... 22 Developing Methods for Assessing Element Mobility and Availability in Soils of the Greater
Green River Basin ......................................................................................................................... 24 Developing Remote Sensing Applications for Geologic, Vegetation, and Soil Investigations ........... 26 Developing a Soil-Quality Index ....................................................................................................... 28 Assessing Socioeconomics: Oil and Gas Development Literature Review and Case Study ............ 29 Assessing Rancher Perceptions of Energy Development in Southwest Wyoming ........................... 31 Assessing Wildlife Vulnerability to Energy Development .................................................................. 33 Climate Change and Simulating Potential Future Vegetation ........................................................... 38 Development of Conceptual Models to Inform WLCI Long-term Monitoring and Selection of
Monitoring Indicators ..................................................................................................................... 40 Targeted Monitoring and Research ............................................................................................................... 42
Summary: Inventory and Long-Term Monitoring ....................................................................................... 42 Framework and Indicators for Long-Term Monitoring ....................................................................... 43 Remote Sensing for Vegetation Inventory and Monitoring ............................................................... 46 Long-Term Monitoring of Soil Geochemistry .................................................................................... 49 Long-Term Monitoring of Surface Water and Groundwater Hydrology ............................................. 53
Summary: Effectiveness Monitoring of Habitat Treatments ....................................................................... 58 Applying Greenness Indices to Evaluate Sagebrush Treatments in the WLCI Region ..................... 59 Greater Sage-Grouse Use of Vegetation Treatment Sites ............................................................... 64 Occurrence of Cheatgrass Associated with Habitat Projects in the Little Mountain Ecosystem
Area .............................................................................................................................................. 67 Application and Feasibility of Mapping Aspen Stands and Conifer Encroachment Using
Classification and Regression Tree (CART) Analysis for Effectiveness Monitoring ...................... 70 Aspen Regeneration Associated with Mechanical Removal of Subalpine Fir ................................... 73

iv
Herbivory, Stand Condition, and Regeneration Rates of Aspen on Burned and Unburned Plots for Effectiveness Monitoring .......................................................................................................... 75
Use of Aspen Stands by Migrant Birds for Effectiveness Monitoring ................................................ 77 Soil Chemistry: Relationships between Energy Exploration/Development and Salinity of Soils
and Waters .................................................................................................................................... 79 Summary: Mechanistic Research of Wildlife ............................................................................................. 81
Pygmy Rabbit ................................................................................................................................... 82 Sage-Grouse .................................................................................................................................... 85 Songbird Community ........................................................................................................................ 87 Mule Deer ......................................................................................................................................... 90
Data and Information Management ............................................................................................................... 93 Summary ................................................................................................................................................... 93
Data Management Framework and Clearinghouse .......................................................................... 93 Science and Conservation Projects Database ................................................................................. 96 Outreach and Graphic Products ....................................................................................................... 97
WLCI Interagency Coordination, Science Integration, Decisionmaking, and Evaluation ............................... 98 Summary ................................................................................................................................................... 98
WLCI Interagency Coordination, Science Integration, Decisionmaking, and Evaluation .................. 99
References Cited ................................................................................................................... 101

v
Figures
1. This diagram illustrates the U.S. Geological Survey’s approach to researching and monitoring ecosystem components ....................................................................................................................................................... 5 2. The Wyoming Landscape Conservation Initiative region, by county boundaries, with major drainages, roads, and cities/towns shown. ........................................................................................................................ 10 3. Example of a conceptual model showing states, pathways, and transition triggers. ................................... 13 4. Southwestern Wyoming Province and its relationship to the Wyoming Landscape Conservation Initiative region. .............................................................................................................................................................. 16 5. Extent of the Mowry Composite Total Petroleum System ........................................................................... 18 6. Approximate depth to the top of the Mesaverde Group, in the Mesaverde Total Petroleum System in the Southwestern Wyoming Province .................................................................................................................... 19 7. Map showing location of mineralized areas in, and immediately adjacent to, the Wyoming Landscape Conservation Initiative expanded study area. .................................................................................................. 21 8. Mercury concentrations in soils in southwestern Wyoming. ........................................................................ 23 9. Sample locations of soil profiles, associated plants, and rocks collected from the three members of the Green River Formation. ................................................................................................................................... 25 10. A mineral composite of Wyoming Landscape Conservation Initiative study area developed by mosaicking 10 scenes from Landsat 5 ............................................................................................................. 27 11. Species of Greatest Conservation Need plotted as a function of the proportion of their Wyoming range that is considered ―Known,‖ based on documented occurrences, versus ―Suspected,‖ based on historical occurrences and(or) presence of potentially suitable habitat. .......................................................................... 34 12. Species of Greatest Conservation Need plotted as a function of the current well density in their range and proportion of their range leased for development. .................................................................................... 36 13. Mean annual temperature for 1971–2000 and 2070–2099 ....................................................................... 39 14. Examples of predicted statistical power for trend based on population parameters derived from pilot data and a split-plot, rotating panel sample design for passerine birds ........................................................... 45 15. Landsat images from1988 and 2006. ....................................................................................................... 48 16. Soil geochemistry sampling locations for the Wyoming Landscape Conservation Initiative’s long-term monitoring program. ......................................................................................................................................... 51 17. Distribution of organic carbon (percent) in soils collected from a depth of 0–5 cm in the Wyoming Landscape Conservation Initiative study area. ................................................................................................ 53 18. Location and station identifiers of surface-water quality and groundwater-level monitoring sites within the Wyoming Landscape Conservation Initiative study area. ........................................................................... 56 19. National Water Information System data portal showing data for stream gage USGS 09217000 near Green River, Wyoming. ................................................................................................................................... 57 20. Locations of effectiveness monitoring for past and current habitat treatments and Muddy Creek soil sampling. ......................................................................................................................................................... 60 21. Sample plot locations for 2009 in the vicinity of Fall Creek Elk Feedground in relation to prescribed burns and herbicide treatments. ...................................................................................................................... 61 22. Effectiveness monitoring of vegetation treatments around the Fall Creek Elk Feedground ..................... 62 23. Area where Pinedale Anticline herbicide application took place and was sampled in 2008.. .................... 63 24. Little Mountain ecosystem study area, where more than 2 million dollars was spent on habitat estoration activities since 1990. ....................................................................................................................... 66 25. Layout of the belt transect divided into sub-samples used to assess occurrence of invasive species.. .... 68
vi
26. The general study area is focused on burn treatments within the Little Mountain ecosystem, near Rock Springs, Wyoming .................................................................................................................................. 69 27. Project study area located on the western slope of the Sierra Madre Range, Carbon County, Wyoming .......................................................................................................................................................... 72 28. Location of aspen treatment plots being monitored for treatment effectiveness within the Wyoming Landscape Conservation Initiative region. ....................................................................................................... 74 29. Location and distribution of the Muddy Creek subbasin. ........................................................................... 80 30. Pygmy rabbit occupancy among 187 sites surveyed in Southwest Wyoming, 2008–2009. ...................... 84 31. Predicted and observed site occupancy rates for pygmy rabbits in Southwest Wyoming, 2008–2009. .... 84 32. Three separate energy-development areas where songbird sampling occurred ...................................... 88 33. The probability of nesting success in relation to distance from energy development for the three main sagebrush-obligate songbird species found in the WLCI project area ............................................................. 89 34. Location of mule deer study in the WLCI region and estimated population-level migration route for mule deer in the Wild Horse Winter Range in Southwest Wyoming ......................................................................... 91 35. Mean NDVI values of stopovers from 15 mule deer, plotted as a function of mean elevation and distance from winter range in 2005 and 2006 .................................................................................................. 92 36. A screen capture of the enhanced Project Database Map accessible through the Wyoming Landscape Conservation Initiative Web site. ...................................................................................................................... 97
Tables
1. List of Wyoming’s top 20 Species of Greatest Conservation Need ............................................................. 37 2. Statistical summary for the geochemistry of soils collected from a depth of 0–5 cm in the Wyoming Landscape Conservation Initiative study area ................................................................................................. 52 3. Targeted distribution of treatment size classes within the Little Mountain area .......................................... 68
vii
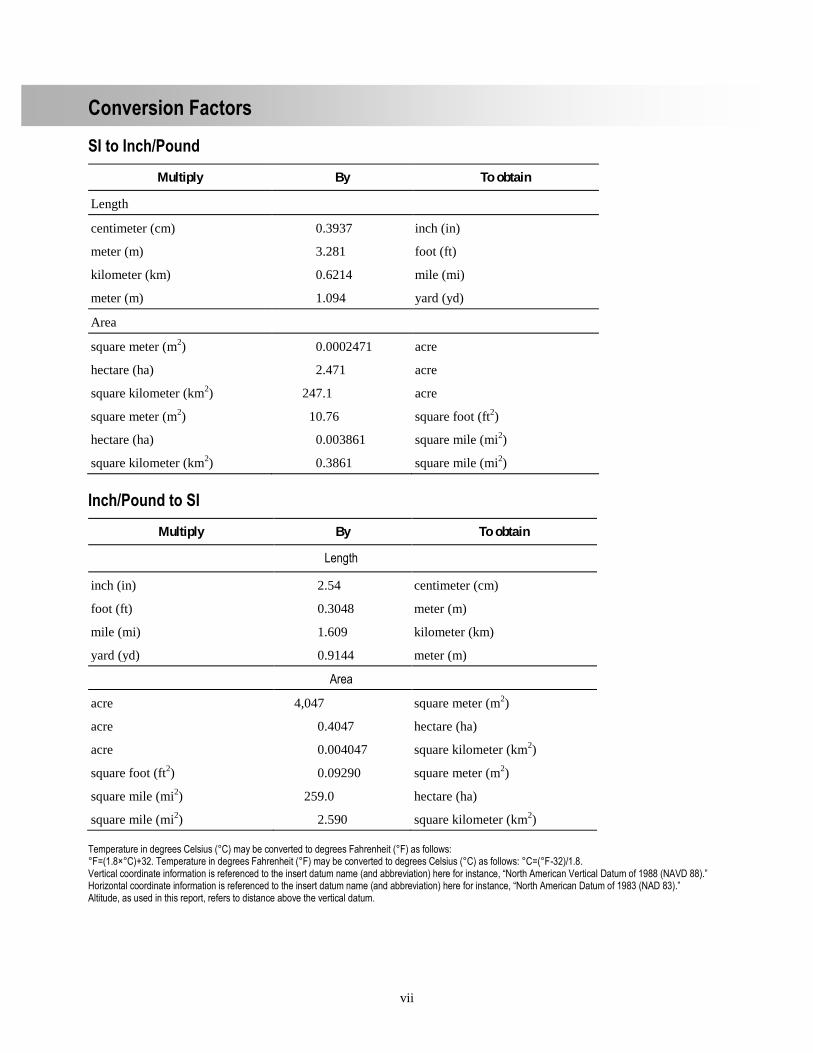
Conversion Factors
SI to Inch/Pound
Multiply By To obtain
Length
centimeter (cm) 0.3937 inch (in)
meter (m) 3.281 foot (ft)
kilometer (km) 0.6214 mile (mi)
meter (m) 1.094 yard (yd)
Area
square meter (m2) 0.0002471 acre
hectare (ha) 2.471 acre
square kilometer (km2) 247.1 acre
square meter (m2) 10.76 square foot (ft
2)
hectare (ha) 0.003861 square mile (mi2)
square kilometer (km2) 0.3861 square mile (mi
2)
Inch/Pound to SI
Multiply By To obtain
Length
inch (in) 2.54 centimeter (cm)
foot (ft) 0.3048 meter (m)
mile (mi) 1.609 kilometer (km)
yard (yd) 0.9144 meter (m)
Area
acre 4,047 square meter (m2)
acre 0.4047 hectare (ha)
acre 0.004047 square kilometer (km2)
square foot (ft2) 0.09290 square meter (m
2)
square mile (mi2) 259.0 hectare (ha)
square mile (mi2) 2.590 square kilometer (km
2)
Temperature in degrees Celsius (°C) may be converted to degrees Fahrenheit (°F) as follows: °F=(1.8×°C)+32. Temperature in degrees Fahrenheit (°F) may be converted to degrees Celsius (°C) as follows: °C=(°F-32)/1.8. Vertical coordinate information is referenced to the insert datum name (and abbreviation) here for instance, ―North American Vertical Datum of 1988 (NAVD 88).‖ Horizontal coordinate information is referenced to the insert datum name (and abbreviation) here for instance, ―North American Datum of 1983 (NAD 83).‖ Altitude, as used in this report, refers to distance above the vertical datum.
viii
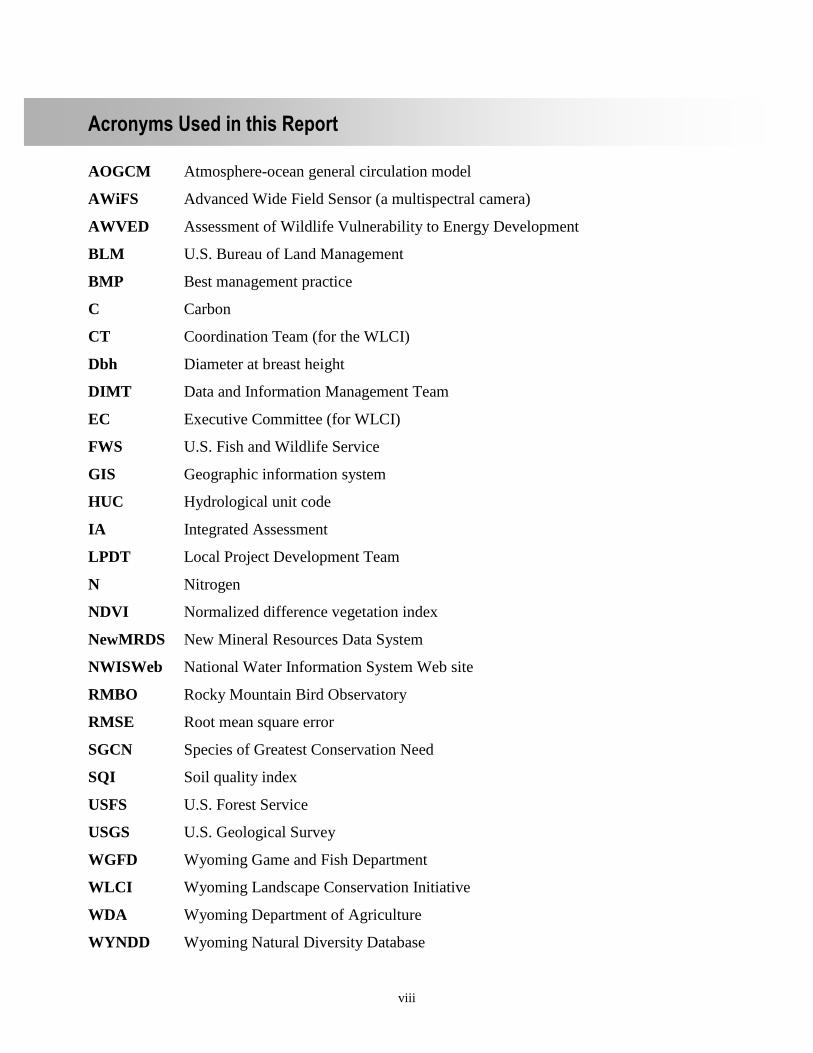
Acronyms Used in this Report
AOGCM Atmosphere-ocean general circulation model
AWiFS Advanced Wide Field Sensor (a multispectral camera)
AWVED Assessment of Wildlife Vulnerability to Energy Development
BLM U.S. Bureau of Land Management
BMP Best management practice
C Carbon
CT Coordination Team (for the WLCI)
Dbh Diameter at breast height
DIMT Data and Information Management Team
EC Executive Committee (for WLCI)
FWS U.S. Fish and Wildlife Service
GIS Geographic information system
HUC Hydrological unit code
IA Integrated Assessment
LPDT Local Project Development Team
N Nitrogen
NDVI Normalized difference vegetation index
NewMRDS New Mineral Resources Data System
NWISWeb National Water Information System Web site
RMBO Rocky Mountain Bird Observatory
RMSE Root mean square error
SGCN Species of Greatest Conservation Need
SQI Soil quality index
USFS U.S. Forest Service
USGS U.S. Geological Survey
WGFD Wyoming Game and Fish Department
WLCI Wyoming Landscape Conservation Initiative
WDA Wyoming Department of Agriculture
WYNDD Wyoming Natural Diversity Database

ix
Acknowledgments
We thank the Wyoming Landscape Conservation Initiative‘s Science and Technical
Advisory Committee and the Coordination Team for their ideas and advice regarding this report,
and we acknowledge the Wyoming Game and Fish Department and the U.S. Bureau of Land
Management for supporting USGS WLCI efforts by providing data and other information. We also
thank the WLCI Science and Technical Advisory Committee, Renee Dana, Tom Owens, and Steve
Hostetler for their careful reviews. We acknowledge the modeling groups, the Program for Climate
Model Diagnosis and Intercomparison (PCMDI) and the World Climate Research Programme‘s
(WCRP) Working Group on Coupled Modeling (WGCM) for their roles in making available the
WCRP Coupled Model Intercomparison Project phase 3 multi-model dataset; support of this
dataset is provided by the U.S. Department of Energy‘s Office of Science.


1
U.S. Geological Survey Science for the Wyoming Landscape Conservation Initiative: 2009 Annual Report
By Zachary H. Bowen,1 Cameron L. Aldridge,1,2 Patrick J. Anderson,1 Timothy J. Assal,3 Steven W. Blecker,4 Sky Bristol,5 Natasha B. Carr,1 Anna D. Chalfoun,6 Geneva W. Chong,2,7 Jay E. Diffendorfer,8 Bradley C. Fedy,3 Steven L. Garman,8 Stephen Germaine,1 Richard I. Grauch,9 JoAnn Holloway,10 Collin Homer,11 Matthew J. Kauffman,12 Douglas Keinath,13 Natalie Latysh,5 Daniel Manier,3 Robert R. McDougal,10 Cynthia P. Melcher,1 Kirk A. Miller,14 Jessica Montag,1 Constance J. Nutt,10 Christopher J. Potter,15 Hall Sawyer, 6,16 Spencer Schell,1 Sarah L. Shafer,17 David B. Smith,9 Lisa L. Stillings,17 Michele Tuttle,10 Anna B. Wilson9
Abstract
This is the second report produced by the U.S. Geological Survey (USGS) for the Wyoming
Landscape Conservation Initiative (WLCI) to detail annual work activities. The first report
described work activities for 2007 and 2008; this report covers work activities conducted in 2009.
Important differences between the two reports are that (1) this report does not lump all the
Effectiveness Monitoring activities together as last year‘s report did, which will allow WLCI
partners and other readers to fully appreciate the scope and accomplishments of those activities,
and (2) this report does not include a comprehensive appendix of the background details for each
work activity (the 2008 report and appendix may be accessed at
http://pubs.usgs.gov/of/2009/1201/pdf/OF09-1201.pdf ).
1 U.S. Geological Survey, Fort Collins Science Center, Fort Collins, Colo.
2 Colorado State University, Natural Resource Ecology Laboratory, Fort Collins, Colo.
3 Arctic Slope Regional Corporation management services, contracted to U.S. Geological Survey, Fort Collins Science
Center, Fort Collins, Colo. 4 U.S. Geological Survey, Western Mineral and Environmental Resources Science Center, Reno, Nev.
5 U.S. Geological Survey, Central Region Geospatial Information Office, Denver, Colo.
6 Wyoming Cooperative Fish and Wildlife Research Unit, Dept. of Zoology and Physiology, Univ. of Wyoming,
Laramie, Wyo. 7 U.S. Geological Survey, Northern Rocky Mountain Science Center, Jackson, Wyo.
8 U.S. Geological Survey, Rocky Mountain Geographic Science Center, Denver, Colo.
9 U.S. Geological Survey, Central Region Mineral and Environmental Resources Science Center, Denver, Colo.
10 U.S. Geological Survey, Crustal Geophysics and Geochemistry Science Center, Denver, Colo.
11 U.S. Geological Survey, EROS Data Center, Sioux Falls, S.D.
12 U.S. Geological Survey, Wyoming Cooperative Fish and Wildlife Research Unit, Dept. of Zoology and Physiology,
Univ. of Wyoming, Laramie, Wyo. 13
Wyoming Natural Diversity Database, Univ. of Wyoming, Laramie, Wyo. 14
U.S. Geological Survey, Wyoming Water Science Center, Cheyenne, Wyo. 15
U.S. Geological Survey, Central Region Energy Resources Science Center, Denver, Colo. 16
Western EcoSystems Technology, Inc., Cheyenne, Wyo. 17
U.S. Geological Survey, Geology and Environmental Change Science Center, Corvallis, Ore.

2
In 2009, there were 29 ongoing or completed activities and 5 new work activities conducted
under the five original major multi-disciplinary science and technical assistance activities: (1)
Baseline Synthesis; (2) Targeted Monitoring and Research; (3) Data and Information Management;
(4) Integration and Coordination; and (5) Decisionmaking and Evaluation. New Baseline Synthesis
work included developing a soil-quality index, developing methods for assessing levels of and
relationships between mercury and soil organic matter, and ascertaining element source, mobility,
and fate. Additionally, remotely sensed imagery was used to assess vegetation as an indicator of
soil condition and geology, and an Integrated Assessment (IA) was initiated to synthesize what has
been learned about WLCI systems to date. Associated decision tools, maps, and a comprehensive
report are being developed for the IA as well.
Ongoing and completed Baseline Synthesis work included drafting a report on the final
conceptual models and the indicators selected to provide early warning of changes due to land-use;
completing range maps for all terrestrial vertebrate Species of Greatest Conservation Need;
publishing a geographic information system (GIS) product illustrating the progression of oil and
gas exploration and production in the Green River Basin; mapping coal, oil shale, uranium, and oil
and gas production; refining the NewMRDS (Mineral Resources Data System) minerals database;
and conducting field visits to metallic mineralized areas. Future (2001–2100) monthly temperature
and precipitation changes that were simulated by atmospheric-ocean general circulation models
(AOGCMs) to produce data of future temperature and precipitation were downscaled for modeling
WLCI scenarios, and development of a simulation model is underway to explore effects of energy
development, land disturbances, and future climate patterns on vegetation across the WLCI
landscape. In the realm of socioeconomic research, results of a literature review on socioeconomic
effects of oil and gas development in the WLCI region were summarized, and a rancher survey was
conducted and summarized to assess WLCI- and energy-related issues.
Ongoing work for Long-term Monitoring efforts in 2009 included completing the
monitoring framework and conducting power analyses of two potential indicators for monitoring
changes in resource conditions; analyzing and comparing different remotely sensed imagery
products to improve characterization land cover classes in Wyoming; and tabulating and mapping
results of soil analyses to determine the presence and concentration of 47 parameters that can
indicate changes in land-use or other factors. In addition surface-water and groundwater quality
monitoring data, as well as water-quality characteristics and statistical relations, were published.
Effectiveness Monitoring comprised eight work activities, including applying greenness indices to
evaluate sagebrush treatments; assessing greater sage-grouse use of vegetation treatment areas;
measuring cheatgrass (Bromus tectorum) occurrence in habitat-project areas of the Little Mountain
ecosystem; using classification and regression tree analysis for evaluating conifer encroachment
treatment in aspen (Populus tremuloides) stands; assessing aspen regeneration after mechanical
removal of subalpine fir (Abies lasiocarpa); assessing herbivory, stand condition, and regeneration
rates of aspen on burned and unburned plots; assessing migratory bird use of aspen stands; and
ascertaining relationships between energy exploration/development and the salinity of soils and
waters.
Mechanistic wildlife research continued on the four focal species (or groups): pygmy rabbit
(Brachylagus idahoensis), greater sage-grouse (Centrocercus urophasianus), sagebrush- (Artemisia
spp.) obligate songbird community, and mule deer (Odocoileus hemionus). The pygmy rabbit work
entailed ground-truthing four occupancy classes developed in 2008 and assessing how well the
occupancy model fit the survey data for each class. The sage-grouse work entailed continued
evaluations of monitoring design and investigation of the apparent correlation between population

3
cycles of sage-grouse and cottontail (Sylvilagus spp.) rabbits. Songbird work culminated in
preparing manuscripts detailing results of work conducted in 2008 that showed relationships
between songbird densities and nesting success in relation to energy development. For the mule
deer study, maps of migration routes and route segments used for foraging, resting, and movement
were developed and movement data were summarized.
The ongoing work of Data and Information Management focused on developing procedures
for assembling, cataloging, and serving datasets and providing access to and use of WLCI data and
products, enhancing the system on the WLCI Web site that displays habitat and science project
locations, and improving and updating the WLCI Web site. Finally, the USGS scientist liaison to
the WLCI Coordination Team (CT) continued Integration/Coordination and Decisionmaking/
Evaluation activities by collaborating with the CT to manage WLCI operations, coordinate WLCI
teams and committees, and integrate science principles and concepts to support conservation
planning and ensure that USGS science helps inform on-the-ground management actions and
decisions. These efforts continue to focus on iteratively improving science relevance by evaluating
what and how information is being used.
Introduction
Southwest Wyoming contains abundant wildlife, habitat, and energy resources. To date,
settlement in the region has been limited and the area is characterized by open spaces, sparse
human population, and local economies tied to agriculture, resource extraction, and recreation.
Since the late 19th century, Southwest Wyoming, which encompasses part of the fossil-fuel-rich
Green River Basin, has been explored and developed for coal, oil, natural gas, and uranium fuels.
Since 2000, however, the pace of energy development has increased significantly, especially
development associated with natural gas and wind energy. Combined with increased residential and
industrial development, energy development has resulted in land use and socioeconomic changes
throughout much of the WLCI region. The potential effects of these changes on wildlife and
wildlife habitat led the U.S. Bureau of Land Management (BLM) and the Wyoming Game and Fish
Department (WGFD) to develop an initiative that encompasses the Southwest Wyoming landscape
to address their concerns.
Driven by local and regional leaders, the Wyoming Landscape Conservation Initiative
(WLCI) was officially launched in 2007 with support from the U.S. Department of the Interior. The
WLCI mission is to implement a long-term, science-based program of assessing, conserving, and
enhancing fish and wildlife habitats while facilitating responsible energy and other development
through local collaboration and partnerships. Partners in the WLCI include the BLM, the U.S.
Geological Survey (USGS), the U.S. Fish and Wildlife Service (FWS), the Wyoming Game and
Fish Commission (the policy-making board for the WGFD), the Wyoming Department of
Agriculture (WDA), the U.S. Forest Service (USFS), six Wyoming County Commissions, nine of
Wyoming‘s Conservation Districts, and the Pinedale Anticline Project Office. Additional
collaborators providing support to the WLCI effort include many public agencies, including the
National Park Service, the U.S. Natural Resources Conservation Service, the U.S. Bureau of
Reclamation, the Wyoming Department of Environmental Quality, the Wyoming State Land Board,
the Jonah Interagency Mitigation and Reclamation Office, as well as non-profit entities, industry,
and landowners.
The role of the USGS as a partner in the WLCI is to provide multidisciplinary scientific-
and technical-assistance support to WLCI partners and to advance the overall scientific
understanding of ecosystems in the Southwest Wyoming landscape. Fulfilling these roles entails

4
evaluating the effectiveness of habitat treatments implemented by WLCI partners and
collaborators,
assessing the cumulative effects of energy development and other land-use changes on
wildlife and habitat in the WLCI area, and
coordinating work activities with the WLCI community and demonstrating how to integrate
research findings into on-the-ground management actions.
USGS WLCI Science Strategy Continues to Guide Science and Technical Assistance Activities in FY2009: Towards an Integrated Assessment
The USGS WLCI Science Strategy (Bowen, Aldridge, Anderson, Assal, and others, 2009)
continues to serve as a robust framework for conducting science and technical assistance on behalf
of the WLCI effort. As implied by the strategy‘s framework (fig. 1), information gained through
USGS activities is iteratively integrated into our overall knowledge base and made available to
WLCI partners for guiding and improving future habitat treatments, best management practices
(BMPs), and other conservation activities. Work continues to focus on addressing immediate
management needs identified by WLCI members, including supporting the identification,
implementation, and tracking of habitat projects in priority areas while simultaneously launching
longer-term, priority technical assistance, research, and monitoring activities as part of the overall
research approach for the WLCI. Work activities also continue to address questions and issues from
the spatial scale of individual habitat treatment sites to the entire WLCI landscape. This approach is
providing information to support policy and planning decisions while meeting specific technical-
assistance needs.
In FY2009, a new task was launched by the USGS to develop an Integrated Assessment
(IA) of natural resources in the WLCI region, which helps meet one of the important goals laid out
in the USGS Strategic Plan (U.S. Geological Survey, 2007) and culminates the work completed to
date by the USGS on behalf of the WLCI effort (see Comprehensive Assessment section below).
The integrated assessment will take the form of a document and a decision-support tool for
evaluating cumulative effects of energy development and other land-use changes, climate change,
and other key drivers of change on wildlife and their habitats. As WLCI efforts continue, USGS
will continue providing technical assistance and research, including updates of the Integrated
Assessment, for meeting partner needs while also improving the overall understanding of the WLCI
region ecosystems and how they are driven by and respond to change. This understanding will
strengthen the basis for management decisions and advance the WLCI mission.
USGS WLCI Annual Report for FY2009
The first annual USGS WLCI report (Bowen, Aldridge, Anderson, Chong, and others,
2009) summarized not only the work accomplished from FY2007 through FY2008. It provided the
necessary foundational and background information on research approaches the USGS would
employ for meeting WLCI partner needs. This report, the second annual summary of work and
results, builds on the first annual report and is organized similarly, although some individual tasks
that were lumped in last year‘s report are addressed separately this year to make it easier for readers
to discern progress among individual tasks. The main body of this report, Science and Technical
Assistance Activities, provides a summary for each individual science and technical assistance task
conducted in FY2009. The summaries include a given task‘s scope, methods, objectives, and a
description of the study area with a map (maps for studies initiated in 2008 did not include the 2009

5
WLCI expansion area unless the expansion area was subsequently sampled in 2009); these sections
are written in proposal-like language, often including the scope of work planned for the entire study
(not just work planned for FY2009), which provides a broader understanding of the overall task.
The subsequent sections for each task entail brief accounts of the work accomplished and products
completed in FY2009. In addition, there is an overall FY2009 summary for each major realm of
work: Baseline Synthesis; Targeted Monitoring and Research (including summaries for the three
subdivisions of Targeted Monitoring and Research: Inventory and Long-term Monitoring,
Effectiveness Monitoring, and Mechanistic Research of Wildlife); Data and Information
Management; and Integration/Coordination and Decisionmaking/Evaluation. Literature and other
works cited in the document are listed at the end in the References Cited section. This year‘s report
does not contain the appendix of highly detailed background, methods, and(or) results that was
provided in the FY2008 report; readers seeking that level of detail may wish to refer to last year‘s
report online at http://www.fort.usgs.gov/Products/Publications/pub_abstract.asp?PubID=22683.
Figure 1. This diagram illustrates the U.S. Geological Survey’s approach to researching and monitoring ecosystem components. The Management Needs identified by the WLCI partners form the foundation of the five major WLCI work activities: (1) Baseline Synthesis, (2) Targeted Monitoring and Research, (3) Data and Information Management, (4) Integration and Coordination, and (5) Decisionmaking and Evaluation. They represent successive stages that build on information gained from earlier stages, and at any stage Data and Information Management ensures access for use in Decisionmaking and Evaluation. The approach may be used iteratively and allows for stages to overlap.

6
Science and Technical Assistance Summaries
Baseline Synthesis
Summary
There were 13 Baseline Synthesis tasks conducted in FY2009, including four new tasks: (1)
Application of Comprehensive Assessment Data to Support WLCI Decisionmaking and
Conservation Actions; (2) Assessing Land Use/Cover Change; (3) Assessing Energy Futures; (4)
Assessing Mineral Resources; (5) Developing Methods for Assessing Soil Organic Matter and
Mercury at Variable Spatial Scales (new); (6) Developing Methods for Assessing Element Mobility
and Availability in Soils of the Greater Green River Basin (new); (7) Developing Remote Sensing
Applications for Geologic, Vegetation, and Soil Investigations (new); (8) Developing a Soil-Quality
Index (new); (9) Oil and Gas Development Literature Review and Case Study; (10) Rancher
Perceptions of Energy Development in Southwest Wyoming; (11) Assessing Wildlife Vulnerability
to Energy Development; (12) Climate Change and Potential Future Vegetation Simulations; and
(13) Development of Conceptual Models to Inform WLCI Long-term Monitoring and Selection of
Monitoring Indicators.
The comprehensive assessment work entailed using existing baseline data and data
collected in FY2008 to support the evaluation and ranking process for proposed WLCI habitat
treatments, aligning habitat projects with WLCI priorities, evaluating projects proposed for 2010,
and supporting planning by Local Project Development Teams (LPDTs). To culminate the
comprehensive assessment work and other USGS science completed through FY2009, an
Integrated Assessment (IA) is being developed to inform and support land-use planning and
decisionmaking by land management agencies. In fall 2009, the USGS held an IA workshop to
ensure that the IA will be useful to land managers and environmental planners, and to draft a
framework for the IA. Products of the IA will include spatial data, decision tools, maps, and a
comprehensive report for supporting development and conservation planning.
The FY2009 land-use/land-cover work focused on developing a spatially explicit, frame-
based prototype simulation model. Maps of predicted vegetation potential were acquired to begin
simulation experiments in 2010 for exploring potential effects of energy development on
vegetation, as well as potential interactive effects of land disturbances and future climate patterns
on plant dispersal across the WLCI landscape.
The energy futures work included final publication of a GIS-based product illustrating the
progression of oil and gas exploration and production in the Green River Basin since the early
1900s. Subsequent to that publication, data were collected and processed for developing an energy
map that portrays the locations and temporal evolution of coal, oil shale, uranium, and oil and gas
production. Also, a multi-disciplinary team of USGS scientists collaborated to identify and test a
new method for predicting the likelihood of future development of natural gas resources in the
WLCI area. Energy geologists from the USGS also began compiling a new, detailed, subsurface
database for the Southwest Wyoming region that incorporates all available oil and gas well data to
enhance interpretations of subsurface geology and emerging petroleum-exploration concepts.
Mineral resources assessment work in FY2009 entailed refining the NewMRDS (Mineral
Resources Data System) mineral resources database by using data collected at mines and prospects
in FY2008 to eliminate duplicate records and to aggregate records of multiple mine workings
associated with a single deposit. Additionally, metallic mineralized areas were visited in (1) the

7
Sara Meloy collecting small mammal data in the WLCI region. U.S. Geological Survey photo.
expanded WLCI study area (expanded to include areas of interest for renewable energy
development, especially wind power) of Carbon County, (2) the trona- (soda-ash-) producing area
west of Green River, and (3) uranium districts not visited in FY2008. Latitude and longitude
coordinates for all sites visited were collected by global positioning system (GPS) receivers and
corrected in the minerals NewMRDS database (U.S Geological Survey, 2010a, b; available online
to USGS internal users who request password-protected access at
http://mrds.cr.usgs.gov:7777/mrds/f?p=130:1, and in less detail to all other users at
http://tin.er.usgs.gov/mrds), which now contains 1,044 records for the WLCI study area.
The four new Baseline Synthesis tasks added in FY2009 all entail developing methods for
assessing soils and geology (including assessing vegetation as an indicator of soil condition and
geology). Soil sampling took place in southwestern Wyoming to assess soil organic matter and
mercury. Analyses indicate that organic carbon is greater in montane forests of the Uinta and
Rocky Mountains than in other areas, and mercury concentrations correlate with soil organic
carbon; thus, there are greater mercury concentrations in montane forests than elsewhere. Analyses
also indicate that mercury in the WLCI region originates largely from atmospheric deposition, and
elevated mercury concentrations northeast of the city of Green River may reflect a point source of
mercury. Soil profiles, associated plants, and rock samples collected as part of the effort to develop
methods for assessing element mobility will be analyzed in FY2010. Once completed, the resulting
geochemical data will allow evaluation of element source, mobility, and fate during weathering
processes and will provide a datum for assessing the uniqueness of the Green River Basin. The
methods for using remote sensing to enhance studies on geology, soils, and associated vegetation
entailed mosaicking 10 scenes from Landsat 5 to produce a seamless mineral-composite map that
distinguishes different soil types by color and will be useful for monitoring changes across the
landscape surface.

8
The literature review on socioeconomic effects of oil and gas development revealed that the
negative and positive effects varied across communities. Potentially positive effects included
increased revenue for local governments and schools, more employment opportunities, and
increased income. Potentially negative effects included rapid population growth, increases in crime,
overcrowding in schools, stressed infrastructure, and lack of affordable housing. The rancher
survey completed in FY2009 revealed that 55 percent of respondents had never heard of the WLCI,
and 42 percent have had some form of energy development on their land (mostly oil and gas).
Perceived negative effects of energy development included degraded scenery/views, and
diminished open space, housing affordability, and availability of ranching supplies. Perceived
positive effects included increased community economic development, small business
development, employment opportunities, and salary levels. The survey also indicated that, overall,
Wyoming agencies and districts were rated as being more credible sources of information on
energy development and its potential impacts than federal agencies, public interest groups, private
industry, and non-governmental organizations.
The FY2009 work on assessing wildlife vulnerability to energy development included
completing range maps for all terrestrial vertebrate Species of Greatest Conservation Need
(SGCN), which were compiled by hydrologic units on the basis of reported observations and
knowledge of local habitat. This work revealed that, for 80 percent of Wyoming‘s SGCN, more
than half the species‘ ranges are assumed in the absence of actual survey evidence. The best
documented species are colonially nesting water birds, sage-grouse (Centrocercus urophasianus),
moose (Alces alces), pika (Ochotona princeps), and sandhill crane (Grus canadensis); the least
documented include small mammals and reptiles, particularly lizards. To derive a coarse
assessment of risk to SGCN from current development, existing well densities in hydrologic units
(hydrologic unit code = HUC) where species are known or suspected to occur were determined, and
risk from future activities was assessed by calculating the area of those units that has been leased
for energy development. Based on this exposure analysis, the Wyoming pocket gopher (Thomomys
clusius) appears most at risk from development, although actual response of the species to
development is not fully understood.
In FY2009, the climate change and vegetation simulation work entailed downscaling future
(2001–2100) monthly temperature and precipitation changes that were simulated by coupled
atmospheric-ocean general circulation models (AOGCMs) to a 30-arc-second (approximately 1-
km) grid of the WLCI study area. These data will be used to produce data of future temperature and
precipitation for the WLCI region. These future climate datasets will be completed in FY2010.
The conceptual models for the WLCI were completed in 2009, including assembly of the
model hierarchy (that is, from general to specific degradation pathways) and development of the
supporting narratives. The models span the WLCI focal ecosystems (aspen [Populus tremuloides]
foothills, mixed mountain shrubs, shrub-steppe, riparian, and aquatic), as well as atmospheric and
human systems, and they incorporate 33 drivers and stressors to assess their effects on wildlife
populations (explicitly delineating potential impacts through more than 60 ‗causal‘ or degradation
pathways). An Indicator Selection workshop was held to use the WLCI conceptual models for
identifying key indicators (61 were selected) that could provide early warning of system change in
response to land-uses, including indicators specific to terrestrial and to aquatic wildlife. The results
of the Indicator Selection workshop are being combined with the Conceptual Model report to
provide a more cohesive and comprehensive document, which will be published in late FY2010 as
a USGS Open-File Report.
These 13 Baseline Synthesis tasks are detailed in the sections that follow.

9
Application of Comprehensive Assessment Data to Support WLCI Decisionmaking and Conservation Actions
St atus
Ongoing
Contac t s
Patrick J. Anderson; 970-226-9488; [email protected]
Zack Bowen; 970-226-9218; [email protected]
Scope and Methods
The comprehensive assessment is a collaborative effort to compile and analyze resource
data from many sources to support diverse needs and efforts within the WLCI. It is being
conducted to identify common areas of interest for all WLCI partners, to improve the quantification
of habitat and human disturbance, and to provide the best available information for management
decisions by the WLCI Coordination Team (CT) and other teams and committees of the WLCI.
This information will help the WLCI and LPDTs support conservation planning and the
development of conservation strategies, identify priority areas for future conservation projects, and
support the evaluation and ranking of conservation projects. In general, the assessment includes
data and information that will help characterize important ecological systems (for example,
important species, priority habitats, and migration routes), known infrastructure and developed
areas, and locations of past and current conservation projects. Data and information sources include
low- and high-resolution imagery, regional-level resources (for example, maps of soils, land cover,
and roads), local resources and managers associated with WLCI partners (BLM, USFS, FWS,
WGFD, WDA) and industry, and results from modeling efforts for sage-grouse and other species.
During 2010, acquisition of information about habitat treatments will continue, as will definition
and characterization of priority areas identified by LPDTs. These priority areas reflect where
LPDTs will concentrate conservation actions during the next five years. This information will be
used to support the development of the WLCI conservation plan.
Objec t i ves
Inventory and acquire important ecosystem, conservation, land management, and energy-
related information and data across the WLCI area.
Develop strategies and approaches to evaluate relationships between data derived from
modeling and data acquired from WLCI partners, which will inform decisionmakers such as
the WLCI Coordination Team (CT) and other WLCI committees about risks, threats, and
priorities for future conservation actions.
Using the comprehensive assessments, provide an understanding of the relationships
between ecosystem stressors and drivers of change, and their influence on important species
and habitats.
Develop a coarse screen to identify potential threats and support retrospective analyses for
identifying important areas for future conservation projects.

10
Assist the livestock industry with spatial representations of priority areas, such as calving or
lambing areas, and areas for potential forage reserves and grass banks.
Compile, rectify, manage, and provide data to the USGS Geographic Information Office in
support of the USGS/WLCI Comprehensive Science Catalog and Data Clearinghouse.
Provide a data and analytical foundation for all WLCI science and technical assistance
tasks.
St udy Area
Activities associated with this work are not specific to any one location, site, or habitat.
They apply to the entire WLCI region (fig. 2).
Figure 2. The Wyoming Landscape Conservation Initiative (WLCI) region, by county boundaries, with major drainages, roads, and cities/towns shown. [Note: The WLCI boundary changed after 2008 work was initiated. This map shows both the original area (black outline) and the extended area (orange outline). For any tasks initiated in 2008 and for which work was not expanded into the new WLCI area during 2009, the respective study areas retain the old boundary.]

11
Wor k Ac compl i shed in FY2009 and Findings
Assessment for Local Project Development Teams—Data associated with the
Comprehensive Assessment was used to support the evaluation and ranking process for proposed
WLCI habitat treatments. This information was used by the WLCI CT and the WLCI Executive
Committee (EC) to evaluate the relationship between the proposed habitat projects and the WLCI
priorities, which are listed below:
conservation focus areas (WLCI partner focus areas and areas defined by LPDTs);
WLCI priority habitats;
sites essential to certain life stages (for example, migration corridors, crucial
seasonal habitats, parturition areas);
ecosystem function attributes (integrity, fragmentation);
project benefits of long-term ecosystem function (species assemblages and multiple
habitats);
locations of population strongholds for greater sage-grouse and other species of
concern;
locations where abiotic and biotic conditions are favorable for treatments and have
potential to increase connectivity; and
proximity to protected areas and/or areas of development, or other past or current
projects.
Approximately 85 map overlays of proposed projects related to evaluation criteria were
generated. The results of these activities were presented to the WLCI CT and the EC and used
during the evaluation of 2010 projects during June 2009. Similar maps and posters were prepared
for each LPDT meeting to support discussions and planning that incorporated past and proposed
conservation actions and habitat projects. Geospatial information was provided on a portable hard
drive and presented during LPDT meetings.
Integrated Assessment (IA)—The IA is a component of, and builds on, the baseline
synthesis and comprehensive assessment that is being directed to inform and support land-use
planning and decisionmaking by land-management agencies. The USGS conducted a workshop on
17–20 November 2009, the goal of which was to ensure that the IA is as useful as possible to land
managers and environmental planners tasked with making planning-level recommendations and
decisions. The workshop was designed to meet this goal by developing a framework that ties the IA
to the goals, needs, and parameters of decisionmakers and stakeholders. Representative
stakeholders and decisionmakers participated during the first day of the workshop to identify issues
and frame the questions that the IA will address. Members of the USGS Science Team met for the
remainder of the workshop to develop an overall structure for the IA, including examples of the
types of information and analyses that will be produced. The workshop concluded with developing
a draft framework and example results that will be reviewed by the decisionmakers and
stakeholders who participated in the framing. It is anticipated that products of the IA will include
GIS data, decision tools, maps, and reports that will support development and conservation
planning.

12
Pr oduc ts Completed i n FY2009
GIS data and geospatial maps and posters associated with proposed and completed
habitat projects.
Continued to obtain datasets relevant to WLCI, which may be viewed by authorized
users at https://my.usgs.gov/csc/wlci.
Prepared a data directory and descriptions of compiled and derived data associated
with the comprehensive assessment and IA.
Developed limited metadata standards (origin, entity from which the data came, and
date received) for data obtained from WLCI partners. This information is provided
in the data directory.
Assessing Land Use/Cover Change
St atus
Ongoing; projected completion for prototype model is late FY2010
Contac t
Steven L. Garman; 303-202-4118; [email protected]
Scope and Methods
This effort entails evaluating the effects of future land uses on vegetation and wildlife
habitat and is designed to illustrate potential management actions that may minimize land-use
impacts. The entire WLCI landscape will be included in a spatially-explicit simulation framework
to explore future potential land-use effects and the potential influence of future climatic conditions.
Land-use effects illustrated in the WLCI conceptual models (see below) serve as the basis for the
design of a frame-based simulation model. A frame-based model is a type of knowledge-based
model used to illustrate system states and state changes, whereby the generalized alternative states
of a system are represented as ―frames‖ and knowledge about factors influencing a frame is used to
model the temporal transition among frames. Frames consist of one or more key plant species or
species groups. The simulated landscape in the modeling system is represented as a lattice of equal-
sized cells called landscape elements, which are initialized with frames that represent current
vegetation. Other biophysical properties are stored for each landscape element.
The WLCI conceptual models for contemporary ecosystems define all possible ecosystem
states and the pathways and triggers of transition among states in response to natural disturbances
and human-mediated stressors (for example, fig.3). Disturbances within the natural range of
variability are modeled to mediate changes in variants of the native state (fig. 3A–3C). Degraded
states (outside the range of native conditions) induced by stressors are explicit, and assumptions
about the intensity or severity of a stressor determine the probability of transition to a degraded
state (fig. 3D: response to climate change; 3F: response to soil compaction). Degraded states are
described by changes in species composition, and by impacted soil properties (soil erosion, reduced
soil stability). These states become susceptible to conversion (subdominant replacing dominant
species) or invasion (new species assemblage). Dynamic features related to soil conditions of a
degraded state, climatic conditions, and propagule abundance (which considers ‗migration‘
barriers) determine the species that invade the landscape element containing the degraded state (for

13
example, fig. 3D–3E; 3F–3G). In this regard, novel states replacing degraded states are not pre-
scripted, but evolve in response to landscape and climatic conditions. However, conceptual models
of all logical combinations of species (that is, all logical states) are required to guide the dynamics
of novel states when or if they occur on the landscape. Developing these models will use species‘
traits to define the dynamics of the novel state (dominance, co-dominance combinations), and the
states resulting from stressors. Novel states are not static. They are subject to conversion or
invasion in response to land uses given current climatic conditions. Thus, the development of novel
plant assemblages is continuous.
Figure 3. Example of a conceptual model showing states, pathways, and transition triggers. (Not all of the possible pathways are illustrated.)
Simulated future land uses will be driven largely by BLM livestock grazing and energy-
development policies. Future climatic conditions will be derived from geospatial layers of potential
vegetation generated from a physiological-based model of future climate effects by Ron Neilson
(USFS, Corvallis, Oreg.). In simulated future land use scenarios (for example, low and high rates of
oil/gas development), simulated vegetation condition is output annually as a map and used with
empirically-derived wildlife-habitat association models to produce maps of species‘ habitat and
distribution. Collaboration with WLCI Science Team members will provide wildlife habitat-
association models or methods to assess wildlife habitat quality given conditions and pattern of

14
simulated vegetation condition. Comparison of wildlife species‘ distributions among scenarios will
begin to identify management strategies that may limit the impacts of land uses and the interactions
between land uses and future climatic conditions.
Objec t i ves
Identify land-management strategies that maximize persistence of habitat for wildlife
species of special concern (for example, sagebrush [Artemisia spp.] obligates) under
future potential land-uses and climatic conditions.
St udy Area
Activities associated with this work are not specific to any one location, site, or habitat.
They apply to the entire WLCI region (fig. 2).
Wor k Ac compl i shed in FY2009 and Findings
A prototype of the spatially explicit, frame-based simulation model was developed.
Collaboration with Ron Neilson to acquire and use maps of predicted vegetation potential was
initiated in 2009. Simulation experiments will be initiated in 2010 to begin to explore the potential
impacts of energy development on vegetation conditions within the shrub-steppe ecosystem and the
potential interactions of land disturbances and future climate patterns on the ability of major plant
species to disperse across the WLCI landscape. Additionally, models or information for assessing
simulated vegetation conditions in terms of wildlife habitat will be acquired and used to begin to
assess wildlife-habitat response to future land-use disturbances and climatic patterns.
Pr oduc ts Completed i n FY2009
A prototype of the spatially explicit, frame-based simulation model.
Assessing Energy Futures
St atus
Ongoing
Contac t
Christopher J. Potter; 303-236-1735; [email protected]
Laura R. H. Biewick; 303-236-7773; [email protected]
Scope and Methods
Future effects of energy development in southwestern Wyoming ecosystems are dependent
on which particular energy resources are exploited and which geologic conditions (including oil
and gas play concepts1) lead to development. For this reason, it is important to apply a geologic
understanding of emerging patterns in energy extraction when identifying the regions most likely to 1 A ―play concept‖ is a hypothesis for the existence of oil and gas accumulations that is based on a specific set of
geologic assumptions used in a given exploration effort. This entails using seismic reflection and well data to learn
about the coincidence of certain key geologic conditions (in the subsurface) that petroleum geologists deem to be
favorable for a particular style of oil or gas accumulation. Then geologists will drill into the subsurface to test the
hypothesis.

15
be developed in the future. Planning is underway to develop strategies for identifying possible
scenarios of future development, based on geologic knowledge of emerging play concepts and
other factors. A spatial product based on GIS (Biewick, 2009) exemplifies the progression of oil
and gas exploration and production in the Greater Green River Basin over the last century.
Ongoing work will concentrate on improving the understanding of other energy resources in
southwestern Wyoming. A refined understanding of the geologic facies (bodies of rock with
specified characteristics) in the Green River Formation, and of the geochemical properties of the oil
shale, will lead to enhanced estimates of recoverable volumes of oil shale and the hydrocarbons
within the oil shale. These studies will improve predictions of the areal extent of possible future
shale-oil extraction. Work on the properties of coal, coalbed gas, and produced waters1 in the
Powder and Green River Basins is producing an extensive coalbed methane database. It also
contributes to the development of new concepts and understandings relative to the geologic and
biologic controls on coalbed methane accumulations in the Basins. As the production of coalbed
methane begins to have greater impacts in the Atlantic Rim (located in the eastern part of the
Southwestern Wyoming Province), USGS coalbed methane studies will have increased significance
for the WLCI. Importantly, this work will help inform resource conservation by incorporating
potential development patterns into planning and monitoring efforts.
Objec t i ves
Document the temporal evolution of energy resource production in the Southwest
Wyoming Province in the context of oil and gas assessment units defined in the 2004
USGS assessment of undiscovered oil and gas resources in southwestern Wyoming
(Kirschbaum and others, 2004; U.S. Geological Survey Southwestern Wyoming
Province Assessment Team, 2005).
Enhance our understanding of the subsurface geology of the Southwest Wyoming
Province in order to update our perspective on the potential impact of future energy
development on critical ecosystems.
Evaluate existing models and forecasts of future energy production in Southwest
Wyoming, and work to enhance these if possible.
St udy Area
Activities associated with this subtask apply to the Southwestern Wyoming Province
(fig. 4).
1 Produced waters are waters co-produced with the extraction of natural gas. Within the coalbed at depth (under
pressure), the natural gas (mostly methane) occurs in solution within the formation (rock strata) waters. As the water is
pumped to the surface in a coalbed methane well, the natural gas separates from the water (at lower pressures near the
earth's surface). The gas is then routed toward a natural gas pipeline, and the water is produced at the surface.
Depending on the operation, the water might be re-injected into the ground or, commonly in Wyoming, discharged at
the surface.

16
Figure 4. Southwestern Wyoming Province and its relationship to the WLCI region prior to its expansion in 2009 (map largely for orientation when looking at the two subsequent figures).
Wor k Ac compl i shed in FY2009 and Findings
Among this year‘s accomplishments was the final publication of a GIS-based product
illustrating the progression of oil and gas exploration and production in the Green River since the
early 1900s (Biewick, 2009). As a next step, data were collected and processed for developing an
energy map that portrays the locations—and, where applicable, temporal evolution in the
production—of coal, oil shale, uranium, and oil and gas. The energy data were collected from the
Wyoming State Geological Survey and included
coalbed natural gas activity in the Atlantic Rim Area (Quillinan and others, 2009);
a Wyoming uranium map and geodatabase that includes districts, active mills, and deposits
(unpubl. data, R. Gregory, University of Wyoming, Laramie, Wyo.); and
Wyoming coal map and geodatabase (Jones and others, 2009).
A Web service was developed for displaying the map, and a final product that provides data and
services on energy development in Southwest Wyoming for the WLCI will be published in 2011 as
a USGS Digital Data Series report.
17
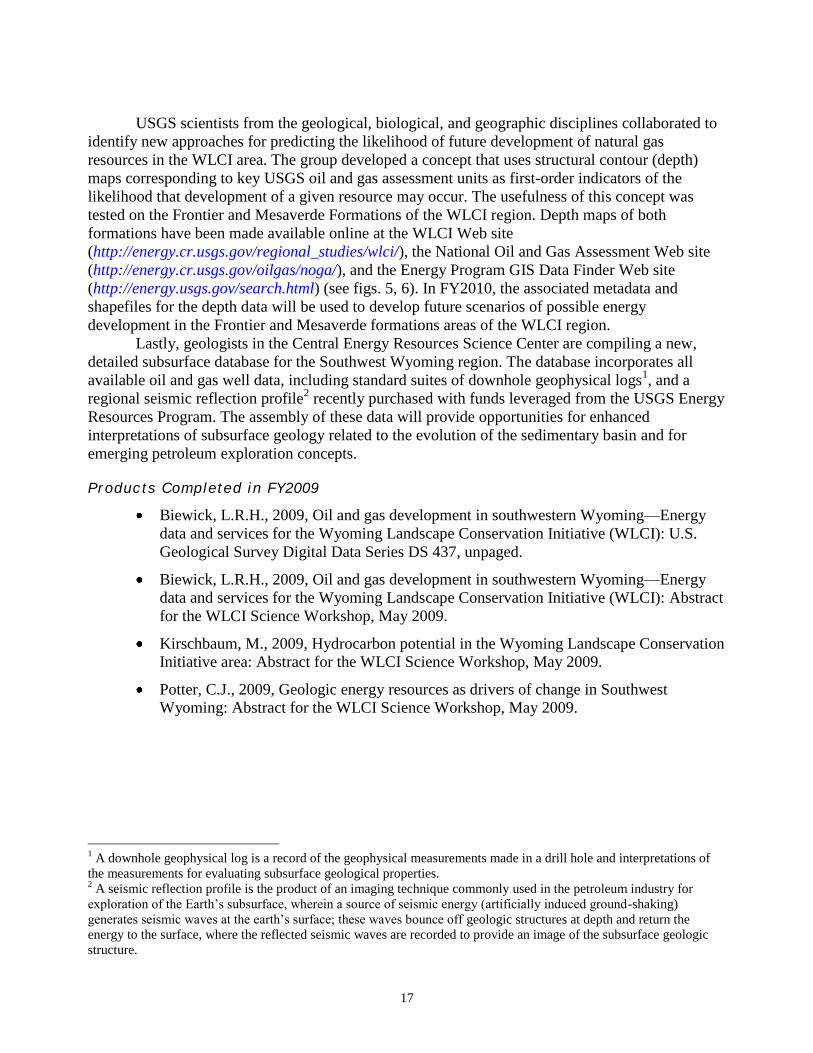
USGS scientists from the geological, biological, and geographic disciplines collaborated to
identify new approaches for predicting the likelihood of future development of natural gas
resources in the WLCI area. The group developed a concept that uses structural contour (depth)
maps corresponding to key USGS oil and gas assessment units as first-order indicators of the
likelihood that development of a given resource may occur. The usefulness of this concept was
tested on the Frontier and Mesaverde Formations of the WLCI region. Depth maps of both
formations have been made available online at the WLCI Web site
(http://energy.cr.usgs.gov/regional_studies/wlci/), the National Oil and Gas Assessment Web site
(http://energy.cr.usgs.gov/oilgas/noga/), and the Energy Program GIS Data Finder Web site
(http://energy.usgs.gov/search.html) (see figs. 5, 6). In FY2010, the associated metadata and
shapefiles for the depth data will be used to develop future scenarios of possible energy
development in the Frontier and Mesaverde formations areas of the WLCI region.
Lastly, geologists in the Central Energy Resources Science Center are compiling a new,
detailed subsurface database for the Southwest Wyoming region. The database incorporates all
available oil and gas well data, including standard suites of downhole geophysical logs1, and a
regional seismic reflection profile2 recently purchased with funds leveraged from the USGS Energy
Resources Program. The assembly of these data will provide opportunities for enhanced
interpretations of subsurface geology related to the evolution of the sedimentary basin and for
emerging petroleum exploration concepts.
Pr oduc ts Completed i n FY2009
Biewick, L.R.H., 2009, Oil and gas development in southwestern Wyoming—Energy
data and services for the Wyoming Landscape Conservation Initiative (WLCI): U.S.
Geological Survey Digital Data Series DS 437, unpaged.
Biewick, L.R.H., 2009, Oil and gas development in southwestern Wyoming—Energy
data and services for the Wyoming Landscape Conservation Initiative (WLCI): Abstract
for the WLCI Science Workshop, May 2009.
Kirschbaum, M., 2009, Hydrocarbon potential in the Wyoming Landscape Conservation
Initiative area: Abstract for the WLCI Science Workshop, May 2009.
Potter, C.J., 2009, Geologic energy resources as drivers of change in Southwest
Wyoming: Abstract for the WLCI Science Workshop, May 2009.
1 A downhole geophysical log is a record of the geophysical measurements made in a drill hole and interpretations of
the measurements for evaluating subsurface geological properties. 2 A seismic reflection profile is the product of an imaging technique commonly used in the petroleum industry for
exploration of the Earth‘s subsurface, wherein a source of seismic energy (artificially induced ground-shaking)
generates seismic waves at the earth‘s surface; these waves bounce off geologic structures at depth and return the
energy to the surface, where the reflected seismic waves are recorded to provide an image of the subsurface geologic
structure.

18
Figure 5. Extent of the Mowry Composite Total Petroleum System (U.S. Geological Survey Southwestern Wyoming Province Assessment Team, 2005). Contours show depth to top of the Frontier Formation in thousands of feet using a 2,000-ft contour interval. Ranges of thermal maturity values (in percent R0) at the top of the Frontier are indicated by colors (from Kirschbaum and Roberts, 2005).

19
Figure 6. Approximate depth to the top of the Mesaverde Group, in the Mesaverde Total Petroleum System in the Southwestern Wyoming Province (from Johnson and others, 2005). Contour interval is 1,000 ft.
20
Assessing Mineral Resources
St atus
Ongoing
Contac t
Anna Wilson; 303-236-5593; [email protected]
Scope and Methods
Numerous mineral deposits are located within the WLCI area. The initial study in FY2008
focused on inventorying the locations and types of deposits containing metals such as copper, lead,
zinc, silver, and gold in the original WLCI study area. In FY2009, the WLCI study area was
expanded eastward to include all of Carbon County. In addition, the trona-producing1 area in the
central part of the study area (west of Green River), as well as areas either mined or prospected for
uranium, were included. Based on information from historic map and the geology literature,
attempts were made to locate the mines, prospects, and occurrences in the study area that were
reported to contain the commodities listed above; from the new information, the USGS MRDS (U.
S. Geological Survey, 2010a) will be revised and new records will be created for each of the major
mineralized areas (districts).
Objec t i ve
Provide an overview of known base- and precious-metal mineralized areas and the
location of mines and prospects in the WLCI study area.
St udy Area
In addition to the three main metallic mineralized areas previously reported (Lake Alice,
Seminoe, and the western part of Encampment; see Bowen, Aldridge, Anderson, Assal and others,
2009), there are additional areas in Carbon County: the eastern part of Encampment, Big Creek,
Gold Hill, Cooper Hill, Herman, and part of Keystone. The trona area west of Green River is the
largest trona deposit in the world. Uranium is found in the Poison Basin, Ketchum Buttes, Shirley
Basin, and Crooks Gap/Green Mountain areas. These mineralized areas are shown in figure 7.
Wor k Ac compl i shed in FY2009 and Find ings
At the start of the project, records for about 800 known mines and prospects pulled from the
USGS databases (U.S Geological Survey, 2010a; Wilson and others, 2001) were plotted on
simplified geologic base maps. In September 2008, field visits were conducted at many of the
accessible sites in the Lake Alice, Seminoe, and western part of the Encampment mineralized areas,
as well as at sites identified as uranium occurrences in Poison Basin, within the original study area.
The consolidation of duplicate records and the aggregation of multiple workings associated with a
mine into single-deposit records have reduced the number of base- and precious-metal records in
the database by about half. In September 2009, field visits were made to the metallic mineralized
areas (eastern part of Encampment, Big Creek, Gold Hill, Cooper Hill, Herman) in the expanded
1 Trona (sodium sesquicarbonate) is an evaporate mineral processed into soda-ash, which is used in the manufacture of
glass, paper, medicines, food additives, and laundry detergents, among other things.

21
study area in Carbon County, the trona-producing area west of Green River, and the remaining
uranium districts (Ketchum Buttes, Shirley Basin, and Crooks Gap/Green Mountain) (fig. 7). With
the exception of the major trona-producing mines, no other visited mines are currently active. As
we found last year, access at many sites was problematic due to road closures, locked gates, or
private property. Many sites could not be found because they were poorly located on maps or
poorly described in the literature. At all the visited sites, latitude and longitude coordinates were
recorded by GPS and locations were corrected as needed in the NewMRDS database (U.S.
Geological Survey, 2010a). In addition, we noted the geology and mineralogy of the ores and often
collected dump samples for geochemical analysis.
There are 1,044 records in the NewMRDS database in the expanded study area (as of
January, 2010). Of these, 145 records are for base- and precious-metal deposits such as gold, silver,
copper, lead, zinc, molybdenum, iron, titanium, and manganese. There are 468 uranium records,
and 54 sodium records, which are mostly trona in the western part of the study area, and various
salts in the central region of the study area (see fig. 7). Another 111 are phosphate, 83 are silica, 61
are sand and gravel (construction material), 18 are potassium, 16 are gypsum-anhydrite, and 16 are
crushed stone. The remaining records contain fewer than 10 each: aluminum (2), asbestos (2),
barite (1), bentonite (9), beryllium (3), calcium (1), clay (5), corundum (1), dimension stone (9),
garnet/abrasive (2), gemstone (3), geothermal (2), graphite (3), kyanite (6), mica (4), pumice (4),
rare-earths (4), stone (1), talc (1), vermiculite (3), and zeolite (3). Of these, some may be duplicate
or unverifiable records.
Figure 7. Map showing location of mineralized areas in, and immediately adjacent to, the WLCI expanded study area. Areas primarily containing base and precious metals are shown in red, uranium in yellow, trona in pink. Base and precious metals (red diamonds), uranium (yellow diamonds), and sodium (pink diamonds) deposits occur throughout the study area and are not restricted to these areas. Other commodities are not shown on this figure.
22
Pr oduc ts Completed i n FY2009
Data for all of the mines and prospects visited are in the USGS NewMRDS database.
Unrestricted versions of the database are available at http://tin.er.usgs.gov/mrds (U.S.
Geological Survey, 2010b) and http://pubs.usgs.gov/of/2001/ofr-01-0497/ (U.S.
Geological Survey, 2001). Revisions and elimination of duplicate entries are currently
in progress. Summaries of each of the mineral districts are in progress and will be
incorporated into the database as "district" records.
Wilson, A.B., 2009, Overview of mineral resources for the WLCI study area: Poster and
abstract, May, 2009, USGS Science Workshop, Laramie, Wyo.
Revisions to the U.S. Geological Survey New Mineral Resources Data System (U.S.
Geological Survey 2010b), online (internally to USGS) at
http://mrds.cr.usgs.gov:7777/mrds/f?p=130:1.
Developing Methods for Assessing Soil Organic Matter and Mercury at Variable Spatial Scales
St atus
New in FY2009
Contac t s
JoAnn Holloway; 303-236-2449; [email protected]
Robert McDougal; 303-236-1854; [email protected]
Scope and Methods
Soil organic matter and mercury concentrations were evaluated for the WLCI region using
the A-horizon soil-chemical data collected as described under the section entitled Long-Term
Monitoring of Soil Geochemistry in the section below on Long-Term Monitoring. Shrubland and
forest plant communities depend on soil organic matter, which can be evaluated by measuring soil
carbon and nitrogen concentrations. Because soil organic matter is largely in the surface horizon,
revegetation efforts may be difficult in areas that have had extensive soil disturbance, resulting in
increased rates of soil erosion.
In addition, soil organic matter can form chemical bonds with certain trace metals,
including mercury. Mercury and sulfur form a strongly bonded, poorly soluble compound in soil
organic matter, which serves to accumulate mercury in soils. This affinity of mercury for soil
organic matter causes soil to absorb mercury like a sponge. The accumulation of mercury in soils
may be critical in wetland and riparian areas, where soil-bound mercury can be desorbed and
methylated, forming the bioaccumulating neurotoxin methylmercury.
Objec t i ves
Establish a regional-scale baseline of soil organic matter for southwestern Wyoming by
using concentrations of nitrogen and organic carbon, as measured for the Long-Term
Monitoring of Soil Geochemistry task (see section below on Soil Geochemistry under
Long-Term Monitoring); use the baseline to evaluate local-scale studies (for example,
evaluation of Muddy Creek watershed, study of Green River Formation oil shale
geochemistry).

23
Establish a regional-scale baseline of soil mercury concentrations and determine the
correlation between mercury and soil organic carbon.
Identify areas of highest mercury concentrations in the WLCI study area.
St udy Area
Activities associated with this work are not specific to any one location, site, or habitat.
They apply to the entire WLCI region (fig. 2).
Wor k Ac compl i shed i n FY2009 and Findings
Soil samples were collected in southwestern Wyoming during the summer and fall of 2009.
Sample analyses indicated that greater concentrations of soil organic carbon were more frequently
associated with montane forests of the Uintah and Rocky Mountains than they were with the
sagebrush steppe. Mercury in WLCI soils may originate from the weathering of bedrock or from
atmospheric deposition. Mercury concentrations correlated with soil organic carbon, with elevated
mercury concentrations northeast of the city of Green River, which may reflect a point source in
that area.
Figure 8. Mercury concentrations in soils in southwestern Wyoming.

24
Pr oduc ts Completed i n FY2009
Map of mercury concentrations at sites sampled in Southwest Wyoming (fig. 8).
Holloway, J.M., 2009, Soil organic matter and mercury at variable spatial scales, in
International Symposium on Soil Organic Matter Dynamics: Land Use, Management
and Global Change, Colorado Springs, Colo., 6–9 July 2009, Book of Abstracts: Fort
Collins, Colorado State University Natural Resource Ecology Laboratory, p. 200.
Available online at http://www.nrel.colostate.edu/som-home.html.
Developing Methods for Assessing Element Mobility and Availability in Soils of the Greater Green River Basin
St atus
New in FY2009
Contac t s
Michele Tuttle; 303-236-1944; [email protected]
Robert McDougal; 303-236-1854; [email protected]
Scope and Methods
The Green River Formation in the Greater Green River Basin of southwestern Wyoming
holds the world's largest known resource of natural sodium carbonate, or trona
(Na2CO3∙NaHCO3∙2H2O). This trona resource is estimated to comprise more than 115 billion tons
in 22 beds ranging from 1.2 to 9.8 meters (m) in thickness (as cited in Dyni, 2005). In 2004 alone,
17 million tons of trona were mined from the region. This study provides data to help characterize
the environmental weathering of the Green River Formation and assess the environmental impact
of trona mining. Because the areal extent of the Green River Formation overlaps the range of the
pygmy rabbit (Brachylagus idahoensis) and supports growth of big sagebrush, this work also
provides pedogenic (evolution of soil formation) data to WLCI scientists.
Objec t i ves
Provide geochemical data to the Mineral Resources Environmental Assessment on trona
resources in the Green River Basin.
Provide valuable geochemical data on soils and weathering profiles of the Green River
Formation to USGS scientists working in the Wyoming Landscape Conservation
Initiative as well as industry, academic and research entities, BLM managers, and others
interested in the weathering of the GRF (this aspect of the work is being partially
supported by Energy Resource‘s Oil Shale Assessment Project).
Define soil biogeochemical controls on the ecological health of Wyoming sage
landscapes.

25
St udy Area
This study covers the greater Green River Basin in southwestern Wyoming (fig. 9).
Figure 9. Sample locations (red circles) of soil profiles, associated plants, and rocks collected from the three members of the Green River Formation.
Wor k Ac compl i shed in FY2009 and Findings
In late FY2009, soil profiles, associated plants, and rock samples were collected from each
of the three Green River Formation Members, including the trona-bearing Wilken‘s Peak Member
(trona does not occur at this locality, but is mined in the subsurface just to the east). In addition,

26
unweathered shale from the Green River Formation was obtained from a core just south of White
Mountain and is being analyzed with the soil and weathered shale to represent parent material. Bulk
samples are being analyzed for elemental composition and water extracts to allow the measurement
of salinity, pH, and extractable elements. Geochemical data will allow an evaluation of element
source, mobility, and fate during weathering processes and will provide a datum for assessing the
uniqueness of the Green River landscapes.
Pr oduc ts Completed i n FY2009
Tuttle, M.L., 2009, A collection of chemical, mineralogical, and stable isotopic
compositional data for Green River oil shale from depositional center cores in Colorado,
Utah, and Wyoming: U.S. Geological Survey Open-File Report 2009–1274, 18p.
Developing Remote Sensing Applications for Geologic, Vegetation, and Soil Investigations
St atus
New in FY2009
Contac t
Robert McDougal; 303-236-1854; [email protected]
Scope and Methods
Regional-scale studies, such as those being conducted for the WLCI, are well suited for the
use of remote-sensing techniques. Derivative products from remote-sensing instruments, such as
Landsat, have been used successfully for decades in studies of geology, vegetation, environmental
change, and many other types of scientific research. The continuous coverage of Landsat data since
1972 makes it possible to establish baseline conditions in areas affected by renewable and non-
renewable energy development. In this study, various Landsat data sets will be used to map current
and pre-development conditions in the WLCI study area for a selected set of scientific interests.
Objec t i ves
Derive from the mosaicked scene a composite surficial mineral map, showing ferric
iron, ferrous iron, clays, and carbonates.
Derive a Normalized Difference Vegetation Index (NDVI), showing relative
―condition‖ of vegetation.
Derive a dNDVI1, showing the occurrence of cheatgrass in the WLCI study area.
St udy Area
Activities associated with this work are not specific to any one location, site, or habitat.
They apply to the entire WLCI region (fig. 2).
1 A dNDVI is a "difference" of two separate NDVIs obtained on two different dates for cheatgrass detection (dates in
early spring and mid-summer). One data set is subtracted from the other to show the probable occurrence of cheatgrass.

27
Wor k Ac compl i shed in FY2009 and Findings
Ten scenes from Landsat 5 have been mosaicked (a process of eliminating visible seams
between scenes) to cover the entire WLCI study area, including the 2009 expansion of the WLCI
boundary into Carbon County. Scenes were acquired in July, August, and September 2009. The
mosaicked scenes have been used to produce a mineral-composite map showing clays, carbonates,
sulfates, and micas as red; ferric iron minerals as green; and ferrous iron minerals, bare rock, and
soil as blue (fig. 10).
Pr oduc ts Completed i n FY2009
Mosaicked Landsat 5 mineral composite map (in review; fig. 10).
Figure 10. A mineral composite of the Wyoming Landscape Conservation Initiative study area developed by mosaicking 10 scenes from Landsat 5. Landsat bands were used to produce 5/7, 3/1, and 5/4 ratios, shown in a three-band combination of red, blue, and green, respectively. Four orbital paths were required to complete the mosaic: path 38 was acquired on July 16, 2009, path 37 on September 11, 2009, path 36 on July 18, 2009, and path 35 on August 12, 2009. The color key indicates that group A (red) represents clay-carbonate-sulfate mica minerals; group B (green) represents ferric Iron minerals; and group C (blue) represents bare rock and soil-ferrous iron minerals. Projection: Universal Transverse Mercator, Zones 12 and 13; Datum: World Geodetic System 1984.
28
Developing a Soil-Quality Index
St atus
New in FY2009
Contac t s
Lisa Stillings; 775-784-5803; [email protected]
Steven W. Blecker; 775-784-5036; [email protected]
Robert McDougal; 303-236-1854; [email protected]
Scope and Methods
The severe disturbance that surface mining often causes has the potential to drastically alter
a soil‘s physical, chemical, and biological properties (Insam and Domsch, 1988). In particular,
metals associated with mining deposits present obstacles to ecosystem recovery (Nielsen and
Winding, 2002), as their residence time in soils can be quite extensive (Brookes, 1995).
Quantifying soil quality can be useful in evaluating the impact of such disturbances and can
improve our understanding of the mechanisms behind ecosystem processes.
Definitions of soil quality generally involve soil function (for example, a soil‘s ability to
support vegetative diversity and biomass, or to sustain itself through nutrient cycling [Doran and
Parkin, 1994]). Soil quality indices (SQIs) are generally composed of biological (and sometimes
physicochemical) parameters that reduce a system‘s complexity to a metric that indicates the soil‘s
ability to carry out one or more functions (Papendick and Parr, 1992; Halvorson and others, 1996).
Simple ratios, such as the metabolic quotient, qCO2 (quantity of mineralized substrate/unit of
microbial biomass carbon/unit of time) and enzyme activity/total carbon, are generally too
simplistic and often difficult to interpret (Gil-Sotres and others, 2005); thus, many SQIs combine
these parameters with other microbial indicators, such as organic matter (organic carbon [C] and
total nitrogen [N]) and microbial activity. Specifically, estimates of carbon and nitrogen
mineralization, respiration, and enzyme activity can be very useful in evaluating soil recovery in
surface-mining situations (Insam and Domsch, 1988); thus, identifying sensitive soil-quality
indicators in mineralized terrane (terrain) and incorporating them into an SQI could aid long-term
monitoring of reclamation efforts in areas impacted by surface mining.
The work of this task is to extend ongoing efforts to develop an SQI that represents a soil
ecosystem‘s ability to incorporate organic C and N. Methods will include sampling field sites of
varying climate, vegetation, and trace metal chemistry that have been impacted by mining (Blecker
and others, 2010). The first step will entail identifying the microbial indicator variables that
correlate with soil organic carbon and nitrogen for a variety of ecosystems and types of geological
mineralization. Soil samples will be collected at a few WLCI sites during spring 2010. Meanwhile,
work to develop an SQI from existing chemical data (without microbial indicator variables) will
continue; this will be a cumulative metric representing diverse indicator data such as pH, salt
content, nutrient content, and concentration of metals. Whereas this number will demonstrate the
data variability across the WLCI region, it will not provide any information on soil or ecosystem
function. Addition of the microbial indicator variables to the SQI calculation will greatly improve
the utility of the SQI and help to integrate scientific and management objectives.

29
Objec t i ve
Produce an SQI for the WLCI study area by using indicators—such as mineralization,
disturbance, climate differences, geology, topography, and ecologic region—that
distinguish various parts of the landscape.
St udy Area
Activities associated with this work are not specific to any one location, site, or habitat.
They apply to the entire WLCI region (fig. 2).
Wor k Ac compl i shed in FY2009 and Findings
Compilation of data layers for use in the SQI was initiated. These data include biological,
chemical, and respiration or enzyme activities, as well as organic matter and microbial biomass.
Pr oduc ts Completed i n FY2009
Blecker, S.W., Stillings, L.L., Amacher, M.C., Ippolito, J.A., and DeCrappeo, N., 2010,
Ecosystem health in mineralized terrane—Data from Podiform Chromite (Chinese
Camp mining district, California), Quartz Alunite (Castle Peak and Masonic mining
districts, Nevada/California), and Mo/Cu porphyry (Battle Mountain mining district,
Nevada) deposits: U.S. Geological Survey Open-File Report, 2010–1040, 38 p.
Blecker, S.W., Stillings, L.L., Amacher, M.C., Ippolito, J.A., and DeCrappeo, N.,
Development of an SQI from data for soil organic matter and microbiological activity,
in mineralized terranes (manuscript to be submitted to a peer-reviewed journal).
Assessing Socioeconomics: Oil and Gas Development Literature Review and Case Study
St atus
Ongoing; projected completion in FY2010
Contac t
Jessica Montag; 970-226-9137; [email protected]
Scope and Methods
Understanding the socio-political and economic context of energy development is crucial
for an accurate portrayal of the true tradeoffs involved with energy development effects. In addition
to the bio-physical effects, development of oil and gas has an effect on and is affected by the
surrounding communities and the region as a whole. Synthetic literature reviews can elucidate what
is already known about these effects and create a common understanding of the social and
economic context for energy development and habitat conservation, as well as provide a basis for
dialogue with the public through the entire adaptive management process. For this task, literature
produced prior to and during the current energy-development booms in Southwest Wyoming was
reviewed to identify trends in socioeconomic effects and how the effects and perceptions of those
effects have changed. The results of this effort can be used to inform further research and assist
communities affected by energy development. A concomitant case study of the WLCI area will

30
employ baseline data provided by the U.S. Bureaus of the census, labor statistics, and economic
analysis.
Objec t i ves
Compile a basic social and economic assessment to provide a common context for the
other issues addressed in the WLCI.
Compile a complementary literature review on the social and economic research
completed on energy development, with a focus on oil and gas development in the West.
Identify locations of existing and potential future leases and wells in the Green River
Basin as well as in the broader context of Wyoming, Montana, and Colorado.
St udy Area
The WLCI boundaries overlap six counties in Southwest Wyoming; however, in FY2009
when this study was initiated, only four counties fell completely or almost completely within the
original WLCI boundaries: Lincoln and Uinta (completely), and Sweetwater and Sublette (almost
completely). Because the available data are summarized at the county level, the study area for this
task is the four counties that fall completely or almost completely within the WLCI boundary (fig.
2).
Wor k Ac compl i shed in FY2009 and Findings
A social and economic assessment and literature review was drafted. This literature review
revealed that the mix and extent of negative and positive effects on affected communities was
influenced by characteristics of both the development and the communities themselves and did not
appear to be the same from place to place. Review of the literature indicates that there are some
predictable socioeconomic effects from energy-development booms, including those seen in
Sweetwater County in the 1970s and in Sublette County in the 2000s. Previous literature focused
on economic issues while social or quality-of-life components received little attention. In the case
of rapid rural energy development, however, there were many potentially positive effects across
differing communities and types of development, including increased revenue for local
governments and schools, more employment opportunities, and increased income. Potentially
negative effects included rapid population growth, increases in crime, overcrowding in schools,
stressed infrastructure, and lack of affordable housing. Many of these effects were felt in the Green
River Basin during the 2000s boom. Specifically, Sublette County experienced the majority of the
effects due to the development of major natural gas fields in the county.
Pr oduc ts Completed i n FY2009
Stinchfield, H., Montag, J.M., Essen, M., and Ponds, P., Socioeconomic effects of oil
and gas development in the western United States—A literature review: U.S. Geological
Survey Open-File Report xxxx-xxxx, xx p. (in review).
Stinchfield, H., Montag, J.M., and Essen, M., 2009, Socioeconomic effects of oil and
gas development in the western United States—A literature review: Poster presented at
the WLCI Science Workshop, May 2009, Laramie, Wyo.

31
Assessing Rancher Perceptions of Energy Development in Southwest Wyoming
St atus
Ongoing; projected completion in FY2010
Contac t
Jessica Montag; 970-226-9137; [email protected]
Scope and Methods
Energy and other forms of development can have large effects on ranching and farming
communities. Jobes (1987) characterizes these communities as small, isolated, stable,
interdependent, and independent of outsiders, and argues that energy development can devastate
such communities because the informal institutions that hold them together (for example,
community meetings) are disrupted and replaced by formal institutions. Many people may begin to
feel like outsiders in their own communities as the population grows and changes rapidly, causing
them to feel less satisfaction with their lives and move away. The lack of current research on how
energy development affects ranching communities provides an opportunity for further study. This
WLCI study evaluates perceptions about these and other issues facing ranchers overall to get a
more complete picture of how ranchers perceive effects of energy development.
Through an agreement between the WDA and the USGS, a study evaluating ranchers‘
perceptions of energy development has been initiated. This entails a WDA survey with the USGS
serving as consultant in survey design and construction based on the needs and issues provided by
the WDA. Following the standard survey methodology set forth by Salant and Dillman (1994),
surveys were mailed to randomly selected ranchers operating in counties encompassed by the
WLCI area (Lincoln, Sublette, Uinta, Sweetwater, and Carbon Counties) and the portion of
Fremont County that lies within the WLCI boundary (see fig. 2).
Objec t i ves
Develop an understanding of how ranchers frame the underlying issues and conflicts
related to energy development. Address whether or not the issues and conflicts differ
with different energy types.
Develop an understanding of how ranchers view their social well-being in the midst of
energy development, including what they believe they have gained or lost.
Identify how ranchers frame issues/impacts on federal lands differently than on private
lands.
Identify ranchers‘ perceptions toward policy-making, both at a local and national level,
including how ranchers perceive the science on which policies are based.

32
St udy Area
The survey was designed to provide adequate representation of ranchers throughout the
entire WLCI region (fig. 2).
Wor k Ac compl i shed in FY2009 and Findings
Surveys were mailed to 887 randomly selected ranchers operating in counties encompassed
by the WLCI area. A notice card explaining the survey was mailed to each rancher, and two weeks
later the WDA mailed the survey to each rancher. A reminder card was mailed to all survey
recipients within another two weeks. Twenty-eight of the first survey cards were returned to the
WDA as undeliverable; after searching for updated address for those recipients, one updated
address was found. The USGS Policy Analysis and Science Assistance (PASA) branch has
received the completed surveys (24 percent return rate) from WDA and has entered the data into a
statistical database. Standard statistical analyses were conducted.
Preliminary findings indicated that approximately 42 percent of respondents currently had
some form of energy development on their land, the majority of which was for oil or gas.
Respondents indicated that energy development is having a negative effect on scenery/views and
open space, affordability of housing, and availability of ranching supplies and is increasing drug
activity, crime rates, and traffic congestion. On the other hand, respondents indicated that energy
development is having a positive effect on community economic development, small business
development, employment opportunities, and salary level. When asked about the WLCI effort,
approximately 55 percent of the respondents said that the survey was the first they had heard about
the WLCI; less than 10 percent of the respondents are participating on a WLCI project or LPDT;
and 90 percent are not sure that the science generated by the WLCI will be credible. A higher
percentage of respondents agreed than disagreed that the WGFD, WDA, Wyoming Oil and Gas
Commission, Natural Resources Conservation Service (for assessing opinions of higher-level
NRCS administration), Conservation Districts (for assessing opinions of local-level NRCS
administration), and Stockgrowers/Woolgrowers/grazing associations are credible sources of
information on energy development and its potential impacts. However, more respondents
disagreed than agreed that the Wyoming Department of Environmental Quality, FWS, BLM, U.S.
Department of Energy, USFS, news media in general, sportsmen/conservation groups, energy
industry associations, and non-governmental conservation groups are credible sources of
information on energy development and its potential impacts. A higher percentage of respondents
agreed than disagreed that the USGS is a credible source of information on energy development
and its potential impacts, although 48 percent were neutral.
Pr oduc ts Completed i n FY2009
Montag, J.M., and Caudill, J., 2009, Ranching community perceptions toward energy
development, presented at WLCI Science Workshop, May 2009, Laramie, Wyo.
Lyon, K., and Montag, J.M, Ranching community perceptions toward energy
development in Southwest Wyoming: U.S. Geological Survey, Open-File Report xxxx–
xxxx, xx p. (in review).

33
Assessing Wildlife Vulnerability to Energy Development
St atus
Ongoing; projected completion in early FY2012
Contac t s
Douglas Keinath; 307-766-3013; [email protected]
Matthew Kauffman; 307-766-6404; [email protected]
Scope and Methods
The Assessing Wildlife Vulnerability to Energy Development (AWVED) research task was
established to help prioritize the management, monitoring, and research needs of Wyoming‘s
numerous SGCN (listed in Wyoming‘s Comprehensive Wildlife Conservation Strategy; Wyoming
Game and Fish Department, 2005). In May 2008, representatives of State and Federal entities met
to coordinate range mapping and modeling of Wyoming SGCN. The approach developed by the
AWVED researchers was accepted as the standard. The first step in this multi-year process is to
develop Wyoming-specific range maps for terrestrial vertebrate SGCN. The second step is to
develop detailed distribution models for the same species. These models will be refined to show
where the species are most likely to occur within their ranges and how this relates to energy
development.
Objec t i ve
Focus conservation attention on the most vulnerable species before they become
imperiled by assessing relative risks from energy related disturbances based on
geospatial estimates of exposure and evaluation of biological sensitivities.
St udy Area
Activities associated with this work apply to the entire WLCI region (fig. 2).
Wor k Ac compl i shed in FY2009 and Findings
Development of range maps for all terrestrial vertebrate Species of Greatest Conservation
Need (SGCN) has been completed. A geodatabase containing these range maps has been
disseminated to cooperators and is available to all interested parties upon request (see information
below under Products Completed). These maps were used to develop a preliminary assessment of
species‘ exposure to energy development, which was presented at the annual meeting of The
Wildlife Society and is summarized below. The next step, currently underway, is to create models
of species‘ distributions within their ranges and use the information to develop a refined exposure
assessment.
Range maps were based on 10-digit HUCs. Each HUC within a species‘ range was given an
occupational status of ―Known to Occur,‖ ―Suspected to Occur,‖ or ―Likely Absent‖ based on
experts‘ knowledge of local habitat. This information affords a quick assessment regarding the
level of knowledge about where species occur in Wyoming. For 80 percent of the SGCN, more
than half their Wyoming range is currently assumed in the absence of actual survey evidence (fig.
11). The most well-documented species are colonial nesting water birds (for example, common

34
loon [Gavia immer]: 100 percent known), greater sage-grouse (90 percent known), moose (87
percent known), pika (85 percent known) and sandhill crane (84 percent known). The least
documented are small mammals (for example, plains harvest mouse [Reithrodontomys montanus]:
less than 1 percent known, sagebrush vole [Lemmiscus curtatus]: 5 percent known) and reptiles,
particularly lizards (for example, northern many-lined skink [Eumeces multivirgatus multivirgatus]:
0 percent known, plains gartersnake: 5 percent known).
Figure 11. Species of Greatest Conservation Need plotted as a function of the proportion of their Wyoming range that is considered ―Known,‖ based on documented occurrences, versus ―Suspected,‖ based on historical occurrences and(or) presence of potentially suitable habitat.
35
To derive a coarse assessment of risk to SGCN from current development, existing well
densities in HUCs where species are known or suspected to occur were determined, and risk from
future activities was assessed by calculating the area of those HUCs that has been leased for energy
development. The primary metric of current energy development was density of existing wells
based on well locations provided by the Wyoming Oil and Gas Conservation Commission. The
primary metric of potential future development was proportion of the range contained within
federal oil and gas leases based on lease information obtained from the Wyoming state office of the
BLM. As one would expect, there was a high degree of correlation between risk from current and
future development (fig. 11), although this varied by species. The Wyoming pocket gopher was one
of the species most at risk of exposure to future development, having over 40 percent of its global
range encompassed by energy leases (fig. 12). Other species, such as the plains gartersnake were at
relatively high risk due to current well densities within their range, although proportionally less of
that range was leased for future development (fig. 12).
Conservation surprises are more likely for species that have not been well documented (that
is, range and population status are largely based on supposition) and are at potential risk from
development. Combining these two metrics into a consolidated rank could help identify where
basic research on clarifying species status might be most informative. Using this ranking procedure,
the top 20 SGCN are presented in table 1.
Pr oduc ts Completed i n FY2009
Keinath, D., and Kauffman, M., 2009, Assessment of wildlife vulnerability to energy
development—Status update and preliminary results, presentation for the WLCI Science
Workshop, May 12, 2009, Laramie, Wyo.
Interagency range map-review workshop for reptiles and amphibians, May 26–27, 2009,
Casper, Wyo.
Interagency range map-review workshop for mammals, September 14–15, 2009,
Casper, Wyo.
Interagency range map-review workshop for birds, September 15–16, 2009, Casper,
Wyo.
Keinath, D., and Kauffman, M., 2009, Where are Wyoming‘s SGCN? Presentation for
the Wyoming Chapter of The Wildlife Society annual meeting, November 4, 2009,
Cody, Wyo.
Keinath, D.A., Andersen, M.D., and Beauvais, G.P., 2009, Range maps for Wyoming‘s
Species of Greatest Conservation Need—Version 1.0. Geodatabase created by and
available from the Wyoming Natural Diversity Database, University of Wyoming,
Laramie, Wyo.

36
Figure 12. Species of Greatest Conservation Need plotted as a function of the current well density in their range and proportion of their range leased for development. Each point represents one species plotted along both axes, with two extremes labeled (Wyoming pocket gopher and plains gartersnake).

37
Table 1. List of Wyoming’s top 20 Species of Greatest Conservation Need (SGCN), based on a combination of potential risk from energy development and a lack of knowledge regarding their range in Wyoming. A complete list of preliminary ranks for all SGCN can be obtained from Doug Keinath ([email protected]).
Species Name Combined
rank1
Risk rank
2
Well density
3
Proportion leased
4
Knowledge rank
5
Proportion known
6
Idaho pocket gopher (Thomomys idahoensis) 1 7 0.52 0.249 22 0.054
Wyoming pocket gopher (Thomomys clusius) 2 1 0.44 0.415 30 0.086
Olive-backed pocket mouse (Perognathus
fasciatus) 3 17 0.46 0.224 15 0.040
Plains spadefoot (Spea bombifrons) 4 9 0.68 0.220 29 0.085
Plains gartersnake (Thamnophis radix) 5 21 0.93 0.202 20 0.052
Great plains toad (Anaxyrus cognatus) 6 24 0.74 0.200 19 0.049
Pale milksnake (Lampropeltis triangulum
multistriata) 7 22 0.60 0.201 23 0.057
Sagebrush vole (Lemmiscus curtatus) 8 36 0.46 0.223 17 0.046
Western painted turtle (Chrysemys picta
bellii) 9 10 0.72 0.220 47 0.131
Dwarf shrew (Sorex nanus) 10 49 0.43 0.202 8 0.024
Dickcissel (Spiza americana) 11 26 0.73 0.199 33 0.097
Rocky mountain toad (Anaxyrus woodhousii
woodhousii) 12 8 0.64 0.221 52 0.141
Bobolink (Dolichonyx oryzivorus) 13 23 0.56 0.203 37 0.111
Silky pocket mouse (Perognathus flavus) 14 56 0.48 0.195 5 0.012
Plains harvest mouse (Reithrodontomys
montanus) 15 58 0.56 0.163 3 0.007
Great basin spadefoot (Spea intermontana) 16 4 0.43 0.319 58 0.151
Great basin pocket mouse (Perognathus
parvus) 17 25 0.29 0.298 38 0.111
Prairie vole (Microtus ochrogaster) 18 45 0.49 0.190 24 0.060
Western small-footed myotis (Myotis
ciliolabrum) 19 20 0.46 0.220 51 0.138
Plains pocket mouse (Perognathus
flavescens) 20 61 0.50 0.173 10 0.029 1 Combined Rank = Ordinal rank based on an additive combination of the risk rank and the range-knowledge rank.
Higher-ranked species are both poorly documented and have a large proportion of their range potentially impacted by
energy development. 2 Risk Rank = Ordinal rank based on well density in range and proportion of range leased for development. Highly
ranked species have both a relatively high current well density in their range and a larger proportion of their range
leased for development. 3 Well Density = Density of wells within a species‘ ―known‖ and ―suspected‖ range, given as wells per square mile.
4 Proportion Leased = Proportion of the ―known‖ and ―suspected‖ range of a species that is contained within current oil
and gas leases. 5 Knowledge Rank = Ordinal rank based on the proportion of the species‘ range containing known occurrences. Highly
ranked species have a larger proportion of their range classified as ―suspected.‖ 6 Proportion Known = Proportion of HUCs within the species‘ range classified as ―known‖ based on documented
occurrences since 1985.

38
Climate Change and Simulating Potential Future Vegetation
St atus
Ongoing; anticipated completion in late FY2011, although related work may extend beyond
FY2011
Contac t
Sarah Shafer; 541-750-0946; [email protected]
Scope and Methods
Projected future climate changes will affect the wildlife and habitats of southwestern
Wyoming. Understanding these potential effects and how they may interact with future land-use
changes is important for anticipating the impacts of climate change on the region‘s ecosystems.
This work will produce downscaled simulations of future climate change for the WLCI study area.
These climate data will be used as input data for other modeling efforts, such as simulating future
vegetation change for the region, and will help to identify the potential effects of future climate
change on the species and landscapes of southwestern Wyoming. The simulated climate and
vegetation data produced by this research also will contribute to projecting the cumulative effects
of land uses (for example, energy development and livestock grazing) and climate change on the
region‘s species and landscapes.
To investigate potential future climate change effects, climate simulations from three or
more coupled AOGCMs produced under three different future greenhouse gas emissions scenarios
will be downscaled to a 30-arc-second (approximately 1 km) grid of the study area. The AOGCM
simulations were produced as part of the World Climate Research Programme‘s Coupled Model
Intercomparison Project phase 3 (CMIP3) multi-model dataset. These simulations were used in the
recent Intergovernmental Panel on Climate Change Fourth Assessment Report (Solomon and
others, 2007). By using climate data from multiple AOGCMs simulated under multiple emissions
scenarios, we will capture a range of projected potential future climate changes for the WLCI
region.
As part of this work, the downscaled climate data will be used to simulate potential future
vegetation changes for southwestern Wyoming using a dynamic global vegetation model, such as
LPJ (Lund-Potsdam-Jena: Sitch and others, 2003). These vegetation simulations will provide a first
approximation of potential future habitat changes across the WLCI region.
Objec t i ves
Downscale potential future climate change simulations for Wyoming and the WLCI study
area. Use these downscaled data to
model the potential impacts of climate change on the species and habitats of Wyoming,
and
evaluate potential future changes in climate, vegetation, and habitats within the WLCI
region.

39
St udy Area
The study area, which extends beyond the WCLI region (fig. 13) to encompass all of
Wyoming and portions of surrounding states, was chosen for the climate and vegetation analyses
because potential future changes in climate and vegetation across this larger area may have
significant implications for species and landscapes within the WLCI study area.
Figure 13. Mean annual temperature for 1971–2000 and 2070–2099. Top panel: 1971–2000 30-yr mean from the University of East Anglia’s Climatic Research Unit (CRU) TS 2.1 data set (Mitchell and Jones, 2005). Bottom panel: 2070–2099 30-yr mean from data simulated by CCSM3 (Collins and others, 2006), a coupled atmosphere-ocean general circulation model, using the Special Report on Emissions Scenarios A2 emissions scenario (Nakicenovic and others, 2000). The CRU TS 2.1 data have been downscaled to a 30-arc-second grid of the study area using an interpolation method developed by P.J. Bartlein (University of Oregon, written commun., 2009). (Figure by R.T. Pelltier, U.S. Geological Survey.)
40
Wor k Ac compl i shed in FY2009 and Findings
In FY2009, AOGCM-simulated changes in future monthly temperature and precipitation for
the period 2001–2100 were downscaled to a 30-arc-second grid of the WLCI study area. These
climate data were produced by three AOGCMs, CCSM3 (Collins and others, 2006),
CGCM3.1(T47) (Scinocca and others, 2008), and UKMO-HadCM3 (Pope and others, 2000) as part
of the World Climate Research Programme‘s CMIP3 multi-model dataset (Meehl and others,
2007). Each AOGCM was run under the A2 greenhouse gas emissions scenario (Nakicenovic and
others, 2000). The AOGCM-simulated changes in monthly temperature and precipitation will be
applied to downscaled observed climate data to produce potential future temperature and
precipitation data for the region. These future climate datasets will be completed in FY2010.
Pr oduc ts Completed i n FY2009
Downscaled simulated future temperature and precipitation data from the CCSM3,
CGCM3.1(T47), and UKMO-HadCM3 AOGCMs to a 30-arc-second grid of the WLCI
study area for the period 2001–2100.
Development of Conceptual Models to Inform WLCI Long-term Monitoring and Selection of Monitoring Indicators
St atus
Ongoing; completion of final products anticipated in fall 2010
Contac t s
Steven L. Garman; 303-202-4118; [email protected]
Jay Diffendorfer; 303-202-4070; [email protected]
Scope and Methods
Initial conceptual models were developed to organize and document current knowledge
about key ecosystems in Southwest Wyoming. The objective of this work is to provide a scientific
means for identifying potential indicators of ecosystem change to be used in a long-term
monitoring program. Models pertain to the atmospheric and human systems, and the focal
ecosystems identified by WLCI partners: aspen foothill woodlands, mixed mountain shrubs,
sagebrush steppe, riparian, and aquatic. Additional models were developed to illustrate the effects
of disturbances on wildlife habitat and populations. A hierarchy of models was used to illustrate
key components and processes of native systems and how systems respond to human-mediated
stressors. Models were developed based on literature reviews, or were extracted from the literature
and enhanced to accommodate the drivers and stressors of the WLCI study area. Individual system
models were organized into an integrative model that additionally considers the interactions among
systems and across scales. In 2008, preliminary conceptual models for terrestrial systems were
developed and then reviewed by USGS Science Team members during a Conceptual Model
Workshop. In 2009, these models were refined and additional models were developed and
reviewed. A draft conceptual model and indicator report was developed in 2009 and a final report
will be published in 2010 along with a report on indicators for use in monitoring ecosystem change.
The workshop and a subsequent report documenting prioritized indicators were drafted to provide
direction in planning 2010 monitoring efforts.

41
Objec t i ves
Create a useful set of conceptual models that organize and document current knowledge
of key ecosystems and processes in Southwest Wyoming and that can be used to help
identify indicators for monitoring ecosystem change.
Use conceptual models developed for the WLCI, and other information, to identify
indicators for monitoring ecosystem change. Indicators will include properties of habitat
(for example, vegetation and soil attributes and landscape pattern) and wildlife species.
Based on documented criteria, prioritize the monitoring indicators identified for
immediate consideration in operational monitoring efforts.
St udy Area
Activities associated with this subtask are not specific to any one location or site. They
apply to the entire WLCI region (fig. 2).
Wor k Ac compl i shed and Findings
Conceptual models for the WLCI effort were completed in 2009. A hierarchy of models
showing very general to specific degradation pathways was assembled, and supporting narratives
were completed. Models spanned the focal ecosystems (aspen foothills, mixed mountain shrubs,
shrub-steppe, riparian, and aquatic), as well as atmospheric and human systems. Conceptual models
related to the effects of stressors on wildlife species and populations also were produced to
explicitly delineate potential impacts and ‗causal‘ pathways. Across all models, a total of 33 drivers
and stressors were explicitly included. Approximately 60+ degradation pathways are illustrated
across the collection of conceptual models, with numerous ecological properties highlighted as
potential indicators of these pathways. The final Conceptual Model report is being combined with
the final report on Indicator Selection to provide a more comprehensive document. A draft report
was produced in 2009 and is being finalized for submission to the USGS Report Series review
process as an Open-File report.
An Indicator Selection workshop was held April 1, 2009. Using the WLCI conceptual
models, WLCI Science Team Members identified key indicators that could provide early warning
of system change in response to land-use actions (for example, oil/gas development) and other
potential ecosystem stressors (for example, climatic change). A total of 61 indicators were selected,
which spanned 8 general categories: cover and distribution (for example, percent cover of litter),
stand condition, soils/geology, hydrology, landscape pattern, animal populations, animal health,
and stressors (for example, urban sprawl and energy infrastructure). Similar as well as unique
indicators were selected across the focal ecosystems, and indicators specific to terrestrial and to
aquatic wildlife also were determined. As indicated above, the results of the Indicator Selection
workshop are being combined with the Conceptual Model report to provide a more cohesive and
comprehensive document.
Pr oduc ts Completed
WLCI Indicator Selection Workshop, April, 2009, Ft. Collins, Colorado.

42
Garman, S.L., and Diffendorfer, J., Instructional White Paper. Overview of Procedures
for Selecting and Prioritizing Indicators for Monitoring: The Wyoming Landscape
Conservation Initiative. U.S. Geological Survey Rocky Mountain Geographic Science
Center, Denver, Colorado.
Targeted Monitoring and Research
Targeted Monitoring and Research for the WLCI is composed of three major tasks: Long-
Term Monitoring, Effectiveness Monitoring, and Mechanistic Research of Wildlife (studies
designed to elucidate the mechanisms behind wildlife responses to ecosystem changes and
mitigation projects). Each major task and its components are described below.
Summary: Inventory and Long-Term Monitoring
This work comprises four components: (1) Framework and Indicators for Long-Term
Monitoring, which includes developing a framework for landscape-scale, long-term monitoring and
identifying robust indicators for monitoring landscape conditions; (2) Remote Sensing for
Vegetation Inventory and Monitoring, which entails using multi-scale remote-sensing products for
improving estimates of changes in vegetation characteristics; (3) Long-Term Monitoring of Soil
Geochemistry, which includes sampling and chemical analysis of soils across the WLCI region to
establish a baseline dataset for long-term monitoring; and (4) Long-Term Monitoring of Surface
Water and Groundwater.
The monitoring framework employs a spatially balanced design with random site selection
to represent the WLCI landscape. This framework provides the spatial representation required for
measuring the condition of vegetation, priority habitats, populations of priority species, and soil
geochemistry across a large, heterogeneous landscape. In FY2009, analyses were conducted to
estimate statistical precision for landscape-scale estimates of condition (to recognize the influence
of spatial and temporal variability on estimates). Analyses also were conducted to determine the
potential for detecting trends (that is, statistical power for trend based on sample design and
variability estimates) of two potential indicators for monitoring resource conditions: dominant
vegetation cover and passerine bird abundance. These potential indicators were represented by data
collected using spatially balanced, random design, and systematic re-measurement of conditions
across the WLCI region over several years. Pilot data for both indicators were subjected to
sampling simulations and statistical analyses to determine optimal monitoring designs and
minimum sampling requirements. Results indicated that some existing long-term monitoring efforts
meet the sampling framework‘s design criteria and will help meet the WLCI long-term monitoring
goals for sagebrush-obligate bird species. However, other monitoring designs are being evaluated
for supporting specific WLCI monitoring objectives.
The multi-scale remote sensing work employs different remotely sensed imagery products
that represent three resolutions (cell diameters): 2.4, 30, and 56 m. Sixteen habitat-component
models based on imagery data from the 30-m and 56-m resolution data were completed for the
WLCI area. These models improved the state-wide characterization of categorical land cover
classes by 8 percent over the National Land Cover Database for shrub, herbaceous, and bare ground
canopy cover, and by 8.34 percent over the LANDFIRE estimates for shrub and herbaceous canopy
cover. Subsequent analyses using this approach revealed that, between 1988 and 2006, across one
Landsat scene (34,225 square kilometers [km2]) in the southwestern WLCI region there was a net
increase in bare ground (0.95 percent), and net losses of herbaceous (3.53 percent), litter (1.64
percent), sagebrush (2.16 percent), and overall shrub (1.62 percent) canopy cover.
43
Soil inventory and monitoring work in FY2009 entailed processing soil samples collected in
FY2008 and testing for presence/concentrations of 47 parameters that can be indicative of changing
land-use or other changes. The results were tabulated and preliminary geochemical maps were
prepared to illustrate the abundance and spatial distribution of each element and the values of soil
parameters. The maps were compared with other map layers, such as those for ecoregion and
geology, and, in general, it was found that the geochemical variation among soils of the WLCI
region is similar to that reported for the United States and Canada by other studies, and that the
composition of the soil parent material and amount of precipitation for a given site in the WLCI
region impose the major controls on soil geochemistry at that site.
Surface-water and groundwater quality monitoring data from 2008 for the one site partially
funded by WLCI were published in the USGS Annual Water-Data Report. In addition, 2009 data
were collected and the preliminary data were made available online in real-time. A USGS report
describing water-quality characteristics and statistical relations at two sites in the WLCI was
published.
Details of the Inventory and Long-Term Monitoring work are provided below in the four
sections that follow.
Framework and Indicators for Long-Term Monitoring
St atus
Ongoing
Contac t s
Natasha Carr; 970-226-9446; [email protected]
Dan Manier; 970-226-9466; [email protected]
Collin Homer; 605-594-2714; [email protected];
Steve Germaine; 970-226-9107; [email protected]
Cameron Aldridge; 970-226-9433; [email protected];
Scope and Methods
Long-term monitoring in the WLCI area is necessary for assessing habitat conditions and
cumulative effects at landscape scales and detecting trends in selected indicators (for example,
species, habitat, and land use) in response to development activities and other stressors (for
example, climate change). When long-term monitoring is coupled with mechanistic research,
modeling (as discussed throughout this document), and management, it has the potential for serving
as an evaluation system that can help managers identify deteriorating population or habitat trends
before they reach critical levels that could require costly actions (for example, habitat protection
versus reconstruction). Designing an effective and efficient long-term monitoring program that
meets stated objectives requires a balance between extensive sampling across a large area versus
repeated sampling over many years to develop statistical power to detect significant changes in
priority indicators. Work done to meet these requirements entails the use of a spatially balanced,
random-sampling framework that has proven to be powerful for making inferences across large,
heterogeneous resource targets, such as the WLCI area. This sampling framework may be
combined with other sampling protocols and objectives to provide a comprehensive, extensive
picture of current resources status. If protocols are implemented through time, resulting data will
provide a reference of ongoing changes in land use, vegetation, priority habitats, and populations of

44
priority species. This requires consistent, sufficient funding to sustain the annual field sampling
required.
For monitoring priority terrestrial habitats (sagebrush, aspen, riparian, and mountain shrub
communities), a combination of spatially extensive and locally intensive designs and
methodologies would help address both scale issues and stakeholder needs. To represent the full
extent of the WLCI area, our approach incorporates multiscale sampling by linking field vegetation
measurements to remotely sensed data (QuickBird, Landsat, and AWiFS [Advanced Wide Field
Sensor —a multispectral satellite sensor]) at several scales of resolution and extent. The resulting
maps will facilitate analyses of land use and habitat changes at multiple scales for evaluating
cumulative impacts and potential management decisions. In addition, development of several
alternative monitoring programs for vegetation and birds will specifically address a variety of
management and monitoring objectives. Comparing and evaluating the cost, information
effectiveness, implementation feasibility, and objectives of each alternative will help identify which
program(s) will meet stakeholder needs. The alternative programs will be presented to stakeholders
for evaluation and selection. Implementation of selected monitoring programs is contingent upon
the availability of funding.
Objec t i ves
Create and compare monitoring designs based on stakeholder objectives, power analysis
of pilot and ancillary data, and fiscal and time constraints. Present the alternative
monitoring plans to WLCI cooperators to obtain feedback, then refine and recommend
suitable monitoring design(s).
Evaluate the success of the baseline and pilot monitoring efforts developed in FY08–09;
analyze the sensitivity of remote sensing datasets in monitoring on-the-ground change;
analyze variability and estimate potential power for trend and status estimation in
vegetation and avian data.
Draft a monitoring-plan report documenting approach, process, and alternatives for
designs and implementation options.
St udy Area
Sampling for this work will take place across the entire WLCI area (fig. 2). Currently only
―potential sites‖ and ―potential cooperator sites‖ (for example, those of Rocky Mountain Bird
Observatory) have been identified. Some semi-permanent sites have been established for
monitoring vegetation and sagebrush habitat conditions coincident with the remote-sensing
mapping effort (see section below on Remote Sensing for Vegetation Inventory and Monitoring).
Wor k Ac compl i shed in FY2009 and Findings
The USGS conducted statistical analyses (power for trend detection and precision of range-
wide condition estimates) using vegetation cover and abundance of passerine birds (fig. 14) as two
potential indicators of resource conditions across the WCLI region. Pilot data for vegetation were
derived from sagebrush-mapping field samples (see the Remote Sensing for Vegetation Inventory
and Monitoring section below). Pilot data for passerine birds was compiled from cooperative
efforts of the USGS (Fort Collins Science Center), the Wyoming Cooperative Fish and Wildlife
Research Unit, and the Rocky Mountain Bird Observatory (RMBO). These pilot data illustrate two
components of a larger conceptual framework, which represents current understanding of WLCI

45
Figure 14. Examples of predicted statistical power for trend based on population parameters derived from pilot data and a split-plot, rotating panel sample design for passerine birds. This design includes 28 plots currently sampled annually by the Rocky Mountain Bird Observatory and a rotating panel of 30 additional plots. The accumulation of statistical power to detect abundance trends for six sagebrush bird species are shown with (a) 5 percent trend and (b) 10 percent trend. Dashed vertical lines indicate the number of years it takes to achieve 80 percent power for Brewer’s sparrow (Spizella breweri; blue dashed line) and sage thrasher (Oreoscoptes montanus; orange dashed line). Factors such as number of samples and rotation duration can decrease the time it takes to achieve desired statistical power for trend detection.

46
ecosystems (see the section above on Conceptual Models), and two distinctly different potential
indicators of conditions, variability associated with estimating these populations. System components
and indicators identified in these analyses will be coupled with landscape-scale sampling simulations to
inform selection of final monitoring indicators. Development of a comprehensive monitoring program
will depend on a combination of political will, financial ability, and scientific guidance, which will
influence the number and combination of variables to be monitored. Vegetation and passerine birds
represent two different aspects of the ecological community with distinctive differences in detectability
and population variability; therefore, these data should inform the indicator selection process well.
Pr oduc ts Completed i n FY2009
We used a combination of sampling simulations (boot-strap) and statistical analyses (simple
and multivariate models) to determine optimal designs for a monitoring framework. We determined
minimum sampling requirements for assessing dominant community types across the WLCI area
using mapped dominant vegetation to represent community types. Results indicate that existing
long-term monitoring conducted by RMBO meets the design criteria we established and will
contribute to long-term monitoring goals for sagebrush-obligate birds, but it is insufficient alone to
represent the WLCI area. It appears unlikely that any one organization or agency will be able to
sustain monitoring implementation, but a well-designed, cooperative network is feasible. We are
currently evaluating monitoring designs (for birds and vegetation) that can augment RMBO‘s
existing monitoring programs (for example, the BLM-RMBO program) to offer options for meeting
monitoring objectives at local and regional scales through direct interactions with stakeholders. In
2010, we will continue to gather and analyze pilot data for monitoring objectives that still need to
be addressed.
Compilation and analyses of pilot data representing resources across southwestern
Wyoming, including summary statistics, power analyses, and modeling and simulation
exercises.
Preliminary set of monitoring designs based on monitoring objectives and funding
levels.
Preliminary report and outline for future products documenting patterns and statistical
relationships described above and a comparison of potential spatial and temporal
monitoring designs.
Remote Sensing for Vegetation Inventory and Monitoring
St atus
Ongoing
Contac t s
Collin Homer; 605-594-2714; [email protected]
Cameron Aldridge; 970-226-9433; [email protected]

47
Scope and Methods
This subtask focuses on developing remote-sensing protocols to allow spatial projections of
continuous cover estimates for sagebrush-habitat components (Homer and others, 2009) to support
affordable, repeated assessment of the entire region. This work extends beyond traditional category
based cover-type mapping, with efforts directed at making continuous cover predictions for shrubs,
sagebrush (all species), herbs, litter, bare ground, big sagebrush, and Wyoming big sagebrush
(Artemisia tridentata wyomingensis), as well as an overall shrub-height estimate at multiple spatial
scales. Based on field- and remote-sensing-based samples, we are evaluating the distribution of
variability in these habitat measures and the amount they are changing over time. This information
is critical for understanding current and future distribution of sagebrush habitats.
Objec t i ves
Ground sample six permanent monitoring QuickBird sites.
Evaluate the success of the baseline pilot monitoring sites developed in FY08, and
analyze the sensitivity of remote-sensing datasets in monitoring measurable, on-the-
ground change.
Complete four more Landsat-based models for the WLCI area including estimates of
percent shrub canopy, herbaceous canopy, litter canopy, and canopy of Wyoming sage.
Complete eight AWiFS-based (56 m) models for the WLCI area, including estimates of
percent sagebrush canopy, big sagebrush canopy, shrub canopy, herbaceous canopy,
litter canopy, canopy of Wyoming sage, bare ground, and shrub height.
Evaluate and estimate sagebrush habitat change between 1988 and 2006 across all of
Landsat 37/31 (western half of the WLCI area)
Acquire additional 2009 QuickBird and Landsat imagery required to support the 2009
monitoring plan.
Complete analysis of field-based data to determine sources of variability in habitat types
(for example, shrub cover and bare ground) and conditions. Develop multivariate,
statistical models to predict sagebrush cover and height across the sagebrush steppe in
Wyoming.
Publish a paper that describes the remote-sensing protocol being used for WLCI, and
outlines the relationship with the monitoring goals.
Identify long-term research directions and goals for future years.
St udy Area
This is a nested study, with the coarse level encompassing the entire WLCI study area (fig.
2) and with the secondary level (permanent ground sample plots) encompassing the extent of 6
QuickBird images.
Wor k Ac compl i shed in FY2009 and Findings
Eight Landsat- and eight AWiFS-based habitat-component models were completed for the
WLCI area, including estimates of cover percentage for shrub, herbs, litter, sagebrush, big
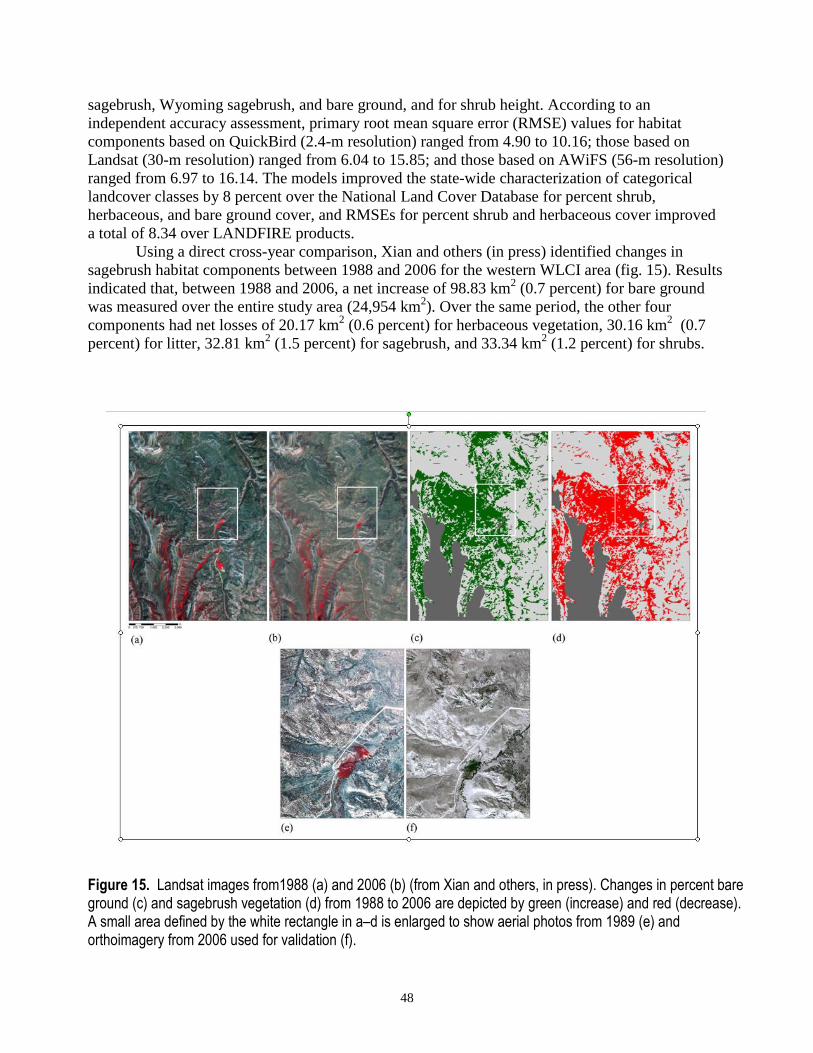
48
sagebrush, Wyoming sagebrush, and bare ground, and for shrub height. According to an
independent accuracy assessment, primary root mean square error (RMSE) values for habitat
components based on QuickBird (2.4-m resolution) ranged from 4.90 to 10.16; those based on
Landsat (30-m resolution) ranged from 6.04 to 15.85; and those based on AWiFS (56-m resolution)
ranged from 6.97 to 16.14. The models improved the state-wide characterization of categorical
landcover classes by 8 percent over the National Land Cover Database for percent shrub,
herbaceous, and bare ground cover, and RMSEs for percent shrub and herbaceous cover improved
a total of 8.34 over LANDFIRE products.
Using a direct cross-year comparison, Xian and others (in press) identified changes in
sagebrush habitat components between 1988 and 2006 for the western WLCI area (fig. 15). Results
indicated that, between 1988 and 2006, a net increase of 98.83 km2 (0.7 percent) for bare ground
was measured over the entire study area (24,954 km2). Over the same period, the other four
components had net losses of 20.17 km2 (0.6 percent) for herbaceous vegetation, 30.16 km
2 (0.7
percent) for litter, 32.81 km2 (1.5 percent) for sagebrush, and 33.34 km
2 (1.2 percent) for shrubs.
Figure 15. Landsat images from1988 (a) and 2006 (b) (from Xian and others, in press). Changes in percent bare ground (c) and sagebrush vegetation (d) from 1988 to 2006 are depicted by green (increase) and red (decrease). A small area defined by the white rectangle in a–d is enlarged to show aerial photos from 1989 (e) and orthoimagery from 2006 used for validation (f).

49
Pr oduc ts Completed i n FY2009
Four Landsat-based models for the WLCI area, including estimates of percentage of
cover for shrubs, herbs, litter, and Wyoming sagebrush canopy.
Eight AWiFS-based component models for the WLCI area, including estimates of the
percentage of cover for shrub, herbs, litter, sagebrush, big sagebrush, Wyoming
sagebrush, and bare ground canopy, and for shrub height.
Data from sampling vegetation at 147 sites across 2 of the 17 WLCI long-term
monitoring QuickBird scenes (sites were also sampled in 2008); the distribution of sites
is structured by landscape-scale patterns of variability as detected in remote-sensing
imagery.
Data from re-sampling permanent monitoring plots at 238 sites across four QuickBird
scenes (sites were also sampled in 2006 and 2008).
Data from permanent monitoring plots in the QuickBird scene (site 1), sampled on a
seasonal basis (early summer, summer, fall).
Analysis of change in sagebrush, herbaceous, and bare ground canopy between 1988
and 2006 for the Landsat scene 37/31 (western half of the WLCI area) to calculate
amount of 18-yr change.
Trend analysis to detect change in sagebrush components across four years of
permanent plot sampling. Trend analysis incorporated field plot data, QuickBird
imagery, and Landsat imagery.
Preliminary analyses on associations of vegetation cover (and variability in cover) with
environmental variables (ecosystem drivers) across the region, based on field sampling.
Homer, C.G., Aldridge, C.L., Meyer, D.K., and Schell, S., in press, Implementing a
multi-scale remote sensing sagebrush habitat quantification and monitoring framework
across Wyoming: Applied Earth Observation and Geoinformation, v. X, no. x, p. xx-xx.
Long-Term Monitoring of Soil Geochemistry
St atus
Ongoing; projected completion in late FY2011
Contac t
David B. Smith; 303-236-1849; [email protected]
Scope and Methods
Establishing a geochemical baseline for soils is essential for recognizing and quantifying
changes caused by either anthropogenic activities or natural processes. To meet this need, soil
samples were collected in 2008 from 139 sites in the original WLCI study area (prior to the study
area expansion in 2009). These sites were chosen by a generalized random tessellation stratified

50
design (see Scope and Methods section for Long-Term Monitoring) and represent a density of
approximately one sample site per 440 km2. This sampling scheme represents the same approach
used in a continent-wide soil geochemistry program being conducted by the USGS in collaboration
with the Geological Survey of Canada and the Mexican Geological Survey (Servicio Geológico
Mexicano).
Surface soil is considered the material most likely to be affected by human activities (such
as energy development) in the study area; thus, the primary sample medium for this work was soil
sampled at a depth of 0–5 centimeters (cm). At 39 of the sites, additional samples were collected to
represent the soil A horizon (the uppermost mineral soil) and the soil C horizon (generally the
partially weathered parent material for the surface soil). The samples were analyzed in the USGS
laboratories for aluminum (Al), calcium (Ca), iron (Fe), potassium (K), magnesium (Mg), sodium
(Na), sulfur (S), titanium (Ti), silver (Ag), arsenic (As), barium (Ba), beryllium (Be), bismuth (Bi),
cadmium (Cd), cerium (Ce), cobalt (Co), chromium (Cr), cesium (Cs), copper (Cu), gallium (Ga),
mercury (Hg), indium (In), lanthanum (La), lithium (Li), manganese (Mn), molybdenum (Mo),
niobium (Nb), nickel (Ni), phosphorus (P), lead (Pb), rubidium (Rb), antimony (Sb), scandium
(Sc), selenium (Se), tin (Sn), strontium (Sr), tellurium (Te), thorium (Th), thallium (Tl), uranium
(U), vanadium (V), tungsten (W), yttrium (Y), zinc (Zn), total C, and carbonate C. Samples were
also submitted to Colorado State University‘s Soil-Water-Plant Testing Laboratory for the
determination of total N, soil pH, electrical conductivity, and the sodium adsorption ratio. The
complete sampling and analytical protocols, along with the entire data set, will be published in
2010 (Smith and Ellefsen, 2010).
Objec t i ves
Define the natural variation in concentrations of major and trace elements in soils throughout
the entire WLCI region.
St udy Area
Monitoring of soil geochemistry is taking place across the WLCI study area (fig. 16).
Wor k Ac compl i shed in FY 2009 and Findings
Soil samples collected during 2008 were air-dried, disaggregated, and sieved to less than 2
mm. The less-than-2-mm material was crushed to less than150 μm in a ceramic mill and thoroughly
mixed to ensure homogeneity prior to analysis by the USGS laboratories for aluminum (Al),
calcium (Ca), iron (Fe), potassium (K), magnesium (Mg), sodium (Na), sulfur (S), titanium (Ti),
silver (Ag), arsenic (As), barium (Ba), beryllium (Be), bismuth (Bi), cadmium (Cd), cerium (Ce),
cobalt (Co), chromium (Cr), cesium (Cs), copper (Cu), gallium (Ga), mercury (Hg), indium (In),
lanthanum (La), lithium (Li), manganese (Mn), molybdenum (Mo), niobium (Nb), nickel (Ni),
phosphorus (P), lead (Pb), rubidium (Rb), antimony (Sb), scandium (Sc), selenium (Se), tin (Sn),
strontium (Sr), tellurium (Te), thorium (Th), thallium (Tl), uranium (U), vanadium (V), tungsten
(W), yttrium (Y), and zinc (Zn). The Colorado State University Soil-Water-Plant Testing
Laboratory analyzed splits of the less-than-2-mm material for total N, soil pH, electrical
conductivity, and sodium adsorption ratio. Rigorous quality control protocols were used throughout
the analytical process with two samples having to be reanalyzed by the USGS laboratories for
failing to meet the acceptance criteria for accuracy and precision. A statistical summary of soils
collected from a depth of 0–5 centimeters (cm) is shown in table 2. In general, the geochemical

51
Figure 16. Soil geochemistry sampling locations for the WLCI’s long-term monitoring program. The figure shows the original Wyoming Landscape Conservation Initiative boundary, as that was the area in which 2008 sampling locations where placed (2009 work only entailed sample analysis).
variation seen for soils of the WLCI study area is similar to that reported for the United States and
Canada by Smith and others (2005) and Garrett (2009).
Exploratory data analysis, including preparation of histograms, Tukey boxplots, plots of
empirical cumulative distribution function, and quantile-quantile plots, was performed on the
major- and trace-element data. Multivariate analyses, including principal component analysis and
factor analysis, also were conducted. Preliminary geochemical maps were prepared to show the
abundance and spatial distribution of each element or parameter and these were compared with
other information layers such as geology and ecoregions. Geochemical maps for mercury and
organic carbon are shown in figures 8 and 17, respectively. In general, the composition of the soil
parent material and climate (amount of precipitation) at a given site were the major controls on soil
geochemistry.

52
Table 2. Statistical summary for the geochemistry of soils collected from a depth of 0–5 cm in the WLCI study area (n = 139).
Element
Concentration
units
Detection
limit
No. samples
<detection limit Min1
Q12 Median Q3
2 Max
1 MAD
3
Al % 0.01 0 2.11 4.41 5.42 6.36 8.09 1.47
Ca % 0.01 0 0.37 0.96 1.98 3.38 10.3 1.7
Fe % 0.01 0 0.29 1.62 1.98 2.36 4.47 0.55
K % 0.01 0 0.83 1.61 1.84 2.09 3.87 0.34
Mg % 0.01 0 0.07 0.52 0.80 1.08 2.42 0.43
Na % 0.01 0 0.08 0.58 1.03 1.53 2.66 0.71
S % 0.01 3 <0.01 0.02 0.03 0.04 0.29 0.015
Ti % 0.01 0 0.04 0.15 0.18 0.25 0.47 0.059
As mg/kg 0.6 1 <0.6 3.3 5.4 7.6 30.1 3.1
Ag mg/kg 1 139 <1 <1 <1 <1 <1 0
Ba mg/kg 5 0 220 532 678 923 2390 258
Be mg/kg 0.1 0 0.6 1.4 1.7 1.9 2.5 0.3
Bi mg/kg 0.04 1 <0.04 0.15 0.21 0.27 0.49 0.089
Cd mg/kg 0.1 2 <0.1 0.2 0.3 0.5 5.7 0.2
Ce mg/kg 0.05 0 18.3 48.4 62.0 74.4 161 18.8
Co mg/kg 0.1 0 0.8 6.0 7.8 9.9 23.9 2.8
Cr mg/kg 1 0 4 37 44 52 171 11.9
Cs mg/kg 5 107 <5 <5 <5 5 11 0
Cu mg/kg 0.5 0 1.7 11.4 15.6 20.8 47.9 7.1
Ga mg/kg 0.05 0 5.6 11.0 13.3 16.3 22.2 3.9
Hg mg/kg 0.01 22 <0.01 0.01 0.02 0.02 0.15 0.015
In mg/kg 0.02 12 <0.02 0.03 0.04 0.04 0.06 0.01
La mg/kg 0.5 0 10.1 24.4 30.6 38.6 75.8 10.5
Li mg/kg 1 0 3 18 24 30 72 9.0
Mn mg/kg 5 0 63 365 493 632 1820 206
Mo mg/kg 0.05 0 0.15 0.63 0.96 1.43 7.38 0.53
Nb mg/kg 0.1 0 1.5 5.9 7.7 9.4 25.8 2.7
Ni mg/kg 0.5 0 1.7 11.6 14.5 17.5 57.1 4.4
P mg/kg 50 0 150 670 860 1090 8590 296
Pb mg/kg 0.5 0 10.8 16.8 19.3 21.6 32 3.6
Rb mg/kg 0.2 0 40.9 66.0 79.1 91.5 125 18.9
Sb mg/kg 0.05 0 0.09 0.41 0.54 0.68 2.53 0.19
Sc mg/kg 0.1 0 1.5 5.6 6.7 8.4 15.4 2.2
Se mg/kg 0.2 87 <0.2 <0.2 <0.2 0.3 4.2 0
Sn mg/kg 0.1 0 0.6 1.1 1.3 1.6 2.8 0.45
Sr mg/kg 0.5 0 50.1 118 183 416 706 134
Te mg/kg 0.1 139 <0.1 <0.1 <0.1 <0.1 <0.1 0
Th mg/kg 0.2 0 4.5 7.5 9.4 11.1 32.5 2.8
Tl mg/kg 0.1 0 0.2 0.4 0.5 0.6 1.5 0.15
U mg/kg 0.1 0 0.8 1.7 2.1 2.6 9.6 0.59
V mg/kg 1 0 8 42 55 69 196 21
W mg/kg 0.1 0 0.1 0.6 0.8 1.1 6.9 0.3
Y mg/kg 0.1 0 3.4 12.6 14.5 16.4 45.3 2.8
Zn mg/kg 1 0 15 44 57 71 210 20.8
Total C % NA 0 0.16 0.89 1.74 3.35 16.1 14.38
Carbonate C % 0.003 10 <0.0030 0.01 0.19 0.83 3.28 0.27
Organic C % NA 0 0.16 0.52 0.93 2.65 16.04 0.85
Total N % NA 0 0.0036 0.077 0.11 0.26 1.10 0.080 1 Min = minimum, Max = maximum.
2 Q1 = first quartile, Q3 = third quartile.
3 MAD = Median absolute deviation.

53
Figure 17. Distribution of organic carbon (percent) in soils collected from a depth of 0–5 cm in the WLCI study area.
Pr oduc ts Completed i n FY2009
Geochemical data set listing determinations for the following 47 parameters from 139
samples of soil collected from a depth of 0–5 cm within the WLCI original study area:
Al, As, Ba, Be, Bi, Ca, Cd, Ce, Co, Cr, carbonate C, Cu, organic C, Fe, Ga, Hg, In, K,
La, Li, Mg, Mn, Mo, Na, Nb, Ni, P, Pb, Rb, S, Sb, Sc, Se, Sn, Sr, Th, Ti, Tl, U, V, W,
Y, Zn, total N, soil pH, electrical conductivity, and sodium adsorption ratio.
Forty-seven geochemical maps showing the abundance and spatial distribution within
the original WLCI study area for all 47 soil parameters in the database described in the
bullet above.
Exploratory data analysis plots, including histograms, Tukey boxplots, empirical
cumulative distribution function plots, and quantile-quantile plots for the following
parameters from 0–5-cm soils collected within the original WLCI study area: Al, As,
Ba, Be, Bi, Ca, Cd, Ce, Co, Cr, carbonate C, Cu, organic C, Fe, Ga, Hg, In, K, La, Li,
Mg, Mn, Mo, Na, Nb, Ni, P, Pb, Rb, S, Sb, Sc, Se, Sn, Sr, Th, Ti, Tl, U, V, W, Y, and
Zn.

54
Box-and-whisker plots comparing geochemical data on 0–5-cm soils from the original
WLCI study area to similar data from two transects across the United States and Canada
for the parameters As, Ca, Cd, Cu, Hg, Pb, Sb, and Tl.
Long-term Monitoring of Surface Water and Groundwater Hydrology
St atus
Ongoing
Contac t
Kirk Miller; 307-775-9168; [email protected]
Scope and Methods
Data from long-term monitoring of surface-water and groundwater resources are needed for
assessing riparian and aquatic ecosystems in the context of changes in land use, land cover, and
climate. Monitoring of surface-water quality will be conducted at one site partially funded by
WLCI. Data will be collected according to USGS methods (U.S. Geological Survey, variously
dated; Wagner and others, 2006). Monitoring of groundwater levels will be conducted at one site
partially funded by WLCI.
Wil Sadler measuring streamflow at USGS 09258980 Muddy Creek stream gage and water-quality monitoring site below Young Draw near Baggs, Wyoming, April 2008.
Cooperator: U.S. Bureau of Land Management.

55
Objec t i ves
Collect and publish monthly water-quality samples for 09217000 Green River near
Green River, Wyo. (USGS NWISWeb; U.S. Geological Survey, variously dated).
Provide publicly accessible, (USGS NWISWeb) seasonal, real-time water temperature,
specific conductance, and computed total dissolved solids concentrations for 09217000
Green River near Green River, Wyo., and computed total dissolved solids
concentrations for 09258980 Muddy Creek below Young Draw near Baggs, Wyo.
Publish seasonal daily water temperature and specific conductance for 09217000 Green
River near Green River, Wyo. (USGS NWISWeb; U.S. Geological Survey, variously
dated).
Provide publicly accessible (USGS NWISWeb) real-time water-level data for the
413850109150601 19-105-10bbb01 Rock Springs site, Rock Springs, Wyo.
Wor k Ac compl i shed and Findings
Monitoring of surface-water quality was conducted at one site partially funded by WLCI.
Data from 2008 were published in the USGS Annual Water-Data Report in 2009 (U.S. Geological
Survey, variously dated) and 2009 data were collected. Preliminary 2009 data were made available
online in real-time (USGS NWISWeb). A USGS report describing water-quality characteristics and
statistical relations at two sites was published in 2009 (Clark and Davidson, 2009).
Monitoring of groundwater levels was conducted at one site partially funded by WLCI.
Data from 2008 were published in the USGS Annual Water-Data Report in 2009 (U.S. Geological
Survey, variously dated) and 2009 data were collected. Preliminary 2009 data were made available
online in real-time (USGS NWISWeb).
St udy Area
Figure 18 shows the monitoring locations for surface-water quality and groundwater levels
(see the Surface Water and Groundwater Hydrology section in appendix 1 for a map of all current
streamflow and reservoir gages and water-quality monitoring sites located within the WLCI
region).
Pr oduc ts Completed
Clark, M.L., and Davidson, S.L., 2009, Specific conductance and dissolved-solids
characteristics for the Green River and Muddy Creek, Wyoming, water years 1999–2008: U.S.
Geological Survey Scientific Investigations Report 2009–5168, 18 p., available online at
http://pubs.usgs.gov/sir/2009/5168/ (see fig. 19).
U.S. Geological Survey, variously dated [see 2009], Water-resources data for the United States,
Water Year 2008: U.S. Geological Survey Water-Data Report WDR-US-2008, at
http://wdr.water.usgs.gov/.

56
Figure 18. Location and station identifiers of surface-water-quality and groundwater-level monitoring sites within the WLCI study area.

57
Figure 19. National Water Information System data portal showing data for stream gage USGS 09217000 near Green River, Wyo.

58
Summary: Effectiveness Monitoring of Habitat Treatments
Federal, State, industry, and nongovernmental organizations have been funding habitat
improvement treatments across southwestern Wyoming. A primary goal of the WLCI is to monitor
and assess the effectiveness of these treatments at individual sites and evaluate their effectiveness
in meeting landscape-level conservation goals, such as connecting fragmented habitats. This work
is intended to help guide the design and development of future habitat treatments and to improve
the ability of these treatments to meet WLCI landscape conservation objectives.
Effectiveness Monitoring includes measuring vegetation and soil responses to treatments,
developing methods for using remotely sensed estimates of plant productivity to evaluate habitat
treatments, and investigating relations between energy development and soil and surface-water
salinity. As part of the USGS WLCI effectiveness-monitoring effort, information is collected to
assess the effectiveness of a range of habitat treatments (for example, applying herbicide to
sagebrush or thinning aspen stands). Existing data associated with past and current habitat
treatments have been acquired and evaluated to assess their effectiveness in meeting WLCI
conservation goals. Assessments entail comparing historical treatments of different ages as well as
before-and-after comparisons of new treatments. Effectiveness is being measured on the basis of
multiple factors, including species composition and cover, bare soil cover, forestry metrics (aspen),
and biotic and abiotic properties of soils. In addition, researchers are collaborating with scientists
working on projects funded by other sources to ascertain the effects of habitat treatments on
wildlife use (for example, greater sage-grouse and elk [Cervus elaphus]), which is an essential
measure of success resulting from individual and cumulative habitat treatments.
Overall objectives of the effectiveness monitoring are to
inventory and evaluate the effectiveness of past habitat treatments to help guide the
design of future habitat treatments and BMPs;
develop strategies, approaches, and designs for conducting effectiveness monitoring on
conservation projects and enhancements conducted as part of the WLCI; and
initiate effectiveness monitoring on WLCI conservation projects conducted in 2007–
2009 and pre-treatment monitoring of habitat treatments funded in 2010.
In FY2009, eight effectiveness-monitoring tasks were conducted: (1) Applying Greenness Indices
to Evaluate Sagebrush Treatments in the WLCI Region, (2) Greater Sage-Grouse Utilization of
Vegetation Treatment Sites, (3) Occurrence of Cheatgrass Associated with Habitat Projects in the
Little Mountain Ecosystem Area, (4) Application and Feasibility of Mapping Aspen Stands and
Conifer Encroachment Using Classification and Regression Tree (CART) Analysis for Effectiveness
Monitoring, (5) Aspen Regeneration Associated with Mechanical Removal of Subalpine Fir, (6)
Herbivory, Stand Condition, and Regeneration Rates of Aspen on Burned and Unburned Plots For
Effectiveness Monitoring, (7) Use of Aspen Stands by Migrant Birds for Effectiveness Monitoring,
and (8) Soil Chemistry: Relationships between Energy Exploration/Development and Salinity of
Soils and Waters. These tasks are detailed in the sections that follow.
59
Applying Greenness Indices to Evaluate Sagebrush Treatments in the WLCI Region
St atus
Ongoing
Contac t s
Geneva W. Chong; 307-733-9212 x5; [email protected]
Patrick J. Anderson; 970-226-9488; [email protected]
Scope and Methods
As climate change (for example, warmer temperatures, earlier snow melt) affects
vegetation, we may expect plant phenology to shift, possibly making forage for elk, sage-grouse,
other wildlife species, and livestock available earlier in the growing season, but also potentially
resulting in earlier senescence and reduced overall forage production (warmer and drier climate
scenario). Because early, rapid green-up can influence wildlife habitat use (for example, it can
influence elk movements or sage-grouse activities), it could be an important seasonal indicator of
habitat condition in treated or untreated areas, or it could be used as an indicator of when to stop
feeding elk on state feedgrounds in the Green River Basin, where shorter feeding seasons are
associated with reduced incidence of brucellosis (Cross and others, 2007).
An important tool for evaluating habitat condition and treatments is the NDVI measure of
greenness, which can be acquired by satellite over large areas at relatively coarse scales. The NDVI
method, however, could miss the fine-scale, rapid green-up that follows snow-free days. On-the-
ground measurement by near-surface sensing platforms can target green-up of specific plant species
(for example, perennial grasses or shrubs) or features (for example, bare soil, where green-up by
annuals, including weeds, may occur) that remote sensing cannot target, including species that may
be more or less palatable and, thus, more or less likely to provide forage for animal species of
interest.
Objec t i ves
Evaluate plant species composition and structure and abiotic characteristics (for
example, bare soil) within historic sagebrush treatment areas by using stratified random
sampling with multi-scale circular plots. Compare treated and control areas.
Evaluate ecosystem function (for example, greenness indices of productivity) using
near-surface and remote-sensing platforms. Compare treated and control areas.
Work with BLM Field Offices to facilitate transfers of technology transfer as sampling
and monitoring approaches are tested and refined. For example, correlations between
near-surface and remotely-sensed greenness data, combined with ground-truthed data,
can be used to alert managers to rapid green-up of non-native species such as
cheatgrass. Similar data could be used to assess revegetation and habitat-improvement
treatments for effectiveness (desired species composition and cover). ―Automated‖
approaches could greatly reduce the need for field checking and greatly increase
accuracy.
Coordinate with WLCI partners to select sample sites for monitoring in FY2010.

60
0 10 20
191
80
0 10 20
Plan for a Jonah Field cheatgrass-detection pilot project and cheatgrass-treatment
effectiveness monitoring to be initiated in FY2010. (A portion of the Fall Creek
Feedground study area is slated for a cheatgrass-control treatment.)
St udy Area
Field sampling in FY2009 was focused on the vicinity of Fall Creek Feedground near
Pinedale, Wyo. (fig. 20). Previous sagebrush vegetation treatments included prescribed burning and
herbicide application (fig. 21). A cheatgrass control project is scheduled for 2010, and USGS is
coordinating with the BLM Pinedale Field Office to monitor the effects of the herbicide treatments
(Deej Brown, oral commun., 2009, Natural Resource Specialist/Reclamation/Weed Management
Coordinator, Jonah Interagency Office Mitigation Team, December, 2009). We are also
coordinating with elk-movement researchers (using GPS collars scheduled to drop off in February
2010) to determine if elk movement can be correlated with vegetation green-up at a local scale
(Paul Cross, oral commun. 2009, Disease Ecologist, USGS Northern Rocky Mountain Science
Center).
Figure 20. Locations of effectiveness monitoring for past and current habitat (sagebrush and aspen) treatments and Muddy Creek soil sampling.

61
W o r k A c c o m p l i s h e d i n F Y 2 0 0 9 a n d F i n d i n g s
Fifty multi-scale, circular vegetation plots (Barnett and others, 2007) were established in the vicinity of the Fall Creek Feedground (including areas treated with burning and herbicide), and may be treated with herbicide in the future to control cheatgrass (fig. 21). In addition, 20 near-surface sensor platforms (“mantis”) were tested and prepared for installation in spring 2010 (fig. 22) to capture green-up following snowmelt in early 2010 (test platforms were deployed in the area during 2009 but were not left over winter). Mantis platforms can also provide automated vegetation “sampling” for monitoring. Correlations between near-surface green-up and remotely sensed green-up will be evaluated in an effort to maximize the utility of multi-scale sampling (plot to satellite) and to provide a true application of ecological scaling (in collaboration with Robert Klaver and other scientists from the USGS EROS center). All vegetation plot data (for example, plant species cover and height and the cover of abiotic variables, such as soil) are maintained in an MSAccess database. All plots were photographed. Vegetation composition, structure, and phenology data may be used to help managers evaluate the effectiveness of treatments ranging from control of non-native species (for example, cheatgrass) to reclamation of well pads and habitat projects (designed to benefit wildlife) to elk feedground management.
Figure 21. Sample plot locations for 2009 in the vicinity of Fall Creek Elk Feedground (yellow) in relation to prescribed burns (red) and herbicide treatments (green).

62
Figure 22. Effectiveness monitoring of vegetation treatments around the Fall Creek Elk Feedground is coordinated with other research programs that include a U.S. Geological Survey National Wildlife Climate Change Science Center study. The monitoring work is designed to examine correlations between timing and location of elk movement in conjunction with vegetation green-up, the effects of herbicide and prescribed burn treatments on plant species composition and structure (cover and height by species), and the effects of herbicide application in controlling cheatgrass (scheduled for 2010; collaboration with Deej Brown, BLM Pinedale Field Office). (A) Vegetation sampling points around the Fall Creek Feedground (yellow boundary); treatments include herbicide (blue boundaries) and prescribed burn (red boundaries) (map made by T.J. Assal, Arctic Slope Regional Corporation management services). (B) A ―mantis‖ near-surface sensor undergoing reflectance calibration (white square); the sensor platform logs soil and air temperature data and two reflectance bands (photo by David Kesonie, Contractor to USGS). (C) Example mantis near-surface vegetation reflectance data from two platforms (F1 and C1); surface greenness (NDVI) is plotted against day of year to indicate when green-up initiates (day 168), and the bar graph indicates the number of valid observations for 10 days (days 168–178). Data from 8 of the 10 days were valid (relatively cloud free) (Heidi Steltzer, Asst. Professor, Ft. Lewis College, Durango, Colo.; unpubl. data).
2001 NAPP imagery
A
Day of year
150 155 160 165 170 175 180
Surf
ace g
reenness (
ND
VI)
0.25
0.30
0.35
0.40
0.45
0.50
0.55
0.60
SAG SAG
Day of year
168 170 172 174 176 178
Num
ber
of observ
ations
0
10
20
30
40
50
60
F1
C1
C B
A

63
Based on the effectiveness monitoring of treatments on the Pinedale Anticline in 2008, in
general the effects of treatments to reduce sagebrush height and cover persist over time. In some
cases, this also results in persistent increased cover of bare soil between treatments and controls
(fig. 23). Sampling on the Rock Creek Prescribed Burn (Kemmerer Field Office) showed
significant decreases in sagebrush height and cover and organic ground cover three years post-burn.
From what we could evaluate, some of the burn objectives are on a trajectory to be met relatively
quickly (Abendroth, 2007). In both general study areas, non-native species cover was not extensive
and richness was not high.
Pr oduc ts Completed i n FY2009
MSAccess database with 50 multi-scale vegetation plots.
Plot photos (digital).
Constructed 20 ―mantis‖ near-surface sensing platforms.
Established and sampled 6 phenology plots (multiple visits throughout the 2009
growing season).
Summarized effectiveness monitoring data from 2008 (Pinedale Anticline treatments
and Rock Creek Allotment/Fossil Butte National Monument Prescribed Burn: Prepared
by David Kesonie, contracted to USGS; unpubl. data; example provided below).
Figure 23. Area where Pinedale Anticline herbicide application took place (in 1960) and was sampled in 2008. Sagebrush cover was 27 percent (control) versus 16 percent (treatment); sagebrush height was 28 cm (control) versus 24 cm (treatment); and soil cover was 23 percent (control) versus 56 percent (treatment; P-value less than 0.01).
64
Greater Sage-Grouse Use of Vegetation Treatment Sites
St atus
New in FY2009
Contac t s
Patrick J. Anderson; 970-226-9488; [email protected]
Geneva W. Chong; 307-733-9212 x5; [email protected]
Scope and Methods
During 2009, the greater sage-grouse use of vegetation treatment sites study entailed
documenting sage-grouse use of vegetation treatments in the Moxa Arch gas field near Granger,
Wyo., and conducting a preliminary assessment of sage-grouse nesting and early brood-rearing
habitat associated with prescribed burns in the Little Mountain Ecosystem south of Rock Springs.
Members of LPDTs expressed an interest in these and similar projects to determine long-term sage-
grouse use and to support better treatment designs.
Moxa Arch Treatments—As part of the BLM ―Moxa Arch Pronghorn Habitat & Livestock
Forage Mitigation Plan‖, numerous vegetation treatments (referred to as the Moxa Arch
Treatments) were conducted in 1997 and 1998. The goal of these treatments was to mitigate the
effects of development on habitat and forage by creating a mosaic of sagebrush stands in different
seral stages. Treatments were conducted within upland habitats dominated by Wyoming big
sagebrush that represented areas selected by sage-grouse for nesting and early brood rearing.
Vegetation surveys of areas treated with mowing and tebuthiuron were conducted in June of 2008
to ascertain potential short- and long-term effects of these treatments on nesting and early brood-
rearing habitat suitability for sage-grouse (Holloran, 2009). Holloran (2009) concluded that the
herbaceous response in mowed treatment areas may be suitable for enhancing nesting and early
brood-rearing habitats in the long term, especially at locations with loamy soils, and that the
tebuthiuron applications at similar sites should be avoided because of the propensity to increase
invasive forb cover at these sites. During 2009, some of the mowing and tebuthiuron treatments
were selected by USGS to establish long-term monitoring of sage-grouse use and to evaluate the
role of patch size, patch shape, distance to edge within a patch, and patch distance to lek (an
assembly area for communal courtship display) or nesting habitat. This information will be used to
help develop more effective treatments to support sage-grouse during brood rearing. Sampling of
the Moxa Arch treatments will continue during 2010.
Little Mountain Ecosystem Burn Treatments—Since 1990, numerous restoration and
enhancement projects have been implemented in the Little Mountain Ecosystem area south of Rock
Springs (fig. 20). Many of these projects involved prescribed fire to reduce sagebrush cover,
increase herbaceous cover, and retard the expansion of junipers (Juniperus spp.) into sagebrush.
Geospatial information for these treatment areas and wildfires were obtained by the BLM Rock
Springs Field Office. Preliminary surveys were conducted between August and September of 2009
at burned areas and adjacent unburned areas to determine suitable habitat for sage-grouse nesting or
brood rearing. Locations with suitable habitat were documented. This information will be used to
select study sites during 2010 to evaluate sage-grouse use of burn treatments during brood rearing.

65
Objec t i ves
Assess the treatments of sage-grouse habitats and their ability to maintain or increase
sage-grouse distribution.
Evaluate use of sagebrush vegetation treatments by sage-grouse during early and late
brood-rearing periods.
Determine differences in use by sage-grouse between sagebrush areas treated with
herbicides, mowing, or prescription burning.
Evaluate the spatial and temporal relationship between placement of vegetation
treatments and the centers of sage-grouse activity.
Evaluate sage-grouse habitat use with respect to distance from nearest road, well pad, or
other related infrastructure.
Evaluate how patch size, shape, and distribution influence the use of treatment sites by
sage-grouse.
Evaluate sage-grouse use of a treatment areas and distance to the edge of a given
treatment area.
Correlate vegetative structure with sage-grouse pellet counts.
St udy Areas
Moxa Arch Treatments—The seven Moxa Arch treatment areas are located within the
expanded Moxa Arch Area Natural Gas Development project area in southwestern Wyoming
(south of Kemmerer, Wyo.) (fig. 20). Tebuthiuron applications and mowing treatments at Zeigler‘s
Wash and Cow Hollow were selected for this study. The location of these treatment areas are
situated between the towns of Opal and Granger, Wyo. (fig. 22). The Zeigler‘s Wash tebuthiuron
application, the Cow Hollow tebuthiuron application, and the Cow Hollow mow occurred during
October 1997. The Zeigler‘s Wash mow occurred during January 1997. The dominant shrub
associated with these areas is Wyoming big sagebrush followed by a mix of smaller shrubs and
common forbs. Crested wheatgrass (Agropyron cristatum) and halogeton (Halogeton glomeratus)
were predominantly observed on tebuthiuron sites. Well pads, roads, and related infrastructure
existed within or near (less than 500 m from) treatment locations.
Little Mountain Ecosystem Burn Treatments—This study focuses on prescribed burns in the
Little Mountain Ecosystem (figs. 20, 24) where mountain sagebrush (A. t. vaseyana) is dominant or
where juniper distribution has encroached into mountain-sagebrush communities. Burn treatments
were implemented to create a mosaic of patches in larger sagebrush areas and to improve nesting
and early and late brood-rearing habitat for sage-grouse. Similar to the Moxa Arch treatment area,
smaller shrubs, grasses, and forbs are common. Several non-native grass and forb species are found
in the general area including cheatgrass.
Wor k Ac compl i shed in FY2009 and Findings
Moxa Arch Treatments—Both treatment and control sites were assessed for sage-grouse
seasonal habitat use using pellet counts within a 4- by 100-m belt transect. Forty-four belt transects
were established at the Zeigler‘s Wash and Cow Hollow tebuthiurons, mowed treatment sites, and
at adjacent untreated sites during late May 2009. The survey design included the ability to evaluate

66
SWEETWATER
191
80
108°30'W109°W109°30'W
41°30'N
41°N
the edge preference of sage-grouse by randomly locating belt transects within 30 m of the treatment
edge or greater than 60 m from the treatment edge. Belt transects at untreated locations were
randomly located within 150 m from the treatment areas. All treatments and belt transects were
located on BLM land. All pellets within the belt transect and an additional half meter beyond the
belt transect were removed at this time. No effort was made to count pellets since seasonal use
could not be ascertained. Pellet count surveys were conducted twice to characterize early and late
brood rearing and summer use. The first survey was conducted between June 30 and July 7, 2009,
and the second survey was conducted between August 29 and September 3, 2009. Individual
foraging pellets, roost piles, hen clockers (large droppings voided by hens after sitting for long
periods on a nest, often voided not far from the nest), and ceacal casts (dark-colored, semi-liquid
scat, usually voided in the mornings) were counted within each belt transect. All pellets within the
transect area were collected and removed during each survey.
Little Mountain Ecosystem Burn Treatments—Preliminary surveys were conducted between
August and September 2009 at burned treatments and adjacent unburned areas to determine
suitable habitat for sage-grouse nesting or brood rearing. Survey locations were recorded by using a
GPS unit (where suitable). This information will be used to select study sites during 2010 to
evaluate sage-grouse use of burn treatments during brood rearing.
Figure 24. Little Mountain ecosystem study area, where more than 2 million dollars was spent on habitat restoration activities since 1990. The USGS is determining the effectiveness of some of these restoration activities by evaluating aspen regeneration potential, impacts of herbivory on aspen, use of treatment areas by sage-grouse and migrant songbirds, and the ability of burned treatments to resist cheatgrass and other invasive species.

67
Pr oduc ts Completed i n FY2009
Geospatial data of monitoring transects and photo points.
Occurrence of Cheatgrass Associated with Habitat Projects in the Little Mountain Ecosystem Area
St atus
Ongoing
Contac t
Patrick J. Anderson; 970-226-9488; [email protected]
Daniel Manier; 970-226-9466; [email protected]
Scope and Methods
The spread of cheatgrass was identified by LPDTs as a serious threat and a high priority for
WLCI managers. Team members also wanted to know whether past habitat treatments were
effective in restoring ecological function and stability. This is of particular interest in areas with
potential for cheatgrass invasion, because treatments could promote systemic resistance to
cheatgrass invasion or could lead to greatly reduced habitat quality. Wildfires and prescribed burns
have been linked with the expansion of cheatgrass in similar systems in the Great Basin; however,
in some situations burning has been documented to support more stable plant communities that
resist cheatgrass and other invasive plant species (Shinneman and Baker, 2009). Differentiating
effective and ineffective treatments based on environmental and management conditions should
help alleviate concerns about similar habitat projects (especially prescribed burns) in the future by
providing the needed feedback on the effectiveness of previous efforts.
Since 1990, numerous restoration and enhancement projects have been implemented in the
Little Mountain Ecosystem area. Many of these projects involved prescribed burns to reduce
sagebrush cover and increase herbaceous cover, retard the expansion of junipers into sagebrush,
and reduce conifer encroachment in aspen stands. To address these questions about the role of
habitat treatments in the occurrence and distribution of cheatgrass in the Little Mountain
ecosystem, we sampled vegetation within a representative sample of former treatments. Long,
narrow belt-transects (fig. 25) were randomly distributed across burn treatments using a
stratification of size classes (table 3). The field protocols are based on another ongoing USGS study
to model invasive species and major disturbance features across Southwest Wyoming. By
incorporating theses protocols, it will be possible to compare the distribution of cheatgrass in burn
areas to the distribution of weeds across the region and other disturbance features in Southwest
Wyoming. The original method protocol was augmented to include soil sampling (for determining
soil texture) and documenting the presence of biological soil crusts. Biological soil crusts, which
can be disturbed through burning, are thought to help resist invasive species; therefore, a lack of
crust may be associated with increased invasion potential. A second component of this research is
assessing the ability of biological soil crusts to resist cheatgrass at unburned sites. Six long term
multi-scale plots (5 × 10 m) were established in Little Fire Hole Canyon south of Rock Springs
where cheatgrass has expanded in the last five years. During 2010, cover and frequency of
biological soil crusts and cheatgrass will be recorded. Measurements will be repeated in subsequent
years to track trends associated with the interaction between biological soil crusts and cheatgrass.
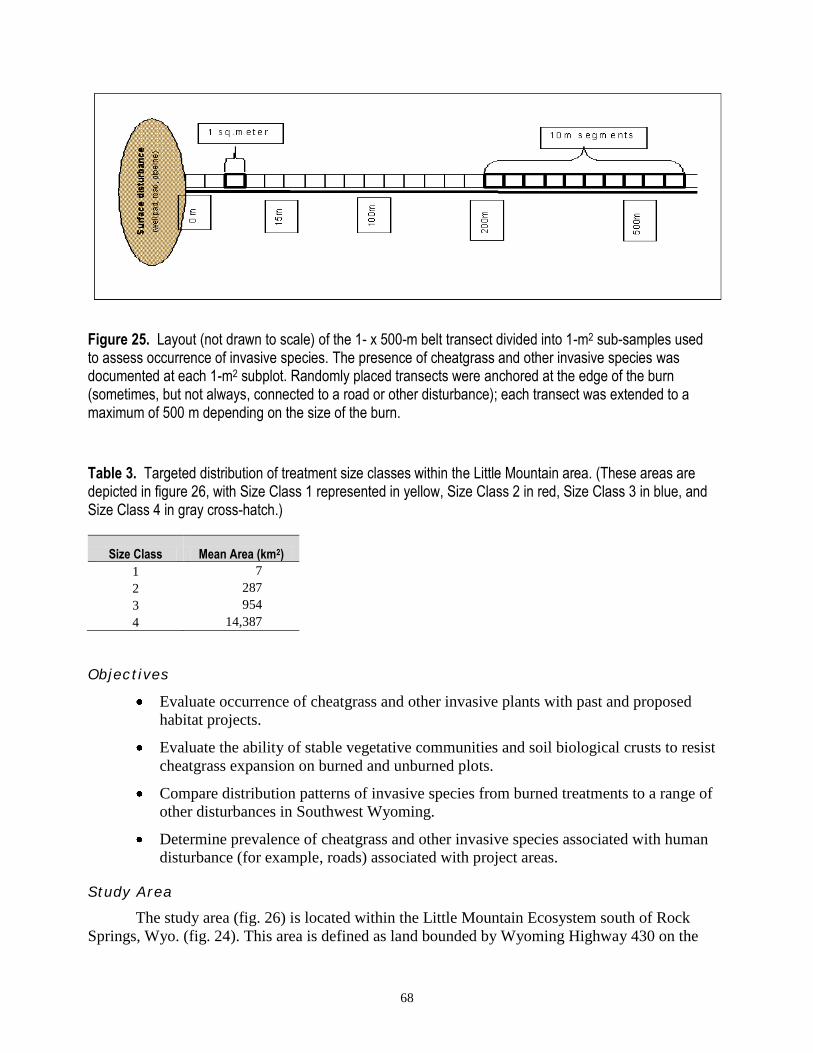
68
Figure 25. Layout (not drawn to scale) of the 1- x 500-m belt transect divided into 1-m2 sub-samples used to assess occurrence of invasive species. The presence of cheatgrass and other invasive species was documented at each 1-m2 subplot. Randomly placed transects were anchored at the edge of the burn (sometimes, but not always, connected to a road or other disturbance); each transect was extended to a maximum of 500 m depending on the size of the burn.
Table 3. Targeted distribution of treatment size classes within the Little Mountain area. (These areas are depicted in figure 26, with Size Class 1 represented in yellow, Size Class 2 in red, Size Class 3 in blue, and Size Class 4 in gray cross-hatch.)
Size Class Mean Area (km2)
1 7
2 287
3 954
4 14,387
Objec t i ves
Evaluate occurrence of cheatgrass and other invasive plants with past and proposed
habitat projects.
Evaluate the ability of stable vegetative communities and soil biological crusts to resist
cheatgrass expansion on burned and unburned plots.
Compare distribution patterns of invasive species from burned treatments to a range of
other disturbances in Southwest Wyoming.
Determine prevalence of cheatgrass and other invasive species associated with human
disturbance (for example, roads) associated with project areas.
St udy Area
The study area (fig. 26) is located within the Little Mountain Ecosystem south of Rock
Springs, Wyo. (fig. 24). This area is defined as land bounded by Wyoming Highway 430 on the
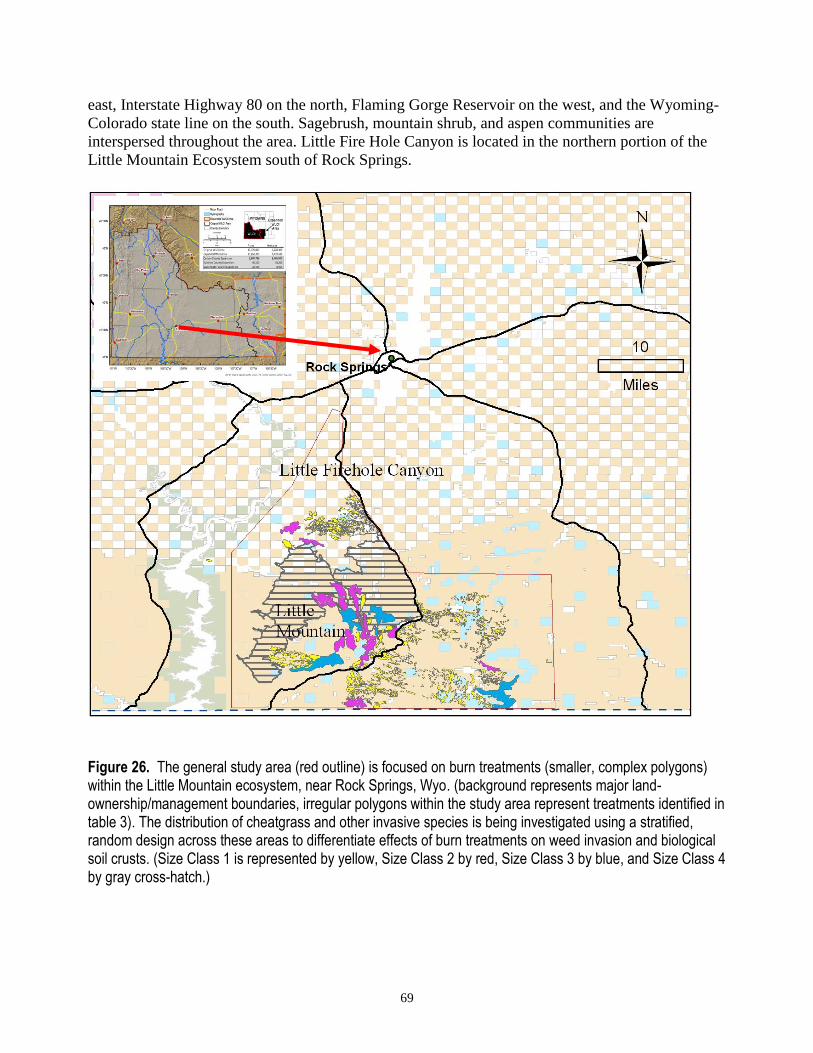
69
east, Interstate Highway 80 on the north, Flaming Gorge Reservoir on the west, and the Wyoming-
Colorado state line on the south. Sagebrush, mountain shrub, and aspen communities are
interspersed throughout the area. Little Fire Hole Canyon is located in the northern portion of the
Little Mountain Ecosystem south of Rock Springs.
Figure 26. The general study area (red outline) is focused on burn treatments (smaller, complex polygons) within the Little Mountain ecosystem, near Rock Springs, Wyo. (background represents major land-ownership/management boundaries, irregular polygons within the study area represent treatments identified in table 3). The distribution of cheatgrass and other invasive species is being investigated using a stratified, random design across these areas to differentiate effects of burn treatments on weed invasion and biological soil crusts. (Size Class 1 is represented by yellow, Size Class 2 by red, Size Class 3 by blue, and Size Class 4 by gray cross-hatch.)

70
Wor k Ac compl i shed in FY2009 and Findings
A detailed observation of emergent, mature, and senescent plants from a priority list of 35
species occurring on state and county weed lists was conducted on 23 belt transects randomly
located on burned sites. Each 1 × 500-m belt transect was divided into 1-m2 subplots for a
maximum of 200 subsamples (fig. 25). One end of the belt transect was anchored to the edge of the
treatment site and extended along a randomly established azimuth through the burned area.
Transect length varied with the size of the burned area with the maximum transect length being 500
m. Biological soil crusts were documented at each 1-m2 subplot for10 transects. Data represent
presence as well as confirmed absence of invasive species and biological soil crusts. General
observations of the dominant vegetation and proximity to human land-use features (for example,
roads) were made in the field. Locations and photos were taken by GPS at the beginning and end of
each transect. Soil samples were randomly collected to a depth of 10 cm along each transect to
determine soil texture.
Maps and other information regarding distributions of biological soil crusts are lacking for
the WLCI area. To accommodate this, numerous locations were surveyed in the Little Fire Hole
Canyon for the presence of biological soil crusts with similar plant species, vegetation cover, and
the presence of cheatgrass at or near the crusts. Fifteen locations matching these criteria were
mapped. Six multi-scale plots were randomly selected from the fifteen locations. Plot locations
were placed and photographed. Cover estimates for biological soil crusts, cheatgrass, and other
native and introduced species will be conducted during the 2010 field season.
Pr oduc ts Completed i n FY2009
Spatial data associated with monitoring transects and photo points.
List of invasive species recorded along transects and nearby human-made disturbance
features.
Application and Feasibility of Mapping Aspen Stands and Conifer Encroachment Using Classification and Regression Tree (CART) Analysis for Effectiveness Monitoring
St atus
Ongoing
Contac t
Tim Assal; 970-226-9134; [email protected]
Patrick J. Anderson; 970-226-9488; [email protected]
Scope and Methods
The WLCI has supported numerous aspen treatments between 2007 and 2009 in the Sierra
Madre Range to reduce conifer encroachment and to increase aspen regeneration. Treatment
locations were prioritized and selected by WLCI partners and participants of the Little Snake River
Aspen Joint Venture. The process used to select treatment areas was based on local knowledge and
information associated with other habitat projects and stewardship projects being implemented in
the area. The ability to prioritize locations for future treatments is dependent on geospatial
information and data that include aspen and conifer canopy cover, digital elevation models and

71
other land-facet-related metrics. LANDFIRE and ReGAP are considered the best spatial map
products that predict aspen locations at regional and landscape scales; however, these products
were not designed to support decisions at finer scales such as the area defined in this study (fig. 27).
To support the prioritization and location of future aspen treatments we have collected temporal,
remotely sensed imagery and ancillary spatial data. In addition, we are evaluating the application
and feasibility of detecting aspen stands using classification and regression tree (CART) analysis to
determine if this approach can be applied to inform selection of aspen treatments in other areas of
Southwest Wyoming. We will focus on evaluating the minimum mapping unit, minimum aspen
patch size, and level of conifer encroachment that can be mapped.
Objec t i ves
Provide land managers and WLCI Local Project Development Teams with empirical
spatial information and map products on aspen communities to support the prioritization
and implementation of aspen treatments across the study area.
Evaluate temporal dynamics of aspen communities using Landsat Thematic data and
topographic land-facet1 variables.
Evaluate the application and feasibility of detecting aspen stands and conifer (subalpine
fir and lodgepole pine [Pinus contorta]) encroachment using CART analysis with
Landsat imagery.
Determine the relationship of aspen communities (both pure aspen stands and mixed
aspen conifer stands) with multiple landscape variables using CART analysis.
Describe different levels of conifer encroachment into aspen stands with respect to
canopy cover classes, stand structure, and aspen vegetative reproduction.
St udy Area
The preliminary study area, located in the Little Snake River Basin (fig. 20), includes the
north and west slopes of the Sierra Madre Range along a 300-m band of elevations ranging from
2,260–2,560 m (fig. 27). The east side of the study area is bounded by the continental divide. Initial
fieldwork has indicated that conifer species and related vegetation communities dominate at
elevations greater than 2,560 m, although there are pure stands of subalpine fir (Abies lasiocarpa)
and lodgepole pine that exist below this elevation. Large contiguous stands of aspen are at risk of
being excluded by the expansion and encroachment of subalpine fir. Encroached aspen stands are
characterized by subalpine fir and, to a lesser extent, by lodgepole pines that are less than 110 years
(yr) old with understories of shade-tolerant herbaceous species. Land ownership in the study area is
primarily federal (Medicine Bow National Forest) with some private and state lands.
Wor k Ac compl i shed and Findings
During 2008, we met with partners associated with the WLCI and the Little Snake Aspen
Joint Venture to discuss science and geospatial needs. During 2009, we developed the project study
area based on the science and geospatial needs identified by partners, preliminary field
investigation, and modeling protocol. A qualitative assessment of herbaceous vegetation was
1 A land facet is the simplest unit of terrain characterized by uniform slope, parent material, soils, and hydrology, as
identified by aerial patterns.

72
107°W107°15'W107°30'W107°45'W108°W108°15'W
41°45'N
41°30'N
41°15'N
41°N
Figure 27. Project study area located on the western slope of the Sierra Madre Range, Carbon County, Wyoming.
conducted between the elevations of 2,400 and 2,800 m as a means of delineating the upper
boundary of encroaching conifer species (Dillon and others, 2005). Landsat imagery was reviewed
for desired temporal dates and for occurrence of cloud and snow cover. The application of selecting
temporal dates followed the approach described by Bergen and Dronova (2007), who used
phenology periods associated with leaf-on and leaf-off periods to distinguish aspen stands from
conifer stands. Intra-annual Landsat imagery that meet cloud- and snow-cover criteria for the entire
study area were acquired. Ancillary data to be used as covariate inputs (for example, elevation,
slope, aspect, landscape indices) in the modeling process also were acquired and processed. A data
set of aspen and conifer stands was acquired from aerial photography and field investigation to
support the training of imagery data.
Pr oduc ts Completed
Geospatial map of study area with WLCI-funded aspen treatments shown.
Geospatial database and documentation of Landsat data and ancillary GIS data.
Ground-truthed data set of aspen and conifer stands from aerial photography and field
investigation.
73
Aspen Regeneration Associated with Mechanical Removal of Subalpine Fir
St atus
Ongoing
Contac t
Patrick J. Anderson; 970-226-9488; [email protected]
Scope and Methods
The WLCI has supported numerous aspen treatments in the Sierra Madre Range to reduce
conifer encroachment and to increase aspen regeneration. Specifically, mechanical removal of
subalpine fir and dying lodgepole pine has taken place on approximately 100 acres in the Medicine
Bow National Forest. Partners of the WLCI identified many questions about the responses of aspen,
soil chemistry, under-canopy vegetation, and invasive species associated with this habitat project.
To address these and similar questions, the USGS developed a study during the summer of 2008 to
investigate aspen-recovery rates and to document how soil chemistry and under-canopy vegetation
change after mechanical treatments. This study also was designed to evaluate trends associated with
long-term encroachment by conifers and how that may influence aspen and under-canopy
vegetation recovery. Aspen sucker density and growth rate from this treatment site will be
compared with other aspen restoration projects being conducted in the WLCI area. This
information will be used to develop an index that will help establish objectives for future aspen
projects.
Objec t i ves
Evaluate the spatial and temporal response of aspen to mechanical removal across a
gradient of conifer encroachment.
Relate aspen regeneration to levels of disturbance to the top soil and the litter layer.
Evaluate conifer removal and the response of native and invasive herbaceous species.
Compare aspen regeneration associated with mechanical removal to burn treatments.
St udy Area
The study area is located in the Sierra Madre Range on Medicine Bow National Forest
property in Carbon County (figs. 20, 28). The treatment area is characterized by mature aspen with
areas of encroachment by subalpine fir and, to a lesser extent, lodgepole pine. Based on tree-ring
counts of subalpine fir, the majority of subalpine firs in the treatment area were less than 100 yr old
and the stands were characterized by the presence of shade-tolerant herbaceous species. The
treatment area is located on both sides of FS road 114S south of highway 70 and east of the Stock
Drive road.
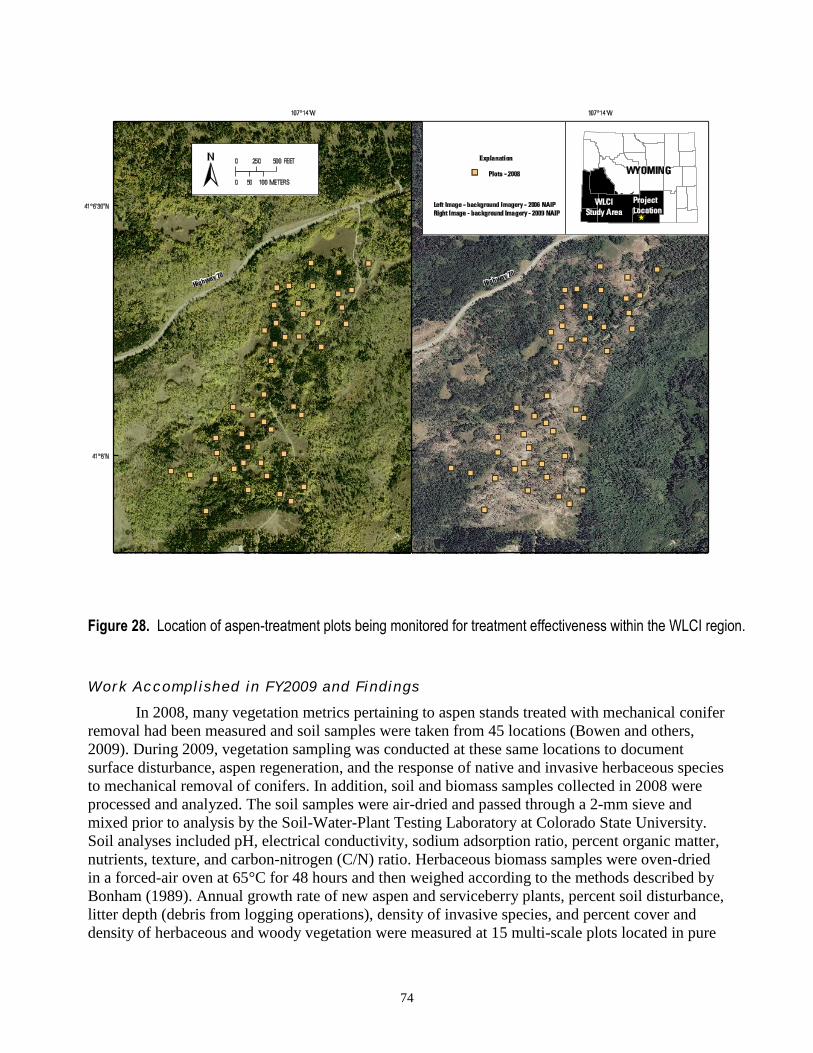
74
Figure 28. Location of aspen-treatment plots being monitored for treatment effectiveness within the WLCI region.
Wor k Ac compl i shed in FY2009 and Findings
In 2008, many vegetation metrics pertaining to aspen stands treated with mechanical conifer
removal had been measured and soil samples were taken from 45 locations (Bowen and others,
2009). During 2009, vegetation sampling was conducted at these same locations to document
surface disturbance, aspen regeneration, and the response of native and invasive herbaceous species
to mechanical removal of conifers. In addition, soil and biomass samples collected in 2008 were
processed and analyzed. The soil samples were air-dried and passed through a 2-mm sieve and
mixed prior to analysis by the Soil-Water-Plant Testing Laboratory at Colorado State University.
Soil analyses included pH, electrical conductivity, sodium adsorption ratio, percent organic matter,
nutrients, texture, and carbon-nitrogen (C/N) ratio. Herbaceous biomass samples were oven-dried
in a forced-air oven at 65°C for 48 hours and then weighed according to the methods described by
Bonham (1989). Annual growth rate of new aspen and serviceberry plants, percent soil disturbance,
litter depth (debris from logging operations), density of invasive species, and percent cover and
density of herbaceous and woody vegetation were measured at 15 multi-scale plots located in pure

75
aspen stands (no disturbance) and 30 multi-scale plots where conifers were removed. Additional
monitoring of aspen, under-canopy vegetation, and invasive species will take place during 2010.
Analyses of previously collected data will also be conducted during 2010.
Pr oduc ts Completed i n FY2009
Spatial data of long-term monitoring plots and photo points.
Soil analysis and vegetation biomass data set.
Spatial data on spotted knapweed location in study area and list of invasive species in
study plots.
Herbivory, Stand Condition, and Regeneration Rates of Aspen on Burned and Unburned Plots for Effectiveness Monitoring
St atus
New in FY2009
Contac t
Patrick J. Anderson; 970-226-9488; [email protected]
Natasha Carr; 970-226-9446; [email protected]
Tim Assal; 970-226-9134; [email protected]
Scope and Methods
Since 1990, more than $2 million has been spent on habitat-restoration and enhancement
projects in the Little Mountain ecosystem. Many of these efforts have focused on restoring aspen
communities to maintain or improve water quality and to enhance ungulate habitat. Indeed, both
fish and ungulate populations appear to have increased as a result. During 2009, biologists from the
WGFD Green River Regional Office established long-term monitoring plots to evaluate whether
the increased number of ungulates using those stands is in balance with targets set for aspen
regeneration. The USGS is supporting this effort by augmenting protocols used by the WGFD to
study herbivory patterns at locations associated with historical burns (wildfires and prescribed fires)
and at unburned locations. Burned and unburned stands were randomly selected based on the stand
size (patch area and shape) and stand location (Aspen Mountain, Pine Mountain, and Miller
Mountain; see fig. 24) across a gradient of conditions and conifer encroachment. Measurements
related to stand composition (dominant and subdominant canopy structure, size classification, age
structure, regeneration, and conifer encroachment) were added to the WGFD protocol. The
extended study design and protocol will be used to evaluate the effectiveness of past and current
aspen treatments, determine herbivory rates (for aspen and serviceberry), and determine aspen
regeneration potential (density and annual growth rate of aspen suckering) at treated and untreated
aspen stands.
Aspen sucker density and growth rate in the Little Mountain Ecosystem area will be
compared to aspen treated with burning and mechanical removal of conifer in other areas of the
WLCI region. An index based on sucker density and growth rate will be developed for establishing
regeneration benchmarks to determine the effectiveness of future treatments across the WLCI area.
In addition to evaluating effectiveness of aspen treatments, this effort was designed to support
76
another USGS study that entails assessing migratory bird use of burned versus unburned aspen
stands (see section below on Use of Aspen Stands by Migrant Birds for Effectiveness Monitoring).
These efforts will be expanded in 2010 to include classification of aspen regeneration based
on its ecological and hydrological settings (ecohydrology). Results from 2009 and 2010 will be
used to support the mapping and classification of aspen stands across the Little Mountain
Ecosystem. The classification and map products are intended for Sweetwater LPDT to prioritize
and design future treatments based on stand condition and conifer encroachment. USGS is
collaborating with the BLM Rock Springs Field Office and the Wyoming Natural Diversity
Database (WYNDD) to support the development of the mapping products.
Objec t i ves
Evaluate spatial and temporal aspen regeneration, herbivory, and ecohydrology on
burned and unburned plots.
Evaluate effects of big-game herbivory on aspen and adjacent serviceberry.
Correlate stand dynamics with use of burned and unburned aspen stands by migrant
songbirds.
Compare aspen regeneration associated with burning to the mechanical removal of
aspen to other treated aspen stands in the WLCI area.
Develop an aspen index based on sucker density and growth rate.
Develop geospatial products that show aspen condition to support prioritization of
restoration projects.
St udy Area
The study area is associated with the Little Mountain Ecosystem south of Rock Springs,
Wyo. (figs. 20, 24). This area is defined as land bounded by Wyoming Highway 430 on the east,
Interstate Highway 80 on the north, Flaming Gorge Reservoir on the west, and the Wyoming-
Colorado state line on the south. Aspen communities are interspersed throughout the area on higher
elevations. During 2009, sampling was conducted at a total of 15 plots in burned and unburned
aspen stands.
Wor k Ac compl i shed in FY2009 and Findings
Scientists with the USGS met with WGFD staff to discuss herbivory protocol,
methodologies, and related science needs. One of the needs identified was to estimate herbivory on
aspens beyond the locations where WGS was conducting sampling. To address this need and to
evaluate aspen regeneration at burned and unburned locations, we prepared a coarse map of
predicted aspen locations on Pine Mountain, Aspen Mountain, and Little Mountain. During 2009,
we established 15 multi-scale, circular plots with three 40- m transects located at the center at
azimuths of 30º, 150º, and 270º. Measurements associated with ungulate herbivory, aspen
regeneration and annual growth rate, tree size class (diameter at breast height [dbh]: 1.37 m), and
canopy cover were conducted along each transect. Ungulate herbivory was estimated using the
approach described by Keigley and others (2002) and by measuring bark chewing on aspen taller
than 2 m. Aspen less than 2 m tall were classified into four height classes (less than 15 cm, 15–50
cm, 50.1 cm–1 m, and 1.1–2 m) to determine growth rate, regeneration, and stem density. Aspen
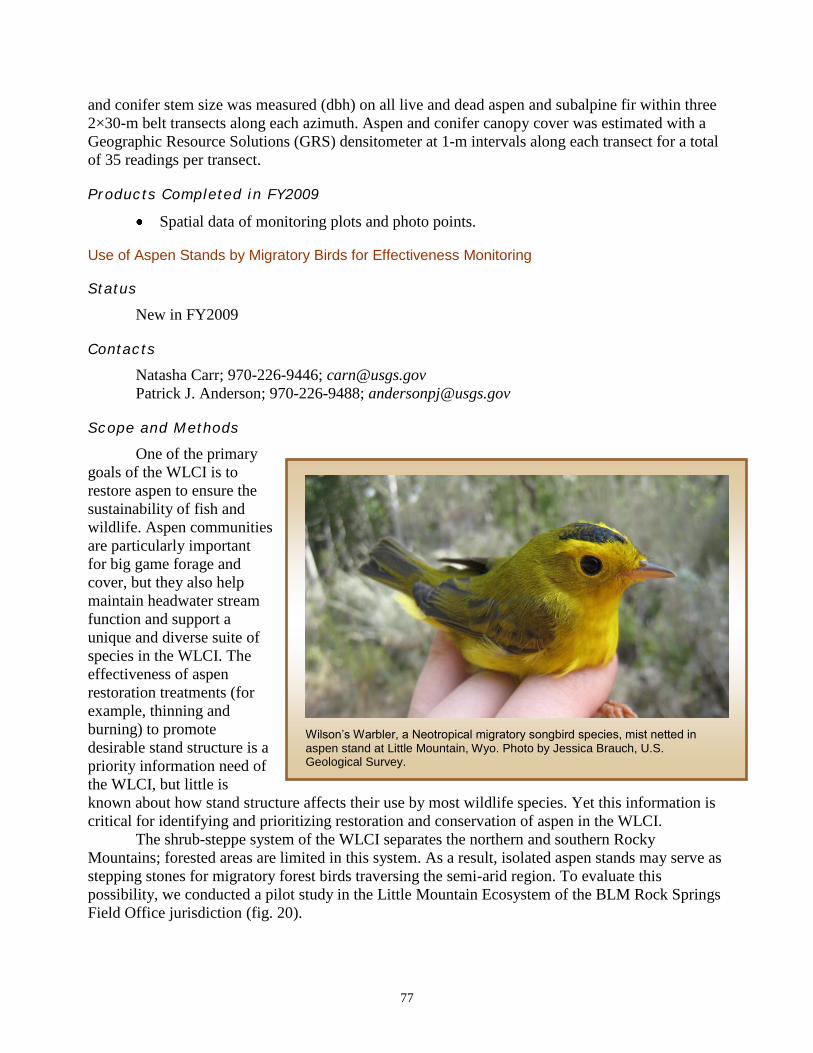
77
and conifer stem size was measured (dbh) on all live and dead aspen and subalpine fir within three
2×30-m belt transects along each azimuth. Aspen and conifer canopy cover was estimated with a
Geographic Resource Solutions (GRS) densitometer at 1-m intervals along each transect for a total
of 35 readings per transect.
Pr oduc ts Completed i n FY2009
Spatial data of monitoring plots and photo points.
Use of Aspen Stands by Migratory Birds for Effectiveness Monitoring
St atus
New in FY2009
Contac t s
Natasha Carr; 970-226-9446; [email protected]
Patrick J. Anderson; 970-226-9488; [email protected]
Scope and Methods
One of the primary
goals of the WLCI is to
restore aspen to ensure the
sustainability of fish and
wildlife. Aspen communities
are particularly important
for big game forage and
cover, but they also help
maintain headwater stream
function and support a
unique and diverse suite of
species in the WLCI. The
effectiveness of aspen
restoration treatments (for
example, thinning and
burning) to promote
desirable stand structure is a
priority information need of
the WLCI, but little is
known about how stand structure affects their use by most wildlife species. Yet this information is
critical for identifying and prioritizing restoration and conservation of aspen in the WLCI.
The shrub-steppe system of the WLCI separates the northern and southern Rocky
Mountains; forested areas are limited in this system. As a result, isolated aspen stands may serve as
stepping stones for migratory forest birds traversing the semi-arid region. To evaluate this
possibility, we conducted a pilot study in the Little Mountain Ecosystem of the BLM Rock Springs
Field Office jurisdiction (fig. 20).
Wilson’s Warbler, a Neotropical migratory songbird species, mist netted in aspen stand at Little Mountain, Wyo. Photo by Jessica Brauch, U.S. Geological Survey.

78
Objec t i ves
Determine whether aspen stands in the Little Mountain Ecosystem are used by migrant
songbirds during fall migration, and, if so, determine the species composition of the
migrant bird community.
Evaluate the abundance, migratory status (for example, Neotropical migrant, short-
distance migrant, partial migrants, resident species), and breeding range of migrants to
determine if the stands are locally, regionally, or geographically important to migrants.
Assess use of different stand structures in burned and unburned aspen stands by migrant
species.
St udy Area
Several areas were selected within the Little Mountain Ecosystem (fig. 24) to represent a
range of aspen stand condition (for example, regenerating stands, multi-storied, senescent) and
landscape position (size and isolation of aspen). In August and September 2009, we surveyed birds
by using point counts and mist nets at Little Mountain (11 plots), Quaking Aspen Mountain (3
plots), Pine Mountain (3 plots), and Miller Mountain (5 plots).
Wor k Ac compl i shed in FY2009 and Findings
In the fall of 2009, we observed 85 species of birds using the aspen stands of the Little
Mountain Ecosystem. Sixty-two of the observed species are songbirds (passerines), 32 of which are
Neotropical migrants (winter south of the United States), and 20 species are short-distance migrants
(winter in the southern United States). The most abundant Neotropical migrant species were
yellow-rumped warbler (Dendroica coronata), Wilson‘s warbler (Wilsonia pusilla), house wren
(Troglodytes aedon), Townsend‘s warbler (Dendroica townsendi), orange-crowned warbler
(Vermivora celata), common nighthawk (Chordeiles minor), hermit thrush (Catharus guttatus),
Macgillivray‘s warbler (Oporornis tolmiei), western wood-pewee (Contopus sordidulus), Cassin‘s
vireo (Vireo cassinii), and Cordilleran flycatcher (Empidonax occidentalis). Five of the neotropical
migrants do not breed in Wyoming, indicating the aspen stands in this area are of regional
importance to migrants. This study is the first documentation of the use of aspen stands in
Southwest Wyoming by migrant birds.
Pr oduc ts Completed i n FY2009
Dataset of species observed using aspen stands in the Greater Little Mountain Areas
including abundance and migratory status.
Landscape-scale study designed to evaluate the effects of stand structure and landscape
structure (size and isolation of aspen patches) for the 2010 field season.
Draft report of pilot field season.

79
Soil Chemistry: Relationships between Energy Exploration/Development and Salinity of Soils and Waters
St atus
Completed; related work will continue in FY2010 under new tasks (see tasks ―Developing
Remote Sensing Applications for Geologic, Vegetation, and Soil Investigations ‖ and ―Developing
Methods for Assessing Soil Organic Matter and Mercury at Variable Spatial Scales‖ in the section
above on Comprehensive Assessment)
Contac t
Richard Grauch; 303-236-5551; [email protected]
Scope and Methods
Energy exploration and development is proceeding rapidly in the Muddy Creek subbasin,
Carbon County, Wyo. This is a small portion of the effort to use the resources of the Atlantic Rim
energy field. Gravel roads, drill pads, pipelines, buried powerlines, and production and injection
wells have been permitted in the subbasin and are being constructed. The impact of this and
planned future development on the salinity of perennial and intermittent streams in the Muddy
Creek subbasin is not known. Open questions include (1) what is the background salinity of surface
and groundwaters in the subbasin, (2) what are the sources of salt, (3) what quantity of salt is
available for leaching into surface and ground water, and (4) what is the trend in salinity of Muddy
Creek and are the suspected changes related to energy exploration and development? Additionally,
there are inadequate data available for reliable modeling of the effects of energy exploration and
development; this effectively limits a modeler‘s ability to predict what will happen with additional
exploration and development activity and precludes reasonable planning for sustainable
development in this portion of the Upper Colorado River Basin.
A road (graded and widened in fall 2008) that crosses the lower reach of Cow Creek, a tributary to Muddy Creek. Note extensively developed, white, ephemeral salts on the disturbed ground. Photo by Richard Grauch, U.S. Geological Survey.

80
Objec t i ve
Develop an understanding of soil and water salinity in the Muddy Creek subbasin,
Carbon County, Wyo., and the influence of energy exploration and development on
salinity.
St udy Area
The study area encompasses the Muddy Creek subbasin, Carbon County, Wyo. (fig. 29).
Figure 29. Location and distribution of the Muddy Creek subbasin.
Wor k Ac compl i shed in FY2009 and Findings
A workshop for ―Friends of Muddy Creek‖ was held in March, 2009, at the University of
Wyoming. This informal meeting addressed (1) issues regarding surface disturbance and salinity
transport concerns within the Muddy Creek subbasin and their relationship to the broader concerns
for energy development in other drainages contributing to the Colorado River Basin, and (2)
ongoing programmatic initiatives that might provide some collaborative opportunities to improve
our understanding of the various complexities involved through information exchange, data
sharing, and any approaches currently underway to attempt mitigation of the issues.
Representatives from the USGS, BLM, NRCS, University of Wyoming, WGFD, Wyoming
Department of Environmental Quality, WY State Engineer‘s Office, Little Snake Water
Conservation District, and the Saratoga-Encampment-Rawlins Conservation District participated in
the meeting.

81
Field analyses of a few salt samples taken from the Muddy Creek subbasin during the fall of
2008 indicate the presence of mercury and the absence of selenium. Some laboratory tests confirm
those findings, but other analytical techniques do not. During the spring of 2009, field analyses of
salts sampled from the same areas as those sampled in 2008 did not indicate the presence of
mercury, but they did show the presence of selenium in the salts or near-surface soil. Laboratory
analyses of those salts are not yet completed. These data indicate that water-soluble forms of
selenium and possibly mercury occur in the salts at different times of the year and, therefore, are
readily available for transport to Muddy Creek and its tributaries at different times of the year.
Observational data suggest that salts are more prevalent in disturbed areas (notably road shoulders
and pipelines) than in adjacent undisturbed areas.
Pr oduc ts Completed i n FY2009
Workshop for ―Friends of Muddy Creek,‖ March 2009, University of Wyoming,
Laramie, Wyo.
Muddy Creek salt sample database.
Summary: Mechanistic Research of Wildlife
Mechanistic research of wildlife can elucidate the relationships between the habitats and
distributions of important and protected species and their responses to changes in land use,
particularly energy development. The species selected for mechanistic studies in the WLCI region
include the (1) pygmy rabbit, which is a species of conservation concern in Wyoming; (2) greater
sage-grouse, which has been petitioned for listing under the Endangered Species Act; (3)
sagebrush-obligate songbird community, which includes several species of conservation concern;
and (4) mule deer, a highly sought after (thus, economically important) game species in Wyoming.
In FY2009, the WYNDD model for pygmy rabbit was used to develop four occupancy
classes ranging from very low to very high, ground-truthed via surveys conducted at 189 randomly
selected sites throughout western Wyoming, and then the fit of the model to the survey data was
assessed for different occupancy classes. Resulting information suggests that, during the years in
which we surveyed, pygmy rabbits occupied a broader range of habitat conditions than predicted by
the WYNDD model. Future work will entail investigating causes and persistence of this trend.
The sage-grouse studies in FY2009 entailed continued evaluations of a design for
monitoring sage-grouse and an investigation of the apparent correlation between population cycles
of sage-grouse and cottontail (Sylvilagus spp.) rabbits. Using publicly available data on greater
sage-grouse in Wyoming, the influence of within-year repeated counts on population-trend
estimates (based on lek counts in the spring) was assessed because past recommendations for
monitoring males at leks suggested a minimum of three within-year observations at a lek to
estimate trends. Modeling efforts indicated that, at large spatial scales, the absence of repeated
counts within a year did not significantly alter population-trend estimates. Using this information, a
subsequent modeling exercise identified significant changes from 1965–2008 in the population
index and cyclic nature of this species. The modeling effort to explore the relationship between
sage-grouse cycles and rabbit cycles used sage-grouse lek counts and annual hunter harvest indices
from 1970–2007. The results indicate a high correlation between the two species, despite being
unrelated taxonomically or sharing a predator-prey relationship. Possible mechanisms behind the
synchronous population cycles are being explored. This research highlights the importance of
control populations in both adaptive management and impact studies.
82
The songbird study evaluates breeding abundance and nesting success of the Brewer‘s
sparrow, sage sparrow (Amphispiza belli), and sage thrasher (all sagebrush-obligate species)
relative to energy-development gradients. Work in FY2009 entailed completing 480 point counts of
birds, as well as locating and monitoring 163 Brewer‘s sparrow, 48 sage sparrow, and 35 sage
thrasher nests. Abundance of Brewer‘s sparrows and sage sparrows, but not sage thrashers,
decreased significantly as well density increased, and nest success for all three species decreased
with increased proximity to the nearest well pad. Nestling mass did not vary significantly with well
density.
The mule deer (Odocoileus hemionus), which employs a movement model for identifying
migration routes used by mule deer (as well as other ungulates, including elk, moose, and
pronghorn [Antilocapra americana]), entails developing maps of migration routes and route
segments used for foraging, resting, and movement. In FY2009, mule deer used a consistent series
of stopover sites in both spring and fall migrations, across a range of migration distances. Deer
spent the vast majority of their time in stopovers and very little time in the movement corridors that
connect them, and individual deer showed high fidelity to stopovers between seasons and years.
Using an NDVI measure of greenness to assess forage quality along migration routes, stopovers
appeared to have higher-quality forage compared to movement corridors, and forage quality
increased with elevation. This work indicates that stopovers may play a key role in the migration
strategy of mule deer by allowing them to migrate in accordance with vegetative phenology so that
foraging opportunities during migration are optimized.
Details of these four studies are provided in the four sections that follow.
Pygmy Rabbit
St atus
Ongoing
Contac t
Stephen Germaine; 970-226-9107; [email protected]
Scope and Methods
Throughout their range, pygmy rabbit populations have declined as sagebrush habitats have
been reduced and fragmented. Because of range-wide habitat loss and corresponding population
decline, pygmy rabbits are now being considered for Federal Endangered Species Act listing.
Relatively little is known about the ecology of this sagebrush obligate, and numerous information
gaps must be filled to effectively manage for conservation of pygmy rabbits. Further, because of
the high level of difficulty involved with studying this species, listing and management decisions in
the foreseeable future likely will depend on site-occupancy information. Scientists from the USGS
are collaborating with staff with the Wyoming Natural Diversity Database (WYNDD) and the
Wyoming Chapter of The Nature Conservancy to (1) provide survey-based validation for two
existing range occupancy models for Wyoming and (2) develop a new model that predicts both site
occupancy and site vacancy based on landscape-level habitat attributes. The new model will be
informed by variables describing anthropogenic disturbances, sagebrush patch metrics, and updated
climate information. Model results will provide managers with a new tool for informing permit-
related decisions. In 2010, we will begin colleting data with which we will relate pygmy rabbit site
occupancy to LiDAR (Light Detection and Ranging) data that describe sagebrush structural
83
characteristics over broad areas. Data collected in these efforts will contribute to an improved
ability to manage for pygmy rabbit conservation, developing the long-term monitoring program,
and backcasting and forecasting wildlife population trends.
Objec t i ves
Improve our knowledge of the distribution of pygmy rabbits in Wyoming.
Collect ground-truth survey data.
Validate the predictive occupancy model developed by the WYNDD and the Wyoming
Chapter of The Nature Conservancy.
Generate a new model capable of accurately classifying both occupied and unoccupied
sites accurately.
Relate pygmy rabbit occupancy to LiDAR sagebrush structure data.
St udy Area
This study incorporates all of the predicted pygmy rabbit range in Wyoming, which extends
beyond the WLCI boundary. Figure 30 illustrates the extent and distribution of pygmy rabbit
survey areas.
Wor k Ac compl i shed in FY2009 and Findings
To ground-truth the WYNDD model, we split the predicted site-specific probability of
occupancy into four classes ranging from very low to very high. We then surveyed 189 random
sites (153 in 2008, 34 in 2009; fig. 30) throughout western Wyoming to determine site-specific
occupancy and assess the fit of the model to the survey data. We interpreted survey-based site
occupancy status two ways: a liberal interpretation where either pellets or burrows were considered
sufficient evidence, and a more conservative interpretation where both pellets and burrows were
required to conclude occupancy. Model fit to the liberal survey data was good for the high- and
very high-occupancy classes (fig. 31). Model fit to the conservative data was good for the high-
occupancy class and marginally good for the very high-occupancy class. The model underfit the
data for both the very low- and low-occupancy classes. This suggests that during the years in which
we surveyed, pygmy rabbits occupied a broader range of habitat conditions than predicted by the
WYNDD model. In the coming years, causes and persistence of this trend will be investigated.
Pr oduc ts Completed i n FY2009
A GIS distribution map of occupied and vacant sites (fig. 30).
Development of a fully attributed pygmy rabbit-occupancy data set.
We held the second annual Wyoming pygmy rabbit working group meeting with
members representing University of Wyoming; WEST, Inc.; WYNDD; Wyoming
BLM; and USGS.
Presented the WYNDD model validation work at 2009 annual meeting of the Wyoming
Chapter of The Wildlife Society in Cody, Wyo.

84
Figure 30. Pygmy rabbit occupancy among 187 sites surveyed in Southwest Wyoming, 2008–2009. Color ramp indicates increasing predicted probability of occupancy (gray to green), based on the Wyoming Natural Diversity Database’s predictive range map for pygmy rabbit (unpubl. data, September 2009, from Douglas Keinath, Vertebrate Ecologist, Wyoming Natural Diversity Database, University of Wyoming, Laramie).
Figure 31. Predicted (median = solid red triangles, range = whiskers) and observed (bars) site occupancy rates for pygmy rabbits in Southwest Wyoming, 2008–2009.

85
Sage-Grouse
St atus
Ongoing; the work concerning sage-grouse and cottontails will be completed in FY2011
Contac t s
Brad Fedy; 970-226-9456; [email protected]
Scope and Methods
Persistence of the greater sage-grouse depends on the quantity, quality, and distribution of
habitat within its range (semi-arid sagebrush steppe). Recent work on greater sage-grouse has
focused on developing spatial models assessing sage-grouse responses across large landscapes. A
long-term analysis of population trends across the WLCI area and the rest of Wyoming was
conducted to identify key time periods in historical sage-grouse population fluctuations and to
quantitatively address many analysis concerns associated with using very large time-series
databases. These studies provided a solid foundation for ongoing research by placing greater focus
on the timing and mechanisms that influence population fluctuations, specifically climate and
energy development. In addition to this work, our major efforts focus on developing predictive
habitat selection models for sage-grouse.
Objec t i ves
Develop spatial models assessing sage-grouse responses to energy development and
climate variation across large landscapes using existing population data from lek counts.
Compile data from previously conducted and ongoing biotelemetry studies, both within
the WLCI area and across Wyoming.
St udy Area
This study is not associated with a particular location or site. The analyses and models apply
to the entire WLCI study area (fig. 2).
Wor k Ac compl i shed in FY2009 and Findings
Monitoring Wyoming greater sage-grouse: The importance of repeated counts and the
influence of scale (manuscript in review)—Long-term population monitoring can provide
indications of population performance, identify potential stressors, and establish the historical
amplitudes for population fluctuations; however, the capacity to detect change and the accuracy of
population estimates are strongly influenced by the approaches used to collect and analyze long-
term data. Monitoring protocols commonly require repeated observations at a site within a year;
however, the effects of within-year repeated observations on the accuracy of trend estimates are
rarely quantified. We examined the influence of within-year repeated counts on population-trend
estimates. We used publicly available data on greater sage-grouse in Wyoming. Greater sage-
grouse populations have been a concern since the early 1900s and extensive long-term data exist on
the maximum number of males that attend leks in the spring. Past recommendations for monitoring
males at leks suggested a minimum of three within-year observations at a lek to estimate trends.
We used generalized additive models to examine trends and found that, at large spatial scales, the

86
absence of repeated counts within a year did not significantly alter population trend estimates or
interpretation. We quantified the influence of sample size and provided a model detailing the
relationship between sample size and the percent of detectable change within a population.
Informed by these findings, we developed a population-trend model for Wyoming greater sage-
grouse from 1965–2008 that was used to identify significant changes in the population index and
the cyclic nature of this species.
Population cycles of sage-grouse and cottontails in Wyoming (manuscript in press for
Oecologia)—Animal species across multiple taxa demonstrate multi-annual population cycles,
which have long been of interest to ecologists. Correlated population cycles between species that
do not share a predator-prey relationship are particularly intriguing and challenging to explain.
Annual population trends of greater sage-grouse and cottontail rabbits across Wyoming were
investigated to explore the possibility of correlations between unrelated species over multiple
cycles, very large spatial areas, and at relatively southern latitudes in terms of cycling species.
Sage-grouse lek counts and annual hunter harvest indices from 1970–2007 were analyzed with
generalized additive models, which show that long-term cycles and trends of greater sage-grouse (a
candidate species for listing as threatened or endangered under the U.S. Endangered Species Act is
warranted but precluded) and cottontails are highly correlated (r = 0.89). Possible mechanistic
hypotheses to explain the synchronous population cycles are being explored. This research
highlights the importance of control populations in both adaptive management and impact studies.
Furthermore, it demonstrates the functional value of lek count and hunter harvest indices for
tracking broad-scale fluctuations in the species. This level of highly correlated, long-term cycles
has not been documented previously for two unrelated species, over a long time-series, over a very
large spatial scale, and within more southern latitudes.
Pr oduc ts Completed i n FY2009
Fedy, B.C., and Aldridge, C.L., in review, Long-term monitoring of greater sage-grouse
populations: the importance of within-year repeated counts and the influence of scale:
submitted to the Journal of Wildlife Management.
Conducted an analysis addressing the influence of climate and weather on long-term
fluctuations in sage-grouse populations.
Presented ―Impacts of climate on long-term sage-grouse population trends‖ at the 2009
annual meeting of The Wildlife Society.
Conducted analysis of population cycles for sage-grouse and cottontail rabbit.
Fedy, B.C., and Doherty, K.E., in press, Population cycles are highly correlated over
long time series and large spatial scales in two unrelated species: Greater sage-grouse
and cottontail rabbits: Oecologia, v. xx, no. xx, p. xx.
Presented ―Population cycles of sage-grouse and cottontails in Wyoming‖ at the 2009
annual meeting of the Wyoming Chapter of the Wildlife Society.

87
Songbird Community
St atus
Ongoing; anticipated completion for phase II (mechanistic component) of this study is late
FY2012.
Contac t s
Anna D. Chalfoun; 307-766-6966
Matthew Kauffman; 307-766-5415; [email protected]
Scope and Methods
Songbird species that breed
within Western North American
sagebrush habitats have been showing
marked declines, commensurate with
ongoing changes to sagebrush steppe
systems. Little is known about how
sagebrush-obligate songbirds are
influenced by energy development,
although such disturbances have the
potential to increase physiological
stress, alter habitat selection, disrupt
nesting, and reduce survival and
reproduction. We quantified songbird
community structure (abundance,
diversity) and reproductive success
across gradients in energy development
intensity (well densities/km2). We assessed the population of the songbird community using point
counts with distance sampling. Nests of all songbird species present were located and monitored for
nesting productivity, variation in clutch size, hatching success, and abandonment rates.
Morphological measurements of nestlings at a subset of nests provided an index of offspring
quality and likelihood of post-fledging survival. Relevant habitat characteristics (for example,
shrub cover, height and density, understory composition) were measured at each point count and
nest location in order to examine possible habitat-disturbance interactions.
Objec t i ves
Evaluate the influence of energy development on the nongame bird community within
sagebrush habitats of the Green River Basin, Wyo.
Measure avian community structure (abundance, diversity) and productivity (nest
success) across gradients of energy development intensity (well-pad density).
Sage thrasher nest and eggs in the Pinedale Anticline area, Wyoming (photo by Michelle Gilbert, University of Wyoming).

88
0 5 10 MILES
191
0 5 10 KILOMETERS
St udy Areas
Songbird study areas were established in three areas that represent a gradient of energy-
development within Sublette County in southwestern Wyoming: the Jonah Field, the Pinedale
Anticline, and the LaBarge Oil Field (fig. 32). All work took place within sagebrush habitats.
Wor k Ac compl i shed in FY2009 and Findings
Two point-count surveys were completed at each survey location (n = 240) for a total of 480
point counts. Additionally, a total of 246 nests (163 Brewer‘s sparrow, 48 sage sparrow, and 35
sage thrasher) were located and monitored. The abundance of Brewer‘s sparrows and sage
sparrows, but not sage thrashers, decreased significantly as well density increased. Nest success for
all three species decreased with increased proximity to the nearest well pad (fig. 33). Nestling
measurements were obtained from 48 Brewer‘s sparrow, 10 sage sparrow, and 10 sage thrasher
nests. Nestling mass did not vary significantly with well density.
Figure 32. Three separate energy-development areas where songbird sampling occurred; the left polygon is the LaBarge Field, the upper right polygon is the Pinedale Anticline, and the lower right polygon is the Jonah Field. Colored squares within the study areas illustrate well-pad density/km2.

89
Figure 33
. The probability of nesting success (as assayed by daily nest-survival probabilities) in relation to distance from energy development for the three main sagebrush-obligate songbird species found in the WLCI project area. For example, extrapolated across the duration of the nesting cycle for a Brewer’s sparrow (average of 22 days), the daily nest survival estimate of 0.95 when immediately adjacent to a well pad translates to 32 percent overall nest survival probability, compared to 64 percent when 2000 meters (0.98) from the nearest well pad.
P r o d u c t s C o m p l e t e d i n F Y 2 0 0 9
• GIS maps of study area and locations of point counts and nests.
• Dataset consisting of avian abundance, diversity, nest success, nestling quality, habitat, and information on distance from and extent of disturbance.
• Oral presentation, “Influence of energy development on sagebrush-obligate songbirds in Southwest Wyoming,” by M.Sc. candidate, M. Gilbert, at the Wyoming Wildlife Society meeting in Sheridan, Wyo. (November, 2009); awarded best student presentation.

90
Wyoming Cooperative Fish and Wildlife Unit doctoral student Hall Sawyer and Wyoming Game and Fish Biologist Tim Wooley (left), and a Leading Edge Aviation helicopter crew (right) as they prepare radio collars (above) for a mule deer capture on the Atlantic Rim in Wyoming. Photo by Matt Kauffman, U.S.
Geological Survey.
Mule Deer
St atus
Ongoing; phase II (identifying threshold levels of development) will be completed in early
FY2012.
Contac t s
Matthew Kauffman; 307-766-5415; [email protected]
Hall Sawyer; 307-755-0401; [email protected]
Scope and Methods
As habitat loss and
fragmentation increase across
ungulate ranges, identifying
and prioritizing migration
routes for land-use planning
and conservation has taken
on a new urgency. A general
framework was created to (1)
provide a probabilistic
estimate of the migration
routes of a sampled
population, (2) identify
which segments of the route
function as foraging and
resting areas or primarily as
movement corridors, and (3)
indicate which routes are
most important based upon
their proportional use by the
sampled population. This approach is based on the Brownian bridge-movement model, an
analytical method for converting a consecutive series of locations (that is, a movement path) into a
3-dimensional probability distribution. Expressing the movement path as a probability distribution
allows one to assess the uncertainty of movement between known locations and to identify areas of
high and low use along the path. This approach has been applied to migratory mule deer
populations that winter in habitats near development associated with the Atlantic Rim and Pinedale
Anticline Project Areas. In addition to identifying key migration corridors for conservation and
enhancement, these analyses identified the consistent use of stopover areas by migrating deer,
similar to what has been found in long-distance migrations of avian taxa.
Stopover ecology has become an area of intense research in avian ecology, and it has played
a key role in developing a rigorous theory of bird migration and in designing effective conservation
strategies. Although stopover behavior occurs in other migratory taxa, the study of stopovers has
been limited to avian species. This work entails exploring whether stopover ecology has broad
applications to other migratory taxa, particularly temperate ungulates that annually migrate long
distances along traditional routes. Our approach includes using fine-scale global positioning system
(GPS) movement data and Brownian bridge movement models (Horne and others, 2007) to

91
quantify a suite of stopover characteristics and examine the ecological role of stopovers in the
seasonal migrations of mule deer in western Wyoming.
Objec t i ves
Identify migration routes used by key ungulate species (mule deer, elk, moose, and
pronghorn) and develop methods for analyzing corridor use to inform conservation
decisionmaking.
Develop the capacity to identify and predict the availability of alternative migration
routes.
St udy Area
Migratory assessments work is focused in the southeast WLCI study area (fig. 34).
0 2.5 5 MILES
0 2.5 5 KILOMETERS
Figure 34. Location of mule deer study in the WLCI region and estimated population-level migration route for mule deer in the Wild Horse Winter Range in Southwest Wyoming. High-priority areas are those used by more than 10 percent of the marked sample. Individual routes are composed of movement corridors, where deer move quickly, and stopover sites, where deer move slowly while foraging (Sawyer and others, 2009).
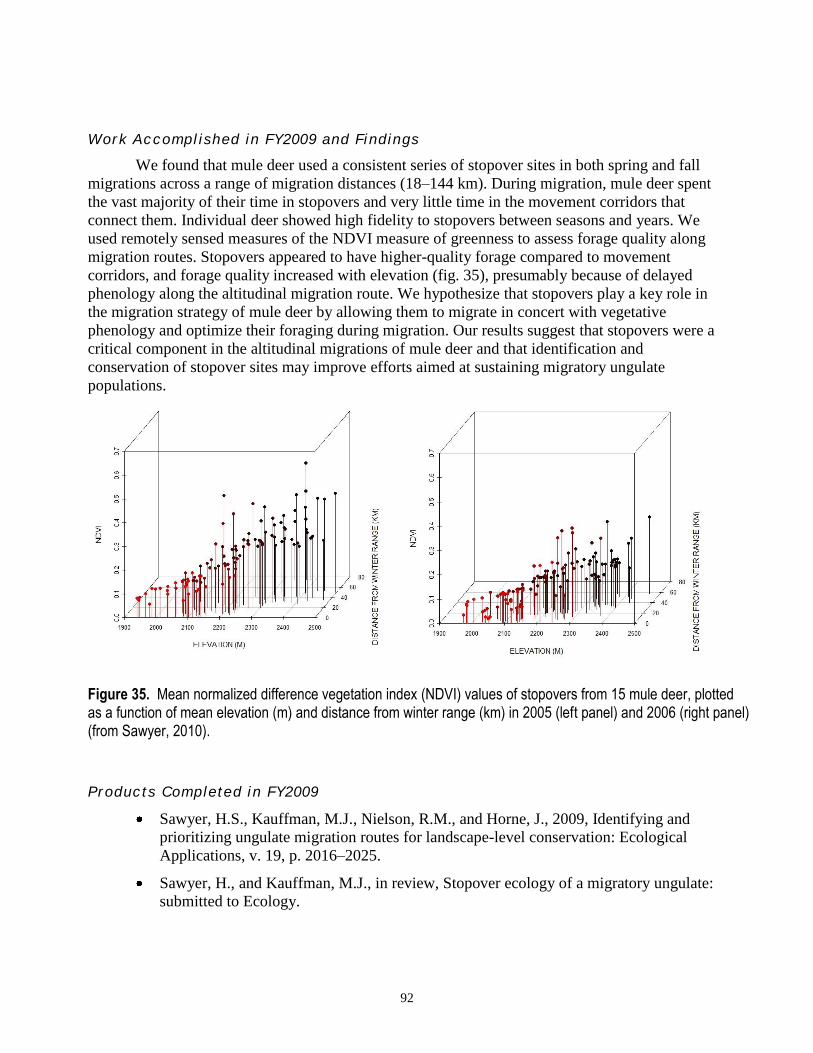
92
Wor k Ac compl i shed in FY2009 and Findings
We found that mule deer used a consistent series of stopover sites in both spring and fall
migrations across a range of migration distances (18–144 km). During migration, mule deer spent
the vast majority of their time in stopovers and very little time in the movement corridors that
connect them. Individual deer showed high fidelity to stopovers between seasons and years. We
used remotely sensed measures of the NDVI measure of greenness to assess forage quality along
migration routes. Stopovers appeared to have higher-quality forage compared to movement
corridors, and forage quality increased with elevation (fig. 35), presumably because of delayed
phenology along the altitudinal migration route. We hypothesize that stopovers play a key role in
the migration strategy of mule deer by allowing them to migrate in concert with vegetative
phenology and optimize their foraging during migration. Our results suggest that stopovers were a
critical component in the altitudinal migrations of mule deer and that identification and
conservation of stopover sites may improve efforts aimed at sustaining migratory ungulate
populations.
Figure 35. Mean normalized difference vegetation index (NDVI) values of stopovers from 15 mule deer, plotted as a function of mean elevation (m) and distance from winter range (km) in 2005 (left panel) and 2006 (right panel) (from Sawyer, 2010).
Pr oduc t s Completed i n FY2009
Sawyer, H.S., Kauffman, M.J., Nielson, R.M., and Horne, J., 2009, Identifying and
prioritizing ungulate migration routes for landscape-level conservation: Ecological
Applications, v. 19, p. 2016–2025.
Sawyer, H., and Kauffman, M.J., in review, Stopover ecology of a migratory ungulate:
submitted to Ecology.
93
Kauffman, M.J, Middleton, A., and Sawyer, H., 2009, Conserving ungulate
migrations—A prospectus for research and management: Presentation for the Wyoming
Chapter of The Wildlife Society annual meeting, November, 2009.
Sawyer, H., Kauffman, M.J., Nielson, R.M., and Horne, J.S., 2009, Identifying and
prioritizing ungulate migration routes for landscape-level conservation: Presentation for
the USGS WLCI Science Workshop, May, 2009.
Sawyer, H., 2009, Mule deer and energy development in Wyoming: Presentation for the
U.S. Forest Service Region II Meeting, February, 2009.
Data and Information Management
Summary
Establishing a Data and Information Management infrastructure allows WLCI partners to
effectively coordinate and maintain information resources, communicate and disseminate
information to users on the WLCI Web site, and provide data-management tools for decision-
making. The three tasks associated with this work are (1) Data Management Framework and
Clearinghouse, (2) Science and Conservation Projects Database, and (3) Outreach and Graphics
Products. Further development and enhancement of all three Data and Information Management
tasks and associated products continued in FY2009.
The primary focus of Data Management Framework and Clearinghouse work has been to
develop procedures for assembling, cataloging, and serving datasets associated with the WLCI. The
WLCI Data Clearinghouse (part of the USGS ScienceBase information management system) is a
searchable online database that enables access to and use of WLCI data and products (for example,
maps, locations of and descriptive information about science and habitat projects, links to relevant
Web sites, and downloadable data sets). The Conservation Project Data Model work entailed
enhancing the system on the WLCI Web site that displays habitat and science-project locations on a
map with descriptive (attribute) information. Outreach and Graphics Products work included
improving and updating the WLCI Web site, which serves as a nexus of information for WLCI and
includes documents; maps; newsletter updates; meeting schedules, agendas, and notes; and access
to the Data Clearinghouse and Project Database.
Details of the Data and Information Management work are provided in the three sections
that follow.
Data Management Framework and Clearinghouse
St atus
Ongoing
Contac t s
Natalie Latysh; 303-202-4637; [email protected]
Sky Bristol; 303-202-4181; [email protected]
Scope and Methods

94
Providing, managing, analyzing, and using information assembled or generated for the
WLCI is essential for supporting WLCI goals. The Data Management Framework and
Clearinghouse work meets those needs by providing a Web-based platform for (1) discovering and
taking advantage of existing data and information, (2) cataloging new data and information, (3)
making these resources available online to the public and WLCI researchers and decisionmakers,
and (4) collaboration promoted by the use of a document-management utility and a wiki for
informal discussions.
Cataloging appropriate data resources for the WLCI community requires identifying the
existing availability, content, scale, and resolution of data for resources relevant to the WLCI.
Protocols for assembling data originating from monitoring and scientific fact-finding efforts are
being established for the WLCI Data Clearinghouse. Comprehensive access must be provided to
data resources, enabling WLCI data users to characterize data and understand how data may be
used. This access must include (1) downloading data to a local system, (2) viewing data with a
map browser, and (3) visiting a Web site for information. The Data Management Framework must
be continually developed to meet user needs and evolve with fast-paced technological innovations,
and the WLCI Data Clearinghouse must be continually maintained to ensure that information
resources are current and relevant.
The myUSGS system, an additional online tool within the Data Management Framework,
serves the internal WLCI community by providing an online platform for sharing and storing
documents, and, via a wiki, allows for collaborative discussions and dissemination of community
information. The myUSGS online community platform is restricted to WLCI community members,
which allows for storage and sharing of sensitive material, including preliminary data and
information.
Objec t i ves
Identify the availability, content, scale, and resolution of data for resources relevant to the
WLCI.
Establish protocols for assembling data originating from monitoring and scientific fact-
finding efforts for the WLCI Data Clearinghouse.
Provide comprehensive access to data resources, enabling WLCI data users to characterize
data and understand how data may be used, including: download data to local system, view
data in map browser, and visit Web site for information.
Maintain and enhance a WLCI Data Clearinghouse.
St udy Area
Activities associated with this subtask apply to the entire WLCI region (fig. 2).
Wor k Ac compl i shed in FY2009 and Findings
During 2009, efforts were focused on acquiring and assembling data resources for the
WLCI Data Clearinghouse (http://my.usgs.gov/catalog/) from publicly available national data sets,
on-the-ground BLM monitoring projects, USFS grazing-allotment information, WGFD biological
surveys, and other sources. Data records provided for the WLCI Data Clearinghouse originally
were generated for numerous projects by multiple investigators working for separate agencies with
varying levels of completeness and differing data standards. The Data Clearinghouse now hosts and

95
provides online access to 523 individual data sources, primarily geospatial data layers available for
online viewing and downloading as shapefiles, and receives an average of 450 visits per month.
Supplemental data resources are continually being added.
Work in FY2009 also included replacing the WLCI Comprehensive Science Catalog user
interface with the ScienceBase user interface, providing more comprehensive access to the data
resources and spatial views of their locations. Users now access data directly through the
ScienceBase application interface. In addition, there is a searchable-context view of WLCI data
available to internal and external audiences (non-public data access requires authentication and
authorization through the WLCI online community). Finally, data harvesting techniques were
developed for discovering and obtaining resources from external data providers. Ongoing work will
continue to
research, develop, and enhance metadata for records lacking attributes;
collaborate with data providers and owners regarding data management, data
maintenance, and data preservation;
establish protocols for Web services, including the harvesting and handling of data
dispensed by various providers using differing techniques;
refine WLCI Data Clearinghouse search tools to enable WLCI Web site visitors to
access a data catalog search interface to discover potential data of interest for the WLCI
area;
develop data-uploading capabilities that enable WLCI community members to directly
contribute resources to the WLCI Data Clearinghouse;
establish protocols for governing data sharing via the WLCI Data Clearinghouse by
requiring non-USGS partners to comply with USGS standards and guidelines, which
require review of distributed information; and
identify data integration problems, formulate potential solutions, and present findings to
the WLCI Data and Information Management Team (DIMT), which will adjudicate
data-management decisions for presentation to the WLCI EC for final approval.
Pr oduc ts Completed i n FY2009
Improved direct access to the Data Clearinghouse through the WLCI Web site
(http://www.wlci.gov/).
Added over 400 data records relevant to the WLCI to the Data Clearinghouse.
Developed protocols for data harvesting using Web services.
Established the ScienceBase Data Clearinghouse user interface.
Refined Data Clearinghouse search tools.

96
Science and Conservation Projects Database
St atus
Ongoing
Contac t s
Natalie Latysh; 303-202-4637; [email protected]
Sky Bristol; 303-202-4181; [email protected]
Scope and Methods
Partners and stakeholders of the WLCI have expressed the need to make accessible the
descriptive information and locations of (1) "on-the-ground" conservation projects managed by the
WLCI CT and (2) science projects being conducted by USGS and other science-agency partners. In
response to this need, the WLCI Project Database Map was developed and is now available on the
home page of the WLCI Web site. The system provides an interactive map environment, which
enables users to click on geospatially placed points, view project information, and link to additional
resources, including data. The Project Database Map is also available on a separate page within the
Web site (http://www.wlci.gov/catalog/WLCI/output/output, fig. 36), where its utility has been
expanded to include search and filter capabilities. Science and conservation-project information is
stored in a geodatabase, which includes point and polygon footprints, and a simple set of attributes
used to describe the projects (title, description, responsible entities, funding year[s], and so on).
Objec t i ves
Develop and enhance the online system to display habitat and science-project locations
on a map with descriptive (attribute) information.
Develop more comprehensive and robust methods for capturing project information
during the proposal period to produce a functional long-term dataset.
Use relevant data sources and data-management methods developed for other broad
USGS scientific efforts for the WLCI.
St udy Area
Activities associated with this subtask apply to the entire WLCI region (fig. 2).
Wor k Ac compl i shed in FY2009 and Findings
In FY2009, the project-tracking map feature of the WLCI Web site was technologically
enhanced and advanced as additional WLCI project information was provided to the USGS and
needs of the WLCI community were refined. This work entailed developing a new interface and
map view of WLCI project locations on the WLCI Website (http://www.wlci.gov; fig. 36);
additional enhancements are slated for FY2010. A project geodatabase for the Web-based mapping
application was developed and is being managed through an ArcGIS server. The database is
maintained by authorized staff in Denver and Fort Collins, Colo., and contains project geospatial
data, including points and polygons locating project activities and a basic set of attributes.
Authorized WLCI community members are able to add and edit project information through the
Project Database Map, accessed via the WLCI Web site, which averages 20 visitors per day.

97
Pr oduc ts Completed i n FY2009
New project-tracking interface and map-display feature.
Project geodatabase containing location and descriptive (attribute) information.
Figure 36. A screen capture of the enhanced Project Database Map accessible through the WLCI Web site (http://www.wlci.gov/catalog/WLCI/output/output).
Outreach and Graphic Products
St atus
Ongoing
Contac t s
Natalie Latysh; 303-202-4637; [email protected]
Sky Bristol; 303-202-4181; [email protected]
Scope and Methods
A project as large, and with as many partners, as the WLCI requires excellent intra- and
interagency communication, as well as dissemination of products and other information to users
interested in learning about the WLCI and tracking its progress. To meet that need, the USGS
developed a usable and content-rich Web presence for the WLCI. The WLCI Web site provides
information about ongoing activities and eases discovery of additional resources, including

98
publications and reports, data products, and habitat and science projects. The WLCI CT and
Communications Team manage content for the WLCI Web site.
Objec t i ves
Develop and maintain a public Web site providing information about WLCI goals and
activities.
Implement a simple content-management mechanism that will allow the WLCI CT and
Communication Team to directly manage content for the WLCI Web site and enable
immediate posting of news items, event listings, new documents, and other dynamic
content.
St udy Area
Activities associated with this subtask apply to the entire WLCI region (fig. 2).
Wor k Ac compl i shed in FY2009 and Findings
In 2009, improvements to the WLCI Web site continued, including development of the
Project Database Map and the WLCI Data Clearinghouse. Augmentation and enhancement of these
resources is continuously spurred by user input, as community members employ these online
resources for WLCI-related activities. Web site resources (Bibliography, News, Highlights) are
being populated directly by WLCI community members, which promotes their ownership of the
Web site and encourages involvement in dissemination of information. The WLCI CT and
Communication Team are jointly responsible for maintaining Web site content and regularly
updating information.
Pr oduc ts Completed i n FY2009
Enhancement and maintenance of the WLCI Web site (http://www.wlci.gov).
Enhancements for posting content to the WLCI Web site directly.
Additional development of the content-management application to facilitate the housing
and maintenance of content specific to the WLCI Web site.
Developed seamless access to WLCI Projects Database mapping application and WLCI
Data Clearinghouse through the WLCI Web site.
Posted agendas, videos, abstracts, and presentations to the WLCI Web site for the 2009
WLCI Science Workshop.
WLCI Coordination, Science Integration, Decisionmaking, and Evaluation
Summary
Integration and Coordination activities continue to be critical components of USGS
involvement in the WLCI. A full-time USGS scientist, who is a member of the WLCI CT, works
with the WLCI CT to manage WLCI operations, coordinate WLCI teams and committees, and
integrate science principles and concepts into WLCI activities to support conservation planning and
to ensure that USGS science helps inform on-the-ground management actions and decisions. This

99
individual serves as a direct connection between local managers, project developers, and
administrators, and as a liaison for the scientific information and technical capabilities available
through USGS and others. In addition to the CT, the USGS also supports and(or) provides
leadership (representation) for other WLCI teams and committees, including the WLCI EC, the
WLCI Monitoring Team, the WLCI Data and Information Management Team, and the Science and
Technical Advisory Committee.
Decisionmaking and evaluation efforts continue to focus on integrating science and
technical assistance into decisions and on iteratively improving the relevance of science by
evaluating what and how information is being used. This includes facilitating the evaluation of
work by multiple partners to ensure that both science and management activities are supporting
WLCI goals. As the knowledge base builds from ongoing integrated-resource assessments,
monitoring, research, and on-the-ground habitat treatments, USGS science and technical support
will provide critical information to help WLCI partners evaluate the costs and benefits of
conservation activities and energy development under alternative management scenarios. In turn,
this will help determine how to minimize or mitigate the negative effects of energy and other types
of development on Wyoming‘s natural resources.
WLCI Coordination, Science Integration, Decisionmaking, and Evaluation
St atus
Ongoing
Contac t s
Patrick Anderson; 970-226-9488; [email protected]
Zachary Bowen; 970-226-9218; [email protected]
Frank D'Erchia; 303-236-1460; [email protected]
Scope and Methods
A program as large and complex as the WLCI requires significant coordination and
management, as well as the integration of what is learned from science with decisionmaking and
program-evaluation processes. For the WLCI, coordination and integration are accomplished
through the WLCI CT, which is composed of one member each from the USGS, BLM, FWS,
WGFD, and WDA. There is also a USGS member on the Science and Technical Advisory
Committee. Under the direction of the WLCI EC, the CT manages the fiscal and logistical
operations necessary to meet the goals and objectives of the WLCI. The CT also is responsible for
conservation planning and implementing adaptive management strategies to guide future
conservation actions. Decisionmaking and evaluation are achieved by iteratively improving the
overall knowledge base as new knowledge is acquired and products completed. The knowledge
and products are then used to inform decisions made about habitat projects and other conservation
activities and to inform evaluations of overall habitat project effectiveness in meeting WLCI goals.
Objec t i ves
Provide coordination for planning and work among multiple research and management
projects to maximize efficiency in meeting the goals of the initiative.
Provide direct technical assistance to multiple WLCI teams and committees.

100
Ensure that the interdisciplinary knowledge, expertise, and work of USGS and other
scientists are available to support the work of WLCI managers and decisionmakers.
St udy Area
Activities associated with this subtask apply to the entire WLCI region (fig. 2).
Wor k Ac compl i shed in FY2009 and Findings
During 2009, the USGS participated in numerous activities designed to inform WLCI
partners about our science activities, improve collaboration, and integrate science with
decisionmaking. These activities included workshops, meetings, tours, and participation associated
with WLCI committees and teams. The largest and most notable workshop was the 2009 WLCI
Science Workshop. The USGS hosted the workshop at the University of Wyoming‘s Hilton
Conference Center on May 12–14, 2009 in Laramie, Wyo. This was the first such presentation to
the broader WLCI community and the public since the 2007 WLCI Science Workshop. The 2007
WLCI Science Workshop was a venue for developing the WLCI framework and for the USGS to
develop the WLCI Science Strategy and frame its science activities. The purpose of the 2009 WLCI
Science Workshop was to inform the broader WLCI community about the completed
organizational framework of the WLCI, with an emphasis on science activities and science
strategies. The workshop focused on six science topics seen as relevant to ongoing WLCI science
and management activities. These were (1) mapping and modeling resources for decisionmaking;
(2) data information and management; (3) fish and wildlife research; (4) changing landscapes; (5)
long-term and targeted monitoring; and (6) reclamation and off-site mitigation. Panelists gave
presentations of ongoing research in these six areas during plenary sessions that were followed by
audience discussions. Four breakout sessions were held to address science needs and gaps
associated with fish and wildlife, changing landscapes, long term and targeted monitoring, and
reclamation. Detailed proceedings from the workshop are being summarized in a workshop
document that will be published in 2010 through the WLCI and the USGS (see the abstracts at
http://www.wlci.gov/viewContent.html?varCSI=10160&vcHeadline=2009%20WLCI%20Science%
20Workshop%20Abstracts [Nuccio and D‘Erchia, 2010]).
The USGS organized several topic-specific meetings during 2009 to better integrate science
information with conservation activities respectively conducted at and proposed for the same
locations. These meetings included the ―Friends of Muddy Creek Workshop‖ (see the section above
on Soil Chemistry: Relationships between Energy Exploration/Development and Salinity of Soils
and Waters) and a tour of Little Mountain Aspen with an associated science meeting. The
objectives of these meetings were to discuss current science activities, needs, and gaps and to
facilitate future collaborations and possible mechanisms for sharing data with interested WLCI
partners and LPDTs. The USGS also conducted a workshop on November 17–20 in Rock Springs
to inform and support land-use planning and decisionmaking by land management agencies, which
will culminate in an Integrated Assessment—comprised of decision-support tools and a
document—that will be published in early 2011.
During 2009, the USGS representative of the CT was involved with numerous coordination and
integration activities. Some of these 2009 activities included
presenting information about USGS science activities and products at numerous EC,
LPDT, BLM, and public meetings;

101
participating in the evaluation and selection of WLCI habitat projects for 2010;
initiating long-term conservation planning associated with LPDTs and identifying
science gaps and needs to support the planning;
meeting with Jonah Interagency Office and Pinedale Anticline Project Office staff to
coordinate conservation planning between WLCI and their offices.
meeting with County Weed and Pest Districts to discuss approaches for managing and
collecting spatial information on invasive species and WLCI priorities;
meeting with WLCI partner resource staff to discuss collaborative efforts and to provide
technical assistance (examples include demonstrating plot designs, reviewing and
revising sampling protocols related to sagebrush and aspen monitoring, and determining
whether to monitor mountain shrub communities);
providing direction to the Monitoring Team about goals and objectives for developing
the partners monitoring database;
meeting with managers associated with the Jonah Interagency Office and the Pinedale
Anticline Project Office to plan and discuss developing a data-management system for
addressing BLM reclamation efforts and reclamation criteria; and
working with WLCI partners, established points of contact, and mechanisms for
acquiring data to support conservation planning.
Pr oduc ts Completed i n FY2009
Nuccio, V.F., and D‘Erchia, F., eds.; Parady, K., and Mellinger, A., comps., 2010,
Wyoming Landscape Conservation Initiative Science and Management Workshop
proceedings, May 12–14, 2009, Laramie, Wyoming: U.S. Geological Survey Scientific
Investigations Report 2010–5067, 111 p.
Abstracts from the 2009 WLCI Science Workshop, online at
http://www.wlci.gov/viewContent.html?varCSI=10139&vcHeadline=2009%20WLCI%2
0Science%20Workshop%20Abstracts.
Many map products used to support decisions or illustrate ecological concepts were
presented at CT and EC meetings.
References Cited
Abendroth, D., unpub. report, Fire ecology annual report 2007: Moose, Wyoming, Grand Teton
National Park.
Barnett, D.T., Stohlgren, T.J., Jarnevich, C.S., Chong, G.W., Ericson, J.A., Davern, T.R., and
Simonson, S.E., 2007, The art and science of weed mapping: Environmental Monitoring and
Assessment, v. 132, p. 235–252. (Available at http://www.refugenet.org/new-pdf-
files/ArtandScience.pdf.)
Bergen, K.M., and Dronova, I., 2007, Observing succession on aspen-dominated landscapes using a
remote sensing-ecosystem approach: Landscape Ecology, v. 22, p. 1395–1410.

102
Biewick , L.R.H., 2009, Oil and gas development data in southwestern Wyoming—Energy data
and services for the Wyoming Landscape Conservation Initiative (WLCI): U.S. Geological
Survey Data Series DS-437, unpaged. Available at http://pubs.usgs.gov/ds/437.
Blecker, S.W., Stillings, L.L., Amacher, M.C., Ippolito, J.A., and DeCrappeo, N., 2010, Ecosystem
health in mineralized terrane—Data from podiform chromite (Chinese Camp mining district,
California), quartz alunite (Castle Peak and Masonic mining districts, Nevada/California), and
Mo/Cu porphyry (Battle Mountain mining district, Nevada) deposits: U.S. Geological Survey
Open-File Report, 2010–1040, 38 p.
Bonham, C.D., 1989, Measurements for terrestrial vegetation: Wiley Interscience Publications,
John Wiley and Sons, N.Y., 338 p.
Bowen, Z.H., Aldridge, C.L., Anderson, P.J., Assal, T.J., Baer, L.A., Bristol, S., Carr, N.B., Chong,
G.W. Diffendorfer, J.E., Fedy, B.C., Homer, S.L., Manier, D., Kauffman, M.J., Latysh, N.,
Melcher, C.P., Miller, K.A., Montag, J., and others, 2009, U.S. Geological Survey science for the
Wyoming Landscape Conservation Initiative—2008 annual report: U.S. Geological Survey
Open-File Report 2009–1201, 83 p.
Bowen, Z.H., Aldridge, C.L.., Anderson, P.J., Chong, G.W., Drummond, M.A., Homer, C.,
Johnson, R.C., Kauffman, M.J., Knick, S.T., Kosovich, J.J., Miller, K.A., Owens, T., Shafer, S.,
and Sweat, M.J., 2009, U.S. Geological Survey Science Strategy for the Wyoming Landscape
Conservation Initiative: U.S. Geological Survey Scientific Investigations Report 2008–5195,
26 p.
Brookes, P.C., 1995, The use of microbial parameters in monitoring soil pollution by heavy metals:
Biology and Fertility of Soils, v. 19, p. 269–279.
Clark, M.L., and Davidson, S.L., 2009, Specific conductance and dissolved-solids characteristics
for the Green River and Muddy Creek, Wyoming, water years 1999–2008: U.S. Geological
Survey Scientific Investigations Report 2009–5168, 18 p.
Collins, W.D., Bitz, C.M., Blackmon, M.L., Bonan, G.B., Bretherton, C.S., Carton, J.A., Chang, P.,
Doney, S.C., Hack, J.J., Henderson, T.B., Kiehl, J.T., Large, W.G., McKenna, D.S., Santer, B.D.,
and Smith, R.D., 2006, The community climate system model version 3 (CCSM3): Journal of
Climate, v. 19, p. 2122–2143.
Cross, P.C., Edwards, W.H., Scurlock, B., Machaik,E., and Rogerson, J., 2007, Management and
climate impacts on brucellosis in elk of the Greater Yellowstone Ecosystem: Ecological
Applications, v. 17, no. 4, p. 957–964.
Dillon, G.K., Knight, D.H., and Meyer, C.B., 2005, Historic range of variability for upland
vegetation in the Medicine Bow National Forest, Wyoming: Fort Collins, Colo., U.S. Department
of Agriculture, RMRS-GTR-139, 85 p.
Doran, J.W., and Parkin, T.B., 1994, Defining and assessing soil quality, in Doran, J.W., and
others, eds., Defining soil quality for a sustainable environment: Madison, Wis., Soil Science
Society of America Special Publication 35, p. 3–21.
Dyni, J., 2005, United States oil shale deposits: U.S. Geological Survey Scientific Investigations
Report 2005–5294.
Garrett, RG., 2009, Relative spatial soil geochemical variability along two transects across the
United States and Canada: Applied Geochemistry, v. 24, no. 8, p. 1405–1415.
Gil-Sotres, F., Trasar-Cepeda, C., Leiros, M.C., and Seoane, S., 2005, Different approaches to
evaluating soil quality using biochemical properties: Soil Biology and Biochemistry, v. 37,
p. 877–887.

103
Halvorson, J.J., Smith, J.L., and Papendick, R.I., 1996, Integration of multiple soil parameters
to evaluate soil quality: a field experiment example: Biology and Fertility of Soils, v. 21,
p. 207-214.
Holloran, M.J., 2009. Greater Sage-grouse focused herbaceous monitoring of the Moxa Arch
sagebrush vegetation treatments. Pinedale, Wyo., BLM Kemmerer Field Office, Job Completion
Report by Wyoming Wildlife Consultants, LCC, 22p.
Homer, C.G., Aldridge, C.L., Meyer, D.K., Coan, M.J., and Bowen, Z.H., 2009, Multiscale
sagebrush rangeland habitat modeling in Southwest Wyoming: U.S. Geological Survey
Open-File Report 2008-1027, 14 p.
Horne, J.S., Garton, E.O., Krone, S.M., and Lewis, J.S., 2007, Analyzing animal movements using
Brownian Bridges: Ecology, v. 88, p. 2354–2363.
Insam, H., and Domsch, K.H., 1988, Relationship between soil organic carbon and microbial
biomass on chronosequences of reclamation sites: Microbial Ecology, v. 15, p. 177–188.
Jobes, P.C., 1987, The disintegration of gemeinschaft social structure from energy development—
Observations from ranch communities in the Western United States: Journal of Rural Studies,
v. 3, no. 3, p. 219–229.
Johnson, R.C., Finn, T.M., and Roberts, L.N.R., 2005, The Mesaverde total petroleum system,
Southwestern Wyoming Province, Chapter 8, in U.S. Geological Survey Southwestern Wyoming
Province Assessment Team, compilers, ed., Petroleum systems and geologic assessment of oil
and gas in the Southwestern Wyoming Province, Wyoming, Colorado, and Utah: U.S. Geological
Survey Digital Data Series DDS-69-D, Version 1.0, 43 p. (Available online at
http://pubs.usgs.gov/dds/dds-069/dds-069-d/REPORTS/69_D_CH_8.pdf.)
Jones, N.R., Jones, R.W., Scott, J.E., and Lucke, D.W., 2009, Coal map of Wyoming: Wyoming
State Geological Survey Map Series 93.
Keigley, R.B., Frisina, M.R., and Fager, C., 2002, Assessing browse trends at the landscape level,
part 1—Preliminary steps and field survey: Rangelands, v. 24, p. 28–38.
Kirschbaum, M.A., Charpentier, R.R., Crovelli, R.A., Klett, T.R., Pollastro, R.M., and Schenk, C.J.
(USGS Southwestern Wyoming Province Assessment Team), 2004, Assessment of undiscovered
oil and gas Resources of the Wyoming Thrust Belt Province, 2003: U.S. Geological Survey Fact
Sheet 2004–3025, 2 p. (Available online at http://pubs.usgs.gov/fs/2004/3025.)
Kirschbaum, M.A., and Roberts, L.N.R., 2005, Geologic assessment of undiscovered oil and gas
resources of the Mowry Composite Total Petroleum System, Southwestern Wyoming Province,
Wyoming, Colorado, and Utah, Chapter 5, in USGS Southwestern Wyoming Province
Assessment Team, compilers, ed., Petroleum systems and geologic assessment of oil and gas in
the Southwestern Wyoming Province, Wyoming, Colorado, and Utah: U.S. Geological Survey
Digital Data Series DDS-69-D, Version 1.0, 27 p. (Available online at
http://pubs.usgs.gov/dds/dds-069/dds-069-d/REPORTS/69_D_CH_5.pdf.)
Meehl, G.A., Covey, C., Delworth, T., Latif, M., McAvaney, B., Mitchell, J.F.B., Stouffer, R.J.,
and Taylor, K.E., 2007, The WCRP CMIP3 multi-model dataset—A new era in climate change
research: Bulletin of the American Meteorological Society, v. 88, p. 1383–1394.
Mitchell, T.D., and Jones, P.D., 2005, An improved method of constructing a database of monthly
climate observations and associated high-resolution grids: International Journal of Climatology,
v. 25, p. 693–712.
Nakicenovic, N., Alcamo, J., Davis, G., de Vries, B., Fenhann, J., Gaffin, S., Gregory, K., Grübler,
A., Jung, T.Y., Kram, T., Lebre La Rovere, E., Michaelis, L., Mori, S., Morita, T., Pepper, W.,
Pitcher, H., Price, L., Riahi, K., Roehrl, A., Rogner, H.-H., Sankovski, A., Schlesinger, M.,

104
Shukla, P., Smith, S., Swart, R., van Rooijen, S., Victor, N., and Dadi, Z., 2000, Special report on
emissions scenarios—A special report of Working Group III of the Intergovernmental Panel on
Climate Change: Cambridge, Cambridge University Press, 599 p.
Nielsen, M.N., and Winding, A., 2002, Microorganisms as indicators of soil health: Copenhagen,
Denmark, National Environmental Research Institute, Technical Report 388, 85 p., accessed
online on September, 2008, at
http://www.dmu.dk/1_viden/2_Publikationer/3_fagrapporter/rapporter/FR388.pdf.
Nuccio, V.F., and D'Erchia, F., eds.; Parady, K., and Mellinger, A., comps., 2010, Wyoming
Landscape Conservation Initiative Science and Management Workshop proceedings, May 12–14,
2009, Laramie, Wyoming: U.S. Geological Survey Scientific Investigations Report 2010–5067,
109 p.
Papendick, R.I., and Parr, J.F., 1992, Soil quality—The key to a sustainable agriculture: American
Journal of Alternative Agriculture, v. 7, p. 2–3.
Pope, V., Gallani, M.L., Rowntree, P.R., Stratton, R.A., 2000, The impact of new physical
parameterizations in the Hadley Centre climate model—HadAM3: Climate Dynamics, v. 16, p.
123–146.
Quillinan, S.A., Worman, B.N., and Rodgers, J.R., 2009, Coalbed natural gas activity in the
Atlantic Rim Area, Carbon County, Wyoming: Wyoming State Geological Survey Open File
Report 09–7.
Salant, P., and Dillman, D.A.,1994, How to conduct your own survey: New York, John Wiley &
Sons, Inc., 232 p.
Sawyer, H., 2010, Habitat use and migration ecology of mule deer in developing gas fields of
western Wyoming: Laramie, Wyo., University of Wyoming, Ph. D. dissertation.
Sawyer, H., Kauffman, M.J., Nielson, R.M., and Horne, J. S., 2009, Identifying and prioritizing
ungulate migration routes for landscape-level conservation: Ecological Applications, v. 19, p.
2016–2025.
Scinocca, J.F., McFarlane, N.A., Lazare, M., Li, J., and Plummer, D., 2008, The CCCma third
generation AGCM and its extension into the middle atmosphere: Atmospheric Chemistry and
Physics, v. 8, p. 7055–7074.
Shinneman, D.J., and Baker, W.L., 2009, Environmental and climatic variables as potential drivers
of post-fire cover of cheatgrass in seeded and unseeded semiarid ecosystems: International
Journal of Wildland Fire, v. 18, p. 191–202.
Sitch, S., Smith, B., Prentice, I.C., Arneth, A., Bondeau, A., Cramer, W., Kaplan, J.O., Levis, S.,
Lucht, W., Sykes, M.T., Thonicke, K., and Venevsky, S., 2003, Evaluation of ecosystem
dynamics, plant geography and terrestrial carbon cycling in the LPJ dynamic global vegetation
model: Global Change Biology, v. 9, p. 161–185.
Smith, D.B., Cannon, W.F., Woodruff, L.G., Garrett, R.G., Klassen, R., Kilburn, J.E., Horton, J.D.,
King, H.D., Goldhaber, M.B., and Morrison, J.M., 2005, Major- and trace-element concentrations
in soils from two continental-scale transects of the United States and Canada: U.S. Geological
Survey Open-File Report 2005–1253, 20 p. (Available online at
http://pubs.usgs.gov/of/2005/1253/>.)
Smith, D.B., and Ellefsen, K.J., 2010, Soil geochemical data for the Wyoming Landscape
Conservation Initiative study area: U.S. Geological Survey Data Series Report 510, 10 p.
(Available online at http://pubs.usgs.gov/ds/510/downloads/DS-510.pdf).
Solomon, S., Qin, D., Manning, M., Chen, Z., Marquis, M., Averyt, K.B., Tignor, M., and Miller,
H.L., eds., 2007, Climate change 2007—The physical science basis—Contribution of working
105
group I to the Fourth Assessment Report of the Intergovernmental Panel on Climate Change:
Cambridge, Cambridge University Press, 996 p.
U.S. Geological Survey, 2007, Facing tomorrow‘s challenges—U.S. Geological Survey science in
the decade 2007–2017: U.S. Geological Survey Circular 1309, x + 70 p. (Available at
http://pubs.usgs.gov/circ/2007/1309/.)
U.S. Geological Survey, 2010a, Mineral resources program—New Mineral Resources Data System
(NewMRDS): U.S. Geological Survey internal-use, password-protected master database,
accessed January 26, 2010, at http://mrds.cr.usgs.gov:7777/mrds/f?p=130:1.
U.S. Geological Survey, 2010b, Mineral resources program—New Mineral Resources Data System
(NewMRDS): U.S. Geological Survey public database, accessed January 26, 2010, at
http://tin.er.usgs.gov/mrds.
U.S. Geological Survey, variously dated, National field manual for the collection of water-quality
data: U.S. Geological Survey Techniques of Water-Resources Investigations, book 9, chaps.
A1–A9, available at http://pubs.water.usgs.gov/twri9A.
U.S. Geological Survey, variously dated [see 2009], Water-resources data for the United States,
Water Year 2008: U.S. Geological Survey Water-Data Report WDR-US-2008, at
http://wdr.water.usgs.gov/.
U.S. Geological Survey Southwestern Wyoming Province Assessment Team, comps., 2005,
Petroleum systems and geologic assessment of oil and gas in the Southwestern Wyoming
Province, Wyoming, Colorado, and Utah: U.S. Geological Survey, Digital Data Series DDS-69-
D, ver. 1, 1 CD–ROM. (Available online at http://pubs.usgs.gov/dds/dds-069/dds-069-d/.)
Wagner, R.J., Boulger, R.W., Jr., Oblinger, C.J., and Smith, B.A., 2006, Guidelines and standard
procedures for continuous water-quality monitors—Station operation, record computation, and
data reporting: U.S. Geological Survey Techniques and Methods 1-D3, 51 p. + 8 attachments.
(Available online at http://pubs.water.usgs.gov/tm1d3.)
Wilson, A.B., Klein, T.L., and Heran, W.D., 2001, Databases and simplified geology for
mineralized areas, claims, mines, and prospects in Wyoming: U.S. Geological Survey Open-File
Report 01-0497, accessed January 26, 2010, at http://pubs.usgs.gov/of/2001/ofr-01-0497/.
Wyoming Game and Fish Department, 2005, A comprehensive wildlife conservation strategy for
Wyoming: Cheyenne, Wyo., Wyoming Game and Fish Department, 562 p.
Xian, G., Homer, C.G., and Aldridge, C.L., (in press), Assessing long-term variations in sagebrush
habitat—Characterization of spatial extents and distribution patterns using multi-temporal
satellite remote sensing data: International Journal of Remote Sensing, v. 32, no. x., p. xx-xx.

106
Publishing support provided by:
Denver Publishing Service Center
For more information concerning this publication, contact:
Center Director, USGS Fort Collins Science Center
2150 Centre Ave., Bldg. C
Fort Collins, CO 80526-8118
(970)226-9398
Or visit the Fort Collins Science Center Web site at:
http://www.fort.usgs.gov/

Back cover photo credits: Black Rock, a significant landscape feature surrounded by sagebrush near Wamsutter, Sweetwater County, Wyoming (photo by Collin Homer, U.S. Geological Survey). Smaller photos from left to right: (1) adult Greater Sage-Grouse (photo by Cameron Aldridge, U.S. Geological Survey and Colorado State University); (2) Indian Paintbrush (photo by Michelle Gilbert, University of Wyoming); (3) Michelle Gilbert checking a Brewer’s sparrow nest (photo by Sarah Laske, University of Wyoming); (4) Sage Thrasher nest and eggs (photo by Michelle Gilbert); and (5) well pad in the Jonah natural gas field (photo by Caleb Mitchell, University of Wyoming).

U.S. G
eological Survey Science for the Wyom
ing Landscape Conservation Initiative—2009 A
nnual Report— Open-File Report 2010–1231


