Updates for AQM V5.1 for O3 and PM2.5 48 hour predictions
Verification Stats:
http://www.emc.ncep.noaa.gov/mmb/aq/fvs/web/html/regular.html
Spatial Maps: http://www.emc.ncep.noaa.gov/mmb/aq/cmaqparabc/web/html/index.html
04/19/2018
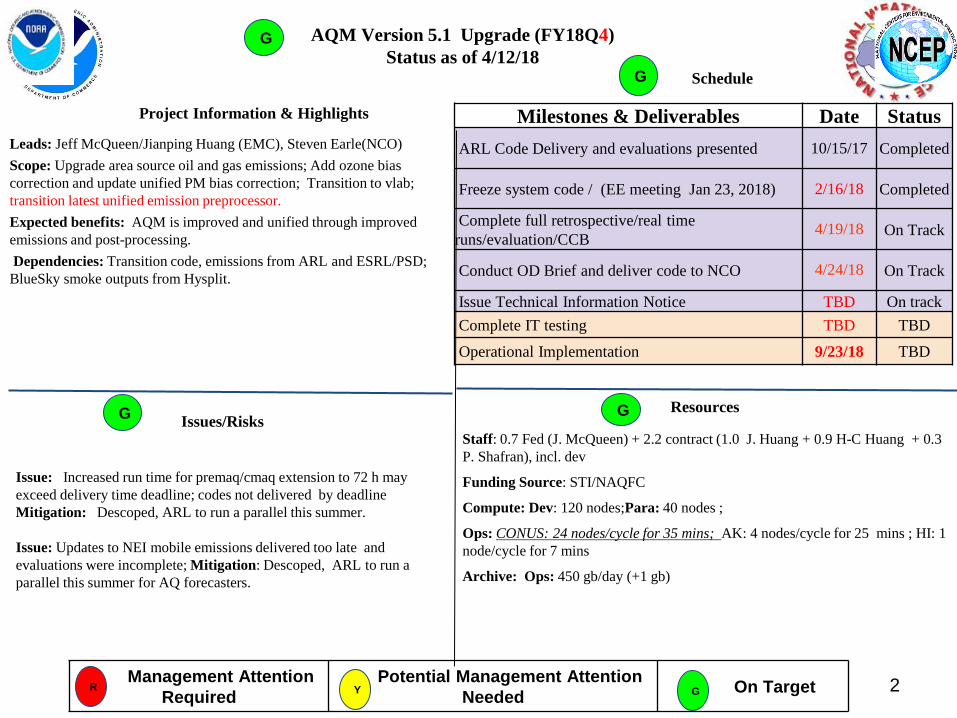
Leads: Jeff McQueen/Jianping Huang (EMC), Steven Earle(NCO) Scope: Upgrade area source oil and gas emissions; Add ozone bias correction and update unified PM bias correction; Transition to vlab; transition latest unified emission preprocessor. Expected benefits: AQM is improved and unified through improved emissions and post-processing. Dependencies: Transition code, emissions from ARL and ESRL/PSD; BlueSky smoke outputs from Hysplit.
AQM Version 5.1 Upgrade (FY18Q4) Status as of 4/12/18
Schedule
Project Information & Highlights
Issue: Increased run time for premaq/cmaq extension to 72 h may exceed delivery time deadline; codes not delivered by deadline Mitigation: Descoped, ARL to run a parallel this summer. Issue: Updates to NEI mobile emissions delivered too late and evaluations were incomplete; Mitigation: Descoped, ARL to run a parallel this summer for AQ forecasters.
Issues/Risks
Management Attention Required
Potential Management Attention Needed On Target G Y R
Resources
Milestones & Deliverables Date Status ARL Code Delivery and evaluations presented 10/15/17 Completed
Freeze system code / (EE meeting Jan 23, 2018) 2/16/18 Completed
Complete full retrospective/real time runs/evaluation/CCB 4/19/18 On Track
Conduct OD Brief and deliver code to NCO 4/24/18 On Track
Issue Technical Information Notice TBD On track Complete IT testing TBD TBD Operational Implementation 9/23/18 TBD
Staff: 0.7 Fed (J. McQueen) + 2.2 contract (1.0 J. Huang + 0.9 H-C Huang + 0.3 P. Shafran), incl. dev
Funding Source: STI/NAQFC
Compute: Dev: 120 nodes;Para: 40 nodes ;
Ops: CONUS: 24 nodes/cycle for 35 mins; AK: 4 nodes/cycle for 25 mins ; HI: 1 node/cycle for 7 mins
Archive: Ops: 450 gb/day (+1 gb)
G
G
G
G
2
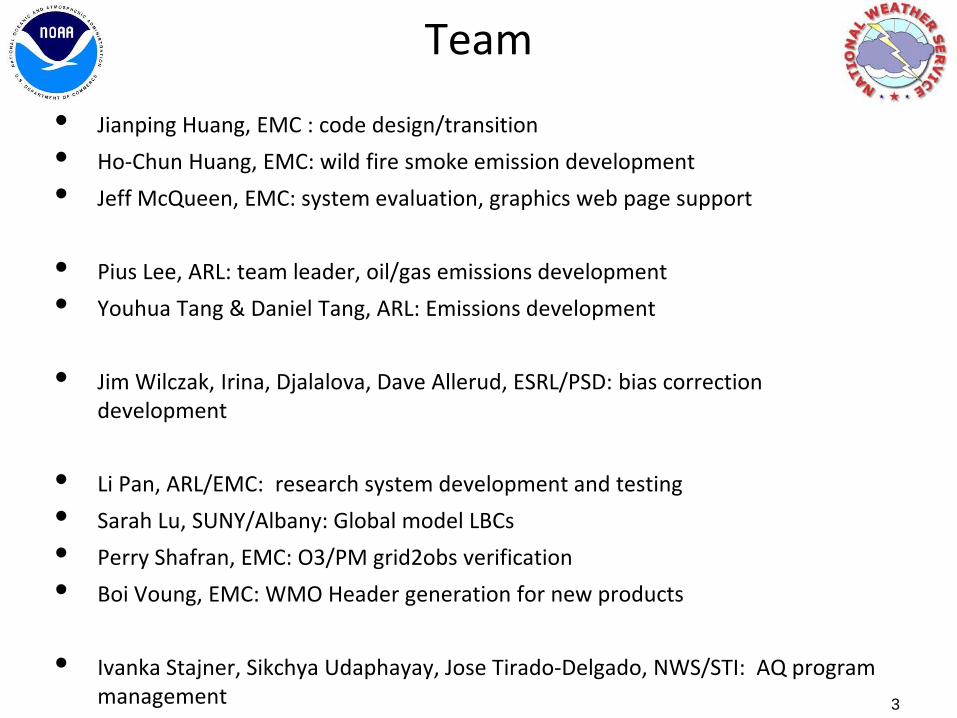
Team
• Jianping Huang, EMC : code design/transition • Ho-Chun Huang, EMC: wild fire smoke emission development • Jeff McQueen, EMC: system evaluation, graphics web page support
• Pius Lee, ARL: team leader, oil/gas emissions development • Youhua Tang & Daniel Tang, ARL: Emissions development
• Jim Wilczak, Irina, Djalalova, Dave Allerud, ESRL/PSD: bias correction
development
• Li Pan, ARL/EMC: research system development and testing • Sarah Lu, SUNY/Albany: Global model LBCs • Perry Shafran, EMC: O3/PM grid2obs verification • Boi Voung, EMC: WMO Header generation for new products
• Ivanka Stajner, Sikchya Udaphayay, Jose Tirado-Delgado, NWS/STI: AQ program
management
3

Summary of Upgrades
• Updates to anthropogenic emissions (NOAA/ARL) – Oil & gas sector emission update to 2017 from NEI 2011 – Species ratio adjustment for Colorado winter VOC emissions
• Updates to Kalman Filter ANalog (KFAN) Bias Correction
(ESRL/PSD) – Included ozone bias correction – Added processing for rare events (V8) – Increased number of sites to over 900 sites – Consistent CMAQ V5 predictions training data – Add the use of downward SW radiation for analog selection
• Update Alaska/Hawaii system to same CONUS V5.0.2
– Moved to Cray (same as CONUS) – Small impact, was to be delivered in FY17 upgrade
4

5
Point source: Static for outside the border: - Canada 2011 Environment Canada Emission Inventory (ECEI); - Mexico inventory (MI) 2012 version 2.2 Upgrade based on 2016 Continuous Emission Monitoring (CEM ) & scaled by the Energy Outlook released by DoE in Jan 2018 Area source: Upgrade for Oil and Gas Sector by including::
Activity data from 2016 production inventories - Contributions from fracking - Latest Formaldehyde to total-VOC ratios
Emission Upgrades NOAA/ARL
5
6
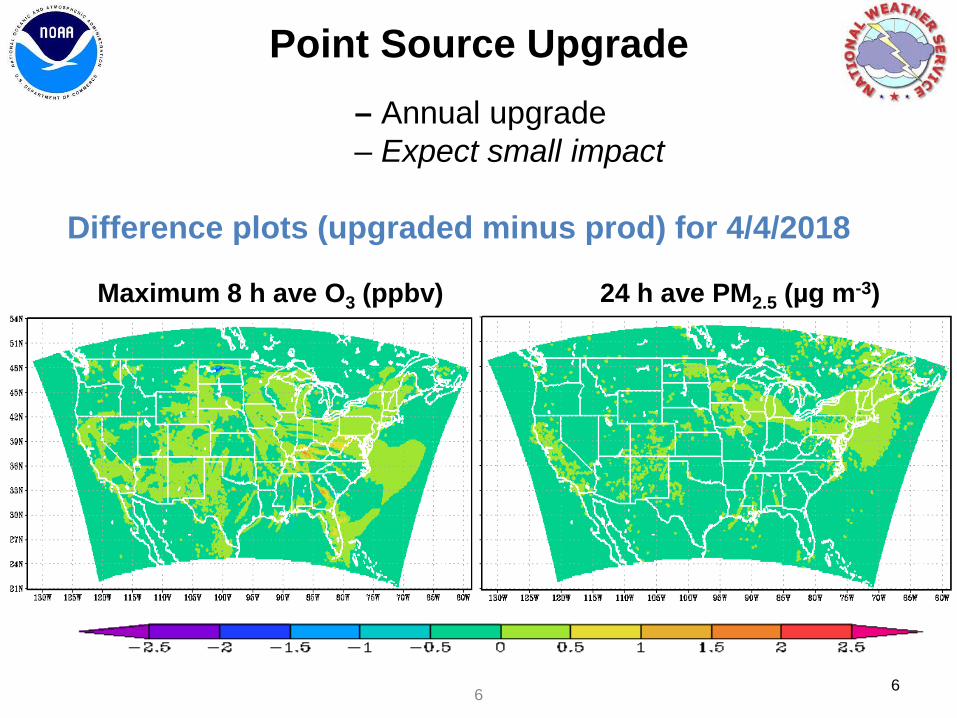
– Annual upgrade – Expect small impact Difference plots (upgraded minus prod) for 4/4/2018
Daily Maximum 8 h ave O3 (ppbv) 24 h ave PM2.5 (µg m-3)
Point Source Upgrade
6

7
Source: Oil and gas activity upgrade – expect significant local impact O3 (ppb) distribution valid at 18Z July 18 2017
Morgan Town, WV
Prod Upgraded
7
8
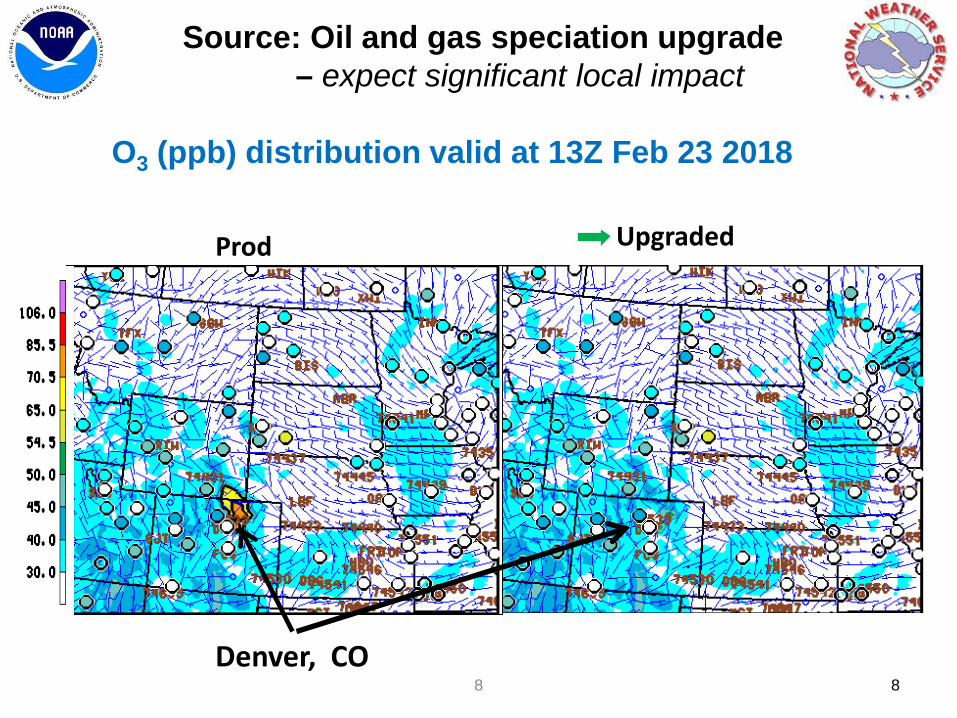
Area Source: Oil and gas speciation upgrade – expect significant local impact O3 (ppb) distribution valid at 13Z Feb 23 2018
Denver, CO
Upgraded Prod
8

ESRL Bias Correction Jim Wilczak, ESRL/PSD
• Analog post-processing schemes require the ability to find good analogs from past forecasts in the post-processing training data. Short training data sets are less likely to have extreme (rare) events.
9
• Forest fires are extremely episodic, and can create extreme values of PM2.5 and other AQ variables including ozone.
• CMAQ has some skill at forecasting forest fire effects because of the inclusion of
satellite-derived data assimilation of fire position, size and intensity. Therefore when an extreme high PM2.5 concentration is forecast, it is likely to be true.
• A standard analog post-processing technique will mistakenly reduce the forecast high PM if the best historical analogs it can find are from non-fire days.
• New algorithm: if algorithm is unable to find good analogs, compute the difference between the current forecast and its analogs, and add this difference to the standard KFAN forecast.
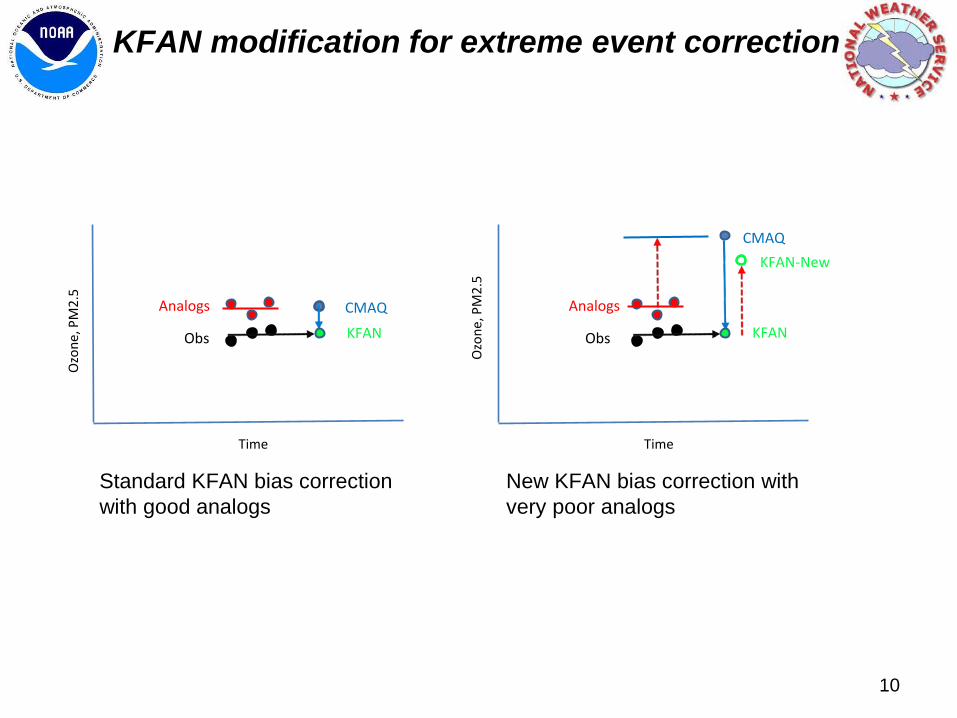
Analogs
Obs
CMAQ
KFAN
Time
KFAN-New
Standard KFAN bias correction with good analogs
CMAQ
KFAN
Analogs
Obs
Time
Ozo
ne, P
M2.
5 New KFAN bias correction with very poor analogs
KFAN modification for extreme event correction O
zone
, PM
2.5
10

Bias correction configuration Ozone PM2.5
Variables used to determine analogs
1) Ozone concentration 2) Wind direction, 10 meters 3) Wind speed, 10 meters 4) Temperature, 2 meters 5) Solar radiation reaching surface 6) PBL height (ACM2 based Richardson number) 7) NOx concentration 8) NOy concentration
1) PM2.5 concentration 2) Wind direction, 10 meters 3) Wind speed, 10 meters 4) Temperature, 2 meters 5) Solar radiation reaching surface
Number of analogs used
10 10
Training period Rolling 12 months Rolling 12 months (skip July 4 and July 5)
Training model configuration
CMAQ 5.0.2 CMAQ 5.0.2
11
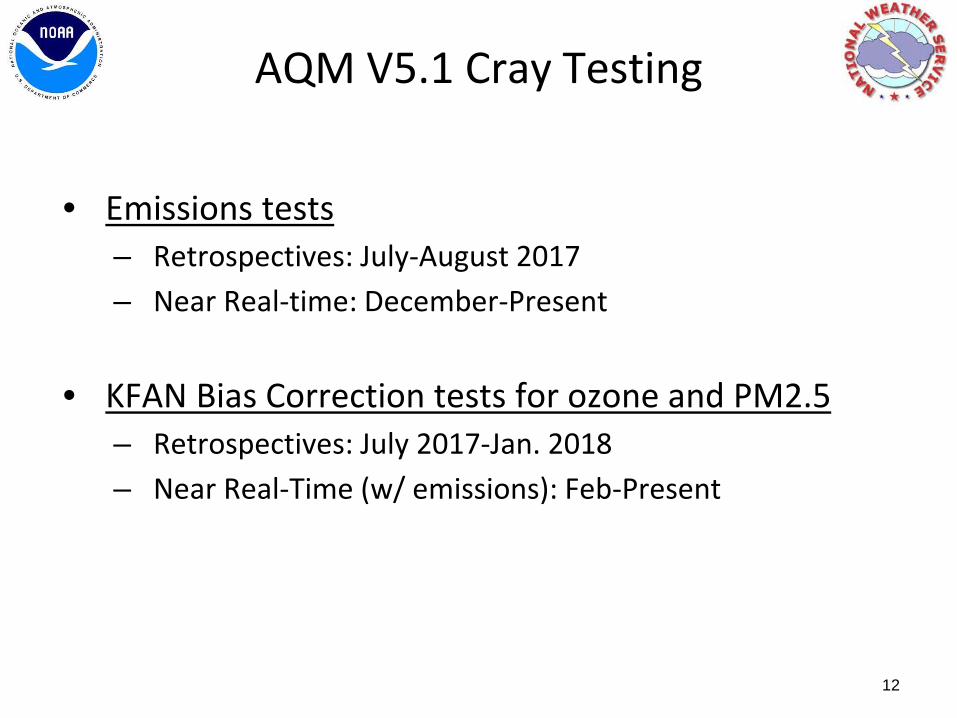
AQM V5.1 Cray Testing
• Emissions tests – Retrospectives: July-August 2017 – Near Real-time: December-Present
• KFAN Bias Correction tests for ozone and PM2.5 – Retrospectives: July 2017-Jan. 2018 – Near Real-Time (w/ emissions): Feb-Present
12

Prod, EXP and EXP bias corrected O3 Diurnal time-series
July 2017
13
EAST U.S. WEST U.S.
Exp Unified Bias Correction near perfect Prod & V5.1: - typical over-prediction East - under-prediction West
Experimental
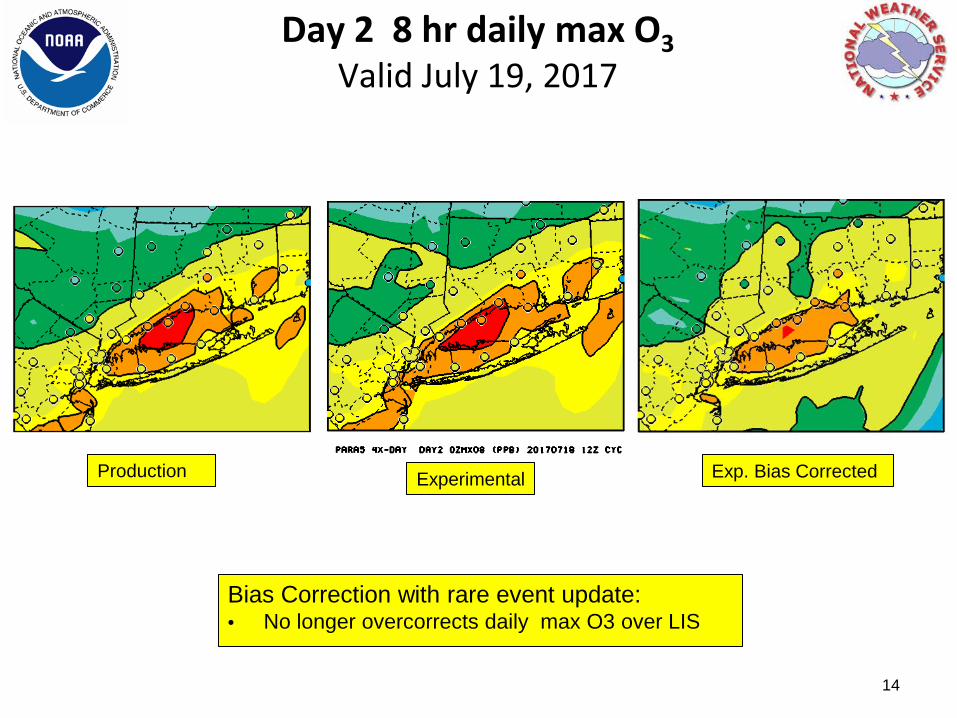
Day 2 8 hr daily max O3 Valid July 19, 2017
Bias Correction with rare event update: • No longer overcorrects daily max O3 over LIS
Production Exp. Bias Corrected
14

Day 2 8hr daily max O3 Valid July 19,2017
15
OBS: 77 ppb Prod: 67 Exp BC: 61
EXP BC - Production
Philadelphia experimental bias-corrected O3 predictions degraded from Raw production predictions by 5-10 ppb

Prod, V5.1, Exp bias corrected O3 Day 2 Daily Time Series
August, 2017
16
WEST U.S.
Exp Bias Correction reduces large overpredictions esp. over East
EAST U.S.
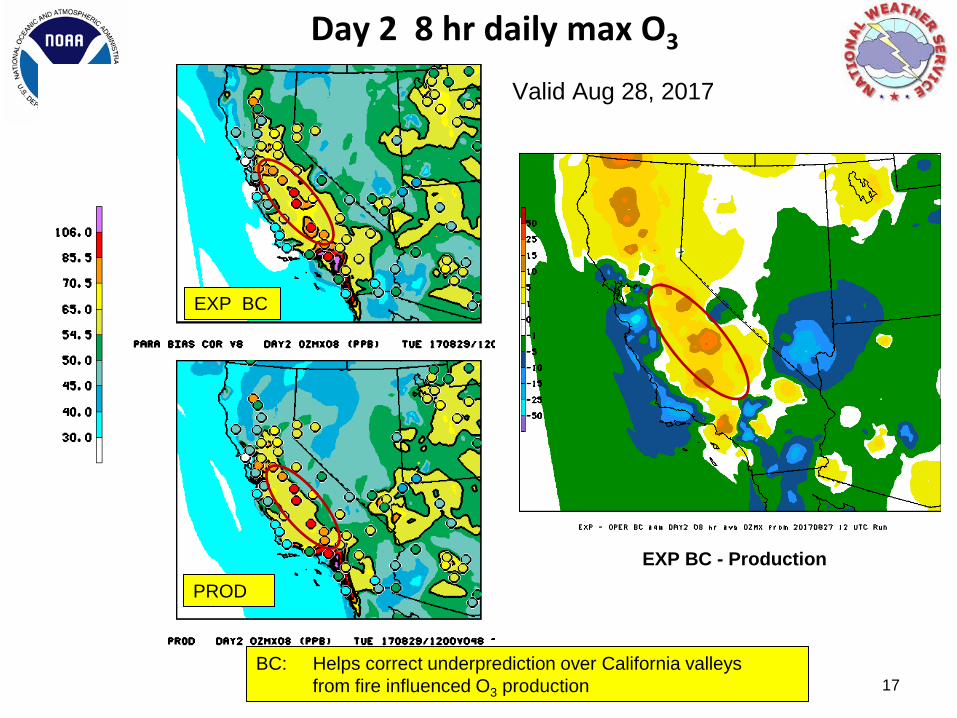
Day 2 8 hr daily max O3
BC: Helps correct underprediction over California valleys from fire influenced O3 production
PROD
EXP BC
EXP BC - Production
Valid Aug 28, 2017
17
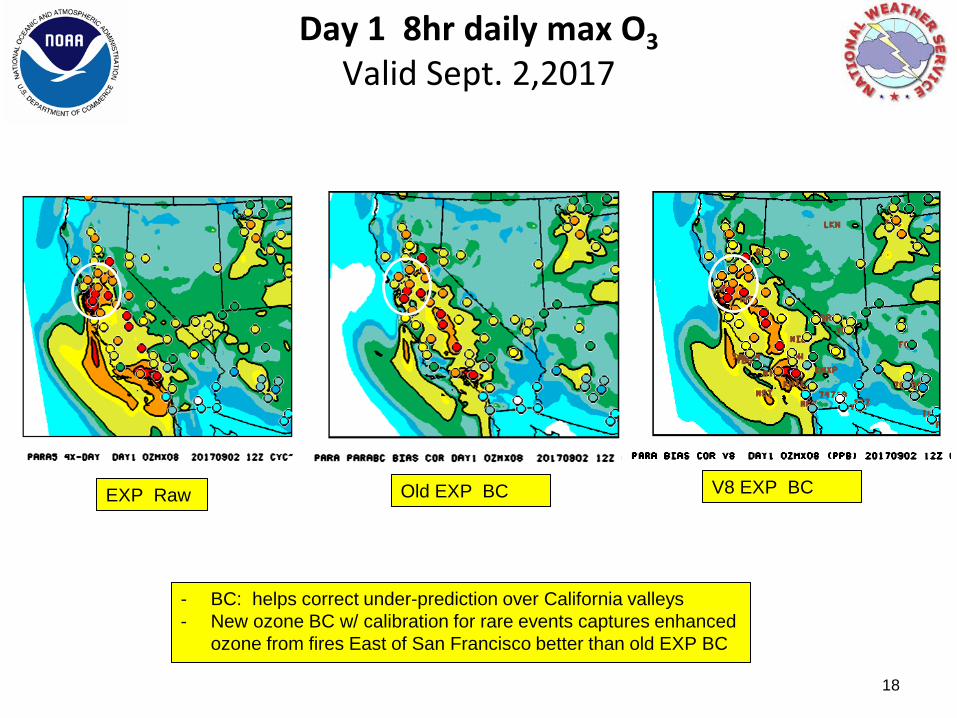
Day 1 8hr daily max O3 Valid Sept. 2,2017
EXP Raw Old EXP BC
- BC: helps correct under-prediction over California valleys - New ozone BC w/ calibration for rare events captures enhanced
ozone from fires East of San Francisco better than old EXP BC
V8 EXP BC
18

Raw PM Production vs PM Production Bias correction vs Experimental Bias Correction (V8)
Predictions
19

• Large improvement with Exp. Bias correction esp. over East • Note: Operational bias correction still using old V4 training predictions
Prod, Prod BC, Exp BC PM2.5 Diurnal Time Series
July, 2017
20

Prod, Prod BC, Exp BC PM2.5 Diurnal Time Series
August, 2017
21
• Improvement with Exp. Bias correction over West compared to Prod BC • All BC results are degraded compared to raw predictions over West - Extensive fires over NW US • Note: Operational bias correction still using old V4 training prediction

Prod, Prod BC, Exp BC PM2.5 Daily Time Series
August, 2017
22
EAST WEST
Exp Bias correction • West: - Removes post wild-fire event noise - Overcorrects some fire events esp. early Aug • East: Similar to prod BC, some improvement around 8/25/17
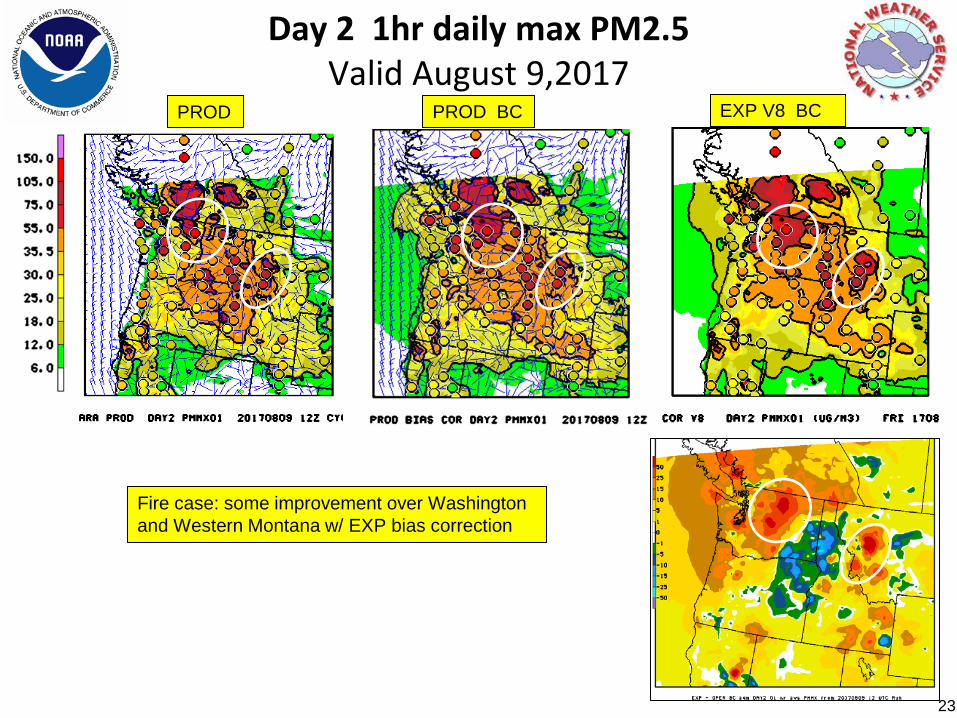
EXP V8 BC
Day 2 1hr daily max PM2.5 Valid August 9,2017
Fire case: some improvement over Washington and Western Montana w/ EXP bias correction
PROD PROD BC
23

Prod, Prod BC, Exp BC PM2.5 Diurnal Time Series
September 2017
24
• Improvement with Exp. Bias correction over West during the daytime compared to prod BC
• Best improvement over East with bias correction • Note: Operational bias correction using old V4 training prediction
EAST WEST

Day 2 24hr daily AVE PM2.5 Valid Sept. 6,2017
EXP PM bias correction overcorrects raw forecasts over East OR/West ID (due to night-time overcorrection ?)
EXP BC V8
PROD “raw”
EXP BC - PROD
NW Coast Diurnal Time Series
25

Prod, Prod BC, Exp BC PM2.5 Diurnal Time Series
January 2018
26
• Less PM (improved) over East with experimental bias correction processing Note: Operational bias correction now using correct V5 training predictions
EAST WEST
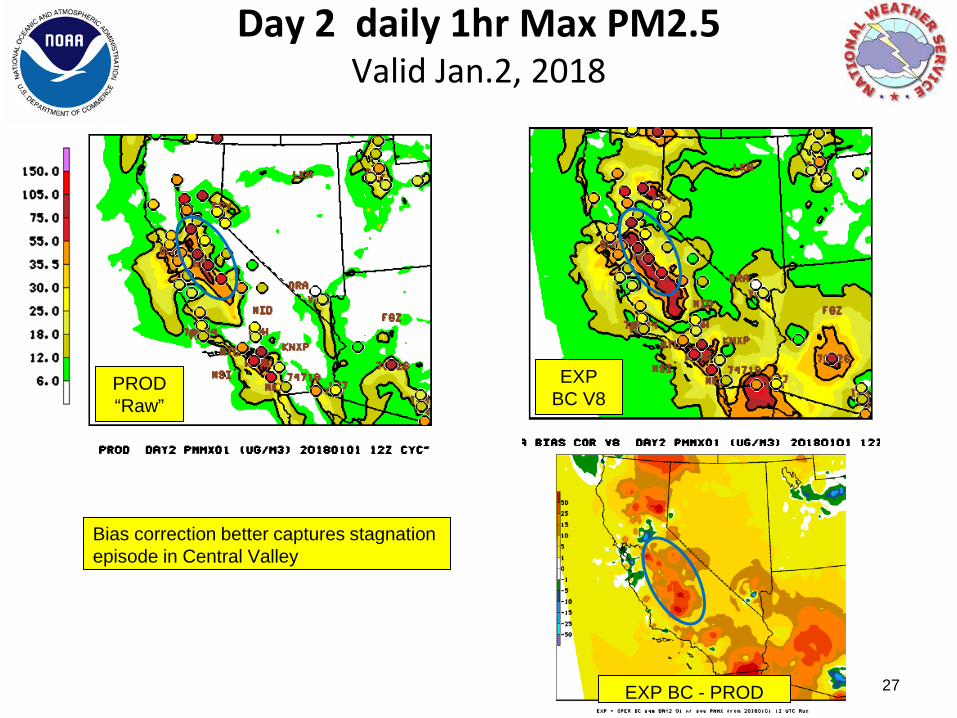
Day 2 daily 1hr Max PM2.5 Valid Jan.2, 2018
Bias correction better captures stagnation episode in Central Valley
EXP BC V8
PROD “Raw”
EXP BC - PROD 27
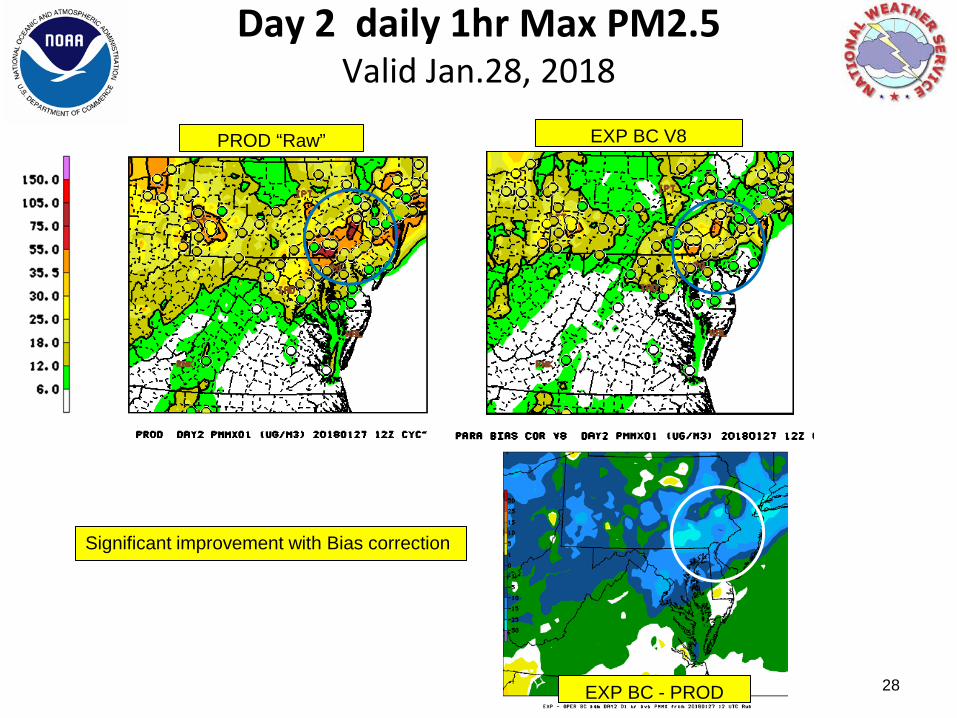
Day 2 daily 1hr Max PM2.5 Valid Jan.28, 2018
Significant improvement with Bias correction
PROD “Raw” EXP BC V8
EXP BC - PROD 28

EMC Case Analysis
• EXP Ozone Bias Correction: Large improvement without degrading most exceedance cases in Summer • Philadelphia exceptions noted
• Summer PM Bias Correction :
‒ Overall improvement statistically correcting raw model over-predictions (still too much PM near fires at night)
‒ Still some overcorrection during fire events but improvements after high PM events
• Winter PM Bias Correction: – Improved over West and North East with bias correction
especially during strong stagnation episodes
29
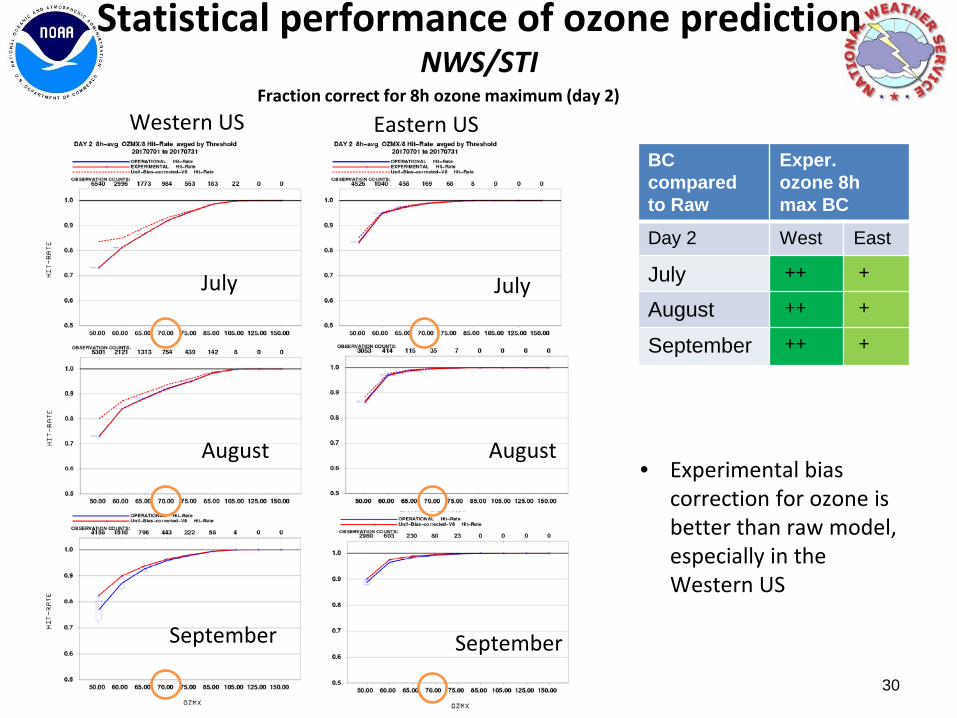
Statistical performance of ozone prediction NWS/STI
Western US Eastern US BC compared to Raw
Exper. ozone 8h max BC
Day 2 West East
July ++ +
August ++ +
September ++ +
July July
August August
September September
Fraction correct for 8h ozone maximum (day 2)
• Experimental bias correction for ozone is better than raw model, especially in the Western US
30
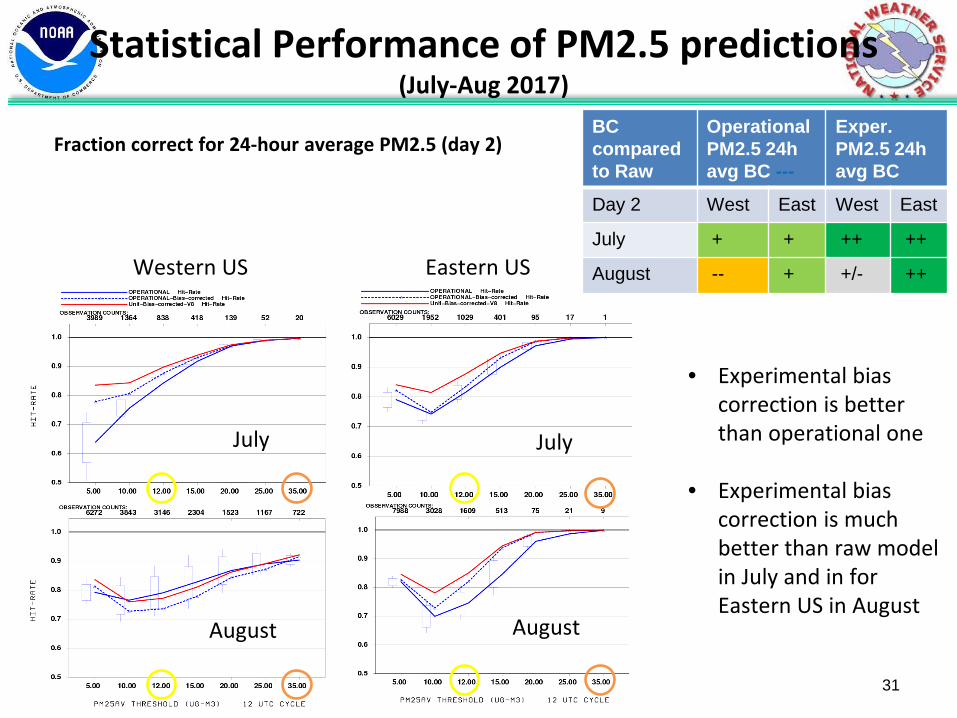
Statistical Performance of PM2.5 predictions (July-Aug 2017)
BC compared to Raw
Operational PM2.5 24h avg BC ---
Exper. PM2.5 24h avg BC
Day 2 West East West East
July + + ++ ++
August -- + +/- ++
July
August
Western US Eastern US
July
August
Fraction correct for 24-hour average PM2.5 (day 2)
• Experimental bias correction is better than operational one
• Experimental bias correction is much better than raw model in July and in for Eastern US in August
31

Western US Eastern US
Statistical Performance of PM2.5 predictions (Sept 2017 & Jan 2018)
January
Fraction correct for 24-hour average PM2.5 (day 2)
January January
September September
BC compared to Raw
Operational PM2.5 24h avg BC ---
Exper. PM2.5 24h avg BC
Day 2 West East West East
September -/+ + + ++
January + + ++ ++
• Experimental bias correction is better than operational one
• Experimental bias correction is much better than raw model in January and in for Eastern US in September
32
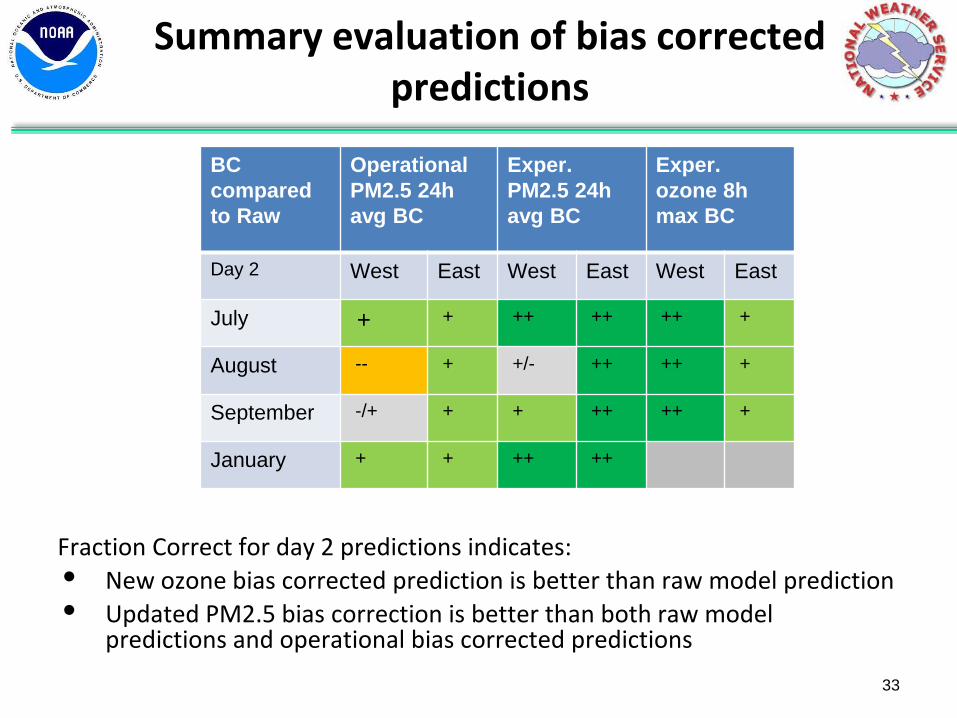
Summary evaluation of bias corrected predictions
Fraction Correct for day 2 predictions indicates: • New ozone bias corrected prediction is better than raw model prediction • Updated PM2.5 bias correction is better than both raw model
predictions and operational bias corrected predictions
BC compared to Raw
Operational PM2.5 24h avg BC
Exper. PM2.5 24h avg BC
Exper. ozone 8h max BC
Day 2 West East West East West East
July + + ++ ++ ++ +
August -- + +/- ++ ++ +
September -/+ + + ++ ++ +
January + + ++ ++
33

Testing with Forecaster Feedback NWS/STI
• Forecasters' feedback was collected after the evaluation period of March 8, 2018 through April 6, 2018.
• Frozen model version predictions were provided by EMC retrospectively for July - September 2017 and January 2018 and in real time since March 2018.
• EMC provides parallel prediction maps and predicted values at monitor sites in text form to air quality forecasters.
34 34
Summary of Forecaster Feedback
35
Received recommendation to implement as proposed from AQ forecasters in
• California
• Maryland
• Virginia
• Connecticut
• Alabama
Additional feedback was received from forecasters in Maine, Minnesota, and North Carolina without a recommendation.
Pennsylvania forecaster recommended further testing.
35
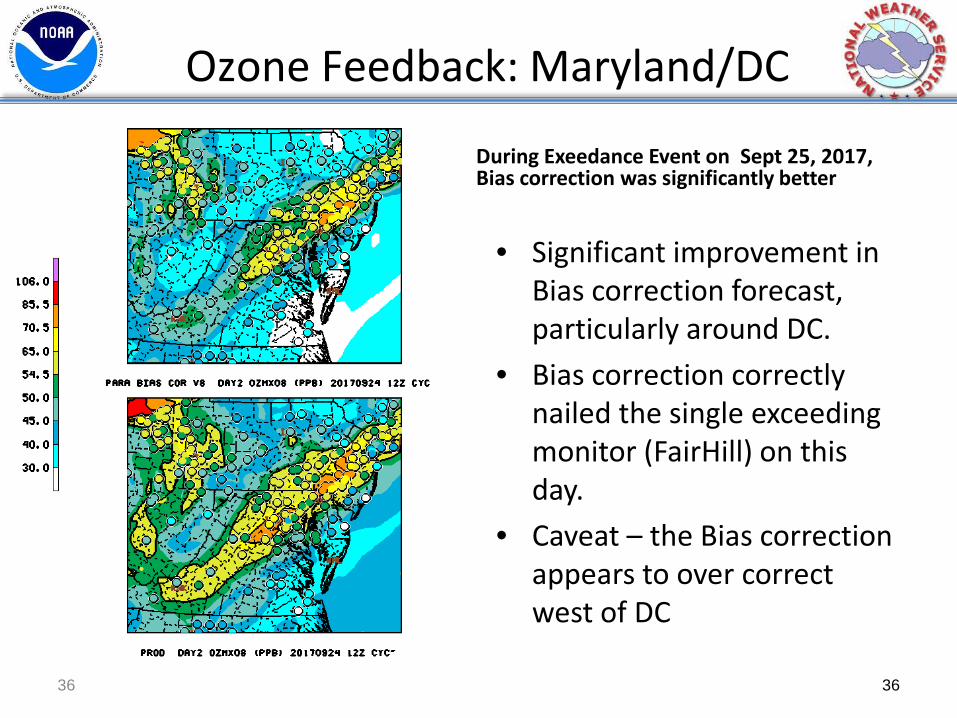
Ozone Feedback: Maryland/DC
36
• Significant improvement in Bias correction forecast, particularly around DC.
• Bias correction correctly nailed the single exceeding monitor (FairHill) on this day.
• Caveat – the Bias correction appears to over correct west of DC
During Exeedance Event on Sept 25, 2017, Bias correction was significantly better
36

Ozone Feedback: Connecticut
37
• The BIAS tended to be more accurate with higher ozone levels; • But on some days, e.g. July 2,3,11th, both models performed poorly; • BIAS= 18 WINNER! • PROD= 12
August 2, 2017 12z Day 2 Day 1
37
38
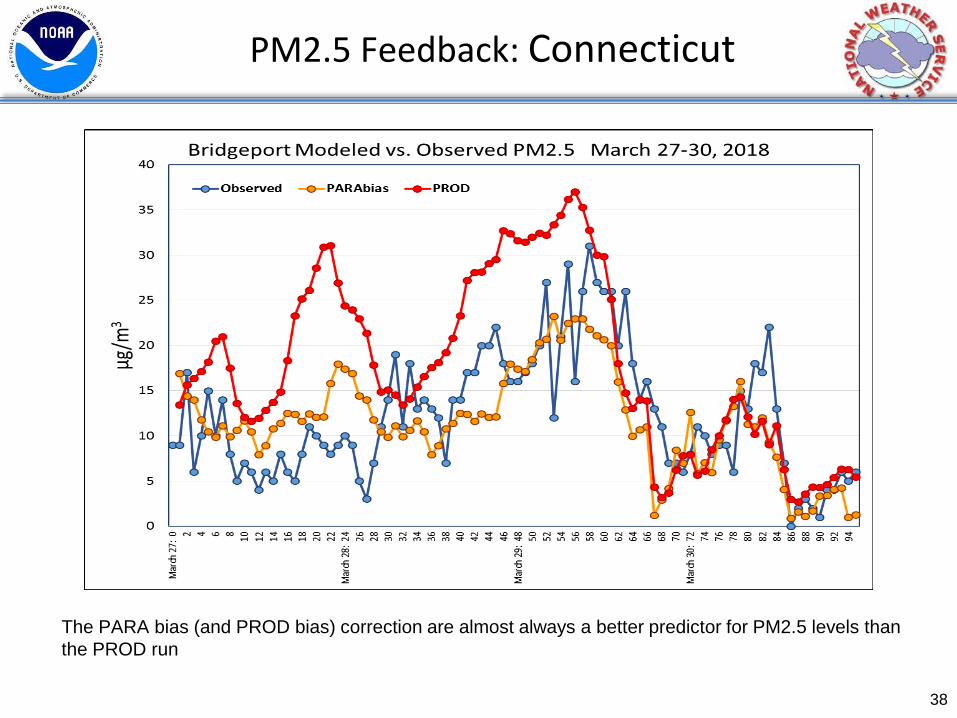
PM2.5 Feedback: Connecticut
The PARA bias (and PROD bias) correction are almost always a better predictor for PM2.5 levels than the PROD run
BACKUPS
39

FY19 Goals
• Extend forecast to 72 hours • Update anthropogenic emissions to NEI 2014V2 • Implement diurnal wild-fire smoke emission profiles
• CMAQ V5.2.1 update:
• Extended speciation (marine chemistry) • Aerosol impacts on photolysis
• Begin transition to FV3-Chem • Offline coupling at first ? • FV3GFS vs FV3REG met driver • BlueSky vs topdown VIIRS/MODIS active fire data • Update bias correction for new model behaviors
40

Emissions updates: oil and gas sector
41
2014 Energy Information Administration on Shale Plays
Adjustment factor applied to NEI2011 oil and gas area source sector
Testing of State-specific scaling for Oil_n_Gas area source • July 11-21 sensitivity run
confirmed that Marcellus area O3 increased
• Under-prediction in O3 in the Marcellus area was reduced
• However the over-prediction in O3 elsewhere was exacerbated
41

1h avg O3 Day 2 Daily Time Series BIAS Prod and EXP bias corrected
September 2017
43
WEST EAST
O3 Bias Correction - Improved, similar trend to raw except underprediction over East later in month


