
UNNATURAL RANDOM MATING
SELECTS FOR YOUNGER AGE AT
MATURITY IN HATCHERY CHINOOK
SALMON STOCKS
David Hankin, Jackie Fitzgibbons, Yaming Chen
Dept. of Fisheries Biology
Humboldt State University

FUNDING: THANKS TO THE
YUROK TRIBE & BOR

“Completely Random Mating” –
Why a Possible Cause of Concern?
• Behavioral observations suggest that Chinook
salmon do not mate “randomly” on the spawning
grounds;
• Size-selective ocean troll fisheries shift age
composition of spawners to younger ages
(Ricker expressed concern circa 1980.)
• Striking evidence of inheritance of age at
maturity in Chinook (Elk River Hatchery
experiments, Hard’s work);

Female Age Compositions are used to Describe Stock-
Specific Maturation Schedules (Early-, Mid-, and Late-
Maturing). Examples from several Oregon Coastal Streams
(Nicholas and Hankin 1988):

In natural populations, the percentages of
males are not closely linked to the
percentages of females at age. Female Ages Stream Male Ages
3 4 5 6 2 3 4 5 6
Late-Maturing
0 20 73 7 Nehalem 4 23 31 42 0
2 33 43 32 Trask 0 12 62 20 6
4 30 58 9 Salmon 35 22 28 13 2
Early/Mid-Maturing
11 60 27 2 Elk 52 22 19 7 1
Early-Maturing
50 44 5 1 Applegate 33 39 26 2 0

Natural Spawning Behaviors of Chinook
Salmon do not Lead to Random Mating
(Baxter, HSU MS Thesis 1991; other pubs, other species)
• Chinook females
“prefer” mates that
exceed their own size;
• Male mating success is
size-dependent: largest
males more often
dominant, spawn with
many females;
• Jacks have “sneaker” strategy, and presumably are less successful than adult males.

Jack
Behavioral observations from Baxter 1991:
Size-dependence of male behavioral status.
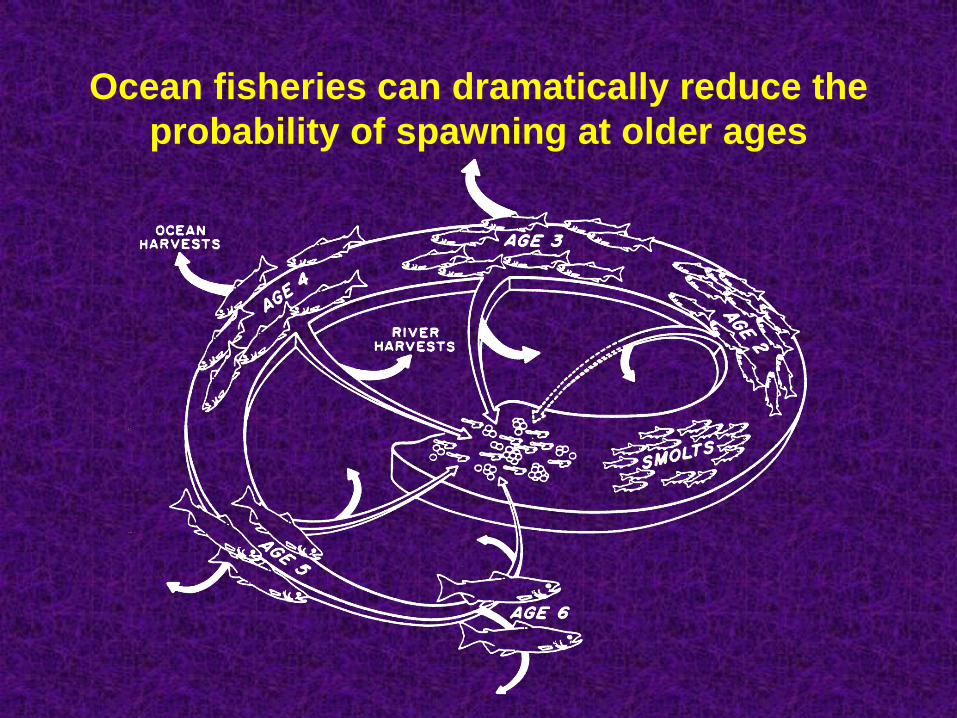
Ocean fisheries can dramatically reduce the
probability of spawning at older ages
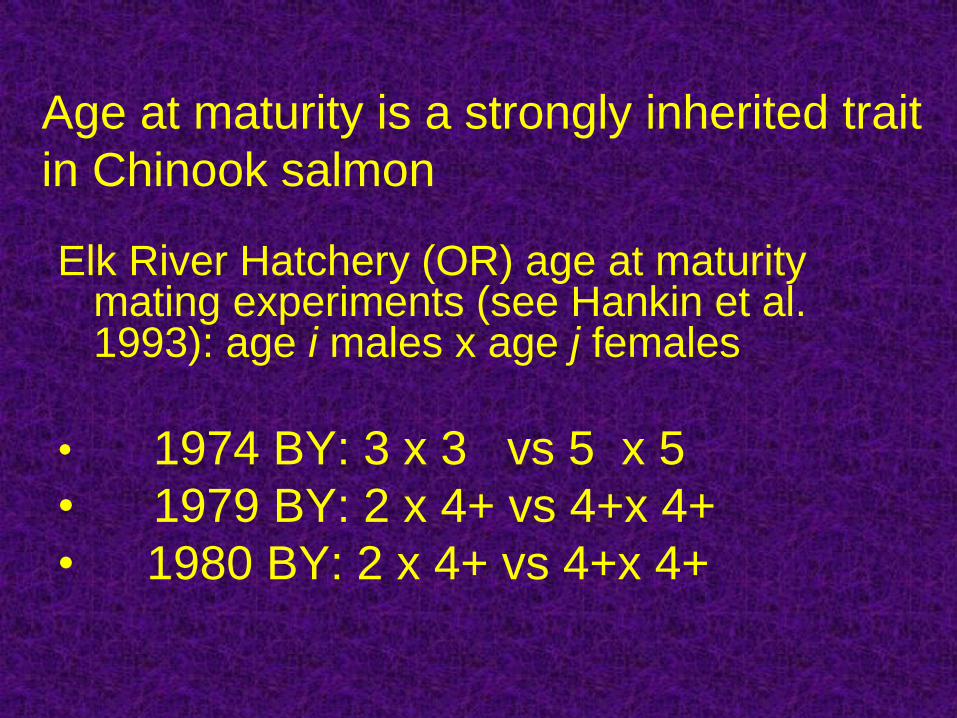
Age at maturity is a strongly inherited trait
in Chinook salmon
Elk River Hatchery (OR) age at maturity mating experiments (see Hankin et al. 1993): age i males x age j females
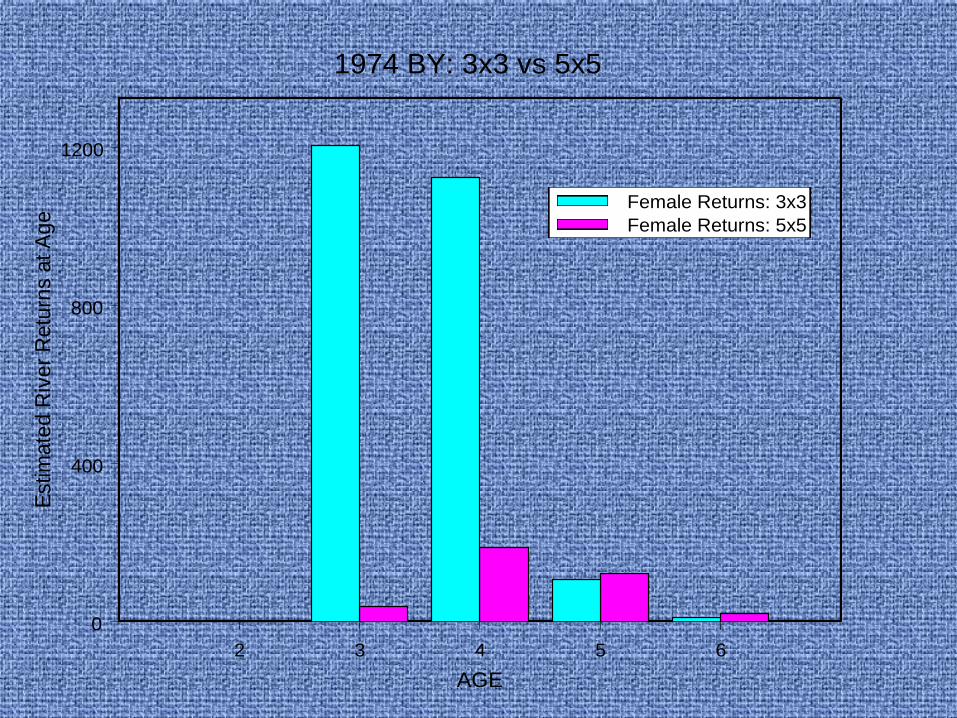
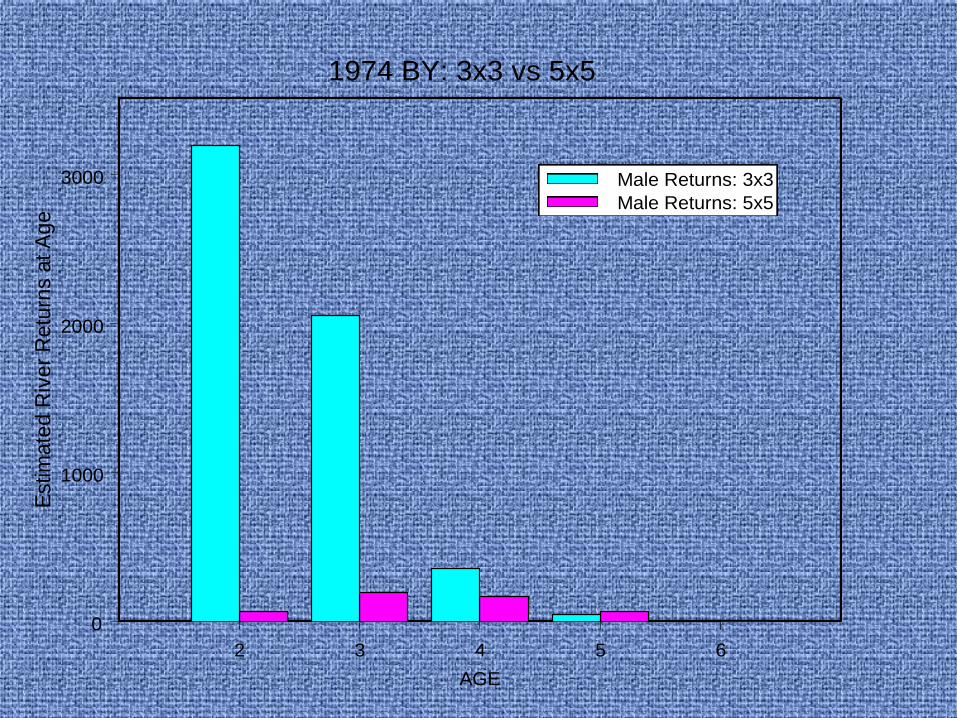
• 1974 BY: 3 x 3 vs 5 x 5
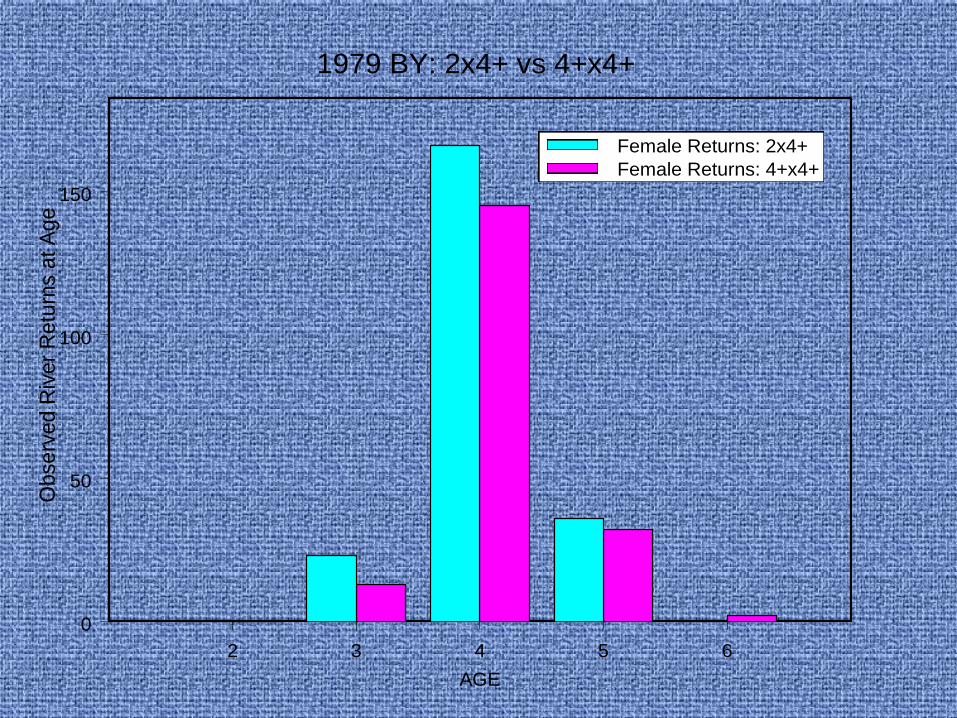
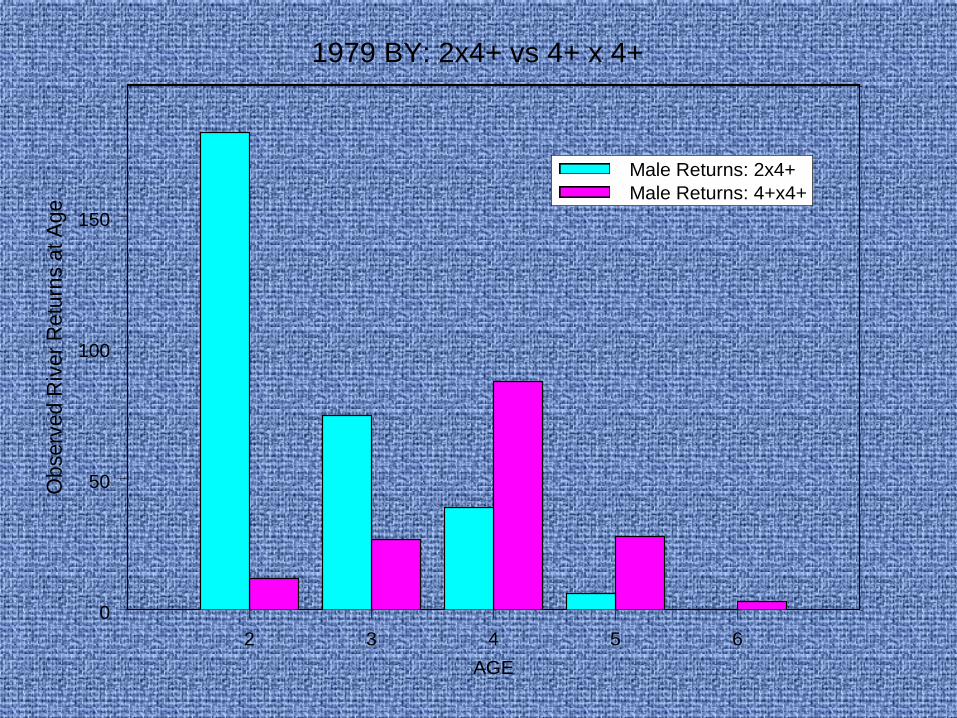
• 1979 BY: 2 x 4+ vs 4+x 4+
• 1980 BY: 2 x 4+ vs 4+x 4+
2 3 4 5 6
AGE
0
400
800
1200
Estim
ate
d R
ive
r R
etu
rns a
t A
ge
1974 BY: 3x3 vs 5x5
Female Returns: 3x3
Female Returns: 5x5
2 3 4 5 6
AGE
0
1000
2000
3000
Estim
ate
d R
ive
r R
etu
rns a
t A
ge
1974 BY: 3x3 vs 5x5
Male Returns: 3x3
Male Returns: 5x5
2 3 4 5 6
AGE
0
50
100
150
Ob
se
rve
d R
ive
r R
etu
rns a
t A
ge
1979 BY: 2x4+ vs 4+x4+
Female Returns: 2x4+
Female Returns: 4+x4+
2 3 4 5 6
AGE
0
50
100
150
Ob
se
rve
d R
ive
r R
etu
rns a
t A
ge
1979 BY: 2x4+ vs 4+ x 4+
Male Returns: 2x4+
Male Returns: 4+x4+

MANAGEMENT ISSUES AND
MODELING QUESTIONS
• Does size-selective ocean fishing, through shifting age composition of spawners to younger ages, select for earlier age at maturity (Ricker 1980, 1981; sea also Rutter circa 1900, re Sacramento gill net fishery )?
• Does random mating of hatchery fish, especially random inclusion of jacks as male parents, cause unintentional selection for earlier age at maturity (Hankin 1986-present!)?
• If hatchery mating strategies instead emulated the outcomes of natural spawnings, could such unintentional selection be avoided (Hankin 2009)?

Model-Based Assertion: Random hatchery
matings generate unintentional long-term
selection for younger age at maturity in
hathcery Chinook salmon populations.
• Empirical Basis:
– Elk River Hatchery Age at Maturity Experiments
• Theoretical Basis:
– A model for inheritance of age at maturity in a
hatchery Chinook population (20 yr after original
idea!);
– Alternative hatchery mating strategies;
– Long-term equilibrium age and sex structure of
modeled hatchery populations
• Age-and sex- structured representation of Chinook population dynamics, with typical assumptions;
• Models incorporate alternative hatchery mating policies & size-selective ocean fisheries;
• Computer calculations used to generate “long-term equilibrium” age and sex structure.
Model Structure: Basic Features
Key Modeling Assumption
• Simulation of “long-term” selection (due to
unnatural random mating) is valid for at
least ten generations given fixed
“heritabilities”.
• Support for this assumption from selection
experiments with rats, etc. (e.g. Falconer
& Mackay).
• Model details in Hankin, Fitzgibbons &
Chen. 2009. CJFAS 66: 1505-1521.
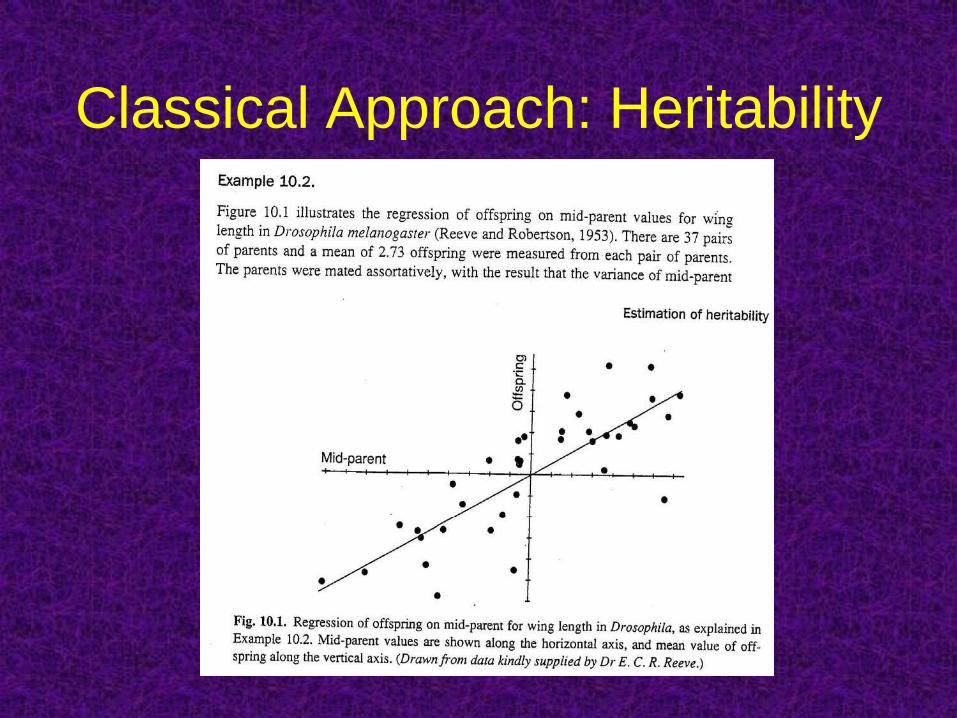
Classical Approach: Heritability
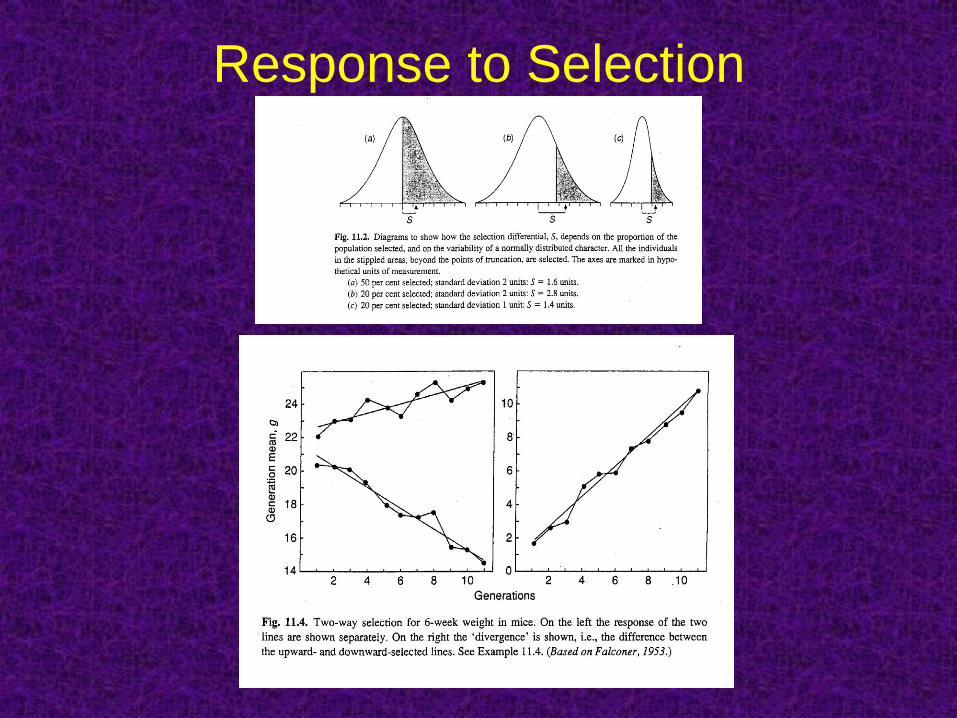
Response to Selection

KEY Model Parameters: Age- and Sex-
Specific Conditional Maturation Probabilities,
• Definition – Probability that an age k female (or male),
not caught and alive in the ocean at age k, will mature
at age k given that it had male and female parents of
ages i and j, respectively. (Captures essence of
inheritance of age at maturity.)
• Parameter Values – ERH age at maturity experiments
used to directly estimate a few (from cohort
reconstructions); remaining are “interpolated”
(“imputed”).
( , ), ( , )kF kM
i j i j

Example matrix of maturation
probabilities: age 2 males
Age of Male Parent Age of Female Parent
2
3
4
5
6
3 0.5810 0.2997 0.1786 0.0574 0.0287
4 0.5428 0.2800 0.1688 0.0536 0.0268
5 0.5280 0.2600 0.1549 0.0498 0.0249
6 0.4652 0.2400 0.1430 0.0460 0.0223

Example matrix of maturation
probabilities: age 3 females
Age of Male Parent Age of Female Parent
2
3
4
5
6
3 0.4026 0.3103 0.2182 0.1280 0.0604
4 0.2740 0.2122 0.1484 0.0856 0.0429
5 0.1456 0.1122 0.0789 0.0455 0.0228
6 0.0726 0.0567 0.0394 0.0228 0.0140
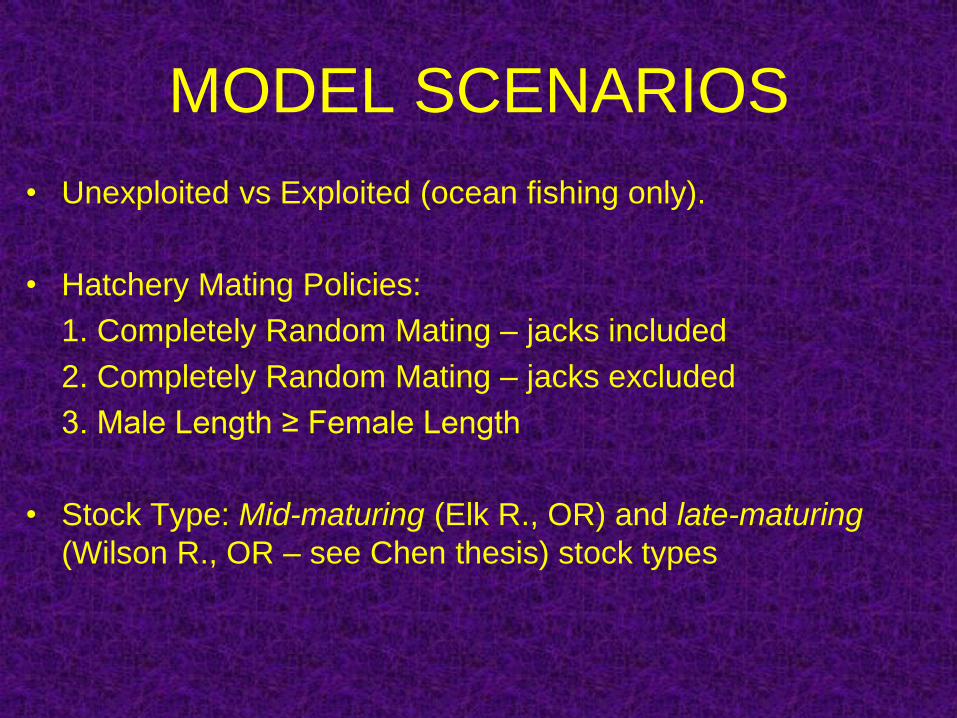
MODEL SCENARIOS
• Unexploited vs Exploited (ocean fishing only).
• Hatchery Mating Policies:
1. Completely Random Mating – jacks included
2. Completely Random Mating – jacks excluded
3. Male Length ≥ Female Length
• Stock Type: Mid-maturing (Elk R., OR) and late-maturing
(Wilson R., OR – see Chen thesis) stock types

Model Calculations of Long-Term
Age and Sex Structure
1. Specify Initial Conditions: Begin with assumed numbers of age k males and females in hatchery returns for first 6 years;
2. Select hatchery mating policy;
3. Generate numbers of expected (i,j) matings according to mating policy and hatchery returns;
4. Use age-specific fecundities, survival from egg to age 2, and maturation probability matrixes to calculate returns at age (from each mating type) in subsequent years;
5. Impose exploitation (if exploited) to alter returns at age;
6. “Run” computer model until equilibrium reached (usually 25-50 years (6-12 generations).
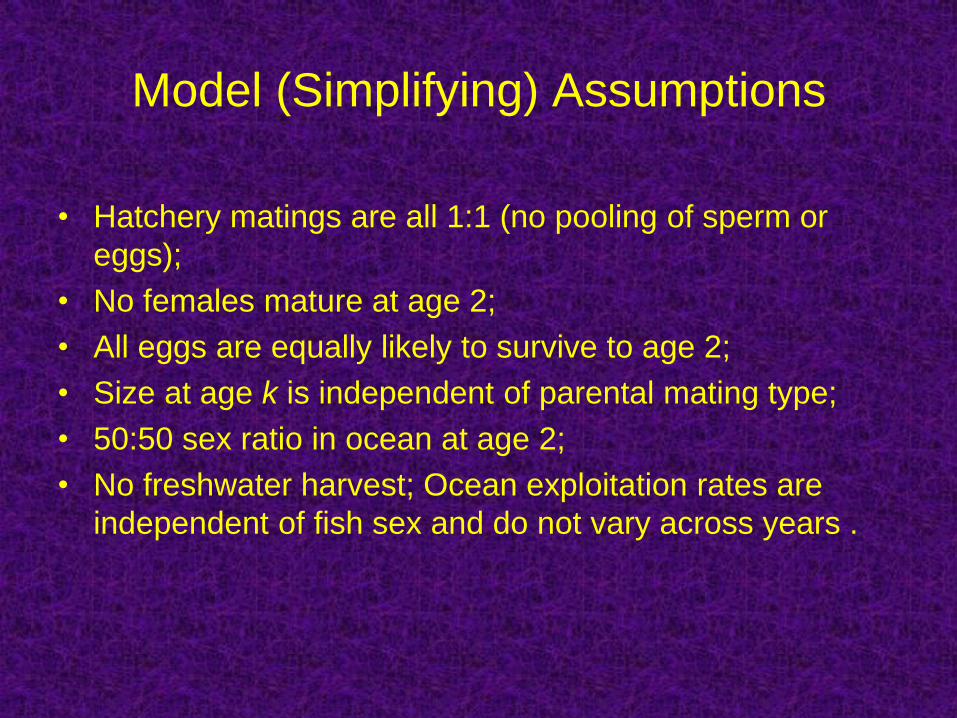
Model (Simplifying) Assumptions
• Hatchery matings are all 1:1 (no pooling of sperm or
eggs);
• No females mature at age 2;
• All eggs are equally likely to survive to age 2;
• Size at age k is independent of parental mating type;
• 50:50 sex ratio in ocean at age 2;
• No freshwater harvest; Ocean exploitation rates are
independent of fish sex and do not vary across years .

A “Piece” of the Model

$
The expected number of age 2 ocean recruits
originating from matings of age i males with
age j females is:
*
1 1( ) ( 2) ( 2)ij ij ij jR t p t p X t f
Where:
*
6 6
2 3
( )( )
( )
ij max
ij
ij
i j
tt
t

Completely Random, Excluding Jacks:
Male Length ≥ Female Length (more complicated!)

Elk River Chinook
Long-Term Equilibrium Age Structure: - Males

Long-Term Equilibrium Age Structure: Females

Long-Term Equilibrium Age Structure Under
“Moderate” Ocean Exploitation: Males

Long-Term Equilibrium Age Structure Under
“Moderate” Ocean Exploitation : Females
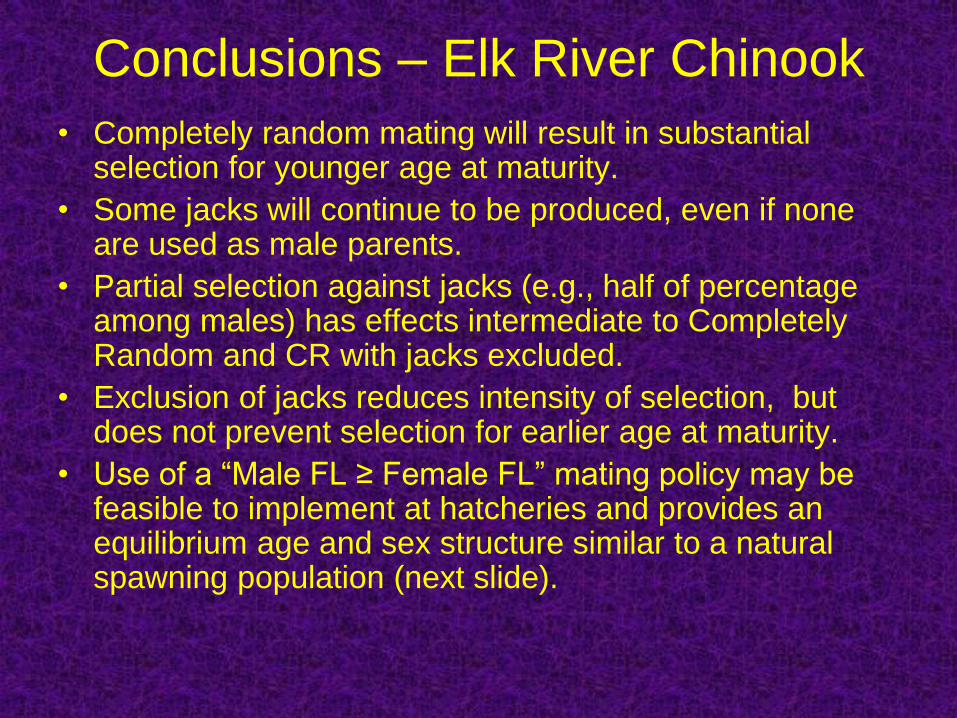
Conclusions – Elk River Chinook
• Completely random mating will result in substantial selection for younger age at maturity.
• Some jacks will continue to be produced, even if none are used as male parents.
• Partial selection against jacks (e.g., half of percentage among males) has effects intermediate to Completely Random and CR with jacks excluded.
• Exclusion of jacks reduces intensity of selection, but does not prevent selection for earlier age at maturity.
• Use of a “Male FL ≥ Female FL” mating policy may be feasible to implement at hatcheries and provides an equilibrium age and sex structure similar to a natural spawning population (next slide).
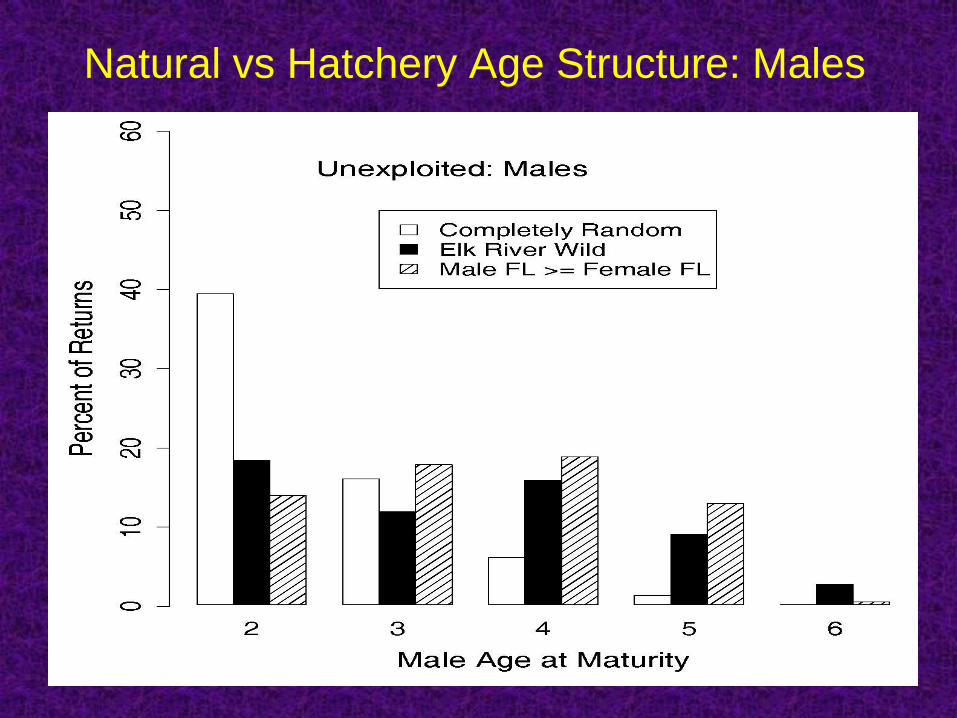
Natural vs Hatchery Age Structure: Males
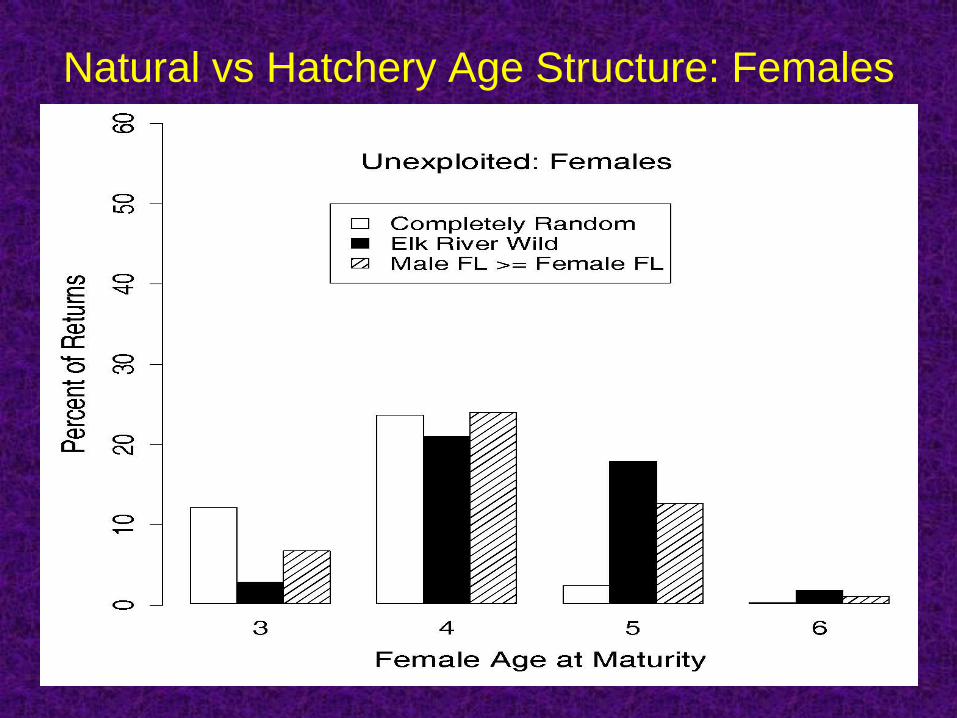
Natural vs Hatchery Age Structure: Females
Additional Comments
• Results for Late-Maturing Stock Type, with very little
natural jack return, are less striking. In general, degree
of reduction in mean ages will depend strongly on stock
type and the maturation matrixes;
• For simplified forms of the model (Lamberson et al.
2007), not all maturation maturations lead to long-term
stable equilibria.
• Interesting that model generates long-term equilibrium
age structure vs continued directional change (in
contrast to standard selection experiments).


