
University of Wisconsin Colleges
Campus Climate Assessment
Aggregate Report Results
November 18, 2008

Why Assess Climate?
What was the Process?
Assessing College Climate

Why conduct a climate assessment?
To foster a caring campus community that provides leadership for constructive participation in a diverse, multicultural world. To open the doors wider for underrepresented groups is to create a welcoming environment.To improve the environment for working and learning on campus.

Project Objectives
Provide UW Colleges with information, analysis, and recommendations as they relate to campus climate.
This information will be used in conjunction with other data to provide UW Colleges with an inclusive view of its campuses and a System wide review.

Projected Outcomes
UW Colleges campuses will add to their knowledge base with regard to how constituent groups currently feel about their particular campus climate and how the community responds to them (e.g., pedagogy, curricular issues, professional development, inter-group/intra-group relations, respect issues).UW Colleges campuses will use the results of the assessment to inform current/on-going work regarding diversity.

Setting the Context
Examine the Research Review work already completed
Preparation Readiness of the institution
Assessment Examine the climate
Follow-up Building on the successes and addressing the challenges

Research on Climate In Higher Education
Campus climate not only affects creating knowledge, but also impacts members of academic community who, in turn, contribute to creating campus environment (Hurtado, 2003; Milem, Chang, & antonio, 2005).Preserving climate that offers equal learning opportunities for all students and academic freedom for all faculty – an environment free from discrimination – is a primary responsibility of educational institutions.

Value of Campus Climate on Enhancing Learning Outcomes
Numerous studies and publications have confirmed the pedagogical value of a diverse student body and faculty on enhancing learning outcomes.
Selected research references include: Frank W. Hale, Jr. (2004). What Makes Racial Diversity Work in Higher Education,
Diversity Digest, Sterling, VA: Stylus. Harper, S.R., & Quaye, S.J. (2004). Taking seriously the evidence regarding the
effects of diversity on student learning in the college classroom: A call for faculty accountability. UrbanEd, 2(2), 43-47.
Harper, S.R. & Hurtado, S. (2007). Nine themes in campus racial climates and implications for institutional transformation. New Directions for Student Services, 120, 7-24.
Hurtado, S. (2003). Preparing college students for a diverse democracy: Final report to the U.S. Department of Education. Ann Arbor, MI: Center for the Study of Higher and Postsecondary Education.

Current Campus Climate
Access
Retention
Research
Scholarship
Curriculum Pedagogy
UniversityPolicies/Service
Intergroup &IntragroupRelations
Transformational Tapestry Model©
Baseline Organizational
Challenges
SystemsAnalysis
Local / Sate /Regional
Environments
Contextualized Campus Wide Assessment
AdvancedOrganizational
Challenges
ConsultantRecommendations
Assessment
Transformationvia
Intervention
FiscalActions
Symbolic Actions
AdministrativeActions
EducationalActions
Transformed Campus Climate
Access
Retention
Research
Scholarship
Curriculum Pedagogy
UniversityPolicies/Service
Intergroup &IntragroupRelations
© 2001
External Relations
External Relations

University of Wisconsin System Mission
The mission of the system is to develop human resources, to discover and disseminate knowledge, to extend knowledge and its application beyond the boundaries of its campuses and to serve and stimulate society by developing in students heightened intellectual, cultural and humane sensitivities, scientific, professional and technological expertise and a sense of purpose. Inherent in this broad mission are methods of instruction, research, extended training and public service designed to educate people and improve the human condition. Basic to every purpose of the system is the search for truth.

UW Colleges Goal Statement
To serve the needs of ethnically diverse students, students with disabilities and nontraditional students.

Process to Date2004-2005
Academic Planner (C. Saulnier) made aware of bias incidents at several campuses & began conversation regarding systemwide campus climate project
Taskforce committee formed to investigate consulting firms who conduct climate assessments in higher education.
Rankin & Associates identified as leading expert in multiple identity studies in higher education
Process to Date2005-2006
Conversations at System level continued
Proposal presentation made to UW System provosts and various constituent groups in Madison in September 2006

Process to Date2006-2007
UWS Administrators form Climate Study Working Group (CSWG) Conducted in-depth interviews with other higher
education institutions who had contracted with R&A resulting in very positive reviews
In collaboration with R&A identified potential fact-finding groups and developed protocol
Identified “next steps” in process

Process to Date 2006-2007
President Reilly pledges support for the project and agrees to finance 75% of the costs
Five UW System institutions volunteer to participate in climate assessment in the first year
Participating institutions Provosts’ Teleconference with R&A to discuss process, Scope of the Work, Projected Time-line, Proposed Budget
At the request of R&A, the Provosts were invited to add additional members to the CSWG to ensure institutional representation
Process to Date Participating Institutions
University of Wisconsin Colleges University of Wisconsin-La CrosseUniversity of Wisconsin-MilwaukeeUniversity of Wisconsin-OshkoshUniversity of Wisconsin-Stevens Point

Process to Date 2006-2007
Project Co-Chairs and Project Coordinator named Vicki Washington (Co-Chair, CSWG)
Interim Assistant Vice President of the Office of Academic Development and Diversity, UW System Administration
Ed Burgess (Co-Chair, CSWG)
Department of Dance, University of Wisconsin-Milwaukee Lisa Beckstrand (Project Coordinator)
Academic Planner, Director of Inclusivity Initiative, Office of Academic & Student Services, UW System Administration

Process to Date Phase I

Process to Date Phase I
PHASE II
Assessment Tool
Development and Implementation

Process to Date Phase II
August – December 2007 Bi-monthly meetings with CSWG to develop the
survey instrumentJanuary - February 2008 Development of Communication Plan IRB Proposal development/approval at each
participating institution UW Colleges approval – February, 2008
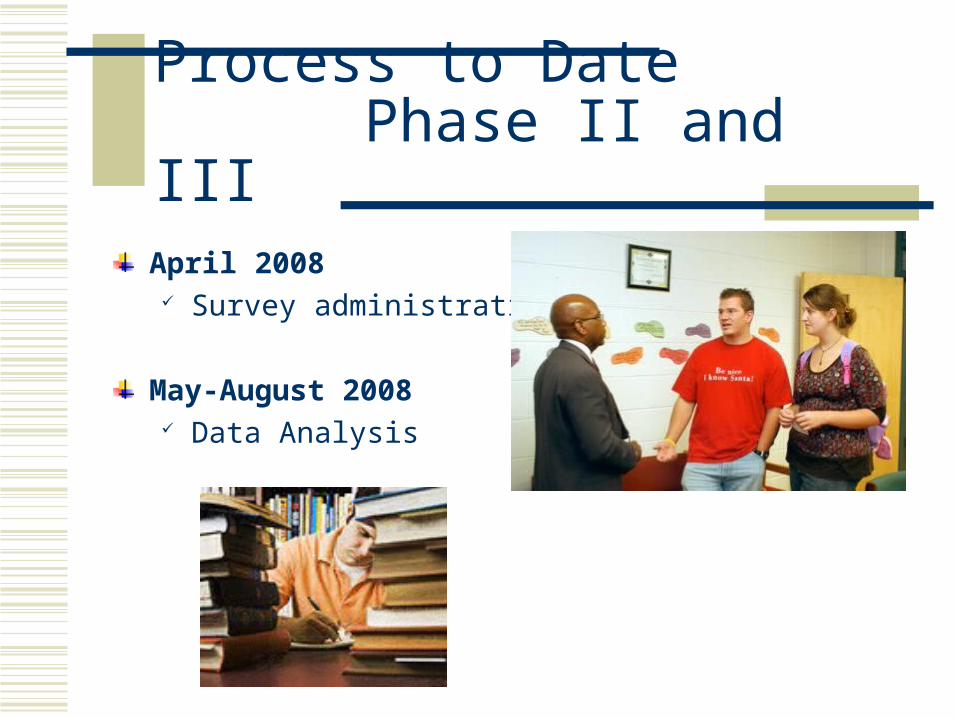
Process to Date Phase II and III
April 2008 Survey administration
May-August 2008 Data Analysis

Process to Date Phase IV
October-November 2008 Draft reports for each campus reviewed by CSWG team
members
November 2008 Final aggregate report forwarded to CSWG representatives
and Interim Provost Lampe from UW Colleges and to UW System
Presentation of survey results to the campus community

Assessment Methods
Research Model
Survey Instrument
Limitations

Research vs. Assessment
Assessment is any effort to gather, analyze, and interpret evidence which describes institutional, departmental, divisional, or agency effectiveness Guides good practice Has implications for a single institution, department, etc.
Research is any effort to gather evidence which guides theory by testing hypotheses Guides theory and tests concepts Has broader implications for student affairs/higher education
--Upcraft & Schuh, 2002

Survey Instrument
Final instrument 91 questions and additional space for respondents to provide
commentary On-line or paper & pencil options
Sample = Population All members of the UW Colleges community were invited to
participate
Results include information regarding: Respondents’ personal experiences at UW Colleges Respondents’ perceptions of climate at UW Colleges Respondents’ perceptions of institutional actions Respondents’ input into recommendations for change

Survey Assessment Limitations
Self-selection biasResponse ratesCaution in generalizing results for
constituent groups with significantly lower response rates

Method Limitation
Data were not reported for groups of fewer than 10 individuals so as not to compromise identity.
Instead, small groups were combined to eliminate possibility of identifying individuals.
Results
Response Rates

Who are the respondents?
2,870 people responded to the call to participate (24% response rate overall).
Several respondents contributed remarks to the open-ended questions.
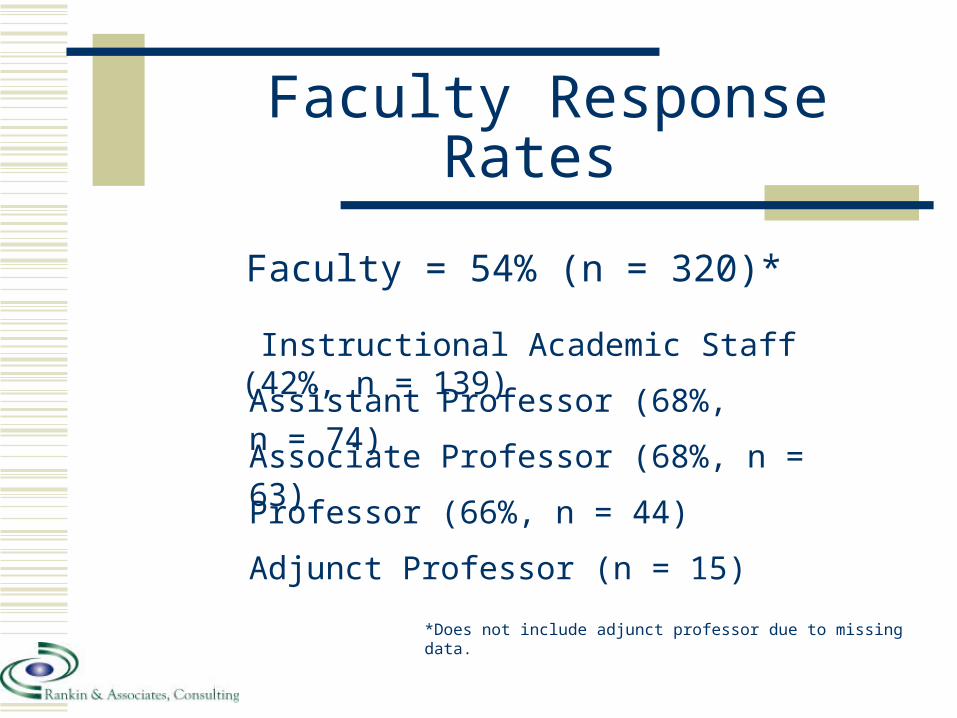
Faculty Response Rates
Assistant Professor (68%, n = 74)
Associate Professor (68%, n = 63)
Faculty = 54% (n = 320)*
Instructional Academic Staff (42%, n = 139)
Professor (66%, n = 44)
Adjunct Professor (n = 15)
*Does not include adjunct professor due to missing data.

Staff Response Rates
Academic Staff = 56% (n = 206)
Limited Term Employee (24%, n = 32)
Non-Instructional Academic Staff (64%, n = 121)
Limited Academic Staff (11%, n = 5)
Administrator (>100%, n = 48)
Classified Staff Non-Exempt (47%, n = 94)
Classified Staff Exempt (n = 39)

Student Response Rates
Students (23%, n = 2137)
Master Degree Student = >100% (n = 21)
Other Students = (54%, n = 571) [Transfer, Dual Enrollment, Non-degree, Professional degree]
Bachelor Degree Student = >100% (n = 395)
Doctoral Degree Student = >100% (n = 6)
Associate Degree Student = 14% (n = 1144)

Student Response Rates
Students (n = 2137)
White Students = 17% (n = 1881)
Men Students = 12% (n = 702)
Students of Color = 20% (n = 204)
Women Students = 21% (n = 1415)

Results
Demographic Characteristics
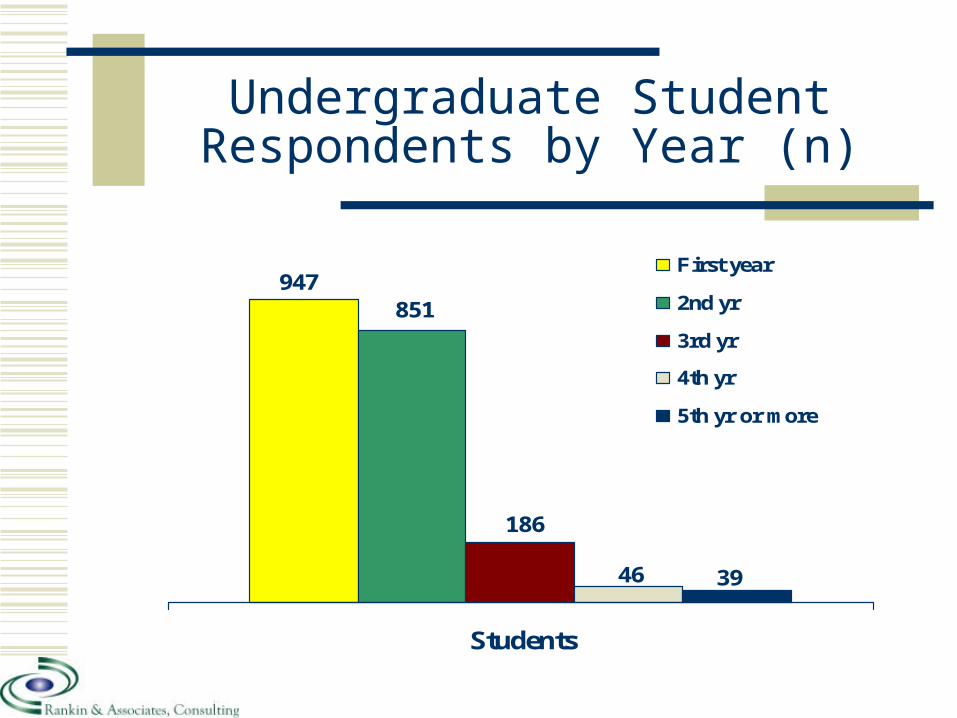
Undergraduate Student Respondents by Year (n)
947851
186
46 39
Students
First year
2nd yr
3rd yr
4th yr
5th yr or more
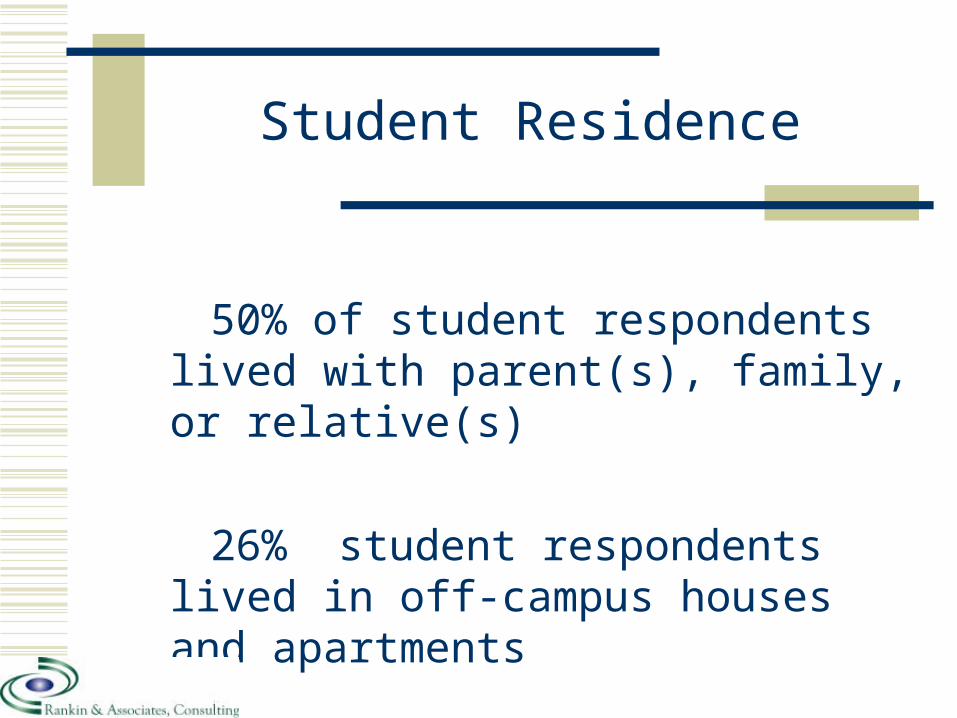
Student Residence
50% of student respondents lived with parent(s), family, or relative(s)
26% student respondents lived in off-campus houses and apartments

Income by Student Status (n)
464
183 202
350
95
324
37
104
8
48
Undergraduate - Independent
Undergraduate - Dependent

Employee Respondents by Position Status (n)
15
139
7463
44 32
94
39
121
5
4859
Adjunt professorInstructional academic staffAssistant professorAssociate professorProfessorLimited term employeeClassified staff non-exemptClassified staff exemptNon-instructional academic staffLimited academic staffAdministratorOther

Collapsed Employee Status (n)
335
206
133
Faculty
Academic Staff
Classified Staff

Respondents by Gender (n)
There were 9 respondents who identified as transgender
1387
162 17115155101
32
694
828
Female Male
Undergraduate Students
Graduate Students
Faculty
Academic Staff
Classified Staff

Respondents by Sexual Orientation & UW Colleges Status (n)
1939
190
10126
6121
303
14
Heterosexual LGB
StudentsFaculty
Academic StaffClassified Staff

Respondents by Racial Identity(Duplicated Total)
9 42 2 4956
211
2625
7 55 8 33 6 40
AfricanAfrican American/BlackAlaskan NativeAsianAsian AmericanSoutheast AsianCaribbean/West IndianCaucasian/WhiteIndian subcontinentLatino(a)/HispanicMiddle EasternNative American IndianPacific IslanderOther

Respondents by Racial Identity (Unduplicated Total)
252
2549
People of Color White People

Respondents by Spiritual Affiliation (n)
n %Animist 4 0.1Anabaptist 1 0.0Agnostic 146 5.2Atheist 97 3.4Baha’i 2 0.1Baptist 72 2.6Buddhist 24 0.9Eastern Orthodox 12 0.4Episcopalian 23 0.8Hindu 1 0.0Islam 15 0.5Jehovah’s Witness 5 0.2Jewish 18 0.6LDS (Mormon) 15 0.5Lutheran 492 17.5Mennonite 2 0.1Methodist 113 4.0Moravian 1 0.0Nondenominational Christian 248 8.8Pagan 21 0.7Pentecostal 32 1.1Presbyterian 53 1.9Quaker 5 0.2Roman Catholic 611 21.7Seventh Day Adventist 5 0.2Shamanist 23 0.8Unitarian Universalist 26 0.9United Church of Christ 52 1.8Wiccan 15 0.5Spiritual, but no religious affiliation 231 8.2Other 105 3.7

Respondents by Spiritual Affiliation (n)
1732
159
826
105
ChristianOther than ChristianNo AffiliationOther

Respondents with Conditions that Substantially Affect a Major Life Activity (n)
67
9 814
63
0 1 0
88
2 2 3
Physical Disability Learning Disability Psychological Condition
StudentsFacultyAcademic StaffClassified Staff

Citizenship Status by Position
Students Employeesn % n %
US citizen 2050 96.3 639 95.4
US citizen – naturalized 30 1.4 19 2.8
Dual citizenship * * 0 0.0
Permanent resident (immigrant) 21 1.0 7 1.0
Permanent resident (refugee) 7 0.3 * *
International (F-1, J-1, or H1-B, or other visa) 15 0.7 * *
* Data is missing due to n < 5

Findings

Aggregate Findings
87% of respondents were “very comfortable” or “comfortable” with the climate at UW Colleges.
83% of respondents were “very comfortable” or “comfortable” with the climate in their department/work unit.
86% of student/faculty respondents were “very comfortable” or “comfortable” with the climate in their classes.

Aggregate Findings
86% of respondents have not personally experienced any exclusionary, intimidating, offensive and/or hostile conduct that has interfered with their ability to work or learn at UW Colleges.
83% percent of UW Colleges faculty and staff respondents were “highly satisfied” or “satisfied” with their jobs at UW Colleges.
83% of student respondents were “highly satisfied” or “satisfied” with their education at UW Colleges.

Challenges and Opportunities

Personally experienced exclusionary, intimidating, offensive and/or hostile conduct that interfered with one’s
ability to work or learn at UW Colleges
n %
Yes 394 14.0

Personally Experienced Based on…(%)
3130
28
18
11 11 10
7 7
Institutional Status (n=120)Gender (n=117)Age (n=110)Educational Level (n=69)Psychological Disability (n=43) Religion/Spiritual Status (n=42)Physical Disability (n=38)Ethnicity (n=28)Sexual Orientation (n=26)

Overall Personal Experiences of Perceived Offensive, Hostile, Exclusionary, or Intimidating Conduct and of that
Conduct the Percent Due to Gender Identity (%)
¹ Percentages are based on total n split by group.² Percentages are based on n split by group for those who believed they had personally experienced this conduct.
15 13
36
16
Female Male
Overall experienced conduct¹
Experienced conduct due to gender²
(n=271)¹
(n=98)²
(n=122)¹
(n=19)²

Personal Experiences of Perceived Offensive, Hostile, Exclusionary, or Intimidating Conduct and, of that
Conduct, the Percent Due to Institutional Status (%)
¹ Percentages are based on total n split by group.² Percentages are based on n split by group for those who believed they had personally experienced this conduct.
10
23 21
37
18
39
48
55
Students Faculty Academic Staff Classified Staff
Overall experienced conduct¹
Experienced conduct due to status²
(n=213)¹
(n=38)²
(n=77)¹
(n=30)²
(n=49)¹
(n=27)²
(n=44)¹
(n=21)²

Overall Personal Experiences of Perceived Offensive, Hostile, Exclusionary, or Intimidating Conduct and of that
Conduct the Percent Due to Race (%)
¹ Percentages are based on total n split by group.² Percentages are based on n split by group for those who believed they had personally experienced this conduct.
16 13
30
2
People of Color White
Overall experienced conduct¹
Experienced conduct due to race²
(n=40)¹
(n=12)²(n=341)¹
(n=8)²

Personal Experiences of Perceived Offensive, Hostile, Exclusionary, or Intimidating Conduct and, of that
Conduct, the Percent Due to Sexual Orientation (%)
¹ Percentages are based on total n split by group.² Percentages are based on n split by group for those who believed they had personally experienced this conduct.
1913
57
1
LGB respondents Heterosexual respondents
Overall experienced conduct¹
Experienced conduct due to sexual orientation²
(n=30)¹
(n=17)²
(n=343)¹
(n=4)²

Personal Experiences of Perceived Offensive, Hostile, Exclusionary, or Intimidating Conduct and, of that
Conduct, the Percent Due to Disability (%)
¹ Percentages are based on total n split by group.² Percentages are based on n split by group for those who believed they had personally experienced this conduct..
13
23
15
3335
20
34
No disability Physical Disability Learning Disability Psychological condition
Overall experienced conduct¹
Experienced conduct due to disability²
(n=327)¹ (n=23)¹
(n=8)²
(n=10)¹
(n=2)²
(n=32)¹
(n=11)²

Form of Perceived Offensive, Hostile, Exclusionary, or Intimidating Conduct
n %
Deliberately ignored or excluded 175 44.4
Felt intimidated/bullied 142 36.0
Stares 83 21.1
Derogatory remarks 75 19.0
Isolated or left out when working in groups 68 17.3
Received a low performance evaluation 54 13.7
Derogatory written comments 39 9.9
Isolated or left out because of my identity 33 8.4
Feared for my physical safety 29 7.4

Form of Perceived Offensive, Hostile, Exclusionary, or Intimidating Conduct
n %
Derogatory/unsolicited emails 27 6.9
Singled out as the “resident authority” regarding my identity 19 4.8
Threats of physical violence 18 4.6
Derogatory phone calls 15 3.8
Someone assumed I was admitted or hired because of my identity 15 3.8
Feared for my family safety 12 3.0
Target of racial/ethnic profiling 8 2.0
Victim of a crime 8 2.0
Graffiti 7 1.8
Target of physical violence 6 1.5

Form of Perceived Offensive, Hostile, Exclusionary, or Intimidating Conduct by
Demographic Characteristics (Race)
WhiteRespondents
n = 341
Respondents of Color
n = 44
n % n %
Isolated or left out because of my identity 22 6.5 10 25.0
Someone assumed I was admitted or hired because of my identity 8 2.3 7 17.5
Target of racial/ethnic profiling <5 <1.0 6 15.0
Feared getting a poor grade because of hostile classroom environment 29 8.5 9 22.5
Singled out as “resident authority” because of my identity 12 3.5 6 15.0
Received a low performance evaluation 43 12.6 9 22.5
Isolated or left out when working in groups 66 16.4 9 22.5
Felt intimidated/bullied 126 37.0 9 22.5

Form of Perceived Offensive, Hostile, Exclusionary, or Intimidating Conduct by
Demographic Characteristics (Sexual Orientation)
HeterosexualRespondents
n = 274
LGB Respondents
n = 28
n % n %
Stares 64 18.7 14 46.7
Derogatory remarks 57 16.6 13 43.3
Isolated or left out because of my identity 26 7.6 7 23.3
Derogatory written comments 41 12.0 7 23.3
Isolated or left out when working in groups 58 16.9 8 26.7
Target of physical violence 3 0.9 <5 10.0
Feared for my physical safety 22 6.4 <5 13.3
Received a low performance evaluation 45 13.1 6 20.0
Threats of physical violence 15 4.4 <5 10.0

Where Did The Perceived Conduct Occur?
Of the respondents who believed they had been deliberately ignored or excluded:
• 38 percent (n = 67) said it happened while working at a campus job• 32 percent (n = 56) said it happened in a class
Of the respondents who indicated that they were intimidated or bullied:
• 39 percent (n = 55) said it happened while working at a campus job• 30 percent (n = 43) said it happened in a class

Where Did The Perceived Conduct Occur?
Of the respondents who believed they saw someone staring at them:
• 63 percent (n = 52) said it happened in a class• 49 percent (n = 41) said it happened while walking on campus
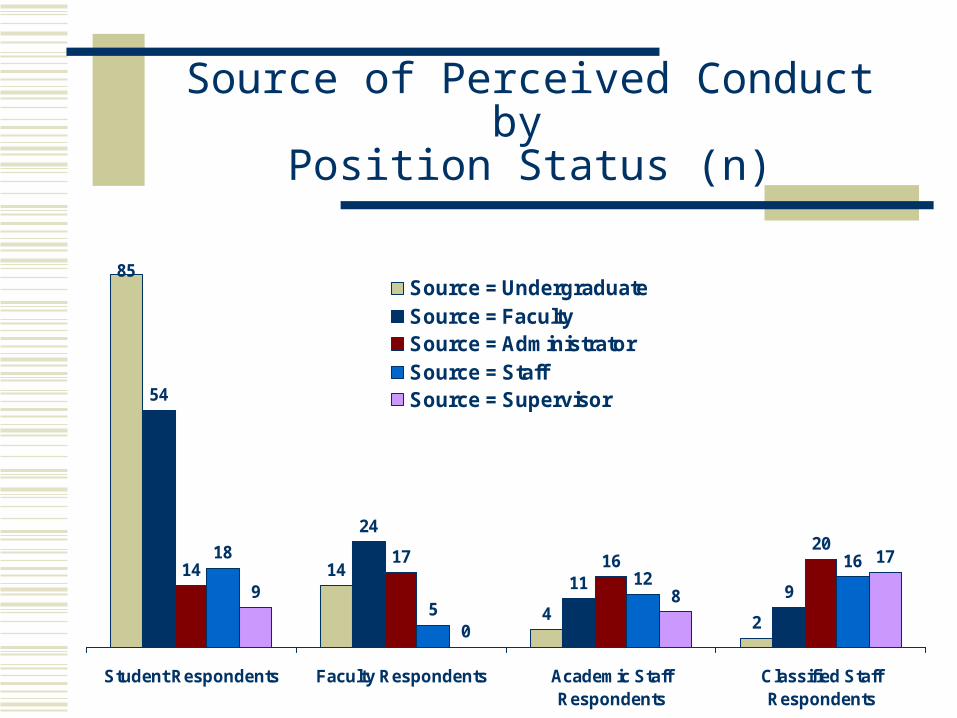
Source of Perceived Conduct by Position Status (n)
85
14
4 2
54
24
11 914
17 162018
5
1216
9
0
8
17
Student Respondents Faculty Respondents Academic StaffRespondents
Classified StaffRespondents
Source = UndergraduateSource = FacultySource = AdministratorSource = StaffSource = Supervisor
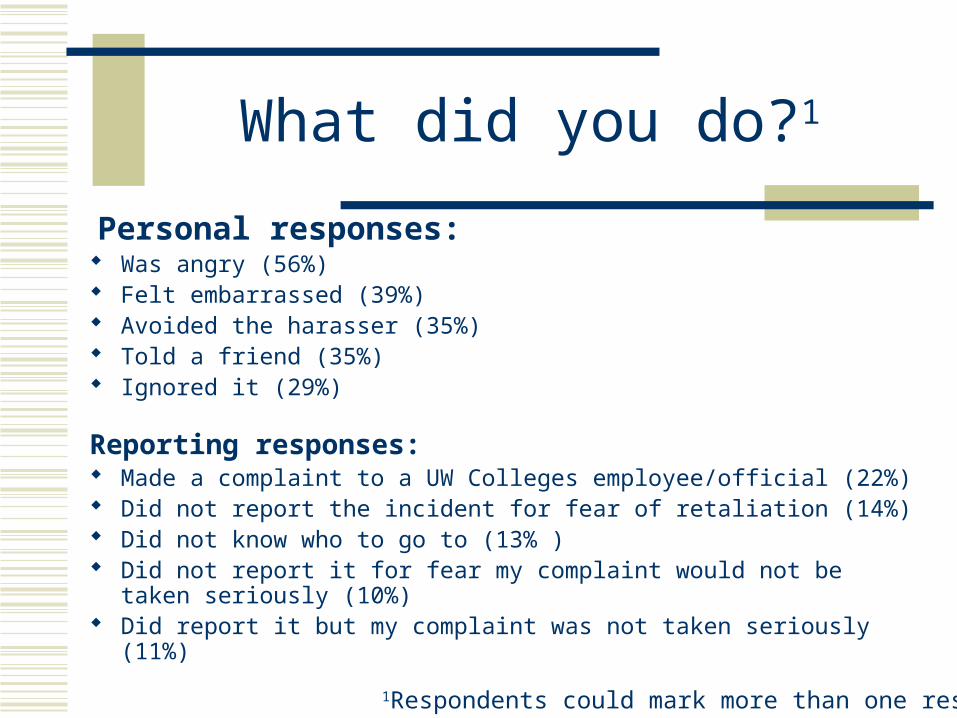
What did you do?1
Personal responses: Was angry (56%) Felt embarrassed (39%) Avoided the harasser (35%) Told a friend (35%) Ignored it (29%)
Reporting responses: Made a complaint to a UW Colleges employee/official (22%) Did not report the incident for fear of retaliation (14%) Did not know who to go to (13% ) Did not report it for fear my complaint would not be taken seriously
(10%) Did report it but my complaint was not taken seriously (11%)
1Respondents could mark more than one response

Sexual Harassment/Sexual Assault
The survey defined sexual harassment as “A repeated course of conduct whereby one person engages in verbal or physical behavior of a sexual nature, that is unwelcome, serves no legitimate purpose, intimidates another person, and has the effect of creating an intimidating, hostile, or offensive work or classroom environment.”
The survey defined sexual assault as “Intentional physical contact, such as sexual intercourse or touching, of a person’s intimate body parts by someone who did not have permission to make such contact.”

Respondents Who Believed They Have Personally Been a Victim of Sexual Harassment by Primary
Status
Students Employees
n % n %
16 0.8 3 <1.0

Respondents Who Believed That They Had Been The Victim of Sexual Assault
While Enrolled at UW Colleges
n %
Yes 19 1.0
12 of the 19 victims were women
16 were students

Respondents Who Believed That They Had Been The Victim of Sexual Assault
Where did it occur?“Other” locations (n = 16)Off-campus (n = 6)On-campus (n = <5)
Who were the offenders against students?*Friends (n = 5)
What did you do1?Did nothing (26%)
Told a friend (21%)
1Respondents could mark more than one response

Satisfaction with UW Colleges
Employees
Students

Employee Satisfaction with Their Jobs at UW Colleges
83% (n = 563) percent of UW Colleges faculty and staff were “highly satisfied” or “satisfied” with their jobs at UW Colleges. Some differences were found between demographic
categories:Women respondents were least satisfied.Classified staff were less satisfied than academic staff
and faculty.

Faculty and Staff Members’ Satisfaction with Their Jobs (%)
86 85
75
1018
7
Faculty Academic Staff Classified Staff
Satisfied*
Dissatisfied**

Employee Satisfaction with The Way Their Careers have Progressed at UW Colleges
74% (n = 362) were “highly satisfied” or “satisfied” with the way their careers have progressed at UW Colleges. Employees of Color were less satisfied than White
Employees Classified Staff were less satisfied than academic
staff or faculty

Employee Satisfaction With The Way Their Careers Have Progressed
By Position Status (%)
67
78
56
11
2115
Faculty Academic Staff Classified Staff
Satisfied*
Dissatisfied**

Employee Satisfaction with the Way Their Careers Have Progressed by Selected
Demographic Categories (%)
67 70 7268
7468
145
16 151616
Women Men People of Color White LGB Heterosexual
Satisfied*
Dissatisfied**

Employee Comments With Regard To The Way Their Careers Have Progressed
Employees who were satisfied with their jobs and the way their careers have progressed attributed their successes to the flexibility of their work environments, and opportunity to develop and grow professionally. Others indicated that they loved their jobs, had supportive departments and supervisors, and found teaching their students rewarding and fulfilling.
Those who were disappointed said the lack of opportunities for advancement was disappointing to them. Many indicated their dissatisfaction with low salaries and lack of tenure-track and full-time teaching positions.

Student Satisfaction With Their Education at UW Colleges
83% (n = 1755) of students were “highly satisfied” or “satisfied” with their education at UW Colleges. Little difference found between demographic categories
with the exception of: LGB student respondents were less satisfied with their education
than their majority counterparts.

Student Satisfaction With Their Education at UW Colleges
8580 80 83
73
84
6 7 4 48
4
Women Men People of Color White LGB Heterosexual
Satisfied*
Dissatisfied**

Student Satisfaction With Their Academic Careers at UW Colleges
68% (n = 1437) were “highly satisfied” or “satisfied” with the way their academic careers have progressed at UW Colleges. Students of Color were less satisfied than White Students Men students were less satisfied than women students LGB students were less satisfied than heterosexual
students

Student Satisfaction With Their Academic Careers at UW Colleges by Selected Demographics
7163
59
69
57
69
13 1611 11
20
10
Women Men People of Color White LGB Heterosexual
Satisfied*
Dissatisfied**

Student Respondents’ Comments in Regard to Satisfaction
Students who were satisfied with the way their academic careers have progressed said they established positive relationships with their professors, advisors and tutors, felt challenged by the course work which was described as relevant and applicable to real world situations, and their expectations matched their experiences.
Dissatisfied students described their professors, courses and campus as a whole as not being up to standards, experienced difficulties scheduling required courses, found the application process to a four-year college or university challenging and unsuccessful, did not receive enough financial aid, and felt disappointed with themselves for not doing better in their classes.

Have You Seriously Considered Leaving UW Colleges?
60 percent of faculty respondents
Faculty women (62%); Faculty men (57%)
White faculty (60%); Faculty of Color (56%)
60 percent of academic staff and 67 percent of classified staff respondents
Staff women (60%); Staff men (68%)
White Staff (62%); Staff of Color (47%)

Have You Seriously Considered Leaving UW Colleges?
34 percent of Student Respondents
Men (35%); Women (33%) Students of Color (30%); White students (34%) LGB (37%); Heterosexual (34%)

Perceptions
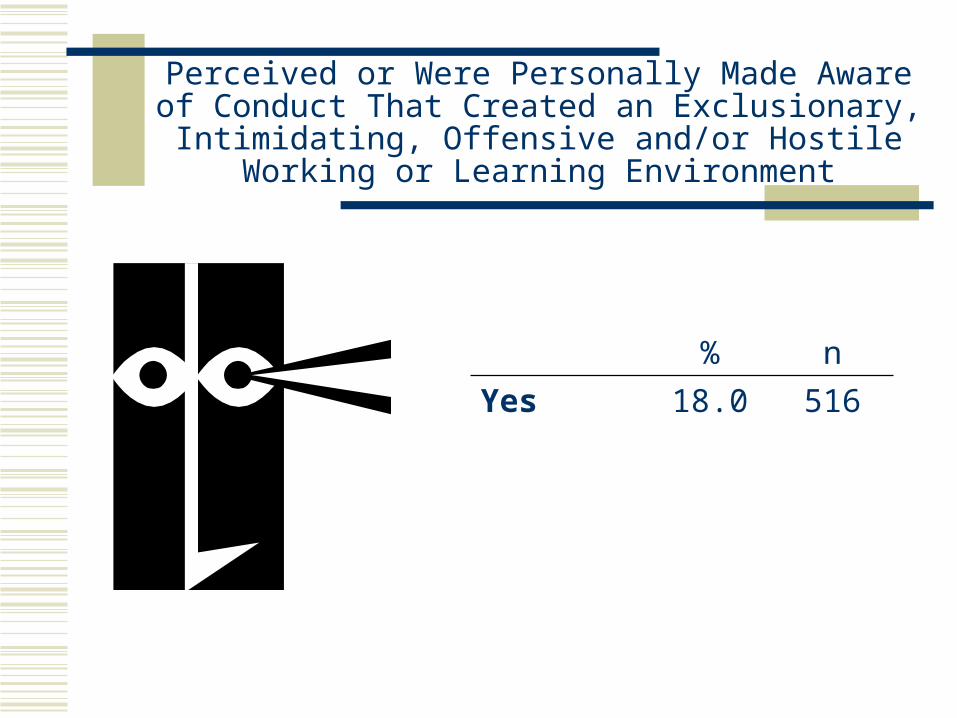
Perceived or Were Personally Made Aware of Conduct That Created an Exclusionary, Intimidating, Offensive
and/or Hostile Working or Learning Environment
% n
Yes 18.0 516

Perceived Offensive, Hostile, Exclusionary, or Intimidating Conduct by Race (%)
18 20
White People (n=446)
People of Color (n=50)

Perceived Offensive, Hostile, or Exclusionary, Intimidating Conduct by Gender (%)
19 17
Women (n=351)
Men (n=163)

Perceived Offensive, Hostile, Exclusionary, or Intimidating Conduct by Sexual Orientation (%)
29
18
LGB (n=46)Heterosexual (n=450)
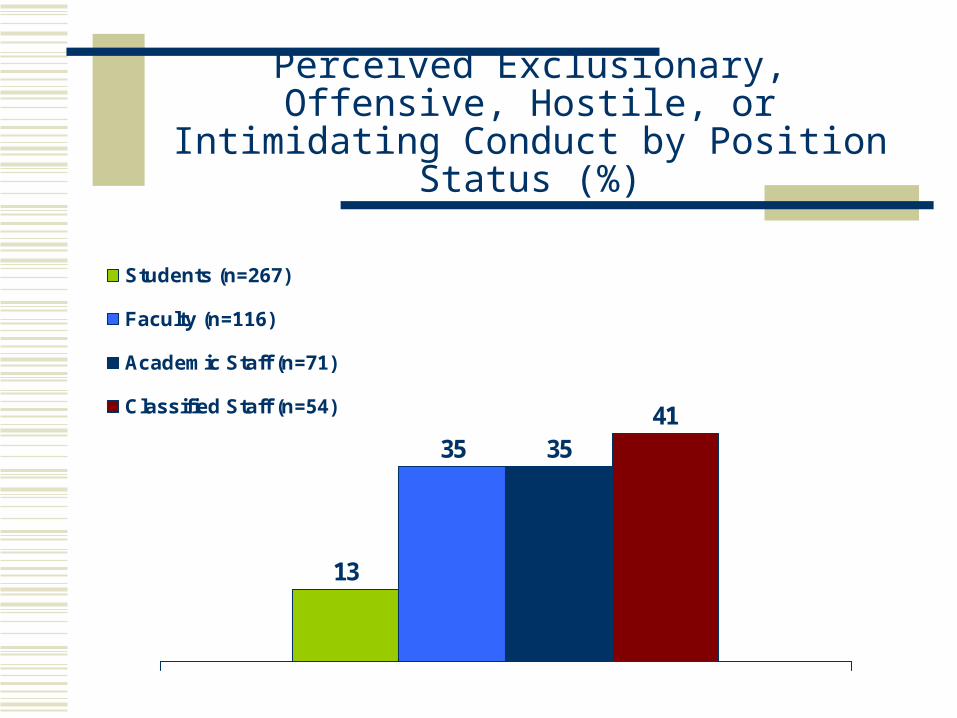
Perceived Exclusionary, Offensive, Hostile, or Intimidating Conduct by Position Status (%)
13
35 3541
Students (n=267)
Faculty (n=116)
Academic Staff (n=71)
Classified Staff (n=54)

Form of Perceived Offensive, Hostile, Exclusionary, or Intimidating Conduct
n %Derogatory remarks 172 33.3Deliberately ignored or excluded 165 32.0Stares 140 27.1Intimidation/bullying 118 22.9Someone isolated or left out because of their identity 115 22.3Racial/ethnic profiling 98 19.0Derogatory written comments 62 12.0Graffiti 61 11.8Assumption that someone was admitted or hired because of their identity 61 11.8Someone isolated or left out when working in groups 61 11.8Someone receiving a low performance evaluation 60 11.6Someone singled out as the “resident authority” regarding their identity 53 10.3

Source of Perceived Offensive, Hostile, Exclusionary, or Intimidating Conduct (%)
Undergraduate Students (42%) Faculty (22%) Administrators (13%) Colleagues (12%) Staff Members (11%)

Perceived Discriminatory Practices
Perceived Discriminatory Hiring (16%) Due to gender (23%) Due to institutional status (20%) Due to age (15%)
Perceived Discriminatory Promotion (16%) Due to institutional status (28%) Due to educational level (17%) Due to age (16%) Due to gender (12%)
Perceived Discriminatory Firing (11%) Due to gender (18%) Due to advanced experience level of the candidate (10%) Due to age (10%) Due to ethnicity (10%)

The majority of respondents expressed positive attitudes about work-life issues.
Work-Life Issues

Work-Life Issues
73% (n = 496) of respondents “strongly agree/agree” that they were comfortable asking questions about performance expectations.
33% (n = 219) of respondents “strongly agree/agree” that there are many unwritten rules concerning how one is expected to interact with colleagues in their work units.
29% (n = 199) of respondents “strongly agree/agree” that they were reluctant to bring up issues that concern them for fear than it will affect their performance evaluation or tenure decision.

Work-Life Issues
69% ( n = 463) of employees “strongly agree/agree” that they are able to balance their professional and work lives.
38% (n = 252) find that UW Colleges is supportive of family leave.
31% (n = 208) of faculty and staff members have to miss out on important things in their personal lives because of professional responsibilities.
16% (n = 104) of respondents felt that employees who do not have children were often burdened with work responsibilities.
14% (n = 87) “strongly agree/agree” that they have equitable access to domestic partner benefits.

Work-Life Issues
71% (n = 476) of employee respondents believe that they have colleagues or peers at UW Colleges who give them career advice or guidance when they need it.
63% (n = 423) of employee respondents believe that they have support from decision makers/colleagues who support their career advancement.
36% (n = 239) of employee respondents reported that their compensation was equitable to their peers with similar levels of experience.

More than half of the respondents "strongly agreed or "agreed" that the CEO/Campus Dean, other deans, Human Resources, Lecture and Fine Arts coordinators, club advisors, student club presidents or leaders, Student Government Association, Faculty/IAS (classroom instructors), academic staff, and the Office of Continuing Education provided visible leadership that fosters inclusion of diverse members of the campus community.
Institutional Actions

Inclusive Curriculum
More than half of all students and faculty felt the courses they took or taught included materials, perspectives, and/or experiences of people based on “difference.”
The exceptions included psychological disability, learning disability, physical disability, and veteran/military status.

Welcoming Classroom Climate
The majority of students found the classroom climate to be welcoming of “difference.” When reviewed by selected demographics, the data revealed:
Gender Differences Women Students (82%); Men Students (77%)
Racial Differences White Students (76%); Students of Color (60%)
Sexual Orientation Differences Heterosexual (67%); LGB (50%)

Welcoming Workplace Climate
More than half of all employees found the workplace climate to be welcoming of “difference.”
Women, Respondents of Color, and sexual minority respondents were less likely to believe the workplace climate was welcoming for employees based on gender, race and sexual orientation than their men, White, and heterosexual counterparts.

Summary
Strengths and Successes
Challenges and Opportunities

Summary of FindingsStrengths
High percentages of employees and students at UW Colleges were highly satisfied or satisfied with the way their jobs/educations (over 80%) and the way their careers/academic careers (over 60%) have progressed.
Institutional support for faculty and staff towards professional development is a major strength of the UW Colleges and an important reason why many employees felt satisfied with their jobs and the way their careers have progressed.
Many faculty were very complimentary about the quality of their students, and many student respondents described their faculty as professional, knowledgeable, and skilled.
Over 80% of respondents reported that they were comfortable or very comfortable with the overall climate for diversity, climate in their department or work unit, and climate in their classes.

Summary of FindingsOpportunities and Challenges
Challenge 1: Perceived Institutional Classism
Challenge 2: Perceived Homophobia and Heterosexism
Challenge 3: Perceived Sexism
Challenge 4: Perceived Racism

Perceived Institutional Classism
Staff respondents perceived that they had less status and therefore less privilege within the institution than other employees.
Staff members in general were more likely than faculty and student respondents to experience harassment, and more than one-quarter identified the basis for the harassment as institutional status.
Classified staff were less satisfied with their jobs and with the way their careers have progressed than academic staff and faculty.

Perceived Homophobia and Heterosexism
Higher percentages of LGB respondents believed they had experienced harassment, and more than half indicated that the harassment was based on their sexual orientation.
Both LGB employees and students reported higher rates of having seriously considered leaving their campuses than their heterosexual counterparts.
Fewer LGB respondents than heterosexual respondents were comfortable with the climate in their departments, work areas, and classroom settings.
LGB student respondents were less satisfied with their educations and the way their academic careers have progressed than other demographic groups.
LGB employee respondents strongly agreed/agreed that the institution is unfair in providing health benefits to unmarried, co-parenting families, and disagreed/strongly disagreed that they have equitable access to domestic partner benefits.

Perceived Sexism
Slightly more women reported experiencing harassment than their male counterparts.
Of the thirteen percent of women who reported experiencing harassment, thirty-six percent indicated the harassment was based on their gender.
Of the nineteen respondents who believed they were sexually assaulted, 16 were female.
Of respondents who observed others being harassed, a slightly higher percentage of women than men believed they had witnessed offensive, hostile, exclusionary, or intimidating conduct.
Higher percentages of women than men observed discriminatory employment practices for hiring, disciplinary actions, and promotion.

Perceived Racism
Respondents of Color were more likely to believe they had experienced offensive, hostile, exclusionary, or intimidating conduct and on the basis of race.
Slightly higher percentages of People of Color believed they had observed harassment at the UW Colleges.
Respondents of Color were less comfortable in their colleges, department or work unit, and classes than their White counterparts.
Only 58% of Employees of Color compared with 76% of all employee thought the workplace climate was welcoming based on race.
Employees of Color were not as comfortable asking questions about performance expectations, felt that their colleagues had higher expectations of them, and felt constantly under scrutiny by their colleagues.
A success, however, is that lower percentages of Employees of Color and Students of Color than their White counterparts have seriously considered leaving their colleges.

Next Steps…

Process ForwardFall/Spring 2008-2009
Share report results with campus community Campus-based dialogue regarding the assessment results Campus-based feedback on recommended actions UW Colleges-wide aggregate and campus-specific Executive
Summaries available at:
http://www.uwc.edu/administration/academic-affairs/campusclimate/
The UW Colleges Aggregate Report and individual campus-specific reports will also be available in hard copy at each campus library.
Recommend an “advance” (as opposed to a retreat) to begin a call to action regarding the challenges uncovered in the reports.

Tell Us What You Think…
Additional questions/comments on results?
Thoughts on process?Suggested actions?

Questions..? Other Ideas..?

Last Thoughts
“Resistance begins with people confronting pain, whether it’s theirs or somebody else’s, and wanting to do something to change it”
-- bell hooks


