
UNIVERSITY OF CALGARY
Effective Project Management of Oil & Gas Projects:
A Model for Oil Sands' SAGD Plants
by
Alnoor Akberali Halari
A THESIS
SUBMITTED TO THE FACULTY OF GRADUATE STUDIES
IN PARTIAL FULFILMENT OF THE REQUIREMENTS FOR THE
DEGREE OF MASTER OF SCIENCE
DEPARTMENT OF CIVIL ENGINEERING
CALGARY, ALBERTA
DECEMBER, 2010
© Alnoor Halari 2010

978-0-494-75264-7
Your file Votre référence
Library and ArchivesCanada
Bibliothèque etArchives Canada
Published HeritageBranch
395 Wellington StreetOttawa ON K1A 0N4Canada
Direction duPatrimoine de l'édition
395, rue WellingtonOttawa ON K1A 0N4Canada
NOTICE:
ISBN:
Our file Notre référence
978-0-494-75264-7ISBN:
The author has granted a non-exclusive license allowing Library andArchives Canada to reproduce,publish, archive, preserve, conserve,communicate to the public bytelecommunication or on the Internet,loan, distrbute and sell thesesworldwide, for commercial or non-commercial purposes, in microform,paper, electronic and/or any otherformats.
The author retains copyrightownership and moral rights in thisthesis. Neither the thesis norsubstantial extracts from it may beprinted or otherwise reproducedwithout the author's permission.
In compliance with the CanadianPrivacy Act some supporting formsmay have been removed from thisthesis.
While these forms may be included in the document page count, theirremoval does not represent any lossof content from the thesis.
AVIS:
L'auteur a accordé une licence non exclusivepermettant à la Bibliothèque et Archives Canada de reproduire, publier, archiver,sauvegarder, conserver, transmettre au public par télécommunication ou par l'Internet, prêter,distribuer et vendre des thèses partout dans lemonde, à des fins commerciales ou autres, sursupport microforme, papier, électronique et/ouautres formats.
L'auteur conserve la propriété du droit d'auteur et des droits moraux qui protege cette thèse. Nila thèse ni des extraits substantiels de celle-ci ne doivent être imprimés ou autrement reproduits sans son autorisation.
Conformément à la loi canadienne sur laprotection de la vie privée, quelques formulaires secondaires ont été enlevés decette thèse.
Bien que ces formulaires aient inclus dansla pagination, il n'y aura aucun contenu manquant.
ii
UNIVERSITY OF CALGARY
FACULTY OF GRADUATE STUDIES
The undersigned certify that they have read, and recommend to the Faculty of Graduate
Studies for acceptance, a thesis entitled "Effective Project Management of Oil & Gas
Projects: A Model for Oil Sands’ SAGD Plants" submitted by Alnoor Akberali Halari in
partial fulfilment of the requirements of the degree of Master of Science.
Supervisor, Dr George Jergeas, Department of Civil Engineering
Dr Sudarshan Mehta, Department of Department of Chemical
and Petroleum Engineering
Dr Francis Hartman, Department of Civil Engineering
Dr Gordon Moore, Department of Department of Chemical
and Petroleum Engineering
Dr Jennifer Krahn, Haskayne School of Business
Date

iii
Abstract
With its vast oil reserves, Alberta is poised to become one of the world’s major oil
suppliers. However, extracting this oil economically will require effective management of
the oil sands’ projects in order to build them on time and within budget. Projects are
subject to both internal and external forces such as political, economic, social and
technological which can destabilize and create tremors to the execution. The SAGD-ET
model developed in this research, with its three pillars of engineering, project
management processes and communications, provides valuable solutions to these types of
issues thus encouraging effective project execution. This model was developed using the
Delphi Method of survey by collecting lessons learned from professionals in the oil & gas
industry who had worked on SAGD projects. The lessons learned which were then rated
allowed for the identification of critical areas for successful execution of SAGD projects.
The SAGD-ET model also provides solutions to the problems encountered during the
engineering, procurement and construction phases of SAGD and oil & gas projects.

iv
Acknowledgements
In every major endeavour in life, one needs a guide to help navigate through uncharted
waters. Dr George Jergeas has been one such guide. He has shown me the way through
his knowledge and motivation while keeping me on track in completing this thesis, and
for this, I am extremely grateful and offer my deepest thanks. I would also like to thank
Dr Francis Hartman and Dr Jennifer Krahn for their valuable feedback and comments.
This research contains the voices of many people particularly the survey participants who
provided freely of their time and thought; I truly appreciate their efforts and sincerely
thank them all. In addition, I would like to convey my appreciation to the hidden heroes
of the University of Calgary, the librarians, for their helpful services.
I am very grateful to Ken Harris for his generosity by sharing his wisdom, knowledge and
insight of undertaking projects; his practical ideas have been extremely beneficial. My
sincere gratitude also goes to Diamond Kanani for introducing me many years back to the
EPC industry, which ultimately made it possible for me to pursue this goal.
The constant support and prayers of my family has been indeed very special; it sustained
me in this huge undertaking, and I thank them all immensely.
Knowledge is a gift of the Divine which informs the human intellect by opening little
windows of what was previously unknown to him (Aga Khan, 1985). This knowledge
seemed to appear at the right time for which, I am deeply thankful to the Almighty.

v
Dedication
This thesis is dedicated to the memory of my dad
Akberali Hasham Halari
1930-2008

vi
Table of Contents
Approval Page ..................................................................................................................... ii Abstract .............................................................................................................................. iii Acknowledgements ............................................................................................................ iv
Dedication ........................................................................................................................... v
Table of Contents ............................................................................................................... vi List of Tables ..................................................................................................................... xv
List of Figures and Illustrations ...................................................................................... xvii List of Symbols, Abbreviations and Nomenclature .......................................................... xx
Epigraph ......................................................................................................................... xxiii
CHAPTER 1: INTRODUCTION ....................................................................................... 1
1.1 The Oil Sands’ Potential ........................................................................................... 1
1.1.1 Background on the Oil Sands ........................................................................... 3
1.1.2 Effective Project Management of SAGD Projects ........................................... 4
1.2 The Research Problem .............................................................................................. 4
1.3 Motivation for Research ............................................................................................ 5
1.4 Research Objectives .................................................................................................. 6
1.5 Research Approach ................................................................................................... 6
1.5.1 Qualitative Research ......................................................................................... 6
1.5.2 Round 1 Delphi Survey..................................................................................... 7
1.5.3 Round 2 Delphi Survey..................................................................................... 8
1.6 Summary of Findings ................................................................................................ 8
1.6.1 Communications on Projects ............................................................................ 9
1.6.2 Knowledge and Experience of Project Management Processes ..................... 10
1.6.3 Management of Engineering Data .................................................................. 11
1.7 The Proposed Model - SAGD Execution Triangle (SAGD-ET) ............................ 12
1.8 Conclusions and Recommendations ....................................................................... 13
1.9 Contributions of the Research ................................................................................. 14
1.10 Limitations of the Research .................................................................................. 15
1.11 Areas for Further Research ................................................................................... 15
1.12 Thesis Organization and Chapter Summaries ....................................................... 16
1.12.1 Chapter One: Introduction ............................................................................ 16
1.12.2 Chapter Two: Literature Review .................................................................. 16
1.12.3 Chapter Three: Research Methods ................................................................ 17
1.12.4 Chapter Four: Selected Research Methodology: The Delphi Method .......... 17
1.12.5 Chapter Five: Application of the Research Methodology ............................ 18
1.12.6 Chapter Six: Results of Delphi Survey - Rounds 1 and 2 ............................. 18
1.12.7 Chapter Seven: Discussion and Analysis ...................................................... 19
1.12.8 Chapter Eight: The Proposed Model – SAGD Execution Triangle (SAGD-ET) ..................................................................................................... 19
1.12.9 Chapter Nine: Conclusions and Recommendations ...................................... 20
1.12.10 Summary ..................................................................................................... 20
CHAPTER 2: LITERATURE REVIEW .......................................................................... 22
2.1 Introduction ............................................................................................................. 22

vii
2.2 Project Management ................................................................................................ 24
2.3 Large Projects .......................................................................................................... 28
2.3.1 Oil & Gas ........................................................................................................ 28
2.3.2 Offshore .......................................................................................................... 32
2.3.3 Pipelines .......................................................................................................... 34
2.3.4 Mining ............................................................................................................. 35
2.4 Engineering ............................................................................................................. 38
2.4.1 Execution ........................................................................................................ 38
2.4.2 Fast Tracking .................................................................................................. 39
2.5 Procurement ............................................................................................................ 40
2.5.1 Contracting Strategies ..................................................................................... 41
2.5.1.1 Cost Reimbursable ................................................................................ 41
2.5.1.2 Lump-Sum Contracting ......................................................................... 42
2.5.1.3 Disadvantages of Lump-Sum Contracts................................................ 43
2.5.1.4 Modified Lump-Sum Contracts ............................................................ 43
2.5.1.5 Risk Allocation & Disputes .................................................................. 44
2.6 Construction ............................................................................................................ 45
2.6.1 Constructability ............................................................................................... 45
2.6.2 Modularization ................................................................................................ 46
2.7 Steam Assisted Gravity Drainage (SAGD) ............................................................. 48
2.7.1 Overview of the Oil Sands .............................................................................. 48
2.7.2 Mining ............................................................................................................. 50
2.7.3 The SAGD Process ......................................................................................... 51
2.7.4 Application of SAGD ..................................................................................... 57
2.7.5 Oil Sands versus Conventional Crude Oil Extraction .................................... 59
2.8 Gaps Identified in the Literature ............................................................................. 59
2.9 Future of Alberta’s Oil & Gas Industry .................................................................. 61
2.10 Lessons Learned .................................................................................................... 62
2.10.1 An Inconvenient Truth .................................................................................. 62
2.10.2 Do Lessons Learned Really Help? ................................................................ 63
2.10.3 Study of Lessons Learned at Alberta EPC Firms ......................................... 63
2.10.4 Importance of Context .................................................................................. 64
2.11 Generating Theory ................................................................................................ 65
2.12 Prologue ................................................................................................................ 65
2.13 Summary ............................................................................................................... 66
CHAPTER 3: RESEARCH METHODS .......................................................................... 67
3.1 Quantitative vs. Qualitative Research Defined ....................................................... 67
3.2 The Five Different Qualitative Methods ................................................................. 69
3.2.1 Narrative Research .......................................................................................... 69
3.2.2 Phenomenological Research ........................................................................... 70
3.2.3 Grounded Theory Research ............................................................................ 71
3.2.4 Ethnography Research .................................................................................... 72
3.2.5 Case Study Research ....................................................................................... 72
3.3 Research Design ...................................................................................................... 73
3.4 Data Collection & Management .............................................................................. 74
3.5 Data Analysis and Representation .......................................................................... 77
viii
3.5.1 Coding ............................................................................................................. 77
3.6 Rigor ........................................................................................................................ 78
3.7 Key Approaches to Validity .................................................................................... 78
3.7.1 Internal Validity .............................................................................................. 79
3.7.2 External Validity ............................................................................................. 79
3.7.3 Triangulation ................................................................................................... 80
3.7.4 Reliability ........................................................................................................ 80
3.8 Researcher Involvement .......................................................................................... 81
3.9 Ethical Considerations ............................................................................................ 81
3.10 Conclusion............................................................................................................. 82
3.11 Summary ............................................................................................................... 82
CHAPTER 4: SELECTED RESEARCH METHODOLOGY – THE DELPHI .............. 83
4.1 Rationale for Using the Delphi Method .................................................................. 83
4.1.1 Impact of Sociological Changes on the Delphi Method ................................. 84
4.1.2 Anonymity ...................................................................................................... 85
4.1.3 Pluralistic Perspectives ................................................................................... 86
4.1.4 Absence of Hierarchy ..................................................................................... 87
4.1.5 No True or False Answers .............................................................................. 87
4.1.6 Talk and Listen to the Experts ........................................................................ 88
4.1.7 Go to the Grass Roots ..................................................................................... 88
4.2 History of the Delphi Method of Research ............................................................. 89
4.3 Mechanics of the Delphi Method ............................................................................ 91
4.3.1 Anonymity ...................................................................................................... 91
4.3.2 Iteration & Controlled Feedback .................................................................... 92
4.3.3 Statistical Group Response ............................................................................. 93
4.4 Types of Delphi Method ......................................................................................... 94
4.5 Steps for Conducting a Delphi Research ................................................................ 95
4.5.1 Preparation Phase ............................................................................................ 96
4.5.1.1 Identify Research Needs ....................................................................... 96
4.5.1.2 Conduct Literature Review ................................................................... 96
4.5.1.3 Research Design .................................................................................... 96
4.5.1.4 Identify Potential Survey Participants ................................................... 97
4.5.1.5 Develop Research Question .................................................................. 98
4.5.2 Survey Phase ................................................................................................... 98
4.5.2.1 Develop Round 1 Questionnaire ........................................................... 98
4.5.2.2 Trial Run ............................................................................................... 99
4.5.2.3 Round 1 Delphi ..................................................................................... 99
4.5.2.4 Evaluate and Incorporate Feedback from Round 1 ............................. 100
4.5.2.5 Mean, Mode or Median? ..................................................................... 101
4.5.2.6 Evaluate Survey Results ...................................................................... 101
4.5.3 Round 2 ......................................................................................................... 102
4.5.3.1 Develop Round 2 Questionnaire ......................................................... 102
4.5.3.2 Lack of Convergence .......................................................................... 103
4.5.3.3 Trial Run ............................................................................................. 104
4.5.3.4 Round 2 Delphi ................................................................................... 104
4.5.3.5 Incorporate Feedback from Round 2 ................................................... 104
ix
4.5.4 Round 3 ......................................................................................................... 105
4.5.5 Conclusion Phase .......................................................................................... 106
4.5.5.1 Tabulate Results .................................................................................. 106
4.5.5.2 Analysis of Final Results .................................................................... 106
4.5.5.3 Dissemination of Results..................................................................... 106
4.6 The Delphi – A Controlled Debate ....................................................................... 107
4.7 Summary ............................................................................................................... 107
CHAPTER 5: APPLICATION OF RESEARCH METHODOLOGY ........................... 108
5.1 Research Objectives .............................................................................................. 108
5.2 Planning the Research Study ................................................................................. 109
5.3 Scope of Study ...................................................................................................... 112
5.4 Researcher Involvement ........................................................................................ 113
5.5 Trial Run ............................................................................................................... 115
5.6 Survey Methodology and Procedure ..................................................................... 116
5.7 Participant Selection .............................................................................................. 117
5.7.1 Purposive Selection ....................................................................................... 117
5.8 Sample Size ........................................................................................................... 118
5.9 Data Collection Process ........................................................................................ 120
5.10 Round 1 Surveys ................................................................................................. 121
5.11 Round 1 Survey Question ................................................................................... 122
5.12 Basis and Philosophy of Round 1 Survey Question............................................ 122
5.13 Conducting Round 1 Delphi Survey ................................................................... 124
5.14 Data Codification ................................................................................................ 125
5.15 Round 2 Research Instrument ............................................................................. 126
5.16 Conducting Round 2 Delphi Survey ................................................................... 126
5.17 Data Management ............................................................................................... 127
5.18 Round 3 Delphi Survey ....................................................................................... 129
5.19 Time Required for Delphi Surveys ..................................................................... 130
5.20 Summary ............................................................................................................. 132
CHAPTER 6: RESULTS OF DELPHI SURVEY ROUNDS 1 AND 2 ......................... 133
6.1 Survey Participants’ Demographics ...................................................................... 133
6.1.1 Survey Participant’s Area of Specialization ................................................. 134
6.1.2 Engineering Participant’s Discipline ............................................................ 136
6.1.3 Participant’s Experience of Working in the EPC Industry ........................... 137
6.1.4 Participant’s Age ........................................................................................... 139
6.1.5 Participant’s Education ................................................................................. 140
6.1.6 Participant’s Organization ............................................................................ 141
6.2 Round 1 Survey Results ........................................................................................ 142
6.3 Categories with Further Codification .................................................................... 144
6.4 Breakdown of Thematic Areas into Sub-Areas .................................................... 145
6.5 Round 2 Survey Results ........................................................................................ 146
6.5.1 Summarizing Lessons Learned ..................................................................... 146
6.5.2 Eliminating Bias ........................................................................................... 147
6.6 Round 2 Survey ..................................................................................................... 147
6.6.1 Definition of Successful ................................................................................ 148

x
6.6.2 Likert Scale ................................................................................................... 149
6.6.3 Round 2 Survey Interviews ........................................................................... 149
6.7 Round 2 Survey Results ........................................................................................ 150
6.7.1 Will these Lessons have to be Learned Again on Other Projects? ............... 152
6.7.2 Importance of Lessons Learned .................................................................... 157
6.7.3 Comparison of Participant Scores by Area of Specialization ....................... 157
6.7.3.1 Observations on the Level of Alignment ............................................ 165
6.7.4 Triangulation ................................................................................................. 168
6.7.5 Top Thirty Lessons Learned Grouped by Area ............................................ 168
6.8 Summary ............................................................................................................... 170
CHAPTER 7: ANALYSIS AND DISCUSSION............................................................ 171
7.1 Reservoir ............................................................................................................... 171
7.2 Front-end Planning ................................................................................................ 173
7.2.1 Clear Scope Definition .................................................................................. 174
7.2.1.1 Fast Tracking ....................................................................................... 175
7.2.1.2 Traditional versus Current Project Durations ..................................... 176
7.2.2 Change Management .................................................................................... 178
7.2.3 Changes to PFDs and P&IDs ........................................................................ 179
7.2.4 Design Changes and 3D-Modelling .............................................................. 180
7.2.5 Design Philosophy & Technology ................................................................ 181
7.2.6 Regulatory ..................................................................................................... 181
7.2.7 Early Environmental Assessment ................................................................. 182
7.3 Project Execution .................................................................................................. 183
7.3.1 Executing Project in Countries with a Lower Cost Advantage .................... 183
7.3.2 Workshare as an Executing Strategy ............................................................ 184
7.3.3 Operability, Maintainability and Constructability ........................................ 186
7.3.4 Simple Well Defined Project Procedures ..................................................... 186
7.3.4.1 Cause & Effect .................................................................................... 187
7.4 Engineering ........................................................................................................... 188
7.4.1 Developing P&IDs ........................................................................................ 188
7.4.2 Fix Basic Process Design Early .................................................................... 190
7.4.3 Stakeholder Approval for Design ................................................................. 191
7.5 Vendor Data .......................................................................................................... 194
7.5.1 Internal Factors ............................................................................................. 195
7.5.1.1 Well Defined Project Scope ................................................................ 195
7.5.1.2 Design Changes ................................................................................... 195
7.5.1.3 Schedule .............................................................................................. 196
7.5.1.4 Contractual Relationship with Vendor ................................................ 197
7.5.2 External Factors ............................................................................................ 198
7.5.2.1 Impact of Sub-Vendors ....................................................................... 198
7.5.2.2 Sub-Vendors’ Resources ..................................................................... 199
7.5.2.3 Schedule .............................................................................................. 200
7.5.2.4 Contractual Relationship between Owner/EPC and Vendors/Sub-Vendors ................................................................................................ 200
7.5.2.5 Vendors’ Technical Capabilities ......................................................... 201
7.6 Quality ................................................................................................................... 201
xi
7.6.1 Meet Owner Quality Requirements .............................................................. 202
7.6.2 Vendor Quality Management ........................................................................ 203
7.7 Procurement .......................................................................................................... 203
7.8 Construction .......................................................................................................... 204
7.8.1 Why is Construction Involvement Important? .............................................. 204
7.8.2 Degree of Construction Involvement ............................................................ 205
7.8.3 Construction Scope ....................................................................................... 206
7.9 Management .......................................................................................................... 206
7.9.1 Roles & Responsibilities ............................................................................... 207
7.9.2 Decision Making ........................................................................................... 208
7.10 Schedule .............................................................................................................. 208
7.10.1 Realistic Schedule ....................................................................................... 208
7.10.2 Developmental Projects .............................................................................. 209
7.10.3 Gestation Period .......................................................................................... 209
7.10.4 Procurement ................................................................................................ 210
7.10.5 Modularization ............................................................................................ 210
7.10.6 Third Party Issues ....................................................................................... 212
7.10.6.1 Involvement at Project Meetings ...................................................... 212
7.10.6.2 Third Party Deliverables in Master Schedule ................................... 212
7.10.7 Is the Project Cost or Schedule Driven? ..................................................... 212
7.11 Communication ................................................................................................... 213
7.11.1 Communication Among Whom and Communication About What? .......... 214
7.11.2 Why is Communication Important? ............................................................ 215
7.11.3 Missed Communication .............................................................................. 217
7.11.4 Root of the Communications Conundrum .................................................. 218
7.11.4.1 Large Volumes of Data from Software Tools ................................... 218
7.11.4.2 Cosmopolitan Societies ..................................................................... 218
7.11.4.3 Multigenerational Teams .................................................................. 219
7.12 Summary ............................................................................................................. 220
CHAPTER 8: THE PROPOSED MODEL ..................................................................... 221
8.1 Theory of Forces ................................................................................................... 221
8.1.1 External Forces ............................................................................................. 222
8.1.1.1 Political Forces .................................................................................... 222
8.1.1.2 Economic Forces ................................................................................. 223
8.1.1.3 Social Forces ....................................................................................... 225
8.1.1.4 Technological Forces .......................................................................... 225
8.1.2 Internal Forces .............................................................................................. 226
8.1.2.1 Competing Projects ............................................................................. 226
8.1.2.2 The Project Organizational Structure & Decision Making ................. 227
8.1.2.3 Project Ownership ............................................................................... 229
8.1.2.4 Financial Considerations ..................................................................... 230
8.1.3 Tremors on a Project ..................................................................................... 230
8.2 What are the Solutions? ........................................................................................ 231
8.2.1 Triple Constraints on Projects: Cost, Schedule and Quality ......................... 231
8.3 SAGD-Execution Triangle (SAGD-ET) ............................................................... 232
8.3.1 Application of SAGD-ET ............................................................................. 235
xii
8.4 Engineering ........................................................................................................... 235
8.4.1 Well Defined Reservoir Data ........................................................................ 235
8.4.1.1 Build a Pilot Plant ............................................................................... 236
8.4.1.2 Communication among Reservoir, Operations, & Project Group ...... 239
8.4.1.3 “What if” Scenario Planning ............................................................... 239
8.4.1.4 Control Flow of Information to the Design Group ............................. 240
8.4.2 Define Design Philosophy & Technology Early .......................................... 241
8.4.3 Define the Scope by EDS ............................................................................. 242
8.4.4 Freeze Scope after EDS ................................................................................ 245
8.4.5 Fix Basic Process Design Early .................................................................... 245
8.4.6 Completed P&IDs (IFD) ............................................................................... 246
8.4.6.1 Ramp up Staffing of the Process Engineering Group ......................... 247
8.4.7 Build Regulatory Requirements in the Design ............................................. 249
8.4.8 Order Long Lead Items Early ....................................................................... 250
8.4.9 Vendor Data Requirements ........................................................................... 252
8.4.9.1 Firm-up Scope with Minimal Design Changes ................................... 252
8.4.9.2 Payments Based on Receipt of Vendor Data ...................................... 252
8.4.9.3 Vendor Incentives ............................................................................... 254
8.4.9.4 Suppliers Document Index (SDI) ........................................................ 255
8.4.9.5 Build Good Relations with Vendor ..................................................... 256
8.4.9.6 Assign Expeditor to Vendor’s Shop .................................................... 256
8.4.9.7 Role of Expeditor ................................................................................ 256
8.4.9.8 Vendor Evaluation .............................................................................. 257
8.4.10 Operability, Maintainability & Constructability ......................................... 257
8.4.11 Vendor Quality Management ...................................................................... 259
8.5 Project Management Processes ............................................................................. 260
8.5.1 Simple Processes and Procedures ................................................................. 261
8.5.2 Knowledge and Experience of Management Processes ............................... 262
8.5.2.1 Management Education ....................................................................... 263
8.5.2.2 Project Organization Chart .................................................................. 264
8.5.3 Set Realistic Key Milestone Dates ................................................................ 266
8.5.3.1 Sample Schedule for a SAGD Plant – From Pilot Plant to Oil Production ............................................................................................ 268
8.5.3.2 Decision Making ................................................................................. 275
8.5.4 Early Environmental Assessment ................................................................. 275
8.5.5 Effective Change Management ..................................................................... 276
8.5.5.1 Early Recognition of Changes ............................................................ 277
8.5.5.2 Acceptance of Change ......................................................................... 278
8.5.5.3 Mitigation to Changes ......................................................................... 279
8.5.5.4 Changes on SAGD Projects ................................................................ 279
8.5.6 Timely Receipt of Vendor Data .................................................................... 283
8.5.7 Meet Owner’s Quality Requirements (QA/QC) ........................................... 283
8.5.7.1 Enhance Role of Quality Discipline .................................................... 284
8.5.8 Plan for Weather Windows ........................................................................... 285
8.6 Communications ................................................................................................... 285
8.6.1 Mode of Communication .............................................................................. 286

xiii
8.6.2 Parties to Communication ............................................................................. 287
8.6.3 Channels of Communication ........................................................................ 288
8.6.4 Flows of Communication .............................................................................. 289
8.6.5 Objects of Communication ........................................................................... 290
8.6.6 Generations ................................................................................................... 290
8.6.7 Solutions to Improve Communications on Projects ..................................... 291
8.6.7.1 Build a Culture of Trust ...................................................................... 292
8.6.7.2 Project Organization Chart .................................................................. 297
8.6.7.3 Review Communication Plan at Gate Reviews .................................. 298
8.6.7.4 Communications Interface Coordinator .............................................. 299
8.6.7.5 Elevate Importance of Communications on Projects .......................... 300
8.6.7.6 Educating Project Teams on How to Communicate Better ................ 300
8.7 Importance of Lessons Learned ............................................................................ 300
8.7.1 Method of Communicating Lessons Learned ............................................... 301
8.8 Summary ............................................................................................................... 302
CHAPTER 9: CONCLUSIONS AND RECOMMENDATIONS .................................. 303
9.1 Review of Project Objectives ................................................................................ 303
9.2 Conclusions and Recommendations ..................................................................... 304
9.2.1 Reservoir Uncertainties Impact Design of Surface Facilities ....................... 304
9.2.2 Engineering - SAGD Technology is Evolving ............................................. 306
9.2.3 Spend More Time During Front-end Planning ............................................. 307
9.2.4 Regulatory/Environmental ............................................................................ 308
9.2.5 Project Execution .......................................................................................... 309
9.2.6 No Engineering Related Issues ..................................................................... 309
9.2.7 Vendor Data .................................................................................................. 311
9.2.8 Meeting Owner’s Quality Standards ............................................................. 311
9.2.9 Procurement .................................................................................................. 312
9.2.10 Construction - Modularization .................................................................... 313
9.2.11 Knowledge and Experience of Project Management .................................. 314
9.2.12 Schedule ...................................................................................................... 314
9.2.13 Communication ........................................................................................... 315
9.2.14 Lessons Learned ......................................................................................... 316
9.2.15 Perceptions of Project Managers and Engineers ......................................... 318
9.2.16 The Delphi is an Effective Survey Method ................................................ 318
9.2.17 Plant Replication ......................................................................................... 319
9.3 Contributions of the Research ............................................................................... 320
9.3.1 Development of the SAGD-ET Model ......................................................... 320
9.3.2 Theory of Forces Impacting Project Execution ............................................ 321
9.3.3 Added Pioneering Knowledge to Project Management of SAGD Projects .. 321
9.3.4 Identification and Ranking of Factors for Successful Execution ................. 322
9.3.5 Commentary to Project Procedures .............................................................. 322
9.3.6 Lessons Learned ........................................................................................... 322
9.3.7 Development of a Comprehensive SAGD Project Schedule ........................ 323
9.3.8 Communication Attributes on EPC Projects ................................................ 323
9.3.9 Impact of Churn (indecision) on Projects ..................................................... 323
9.3.10 Timely Receipt of Vendor Data .................................................................. 324
xiv
9.3.11 Knowledge and Experience of Management Processes ............................. 324
9.3.12 Increasing Trust in Organizational Setting ................................................. 324
9.3.13 Consolidation of Literature of Oil & Gas Project Management ................. 324
9.4 Limitations of the Research .................................................................................. 325
9.5 Suggested Areas for Future Research ................................................................... 325
9.5.1 Lump-sum Turn Key Contracts in Alberta’s Oil & Gas Industry ................ 326
9.5.2 Enhancing Communications on Oil & Gas Projects ..................................... 326
9.5.3 Decision Making on Oil & Gas Projects ...................................................... 326
9.5.4 Analysis of Modularization Compared to Stick-Built Construction ............ 327
9.5.5 Development of an Effective Model for Timely Receipt of Vendor Data ... 327
9.5.6 Replication of Oil & Gas Facilities ............................................................... 328
9.6 Summary ............................................................................................................... 328
9.7 Epilogue ................................................................................................................ 329
REFERENCES ................................................................................................................ 332
xv
List of Tables
Table 2.1. Cost Overruns on Alberta Oil & Gas Projects ................................................ 23
Table 2.2. Cost Overruns on Historical Projects .............................................................. 30
Table 2.3. Cost Overruns on Mining Projects .................................................................. 36
Table 2.4. Characteristics of Cost Reimbursable and Lump-Sum Contracts ................... 43
Table 3.1. Comparison of Quantitative and Qualitative Methods.................................... 68
Table 3.2. Data Collection Processes of Various Qualitative Research Methods............ 76
Table 4.1. Comparison of Traditional and Emerging Societal Notions ........................... 85
Table 4.2. Classical Delphi Characteristics and its Application on SAGD Research ...... 94
Table 4.3. Phases and Attributes of a Delphi Survey ....................................................... 95
Table 5.1. Major Activities Required in Undertaking Delphi Survey ........................... 131
Table 6.1. Participant’s Area of Specialization .............................................................. 135
Table 6.2. Engineering Participant’s Discipline............................................................. 136
Table 6.3. Number of Years Experience of EPC Industry ............................................. 138
Table 6.4. Participant’s Age ........................................................................................... 139
Table 6.5. Participant’s Educational Background .......................................................... 140
Table 6.6. Participant’s Organization ............................................................................. 141
Table 6.7. Emerging Thematic Areas from Round 1 Lesson Learned ........................... 143
Table 6.8. Thematic Areas with Further Codification (Data) ........................................ 144
Table 6.9. Round 2 Overall Survey Results – Rank & Score ........................................ 151
Table 6.10. Will These Lessons Have to be Learned Again? ........................................ 152
Table 6.11. Round 2 Project Management Survey Results – Rank & Score ................. 159
Table 6.12. Round 2 Engineering Survey Results –Rank & Score ................................ 160
Table 6.13 Round 2 Overall, Project Management and Engineering Scores .................. 161
Table 6.14. Definition for Levels of Alignment............................................................. 162

xvi
Table 6.15. Lessons Learned with High Level of Alignment ........................................ 163
Table 6.16. Lessons Learned with Medium Level of Alignment................................... 164
Table 6.17. Lessons Learned with Low Level of Alignment ......................................... 165
Table 6.18. Percentage of Lessons Learned by Level of Alignment ............................. 167
Table 6.19. Round 2 Survey Results – Score by Area ................................................... 169
Table 7.1. Reservoir ........................................................................................................ 171
Table 7.2. Front-end Planning ........................................................................................ 173
Table 7.3. Regulatory ..................................................................................................... 181
Table 7.4. Project Execution .......................................................................................... 183
Table 7.5. Engineering ................................................................................................... 188
Table 7.6. Vendor Data .................................................................................................. 194
Table 7.7. Quality ........................................................................................................... 201
Table 7.8. Procurement .................................................................................................. 203
Table 7.9. Construction .................................................................................................. 204
Table 7.10. Management ................................................................................................ 206
Table 7.11. Schedule ...................................................................................................... 208
Table 7.12. Communication ........................................................................................... 213
Table 7.13. Characteristics of Communication on SAGD Projects ............................... 215

xvii
List of Figures and Illustrations
Figure 1.1. Thesis Organization Chart ............................................................................. 21
Figure 2.1. Impact of Incremental Changes of Scope on Budget and Schedule .............. 37
Figure 2.2. Composition of an Oil Sands Particle ............................................................ 49
Figure 2.3. Areas of Oil Sands Reserves in Alberta ......................................................... 50
Figure 2.4. Bitumen Extraction Using a SAGD Process.................................................. 53
Figure 2.5. Schematic of Major Components of a SAGD Central Processing Plant ....... 56
Figure 2.6. Bitumen .......................................................................................................... 57
Figure 2.7. Synthetic Crude Oil ....................................................................................... 57
Figure 2.8. Literature Review Map .................................................................................. 60
Figure 2.9. A Typical SAGD Plant in Northern Alberta .................................................. 66
Figure 3.1. Data Collection Process ................................................................................. 75
Figure 3.2. Example of the Coding Process to Develop Theory ...................................... 77
Figure 5.1. Effect of Group Size (Dalkey, 1969) ........................................................... 119
Figure 5.2. The Delphi Process from Round 1 to Round 2 ............................................ 128
Figure 5.3. Time Required for Delphi Surveys .............................................................. 131
Figure 6.1. Participant’s Area of Specialization ............................................................ 135
Figure 6.2. Engineering Participant’s Discipline ........................................................... 137
Figure 6.3. Experience of EPC Industry ........................................................................ 138
Figure 6.4. Participant’s Age ......................................................................................... 139
Figure 6.5. Participant’s Educational Background......................................................... 140
Figure 6.6. Participant’s Organization ........................................................................... 141
Figure 6.7. Thematic Areas with Further Codification .................................................. 145
Figure 6.8. Breakdown of Thematic Areas into Sub-Areas ........................................... 146
Figure 6.9. Breakdown of Responses to Question on Lessons Learned ........................ 152
xviii
Figure 6.10. Breakdown of Yes Response Between Owner and EPC Participants ...... 153
Figure 6.11. Breakdown of No Response Between Owner and EPC Participants......... 153
Figure 6.12. Round 2 Overall, Project Management, and Engineering Scores.............. 162
Figure 6.13. Lessons Learned with High Level of Alignment ....................................... 163
Figure 6.14. Lessons Learned with Medium Level of Alignment ................................. 164
Figure 6.15. Lessons Learned with Low Level of Alignment ....................................... 165
Figure 6.16. Levels of Alignment .................................................................................. 167
Figure 7.1. Impact of Oil Prices on Execution Strategy................................................. 176
Figure 7.2. Traditional Durations of EPC Phases .......................................................... 177
Figure 7.3. Overlapping EPC Phases ............................................................................. 178
Figure 7.4. Process of Designing a Plant – From Reservoir to Engineering.................. 190
Figure 7.5. Various Owners of a Project and Their Relationships ................................. 192
Figure 7.6. Working Relationship of Major Stakeholders of a Project .......................... 193
Figure 7.7. Structure Between Owner/EPC, Vendor, and Sub-Vendors........................ 199
Figure 7.8. Truck Carrying a Long Module to Northern Alberta .................................. 211
Figure 7.9. Preferred Communication Styles Among Generations ................................ 219
Figure 8.1. External and Internal Forces Impacting Projects ......................................... 222
Figure 8.2. Impact of “Churn” on Project Execution ..................................................... 229
Figure 8.3. Tremors Affecting Projects .......................................................................... 231
Figure 8.4. SAGD Execution Triangle (SAGD-ET) ...................................................... 234
Figure 8.5. A Type Curve Identifying Production from an Oil Sands Reservoir .......... 238
Figure 8.6. Various Approaches to Engineering ............................................................ 244
Figure 8.7. Ramping-up Staffing in the Process Engineering Group............................. 248
Figure 8.8. Vendor Milestone Progress Payments ......................................................... 253
Figure 8.9. Opportunities for Cost Reduction and Schedule Alignment ....................... 268
xix
Figure 8.10. Sample Schedule for Building a 40,000 b/d SAGD Plant ......................... 272
Figure 8.11. Attributes of Communication on EPC Projects ......................................... 286
Figure 8.12. Communication Flows with Email ............................................................ 289
Figure 8.13. Competence Trust ...................................................................................... 294
Figure 8.14. Ethical Trust ............................................................................................... 294
Figure 8.15. Emotional Trust ......................................................................................... 295
Figure 8.16. Increasing Trust in Organizational Setting ................................................ 296

xx
List of Symbols, Abbreviations and Nomenclature
Acronym Definition
AENV Alberta Environment
AACE Association for the Advancement of Cost Engineering
b/d Barrels per Day
CAD Canadian Dollar
C&SU Commissioning and Start-up
Auto-CAD Computer Assisted Design - 3D modelling Software
CII Construction Industry Institute
CWP Construction Work Packages
CSR Corporate Social Responsibility
CSS Cyclical Steam Stimulation
DBS Deliverables Breakdown Structure
DBM Design Basis Memorandum
DE Detailed Engineering
ESP Electrical Submersible Pumps
ERCB Energy Resources Conservation Board
EDS Engineering Design Specifications
EPC Engineering Procurement Construction (companies)
EWP Engineering Work Packages
FEL Front End Loading
GHG Green House Gases
I & C Instrument and Control Systems
xxi
Acronym Definition
IAP Inter Active Planning
IRR Internal Rate of Return
IFC Issued for Construction
IFD Issued for Design
IFR Issued for Review
kg Kilogram
MOC Management of Change
MR Material Requisition
MRP Material Requisition for Purchase
NPV Net Present Value
PIN Performance Improvement Notice
P&ID Piping and Instrument Diagram
PFD Process Flow Diagram
PMI Project Management Institute
PM Project Management or Project Manager
PO Purchase Order
QA/QC Quality Assurance/Quality Control
RFO Ready for Operations
SAGD-ET SAGD - Execution Triangle
SOR Steam to Oil Ratio
SAGD Steam Assisted Gravity Drainage
SME Subject Matter Expert

xxii
Acronym Definition
SDI Suppliers Document Index
THAI Toe to Heel Air Injection
TIC Total Installed Cost
US United States
VAPEX Vapour Extraction
VDDR Vendor data Drawing Requirements
WBS Work Breakdown Structure
xxiii
Epigraph
No honour is like knowledge. No belief is like modesty and patience,
no attainment is like humility, no power is like forbearance,
and no support is more reliable than consultation.
Ali ibn Abi Talib (c. 599-661)

1
Chapter 1: Introduction
The oil & gas industry has been considered by many as the backbone of Alberta’s
economic engine. From the first discovery of oil in Leduc back in 1947 to the rapidly
rising production from today’s oil sands, this industry has undoubtedly brought immense
financial prosperity to the citizens of this province. However, over the years, the oil &
gas industry has been subject to numerous cycles of boom and bust, the most recent one
occurring between 2006 and 2008 when oil prices climbed to a peak of US$147 per
barrel and collapsed around US$30. Nonetheless, due to the increased economic growth
of emerging countries such as China and India a sustained demand for oil can be
predicted in the medium term. In fact, a study conducted by Cambridge Energy Research
Associates (CERA), quoted in the Oil & Gas Journal, states that “Even in a world of
relatively slow demand growth, new supplies of oil will be needed, especially to meet
demand for greater mobility among those entering middle income levels around the world
and to offset declining production in existing fields” (Collyerand & Reheis-Boyd, 2009,
p. 1 para 7).
1.1 The Oil Sands’ Potential
Alberta’s vast oil sands reserves, consisting of nearly 173 billion barrels (AEUB, 2007),
give Canada the second largest oil reserves in the world (McColl, Mei, Millington, &
Kumar, 2008). This massive oil supply has been a major reason why Canada, and
particularly Alberta, has received significant interest in recent years from countries such
as the United States, China, Norway, Japan, and South Korea, just to name a few. A 2006
2
report of the Joint Economic Study Committee of the United States Congress entitled
Canadian Oil Sands: A New Force in the World Oil Market predicts that Canada will
most likely be among the top five oil producers in the world by the year 2016 (Saxton,
2006). In addition, Canada’s highly stable political and economic climate, relative to
other oil producing countries, makes it an attractive place for a secure supply of oil.
Considering that the global demand for oil is expected to increase from 85 million b/d in
2008 to approximately 97 million b/d by 2035 (Collyerand & Reheis-Boyd, 2009) and
that the United States has in recent times been reducing its reliance on oil supplies
obtained from the Middle East, demand for Canadian oil is expected to rise significantly.
According to statistics from the influential group IHS CERA, quoted by The Globe and
Mail, the United States imported 17% of its oil from Saudi Arabia and 15% from Canada
in the year 2000; almost a decade later, in the year 2009, 21% of US imports of oil were
from Canada and only 11% were from Saudi Arabia (McCarthy, 2010). The same report
suggests that the US will import close to 36% of its oil from Canada by the year 2030.
Within the Canadian context, conventional crude oil reserves have started declining
(CAPP, 2010). Although offshore oil production is an alternative, it is one which can
prove to be quite difficult to explore and drill from the ocean floor reservoirs. In addition
to this drawback, it can also produce considerable environmental impacts, such as the
recent oil spill in the Gulf of Mexico. For these and other reasons, the oil sands, despite
its higher extraction costs, relative to conventional crude oil, appear to be a very
attractive alternative.
3
Although there continues to be a significant amount of debate among environmentalists,
the media, and various political circles regarding greenhouse gas (GHG) emissions from
the oil sands, much of it is rhetoric, based on a poor understanding of the oil sands. In
fact, a report prepared by Jacobs Consultancy suggests that on a life cycle basis, which is
from wells to wheels, the oil produced from the oil sands generates similar GHG
emissions in comparison to crude oil from other countries such as Saudi Arabia,
Venezuela, and the US Gulf Coast (Jacobs, 2009).
1.1.1 Background on the Oil Sands
In comparison with countries having oil sands deposits such as Venezuela, Romania,
United States, and Russia, Alberta has some of the world’s largest deposits (ERCB,
2010a). However, 80% of these oil sands deposits in reservoirs contain oil that is deeper
than 75 meters below the earth’s surface, making it extremely difficult to mine at such
depths. Consequently, in situ, or “in place”, extraction methods have been developed over
time, which, unlike mining, do not disturb the earth as extensively through massive
excavations using large trucks and shovels. Therefore, in situ extraction has become a
predominant method in Alberta to recover the oil from the reservoirs (CAPP, 2009a).
Among the numerous in situ extraction methods currently available, such as Cyclical
Steam Stimulation (CSS), Vapour Extraction (VAPEX), Toe to Heel Air Injection
(THAI), and others, the Steam Assisted Gravity Drainage (SAGD) method has proven to
be a reliable technology. An increasing number of oil companies, including Suncor,
Cenovus, Husky, and many others, have invested heavily in the utilization of SAGD in
4
their oil sands operations. In an interview with The Globe and Mail, Brian Ferguson,
CEO of Cenovus, stated that “One hundred percent of our assets are SAGD and SAGD is
definitely in my opinion the way of the future for bitumen production”. Ferguson is not
alone in such thinking; many other large oil companies also have similar strategies.
1.1.2 Effective Project Management of SAGD Projects
With a large part of oil sands production coming from the employment of in situ
extraction and with SAGD being the most tested and advanced technology currently
available, the number of new plants using this technology is likely to increase
significantly as the North American economy recovers from the current recession. This
will subsequently increase the number of SAGD surface facilities, which will require
capital investments in the billions of dollars over the long term. Due to the large amount
of capital required, owners and shareholders of such projects will therefore expect greater
efficiencies from the engineering, procurement, and construction of the projects than
current practices provide. In addition, considering that many recent large oil & gas
projects in Alberta have had significant cost overruns (G. F. Jergeas, 2008), a great deal
of attention will be focussed by project owners, contractors, suppliers, and academia on
how to make the project management of SAGD projects more effective.
1.2 The Research Problem
From the large projects built in the past, such as bridges and canals, to the more recent
mega projects, such as airports and oil refineries, cost overrun has been a recurrent and
consistent theme. A study undertaken by the Government of Alberta in 2002 found that a

5
common problem relating to the cost and schedule overruns on large oil & gas projects is
the lack of proper management of scope, quality, and materials (G. F. Jergeas &
Ruwanpura, 2009). While studies to correct this situation have been carried out
previously, comprehensive studies in the engineering, procurement, and construction
(EPC) of oil & gas facilities, and particularly, of SAGD plants, have not yet been
undertaken. In addition, SAGD is a relatively new method of oil extraction and recovery;
at the same time, as stated earlier, the number of new SAGD plants in Alberta is expected
to increase within the this decade (Government of Alberta, 2009/2010). Therefore, a
project management model for the successful execution of oil & gas projects with a focus
on SAGD would be very beneficial to project owners and the EPC contractors in
effectively executing and completing these mega projects on time and within budget.
1.3 Motivation for Research
From the researcher’s perspective, the motivation for the research is to add to the current
literature, new theories and knowledge of project management in executing oil & gas
projects. In addition, the intent of the research is to assess and identify the issues
surrounding the understudied population (Creswell, 2007b) of project managers,
engineers, and support staff working collaboratively in the EPC industry environment.
Being employed in the EPC industry and currently working on a SAGD project, the
opportunity to the researcher for improving the effectiveness of project management on
oil & gas projects and SAGD in particular, appears to be an appealing and exciting
proposition and a natural fit for undertaking research in this area.

6
1.4 Research Objectives
This research aspires to accomplish two major objectives. The first objective is to review
at a high level the entire engineering, procurement, and construction process for
executing SAGD projects. The purpose of this review is to gain an understanding of how
the EPC processes function, which will help identify the current issues in executing the
projects. Upon identifying the issues, the second objective is to propose a model for
effective project management for executing SAGD projects. This includes recommending
solutions to some of the more common issues encountered in executing SAGD projects.
Thus, this research plan becomes a problem-solving approach where issues are identified,
a model is developed, and effective solutions for mitigation are devised.
1.5 Research Approach
1.5.1 Qualitative Research
Since this research involves both processes and people, the qualitative approach was
deemed more advantageous than the quantitative approach of research. This is because
qualitative research has the aptitude to collect voices of the research participants in a
natural setting (Creswell, 2007b). When consolidated and synthesized properly, the
participants’ knowledge, experiences, and innovations have the ability to evolve into
powerful concepts from which new knowledge can emanate.
Qualitative research has five predominant methods of inquiry, which include the
narrative, phenomenology, grounded theory, ethnography, and the case study. In this
research, due to the similar elements involved in project execution, such as cost,
7
schedule, technology, execution strategy, and stakeholders, the case study method was
deemed the most suitable, given that it would help in collecting similar but different
information about projects that the participants have worked on. Within the case study,
the Delphi Method was used to collect data from the research participants. This surveying
method was preferred because of its versatility in providing the participants’ voices in a
free, discreet, and democratic manner, which in turn helps reduce lopsided or biased
research results. The Delphi Method is known to be an efficient survey method,
especially where the process or problem being investigated is new or complex (Turoff &
Linstone, 2002).
1.5.2 Round 1 Delphi Survey
In this research, two rounds of surveying using the Delphi Method were conducted. In the
first round, lessons learned were collected through one-on-one interviews with 37
participants almost equally divided between the owner and EPC organizations; from
those groups, close to 50% of the participants were from the engineering area, 25% of the
participants were from the project management area, and the rest were from the
procurement, construction, and project support. The high number of engineering
participants in the survey is reflective of their actual proportion on oil & gas projects. A
total of 339 lessons learned were collected from the one-on-one interviews, thus
providing a good cross-section of views of the participants who had worked on, or were
currently working on, SAGD projects.

8
1.5.3 Round 2 Delphi Survey
After collecting the lessons learned from Round 1 of the Delphi survey, they were sorted
and codified from which 92 summarized lesson learned statements were prepared; these
statements were later provided to the same participants for rating in Round 2. Using a
Likert scale of 1 to 10, where 1 represents least impact and 10 represents high impact, the
participants rated the impact of each of the lessons learned on the successful execution of
SAGD projects. The individual scores of all the participants were tabulated on a
spreadsheet and the mean of each of the 92 lesson learned was calculated. The lessons
learned were then sorted based on the value of the mean and ranked from highest to
lowest in descending order. The top thirty lessons learned were analyzed and upon which
the SAGD-ET model was structured and built.
1.6 Summary of Findings
From Round 2 of the survey, the top ranking lessons learned include:
i. Communication between and within engineering/procurement/construction teams
ii. Knowledge/experience of management processes to execute large projects
iii. Management and control of engineering deliverables
iv. Have clearly defined and frozen scope by the end of the EDS phase
The complete survey rankings are available in Appendix B and a detailed analysis and
discussion of the results is provided in Chapter Seven. In the following sections, the top
ranked lessons learned are briefly discussed.

9
1.6.1 Communications on Projects
From the survey results, communications is one of the most important factors in the
successful execution of projects. Results from previous surveys and commentaries of
project management experts such as Hartman have also indicated communication as a
major project issue (2000). Achieving perfect communication on projects, particularly
larger ones, is difficult. This is because project communications has many attributes, such
as mode, parties, channels, flows, objects and generations, and all of these attributes have
sub-attributes. Therefore, maintaining perfect coordination and balance among and
between the attributes of communication can be daunting, if not overwhelming. This is
why, despite the efforts of all the players involved, communication on projects has not
been as efficient as one would have desired.
However, there are solutions to this challenging problem. According to research
conducted by Roberts & O’Reilly (1974), there is a significant relationship between trust
and the desire to communicate; therefore, building a culture of trust within a project
organization can result in improving communications. This can be achieved by conveying
a sense of openness and transparency among various project stakeholders. Another
solution is to place greater emphasis on the project organization chart and use it as a tool
to determine how and to whom communication should flow among the various project
participants. Because of its criticality, a well thought out and workable communications
plan should be included in the project execution plan of every phase. The attributes of
communication developed in this research study can be incorporated in such a plan for
effective results. In addition, the effectiveness of the communications plan should be

10
questioned and validated at each Gate Review. Finally, similar to a Quality Manager
being part of the project management team, a Communications Interface Coordinator
should be appointed on every project organization to give prominence to this area and to
ensure that communication on projects is occurring in an effective and efficient manner.
1.6.2 Knowledge and Experience of Project Management Processes
Similar to communications, knowledge and experience of project management processes
to execute large projects was equally highly rated in the survey. Effective project
management is the means by which team members can further a project’s goals and
objectives; lack of it can result in dissonance on the project. In organizations and projects,
the notions of leadership and management often get mixed up. Kotter suggests that
management essentially deals with processes, while leadership deals with movement by
directing people and resources to bring about change (1990). One way to improve that
understanding of leadership and particularly management is through education.
Educating team members on management as a topic with a deeper understanding of roles,
responsibilities, accountabilities, chains of command, lines of authority, motivation,
decision making, and building trust can significantly help establish effective project
management processes. The experience of project management becomes available by
selecting the right individuals with appropriate credentials to undertake the project.
Another related solution to improving knowledge of management processes is the greater
use and adherence to the project organization chart. Every project has one; however,
using it habitually and by recognizing the roles, responsibilities, authorities, and
11
accountabilities of the respective positions embedded in the project organization chart
results in less confusion and more order in executing projects. However, to be successful,
a disciplined approach to using the project organization chart has to be inculcated within
all levels of the project organization and enforced by upper levels of management.
1.6.3 Management of Engineering Data
Vendor data for equipment, which provides essential information to other engineering
disciplines to develop their respective designs, is a major issue on most projects. If
received on time, it has the potential to bring to every project significant savings in terms
of cost and schedule, particularly in the engineering phase. The reason why vendor data is
often delayed is because of the long chain of vendors and sub-vendors involved in the
procurement process in order to purchase equipment. In addition, the inability of the
prime vendor to manage and track their sub-vendors for meeting the purchase order
requirements for vendor data and scheduling compounds the problem. Moreover, the
contract to supply the equipment is typically between the owner/EPC and the vendor;
there is an absence of a contractual relationship between the owner/EPC and the sub-
vendors. This combination of factors makes it difficult to track the equipment’s
fabrication progress, and thus, the ability to contact the sub-vendors to expedite the
delivery of the equipment in the event of a delay.
A fundamental aspect to receiving vendor data on time is to have a firm scope and
minimal design changes. This reduces the number of revisions to the drawings, which
would otherwise be required. Assuming that the scope is firm, financial incentives for
12
early submittal of vendor data should then be provided in order to motivate the vendors
and sub-vendors. These incentives can include paying the vendor a higher percentage of
the purchase costs up front in the equipment manufacturing/fabrication cycle. In
exchange, the vendor promises to provide the current reviewed data/drawings in an
acceptable status according to the agreed schedule.
1.7 The Proposed Model - SAGD Execution Triangle (SAGD-ET)
The SAGD Execution Triangle (SAGD-ET), which was developed from this research,
provides an effective model for executing SAGD and other oil & gas projects. The
SAGD-ET model focuses on three major components, namely, engineering, project
management processes, and communication. Each of these components has a list of sub-
components that need to be focussed on in order to achieve successful project execution.
SAGD-ET is based on the premise that all projects are subject to and can be impacted by
the theory of forces. The forces can be external and or internal. The external forces
include political, economic, social, and technological aspects, while the internal forces
include competing projects, project organizational structure and decision making, project
ownership, and financial. These forces create tremors on the project, which result in
constant changes to the project’s execution strategy in order to minimize and mitigate the
impact of these forces.
This is the reason why the triple constraints of cost, schedule, and quality can be less
effective during project execution. Similar to the dashboard of a vehicle, they provide the
13
project metrics but do not offer guidance during conditions of turbulence, which happens
quite frequently during project execution.
The SAGD-ET model on the other hand, is based on the overall execution and focuses on
the project deliverables. In the SAGD-ET model, the engineering block focuses on the
front-end planning, including complete scope definition and vendor data management.
The project management processes (PM Processes) block involves managing the
processes that help in moving the project forward such as project management, change
management, regulatory approvals, etc. The communications block includes
communication between the wide range of project stakeholders, such as owners,
engineers, contractors, etc, among whom communication should take place. It also
includes the objects of communication such as drawings, schedules, procedures and the
like that are common on SAGD projects and which should be communicated to the
stakeholders. This effective SAGD-ET model can also be applied to other oil & gas
projects and industries with similar execution processes.
1.8 Conclusions and Recommendations
This research concludes that the oil sands reservoir conditions can have a major impact
on the design of the surface facilities. Moreover, the SAGD technology is evolving.
Therefore, spending more time planning at the front-end of the project can significantly
improve and benefit the project’s execution. While the study did not uncover any
engineering related areas that create an impediment to effective execution of SAGD
projects, it is often the non-engineering aspects that cause an impact. These include areas
14
such as communications, knowledge and experience of project management, timely
receipt of vendor data, regulatory/environmental legislation, quality, modularization, and
procurement, among others.
To effectively manage and execute SAGD projects, the researcher recommends that a
long term view of the project’s development should be considered. This will enable
replication, which involves breaking and executing a large project into smaller phases or
series of projects, to be incorporated as an execution strategy. For example, instead of
constructing a single 160,000 b/d SAGD plant, building it in four phases or stages of
40,000 b/d each should be considered. Sufficient time should be spent designing the base
plant and attaining a solid design, which will allow subsequent phases to be built with
fewer design changes. However, replication has some limitations. Due to the changing
soil conditions and elevations across the plot plan and changes to technology over time,
minor modifications to the base plant design may be required. For these reasons and
others, replication cannot be implemented on the project’s entire scope. However, the
benefits of replication have the potential to significantly improve project execution from
an efficiency and cost perspective.
1.9 Contributions of the Research
Contributions of this research project to the oil & gas project management body of
knowledge include the development of the SAGD-ET model, the theory of forces
impacting project execution, identification and ranking of factors for successful execution
of projects, development of communication attributes of EPC projects, and the theory of
15
churn impacting project decision making. Theories were also developed on timely receipt
vendor data, lessons learned, and increasing trust in an organizational setting. This
research also consolidated some of the literature on project management of oil & gas
projects; provided commentary to project procedures of oil & gas project execution.
Overall, the major contribution of this research has been to present pioneering knowledge
on how to effectively manage SAGD projects.
1.10 Limitations of the Research
The research was limited to the SAGD projects undertaken in Northern Alberta. In
addition, by having all SAGD projects undertaken in Alberta included in the survey could
have potentially added to the list of lessons learned; however, this was not possible due to
the large number of players involved from both owner and EPC organizations. Moreover,
by including a larger number of players in the study can make it difficult to manage the
equilibrium of participants between the owners and contractors and between the various
engineering disciplines, hence, potentially compromising the consistency of the results.
Another limitation was the fact that since SAGD projects can take up to five or more
years to complete from the planning phase to mechanical completion, testing of the
SAGD-ET model was not possible during the period of the study.
1.11 Areas for Further Research
Areas for further research which can enhance the project management body of knowledge
and literature include: the study of lump-sum turnkey contracts in Alberta’s oil & gas
industry, enhancing communications on oil & gas projects, decision making on oil & gas
16
projects, development of an effective model for timely receipt of acceptable vendor data,
replication of oil & gas facilities and analysis of modularization versus stick-built
construction on Alberta projects.
1.12 Thesis Organization and Chapter Summaries
1.12.1 Chapter One: Introduction
Chapter One provides a summary of the entire thesis. It begins by situating the topic of
research within the broader perspective of the oil & gas industry and why the oil sands
are important and the rationale behind SAGD’s importance as a leading technology. This
perspective provides the basis for the research problem. This is followed by the
motivation and objectives of the research, the methodology employed, and the results of
Rounds 1 and 2 of the Delphi Survey. Chapter One also provides a brief analysis and
discussion of the results and ends with the conclusions and recommendations. For easy
reference, an organization chart of the key areas discussed in the thesis is illustrated at the
end of the chapter.
1.12.2 Chapter Two: Literature Review
Chapter Two presents a review of the literature that is currently available on the research
topic and the justification for its selection. An analysis of cost overruns of historical
infrastructure projects and, more recently, of the mining and oil & gas industries is
provided so as to put into perspective why effective project management is central for
SAGD projects. The literature review provides a detailed discussion on five major areas
including project management, engineering, procurement, construction, and SAGD. The

17
discussion of the literature then focuses on industries such as oil & gas, off-shore,
pipelines, and mining, which possess similarities to the execution of SAGD projects. The
chapter concludes with an identification of the various gaps existing in the current
literature of oil & gas project management, thus providing justification for research on
SAGD projects.
1.12.3 Chapter Three: Research Methods
An understanding of the various research methods available to the researcher is very
important. It is this understanding that influences the researcher to select and use the most
suitable methodology in order to elicit the best information from the group being
researched. In Chapter Three, the two major branches of research, quantitative and
qualitative, are compared. By the very nature of this research, which involves processes
and people, greater emphasis is placed on the qualitative research methods of narrative,
phenomenology, grounded theory, ethnography, and case study. Due to the commonality
of the research elements involved in this SAGD research, the case study was deemed to
be the most appropriate method.
1.12.4 Chapter Four: Selected Research Methodology: The Delphi Method
Within the case study method, the Delphi Method, which uses an iterative process to
establish results, was selected as a fitting survey methodology for this study. This is
because of its inherent ability to inquire into areas where there is very little existing
information available. Moreover, the Delphi Method allows the researcher to solicit
information from individuals in an environment that is open, unconstrained, and non-
18
threatening. Chapter Four also provides a historical perspective of the Delphi Method,
which was originally used by Dalkey in 1963 on a consultative project for the United
States Air Force. A step by step process of the mechanics of this method of survey is
provided in detail, which can be very useful to other researchers considering using it.
1.12.5 Chapter Five: Application of the Research Methodology
Chapter Five highlights how the Delphi Method was used to undertake this research
study. This includes the high level activities such as setting the objectives for the study,
planning, identifying the scope of the study, and researcher involvement. The details of
how the study was done are described with sections on the survey procedures, sample
selection, sample size, data collection process, and preparation of the survey instruments
for both Rounds 1 and 2. The chapter concludes by describing the data collection process,
its codification and management, and the rigor infused in the entire surveying process,
which helps to enhance the study’s credibility.
1.12.6 Chapter Six: Results of Delphi Survey - Rounds 1 and 2
The survey results of Rounds 1 and 2 are illustrated in Chapter Six using various pie-
charts. This includes pie-charts of the survey participants’ demographics, such as area of
specialization, engineering participants’ discipline, EPC industry experience, age,
education, and organization. The purpose for illustrating the demographics is to
demonstrate the quality of the data collected. This is followed by a table listing the
emerging themes from the survey interviews in Round 1 and its codification. The
highlight of this chapter is the table showing the ranking of the overall survey ratings of

19
the top thirty lessons learned. The rankings of the Project Management and Engineering
groups are then split out identifying the major differences in their ratings in terms of low,
medium, and high alignment between these two major groups of participants. The
purpose of this exercise was to demonstrate the alignment of both of the major groups in
the top thirty lessons learned. The lessons learned were then grouped by codified areas in
order to analyze and discuss them in greater detail.
1.12.7 Chapter Seven: Discussion and Analysis
Chapter Seven discusses the lessons learned grouped by area and provides a short
commentary on each of them. The reasons why certain areas were more highly rated than
others are explained with use of effective sketches where possible in order to make them
easier to understand. Some of the sketches include overlapping engineering phases, the
impact of oil prices on execution strategy, traditional versus current project execution
durations, and the impact of reservoir information on the design of surface facilities,
including the persistent issue of late vendor data among others. The chapter ends with a
discussion on the root of the communications conundrum and the reasons why it is
difficult to achieve it on oil & gas projects in an effective and consistent manner.
1.12.8 Chapter Eight: The Proposed Model – SAGD Execution Triangle (SAGD-ET)
In this chapter, the theory of forces originating from this research is discussed. It suggests
that there are external and internal forces impacting organizations, which have a way of
subsequently impacting the projects being implemented. These forces create tremors on
the project due to frequently changing execution strategies. On the basis of the study’s

20
findings and analyses of the research data, the resulting SAGD-ET model that developed
is highlighted and described. The SAGD-ET model is further explained together with the
recommended solutions to issues encountered during project execution. Some of them
include obtaining well defined reservoir data, having a proper scope definition including
front-end planning, obtaining timely vendor data, as well as having knowledge and
experience of project management processes. Finally, the attributes of communications
on projects are discussed, including the theory on how to enhance trust, which is essential
in order to improve communications.
1.12.9 Chapter Nine: Conclusions and Recommendations
Conclusions and recommendations originating from this research are presented in
Chapter Nine. Some of these include: 1) the oil sands reservoir conditions impact the
surface design conditions; 2) there is a great need to spend more time in the front-end
planning; and finally, 3) SAGD is an evolving technology, but its fundamental extraction
processes and the surface facilities will likely remain the same in the future.
Recommendations from the research include a strong case for replication in building the
surface facilities, given that it has significant advantages and can benefit oil sands
developers who can take a long term view of their projects.
1.12.10 Summary
In this chapter, a comprehensive summary of the entire thesis is presented. It begins by
situating the Alberta oil sands within the larger oil & gas industry and highlighting the
economic and geo-political forces which will result in an increased demand for Canadian

21
oil. The outcome of this increased demand for oil, particularly from the oil sands, will
mean an increased number of SAGD projects, which therefore, provides a justification
for this research and its significance. The chapter discusses the research methods and
methodologies, and briefly mentioning the research results and providing a summary of
the discussion and analysis. In addition, the recommendations, conclusions, and
limitations are also summarized; areas of contribution of this research to the project
management body of knowledge are highlighted with recommendations for future areas
of research. The chapter then concludes with a summary of all the chapters within this
thesis and its organization chart. The next chapter deals with a review of the available
literature and the gaps identified on the topic of this research.
Figure 1.1. Thesis Organization Chart
Chapter One
IntroductionChapter Two
Literature ReviewChapter Three
Research Methods
Chapter Four
Results of Delphi Surveys
Chapter Five
Application of Research Method
Chapter Six
Selected Research Methodology
Chapter Seven
Analysis and Discussion
Chapter Eight
The Proposed SAGD-ET Model
Chapter Nine
Conclusions and Recommendations
22
Chapter 2: Literature Review
Chapter Overview
This chapter reviews the existing literature on project management of oil & gas projects
and SAGD in particular. The literature is reviewed first from a high level by examining
the broader and critical areas of project management, engineering, procurement,
construction, and SAGD. These areas are then examined further with a detailed review of
project management of large projects in industries such as on-shore and off-shore oil &
gas, pipelines, and mining. The available literature on SAGD is also examined. Based on
this review, the gaps in the current literature on project management of oil & gas projects
are identified. The gaps subsequently provide the justification, approach, and perspective
to undertake the research. The chapter concludes with a short discussion on the lessons
learned, since they will be the basis for collecting primary data from industry
professionals during the surveys using the Delphi Method.
2.1 Introduction
The oil & gas industry is the life blood of Alberta. Activities ranging from the discovery
of oil in Leduc, Alberta in 1947 to the recent technological innovations in extracting oil
from oil sands have spawned a wide variety of industries, from heavy manufacturing to
information technology. This development has given the Albertans confidence in their
abilities; confidence which has largely arisen from three sources – risk capital from the
private sector, government support for scientific innovation, and well established
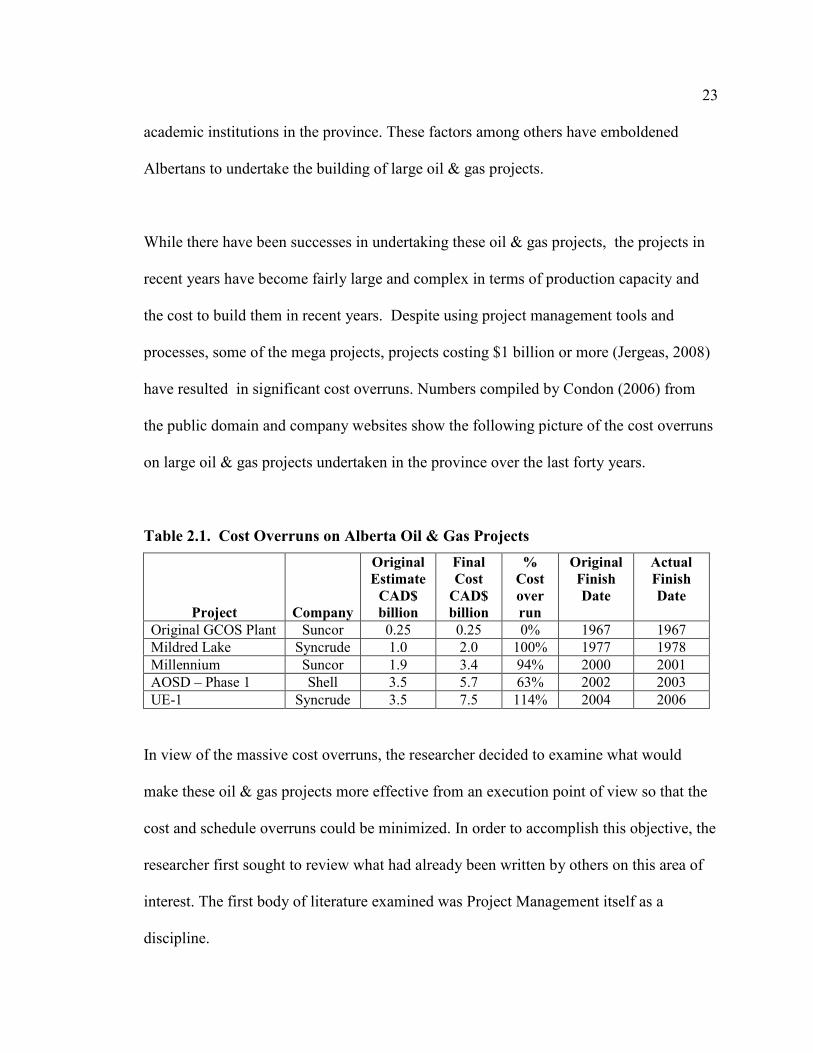
23
academic institutions in the province. These factors among others have emboldened
Albertans to undertake the building of large oil & gas projects.
While there have been successes in undertaking these oil & gas projects, the projects in
recent years have become fairly large and complex in terms of production capacity and
the cost to build them in recent years. Despite using project management tools and
processes, some of the mega projects, projects costing $1 billion or more (Jergeas, 2008)
have resulted in significant cost overruns. Numbers compiled by Condon (2006) from
the public domain and company websites show the following picture of the cost overruns
on large oil & gas projects undertaken in the province over the last forty years.
Table 2.1. Cost Overruns on Alberta Oil & Gas Projects
Project Company
Original
Estimate
CAD$
billion
Final
Cost
CAD$
billion
%
Cost
over
run
Original
Finish
Date
Actual
Finish
Date
Original GCOS Plant Suncor 0.25 0.25 0% 1967 1967
Mildred Lake Syncrude 1.0 2.0 100% 1977 1978
Millennium Suncor 1.9 3.4 94% 2000 2001
AOSD – Phase 1 Shell 3.5 5.7 63% 2002 2003
UE-1 Syncrude 3.5 7.5 114% 2004 2006
In view of the massive cost overruns, the researcher decided to examine what would
make these oil & gas projects more effective from an execution point of view so that the
cost and schedule overruns could be minimized. In order to accomplish this objective, the
researcher first sought to review what had already been written by others on this area of
interest. The first body of literature examined was Project Management itself as a
discipline.

24
2.2 Project Management
Modern Project Management is a fairly young discipline and has developed from various
areas such as construction, engineering, and defence (Cleland & Gareis, 2006). Most
writers trace the history of Project Management back to 1950s when Henry Gantt
developed planning and control techniques such as the Gantt chart, which was
subsequently named after him. In recent years, there has been a proliferation of
knowledge and application of project management techniques in various industries such
as aeronautics, information technology, infrastructure, oil & gas, and so on. In examining
the literature on project management, the researcher found a great deal of information of
a general nature that is based on fundamental principles. Institutions, such as the Project
Management Institute (PMI), Construction Industry Institute (CII), Association for the
Advancement of Cost Engineering International (AACEI) and other organizations, have
produced significant number of books and manuals on various areas of project
management to supplement this literature.
Among the many books written on project management, a recent and comprehensive one
by Hartman (2000) entitled Don’t park your brain outside: A practical guide to
improving shareholder value with SMART management discusses in a commonsensical
way the principles and theories of project management, early identification of things that
can go wrong on projects, and how to mitigate them. This information is presented in a
writing style that is easy to understand and absorb. In this book, Hartman goes beyond
the current project management thinking and practices and introduces a framework of
SMART management, which improves on the current project management methods of

25
delivering projects with greater focus on efficiency (2000). SMART, which is an
acronym for Strategically Managed, Aligned, Regenerative work environment,
Transitional management, describes how to more effectively use tools and processes such
as project charter, RASCI chart, 3D-Schedules, Deliverables Breakdown Structure
(DBS), Monte Carlo simulation, Sensitivity Analysis, and Tornado Diagrams. Hartman
points out in his book that one needs to keep an eye on all the balls in a project and that
not all the project management tools need to be used at the same time; they should be
applied depending on the situation of the project, and when these tools are used in
combination with SMART management, they can yield powerful insights that can be
applied to mitigate the problems (2000).
How problems are mitigated depends to a large extent on management and leadership.
These two concepts are often intertwined in organizational and project settings. Within
this context, people often ask, what makes a good leader, and which qualities should
project managers possess in order to effectively lead projects? Krahn (2005), in her
empirical investigation on Project Leadership, sought to determine in her study the
significant skills and competencies required for a project manager, the order of their
importance, and which of them can be used on specific projects and contexts. The results
of Krahn’s significant investigation suggest that there is a long and diverse list of
leadership skills required of a project manager, with people-oriented skills having the
highest importance. In addition, there is an interrelationship between project
characteristics and a project manager’s skills and competencies. Importantly, based on
her study, she identifies that there is a misalignment between project managers and
26
project sponsors’ notions of the skills and competencies that are of greater importance
(Krahn, 2005).
In other literature on project management, Morris (1998) examines the project
management principles of executing and completing projects. He argues that
theoretically, one can be on time, budget, and meeting quality but build something that
does not work as well as it was expected to. Among the solutions, he suggests that
projects should be looked at from a business perspective and focus more on the cost
savings generated from the project’s execution strategy and its implementation. This can
be done by looking at the project holistically with emphasis on the front-end planning of
the project, while also identifying procurement requirements. Emphasis on people and
information technology can add to the efficiencies in executing projects.
Skumolski, Hartman and DeMaere (2000) propose that most of the research to date on
project management has focussed extensively on tools and processes and not enough on
the ‘soft’ skills or competencies of people and managers working on projects. They
explore what these skills should include and surmise that both workers and project
managers need some meta-competencies; these include open communication, trust,
problem analysis, judgement, and being results oriented. For superior performance, both
workers and managers need to be creative, proactive, and achievement driven. They
suggest that identification of business know-how and problem analyses are important
skills for workers, while decisiveness and delegation are important skills for project
managers.

27
In identifying out of the box solutions for effective project management, in one of his
more recent papers, Hartman (2008) discusses a pilot course that he developed on
Dynamic Management. The course was the end-result of a discussion with an executive
who laments that present-day project management is driven by numbers, which tends to
exclude intuition or gut feel from the equation. In this interesting article, Hartman states
that as a society, we pay less attention to that intuitive feel because of the need to have a
paper trail or ‘auditability’ of our decisions, especially in the corporate world. Ironically,
when he did an informal study of retired executives on how they made the most
important decisions while they were at the helm in the corporate world, the majority of
them said they used their gut feel. Yet, when the same question was posed to executives
who currently held similar positions in corporations, their responses were they would
“check with the Vice-President” or “ let the Board of Directors decide” and so on, not
mentioning the use of intuition at all! Hartman concludes that we keep on relearning the
lessons learned, and more research needs to be done to prepare the mind for effective
project management.
While stakeholders are important entities on a project and their requirements need to be
managed, Karlsen (2002) argues in her research article that there is no formal process to
do so. Karlsen’s study shows that stakeholders have their issues and can be a “wild card”
in the project’s execution if they are not well managed; in addition, the project’s
management team seldom have plans on how to meet the stakeholders’ needs and issues
and is often done by the project manager (2002). Karlsen states that stakeholders and
their potential issues need to be identified and recommends a six step management
28
process of planning, identifying, analyzing, communicating, acting, and following-up in
order to identify their needs and wants.
2.3 Large Projects
2.3.1 Oil & Gas
In order to build major oil & gas facilities, be it on-shore, off-shore, or pipelines, the
primary activities required are engineering, procurement, construction, and finally,
commissioning & turnover. Project management is required to oversee the execution of
these major activities and the detailed deliverables to ensure that the facility is delivered
on time, within budget, and meets the defined quality requirements. Examples of on-
shore oil & gas projects include refineries, sulphur extraction plants, hydrogen
manufacturing plants, and more recently, steam assisted gravity drainage (SAGD) plants
to extract bitumen from the oil sands. The size and scale of some of the oil & gas projects
can be costly due to the significant human effort and coordination required to get the first
barrel of oil out of the reservoir.
To identify how effective this process has been, Jergeas (2008) analyzes Alberta’s oil
sands projects using data from three mega projects with a combined total installed cost
(TIC) of $10 billion. His research, which focuses on the front-end loading activities of
projects, identifies various causes of problems in execution. Some of these include overly
optimistic original cost and schedule estimates, incomplete scope definition,
inappropriate execution strategies, late vendor data, poor project controls, lack of
leadership, mismanagement during the construction phase, and poor communication,

29
among other issues. Jergeas concludes that the warning signs of deteriorating conditions
impacting cost and schedule are not brought to management’s attention early enough so
that mitigation strategies can be planned to counter them. Jergeas’ recommended actions
to improve the front-end loading of a project include reporting and monitoring of the
issuing of Process Flow Diagrams (PFD) and Piping & Instrument Diagrams (P&ID)
including award of the Purchase Orders (PO). The timeliness in issuing these project
documents indicate how smoothly the front-end design is proceeding and whether there
are any issues that need to be rectified.
Cost overruns on mega projects are not only prevalent in North America, but also, in
other western European countries. Flyvbjerg et. al (2003) candidly present in their eye
opening book entitled Megaprojects and Risk analyses of cost overruns on large projects
in the European transportation industry such as the Channel Tunnel linking Britain and
France, the Great Belt Link, and Oresund projects in Denmark. The authors suggest that
during the feasibility stage, many of these projects show to the citizens or shareholders
overly ambitious forecasts of passenger use and revenues while at the same time
providing lower cost forecasts to build these projects (2003). In reality, upon
commissioning these projects, the opposite happens where the numbers of riders or
passengers are significantly lower and the project costs are significantly higher
consequently resulting in huge cost overruns.
Major reasons provided for these overruns are “risk-negligence and lack of accountability
induced by project promoters whose main ambition is to build projects for private gain,

30
economic or political, not to operate projects for public benefit” (Flyvbjerg, et al., 2003,
p. 142). Interesting examples of cost overruns of some of the most spectacular projects
are provided in this book, which are listed in Table 2.2. (Flyvbjerg, et al., 2003); these
examples bring to light the fact that cost overruns are not a new phenomenon and that
history shows us many examples of lessons that have not been learnt!
Table 2.2. Cost Overruns on Historical Projects
Project Year
Completed
Country Cost
Overrun
Suez Canal 1869 Egypt 1,900%
Sydney Opera House 1973 Australia 1,400%
Concorde Supersonic Airplane 1969 UK/France 1,100%
Panama Canal 1914 Panama 200%
Brooklyn Bridge 1883 USA 100%
Almost 50% of a project’s costs are incurred during the construction phase and is an area
where significant potential cost savings can be achieved. To identify these potential areas,
a major report titled Improving construction productivity on Alberta oil and gas capital
projects was prepared by Jergeas (2009). He surveyed experienced people from the EPC
as well as owner companies to identify issues relating to poor productivity. In this survey,
Jergeas received 309 recommendations from the industry for improving construction
productivity! The top five areas being labour management conditions and relations;
project front-end planning (loading) and work face planning; management of construction
and support; engineering management; and effective supervision and leadership. These
issues and their recommendations are currently being worked on in collaboration with
industry and academia.

31
Aside from Canada, the Middle East is another part of the world where a large number of
oil & gas projects are undertaken. Based on five mega projects executed in Saudi Arabia
using international EPC contractors and local subcontractors Palmer and Mukherjee
(2006) discuss the improvement in execution of these projects of up to 50% in terms of
schedule and up to 90% in terms of budget. Continuous improvement was one of the
factors cited contributing to this dramatic progress. Specific strategies included the use of
lessons learned, value engineering, and using a standard contract schedule for quality.
Having an integrated team, sharing common goals among owners and contractors, team
continuity, and effective contracting strategies were among the other strategies leading to
the dramatic improvement in their project’s execution.
Another area to improve project execution is the stage-gate approval process, where
approval to proceed to successive stages of the project is provided only if the
requirements of the next stage have been clearly identified and fulfilled. Based on
experience of having worked on over 70 projects, Walkup and Ligon (2006) argue that
the stage-gate process, which is heavily used by most of the oil & gas companies, has not
delivered the benefits that it should in terms of success in project execution, and it
continues to result in technical and economic failure. Major reasons for this failure
include lack of stakeholder engagement, value discipline, and leadership. Based on their
observations, lack of leadership is resulting in situations where no one is in charge and
where there is confusion as to who should lead the stage gate effort. This is resulting in
poor quality decisions, which negatively impact the project in a number of different
ways. Walkup and Ligon admit that due to the technical nature of the work involved,

32
there is a fair amount of uncertainty in projects to make good decisions, but they
underscore the point, saying that uncertainty is and will always be present in projects;
however, the objective should be to make decisions that are sound, well thought out, and
effective (Walkup & Ligon, 2006).
2.3.2 Offshore
Almost one-third of the world’s oil comes from off-shore production (Sandrea, 2009).
Although this is an area with great potential for growth, there are numerous challenges
associated with getting oil production in a safe and effective manner. President Barack
Obama recently allowed the drilling of oil and natural gas on the vast eastern coastline of
the United States (Broder, 2010) involving off-shore production and then immediately
imposed a moratorium due to the recent oil spill in the Gulf of Mexico. Such are the
difficulties involved in off-shore drilling and oil production.
In this area of off-shore oil production, Rapp (2007) of US based Mustang Engineering
discusses the various elements of engineering to develop an offshore field platform. He
suggests a structure for the conceptual design phase, which shares similar characteristics
to engineering an oil sands production facility such as SAGD. Both off-shore drilling and
the oil sands have unpredictable oil reservoirs requiring long pipes, almost a thousand to
sixteen hundred meters in length, with strict regulatory requirements and with oil
extraction technologies that are still evolving.

33
With his extensive experience in deepwater engineering, in another article, Rapp (2006)
suggests a number of things to streamline deepwater projects. For example, he suggests
fast- tracking, which shortens the schedule, resulting in lower costs by bringing
production earlier and as a result improving cash-flow. While Rapp is cognizant of the
flip-side to fast tracking such as having to modify company procedures and fewer
opportunities to change the course once fast-tracking is implemented, he contends that
the improvement in the net present value (NPV) is significant enough to offset the risks.
In order to be successful in fast-track projects, Rapp suggests standardizing the
engineering design so that it can be replicated on other projects with fewer changes to the
engineering and design.
Value engineering, while not fully appreciated in the oil & gas industry, can be an
important strategy for effective project management. Value engineering is defined as
achieving design excellence using an optimum blend of all project requirements such as
teamwork, functional analysis, creativity, and cost-benefit analysis. Reymert (2002),
discusses value engineering used on deep water gas to power projects under tight design
and execution schedules. Value engineering was used on a project which had significant
overlap between detailed engineering, procurement, and construction. Construction was
started when engineering was only 20% complete! In order to mitigate the risks, various
strategies were employed, including close communication between the design office and
construction site, a hands-on approach to scheduling and by including the commissioning
sequence, close follow-up of procurement which will include penalties, and incentives

34
included in the purchase orders to meet the target dates for receiving the equipment and
material on time.
Procurement, which represents approximately 35% of an oil & gas project’s cost, is
another area where significant costs savings can be achieved. To this end, Barlow (2000)
examines the procurement side of an off-shore oil project whose objective was to reduce
costs. By using alliances and partnering among client and contractors, the £373 million
project was able to save the owners £83 million, of which £45 million was shared among
the project’s seven partners. The cost savings were achieved by bringing the key
companies into the Alliance at the beginning of the project, rather than later, establishing
clear cost targets for the project, non-adversarial relations with suppliers, and a profit
sharing mechanism.
2.3.3 Pipelines
Pipelines are an integral part of the oil & gas industry. Unlike constructing a refinery or a
SAGD plant, building pipelines is a relatively simple process because the engineering
and construction of pipelines are fairly repetitive; therefore, design standardization is
easily achievable. Dixon, Pound & Korgan (1987) talk about the design and
standardization of pipelines using Geographical Information Systems (GIS) software,
which incorporates project controls data relating to the construction progress. From a
technical perspective, due to the different types of solids and liquids that pass through the
pipelines, they are subject to significant corrosion and present a high risk in the pipeline
construction and operations. Risk analysis during these phases of the project is therefore
35
essential, and the pipeline industry has developed sophisticated models of risk analysis.
Dey (1997) recommends doing risk analysis at the work breakdown structure (WBS)
level, which helps to identify with much precision which work packages are a high risk,
and thereby, planning mitigation strategies to that WBS level. Risk analysis on the
estimate can be done by looking at “the percentage of risk on a work package which
corresponds to probability of cost overrun when combined with even-chance success of
the project” (Dey, Tabucanon, & Ogunlana, 1996, p. 233).
The construction of the 3,000 kilometre Alliance Pipeline from Fort St John, British
Columbia to Chicago, Illinois, highlighted by Rickards (2000), is quite inspiring,
considering the many lessons it has for the oil & gas industry. The $5 billion project was
executed with an owner’s team comprising of only 250 people. This was accomplished
by hiring only highly skilled people for the key roles who were given the responsibility
and authority to make the necessary decisions to get the job done without the several
layers of approvals, which is often prevalent on projects of this size.
2.3.4 Mining
The problems of cost overrun illustrated at the beginning of the chapter, are not unique to
the oil & gas sector; they are also common in the mining industry. Noort & Adams
(2006) lament over the cost overruns running anywhere from 15% to 100% in Australia’s
recent major mining projects. In Table 2.3. from their study (Noort & Adams, 2006)
identify the severity of the problem of recent mining projects executed in and around
Australia.

36
Table 2.3. Cost Overruns on Mining Projects
Project Company
Feasibility
Estimate
$ billion
% Cost
overrun
Ravensthorpe/Yabilu Expansion BHP Billiton AU1.4 30%
Spence (Chile) BHP Billiton US1.0 10%
Telfer Mine Newcrest AU1.2 18%
Stanwell Magnesium AMC AU1.3 30%
Boddington Newmont AU0.9 100%
Goro (Indonesia) Inco US1.5 15%
Priminent Hill Oxiana AU0.4 51%
While no new strategies are suggested, the authors recommend that standardized project
management processes would help manage the associated risks. The mining industry, like
the oil sands, faces unpredictability of geological data to determine mineral resource
reserves, which causes changes to the operating scenarios, resulting in rework and delays.
As mentioned earlier, value engineering, in which team work is an essential component,
is also suggested by Luxford (2006) in his review of effective project management
practices in a mining operation. He suggests that teams that have worked with a certain
project manager generally follow the manager from one project to the next. Luxford
suggests that while these teams may not be the best teams, the fact that they have worked
together for a long period of time enables them to overcome obstacles and to effectively
execute projects with successful outcomes (2006). Therefore, this element of team
continuity can be a major factor contributing to the project’s success.
Another area to achieve effective project execution is to maintain good relationships with
various project stakeholders, particularly vendors, who can provide significant benefits.
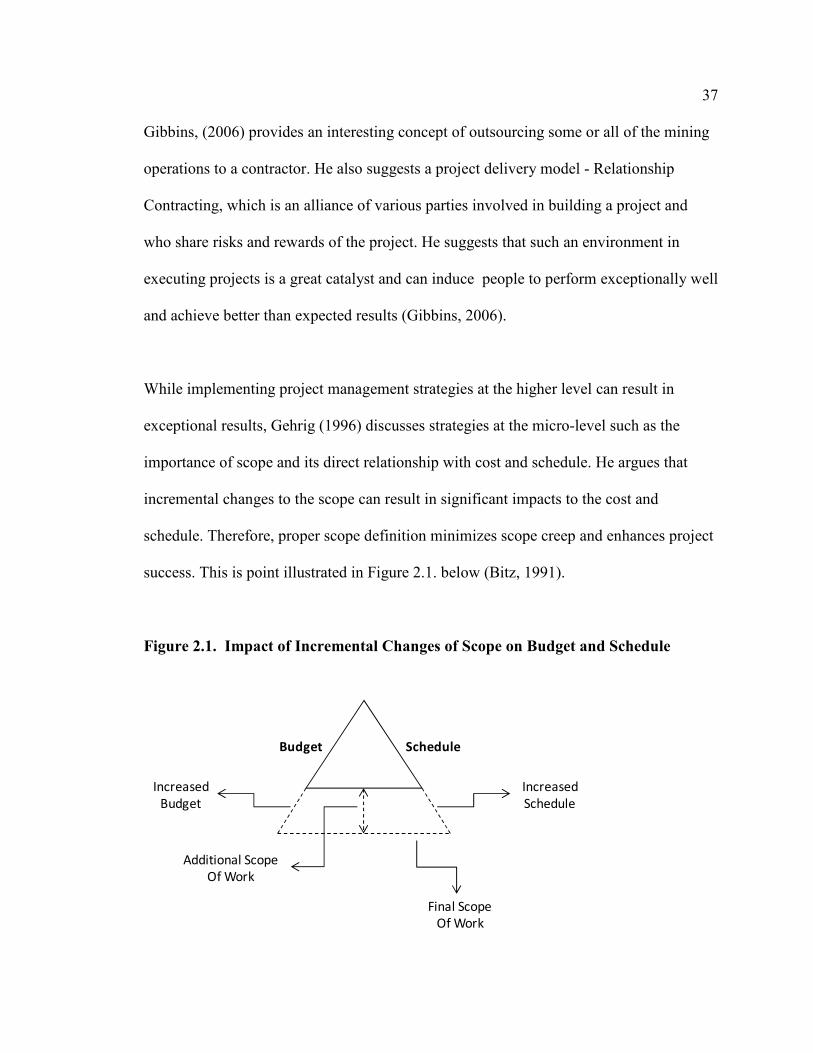
37
Gibbins, (2006) provides an interesting concept of outsourcing some or all of the mining
operations to a contractor. He also suggests a project delivery model - Relationship
Contracting, which is an alliance of various parties involved in building a project and
who share risks and rewards of the project. He suggests that such an environment in
executing projects is a great catalyst and can induce people to perform exceptionally well
and achieve better than expected results (Gibbins, 2006).
While implementing project management strategies at the higher level can result in
exceptional results, Gehrig (1996) discusses strategies at the micro-level such as the
importance of scope and its direct relationship with cost and schedule. He argues that
incremental changes to the scope can result in significant impacts to the cost and
schedule. Therefore, proper scope definition minimizes scope creep and enhances project
success. This is point illustrated in Figure 2.1. below (Bitz, 1991).
Figure 2.1. Impact of Incremental Changes of Scope on Budget and Schedule
ScheduleBudget
Increased
Schedule
Increased
Budget
Additional Scope
Of Work
Final Scope
Of Work
38
Having reviewed the project management area, oil & gas, off-shore, pipelines, and
mining industries, the next sections examine the major works of research and inquiry in
the engineering, procurement, and construction of projects including the SAGD.
2.4 Engineering
2.4.1 Execution
Engineering fundamentals have not changed over the years; however, the people doing
the engineering have changed. In their research, Yates & Battersby (2003) examine the
traditional concept of Master Builder. This is a concept where the designer of a facility is
knowledgeable about construction and has a sufficient amount of experience in this area.
In this situation, the major advantage is that as the engineering designs are produced, the
constructability issues are also looked after. However, in recent years, there has been a
significant fragmentation and specialization of engineering into its various disciplines,
commonly resulting in the designer’s inability to thoroughly consider all the construction
related issues. Based on the researcher’s discussions with some industry professionals,
this issue is also facing the Alberta EPC industry.
In addition, there is a tendency to divert from the traditional project delivery systems of
design/bid/build to having separate contracts for each of the EPC phases. These factors
have affected the industry in areas of both quality and cost. The authors suggest and
conclude from their survey that many design errors can be reduced if the engineers were
more experienced in the field and had more knowledge of construction. Their

39
recommendations include increasing the number of construction courses taught at
universities in the architecture and engineering programs (Yates & Battersby, 2003).
Although this research study revolves around mega projects, there can be some learnings
from smaller projects as well, which can be implemented to achieve effective execution
on larger ones. Kuprenas (2003) analyzed over 270 projects undertaken by the City of
Los Angeles’s Departments of Public Works; this study involved mostly infrastructure
projects costing less than $10 million. He found that by increasing the frequency of the
design team’s meetings, there was a statistical corresponding improvement in the design
phase’ costs; similarly, increasing the reporting frequency of the design phase to more
than once a month resulted in an improvement in the design cost performance index.
2.4.2 Fast Tracking
In a similar effort to reduce the design delivery time, and therefore reduce costs, Bogus,
Molenaar & Diekmann (2005) discuss concurrent engineering, or overlapping sequential
activities, as a method to achieve this. On a normal schedule, there are successor
activities which are dependent on the predecessor essentially waiting for information, this
results in time being wasted. By including an assumption for the information being
waited on, overlapping of activities can be allowed to happen albeit with the risk of
rework when the information is received. The authors suggest the overlapping of
activities can produce good results, particularly with an environment where information
is freely and quickly available and the projects can tolerate rework; otherwise this
40
strategy would not be as effective. For a solution, the authors recommend increased
communication and an exchange of preliminary information (Bogus, et al., 2005).
On the other hand, Reinschmidt and Trejo argue that fast tracking to achieve savings is
not as easy, because it has the potential to increase costs in other areas such as the
projects design, development, or execution, and therefore, the net effect may not be as
beneficial (2006). The authors contend that at project inception, due to the limited
information available, it is difficult to predict the cost reductions that could be generated.
However, they have formulated a set of equations using factors, such as project
development time, project service life, and rate of return, to arrive at the value add of fast
tracking a project (Reinschimdt & Trejo, 2006). The authors conclude that if a project is
profitable or risky, it is advantageous to complete it quickly in order to reap the project’s
economic benefits.
2.5 Procurement
Procurement is an essential element of all projects and can provide effective ways to
execute projects. As stated earlier, approximately 35% of oil & gas project’s costs are
spent on procuring equipment and materials and about half go towards construction, thus
making it a key area of focus for cost effectiveness. Effectiveness of procurement is
largely predicated on the contract strategies used with the respective vendors, suppliers,
and contractors. The most important area for consideration on contracts relates to risk and
ascertaining which party is best able to handle it. Most owners like to mitigate the risk by
transferring it to other parties, but in doing so, end up paying a high premium. Moreover,

41
as Hartman and Snelgrove suggest, inappropriate risk allocation is a major cause of
misunderstanding on projects leading to disputes and adversarial relationship (1996).
2.5.1 Contracting Strategies
One area relating to project execution where little information is available, and therefore,
is worthy of deeper research, is the contracting strategies used for constructing oil & gas
projects. Currently, the commonly used contracting strategies are lump-sum turnkey and
cost reimbursable contracts, the latter mostly used in Alberta’s oil & gas projects.
2.5.1.1 Cost Reimbursable
In a cost reimbursable contract, also referred to as time and material or cost plus
contracts, the contractor is paid for the profit, time, and materials used on the project (C.
M. Gordon, 1994). Time, from the researcher’s perspective, represents the labour costs
for the duration of the project. In practice, cost reimbursable contracts are defined as the
estimated value of work to be done including costs for changes made to the original
scope of the project. This contracting strategy, although undesirable for construction
work (Navarrete & Cole, 2001), is used when the work to be done is not well defined at
the start of the project (Buckingham, 1994). By contrast, in a lump-sum or fixed price
contract, the contractor is paid for the labour and materials for a fixed piece of work at a
specific cost (C. M. Gordon, 1994). This strategy is commonly used on projects where
the construction work can be divided into distinct parts (Navarrete & Cole, 2001).
42
2.5.1.2 Lump-Sum Contracting
Lump-sum contracting on oil & gas projects is predominantly used in the Middle East
and Asia and not as much in North America. However, with the recent recession (2007-
2009), the current trend in Alberta is shifting towards lump-sum contracts. Anecdotal
evidence suggests that oil & gas projects in the Middle East and elsewhere have been
successfully completed without significant cost overruns using lump sum contracting.
However, according to one expert, due to inequitable allocation of risk, relationships
between contractors and owners have sometimes been confrontational resulting in a
deadlock between the two parties causing delays to the project.
On the whole, very few comprehensive studies have been published on lump-sum
contracting in the oil & gas industry, especially from the North American or Alberta
perspective. Berends & Dhillon (2004), Johnson (1987), Camps (1996), and Singh (1997)
have provided quantitative project data in the form of single or multiple case studies on
some of the projects that they have worked on. The majority of the data on contracts
tends to be confidential, which often makes it difficult to conduct studies on and publish
results of some of these projects, especially when they belong to public companies listed
on the stock exchange.
Nevertheless, from the mechanics of how lump-sum projects work, Brkic & Romani
(2009) provide a comparison between the traditional contracting strategies of cost
reimbursable and lump-sum turnkey (LSTK) as illustrated in Table 2.4.
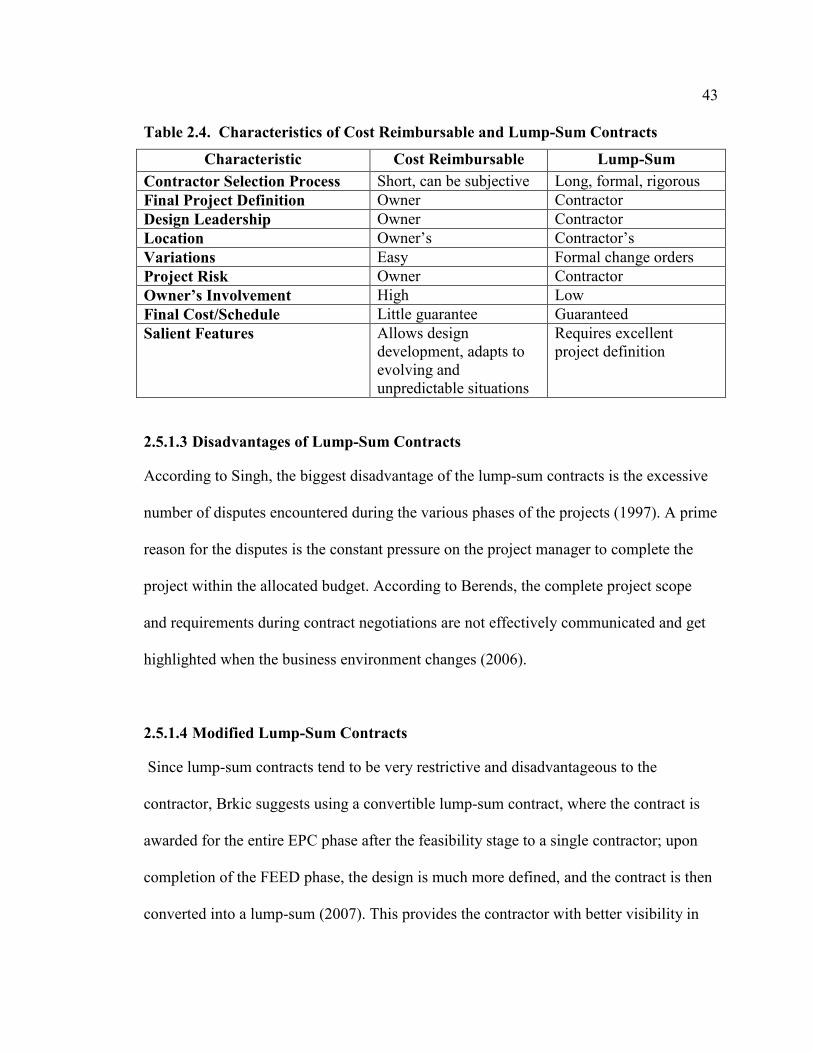
43
Table 2.4. Characteristics of Cost Reimbursable and Lump-Sum Contracts
Characteristic Cost Reimbursable Lump-Sum
Contractor Selection Process Short, can be subjective Long, formal, rigorous
Final Project Definition Owner Contractor
Design Leadership Owner Contractor
Location Owner’s Contractor’s
Variations Easy Formal change orders
Project Risk Owner Contractor
Owner’s Involvement High Low
Final Cost/Schedule Little guarantee Guaranteed
Salient Features Allows design development, adapts to evolving and unpredictable situations
Requires excellent project definition
2.5.1.3 Disadvantages of Lump-Sum Contracts
According to Singh, the biggest disadvantage of the lump-sum contracts is the excessive
number of disputes encountered during the various phases of the projects (1997). A prime
reason for the disputes is the constant pressure on the project manager to complete the
project within the allocated budget. According to Berends, the complete project scope
and requirements during contract negotiations are not effectively communicated and get
highlighted when the business environment changes (2006).
2.5.1.4 Modified Lump-Sum Contracts
Since lump-sum contracts tend to be very restrictive and disadvantageous to the
contractor, Brkic suggests using a convertible lump-sum contract, where the contract is
awarded for the entire EPC phase after the feasibility stage to a single contractor; upon
completion of the FEED phase, the design is much more defined, and the contract is then
converted into a lump-sum (2007). This provides the contractor with better visibility in

44
the design development process, which makes it easier to allay the fears of both parties to
future and latent disputes.
2.5.1.5 Risk Allocation & Disputes
Gordon insists that a major reason why owners prefer lump-sum contracts is related to the
transferability of risks; owners are generally risk averse, and the amount of risk they are
able to carry on a project directly determines the type of contract they entered into
(1994). Berends and Dhillon add that due to the nature of lump-sum contracts, cost
overruns are generally borne by the contractor, and, therefore, risk is passed on to the
contractor (2004). In other words, the contractor acts as a ‘quasi-insurer’ to the project
(Ward, Chapman, & Curtis, 1991). However, Camps argues that there is a common
misperception in the process industries, which includes the oil & gas industry, that lump-
sum contracts actually reduce the owner’s risk (1996). He says that by virtue of taking
additional risk on lump-sum contracts, contractors require and receive higher fees in their
contracts. In addition, higher profit margins are included in subtle ways which are not
apparent in the contract prices (Camps, 1996).
In view of the problems of proper allocation of risks and the potential for disputes,
Pedwell, Hartman and Jergeas maintain that it is important for the owner to consider the
type of contracting strategies to be employed during the early stages of a project. They
caution that “Failure to recognize the interaction between the contracting strategy and the
project’s risk and capital costs will place that venture at a competitive disadvantage”
(1998, p. 37). Their study, which focused on the effects of fast tracking on total project

45
costs, found that it is favourable to use a cost plus contract when fast tracking projects; it
produces the lowest overall costs when the project schedule is reduced by more than 8%,
and lump-sum contracts are better when the schedule is reduced by less than 8%
(Pedwell, et al., 1998). It should also be mentioned that with lump-sum, there is greater
temptation on the part of the contractors to circumvent procedures and focus more on
meeting the schedule, rather than on quality (Willoughby, 1995).
2.6 Construction
2.6.1 Constructability
Nearly half of an oil & gas project’s costs are related to construction, and yet
surprisingly, constructability, which can yield cost savings to the project, is not as rigidly
implemented as it should be. The reasons are numerous; according to a study done by
Jergeas and Van der Put (2001), there seems to be a clash of perceptions between the
designer’s need for constructability knowledge and the constructors’ confidence in their
ability to meaningfully contribute to the process. O’Connor (1995) suggests there are
barriers to fully participating in constructability, including lack of experience in the
design organization, the designer’s ownership of the design, and the delayed participation
of construction people in the process. With the current shortage of constructors, this
situation is made worse when constructors are required to be in a design organization for
a period of a year or two in order to significantly contribute to the constructability effort.
In addition, the lag in awarding the construction contracts until the end of the design
phase (Song, Mohamed, & AbouRizk, 2009) results in delays in getting the appropriate
46
people to participate in the exercise. A Construction Industry Institute (CII) paper
entitled Preview of Constructability Implementation cautions that as one goes further into
the design phase, there is a corresponding reduction in the ability to influence the
project’s costs (2004). This can be resolved by having the construction contractors
involved at the Feasibility and DBM phases, which is where major design decisions are
made (G. Jergeas & Van der Put, 2001). Pocock, Kuenen, Gambatese & Rauschkolb
(2006) concur and add that open communication between designers and contractors is
quite advantageous and that project owners can create such opportunities with
appropriate contracts and project delivery methods.
2.6.2 Modularization
The other important aspect relating to construction is modularization, which has gained
remarkable acceptance in the construction of large oil & gas projects in Alberta. Despite
having to transport the heavy and long modules by road to the construction site at a fairly
slow speed (Jameson, 2007), modularization significantly lowers the costs of production.
In addition, there are advantages of building the modules in a yard. For example, it
provides a controlled environment (Jameson, 2007) while shortening schedules, a
significantly decreased amount of site congestion and logistical issues, and improved
safety (Byrne, et al., 2008). Blankinship muses that in the electronics and computer
industries, the concept of “plug and play” is fairly common, and with the experience
gained, modularization could be the plug and play of the construction industry (2008)!
Although modularization has less room for error, it is also used in building large facilities
such as nuclear and other power plants, off shore oil & gas platforms, and ships, among
47
other things (Blankinship, 2008; Byrne, et al., 2008). Byrne et. al’s paper describes the
modularization in building the ACR-1000® (Advanced CANDU Reactor), suggesting
that modularization needs to be considered very early on during the planning phases of
the project (2008). The authors argue that in an effort to shorten the schedule, more
activities in parallel should be done, and modularization and pre-fabrication are ideal
strategies to achieve this objective (2008).
Blankinship reports that the Japanese are very experienced in this area; he suggests that a
cost/benefit analysis needs to be done on using modularization (2008). It seems as though
the Alberta construction industry is convinced of the benefits of modularization and has
fully embraced it, especially with the costs savings that can be achieved over methods
such as stick-building modules at the construction site. In Jameson’s analysis of a small
$70 million hydrotreater project, stick-built construction had higher labour costs and
lower productivities over modularization by almost 18%, which resulted in a US$12.5
million savings (2007).
In educating the industry on the merits of modularization, the CII has attempted to
provide a primer on this topic entitled Implementing the prefabrication, preassembly,
modularization, and offsite fabrication decision framework: Guide and tool (2002).
While this primer provides basic decision making tools, such as whether or not to use
offsite fabrication, more studies and analyses, as illustrated on Jameson’s project, are
required in this area of modularization, particularly in relation to large oil & gas projects
undertaken in Alberta.
48
2.7 Steam Assisted Gravity Drainage (SAGD)
2.7.1 Overview of the Oil Sands
Canada has a total of 178 billion barrels of oil reserves. These reserves consist of 5
billion barrels of conventional crude oil and 173 billion barrels from the oil sands, which
gives Canada the second largest oil reserves in the world after Saudi Arabia (CAPP,
2009b). In terms of production, Canada produces a total of 1.35 million b/d of oil from
conventional crude and 1.2 million b/d of oil per day from the oil sands (CAPP, 2009b;
Government of Alberta, 2010). According to the Canadian Association of Petroleum
Producers (CAPP), by the year 2020, oil production from the oil sands is going to be
significantly larger than conventional crude oil, which is currently declining; forecasts
indicate that by the year 2018, production from the oil sands will rise to 3 million b/d
(Government of Alberta, 2010).
Another recent forecast suggests Canada’s oil sands production by the year 2030 will
reach as high as 5.7 million b/d representing 36% of America’s oil imports (Krauss &
Rosenthal, 2010; McCarthy, 2010). Daniel Yergin, an oil historian and Chairman of IHS
CERA, a reputed oil & gas consulting firm, is quoted in the New York Times saying that
“The uncertainty and the slowdown in drilling permits in the gulf (of Mexico) really
underscores the growing importance of Canadian oil sands, which over the last decade
have gone from being a fringe energy source to being one of strategic importance.
Looking ahead, its importance is only going to get bigger (Krauss & Rosenthal, 2010)
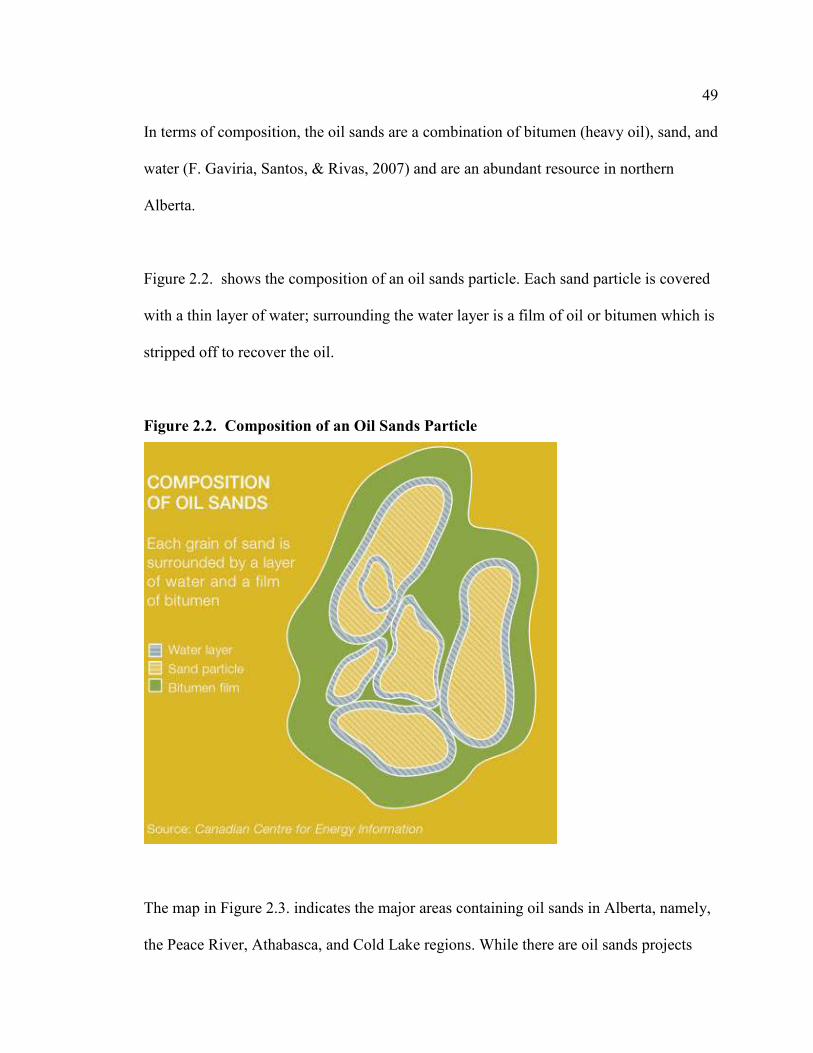
49
In terms of composition, the oil sands are a combination of bitumen (heavy oil), sand, and
water (F. Gaviria, Santos, & Rivas, 2007) and are an abundant resource in northern
Alberta.
Figure 2.2. shows the composition of an oil sands particle. Each sand particle is covered
with a thin layer of water; surrounding the water layer is a film of oil or bitumen which is
stripped off to recover the oil.
Figure 2.2. Composition of an Oil Sands Particle
The map in Figure 2.3. indicates the major areas containing oil sands in Alberta, namely,
the Peace River, Athabasca, and Cold Lake regions. While there are oil sands projects
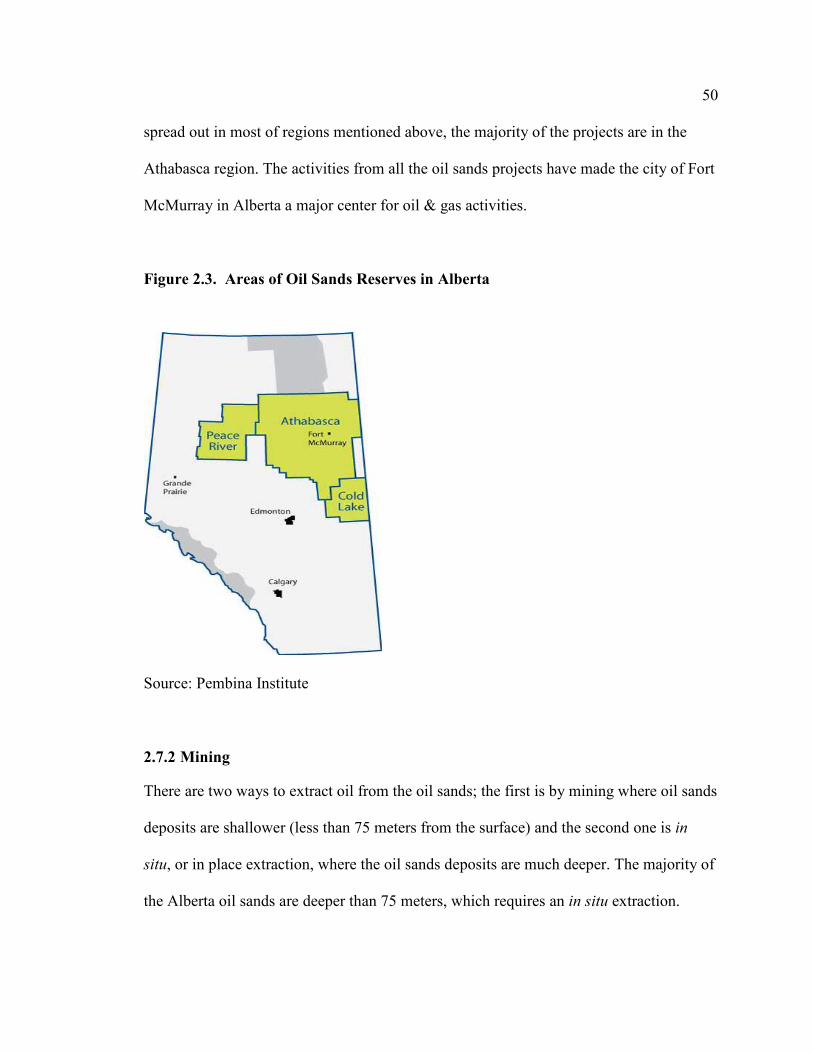
50
spread out in most of regions mentioned above, the majority of the projects are in the
Athabasca region. The activities from all the oil sands projects have made the city of Fort
McMurray in Alberta a major center for oil & gas activities.
Figure 2.3. Areas of Oil Sands Reserves in Alberta
Source: Pembina Institute
2.7.2 Mining
There are two ways to extract oil from the oil sands; the first is by mining where oil sands
deposits are shallower (less than 75 meters from the surface) and the second one is in
situ, or in place extraction, where the oil sands deposits are much deeper. The majority of
the Alberta oil sands are deeper than 75 meters, which requires an in situ extraction.
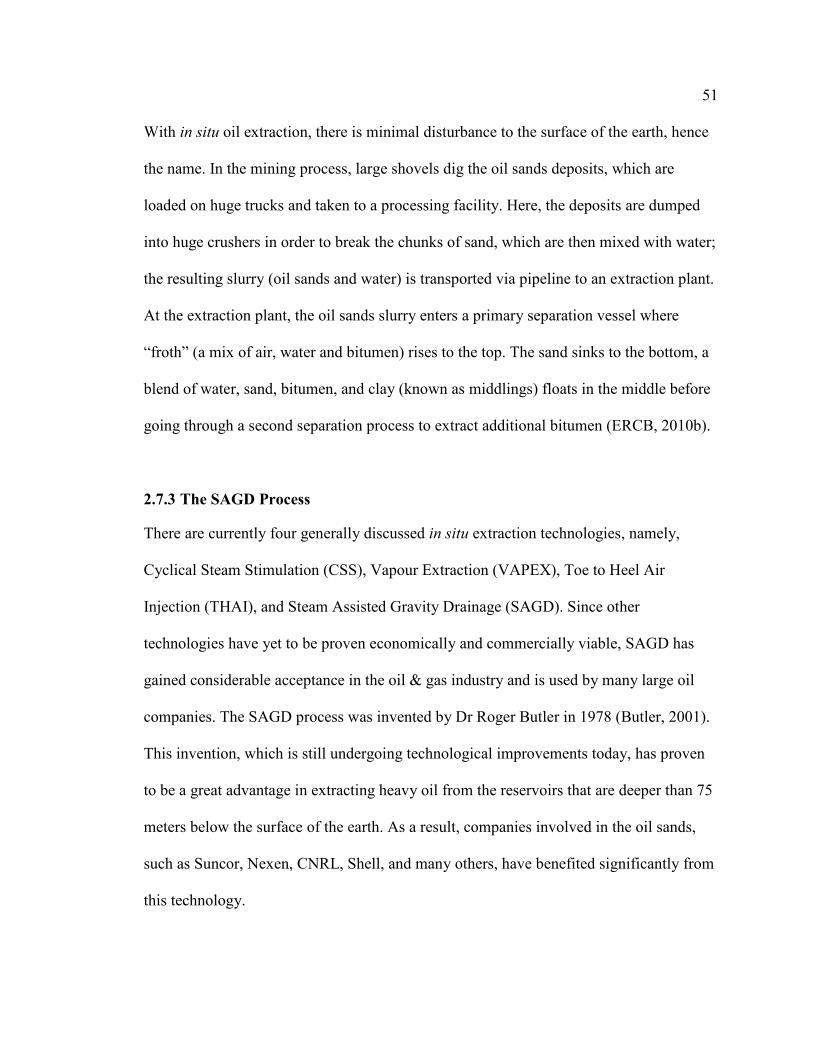
51
With in situ oil extraction, there is minimal disturbance to the surface of the earth, hence
the name. In the mining process, large shovels dig the oil sands deposits, which are
loaded on huge trucks and taken to a processing facility. Here, the deposits are dumped
into huge crushers in order to break the chunks of sand, which are then mixed with water;
the resulting slurry (oil sands and water) is transported via pipeline to an extraction plant.
At the extraction plant, the oil sands slurry enters a primary separation vessel where
“froth” (a mix of air, water and bitumen) rises to the top. The sand sinks to the bottom, a
blend of water, sand, bitumen, and clay (known as middlings) floats in the middle before
going through a second separation process to extract additional bitumen (ERCB, 2010b).
2.7.3 The SAGD Process
There are currently four generally discussed in situ extraction technologies, namely,
Cyclical Steam Stimulation (CSS), Vapour Extraction (VAPEX), Toe to Heel Air
Injection (THAI), and Steam Assisted Gravity Drainage (SAGD). Since other
technologies have yet to be proven economically and commercially viable, SAGD has
gained considerable acceptance in the oil & gas industry and is used by many large oil
companies. The SAGD process was invented by Dr Roger Butler in 1978 (Butler, 2001).
This invention, which is still undergoing technological improvements today, has proven
to be a great advantage in extracting heavy oil from the reservoirs that are deeper than 75
meters below the surface of the earth. As a result, companies involved in the oil sands,
such as Suncor, Nexen, CNRL, Shell, and many others, have benefited significantly from
this technology.
52
Unlike conventional crude oil, where considerable exploration costs are involved, finding
costs for the oil sands are negligible because they are delineated or well defined (F.
Gaviria, et al., 2007); this makes the oil sands very attractive. Rick George, the President
and CEO of Suncor Energy, considers Canada’s huge oil sands as “extremely long life,
low risk, and relatively low-cost commodity” (Moritis, 2004, p. 37).
In the SAGD process, a pair of wellbores or pipes, around10 inches in diameter and
almost 1000 to 1600 meters long, is drilled into the oil sands reservoir at a depth of about
100 to 200 meters. Underground, the two pipes sit horizontally parallel to each other and
approximately five meters apart. In the pipe sitting above, steam is injected from a
surface plant at a high pressure, which results in a steam chamber forming around it. The
steam starts to heat the reservoir, eventually melting the bitumen, which is collected by
gravity into the second pipe and lifted to the surface and collected in huge tanks.
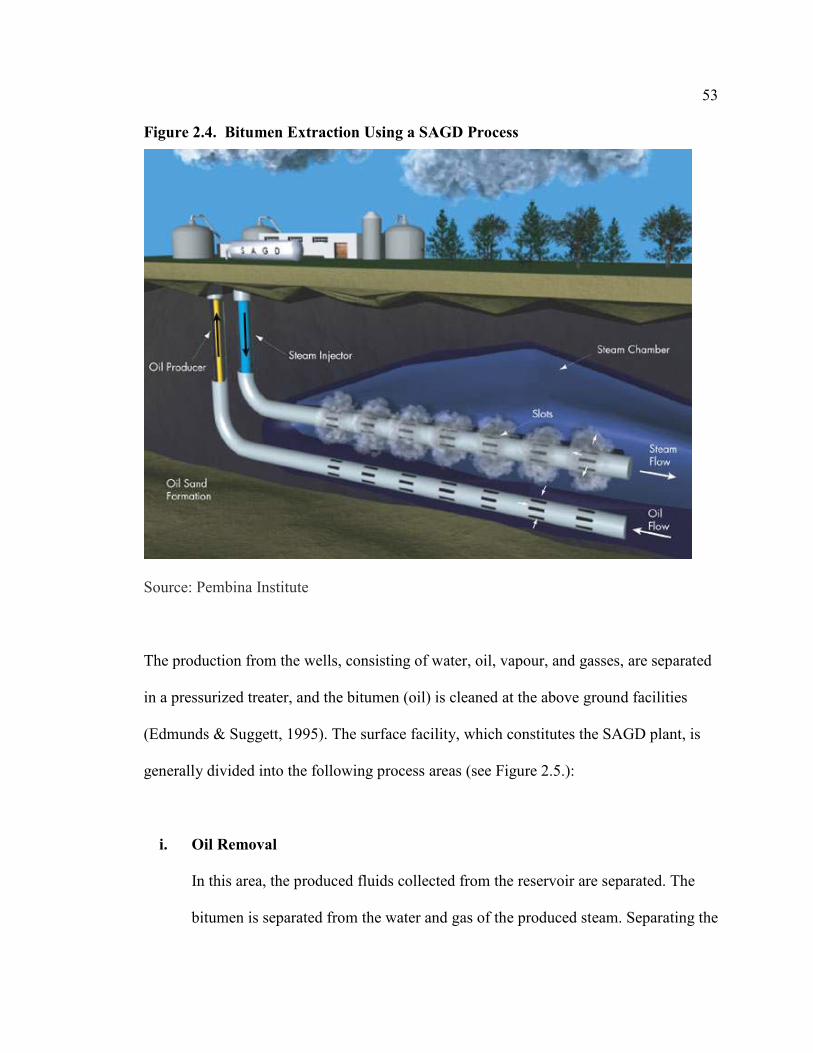
53
Figure 2.4. Bitumen Extraction Using a SAGD Process
Source: Pembina Institute
The production from the wells, consisting of water, oil, vapour, and gasses, are separated
in a pressurized treater, and the bitumen (oil) is cleaned at the above ground facilities
(Edmunds & Suggett, 1995). The surface facility, which constitutes the SAGD plant, is
generally divided into the following process areas (see Figure 2.5.):
i. Oil Removal
In this area, the produced fluids collected from the reservoir are separated. The
bitumen is separated from the water and gas of the produced steam. Separating the

54
bitumen from the water is done in several steps. Essentially, the separation is done
by gravity. Since density of bitumen and water is almost the same, diluent (a
hydrocarbon) is added, since diluent mixes with the bitumen but not with water.
The mixture of diluent and bitumen, which is called dilbit, is less dense and less
viscous than bitumen, and so the separation will work. Special treating chemicals
must be added to help the separation of water and dilbit at a reasonable rate.
ii. Storage Tanks for Dilbit
The treated bitumen (dilbit) is stored in tanks in this area and sent to a central
pipeline terminal in order to be shipped to the market.
iii. Cooling and Separation
The produced water vapour from the well pads is cooled off in the cooling and
separation plant to condense the water, which is sent to the Deoiling area. The
remaining methane gas is sent to the steam generators to be used as fuel gas.
iv. Water Deoiling
The water that is produced from the well pads together with the bitumen must
have the contaminants removed before it can be recycled to produce steam. Any
free oil that did not separate from the water in the oil removal plant is removed
using a process called Microbubble Floatation, and it is removed through oil
removal filters. This water is sent to the water treatment area for further cleaning.
55
v. Water Treatment
In this area, source or raw water from rivers or lakes, also called makeup water, is
filtered and treated by removing any solids in order to feed the huge steam
generators. In addition, the produced water from the Deoiling plant, which still
contains dissolved minerals such as calcium, magnesium and silica, must be
removed so as to prevent scaling of the steam generators. Warm Lime Softener,
filters, and ion exchange units are used to clear the water from these solids, which
can be used as the boiler feed water.
vi. Steam Generation
Here huge boilers produce steam, which is sent down the injector wells and into
the reservoir to melt the oil sands. The steam generators are made of special
design so that they can make steam even from water, which is “dirty” or having
impurities. For every 1000kg of boiler feed water sent to these steam generators,
approximately 750 kg of steam is produced with 250kg remaining as liquid water.
Natural gas or diesel is used as fuel to operate the huge steam generators.
vii. Well Pads
This is the base of the steam injection area. Each well pad has several well pairs
(injector and producer wells). Through the injector well head, steam is injected
into the different reservoir areas; the bitumen produced is pumped through the
producer well and collected in tanks at the surface.
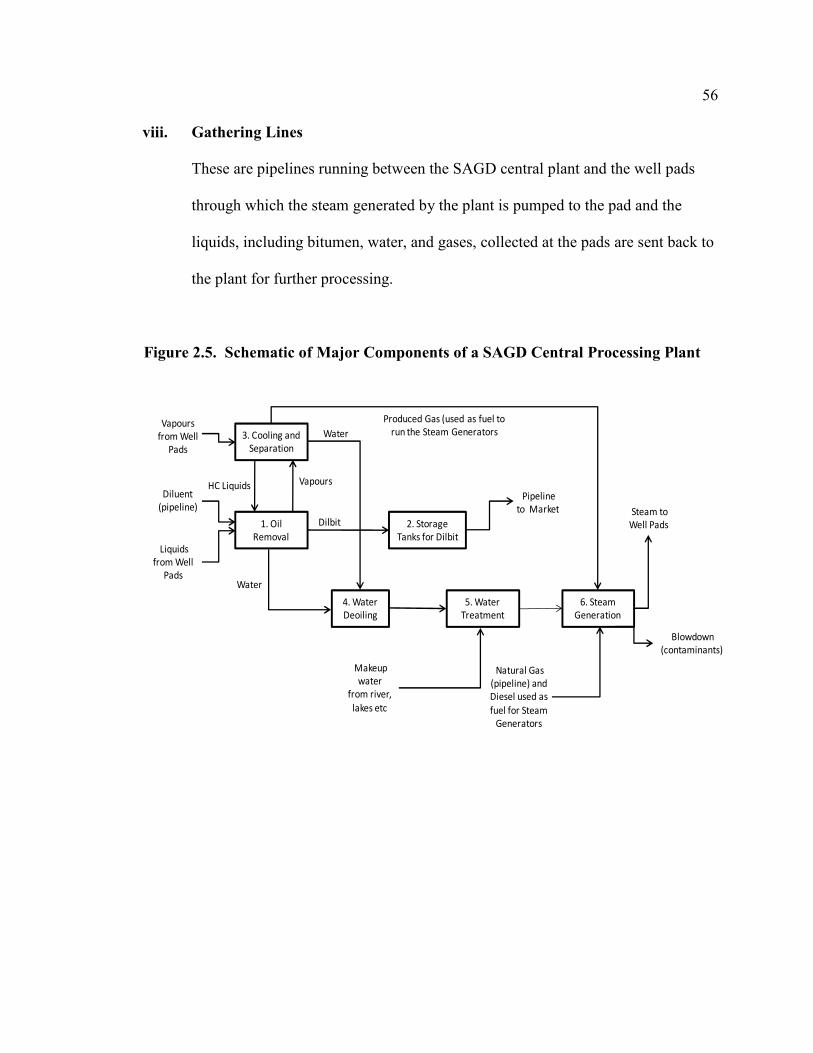
56
viii. Gathering Lines
These are pipelines running between the SAGD central plant and the well pads
through which the steam generated by the plant is pumped to the pad and the
liquids, including bitumen, water, and gases, collected at the pads are sent back to
the plant for further processing.
Figure 2.5. Schematic of Major Components of a SAGD Central Processing Plant
Vapours
from Well
Pads
Diluent
(pipeline)
Liquids
from Well
Pads
Makeup
water
from river,
lakes etc
Natural Gas
(pipeline) and
Diesel used as
fuel for Steam
Generators
2. Storage
Tanks for Dilbit
3. Cooling and
Separation
1. Oil
Removal
6. Steam
Generation
4. Water
Deoiling
5. Water
Treatment
Water
HC Liquids
Dilbit
Produced Gas (used as fuel to
run the Steam Generators
Pipeline
to Market Steam to
Well Pads
Blowdown
(contaminants)
Water
Vapours

57
Figure 2.6. Bitumen
Figure 2.7. Synthetic Crude Oil
2.7.4 Application of SAGD
Butler, in his paper entitled Steam assisted gravity drainage: concept, development,
performance and future (1994) describes the SAGD process briefly and identifies the
problem of establishing communication between the steam injection well and the
production well. To resolve this problem, he suggests keeping the two wells close enough
and heating both the wells and “applying a pressure difference between them” (Butler,
1994, p. 46). Butler continues saying that “The main advantage of closer well spacing is
that the oil/steam ratio is better because of the shorter time which is necessary to keep the

58
reservoir hot. On the other hand, close well spacing involves a higher cost for
constructing the wells and, as a result, there is an economic optimum” (1994, p. 47).
Bitumen production using SAGD is linked to the price of fuel such as natural gas which
is required to produce the steam that is injected into the well leading into the oil sands
reservoir (Winestock, 2004). The steam to oil ratio, also known as SOR, is an important
indicator of oil sands’ reservoir performance; most literature suggest that a lower SOR,
ranging between 2.2 and 2.7, results in lower costs, and therefore, better economics. A
higher SOR means that a greater amount of steam is required to be pushed into the
reservoir to recover the bitumen, which results in higher energy (natural gas) costs.
Due to its high viscosity, the heavy bitumen travels very slowly through the production
well, and therefore, hot steam and high pressure have to be used to move it quickly to the
surface facilities; this results in higher cost from generating the steam. In their paper,
Gaviria et. al report using electric submersible pumps (ESP) at Suncor’s Firebag plants to
artificially or mechanically lift the bitumen; this technique helped in lowering the SAGD
operating pressure (and the temperature) and, therefore, lowering the SOR, which
ultimately resulted in lower cost; it also provided the ability to increase production
(2007). The authors conclude that, “On an individual well basis, some wells can be
produced now with SOR of 1.5 and less. Bottom-line, ESPs have contributed to reduce
the in situ operating cost at levels that promise to be comparable with mining production
costs” (F. Gaviria, et al., 2007, p. 6) .

59
2.7.5 Oil Sands versus Conventional Crude Oil Extraction
It should be noted that the crude oil extracted from conventional crude oil reservoirs is
much lighter than the oil from the oil sands, which is very thick and heavy making it hard
to move though pipelines on its own. The lighter oil, because it is less viscous, does not
require as much heat and pressure to move it to the surface. Moreover, it does not require
any processing at the surface and is, therefore, sent directly to the storage tanks for
distribution to the market. In comparison, extracting oil from the oil sands using in situ
technology, such as SAGD, requires huge plants to generate the steam needed to liquefy
the oil sands and move the oil as well as other fluids that appear at the surface from the
reservoirs where it is collected and separated into large tanks. This is why extracting the
lighter conventional crude oil from its reservoir does not create as much impact on the
plant’s surface facilities in comparison with oil from the oil sands.
Figure 2.8. is a map of the discussions in the previous sections regarding the literature
available on the project management of large projects as described in this section and the
gaps or areas requiring further study.
2.8 Gaps Identified in the Literature
In examining the literature, the researcher concluded that despite the fact that project
management is a relatively young discipline, there is significant information available in
this area. However, this literature is of a general nature; applications to specific industries
are lacking. While generic project management principles are universal for all industries,
the nuances of executing projects from the healthcare industry to the software industry to

60
oil & gas industry are different. For example, in the information technology industry, a
major output of a software application project is the code or the program. On the other
hand, in the chemical process industry, it is the P&IDs. These two outputs are of a similar
nature. However projects in each of these industries are developed differently and,
therefore, require different strategies to successfully execute the project.
Figure 2.8. Literature Review Map
Effective Project
Management of Oil & Gas Projects:
Execution Model for SAGD Plants
Project Management
Large Projects
Oil & Gas
Off-Shore
Pipelines
Mining
Engineering Execution Fast Tracking
Procurement Contracts Lump-sum
Construction
Constructa-
bility
Modulariza-
tion
SAGD
Process
Application
Need
for
Study
Secondly, in focusing on the oil & gas industry, which is the researcher’s area of interest,
there is literature available on the various aspects of project execution such as the stage-
gate process, front-end loading, estimating, value improvement practices, scheduling, and
61
so on. However, comprehensive literature on the execution of large oil & gas projects is
not available. The literature is even scarcer and non-existent as one examines project
management of SAGD plants in the production of bitumen from the oil sands. One of the
reasons for this lack of literature could be that most of the large oil & gas projects, such
as refineries, were built approximately 30 to 35 years ago. It is only recently, with the
sudden increase of crude oil prices, that the construction of large oil sands projects has
become economically feasible, and this has resulted in increased activity in the
construction of new bitumen plants and upgraders.
2.9 Future of Alberta’s Oil & Gas Industry
Considering that only 20% of the oil sands are mineable and the other 80% requires in
situ processes for oil extraction, the recent geo-political issues, the increased demand for
oil from the emerging countries of Brazil, Russia, China and India, and together with
improvements in oil sands technology, one can safely say that a large number of new oil
sands extraction plants and facilities will be undertaken within the next five to ten years.
Within in situ technologies, SAGD is the most widely used, and as a result, the oil & gas
industry has gained considerable experience. Although, SAGD is still a new technology,
which has only been widely used over the last decade or so, Brian Ferguson, the
President and CEO of Cenovus (Encana), is quite bullish saying, “One hundred percent
of our assets are SAGD and SAGD is definitely in my opinion the way of the future for
bitumen production” (Vanderklippe, 2009, p. 1 Para 9). Based on these facts, the
researcher proposes that SAGD plants will be the wave of the future in Alberta’s oil
sands industry.
62
If SAGD will be the wave of the future, then the oil & gas industry will need to have an
efficient process to engineer, procure, and construct the SAGD plants in an effective
manner within the traditional limitations and boundaries of cost, schedule, and quality.
As a result, the researcher, having recent experience working on SAGD projects, decided
to undertake a study on Effective project management of oil & gas projects: An model for
oil sands’ SAGD plants as his contribution to the Alberta oil & gas industry.
2.10 Lessons Learned
In order to undertake the study, the researcher decided to do a preliminary review of the
lessons learned from a SAGD project that had been completed a few years back. The
researcher was amazed to find that there were a significant number of lessons learned
from the project; however, they had not been well documented, codified, or categorized.
More importantly, with the wealth of information available from previous projects, why
do companies not learn from their past experiences that project cost overruns are
becoming a recurring symptom in many new projects?
2.10.1 An Inconvenient Truth
Duhon & Elias write in their article that people do not learn from their lessons because
they do not want to change their long held beliefs despite evidence to the contrary (2008);
it is as if they do not want to hear, “an inconvenient truth”. Weick suggests that people
tend to hang on to their beliefs with the minimum amount of evidence available (1995).
“Real learning occurs when problems are important enough to us that we are sufficiently
motivated to change our behaviour. We may continue in a failed course of action if the

63
results are not important to us” (Duhon & Elias, 2008, p. 5). From an organizational
setting, and especially on project based work, Duhon & Elias suggest that there is a
tendency not to pay as much attention to lessons learned from a previous team because of
the bias of superiority of the current team; more importantly, according to some, the
reason why people do not learn is that the experiences of previous projects are often
forgotten (2008).
2.10.2 Do Lessons Learned Really Help?
In an interesting article entitled “Disasters, Lessons Learned, and Fantasy Documents”,
Birkland bluntly states that in some cases, lessons learned documents in projects
involving disaster relief are prepared in an attempt to satisfy the appropriate authorities
by exhibiting that something was done after a certain disaster struck, and not necessarily
for purposes of real learning (2009). In his article, Birkland discusses lessons learned
processes, especially after disasters such as the Exxon Valdez oil spill, Hurricane Katrina,
etc. He suggests that there is no way to test if learning actually took place, and in the end,
the lessons learned are generally ignored after being published (2009).
2.10.3 Study of Lessons Learned at Alberta EPC Firms
In her study regarding Alberta’s EPC sector and how construction companies in the
United Kingdom could take advantage of this procedure, Carrillo examined five
organizations and reviewed different aspects of how they conducted lessons learned
including aspects such as requirements, procedures, participants, documentation, and
dissemination (2005). One of the findings of her study was that the EPC companies
64
conduct lessons learned to impress potential clients by showing them that they have such
a procedure in hope that it would help them bring more business; she concludes that
companies need to conduct lessons learned in a more structured way, rather than ad hoc,
which can help them build a knowledge database for future projects (2005).
2.10.4 Importance of Context
From the researcher’s experience, in having participated in lessons learned sessions and
having read the lessons learned from other projects, the problem is that the context in the
written lessons learned is always missing. When one reads the documented lessons
learned, they often lack the emotion, argument, importance, frustration, and achievement,
which are ever so present in the lessons learned sessions. Moreover, it becomes a
complex exercise to provide in the written narrative the contexts of the various lessons
learned, and therefore, to fully appreciate and understand them.
Another aspect of lessons learned is the experience. Unless one has personally
experienced something, it is difficult for that person to appreciate its importance. To take
the example of giving birth, although much literature is available about child birth, it is
very difficult for a first-time expectant mother to understand labour pain without having
gone through it herself. Therefore, unless one experiences the pain, the impact or severity
of the situation, is hard to empathise and fully understand it. As a result, the lessons
learned are not taken as seriously, and people end up having to relearn them.
65
2.11 Generating Theory
Despite the strong arguments in the preceding sections about not learning from lessons
learned, from a research perspective, it is a powerful source of knowledge and wisdom to
be able to document, review, analyze, and contextualize in order to generate new
theories. Lessons learned are essentially the voices of people who have been burned
through a certain incident and through that experience, provide caution and or advice so
that the next person can avoid undergoing the same issues that they went through. In a
sense, lessons learned are like one’s parent or guide advising the child regarding what to
do and what not do so as to make life easier, whether it is in a personal, family,
community, or an organizational setting. This is how the world has been able to sustain
and make progress.
2.12 Prologue
It is with the intent of creating new theory and knowledge that the researcher decided to
undertake a study by talking to people who had worked on SAGD projects and to
document and use their lessons learned. The goal is to come up with a model that would
make the execution of SAGD projects more effective from a project management
perspective. The researcher hopes this study will create a dialogue among the various
practitioners in the EPC industry; and also, inform and educate those who wish to avoid
having to relearn the lessons already learnt by others.
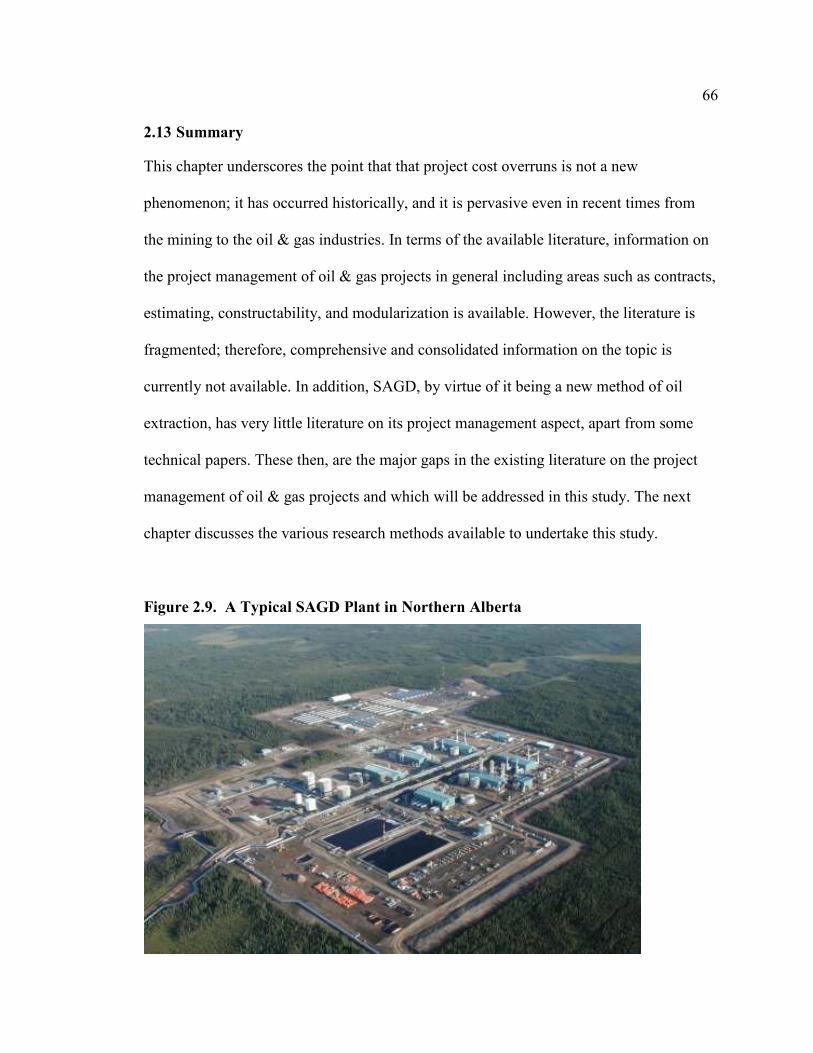
66
2.13 Summary
This chapter underscores the point that that project cost overruns is not a new
phenomenon; it has occurred historically, and it is pervasive even in recent times from
the mining to the oil & gas industries. In terms of the available literature, information on
the project management of oil & gas projects in general including areas such as contracts,
estimating, constructability, and modularization is available. However, the literature is
fragmented; therefore, comprehensive and consolidated information on the topic is
currently not available. In addition, SAGD, by virtue of it being a new method of oil
extraction, has very little literature on its project management aspect, apart from some
technical papers. These then, are the major gaps in the existing literature on the project
management of oil & gas projects and which will be addressed in this study. The next
chapter discusses the various research methods available to undertake this study.
Figure 2.9. A Typical SAGD Plant in Northern Alberta
67
Chapter 3: Research Methods
Chapter Overview
In this chapter, the two main branches of research, known as the quantitative and
qualitative, will be examined. Within these branches, the qualitative branch will be
examined in further detail with a look at the five predominant methods within it, namely,
narrative research, phenomenological research, grounded theory research, ethnography
research, and the case study. The elements of research are also discussed including
research design, data collection and management, data analysis and representation,
coding, rigor, validity, triangulation, and reliability. The chapter will conclude with
sections on researcher involvement and ethical considerations.
3.1 Quantitative vs. Qualitative Research Defined
There are two major paths to conducting research in the Social Sciences; the first one is
the Qualitative, and the other is the Quantitative method, which is considered to be the
more orthodox of the two. Most scientific theories are based on quantitative methods
involving numbers, statistical modelling, and analysis. Concepts such as frequency
distribution, measures of central tendency, linear correlation, and prediction, are used as
tools to extract and validate the theories emanating from the research experiments. Due to
its precision of numbers, and therefore, the ability to provide a picture of a society or a
situation, the standing of quantitative research among grants-giving institutions is higher;
however, “research findings in quantitative research, which are, in essence, a snapshot in
time, and may not address the needs of the local community because the focus is on
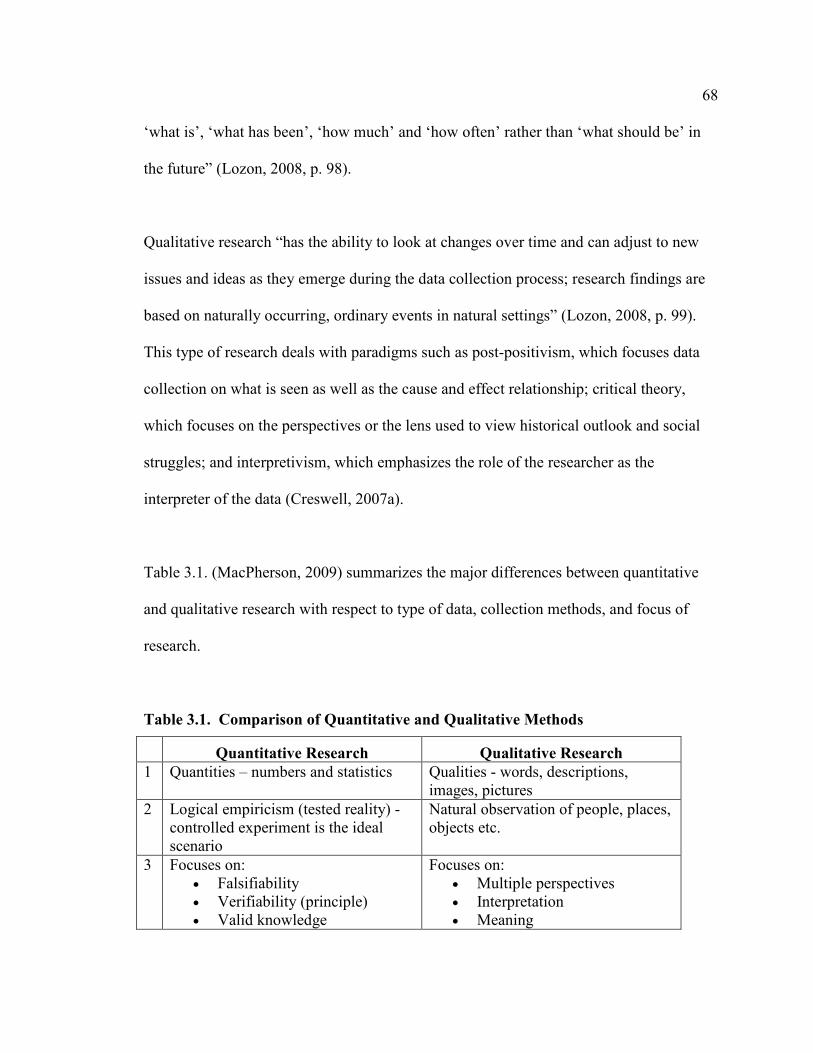
68
‘what is’, ‘what has been’, ‘how much’ and ‘how often’ rather than ‘what should be’ in
the future” (Lozon, 2008, p. 98).
Qualitative research “has the ability to look at changes over time and can adjust to new
issues and ideas as they emerge during the data collection process; research findings are
based on naturally occurring, ordinary events in natural settings” (Lozon, 2008, p. 99).
This type of research deals with paradigms such as post-positivism, which focuses data
collection on what is seen as well as the cause and effect relationship; critical theory,
which focuses on the perspectives or the lens used to view historical outlook and social
struggles; and interpretivism, which emphasizes the role of the researcher as the
interpreter of the data (Creswell, 2007a).
Table 3.1. (MacPherson, 2009) summarizes the major differences between quantitative
and qualitative research with respect to type of data, collection methods, and focus of
research.
Table 3.1. Comparison of Quantitative and Qualitative Methods
Quantitative Research Qualitative Research
1 Quantities – numbers and statistics Qualities - words, descriptions, images, pictures
2 Logical empiricism (tested reality) - controlled experiment is the ideal scenario
Natural observation of people, places, objects etc.
3 Focuses on: • Falsifiability • Verifiability (principle) • Valid knowledge
Focuses on: • Multiple perspectives • Interpretation • Meaning

69
Qualitative research is used “to develop theories when partial or inadequate theories
exist for certain populations and samples or existing theories do not adequately capture
the complexity of the problem we are examining” (Creswell, 2007a, p. 40). After
examining the available literature on “Effective project management of oil & gas
projects”, the researcher found insufficient information and studies on execution of oil &
gas projects. Therefore, based on Creswell’s criteria stated earlier, this study falls under
the realm of qualitative research, and for this reason, the emphasis and discussion of this
section will be on the various qualitative methods available to researchers, including
narrative research, phenomenology, grounded theory, ethnography, and case study.
It should be noted that a combination of qualitative and quantitative research can also be
conducted. Nuances of quantitative research can be seen especially when qualitative data
needs to be quantified, albeit in simple terms, for analysis and validation.
3.2 The Five Different Qualitative Methods
3.2.1 Narrative Research
Narrative research is defined by Pinnegar & Daynes (2006) as “an approach to qualitative
research that is both a product and a method. It is a study of stories or narratives or
descriptions of a series of events that account for human experiences” (Creswell, 2007a,
p. 234) Narrative research is used to examine a person’s life. It also includes stories and
deeds of a living or deceased person, for example, the life of Pierre Elliott Trudeau, who
is arguably the finest Canadian Prime Minister in recent history. The following steps are
used for conducting a narrative research study (Creswell, 2007a):
70
i. Evaluate whether the problem deals with the life of a person or place
ii. Identify and choose people who know the person and have stories about the
person on whom the study is being done
iii. Keep the context of the stories in perspective
iv. Retell the stories and narratives in a way that has a certain order and makes sense
v. Establish good relations with the story tellers and make them participate in the
research
3.2.2 Phenomenological Research
Phenomenological research is about something that people have lived through or
experienced such as the dropping of bombs on Hiroshima or a happy event such as the
hockey match between Canada and the United States at the 2010 Vancouver Olympic
Winter Games. Moustakas, as quoted in Qualitative inquiry and research design:
Choosing among five approaches (2nd Edition), maintains that the phenomenological type
of study “describes the meaning of experiences of a phenomenon (or topic or concept) for
several individuals in this study, the researcher reduces the experiences to a central
meaning or the ‘essence’ of the experience” (Creswell, 2007a, p. 236).
In approaching a phenomenological study, the following high-level steps can be helpful
(Creswell, 2007a):
i. Establish whether the research falls under the realm of phenomenology by
evaluating peoples’ experiences
71
ii. The researcher should remove his or her experiences in order to have the
participants’ views spring out more predominantly from the study
iii. Use in-depth data collection procedures such as interviews, poetry, music, art, etc.
iv. Use open ended questions such as the participant’s experience of the phenomenon
and the influences on the experience such as the background
3.2.3 Grounded Theory Research
The Grounded Theory is a qualitative research method in which the theory is developed
from the data, rather than the other way round; therefore, this method is an inductive
approach, meaning that it moves from the specific to the more general. The central point
of the Grounded Theory is to take the appropriate data and try to fit it in the relevant
theory. Moreover, it does not test a hypothesis, but rather, it seeks to determine which
theory accounts for the research situation ‘as-is’.
This research method is predominantly used in the fields of psychology, social sciences,
health sciences, and business. Grounded Theory research has also been used in the field
of Project Management on topics such as Construction Productivity, Knowledge
Management, and Quality Management. Creswell suggests the following points to assist
the researcher in a Grounded Theory study (2007a):
i. Identify the level of theory that is available; if there is insufficient theory, the
research can be done under the realm of Grounded Theory
ii. The researcher’s objective is to focus on the process and identify how it unravels
iii. Interviews, observations, and documents are the primary sources of data

72
iv. Data collected from various sources is coded
v. Identify the emergence of patterns from the coding
3.2.4 Ethnography Research
Ethnography, as defined by Harris (1968), is “a qualitative design in which the researcher
describes and interprets the shared and learned patterns of values, behaviours, beliefs and
language of a culture-sharing group” (Creswell, 2007a, p. 68). An ethnographic study can
involve, for example, the study of the Masaai tribe in Tanzania or the study of
Polynesians in Hawaii. In considering an ethnographic research study, the following
steps are important to keep in mind (Creswell, 2007a):
i. Define the research study and ensure that it fits the definition of ethnography,
which is essentially the study of groups and group behaviour
ii. The ethnographic group to be studied should be identified
iii. Identify themes which the researcher would like to study pertaining to the group
iv. Identify more information about the group and how it works and lives
v. Patience in collecting the data, due to the prolonged nature of this research
3.2.5 Case Study Research
The final method of research is the case study, which can involve the study of a single
case or a group of single cases to create theory out of it. Case study “involves the study of
an issue explored through one or more cases within a bounded system” (Creswell, 2007a,
p. 73). A case study can be done, for example, on how different engineering companies

73
execute their projects or how the Unions reward the construction trades for achieving
good productivity. Steps to undertake a case study research include (Creswell, 2007a):
i. Identify whether there is a single case study or multiple case studies, the factors to
compare the cases, and the limitations of the cases
ii. Identify the case or cases that have the potential of providing good results which
are different in terms of problems, process, or event; this is done through
purposive or non-probability sampling – targeting a subject or participant to
obtain data about a certain population where randomness is neither achievable nor
desirable (MacPherson, 2009)
iii. Multiple data sources should be looked at including observations, documents,
processes, and methodologies
iv. Do a holistic analysis of the complete case
v. Interpretation of the analysis from the learnings of the case; this can evolve as a
lesson learned from the case (Lincoln & Guba, 1985).
Regardless of the research method selected, there are certain hallmarks or characteristics
which distinguish good research from the mediocre. These characteristics are important
because they show the approach, rigor, and concern with which the research is
undertaken. Some of these are discussed in the following sections.
3.3 Research Design
This is an important aspect of any research. It includes all the activities from beginning to
the end involved in undertaking research; from identifying the research question,
74
collecting the data from the surveys, analyzing it, getting meaning out of the data together
with drawing the conclusions from it (Bogdan & Taylor, 1975; Yin, 2003). Research
design, from this perspective, includes every step that is taken in order to achieve the
research’s results. The research design, from the researcher’s perspective, has to be
thought out before starting the process. For a novice researcher, the process or
methodology can be one of trial and error. However, one has to be able to think about the
next steps in the various stages of research and to visualize the process. Visualizing
enables the researcher to play out the research design in his mind, specifically, the
unfolding of the research, which includes the next steps to be implemented and how they
should be implemented. This also provides the researcher with an opportunity to take
corrective action if things are not going as planned.
3.4 Data Collection & Management
Data collection is the range of methods and processes available to the quantitative or
qualitative researcher to verify hypotheses and create new realities through the research
process. For the qualitative researcher, these methods and processes begin by identifying
the place where the research will be conducted or the individuals who could form part of
the sample. This is followed by contacting the people who will participate in the research
to provide the information; through purposive sampling, the best candidates for the
research are selected. Through observations, interviews, surveys, focus groups, stories,
and the like, the data is collected using different modes such online, recording devices, or
simply note taking. Field issues, such as missing a step in the research or inadequate data
collection, have to be resolved, and finally, appropriate means have to be used, such as

75
computers, in order to organize and store the data. Figure 3.1., representing a circle of
activities, summarizes the data collection process from beginning to end (Creswell,
2007a).
Figure 3.1. Data Collection Process
1. Locating site -
individuals
2. Gaining access
- making rapport
3. Purposefully
sampling
4. Collecting data5. Recording
information
6. Resolving field
issues
7. Storing data
Data
Collection
Activities
Data management is an important aspect of data collection. Unlike quantitative research,
whose data is predominantly numeric, and therefore, easily managed and stored,
qualitative research deals with words from interviews, discussions, and observations.
This information has to be sorted, managed, and stored effectively so that it can be
retrieved quickly and easily during the research process. For example, in Grounded

76
Theory, research codes are used to identify anchors around which the main points of data
can be gathered. Coding, a process of comparing data from various sources such as
interviews, is employed so that a general theory or pattern can emerge. With such an
involved process to arrive at a general theory, an effective data management process can
be very useful. Table 3.2., adopted from Creswell (2007a), illustrates the basic
differences between the forms of data collected, strategies for analyzing the data
collected, and how the data is represented in its final form for the five research methods.
Table 3.2. Data Collection Processes of Various Qualitative Research Methods
Data Collection
Format
Data Analysis
Strategies
Data
Representation
Narrative
Research
Interviews, documents
Analysis of stories, “restorying” stories, developing themes often using chronology
Developing a narrative about the stories of an individual’s life
Phenomenological
Research
Interviews with individuals, documents & observations
Analyse significant statements, meaning, description of the “essence”
Describing the essence of the experience
Grounded Theory
Research
Primarily interviews with 20 - 60 individuals
Analysis through open, axial and selective coding
Generating a theory illustrated in a figure
Ethnographic
Research
Observations, interviews, other sources if research period longer
Analysis of description of culture-sharing and themes about the group
Describing how culture-sharing group works
Case Study
Research
Interviews, observations, documents, artefacts
Analysis of description of case, themes of case and cross-case themes
Developing detailed analysis of one or more cases
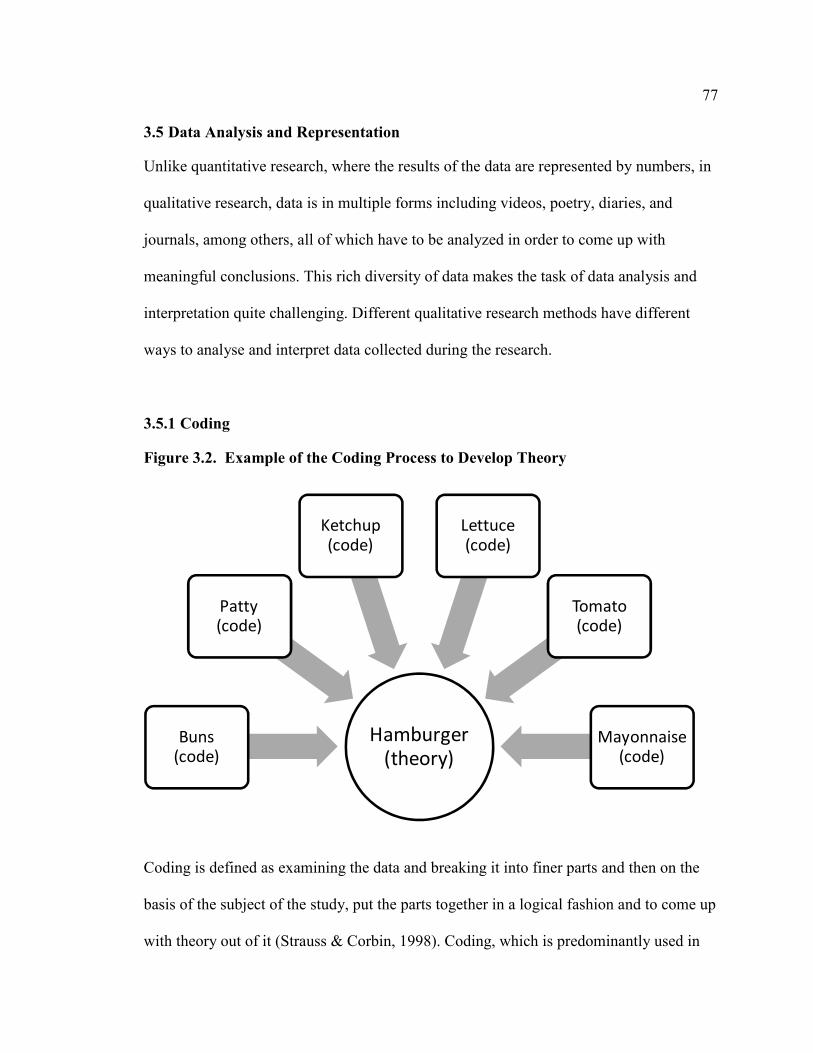
77
3.5 Data Analysis and Representation
Unlike quantitative research, where the results of the data are represented by numbers, in
qualitative research, data is in multiple forms including videos, poetry, diaries, and
journals, among others, all of which have to be analyzed in order to come up with
meaningful conclusions. This rich diversity of data makes the task of data analysis and
interpretation quite challenging. Different qualitative research methods have different
ways to analyse and interpret data collected during the research.
3.5.1 Coding
Figure 3.2. Example of the Coding Process to Develop Theory
Hamburger
(theory)Buns
(code)
Patty (code)
Ketchup (code)
Lettuce (code)
Tomato (code)
Mayonnaise (code)
Coding is defined as examining the data and breaking it into finer parts and then on the
basis of the subject of the study, put the parts together in a logical fashion and to come up
with theory out of it (Strauss & Corbin, 1998). Coding, which is predominantly used in

78
Grounded Theory, is essentially identifying elements that originate from interviews,
observations, and other forms of data collection. When these codes are put together, they
can assist in the formulation of a theory or a series of chapters of one’s life (in the case of
narrative research) or elements of case(s) (in case study research). Coding is an
imperative tool, which can sometimes require a few iterations before final representative
codes from the raw data can be achieved. Figure 3.2. illustrates how elements of food
ingredients (codes) identified from interviews and observations can be combined in order
to form a meal representing theory.
3.6 Rigor
Rigor is the discipline with which the research design is implemented. This discipline is
particularly important in documenting the whole process of the research exercise from the
objectives of the research to the final data collected from the field. This also includes the
data analysis and the number of levels of analysis done on the data. The documentation is
done in a methodical step-by-step way that can be summarized, and yet, drilled down for
details; this makes the research and the data analysis auditable, and it also brings a great
deal of organization to the records. Indeed, if during the research process there was a
need to back track on one or more of the research steps, it would be possible to do so
without losing valuable time.
3.7 Key Approaches to Validity
Validity is the strength of qualitative design, how well it has been put together, and how
accurate the findings are. However, these factors can cause apprehension (MacPherson,
79
2009). The concern relates to the trustworthiness or the dependability of the data
collected. Generally, this can be verified by the time spent in the field or the thick and
rich description of the data collected. One can be more specific by checking both the
internal and external validity of the research results, thereby providing greater
trustworthiness to the data collected.
3.7.1 Internal Validity
Internal validity is how much of a relationship can be identified formed from the data on
the basis of cause and effect. (Bickman, D.J., & Hedrick, 1998). The test here is to find
out if the variables are independent or can cause other results. In other words, if some
other researcher were to perform the same experiment, can one expect to get the same
results as the original researcher? (Willis, Jost, & Nilakanta, 2007)
3.7.2 External Validity
External validity, as Yin suggests, is identifying extent and the areas where the results of
the study can applicable (Yin, 2003). In other words, can the same results be achieved in
other settings or environments? Can they be generalized for other areas? Ways to
establish external validity include peer reviews, where the reviewer takes a cold eyes
review of the data and asks the researcher questions on the means of arriving at certain
conclusions and its significance. Member check is another external validation method
where the researcher asks the research participants to evaluate the validity and
authenticity of the data, analyses, and conclusions. This approach is an important and
effective methodology to ensuring the reliability, integrity and standing of the data.
(Lincoln & Guba, 1985).

80
3.7.3 Triangulation
One common approach to increase the reliability, credibility, and validity of the research
is triangulation, which is the use of multiple sources of data, methods, and theories to
substantiate the findings. Triangulation can also include asking other people or
investigators, who have encountered or been in similar situations, to validate the research
perspectives. Within history,
Alexander the Great never conquered a city or a people without thoroughly
researching the people, their culture, the condition of the empire’s status as well
as any other type of information that would allow him to evaluate the means by
which they could just not be conquered but ruled (Swenson, 2007, p. 4th Para)
3.7.4 Reliability
Willis relates reliability to stability in the sense that if an experiment is repeated, will the
scores, results, and data change or will they remain the same (Willis, et al., 2007)?
Reliability can be increased by collecting detailed field notes during or shortly after the
interviews or observations. Having rich data provides a good basis for documenting the
array of scenarios under which certain events or results can occur. This increase provides
a larger range of conditions for the results to be true, and thereby, assisting the reliability.
Lincoln & Guba support this concept by maintaining that authenticity is revealed if the
researchers can show that a wide collection of realities have been represented,
consequently improving the trustworthiness of the results (Lincoln & Guba, 1985).
81
3.8 Researcher Involvement
In qualitative research, researcher involvement helps in achieving the objectives of the
study, especially when he or she is knowledgeable about the topic of study. The
knowledge base provides the ability to monitor the technical aspects of the research
process, and, therefore, fine tune the study as it progresses. Significant changes to the
study should be avoided, as this can be a detriment to the process of obtaining consistent
results. Although researcher involvement is useful, there are certain disadvantages
associated with being too familiar with the topic. For example, complacency can set in,
and the researcher may not capture key information because the researcher is not paying
attention to the participants. More importantly, if the study participants are aware of the
researcher’s background of expert knowledge, they may, in the interviews, not elaborate
as much as one would expect. Although there are ways to mitigate, the researcher needs
to be cognizant of the issue.
3.9 Ethical Considerations
Ethics are a fundamental part of any research. Prime concerns include the privacy and
protection of the study participants, who sometimes take tremendous risks by opening up
to tell their story for the benefit of society. In doing so, they place a huge amount of trust
in the researcher. It, therefore, becomes incumbent on the researcher to protect their
privacy and to protect them from any physical, social, or economic harm. This means
keeping their data confidential, providing participants with a signed Informed Consent
form, and strictly adhering to ethical guidelines such as the one provided by the
University of Calgary’s Research Ethics Board (See Appendix C).
82
3.10 Conclusion
A quote from Creswell concludes this chapter.
Further, in many approaches to qualitative research, the researchers use
interpretive and theoretical frameworks to further the shape of the study. Good
(qualitative) research requires making these assumptions, paradigms, and
frameworks explicit in the writing of a study, and, at a minimum, to be aware that
they influence the conduct of inquiry (2007a).
3.11 Summary
In this chapter, the quantitative and qualitative branches of research were examined.
Quantitative research, which is the scientific method, is steeped into the orthodoxy of
research and involves quantities and controlled experiments with a focus on falsifiability,
verifiability, and valid knowledge. Qualitative research, on the other hand, deals with
words, descriptions, and images. It involves observation of people, places, and objects in
their natural environment and surroundings. It also focuses on multiple perspectives,
interpretations, and meanings. Regardless of the branch of inquiry used, ethical
considerations in undertaking the research are indispensable. Within qualitative research,
it is critical to protect the privacy of the research participants and avoid complacency in
ethical considerations.

83
Chapter 4: Selected Research Methodology – The Delphi
Chapter Overview
In this chapter, the Delphi Method, which was first utilized in the 1960’s by the United
States Air Force, will be discussed in detail from a historical as well as a practical
perspective. The rationale for selecting the Delphi Method for this research including its
most important features and suitability is explained. In addition, the mechanics and
chronological steps required to undertake a survey using the Delphi Method will be
identified and described in detail.
4.1 Rationale for Using the Delphi Method
Among the many research methods available, the Delphi Method was the most suitable,
given that it met the objectives of this research study. For example, the Delphi Method
provides the ability to solicit individual ideas and opinions in an environment which is
neutral compared to group environments such as brain storming, round tables, panels, and
committees, where some participants have inhibitions about voicing their opinions. This
is because in such group environments, the participants have different personalities and
relationships; some are dominant, while others are bashful; there are also supervisors and
subordinates. Such a setting makes it difficult to provide a neutral environment in which
people can speak freely without anxieties regarding the consequences of their opinions,
either personally or professionally. Therefore, such conditions do not create an
environment for obtaining good quality of data. The neutrality of the environment was
critical in achieving the objectives of this study.

84
Furthermore, based on a preliminary review of the literature, the researcher found that
information on project management, particularly in the area of oil & gas projects, was
scattered and very limited. For this reason, it was felt that in order to provide a valuable
contribution to this body of literature the Delphi Method would be an appropriate
structure due to its effectiveness in collecting experts’ opinions, ideas, and knowledge. In
addition, the data collection can be done in an anonymous, neutral environment, which,
from the researcher’s experience, often yields good quality data. Moreover, the ability of
the Delphi Method to assess or rate the qualitative information provided by the
participants in the surveys seemed to be an attractive feature to the researcher. Therefore,
by using the Delphi Method for this research, multiple objectives were accomplished.
4.1.1 Impact of Sociological Changes on the Delphi Method
In their paper entitled Computers and the future of Delphi, authors Linstone and Turoff
(2002) relate the current sociological changes happening in society and its impact on the
Delphi Method. Linstone and Turoff’s discussion is referred to because it summarizes the
researcher’s rationale for selecting the Delphi Method for the SAGD research.
In their paper, Linstone and Turoff refer to the unpublished work of Maruyama who
describes the sociological transformation taking place in western society as one based on
the traditional or uniformity in comparison to the emerging one which emphasizes
pluralism. In the highly inter-connected world we live in today, thanks to the internet
revolution, these changes have been highly accentuated in our daily lives. In the table

85
below, as reported by Linestone and Turoff, Maruyama characterizes the differences
between the two societal notions (2002).
Table 4.1. Comparison of Traditional and Emerging Societal Notions
• Uniformistic
• Unidirectional
• Hierarchical
• Quantitative
• Classificational
• Competitive
• Atomistic
• Object-based
• Self-perpetuating
Traditional
• Heterogenistic
• Mutualistic
• Interactionist
• Qualitative
• Relational
• Symbiotic
• Contextual
• Process-based
• Self-transcending
Emerging
Linstone and Turoff’s comments (2002) below together with remarks from the researcher
about the SAGD study emphasize the finer points of the Delphi method and its flexibility
even in the face of changes in society such as the ones identified in the table above. These
points of the Delphi method include the following:
4.1.2 Anonymity
Linstone and Turoff state that the anonymity involved in the Delphi Method conceals the
hierarchical status of the participants. In other words, since the Delphi research
participants are unidentified to each other, there is no hierarchy and they are free to state
their opinions without any fear of repercussions. In the SAGD study, the participants
86
were of diverse levels such as Leads, Project Managers, and Directors, but because of the
anonymity, the participants were oblivious to the hierarchy. When using other qualitative
methods of group surveys such brainstorming, round-tables, and the like, the hierarchy is
always visible and can be a deterrent in getting candid opinions and answers.
4.1.3 Pluralistic Perspectives
Authors Linstone and Turoff continue relating their points to Mayurama’s model, which
maintains that in a Delphi research “feedback can be positive as well as negative, thus
amplifying differences as much as dampening them out” (Turoff & Linstone, 2002, p.
488). This is a significant aspect of the Delphi because it provides a good forum for
pluralistic and diverse perspectives; it is difficult to provide a neutral environment when
doing research with members of a project team at the same table. Absence of diversity is
due to group pressure to conform to a certain train of thought out of peer pressure, which
results in “creating distortions of individual judgement” (Dalkey, 1969, p. 14). In
addition, “much of the ‘communication’ in a group discussion has to do with individual
and group interests, not with problem solving” (Dalkey, 1969, p. 14). Therefore,
extracting and harnessing an individual’s knowledge, creativity, and experience is
difficult in research environments that do not encourage or create conditions having
diversity of opinions. In contrast, the Delphi Method allows the participants of a
homogeneous group to maintain the uniqueness of their diverse opinions (Jones, 2002). It
also prevents the research from being dominated by a few individuals (Commission,
2006).

87
4.1.4 Absence of Hierarchy
An observation made by Linstone and Turoff is that the ideas or suggestions in a Delphi
can originate from any person, making it mutualistic rather than unidirectional. It is
commonly observed that in group research within organizational settings the staff
generally coalesce around ideas suggested by the highest person in the department or the
organizational hierarchy. In contrast, with the Delphi Method, there is no indication
where the ideas or suggestions are coming from because the surveys with the participants
are conducted on a one-on-one basis. In this SAGD survey, there was no indication
provided to the participants who suggested the lessons learned. All the lessons learned
(with the exception of duplicate ones) were presented to the participants in Round 2,
regardless of whether the lesson originated from the Project Director or an engineer.
4.1.5 No True or False Answers
In the Delphi Method of research, there are no right or wrong answers; therefore,
participants need not be concerned with providing (in)correct responses (Turoff &
Linstone, 2002). In the SAGD research, the participants rated the statements based on
their knowledge and experiences, which vary from one participant to the next, and this
was reflected in the survey scores. Maruyama compares this as symbiosis versus
competitive, that is, there is no evident struggle in this method of survey to achieve an
absolute answer; from the researcher’s experience, in group research, this struggle is
always present to a certain degree.

88
4.1.6 Talk and Listen to the Experts
Finally, Turoff and Linstone mention one of the virtues of the Delphi Method, suggesting
that “Good Delphis tend to seek relational and contextual representations of a problem
and avoid preclassification or rigid atomistic considerations or structures” (Turoff &
Linstone, 2002, p. 488). This is the fundamental reason why the researcher chose to use
the Delphi over other research methods because in the oil & gas industry, SAGD is a
fairly new technology for extracting bitumen from the oil sands and the industry is still
learning; as a result, a lot of the information about SAGD is still unknown. Therefore, to
have presented the survey participants with a rigid set of ideas or statements prepared by
the researcher for consideration would have been rather presumptuous and short sighted.
Moreover, a primary objective of the survey was to collect lessons learned that could
enhance the current project management body of knowledge. Therefore, it is the
qualitative input of personal views and opinions, subjective as they may be, that the
researcher was interested in and which makes the Delphi a much more powerful method
of research (Turoff & Linstone, 2002).
4.1.7 Go to the Grass Roots
To conclude this section, a quote from Maruyama on a Delphi study done by Dalkey on
The Quality of Life which also encapsulates the philosophy and rationale of this research
of talking individually to the project managers, engineers, and project support staff on the
topic of SAGD. Linstone and Turoff quote from an unpublished work of Maruyama:

89
The definition of the quality of life must come from specific cultures, specific
communities, and specific individuals, i.e., from grass roots up. There still persists
among the planners the erroneous notion that "experts" must do the planning.
Many of them, when talking about "community participation" still assume that the
"experts" do the initial planning, to which the community reacts. There was a time
when it was fashionable to think that Ph.D.'s in anthropology were experts on
Eskimos. This type of thinking is obsolete. The real experts on Eskimos are
Eskimos themselves. I have run a project in which San Quentin inmates
functioned as researchers, not just data collectors but also as conceptualizers,
methodology developers, focus selectors, hypothesis makers, research designers,
and data analysts. Their average formal education level was sixth grade. Yet their
products were superior to those produced by most of the criminologists and
sociologists....We can use the same method in creating criteria for quality of life
in specific cultures and specific communities (Turoff & Linstone, 2002, p. 489).
4.2 History of the Delphi Method of Research
The Rand Corporation had been studying ways to effectively use group information
obtained from surveys, and in 1953, a new concept of surveying with “iteration and
feedback” was introduced by Dalkey and Helmer (1963). The ability of iteration and
controlled feedback revolutionized group surveying, especially in the areas of long range
forecasting with the use of expert opinion. The name ‘Delphi’ is the place in ancient
Greece where the most revered prophecies about the future were predicted. However, in
90
recent history, the Delphi is known as a research method based on an iterative process to
obtain definitive answers from experts via a series of questions or statements.
The Delphi Method was first used on a consultative study for the United States Air Force
Project Rand. The intent of this study was to “obtain the most reliable consensus of
opinion of a group of experts...by a series of intensive questionnaires interspersed with
controlled opinion feedback” (Dalkey & Helmer, 1963, p. 458). Upon declassification of
the Delphi method as a military application in 1964, the method entered the academic
mainstream (Martino, 1999). Due to the nature of the original topic researched for the US
Air Force, the Delphi method attracted a fair amount of attention.
An interesting aspect of the Delphi Method is the ability to use it on long-range
forecasting (ten to fifty years), which was a major factor initially for using the Delphi
method on research related to science and technology and its impact on society at large.
Among the topics that employ this method include scientific breakthroughs, population
control, automation, space progress, war prevention, weapon systems, and areas such as
environment, health, and transportation (Turoff & Linstone, 2002).
In later years, this feature of long-range forecasting attracted the attention of many
corporations and governments in Western Europe, Eastern Europe, and the Far East.
Governments used the Delphi method on “foresight” studies, and a broader application
was used in the Japanese study about the future of science and technology; this was
followed by other studies by the German, French, and British governments (Cuhls,
Breiner, & Grupp, 1995).

91
4.3 Mechanics of the Delphi Method
Dalkey explains that a Delphi research study should have three major characteristics
(1969):
• Anonymity
• Iteration and controlled feedback
• Statistical group response
4.3.1 Anonymity
As mentioned earlier, individuals are sometimes reluctant to participate in group research
such as focus groups, lessons learned sessions, and the like, in part due to fears or
anxieties of being wrong or speaking in front of one’s peers or superiors. Some people,
especially in organizational settings, do not wish to have certain opinions attributed to
them for fear of future reprisal. Sometimes, people just wish to maintain their privacy
unless anonymity is guaranteed. Anonymity, therefore, is a way of reducing or calming
such fears and inhibitions. In more recent times, research surveys including the Delphi
can be conducted over the internet providing participants a high degree of anonymity.
However, one of the drawbacks of conducting interviews over the internet is that they are
difficult to conduct effectively; and also, a high response rate survey cannot be
guaranteed.
In the Delphi Method, anonymity, where the identity of the participants is not evident to
others, is a key criterion. This is accomplished by having one-on-one interviews with the
participants for all the rounds of the research. In addition, prior to starting the research,
92
confidentiality agreements (see Appendix C) can be provided by the researcher so as to
offer added assurance to the participants that their identity will not be revealed.
4.3.2 Iteration & Controlled Feedback
Iteration and controlled feedback can be defined as “conducting the (research) exercise in
a sequence of rounds between which a summary of the results are communicated to the
participants” (Dalkey, 1969, p. 16). Essentially, in a Delphi exercise, a series of questions
or statements are presented to the participants, and they are asked to provide their
response either through qualitative or quantitative rating. Qualitative responses would be
words like agree, somewhat agree, somewhat disagree, and disagree; while quantitative
ratings involve providing a response based on a five, seven or ten point Likert Scale
where, for example, 1 represents strongly disagree and 10 representing strongly agree.
Upon completion of the first round of survey, the results are collated and an average of
the responses is tabulated; these results are then communicated to the research
participants. On the basis of the first round of results, a second round of survey is
prepared and provided to the research participants; the objective is to have them examine
their individual first round responses in relation to the overall group response. At this
time, the participants have the opportunity to change their responses. This iteration can
go on for two or more rounds until the group results appear stable to the researcher, at
which point the further rounds of survey are cut short. This whole exercise is considered
as iteration and controlled feedback. In an analysis of the research done by Dalkey, there
seems to be a marginal improvement in the group results after more than two rounds of
93
iteration, and he suggests that “...if the more accurate responses on round one could be
identified, then with present procedures it might be better to omit the iteration step for
those questions” (Dalkey, 1969, p. 48).
4.3.3 Statistical Group Response
Dalkey defines statistical group response as “an appropriate aggregate of the individual
opinions on the final round” (Dalkey, 1969, p. V). Essentially, what happens here is that
the participant responses or ratings to the individual questions or statements on the survey
instrument are added up; they are then divided by the number of participants responding
to the specific survey statement or question resulting in the mean or the average of all the
participant responses. This aggregation is an important element of the Delphi Method.
Similar to other survey methods, it is possible for individuals or special interest groups
participating in the research to potentially skew the results in an attempt to achieve their
desired results. However, this element can be mitigated by being selective of who can
participate in the research and secondly, by having a larger sample size. From a strictly
statistical perspective, since the number of participants is generally smaller, the
expectation of Delphi surveys is not to produce results that are statistically significant;
rather, the objective is to identify a trend or combination of thoughts or ideas of that
group that can be projected into a single opinion (T. J. Gordon, 1994).
Dalkey aptly summarizes that “These features (anonymity, iteration & controlled
feedback and statistical group response) are designed to minimize the biasing effects of

94
dominant individuals, of irrelevant communications, and the use of group pressure
toward conformity”(1969, p. V).
4.4 Types of Delphi Method
Table 4.2. Classical Delphi Characteristics and its Application on SAGD Research
Classical Delphi SAGD Research
Anonymity of participants Surveys with participants conducted individually The Informed Consent form, provided to research participants included a confidentiality agreement
Iteration There were two rounds; Round 1 collected the lessons learned; in Round 2, lessons learned were rated by the survey participants
Controlled Feedback Round 1 lessons learned were summarized on survey form and provided to participants in Round 2
Statistical Aggregation Ratings of all individual participants maintained on a spreadsheet. Total scores of each individual lesson learned was aggregated by the total number of participants who responded.
In recent years, there has been an evolution into different types of Delphi methods
including the Classical Delphi (G. J. Skumolski, Hartman, & Krahn, 2007), the
Normative Delphi, Forecasting Delphi, and the Policy Delphi. Some purists, such as
Rowe and Wright, suggest that a Delphi research is true to its word only if it meets the
four major characteristics of the Classical Delphi - anonymity, iteration, controlled
feedback, and statistical group response (1999), as originally suggested by Dalkey. As
illustrated in Table 4.2., the SAGD research study represents a Classical Delphi.
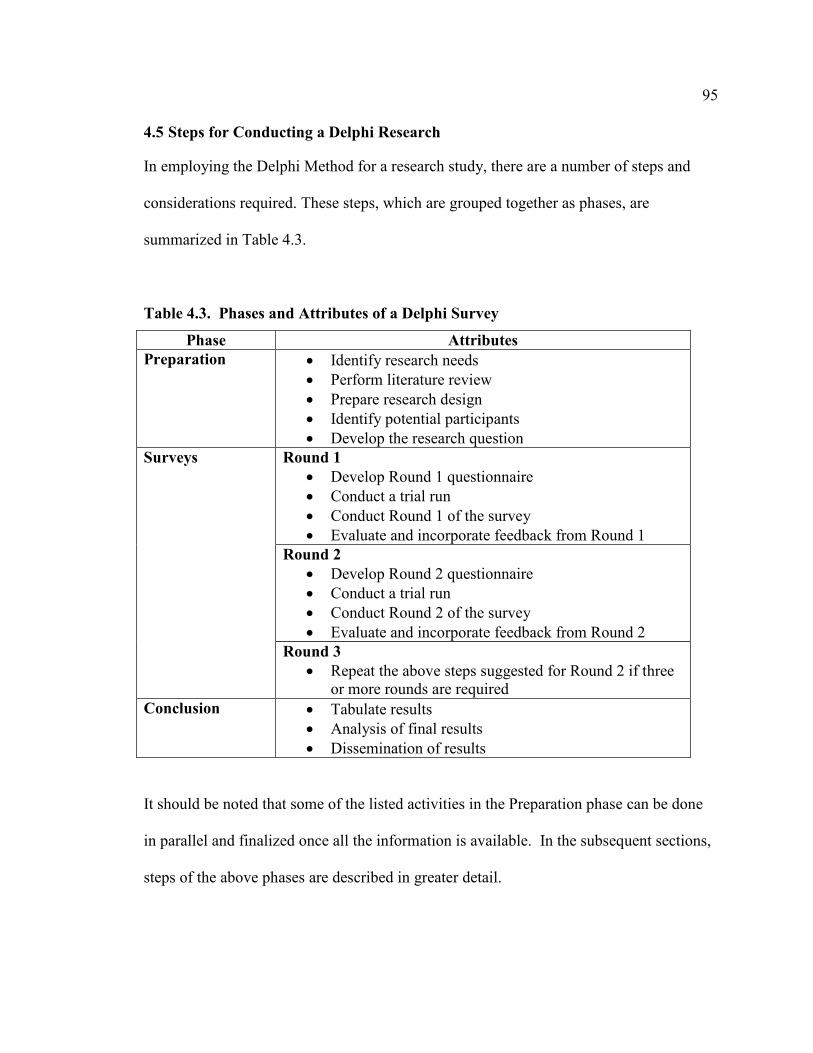
95
4.5 Steps for Conducting a Delphi Research
In employing the Delphi Method for a research study, there are a number of steps and
considerations required. These steps, which are grouped together as phases, are
summarized in Table 4.3.
Table 4.3. Phases and Attributes of a Delphi Survey
Phase Attributes
Preparation
• Identify research needs
• Perform literature review
• Prepare research design
• Identify potential participants
• Develop the research question
Surveys Round 1
• Develop Round 1 questionnaire
• Conduct a trial run
• Conduct Round 1 of the survey
• Evaluate and incorporate feedback from Round 1
Round 2
• Develop Round 2 questionnaire
• Conduct a trial run
• Conduct Round 2 of the survey
• Evaluate and incorporate feedback from Round 2
Round 3
• Repeat the above steps suggested for Round 2 if three or more rounds are required
Conclusion
• Tabulate results
• Analysis of final results
• Dissemination of results
It should be noted that some of the listed activities in the Preparation phase can be done
in parallel and finalized once all the information is available. In the subsequent sections,
steps of the above phases are described in greater detail.

96
4.5.1 Preparation Phase
4.5.1.1 Identify Research Needs
In this phase, the needs of the topic being researched are identified. Several questions
should be asked: what type of information is required to be collected – is it qualitative or
quantitative? Is the research being done for the purpose of collecting information or to get
a long range forecast? Such questions among others help identify the research needs.
4.5.1.2 Conduct Literature Review
A literature review of the topic should be conducted to determine what has already been
written by other researchers; this is done in order to avoid duplication. This information
can also be used to build a strategy for the new research in order to get a different
perspective. For example, what type of survey questions should be asked in the survey,
open-ended or closed-ended; what type of participant mix should there be – should it be
the same as the previous research or a different make-up of participants. The literature
review also helps in identifying the gaps in the body of knowledge, and this is important
in guiding whether the research should be exploratory or confirmatory in nature
(Novakowski & Wellar, 2008).
4.5.1.3 Research Design
When considering the research design, visualizing how the entire research process will
evolve and unfold helps in identifying gaps in the research process. For example,
visualizing the interview setting, the script in approaching the participants, the type of
questions to ask, the method of survey, the survey instrument whether to use electronic
97
forms or hard copy, the forms collection procedures, the data collation and the analysis,
and so on. While all these aspects need to be thought out, more importantly, they need to
be visualized so that the researcher can easily see and identify the areas that are missing
or need to be enhanced in the research design. When conducting surveys using the Delphi
Method for the first time, such details may be difficult to visualize, but with experience,
they become much easier.
4.5.1.4 Identify Potential Survey Participants
As previously mentioned, the research objectives and design will determine the type of
participants that should be invited or solicited to take part in the research. Some research
requires perspectives from the grass-roots, while others require a high level perspective.
Regardless of the participant’s level in the organizational hierarchy, it is the individual’s
knowledge, experience, and wisdom that should be the primary determinant in selecting
the survey participants in order to yield good quality information from the surveys. In the
SAGD research, the key criteria was that only those people who had worked on SAGD
projects would be invited to participate in the research. Another point for consideration is
the time, duration, schedule, and location of the research; this will determine the
availability of the survey participants. For example, if a study has a short schedule of one
month, it may be difficult to get participants such as CEOs of the Fortune 500 companies
to take part, due to their busy schedules. The researcher’s proximity to easily meet the
potential participants can also be a factor in selecting the participants. All these factors, if
well thought out, can assist the researcher in undertaking the survey with greater ease.

98
4.5.1.5 Develop Research Question
Some of the considerations mentioned in the previous section also help in developing the
survey question(s). For instance, the researcher needs to decide whether the survey
should have a single or multiple questions. When exploring an idea or a concept, a single
broad question is more suitable than multiple questions. On the other hand, if one is
trying to confirm a set of issues, observations, or forecasts, then a predefined series of
questions is desirable (Day & Bobeva, 2005). For the SAGD survey, the researcher used
a single question. This was because the literature review identified insufficient
information available on the topic. Therefore, a single broad question was thought to be
able to draw out a multitude of responses resulting in rich data. Regardless of whether
one has a single or multiple questions, the researcher should ensure that the there is
minimal confusion for the survey participants; therefore, there should be clear
instructions, simplicity in the format, and precision in the questions asked in the survey
(Day & Bobeva, 2005).
4.5.2 Survey Phase
4.5.2.1 Develop Round 1 Questionnaire
The Round 1 questions are generally based on the objectives of the research. Most
experts agree that the question(s) should be developed by a panel involved in the project.
The question could also be based on the researcher’s observation of the industry being
researched or on the ‘gap’ between the literature and the research problem (G. J.
Skumolski, et al., 2007). After the question has been developed, a survey template should
be developed. The template would ask the necessary demographic information together
99
with the survey question(s). Demographic information helps in identifying the
characteristics of the survey participants which can help in determining the richness and
the quality of the data collected. Instructions for the survey need to be developed together
with the survey collection procedures identified. Depending on the method of survey
used, that is, email, internet, or one-on-one, the survey forms need to be distributed to the
participants appropriately.
4.5.2.2 Trial Run
It is essential to do a trial run of the survey with approximately two to four individuals;
this exercise will very quickly determine any problems that may arise in completing the
survey. The trial-run “examines the viability and efficiency of the specific instrument and
the research plan before the full survey is launched, and evaluates whether the research
plan and instrument as designed are likely to be effective and efficient” (Novakowski &
Wellar, 2008, p. 1489). Sometimes, the trial-survey participants provide good
suggestions, which, together with the researcher’s observation, can be incorporated into
the final survey template.
4.5.2.3 Round 1 Delphi
This is where the survey part of the research actually begins. It involves sending out the
survey forms to the participants depending on the method of survey selected. With one-
on-one interviews, appointments are set up ahead of time and at a mutually convenient
location. One drawback of the Delphi Method is that the entire process requires more
time to complete; therefore, it is prudent to be aware and track of the amount of time
100
elapsing right from the beginning of Round 1. The benefit of tracking the time elapsed is
that measures can be incorporated to expedite the survey results if the researcher is
running behind schedule.
Generally, a single round of Delphi can take at least three weeks to complete
(Commission, 2006); Gordon’s experience suggests that regardless of the method of
surveying used, it takes weeks for the survey forms to be returned, and the average
response rate is usually between 40% to 75% (1994). Based on the researcher’s
experience, a better response rate can be achieved from conducting one-on-one surveys
especially if participants live in the same city or within close proximity.
4.5.2.4 Evaluate and Incorporate Feedback from Round 1
Upon receipt of the Round 1 surveys, the results are collated and documented. In
reviewing the survey results, it should be noted that some participants may not have
answered certain questions due to insufficient knowledge or experience, which is
acceptable. If the survey asks for quantitative answers, a spreadsheet can be effectively
used to tabulate the responses (see Appendix D). Qualitative or narrative responses to
surveys can also be summarized on a spreadsheet by categorizing them based on codes of
importance to the research. Codes can be defined as the emerging points, ideas, or
concepts that emerge when conducting a survey or interview of a qualitative nature. The
number of times a certain code is mentioned in the survey can be quantified and its
percentage relative to the total number of codes can be determined. Sorting the
percentages of each of the codes from the highest to the lowest will indicate the

101
importance of each code and can be used as a guide by the researcher in order to
determine the areas to focus on for subsequent rounds of surveying.
4.5.2.5 Mean, Mode or Median?
In quantifying the survey results, there are differing opinions on what measure of data
should be used. Some suggest taking the mode, since that measure suggests the largest
number for that responses or observations; it perhaps suggests the participant’s preferred
position on the response categories (Novakowski & Wellar, 2008). Others suggest taking
the mean value of all the total scores to arrive at the relative importance or level of the
question, while Gordon recommends taking the median because polarization of responses
can “pull” the average score in one end of the extreme, making the result unreasonable
(1994). While Gordon is correct that extreme answers can pull the mean unrealistically,
the researcher thinks that Gordon’s recommendation is probably based on a smaller
sample size. With larger sample sizes, for example, 30 or more participants, the
extremities can be neutralized, resulting in marginal impact to the aggregate mean.
4.5.2.6 Evaluate Survey Results
The purpose of evaluating Round 1 results (Novakowski & Wellar, 2008) is
i. To identify the unifying result of the responses to the survey question, which is
essentially identified by the mean or median (measures of central tendency)
ii. Based on the mean or median, to help evaluate the participant’s responses and
identify if they fall within the mean or median
102
iii. Identify areas or categories for rating for Round 2 if the Round 1 responses asked
were of a qualitative nature
iv. Determine the type of questions to ask in Round 2 of the survey
v. Incorporate the participants’ suggestions in subsequent rounds of survey
4.5.3 Round 2
4.5.3.1 Develop Round 2 Questionnaire
On the basis of Round 1 responses, the Round 2 survey is prepared. One of the objectives
of additional rounds of surveying is to narrow the range of participant’s responses in an
attempt to achieve convergence (Dalkey, 1969). In situations where responses that are
more than one interval away from the modal response, for example the mean, the
participant should be asked to specify the rationale for the position (Novakowski &
Wellar, 2008). In this round, the participants are asked to review their quantitative
response from the Round 1 and compare it with the average or aggregate mean of all the
responses. The review provides an opportunity to the participants if they wish to change
or reconsider their responses. In doing so, convergence of the survey results is achieved.
If the objective of Round 1 survey is to identify participants’ responses to a certain
problem or collect lessons learned in the case of this research, in Round 2, the objective is
to evaluate and rate these qualitative responses. Although the responses need to be
summarized for brevity and leading words need to be eliminated to reduce biases, care
should be taken to ensure that the meaning or essence of the participants’ statements do
not get changed unintentionally.

103
4.5.3.2 Lack of Convergence
In a personal communication, Turoff, Novakowski, and Weller make reference to specific
situations where there can be a lack of convergence. The fist case would be where the
participants’ responses or ratings are distributed equally, for example, along a five point
Likert Scale. In such a scenario, more information needs to be provided to the
respondents to reach an agreement. A second case would be where the scores coalesce
around the two extreme points of the scale, which are the lowest and the highest points.
To resolve such a scenario, a factor should be identified by talking to the participants in
order to analyze what is tipping the responses to either end of the scale (2008). Another
option to resolve this issue would be to use an even numbered Likert scale (Lavrakas,
2008)
According to Helmer, a lack of convergence is often the result of differences in the
participants’ level of knowledge regarding the subject matter, experiences, contexts, and
perception (1983). The researcher did notice such a tendency in some of the lower ranked
lessons learned in the SAGD research. Gordon, however, has a valid perspective
regarding convergence or a lack there of. He maintains that in recent times, the Delphi is
used as a systematic method of collecting and the blending experts’ opinions, stating “the
aggregate judgement representing a kind of expert composed, in the domain of interest,
of the expertise of all participants” (1994, p. 10). The objectives of obtaining an expert
opinion and identifying the most important lessons learned as well as the issues
emanating from it is the fundamental intention of this research on SAGD.
104
4.5.3.3 Trial Run
After preparing the Round 2 questionnaire, another trial run, as suggested in Round 1, is
recommended. Although the literature is not explicit about this, doing this step was
immensely useful to the researcher. This is particularly important if Round 1 consists of
qualitative or narrative responses and Round 2 involves rating the responses collected in
Round 1. This is because, in Round 2, the dynamics of the survey are somewhat altered,
given that the comprehensive responses of all the participants are now being presented in
this round of surveying. Therefore, a trial-run validates the objectives and assumptions
established for the research, and it also ensures that they are present in Round 2.
4.5.3.4 Round 2 Delphi
In this round of the survey, a different set of questions or responses from that of Round 1
are presented to the participants via the same methods used previously. If the Round 1
survey was a collection of narratives, then in Round 2, to achieve consistency of results,
these narratives should be rated by the same survey participants. The rating scale for the
responses can either be qualitative or quantitative. In this round, the participants are
asked to reconsider their responses from the previous round. They can choose to change
or keep the same responses. Finding out the reasons from the participants for maintaining
the same response(s) and not changing can be helpful during the analysis of the results.
4.5.3.5 Incorporate Feedback from Round 2
Results from Round 2 of the survey are collected and entered on a spreadsheet similar to
the one created in Round 1. The key objective of the results is to identify whether the

105
“stability” of the responses has been achieved. Stability occurs when there is little
movement on the aggregate score of the overall responses from all the participants and
between successive rounds of the Delphi survey (Chaffin & Telley, 1980). Based on this
definition, when the survey participants select the same responses with every successive
round, stability has been achieved (Novakowski & Wellar, 2008). In recommending a
numeric criteria for stability, Linstone suggests that changes of 15% or less can be
considered stable and could be used as threshold for discontinuing the survey from going
into further rounds (1978).
4.5.4 Round 3
Successive rounds of surveying can be done depending on the objective of the research –
whether to achieve stability or consensus; or, as in the case of this research, the objective
was to identify key areas or factors of importance that can be used in establishing a model
for SAGD projects. If three or more rounds of survey are required, the steps identified for
Round 2 identified in Table 4.3 should be repeated. However, with successive rounds of
survey, there is a general consensus among many writers that participants tend to become
less enthusiastic and unresponsive. Further rounds of surveying result in an increasing
number of drop-outs due to scheduling issues, thus most surveys are limited to two
rounds (Commission, 2006).
106
4.5.5 Conclusion Phase
4.5.5.1 Tabulate Results
Upon conclusion of the survey exercise, the final results are tabulated. Depending on the
type of data collected, they can be ranked based on numerical values of the forecasts,
areas of importance, key indicators, etc. In order to obtain appropriate results, findings
can be ranked from the highest to the lowest or vice versa; they can also be tabulated,
graphed, or clustered in an attempt to derive meaningful results.
4.5.5.2 Analysis of Final Results
An important aspect of collecting the data is to analyze it and view it from different
perspectives. Loading the data on spreadsheets or databases can help create queries from
which analysis and extrapolation of the results under different conditions or scenarios can
be done. Some categories, as in the case of the lessons learned collected in this research,
can be grouped together into broader groups to identify central themes emanating from
the research survey. Further analysis can be conducted on such groups of data.
4.5.5.3 Dissemination of Results
The Delphi Method of surveying is a participative one; both the researcher and the
participants are anxious to find out the results of each of the rounds. The participants are
eager to know the results because they want to see their opinions measure up in relation
to the other experts. It also allows the participants to test out some of their own ideas and
hypotheses, which increases their sense of ownership in the process (Novakowski &
107
Wellar, 2008). It is, therefore, a good practice for the researcher to share and disseminate
the final results with the participants.
4.6 The Delphi – A Controlled Debate
A final word on the Delphi based on a quote from Gordon:
In a sense, the Delphi method is a controlled debate. The reasons for extreme
opinions are made explicit, fed back coolly and without anger or rancour. More
often than not, expert’s groups move toward consensus; but even when this does
not occur, the reasons for disparate positions become crystal clear (1994, p. 3).
4.7 Summary
The Delphi Method is a very versatile surveying process, particularly in areas where the
problem is unknown and there is little clarity on the solutions. Forecasting is another area
where this method is significantly used, particularly by governments wanting to make
long term forecasts and projections about its population. It can equally be used to achieve
remarkable results when solving problems in the social sciences, business, and
engineering. Anonymity of the participants, iteration, controlled feedback, and statistical
group responses are the key pillars that underpin the Classical Delphi. This is conducted
in three major phases: the preparation phase, a survey phase, which includes two or more
rounds of surveys, and finally, the conclusion phase. The next chapter discusses the
application of the Delphi Method within the context of this research study.
108
Chapter 5: Application of Research Methodology
Chapter Overview
This chapter provides details on how the Delphi Method, described in the previous
chapter, was applied to conduct the research surveys. The chapter begins by highlighting
a list of research objectives and examining the important planning considerations a
researcher should undertake so as to achieve the study’s goals. Important elements of
research, such as the survey scope, researcher involvement, sample selection, data
collection process, and survey procedures, are also discussed. Dalkey’s (1969) rationale
regarding the effects of group size on the sample error rate is explained. In addition, the
intent and philosophy of the Delphi Round 1 and 2 survey questions are broken down
into several parts and explained. Chapter Five concludes by listing the various activities
and associated hours required of a Delphi survey which can also be useful information to
those thinking of using a Delphi survey for their research.
5.1 Research Objectives
The overarching objective of the research study was to identify the major areas of focus
in project management in order to build a model for the successful execution of a SAGD
project. This objective would be achieved by quantifying the lessons learned collected in
the survey based on the Delphi Method; the resulting rankings would indicate which
lessons are the most important. The high ranking lessons would become the areas of
major focus in building a model for SAGD projects. The Delphi Method of surveying
was used because its effectiveness at identifying the areas of focus in an undocumented

109
subject matter (G. J. Skumolski, et al., 2007). The specific objectives of the research
study were to:
i. conduct a two to three round survey using the Delphi Method
ii. collect lessons learned from industry professionals who had worked or were
currently working on SAGD projects in Alberta
iii. establish the context by identifying the reasons why they are lessons learned
iv. identify solutions and recommendations that would lead to the successful
execution of SAGD projects
v. create a model for the successful execution of SAGD projects based on the
essential lessons learned collected from the survey
5.2 Planning the Research Study
In planning the research study, considerable thought was given regarding the questions to
be asked and their rationale for Round 1 of the survey. These considerations included:
i. How many questions should be included in the survey?
For the SAGD survey, since there were no pre-conceived opinions, information,
or ideas that the researcher was trying to validate, the Round 1 survey was kept to
a single question. The objective was simply to collect lessons learned from the
participants which would then form the basis for Round 2 of the survey.
110
ii. Should the survey question be narrow or broad?
The scope of the survey question would have an impact on the range of responses
from the participants, such as simple yes or no answer to the more open ended
responses. For this survey, the researcher’s objective was to tap into the
participants’ knowledge and experiences (G. J. Skumolski, et al., 2007); therefore,
a broader question was much more desirable since it would allow for the
collection of more data.
iii. Would the survey question be able to draw out an adequate response and
obtain useful data from the participants?
The objective was to make the participants think more broadly, specifically, to
consider the question not just from their own respective disciplines, but also from
other disciplines which they had observed or experienced in previous projects.
iv. Would all the survey participants be able to understand the survey question
and be able to respond to it?
At times, a poorly worded question can confuse the participant, resulting in
collection of poor quality data; hence, it is critical to clearly define the question
(Commission, 2006). Besides, the researcher has one opportunity to conduct the
survey and it would be wise not to squander it due to poorly worded question(s).
v. Would all the respondents be able to derive the same meaning when they
read the survey question?
The survey participants identified for the survey were from different backgrounds
in terms of their position in the EPC and owner organizations, their knowledge,
111
experience, education, language, vocation, etc. Thus, it was important to ensure
that all the participants derive the same meaning when reading the question.
vi. Would the survey question be within the participants’ range of knowledge
base and experiences so as to be able to respond to it?
This was perhaps the most important point to consider in the planning phase. An
important condition for participating in the survey was to have worked on a
SAGD project; this would enable the participant to convey their experience and
knowledge of SAGD projects. This was achieved by pre-screening the
participants prior to the survey by asking a simple question to ensure that they met
the established criteria.
To validate this point, a situation occurred during Round 1 of the survey where
one of the participants mentioned in the middle of the interview that she didn’t
think she was the right candidate to speak to, despite the fact that the researcher
had pre-screened her and confirmed that she had worked on a SAGD project! It
turned out that she had worked on a SAGD project on an intermittent basis, and
therefore, did not feel to be qualified enough to respond to the question.
Eventually, the interview was discontinued, and the results were not included in
the survey. This example shows the importance of exposure to appropriate
knowledge and experience to be able to participate in the surveys which in turn
ensures that the data collected is of high quality.

112
Other questions that were considered during the survey pre-planning included:
• How will the Delphi survey process be managed?
• What type and how many participants should be invited to partake in the survey?
• What kind of results could one expect from the survey?
• What sort of analysis would be required from the data?
• How will the results be implemented or used (Cuhls, et al., 1995)?
5.3 Scope of Study
The scope of the study was to interview people who had worked in engineering,
procurement, and construction areas of SAGD projects. The goal was to obtain their
experiences in the form of lessons learned that could be used to develop a model that
would lead to the successful execution of SAGD projects in the future. Included in the
scope was a review of all engineering phases, such as DBM, EDS, and Detailed
Engineering. In most projects, EPC and the owner teams’ scope end at mechanical
completion; therefore, the next phase of commissioning and start-up, which is normally
the plant operations group’s responsibility, was not included in the scope of this study.
In addition, testing of the model developed from this study was not included in the scope.
Since the EPC activities for completing a SAGD project take more than five years,
testing the model would not be feasible within the time constraints of this study.
113
5.4 Researcher Involvement
In conducting a research study, the researcher can be involved in a couple of ways - he or
she can either be actively or passively engaged in the survey, particularly during the
interviewing process. From the researcher’s perspective, being passively involved would
mean using a medium for surveys, such as the internet or email that has minimal interface
with the researcher. On the other hand, being actively involved would require personally
conducting the surveys by interviewing the participants. For this researcher, it was a
conscious decision to be actively involved in the survey interviews. There were several
reasons for this decision, which include:
• The Delphi Method of surveying requires the researcher to conduct an initial
interview with the participants individually to get their views on the topic being
researched and to test the questionnaire (G. J. Skumolski, et al., 2007). From this
researcher’s previous experience in conducting surveys, by actively participating
in the study, the researcher is able to learn more about the topic. In addition,
during the interviews, if the participant is not clear about certain aspects, the
interviewer can prod the participant so as to obtain a better explanation with
greater detail. This helps in getting better quality data that is rich and thick with
information.
• In addition, by actively participating in the survey, the researcher also gets to
understand and appreciate the nuances of the area of research, such as the tools,
terminology, interconnectedness of the various subject elements, and so on; such
understanding would be difficult to experience if the surveys were being done
remotely.
114
• Finally, with one-on-one surveys, the researcher gets the opportunity to confirm
certain ideas emanating in the surveys by cross-checking with other participants if
they had experienced something similar.
The researcher felt comfortable conducting the interviews and was successful in
interacting with specialists in the industry because of his background, which includes
having studied project management at the graduate degree level, having substantial
experience working in the Project Controls area in the EPC industry, both at the
construction site and at the engineering contractors home office, as well as having
worked for owner and contractor companies. This work experience has provided the
researcher with the knowledge of the various engineering disciplines, procurement, and
construction areas, and the researcher was, therefore, able to probe the participants for
appropriate detail in their responses during the interviews.
However, as a researcher, one has to be cautious when using this approach of being
actively engaged in the interviews. This is because, being so attached to the research
topic it is sometimes difficult to always have an open mind. In addition, it is easy for the
researcher’s preconceived ideas to inadvertently slip into the participant responses.
Therefore, the researcher has to remain an impartial facilitator and ensure that
participants are not guided by leading questions or responses. Otherwise, this introduces
an element of bias into the research (Day & Bobeva, 2005).
115
With the numerous surveying tools available on the Internet today, some Delphi surveys
are conducted online or via email in order to save time. However, using online tools and
the resulting expediency does not guarantee a high response rate. In this SAGD survey,
by being actively engaged in the surveying and interviewing process, the participant
response rate for both rounds was 100%. Also, the initial planned sample size, as
suggested by Dalkey, was 30 participants (1969). However, by personally approaching
the participants who were known to the researcher and phoning them to set-up
appointments, a total of 37 people, 7 more than the 30 initially planned, confirmed their
participation. Therefore, from this researcher’s perspective, if one feels comfortable, it is
much better to be actively involved in the survey process in order to obtain a higher
participation rate which results in an enhanced quality of data, and a better understanding
of the subject matter.
5.5 Trial Run
This is an essential element of surveying, and it is especially recommended for the Delphi
method because it helps to identify and resolve inconsistencies and vagueness in the
survey instrument and its subsequent reporting (Novakowski & Wellar, 2008). The trial
run is essentially conducting a pilot of the survey; testing out the survey with a few
individuals to observe their reactions to the questions, how they perceive and answer
them, how easy or difficult is it to do the survey, and the participants’ comments about
the survey questions. All this information helps in tweaking or adjusting the survey if
required and removing the “bugs” in an attempt to get better data. The revised survey
instrument usually results in a much better product than the previous versions.

116
In the SAGD Delphi survey, three participants were asked to do the preliminary version
of the survey. Subsequently, based on the participant’s feedback, minor changes were
made to the survey form (see Appendix F).
5.6 Survey Methodology and Procedure
One important characteristic of the Delphi Method is that it is not a rigid method, and
therefore, it provides great flexibility in designing the survey. This flexibility is
important, particularly when the researcher is entering into an uncharted territory, where
there is not much information available in the literature and the objective of the survey is
to extract as much knowledge and experience from the participants as possible.
In this study, a two to three round Delphi was initially contemplated. However, in the
first round, instead of providing a set of issues or views to the participants to evaluate,
which is usually the case, the participants were asked for their lessons learned of having
worked on SAGD projects. The lessons learned collected in Round 1were then the basis
for the participants to rank in subsequent rounds. In other words, the initial data for the
survey essentially came from the participants themselves, rather than the researcher
providing them with the factors, solutions, or lessons learned to rank. This flexibility
element of the Delphi Method is particularly helpful in cases where the available
knowledge has not been well documented or published in the public realm, which was the
situation in the SAGD study.

117
5.7 Participant Selection
Since the initial question in Round 1 was designed to be broad, which covered the
engineering, procurement, and construction aspects of SAGD projects, the researcher
thought that the expertise of the participants that would be involved in the survey should
also be broad enough in order to have a wider representation from all of the EPC areas
and disciplines. By having a broader group of participants, the knowledge base of the
study becomes much wider and deeper. This is the beauty of the Delphi Method in the
ability to get more meaningful responses to survey questions. On the other hand, Dalkey
questions the extent or degree of knowledge an expert would have regarding a certain
subject matter (1969) – thus making it an uncontrollable variable. According to Adler
and Ziglio, there are essentially four qualities that define a participant’s expertise (1996):
i. Knowledge and experience with issues under consideration
ii. Capacity and willingness to participate
iii. Sufficient time to participate
iv. Effective communication skills
5.7.1 Purposive Selection
Purposive selection or criterion based sampling was used, with specific emphasis on
selecting individuals who had worked on SAGD projects. This was achieved by
identifying some of the participants who were known to the researcher, having worked
previously together on SAGD projects, and others through referrals and contacts in the
EPC industry. To ensure that the survey provided rich data, effort was made to select
118
individuals who had or were currently working in lead positions or higher in the
hierarchy of the project organization. The implication of selecting participants from
higher level positions is that the survey participants had a great deal of knowledge and
experience of their field, and therefore, offered a better chance of obtaining good quality
of data. Another consideration was to strive for appropriate representation in terms of
numbers from each of the major areas in a SAGD project organization, that is, from
engineering, procurement, construction, project management, and project support. See
Chapter 6 for demographics of the survey participants.
5.8 Sample Size
As mentioned earlier, a total of 37 people participated in the study. The initial goal was to
have 30 participants because, as the sample size surpasses 30, the error rate decreases
significantly (Dalkey, 1969). Figure 5.1. shows that as the number of participants in a
Delphi survey increases, the error rate rapidly decreases. The graph also shows that the
optimum size of participants in a Delphi survey is between fifteen to seventeen, at which
point, the average group error is only 0.5 and continues to decrease with additional
participants, albeit less rapidly.
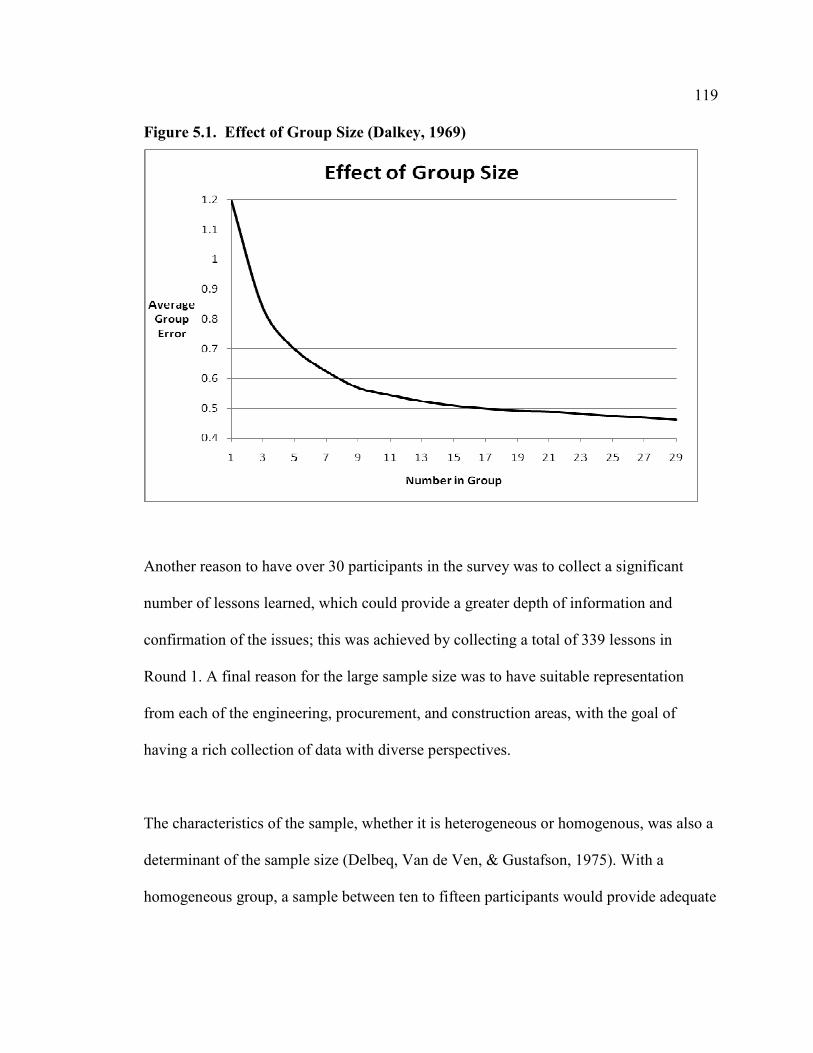
119
Figure 5.1. Effect of Group Size (Dalkey, 1969)
Another reason to have over 30 participants in the survey was to collect a significant
number of lessons learned, which could provide a greater depth of information and
confirmation of the issues; this was achieved by collecting a total of 339 lessons in
Round 1. A final reason for the large sample size was to have suitable representation
from each of the engineering, procurement, and construction areas, with the goal of
having a rich collection of data with diverse perspectives.
The characteristics of the sample, whether it is heterogeneous or homogenous, was also a
determinant of the sample size (Delbeq, Van de Ven, & Gustafson, 1975). With a
homogeneous group, a sample between ten to fifteen participants would provide adequate

120
results. In this SAGD survey, the sample can be considered homogeneous because all the
participants are from the same industry and have worked on SAGD projects.
5.9 Data Collection Process
The researcher contacted the survey participants either in person or by telephone to invite
them for the survey. The research objectives, topic, methodology, and time requirement
were explained to the potential participants before they were asked if they would agree to
participate in the survey. If they agreed, a half-hour appointment was setup for a one-on-
one interview. In most cases, the surveys were conducted at the participants’ places of
work in order to not intrude on their schedule and to get their full attention to complete
the survey. Due to the close proximity of the researcher to the participants, personal
interviews were thought to be the best alternative rather than telephone, on-line, or email.
However, one interview over the telephone had to be conducted because the participant
had travel plans during the survey period.
As a result of the thick and rich details compiled by the researcher, the one-on-one
interviews appeared to be a good choice in the data collection process. Gordon, highly
experienced in using the Delphi method, recommends that the one-on-one interviews are
an excellent way of collecting ideas because of the flexibility in probing the research
participants, identify biases, or even following up on some suggestions by the
participants; these opportunities are usually absent in a strictly questionnaire process
(1994).
121
5.10 Round 1 Surveys
At the beginning of the survey interview in Round 1, the participants were given a formal
explanation of the survey objectives and methodology as well as the expectations of
them. If the participants had any questions regarding the survey, they were explained
with the best available information. In most cases, the participants seem to have well
understood the instructions and there were not many questions.
Before beginning the interview, an Informed Consent form (see Appendix C) was
reviewed with the participants. The form identified the purpose, goals, and objectives of
the survey, including assurance relating to anonymity of participation, data
confidentiality, and participant rights. If the participant was satisfied, their signature was
obtained indicating their agreement to participate and then the interview commenced.
In addition, in order to establish the participant’s credentials, demographic information,
such as name, company employed at, contact information, number of years experience in
EPC industry, names of SAGD projects worked on, and the participant’s role in the
project within engineering, procurement, construction, project management, and project
support areas, was also collected. Also noted was whether the participant worked for an
owner or EPC contractor organization. Participants from engineering, procurement, and
project support areas were also asked to specify their disciplines within those groups.
A special form (instrument) had been designed for Round 1 of the survey (see Appendix
F). The form, in addition to having space for marking the demographic information, had
122
three major column headings, namely, Lesson Learned, Why Lesson Learned, and
Solution. The three-page form also had lines on it to make it easier to take notes during
the interviews with the participants.
5.11 Round 1 Survey Question
As explained in Chapter Four, the Research Methodology section, the survey participants
were asked a single question in Round 1, which is “From a project management
perspective, what are the lessons learned for improving the Engineering,
Procurement, and Construction execution of SAGD projects?”
The intent of this question was to establish a framework for the subsequent rounds of the
survey. This question had important underpinnings in ensuring that appropriate lessons
learned are obtained from the participants; if this was not achieved, then it could have an
impact on rating the lessons learned in Round 2.
5.12 Basis and Philosophy of Round 1 Survey Question
In order to define, analyze, and appreciate the underpinnings, the Round 1 survey
question is broken down here into different parts for discussion purposes. The intent of
the qualifier in the first few words of the question, “From a project management
perspective” was to inform the participants from which angle or point of view should the
question be answered from. The objective was to get the participants focussed on project
management. In addition, the topic of the thesis is “Effective Project Management of Oil
& Gas Projects”. Therefore, the researcher thought that it was fundamental to identify at
the outset from which perspective should the question be answered from. It is interesting
123
to note that during the first round of survey interviews, a few participants had to be
reminded of this perspective, especially when it seemed as though the participants were
having difficulty coming up with lessons learned. However, when reminded that the
lessons learned should be from a project management perspective, it then seemed easier
for the participants to respond. Needless to say, there were a couple of responses where
the participants discussed technical aspects of engineering. Such responses were not
included in the survey.
The survey question continues by asking “what are the lessons learned”. The first
objective here was to find out from the participants, through their experiences working on
SAGD projects, which situations or events they would have handled differently because it
did not work or would repeat because of their successes. This is also the definition of the
lessons learned for the survey. It is also the definition with which the participants are
familiar because it is the one that is used during lessons learned sessions on EPC projects.
The primary objective of Round 1 of the survey was to collect lessons learned and have
them ranked in Round 2 for its impact on the successful execution of SAGD projects. If
the lesson was an important one, which creates a high impact on successful execution,
then it would theoretically be ranked higher in Round 2, demonstrating to the researcher
that this is a key area to be improved.
The verb “improving” in the question is seeking suggestions from the survey
participants. Here, the survey question is going a step further by asking the participants
for a solution to the lesson learned. Usually, people who run into a frequent situation or
124
problem have also found solutions to them; therefore, instead of the researcher providing
solutions to the participants, the idea was to find out solutions from the specialists
themselves. In doing this, the solutions recommended have greater credibility.
Continuing with the question, the purpose of stating “Engineering, Procurement, and
Construction”, is to identify the scope of areas for which the question is asked and limits
it to the three predominant execution areas of SAGD projects. This implies that
Commissioning & Start-up and Operations phases are excluded from the question.
The tail end of the question “execution of a SAGD project” again limits the scope of
survey to the execution phase of a project. Therefore, the initial phases of a SAGD
project, namely, Project Feasibility and Business Planning, are excluded from the
question and therefore, the research itself. “SAGD” is made specific so that the
participants rate their experiences or lessons learned in relation to SAGD projects.
5.13 Conducting Round 1 Delphi Survey
Upon arrival at each participant’s office and after a brief review of the survey was
presented, the researcher went though the Informed Consent form. After which, the
demographic information was collected. The survey question was later read out and
explained to each participant to ensure the proper understanding. Following that, the
participant was asked to talk about his/her lessons learned on SAGD projects while the
researcher took notes. One may wonder why the participant interviews were not recorded
on an electronic device, given that this would have been much easier than transcribing.
125
The reason is that during the trial run, one of the participants did not feel comfortable for
the interview to be recorded and requested that it should not to be used. Therefore, the
researcher thought that recording interviews on a device would be a sensitive issue for the
other participants as well and could be an impediment to conducting and completing the
surveys. As a result, the researcher decided not to record any interviews and instead
depended on the written notes taken during the interviews. The benefit of this decision
was that the participants talked freely resulting in, from the researcher’s opinion, better
quality of data.
During the half an hour interviews, most participants were able to discuss an average of
three to five lessons learned with adequate detail. Using the researcher’s experience of
the EPC industry, the participants were probed to provide better explanations if their
responses seemed too brief or did not generate sufficient detail. The researcher was
careful not to make any leading statements that would bias the survey and the data
collected. The interview session ended upon a point of saturation and once the participant
had completed discussing all of the lessons learned. Although the interviews were done at
a comfortable pace, the researcher was also mindful of the time and would signal to end
the interview if it persisted longer than the requested time of 30 minutes.
5.14 Data Codification
After all the participants were interviewed, the lessons learned were coded based on
different topics in order to identify areas of significance to the research. To prepare for
the Round 2 survey, individual lessons learned were composed into single line statements
126
to make them brief and easy to read and to remove any emotional content in the
statements (Novakowski & Wellar, 2008). Leading words or phrases were also removed
so as to make the statements neutral. Duplicate lessons learned mentioned by more than
one person were not included, as they had already been captured.
5.15 Round 2 Research Instrument
The 339 lesson learned collected from Round 1 were edited and compiled into 92 single-
line statements. These were then included in another survey instrument specifically
designed for designed for Round 2 (see Appendix G). On this form, the lessons learned
were grouped and arranged alphabetically by area in order not to suggest any preference
or priority of a particular lesson learned over another. The objective of this round was to
have the participants rank the lessons learned. To facilitate the rating of the lesson
learned, beside every lesson learned statement, there were numbers from 1 to 10 on a
Likert Scale, 1 representing the Least Impact and 10 representing Great Impact (refer to
Section 6.6.2. for the rationale of using a 10-point Likert scale).
5.16 Conducting Round 2 Delphi Survey
In Round 2, the participants were read out the following statement (instead of a question)
“Rate the impact of each of the Lessons Learned on – successful execution of SAGD
projects”. The participants were given the survey form to rate their responses and circle
one of the numbers from 1 to 10 on what they felt the impact was of a certain lesson
learned on the successful execution of a SAGD project. If the participant had no
knowledge of a certain lesson learned, they could choose not to respond. The participants
127
were informed that the impact of a certain lesson learned could be positive or negative.
Therefore, if in their judgement, the lesson learned had a negative impact on execution,
the participants could indicate a negative sign beside the respective lesson learned.
During the second round of the survey, the researcher was also present with all the
participants in order to provide the context of the lesson learned statements and to offer
the participants any explanations or clarifications they required. The researcher’s
presence proved to be very useful; it helped the Round 2 survey participants align their
thinking with the Round 1 survey participants, who had originally suggested the lesson
learned and were therefore able to rate it with more accuracy.
5.17 Data Management
Like other survey methodologies, data management in the Delphi Method is very critical
to the surveying process. This can include maintaining a current list of interviewed
survey participants and those waiting to be interviewed, collection of the reviewed copies
of the lessons learned, electronic files of survey results of individual rounds, and
maintenance of the Round 2 Rankings spreadsheet and other systems. Therefore, being
organized and in control over the surveying process was essential and proved to be very
useful. Such well organized practices bring a methodological rigor, providing an audit
trail and credibility to the survey process (Rodgers & Cowles, 1993; Sadleowski, 1986).

128
Figure 5.2. The Delphi Process from Round 1 to Round 2
Round 1 Delphi Survey
Collected Lessons Learned During Interviews
Summarized Lessons into Single Line Statements
Round 2 Delphi Survey
Participants Rated Summarized Lessons Learned
Calculated Mean Rating of Each Lesson Learned
Ranked Impact of Lessons Learned on SAGD Projects - from Highest to Lowest
Every day, upon completion of a survey or a group of surveys, the participant rankings of
the responses to each of the lessons learned were individually entered on a large
spreadsheet (see Appendix D). The last column of the spreadsheet provides the mean
ranking for each of the lesson learned using a formula which adds the ranking (number)
of each of the participant responses for the lesson learned divided by the number of
participants responding to that particular lesson learned. It is good practice to enter the
ratings on the spreadsheet as the surveys are completed, rather than entering them at the
end of the survey period in a single sitting. Entering results daily enables the researcher to
see how the mean rankings are moving or shifting, which helps in determining if a
129
consensus is being built in the data. Besides, this ensures that the researcher will not be
inundated with a lot of work at the end of the survey period.
5.18 Round 3 Delphi Survey
After all the 37 Round 2 surveys were completed, the data, especially the mean of the
individual lesson learned, seemed to be converging and stabilizing visually on the survey
response tracking sheet and the data did not appear scattered. Although initially 2 to 3
rounds of surveying were contemplated, after Round 2, the researcher decided to forgo
the third round. There were several reasons for this decision.
Firstly, there was enough convergence taking place in the rankings in Round 2; after
entering approximately 25 survey responses on to the spreadsheet, the mean of all the
individual responses changed only marginally. Secondly, through a visual check of the
rankings, responses to the individual lesson learned seemed to be clustered and close to
the average ranking. Thirdly, further rounds of surveying could have interfered with the
participants’ work, given that it would require more of their time commitment. Finally,
the objective was not as much to achieve an absolute consensus of the rankings, but
rather, to get a sense of the important factors contributing to the successful execution of
SAGD projects. Skumolski, et al. suggests that it is acceptable to conduct less than three
rounds of surveying if the sample is homogeneous, which it was in this case, and the
objective of the survey is for discovery purposes (2007).

130
Upon the completion of the Round 2 surveys, the mean rankings of each of the lessons
learned were sorted by arranging them in descending order, from the highest to the lowest
(see Appendix B). The rankings were then analyzed individually and by area such as
engineering, project management and so on in an attempt to establish meaningful
conclusions from the data collected.
5.19 Time Required for Delphi Surveys
A disadvantage of the Delphi Method is that it takes much longer than other methods
because it requires two or more rounds of surveying. Moreover, additional time is
required to analyze the data collected in each round and in order to prepare another
survey instrument for the following round. In this survey, there were two rounds, and
therefore, two separate types of survey forms had to be designed and prepared; the survey
interviews with each participant were done twice; consequently, the data and results had
to be reviewed and analysed twice as well. On the flip side, from this researcher’s
experience, the Delphi survey is a much better methodology particularly in this case due
to the quality of data collected and the ability to rank it, which ultimately gives higher
confidence to the survey results. Table 5.1. shows the major activities involved in doing
this Delphi survey and the approximate time it took to carry them out.

131
Table 5.1. Major Activities Required in Undertaking Delphi Survey
Survey Activity
Number of
Hours
% of Total
Hours
Designing Survey Round 1Form 10 4%
Contacting & Enlisting Participants 10 4%
Conducting Round 1 Interviews 35 14%
Transcribing Round 1 Interviews 50 20%
Codifying Round 1 Lessons Learned 40 16%
Designing Round 2 Survey Form 20 8%
Conducting Round 2 Interviews 25 10%
Entering Round 2 Results on Spreadsheet 10 4%
Data Analysis 20 8%
Write-up Results & Findings 30 12%
Total Time (Hours) 250 100%
It should be mentioned that the surveying activity started in October 2009 and was
completed mid-December 2009. Thus, it, took almost three months to finish all the
surveying activities - from planning to designing the instrument, conducting the two
rounds of surveys, documenting the interviews, codifying, and reporting the results.
Figure 5.3. Time Required for Delphi Surveys
132
Although surveys using the Delphi Method take longer, depending on the method used to
survey the participants, it also indicates of the amount of time spent in the field with the
participants. For example, in this SAGD survey, close to 80 hours, or 30% of the time,
was spent with the participants, interviewing them one-on-one and later through informal
discussions. This significant amount of time spent with the participants in their natural
surroundings is, as mentioned in Chapter 3, an approach to verify the sample’s validity in
terms of trustworthiness and dependability of the data collected.
5.20 Summary
In undertaking a survey using the Delphi Method, it is important for the researcher to be
actively involved in the entire process, particularly during the interviews with the
participants. This helps the researcher in enhancing his/her knowledge of the topic
including the nuances, terminology, and interconnectedness of the various elements of
the study. From a statistical perspective, various experts on the Delphi Method have
suggested having at least eight survey participants. Dalkey suggests that with 30 or more
participants, the average group error rate drops significantly. This is one of the reasons
why the researcher aimed to have at least 30 survey participants for this study. In terms of
time, close to 34% of the hours were spent doing Round 1 interviews and transcribing
them; codifying the lessons learned from these interviews took another 16% of the total
hours spent. Overall, 50% of the 250 survey hours were spent in Round 1, which is due to
the careful planning and execution required in this round. Failure to be vigilant can result
in the undesirable deficiencies creeping into subsequent rounds of the survey. The next
chapter provides the results of the Round 1 & 2 surveys.

133
Chapter 6: Results of Delphi Survey Rounds 1 and 2
Chapter Overview
This chapter presents the results of the Round 1 & 2 Delphi surveys. It begins with a
presentation of the demographics of the survey participants and its representation using
pie-charts. Next, the lessons learned collected from the Round 1 interviews are presented
together with a table identifying the major thematic areas emanating from it. Overall
survey results of Round 2 , where the lessons learned collected in Round 1 were rated
based on their impact on successful execution of SAGD projects, are presented next. This
is followed by a brief discussion on some of the definitions of the data. Interesting results
are encountered when the overall data is segregated between project management and
engineering areas. The objective of the comparing the two areas was to identify whether
there were significant differences between the ratings of the two groups, which was
accomplished by comparing their level of alignment. The chapter concludes with a
presentation of the survey results grouped by major thematic areas in order to facilitate
the discussion and analysis of the data in Chapter Seven.
6.1 Survey Participants’ Demographics
Prior to conducting the interview, each participant’s demographic information, such as
area of specialization, age bracket, number of years of experience, education, etc., was
collected on the survey form. The objective of collecting the demographic information is
to help understand the characteristics of the survey participants, which can determine the
quality of the data collected as well as the reliability of the results. It is not being

134
suggested here that there is a direct relationship between participants and the survey
results. Much rather, the objective is to demonstrate that a wide range of experts was
available to the researcher. The availability of experts for the survey can prove to be a
great opportunity for tapping into their knowledge, experience, and wisdom; the
perspectives of these individuals establishes the strength and richness of the research
study, providing credibility to the data collected and to the study as a whole. The sections
below discuss the survey participant’s demographic information.
6.1.1 Survey Participant’s Area of Specialization
The survey included participants from Project Management, Engineering, Procurement,
Construction, and Project Support areas. As pointed out earlier, immense effort was
placed so as to ensure that there was an appropriate representation of participants from
each of the discipline areas that are typical in a SAGD project’s execution team. Most of
the survey participants were in middle to senior level positions in their respective
disciplines, such as discipline leads, managers, and directors. Table 6.1. shows the
number and percentage of participants from each area that took part in the survey. The
data reveals that the sample size of the engineering participants is 51% of the total
sample, which is larger than participants from other areas. The reason for this is because
in oil & gas and typical SAGD projects, the number of engineers relative to the total
number of members from other disciplines is much higher. The large sample size of
engineers in the survey is therefore reflective of their proportion on a real project
organization.
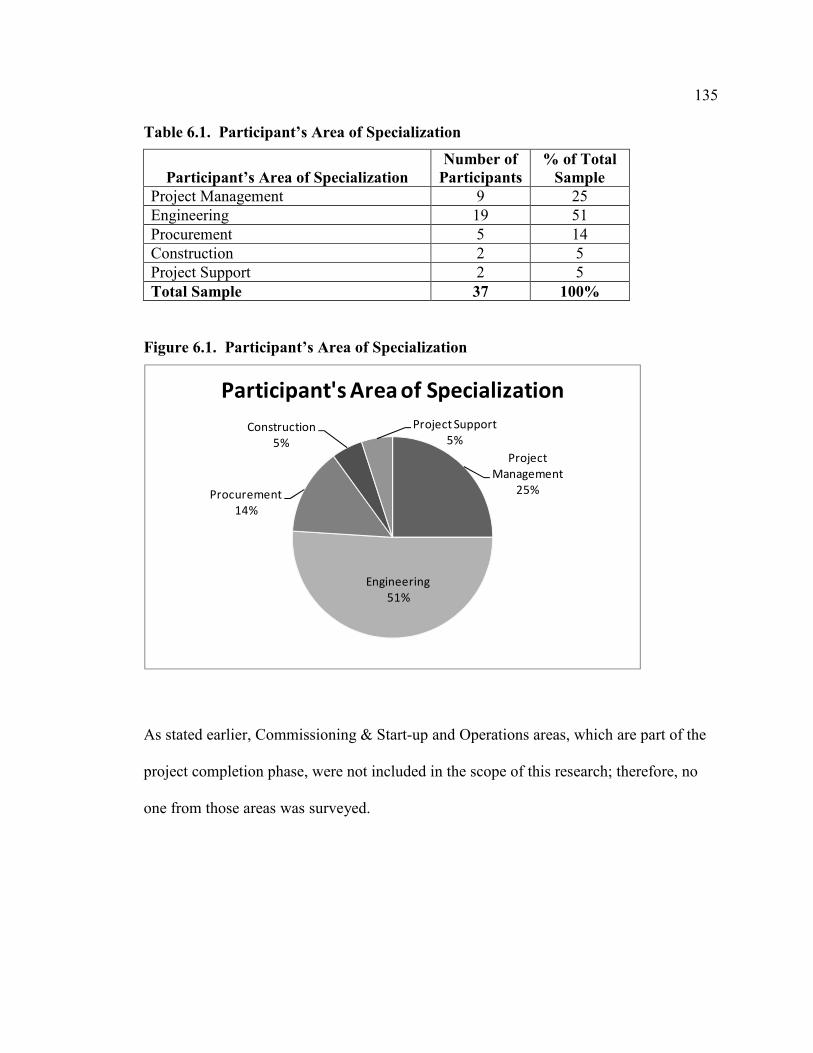
135
Table 6.1. Participant’s Area of Specialization
Participant’s Area of Specialization
Number of
Participants
% of Total
Sample
Project Management 9 25
Engineering 19 51
Procurement 5 14
Construction 2 5
Project Support 2 5
Total Sample 37 100%
Figure 6.1. Participant’s Area of Specialization
Project
Management
25%
Engineering
51%
Procurement
14%
Construction
5%
Project Support
5%
Participant's Area of Specialization
As stated earlier, Commissioning & Start-up and Operations areas, which are part of the
project completion phase, were not included in the scope of this research; therefore, no
one from those areas was surveyed.

136
6.1.2 Engineering Participant’s Discipline
Within the Engineering area, the same philosophy mentioned in Section 6.1.1 was
applied, that is, to have participants in the survey from each of the six major engineering
disciplines including process, piping, mechanical, civil/structural, electrical, and
instrument & control systems (I & C); this was necessary so that the data collected is
reflective of a typical SAGD project. An attempt was made to have at least two
participants from each of the engineering disciplines in order to get a well rounded
opinion from each group. This objective was achieved for all the disciplines except for
the I & C discipline, which had only one participant. Effort was made to get at least two
participants from this discipline, but due to scheduling issues this was not possible.
In Table 6.2., Engineering Management and Project Engineering disciplines are included
in the engineering area because they are an integral part of an engineering organization
on SAGD projects.
Table 6.2. Engineering Participant’s Discipline
Engineering Participant’s Discipline
Number of
Participants
% of Total
Sample
Process 4 21
Mechanical 2 10
Piping 2 10
Civil/Structural 3 16
Electrical 2 11
Instrument & Control Systems 1 5
Project Engineering 2 11
Engineering Management 3 16
Total Engineering Sample 19 100%
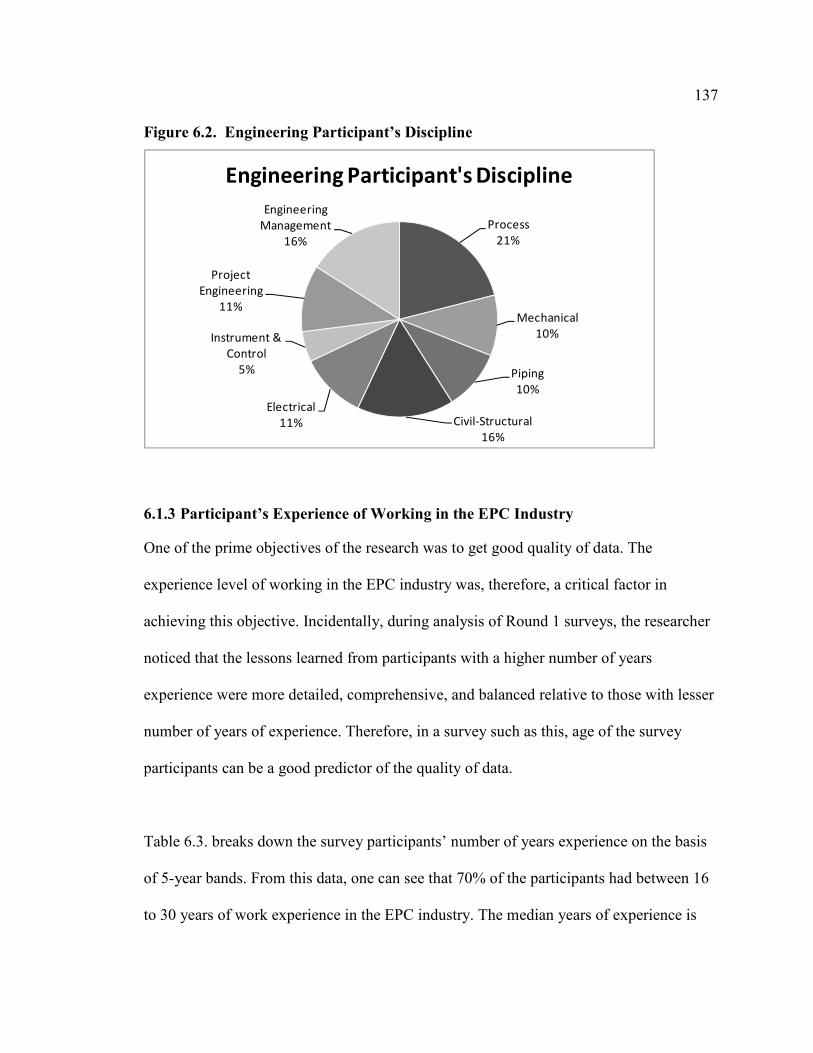
137
Figure 6.2. Engineering Participant’s Discipline
Process
21%
Mechanical
10%
Piping
10%
Civil-Structural
16%
Electrical
11%
Instrument &
Control
5%
Project
Engineering
11%
Engineering
Management
16%
Engineering Participant's Discipline
6.1.3 Participant’s Experience of Working in the EPC Industry
One of the prime objectives of the research was to get good quality of data. The
experience level of working in the EPC industry was, therefore, a critical factor in
achieving this objective. Incidentally, during analysis of Round 1 surveys, the researcher
noticed that the lessons learned from participants with a higher number of years
experience were more detailed, comprehensive, and balanced relative to those with lesser
number of years of experience. Therefore, in a survey such as this, age of the survey
participants can be a good predictor of the quality of data.
Table 6.3. breaks down the survey participants’ number of years experience on the basis
of 5-year bands. From this data, one can see that 70% of the participants had between 16
to 30 years of work experience in the EPC industry. The median years of experience is

138
between 21 to 25 years, and the participants mean or average experience of the EPC
industry is 23.5 years. This high number of years of work experience, from the
researcher’s perspective, is indicative of collecting good quality of data for both rounds
of the survey.
Table 6.3. Number of Years Experience of EPC Industry
Number of Years
Experience in EPC Industry
Number of
Participants
% of Total
Participants
0 - 5 0 0
6 - 10 1 3
11 - 15 5 14
16 - 20 8 22
21 - 25 12 32
26 - 30 6 16
30 + 5 13
Total Sample 37 100%
Figure 6.3. Experience of EPC Industry
0
3
14
22
32
16
13
0
5
10
15
20
25
30
35
0 - 5 6 - 10 11 - 15 16 - 20 21 - 25 26 - 30 30+
Pe
rce
nt
Number of Years
Experience in EPC Industry
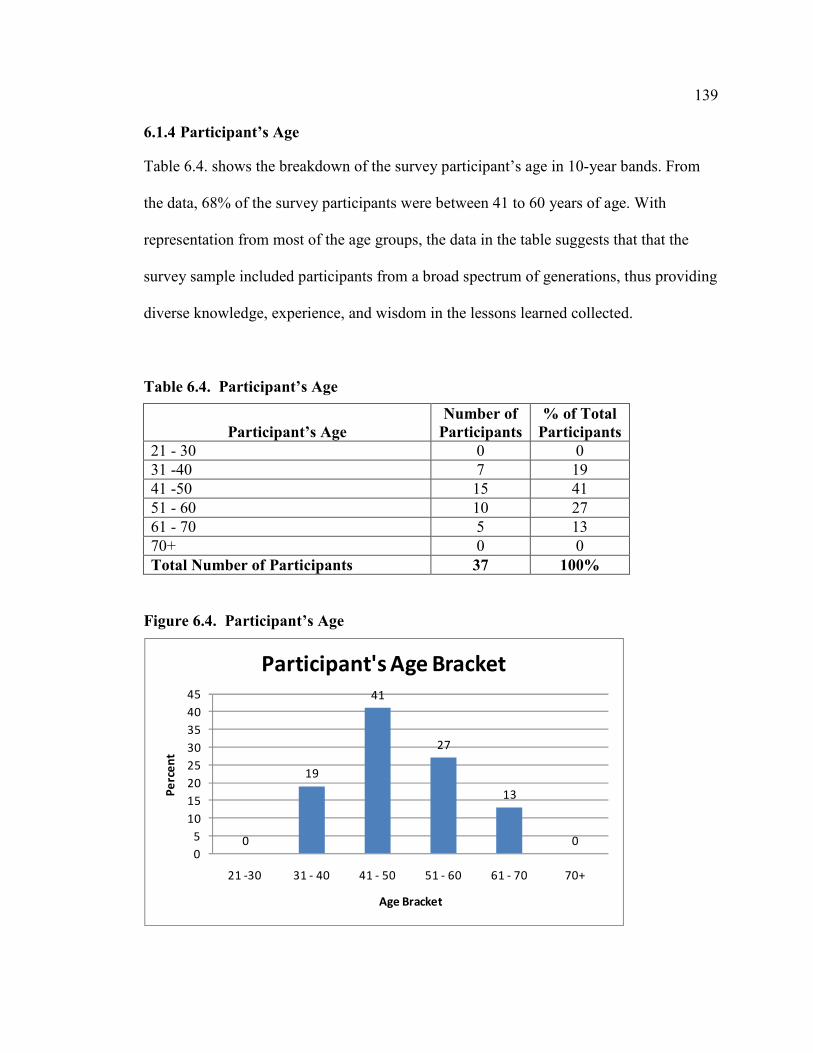
139
6.1.4 Participant’s Age
Table 6.4. shows the breakdown of the survey participant’s age in 10-year bands. From
the data, 68% of the survey participants were between 41 to 60 years of age. With
representation from most of the age groups, the data in the table suggests that that the
survey sample included participants from a broad spectrum of generations, thus providing
diverse knowledge, experience, and wisdom in the lessons learned collected.
Table 6.4. Participant’s Age
Participant’s Age
Number of
Participants
% of Total
Participants
21 - 30 0 0
31 -40 7 19
41 -50 15 41
51 - 60 10 27
61 - 70 5 13
70+ 0 0
Total Number of Participants 37 100%
Figure 6.4. Participant’s Age
0
19
41
27
13
00
5
10
15
20
25
30
35
40
45
21 -30 31 - 40 41 - 50 51 - 60 61 - 70 70+
Pe
rce
nt
Age Bracket
Participant's Age Bracket

140
6.1.5 Participant’s Education
Table 6.5. shows the participants’ education levels. The data in the table indicates that
21% of the participants have a diploma from a technical institution, 57% of the
participants have an undergraduate degree, and 22% of the participants have a graduate
degree either in the sciences or business at the master’s level. It should be noted that
those participant’s having a college diploma also had a significantly higher number of
years of work experience.
Table 6.5. Participant’s Educational Background
Participant’s Education
Number of
Participants % of Total
Participants
College Diploma 8 21
Undergraduate Degree 21 57
Graduate Degree 8 22
Total Sample 37 100%
Figure 6.5. Participant’s Educational Background
Diploma
21%
Undergraduate
Degree
57%
Graduate
Degree
22%
Participant's Education
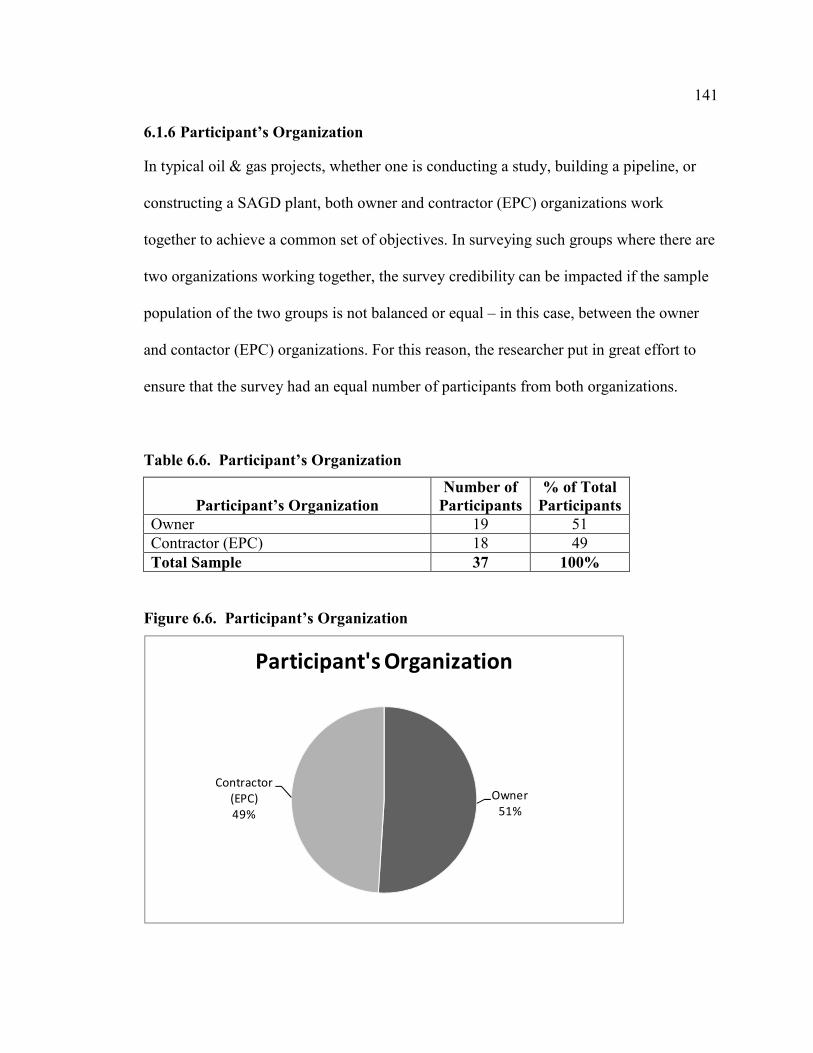
141
6.1.6 Participant’s Organization
In typical oil & gas projects, whether one is conducting a study, building a pipeline, or
constructing a SAGD plant, both owner and contractor (EPC) organizations work
together to achieve a common set of objectives. In surveying such groups where there are
two organizations working together, the survey credibility can be impacted if the sample
population of the two groups is not balanced or equal – in this case, between the owner
and contactor (EPC) organizations. For this reason, the researcher put in great effort to
ensure that the survey had an equal number of participants from both organizations.
Table 6.6. Participant’s Organization
Participant’s Organization
Number of
Participants % of Total
Participants
Owner 19 51
Contractor (EPC) 18 49
Total Sample 37 100%
Figure 6.6. Participant’s Organization
Owner
51%
Contractor
(EPC)
49%
Participant's Organization
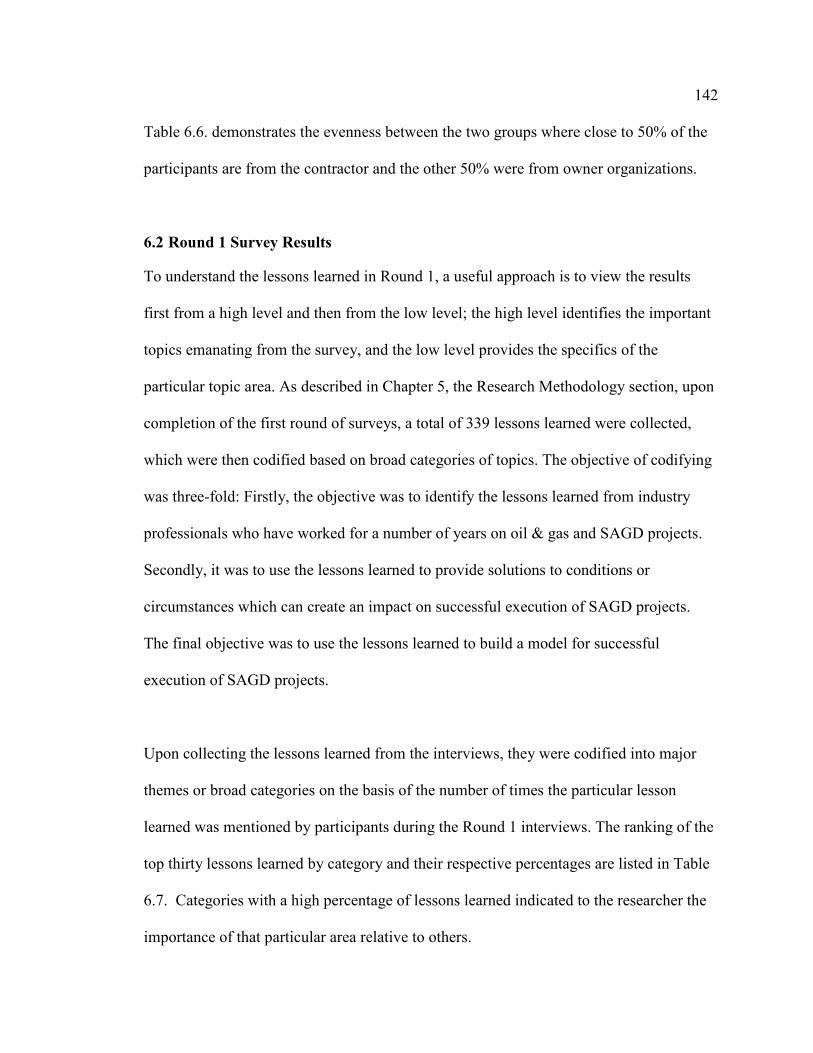
142
Table 6.6. demonstrates the evenness between the two groups where close to 50% of the
participants are from the contractor and the other 50% were from owner organizations.
6.2 Round 1 Survey Results
To understand the lessons learned in Round 1, a useful approach is to view the results
first from a high level and then from the low level; the high level identifies the important
topics emanating from the survey, and the low level provides the specifics of the
particular topic area. As described in Chapter 5, the Research Methodology section, upon
completion of the first round of surveys, a total of 339 lessons learned were collected,
which were then codified based on broad categories of topics. The objective of codifying
was three-fold: Firstly, the objective was to identify the lessons learned from industry
professionals who have worked for a number of years on oil & gas and SAGD projects.
Secondly, it was to use the lessons learned to provide solutions to conditions or
circumstances which can create an impact on successful execution of SAGD projects.
The final objective was to use the lessons learned to build a model for successful
execution of SAGD projects.
Upon collecting the lessons learned from the interviews, they were codified into major
themes or broad categories on the basis of the number of times the particular lesson
learned was mentioned by participants during the Round 1 interviews. The ranking of the
top thirty lessons learned by category and their respective percentages are listed in Table
6.7. Categories with a high percentage of lessons learned indicated to the researcher the
importance of that particular area relative to others.
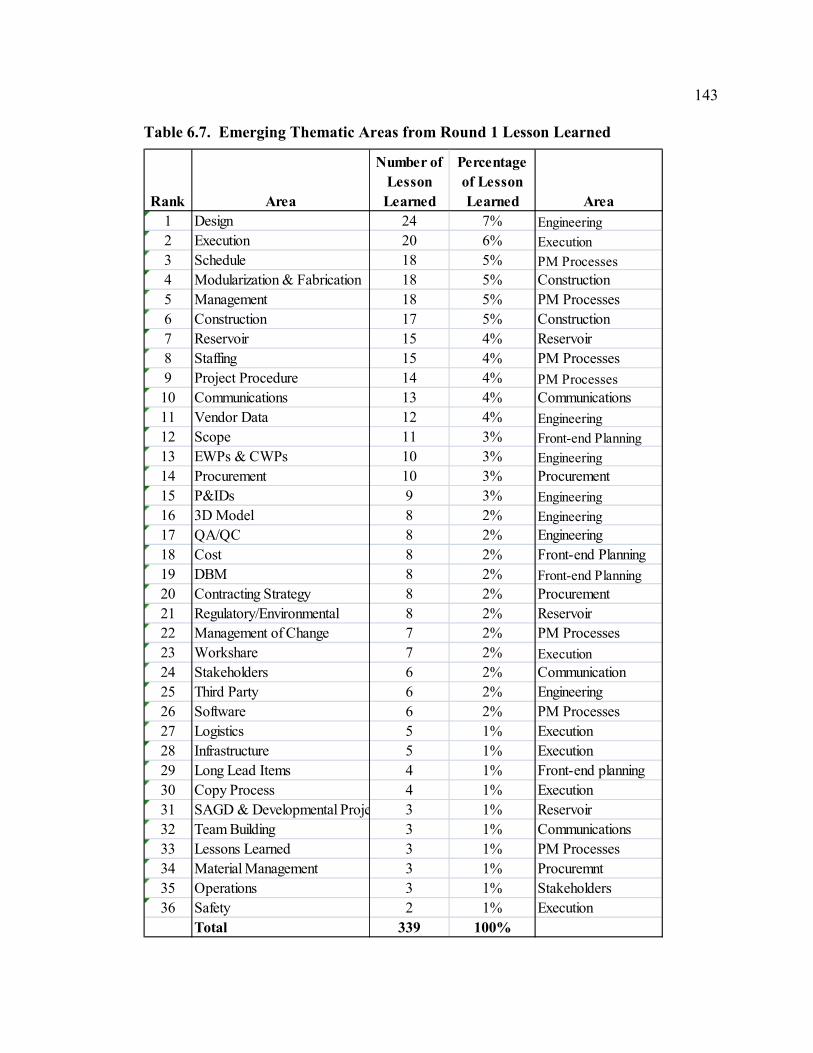
143
Table 6.7. Emerging Thematic Areas from Round 1 Lesson Learned
Rank Area
Number of
Lesson
Learned
Percentage
of Lesson
Learned Area
1 Design 24 7% Engineering
2 Execution 20 6% Execution
3 Schedule 18 5% PM Processes
4 Modularization & Fabrication 18 5% Construction
5 Management 18 5% PM Processes
6 Construction 17 5% Construction
7 Reservoir 15 4% Reservoir
8 Staffing 15 4% PM Processes
9 Project Procedure 14 4% PM Processes
10 Communications 13 4% Communications
11 Vendor Data 12 4% Engineering
12 Scope 11 3% Front-end Planning
13 EWPs & CWPs 10 3% Engineering
14 Procurement 10 3% Procurement
15 P&IDs 9 3% Engineering
16 3D Model 8 2% Engineering
17 QA/QC 8 2% Engineering
18 Cost 8 2% Front-end Planning
19 DBM 8 2% Front-end Planning
20 Contracting Strategy 8 2% Procurement
21 Regulatory/Environmental 8 2% Reservoir
22 Management of Change 7 2% PM Processes
23 Workshare 7 2% Execution
24 Stakeholders 6 2% Communication
25 Third Party 6 2% Engineering
26 Software 6 2% PM Processes
27 Logistics 5 1% Execution
28 Infrastructure 5 1% Execution
29 Long Lead Items 4 1% Front-end planning
30 Copy Process 4 1% Execution
31 SAGD & Developmental Projects 3 1% Reservoir
32 Team Building 3 1% Communications
33 Lessons Learned 3 1% PM Processes
34 Material Management 3 1% Procuremnt
35 Operations 3 1% Stakeholders
36 Safety 2 1% Execution
Total 339 100%
144
The complete data of lessons learned collected in Round 1 are included in Appendix A.
Round 1 rankings listed in Table 6.7. assisted the researcher in identifying the areas to
focus on for Round 2 of the Delphi survey.
6.3 Categories with Further Codification
Further codification of the categories identified from Round 1 was done with similar
topic areas combined under broader themes. Further codification carried the risk of losing
the uniqueness or distinctness of the categories by being absorbed into the larger themes.
However, the codification helped in focussing on the broader themes that needed to be
addressed to identify solutions. Table 6.8. identifies these broader areas and their
respective percentages and ranks them in terms of the number of lessons learned
collected for that area.
Table 6.8. Thematic Areas with Further Codification (Data)
Rank Thematic Area
Number of
Lesson
Learned
Percentage
of Lesson
Learned
1 Project Management (PM) Processes 81 24%
2 Engineering 77 23%
3 Execution 43 13%
4 Construction 35 10%
5 Front-end Planning 31 9%
6 Reservoir 26 8%
7 Procurement 21 6%
8 Communications 16 5%
9 Stakeholders 9 3%
Total 339 100.0%
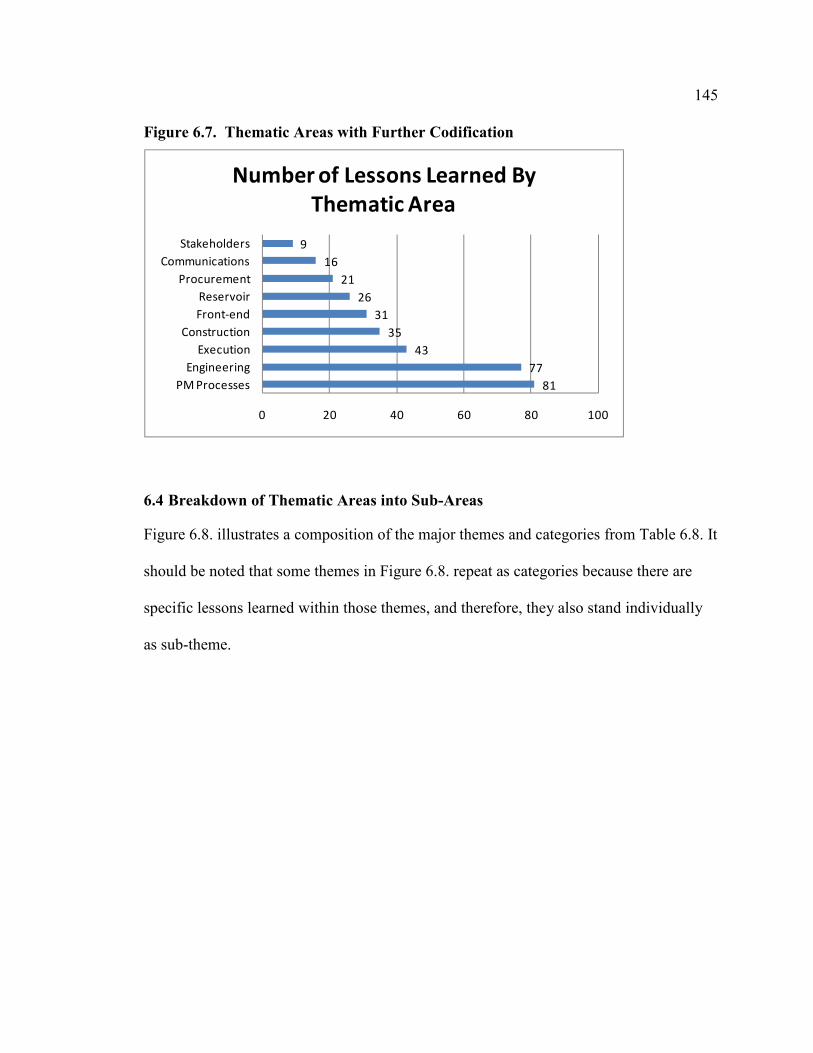
145
Figure 6.7. Thematic Areas with Further Codification
81
77
43
35
31
26
21
16
9
0 20 40 60 80 100
PM Processes
Engineering
Execution
Construction
Front-end
Reservoir
Procurement
Communications
Stakeholders
Number of Lessons Learned By
Thematic Area
6.4 Breakdown of Thematic Areas into Sub-Areas
Figure 6.8. illustrates a composition of the major themes and categories from Table 6.8. It
should be noted that some themes in Figure 6.8. repeat as categories because there are
specific lessons learned within those themes, and therefore, they also stand individually
as sub-theme.

146
Figure 6.8. Breakdown of Thematic Areas into Sub-Areas
Lessons Learned
Engineering Engineering 3D Model Process Design Vendors
Execution Project Execution ModularizationLogistics /
InfrastructureProject
Procedures
Front End Planning
Front End Planning
ScopeChange
ManagementEstimating
Scheduling
Procurement ProcurementContracting
Strategy
Communications Communications Stakeholders
Reservoir ReservoirRegulatory
Environmental
Construction
Lessons Learned & Quality
Equipment Testing
6.5 Round 2 Survey Results
6.5.1 Summarizing Lessons Learned
In preparing for Round 2, all the lessons learned collected in Round 1 were, for ease of
understanding and interpretation, summarized into brief one-line statements. These
single-line statements, which were sorted by areas, were presented to the participants for
ranking on the survey form (see Appendix G). In Delphi surveys, when statements being
rated are too long, the participants have to take in too many variables or details; on the
147
other hand, when statements are too brief, there tends to be too many variations in the
interpretation of the statements (Turoff & Linstone, 2002). Therefore, to assist the
participants in rating them accurately, the survey statements have to be of an appropriate
length. In addition, a study done by Salancik, Wenger, and Helfer found a distinct
relationship between the number of words and the amount of information obtained; they
also concluded that a 20 to 25 word statement is an appropriate length to obtain high
consensus on Delphi survey questions (1971). It is on the basis of this learning that the
researcher decided to summarize the lessons learned into shorter statements for Round 2
of the survey.
6.5.2 Eliminating Bias
In addition to summarizing into single-line statements, leading words in the lesson
learned statements were removed in order to reduce bias. Novakowski suggests that other
than grammar, there should be minimal editing of the participants’ responses, however,
he advises that if there is emotional content in the data collected from each of the rounds,
it is all right to amend such statements (2008) in order to neutralize the emotional aspect.
From the researcher’s perspective, leading words or statements generally are emotion
laden; removing them is certainly appropriate, as was done to Round 2 survey statements.
6.6 Round 2 Survey
Unlike Round 1, in this round, the survey participants had to respond to a statement
rather than a question which asked, “Rate the impact of each of the Lessons Learned
on – successful execution of SAGD projects”. The rating of the lessons learned was
148
based on a Likert scale of 1 to 10, 1 representing least impact and 10 representing great
impact on successful execution of SAGD projects.
6.6.1 Definition of Successful
The definition of the word successful was left to the participants to interpret. In a survey
situation, it is difficult to provide a universal definition which would have the same
meaning to all the participants. One of the reasons of this difficulty was that the survey
participants worked in different areas of a project organization, such as engineering,
procurement, and construction; therefore, their perceptions and definitions of success can
significantly differ from one another. Moreover, providing a definition to each of the
participants’ respective areas can introduce the risk of having multiple definitions of
success, and this can create confusion with the possibility of introducing bias in the
survey.
Success, from some of the management experts’ perspectives, seems to be a simple
notion. When discussing success in relation to a project, Peter Drucker, the renowned
management guru, refers to it as efficiency and effectiveness (Belout, 1998). Many
professionals involved in project management have come to recognize success to fall
within time, cost, and quality (Ika, 2009). Hartman, however, provides a succinct and an
all encompassing definition saying “Success is not a measure of how precisely you
deliver a project, but what the project does for the business or organization that sponsored
it” (2000, p. 26)

149
6.6.2 Likert Scale
In designing the Round 2 survey, form consideration was given by the researcher whether
to use a Likert scale of 1 to 5 or 1 to 10. From the researcher’s experience in designing
surveys, the wider the range of responses available to the participant, the better precision
of answer is provided in the responses. In this survey, for example, if a Likert scale of 1
to 5 was used, it would have been difficult for the participant to provide a response of 3.5
out of 5. On the other hand, if a scale of 1 to 10 is provided on the survey, the participant
could respond 7 out of 10. This latter option provides the survey participants more
flexibility in being more precise in their responses. According to the Encyclopedia of
survey research methods “Though a five category set is most frequently employed, many
psychometricians advocate using response sets of seven, nine, or even eleven points.
Others prefer an even number of response choices, eliminating the neutral alternative to
force a positive or negative expression of attitude” (Lavrakas, 2008, p. 427). Moreover, in
surveys such as this one, where less variability in the responses is expected, using a wider
scale or number of categories can increase the reliability of the results (Lavrakas, 2008).
6.6.3 Round 2 Survey Interviews
In this round, all the 37 Round 1 participants took part in rating the lessons learned,
giving a 100% response rate to the survey. Similar to Round 1, the researcher was present
during the interviews with each of the participants so as to provide clarification and
context to the statements if required. This seemed to help the participants be more
accurate in their responses in rating the lessons learned. Participants were also given the
option of not providing a response to a statement if they felt that they did not have the

150
information or the experience to answer it. In fact, Turoff suggests including a “no
judgement” choice in the selection of responses in the event that survey participants are
not ready to respond to a specific survey statement (Novakowski & Wellar, 2008).
6.7 Round 2 Survey Results
In this round, the researcher’s intention was not to collect the individual participant
ratings of the lessons learned, but rather, to obtain a mean or an average score of all the
participant’s ratings. This was achieved by populating all the participants’ ratings of the
lessons learned onto a spreadsheet (see Appendix D). This spreadsheet lists all the lessons
learned statements on the first left column, with the participants’ individual ratings in
subsequent columns. Embedded in the last column of the spreadsheet is a formula which
adds all the participants’ ratings and divides the summation by the total number of
participants who rated the particular lesson learned giving the average score for the
lesson learned. The average scores of each of the lessons learned were then ranked by
sorting them in descending order. The higher the rank of the lesson learned, the greater its
impact (positive or negative) on the successful execution of SAGD projects.
Table 6.9. illustrates the overall survey scores and the respective rankings of the top thirty
lessons learned from Round 2 of the survey. The complete survey rankings are provided
in Appendix B.
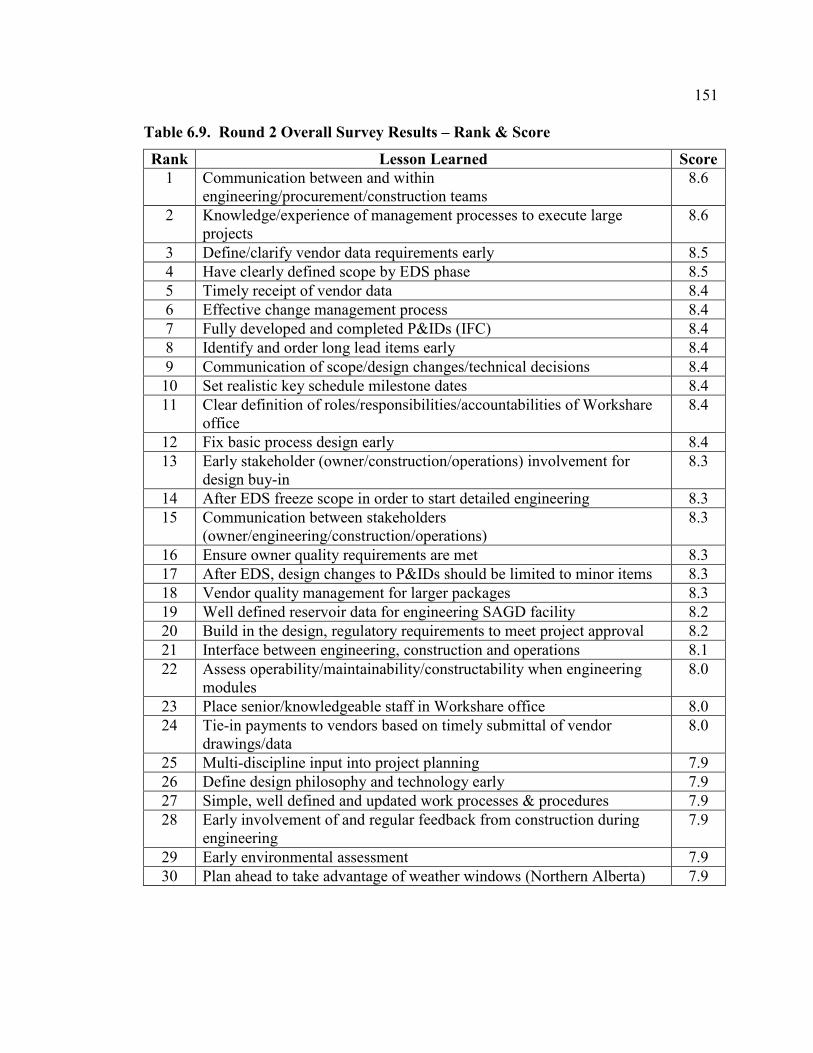
151
Table 6.9. Round 2 Overall Survey Results – Rank & Score
Rank Lesson Learned Score
1 Communication between and within engineering/procurement/construction teams
8.6
2 Knowledge/experience of management processes to execute large projects
8.6
3 Define/clarify vendor data requirements early 8.5
4 Have clearly defined scope by EDS phase 8.5
5 Timely receipt of vendor data 8.4
6 Effective change management process 8.4
7 Fully developed and completed P&IDs (IFC) 8.4
8 Identify and order long lead items early 8.4
9 Communication of scope/design changes/technical decisions 8.4
10 Set realistic key schedule milestone dates 8.4
11 Clear definition of roles/responsibilities/accountabilities of Workshare office
8.4
12 Fix basic process design early 8.4
13 Early stakeholder (owner/construction/operations) involvement for design buy-in
8.3
14 After EDS freeze scope in order to start detailed engineering 8.3
15 Communication between stakeholders (owner/engineering/construction/operations)
8.3
16 Ensure owner quality requirements are met 8.3
17 After EDS, design changes to P&IDs should be limited to minor items 8.3
18 Vendor quality management for larger packages 8.3
19 Well defined reservoir data for engineering SAGD facility 8.2
20 Build in the design, regulatory requirements to meet project approval 8.2
21 Interface between engineering, construction and operations 8.1
22 Assess operability/maintainability/constructability when engineering modules
8.0
23 Place senior/knowledgeable staff in Workshare office 8.0
24 Tie-in payments to vendors based on timely submittal of vendor drawings/data
8.0
25 Multi-discipline input into project planning 7.9
26 Define design philosophy and technology early 7.9
27 Simple, well defined and updated work processes & procedures 7.9
28 Early involvement of and regular feedback from construction during engineering
7.9
29 Early environmental assessment 7.9
30 Plan ahead to take advantage of weather windows (Northern Alberta) 7.9

152
6.7.1 Will these Lessons have to be Learned Again on Other Projects?
At the end of the survey in Round 2, the participants were asked a simple question “Will
these lessons have to be learned again on other projects?” An astounding 76% percent of
the participants responded Yes, 19% responded No, and 5% provided no answer.
Table 6.10. Will These Lessons Have to be Learned Again?
Will These Lessons be Learned Again?
Number of
Participants % of Total
Participants
Yes 28 76
No 7 19
No answer 2 5
Total Sample 37 100%
Figure 6.9. Breakdown of Responses to Question on Lessons Learned
Yes
76%
No
19%
No Answer
5%
Will These Lessons Have to be Learned
Again on Other Projects?
A further breakdown of the response among the EPC and owner organizations is
illustrated in Figures 6.10. and 6.11. respectively.

153
Figure 6.10. Breakdown of Yes Response Between Owner and EPC Participants
EPC
46%
Owner
54%
Yes, Lessons Will Have to be Learned Again
Breakdown of Response - Owner & EPC
Figure 6.11. Breakdown of No Response Between Owner and EPC Participants
EPC
43%
Owner
57%
No, Lessons Will Not Have to be Learned Again
Breakdown of Response - Owner & EPC
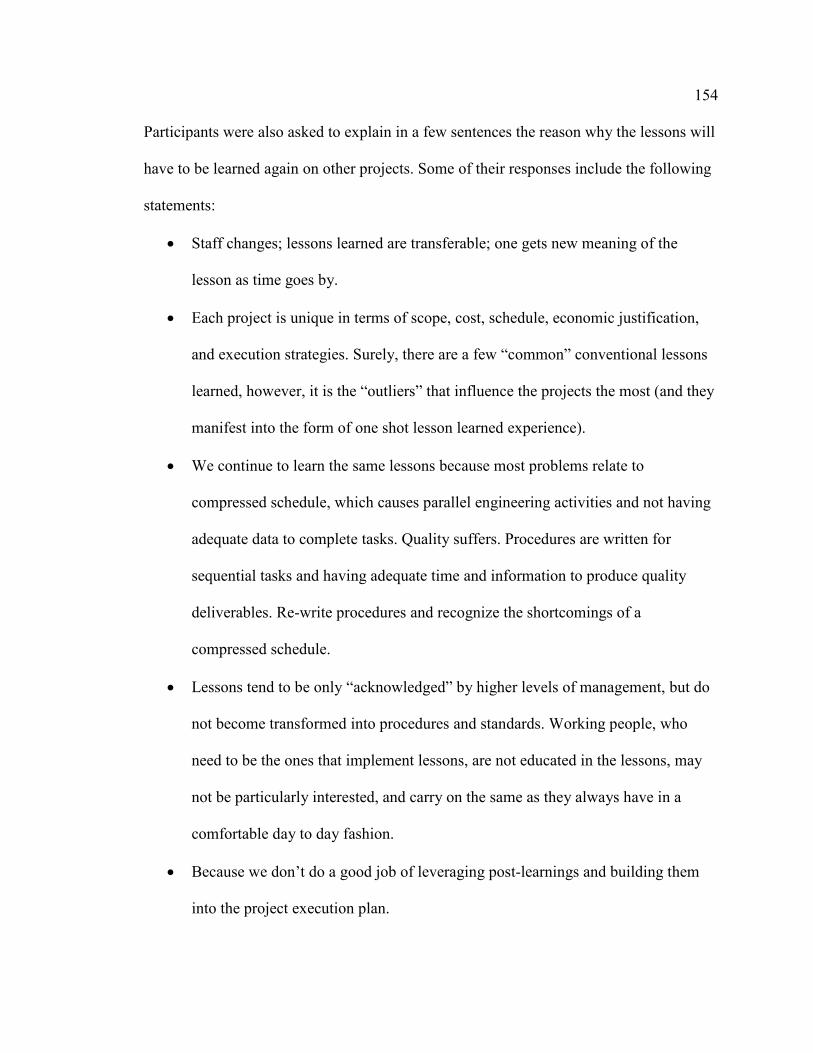
154
Participants were also asked to explain in a few sentences the reason why the lessons will
have to be learned again on other projects. Some of their responses include the following
statements:
• Staff changes; lessons learned are transferable; one gets new meaning of the
lesson as time goes by.
• Each project is unique in terms of scope, cost, schedule, economic justification,
and execution strategies. Surely, there are a few “common” conventional lessons
learned, however, it is the “outliers” that influence the projects the most (and they
manifest into the form of one shot lesson learned experience).
• We continue to learn the same lessons because most problems relate to
compressed schedule, which causes parallel engineering activities and not having
adequate data to complete tasks. Quality suffers. Procedures are written for
sequential tasks and having adequate time and information to produce quality
deliverables. Re-write procedures and recognize the shortcomings of a
compressed schedule.
• Lessons tend to be only “acknowledged” by higher levels of management, but do
not become transformed into procedures and standards. Working people, who
need to be the ones that implement lessons, are not educated in the lessons, may
not be particularly interested, and carry on the same as they always have in a
comfortable day to day fashion.
• Because we don’t do a good job of leveraging post-learnings and building them
into the project execution plan.
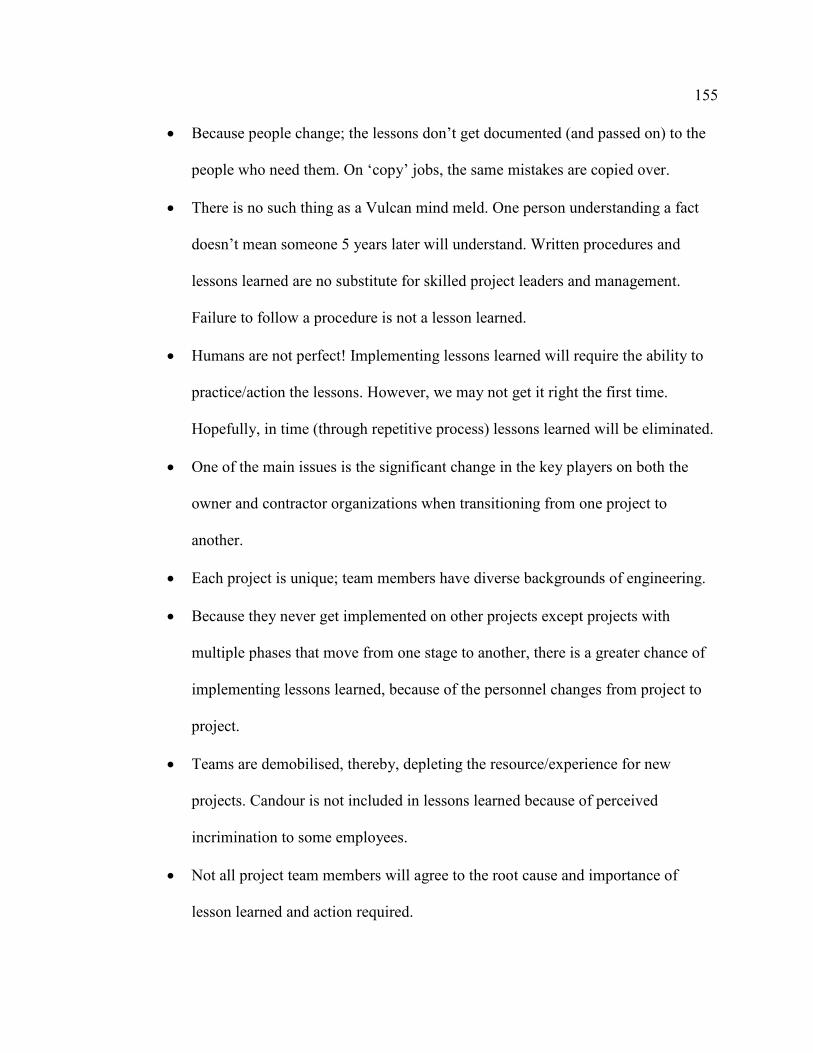
155
• Because people change; the lessons don’t get documented (and passed on) to the
people who need them. On ‘copy’ jobs, the same mistakes are copied over.
• There is no such thing as a Vulcan mind meld. One person understanding a fact
doesn’t mean someone 5 years later will understand. Written procedures and
lessons learned are no substitute for skilled project leaders and management.
Failure to follow a procedure is not a lesson learned.
• Humans are not perfect! Implementing lessons learned will require the ability to
practice/action the lessons. However, we may not get it right the first time.
Hopefully, in time (through repetitive process) lessons learned will be eliminated.
• One of the main issues is the significant change in the key players on both the
owner and contractor organizations when transitioning from one project to
another.
• Each project is unique; team members have diverse backgrounds of engineering.
• Because they never get implemented on other projects except projects with
multiple phases that move from one stage to another, there is a greater chance of
implementing lessons learned, because of the personnel changes from project to
project.
• Teams are demobilised, thereby, depleting the resource/experience for new
projects. Candour is not included in lessons learned because of perceived
incrimination to some employees.
• Not all project team members will agree to the root cause and importance of
lesson learned and action required.
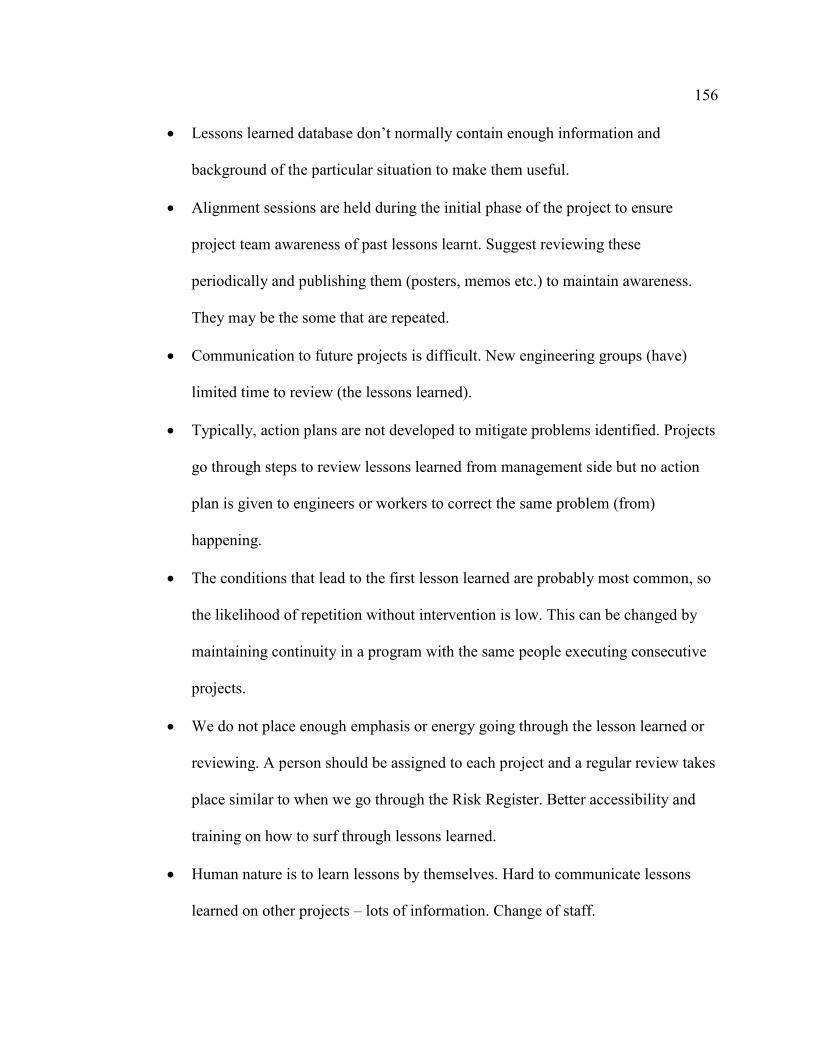
156
• Lessons learned database don’t normally contain enough information and
background of the particular situation to make them useful.
• Alignment sessions are held during the initial phase of the project to ensure
project team awareness of past lessons learnt. Suggest reviewing these
periodically and publishing them (posters, memos etc.) to maintain awareness.
They may be the some that are repeated.
• Communication to future projects is difficult. New engineering groups (have)
limited time to review (the lessons learned).
• Typically, action plans are not developed to mitigate problems identified. Projects
go through steps to review lessons learned from management side but no action
plan is given to engineers or workers to correct the same problem (from)
happening.
• The conditions that lead to the first lesson learned are probably most common, so
the likelihood of repetition without intervention is low. This can be changed by
maintaining continuity in a program with the same people executing consecutive
projects.
• We do not place enough emphasis or energy going through the lesson learned or
reviewing. A person should be assigned to each project and a regular review takes
place similar to when we go through the Risk Register. Better accessibility and
training on how to surf through lessons learned.
• Human nature is to learn lessons by themselves. Hard to communicate lessons
learned on other projects – lots of information. Change of staff.

157
• Because it is more (of a) formality to say we have a quality procedure. Because
people are running a project and not tables & charts. If people don’t have the
attitude to improve, each lesson learned will be repeated again and again.
6.7.2 Importance of Lessons Learned
The importance of lessons learned cannot be underrated; they are important because it
makes an establishment into a “learning organization”. Such organizations then become
more efficient in the work they do. However, certain questions tend to arise. For example,
which department within the overall owner or EPC organization should undertake this
effort? How fast can the lessons learned be incorporated in the project procedures?
Where do they have a better chance of being implemented? What are the advantages and
disadvantages associated with making changes to the project procedures? Should other
means of capturing and disseminating these lessons be utilized? These considerations are
important in order to fully make use of the lesson learned exercise, which is done at the
end of every project.
6.7.3 Comparison of Participant Scores by Area of Specialization
In addition to having a combined overall average of all the participants scores on the
spreadsheet (see Appendix B), the ratings were grouped and averaged by participant area
of specialization - project management, engineering, construction, procurement, and
project support. The intent of the exercise was to explore if there were any differences in
average scores between the areas and if that would change the rankings of the various
lessons learned.

158
In order to have a fair comparison of the scores, one needs to ensure that the sample size
of the area is large enough. Based on various experts who have used the Delphi, a sample
size of 8 – 12 members was deemed sufficient to achieve good results (Novakowski &
Wellar, 2008). On the basis of this recommendation, only project management and
engineering areas with 9 and 19 participants respectively fit the definition from the
survey data (see Table 6.1.). Construction, procurement, and project support were, as a
result, not compared since they had less than 8 participants.
The results of this comparison are shown in subsequent pages beginning with Tables
6.11. and 6.12., which list the ratings for the top thirty lessons learned for the project
management and engineering areas respectively. This is followed by Table 6.13., which
compares the overall, project management and engineering scores.
The scores from the project management and engineering areas were then compared with
the overall scores on the levels of alignment. Alignment is defined here as the position of
the scores vis-a-vis each other. The purpose of identifying the levels of alignment was to
detect the closeness of the respective project management and engineering scores in order
to demonstrate the reliability and trustworthiness of the data. Based on a scale defined by
the researcher (see Table 6.14.), there was high alignment between the two groups in
54% of the top thirty ranked lessons learned, medium alignment in 33% of the lessons
learned, and low alignment in 13% of the lessons learned. In total, 87% of the scores had
high and medium alignment (see Table 6.18.). This significant alignment suggests that
the data collected from the SAGD survey is highly reliable, and therefore, trustworthy.

159
Table 6.11. Round 2 Project Management Survey Results – Rank & Score
Rank Lesson Learned PM
Score
1 Early stakeholder (owner/construction/operations) involvement for design buy-in
8.8
2 Effective Change Management process 8.6
3 After EDS freeze scope in order to start detailed engineering 8.6
4 Have clearly defined scope by EDS phase 8.5
5 Place senior/knowledgeable staff in Workshare office 8.5
6 Fully developed and completed P&IDs (IFC) 8.3
7 Identify and order long lead items early 8.3
8 Timely receipt of vendor data 8.3
9 Define/clarify vendor data requirements early 8.1
10 Clear definition of roles/responsibilities/accountabilities of Workshare office
8.1
11 Review & implement Lessons Learned at start of project 8.1
12 Full participation by engineers & owner representatives during Model Reviews
8.0
13 Close Model Review/HAZOP action items before completing final design
8.0
14 Early involvement of and regular feedback from construction during engineering
8.0
15 Presence of C&SU/RFO/Operations representatives during DBM/EDS phase
8.0
16 Communication between and within engineering/procurement/ construction teams
7.9
17 Communication between stakeholders (owner/construction/engineering/operations)
7.9
18 Do detailed planning for construction phase during engineering 7.9
19 After EDS, design changes to P&IDs should be limited to minor items 7.9
20 Multi-discipline input into project planning 7.9
21 Assess operability/maintainability/constructability when engineering modules
7.9
22 Fix basic process design early 7.9
23 Set realistic key schedule milestone dates at project inception 7.9
24 Communication of scope/design changes/technical decisions 7.8
25 Communication of schedule 7.8
26 Use modularization extensively in execution/contracting 7.8
27 Proactive planning for materials, resources and shop space 7.8
28 Knowledge/experience of management processes to execute large projects
7.8
29 Ensure owner quality requirements are met 7.8
30 Interface between engineering, construction and operations 7.8
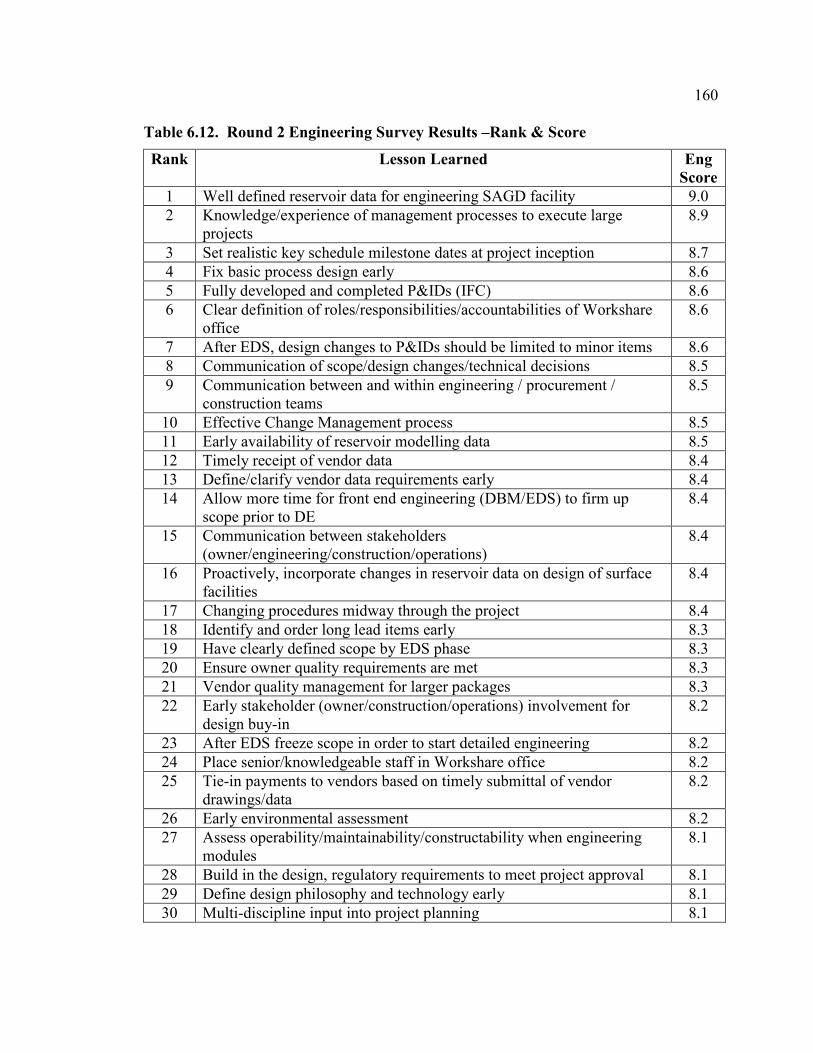
160
Table 6.12. Round 2 Engineering Survey Results –Rank & Score
Rank Lesson Learned Eng
Score
1 Well defined reservoir data for engineering SAGD facility 9.0
2 Knowledge/experience of management processes to execute large projects
8.9
3 Set realistic key schedule milestone dates at project inception 8.7
4 Fix basic process design early 8.6
5 Fully developed and completed P&IDs (IFC) 8.6
6 Clear definition of roles/responsibilities/accountabilities of Workshare office
8.6
7 After EDS, design changes to P&IDs should be limited to minor items 8.6
8 Communication of scope/design changes/technical decisions 8.5
9 Communication between and within engineering / procurement / construction teams
8.5
10 Effective Change Management process 8.5
11 Early availability of reservoir modelling data 8.5
12 Timely receipt of vendor data 8.4
13 Define/clarify vendor data requirements early 8.4
14 Allow more time for front end engineering (DBM/EDS) to firm up scope prior to DE
8.4
15 Communication between stakeholders (owner/engineering/construction/operations)
8.4
16 Proactively, incorporate changes in reservoir data on design of surface facilities
8.4
17 Changing procedures midway through the project 8.4
18 Identify and order long lead items early 8.3
19 Have clearly defined scope by EDS phase 8.3
20 Ensure owner quality requirements are met 8.3
21 Vendor quality management for larger packages 8.3
22 Early stakeholder (owner/construction/operations) involvement for design buy-in
8.2
23 After EDS freeze scope in order to start detailed engineering 8.2
24 Place senior/knowledgeable staff in Workshare office 8.2
25 Tie-in payments to vendors based on timely submittal of vendor drawings/data
8.2
26 Early environmental assessment 8.2
27 Assess operability/maintainability/constructability when engineering modules
8.1
28 Build in the design, regulatory requirements to meet project approval 8.1
29 Define design philosophy and technology early 8.1
30 Multi-discipline input into project planning 8.1
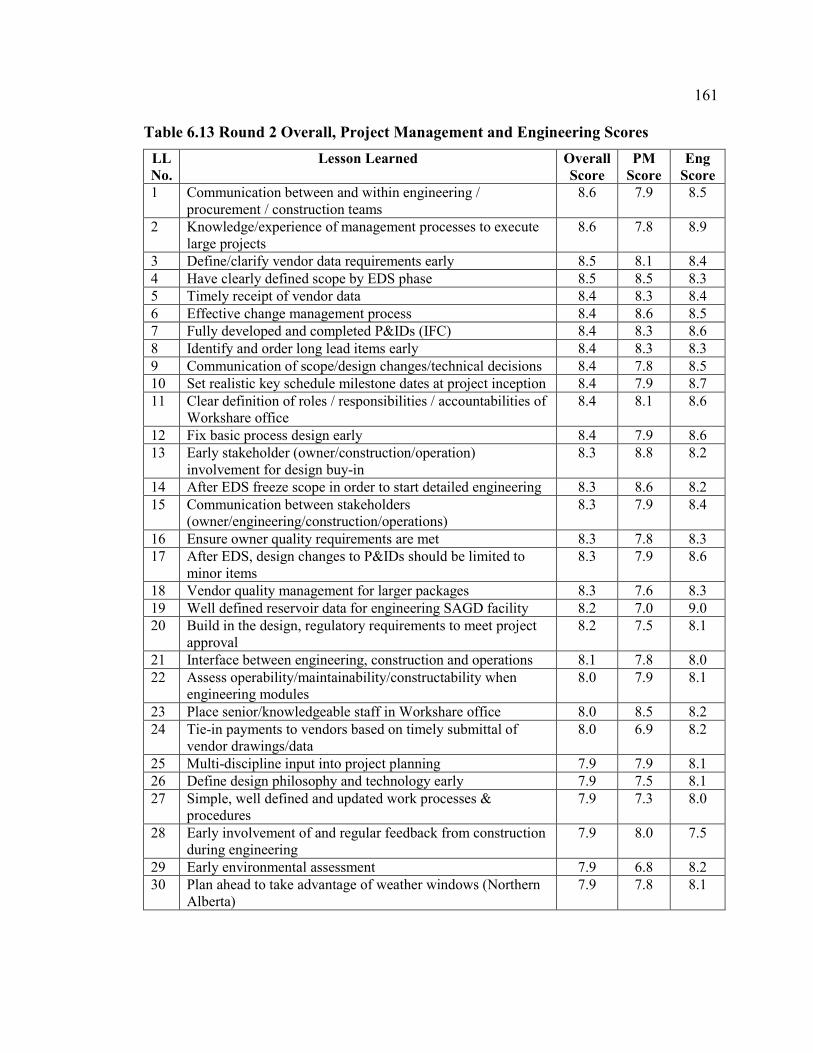
161
Table 6.13 Round 2 Overall, Project Management and Engineering Scores
LL
No.
Lesson Learned Overall
Score
PM
Score
Eng
Score
1
Communication between and within engineering / procurement / construction teams
8.6 7.9 8.5
2 Knowledge/experience of management processes to execute large projects
8.6 7.8 8.9
3 Define/clarify vendor data requirements early 8.5 8.1 8.4
4 Have clearly defined scope by EDS phase 8.5 8.5 8.3
5 Timely receipt of vendor data 8.4 8.3 8.4
6 Effective change management process 8.4 8.6 8.5
7 Fully developed and completed P&IDs (IFC) 8.4 8.3 8.6
8 Identify and order long lead items early 8.4 8.3 8.3
9 Communication of scope/design changes/technical decisions 8.4 7.8 8.5
10 Set realistic key schedule milestone dates at project inception 8.4 7.9 8.7
11 Clear definition of roles / responsibilities / accountabilities of Workshare office
8.4 8.1 8.6
12 Fix basic process design early 8.4 7.9 8.6
13 Early stakeholder (owner/construction/operation) involvement for design buy-in
8.3 8.8 8.2
14 After EDS freeze scope in order to start detailed engineering 8.3 8.6 8.2
15 Communication between stakeholders (owner/engineering/construction/operations)
8.3 7.9 8.4
16 Ensure owner quality requirements are met 8.3 7.8 8.3
17 After EDS, design changes to P&IDs should be limited to minor items
8.3 7.9 8.6
18 Vendor quality management for larger packages 8.3 7.6 8.3
19 Well defined reservoir data for engineering SAGD facility 8.2 7.0 9.0
20 Build in the design, regulatory requirements to meet project approval
8.2 7.5 8.1
21 Interface between engineering, construction and operations 8.1 7.8 8.0
22 Assess operability/maintainability/constructability when engineering modules
8.0 7.9 8.1
23 Place senior/knowledgeable staff in Workshare office 8.0 8.5 8.2
24 Tie-in payments to vendors based on timely submittal of vendor drawings/data
8.0 6.9 8.2
25 Multi-discipline input into project planning 7.9 7.9 8.1
26 Define design philosophy and technology early 7.9 7.5 8.1
27 Simple, well defined and updated work processes & procedures
7.9 7.3 8.0
28 Early involvement of and regular feedback from construction during engineering
7.9 8.0 7.5
29 Early environmental assessment 7.9 6.8 8.2
30 Plan ahead to take advantage of weather windows (Northern Alberta)
7.9 7.8 8.1

162
Figure 6.12. Round 2 Overall, Project Management, and Engineering Scores
1 2 3 4 5 6 7 8 9 10 11 12 13 14 15 16 17 18 19 20 21 22 23 24 25 26 27 28 29 30
PM Score 7.9 7.9 8.1 8.5 8.3 8.6 8.3 8.3 7.8 7.9 8.1 7.9 8.8 8.6 7.9 7.8 7.9 7.6 7.0 7.5 7.8 7.9 8.5 6.9 7.9 7.5 7.3 8.0 6.8 7.8
Eng Score 8.5 8.9 8.4 8.3 8.4 8.5 8.6 8.3 8.5 8.7 8.6 8.6 8.2 8.2 8.4 8.3 8.6 8.3 9.0 8.1 8.0 8.1 8.2 8.2 8.1 8.1 8.0 7.5 8.2 8.1
Overall 8.6 8.6 8.5 8.5 8.4 8.4 8.4 8.4 8.4 8.4 8.4 8.4 8.3 8.3 8.3 8.3 8.3 8.3 8.2 8.2 8.1 8.0 8.0 8.0 7.9 7.9 7.9 7.9 7.9 7.9
6.5
7.0
7.5
8.0
8.5
9.0
9.5
Round 2 Overall, Project Management and
Engineering Scores Compared
Table 6.14. Definition for Levels of Alignment
Level of Alignment Score Variance
High Alignment X ≤ 0.5
Medium Alignment 0.5 ≤ X ≤ 1.0
Low Alignment X > 1.0
Figure 6.12. illustrates the comparison of the lessons learned scores on a graph, with the
diamond representing the overall average score with project management and engineering
average scores at each end of the line. These scores were further broken down based on
the levels of alignment of the three areas. The levels of alignment are defined in the table
below based on the variance (X) between the highest and the lowest scores for each of the
lessons learned.
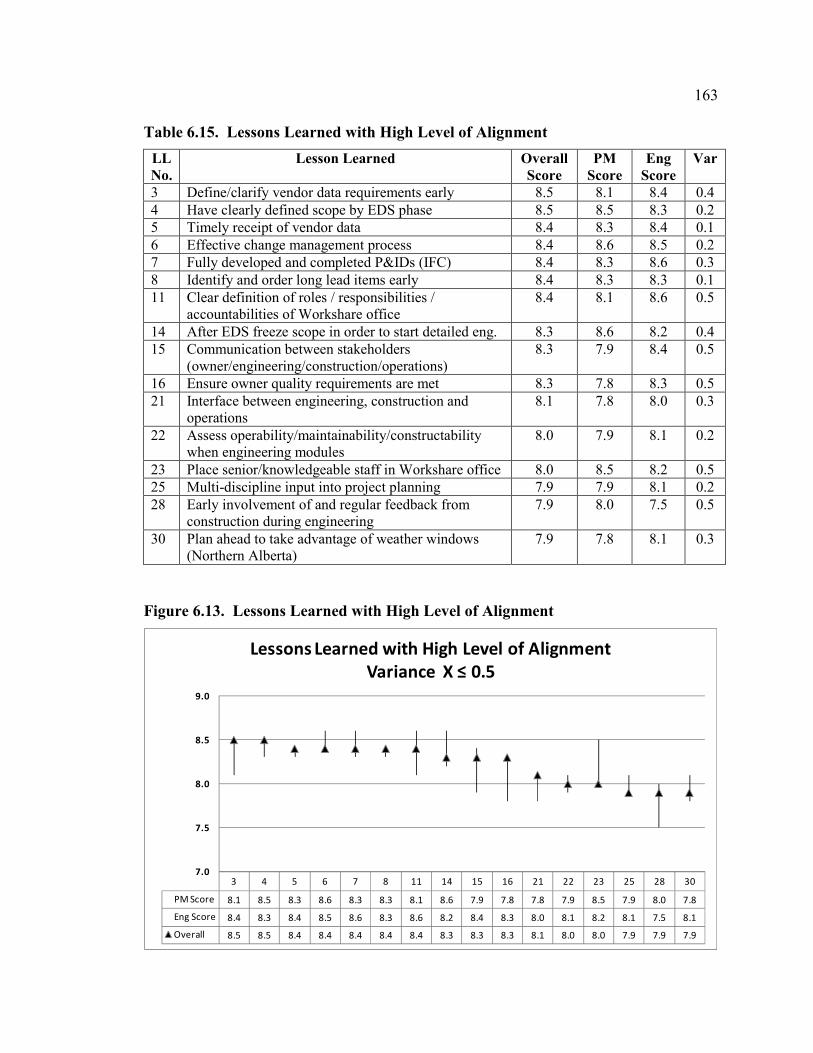
163
Table 6.15. Lessons Learned with High Level of Alignment
LL
No.
Lesson Learned Overall
Score
PM
Score
Eng
Score
Var
3 Define/clarify vendor data requirements early 8.5 8.1 8.4 0.4
4 Have clearly defined scope by EDS phase 8.5 8.5 8.3 0.2
5 Timely receipt of vendor data 8.4 8.3 8.4 0.1
6 Effective change management process 8.4 8.6 8.5 0.2
7 Fully developed and completed P&IDs (IFC) 8.4 8.3 8.6 0.3
8 Identify and order long lead items early 8.4 8.3 8.3 0.1
11 Clear definition of roles / responsibilities / accountabilities of Workshare office
8.4 8.1 8.6 0.5
14 After EDS freeze scope in order to start detailed eng. 8.3 8.6 8.2 0.4
15 Communication between stakeholders (owner/engineering/construction/operations)
8.3 7.9 8.4 0.5
16 Ensure owner quality requirements are met 8.3 7.8 8.3 0.5
21 Interface between engineering, construction and operations
8.1 7.8 8.0 0.3
22 Assess operability/maintainability/constructability when engineering modules
8.0 7.9 8.1 0.2
23 Place senior/knowledgeable staff in Workshare office 8.0 8.5 8.2 0.5
25 Multi-discipline input into project planning 7.9 7.9 8.1 0.2
28 Early involvement of and regular feedback from construction during engineering
7.9 8.0 7.5 0.5
30 Plan ahead to take advantage of weather windows (Northern Alberta)
7.9 7.8 8.1 0.3
Figure 6.13. Lessons Learned with High Level of Alignment
3 4 5 6 7 8 11 14 15 16 21 22 23 25 28 30
PM Score 8.1 8.5 8.3 8.6 8.3 8.3 8.1 8.6 7.9 7.8 7.8 7.9 8.5 7.9 8.0 7.8
Eng Score 8.4 8.3 8.4 8.5 8.6 8.3 8.6 8.2 8.4 8.3 8.0 8.1 8.2 8.1 7.5 8.1
Overall 8.5 8.5 8.4 8.4 8.4 8.4 8.4 8.3 8.3 8.3 8.1 8.0 8.0 7.9 7.9 7.9
7.0
7.5
8.0
8.5
9.0
Lessons Learned with High Level of Alignment
Variance X ≤ 0.5

164
Table 6.16. Lessons Learned with Medium Level of Alignment
LL
No.
Lesson Learned Overall
Score
PM
Score
Eng
Score
Var
1
Communication between and within engineering / procurement / construction teams
8.6 7.9 8.5 0.7
9 Communication of scope/design changes/technical decisions
8.4 7.8 8.5 0.7
10 Set realistic key schedule milestone dates at project inception
8.4 7.9 8.7 0.8
12 Fix basic process design early 8.4 7.9 8.6 0.7
13 Early stakeholder (owner/construction/operation) involvement for design buy-in
8.3 8.8 8.2 0.6
17 After EDS, design changes to P&IDs should be limited to minor items
8.3 7.9 8.6 0.7
18 Vendor quality management for larger packages 8.3 7.6 8.3 0.7
20 Build in the design, regulatory requirements to meet project approval
8.2 7.5 8.1 0.7
26 Define design philosophy and technology early 7.9 7.5 8.1 0.6
27 Simple, well defined and updated work processes & procedures
7.9 7.3 8.0 0.7
Figure 6.14. Lessons Learned with Medium Level of Alignment
1 9 10 12 13 17 18 20 26 27
PM Score 7.9 7.8 7.9 7.9 8.8 7.9 7.6 7.5 7.5 7.3
Eng Score 8.5 8.5 8.7 8.6 8.2 8.6 8.3 8.1 8.1 8.0
Overall 8.6 8.4 8.4 8.4 8.3 8.3 8.3 8.2 7.9 7.9
7.0
7.5
8.0
8.5
9.0
Lessons Learned with Medium Level of Alignment
Variance 0.5 �X ≤ 1.0
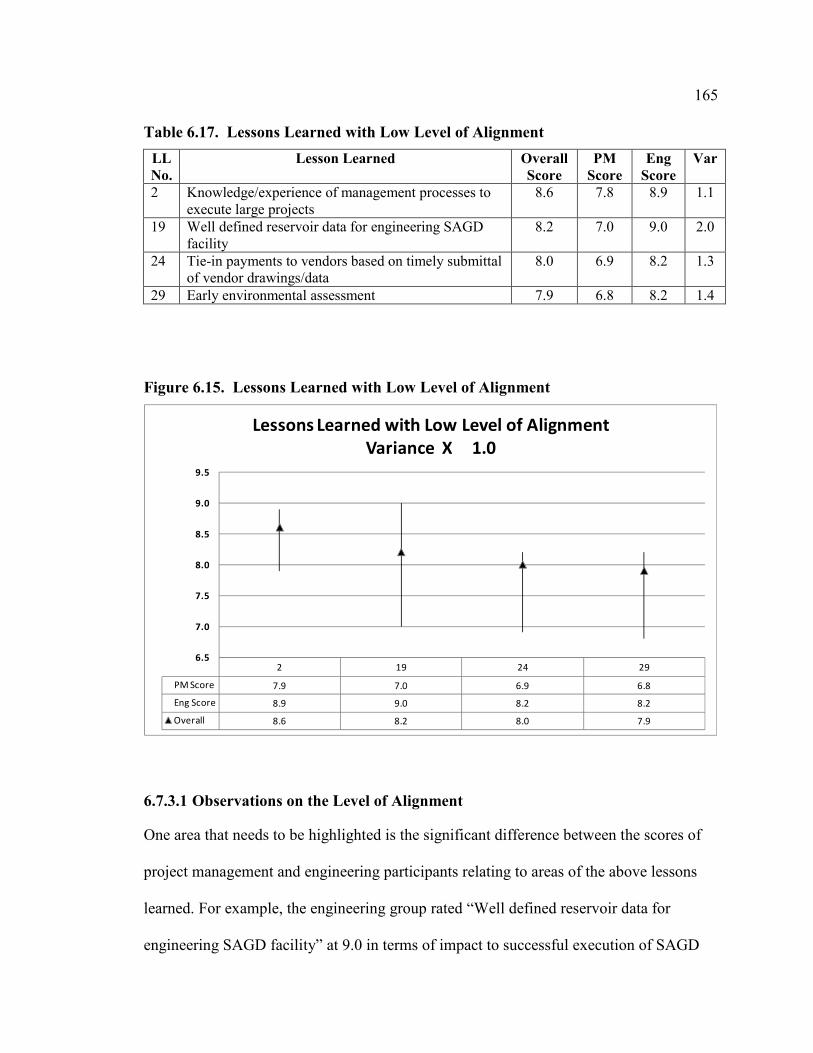
165
Table 6.17. Lessons Learned with Low Level of Alignment
LL
No.
Lesson Learned Overall
Score
PM
Score
Eng
Score
Var
2 Knowledge/experience of management processes to execute large projects
8.6 7.8 8.9 1.1
19 Well defined reservoir data for engineering SAGD facility
8.2 7.0 9.0 2.0
24 Tie-in payments to vendors based on timely submittal of vendor drawings/data
8.0 6.9 8.2 1.3
29 Early environmental assessment 7.9 6.8 8.2 1.4
Figure 6.15. Lessons Learned with Low Level of Alignment
2 19 24 29
PM Score 7.9 7.0 6.9 6.8
Eng Score 8.9 9.0 8.2 8.2
Overall 8.6 8.2 8.0 7.9
6.5
7.0
7.5
8.0
8.5
9.0
9.5
Lessons Learned with Low Level of Alignment
Variance X �1.0
6.7.3.1 Observations on the Level of Alignment
One area that needs to be highlighted is the significant difference between the scores of
project management and engineering participants relating to areas of the above lessons
learned. For example, the engineering group rated “Well defined reservoir data for
engineering SAGD facility” at 9.0 in terms of impact to successful execution of SAGD

166
projects, while the project management group rated it at 7.0, giving a variance of 2.0.
This is an area known to create significant challenges in the execution of SAGD projects.
One of the reasons for this big gap between the project management and engineering
group could be that the engineering group is very close to the design aspects of the
SAGD surface facilities, which means that they are significantly impacted by any
changes in the reservoir data since these changes mean that the plants surface facilities
need to be redesigned. In comparison, the project management group is less close to the
minute details of the reservoir data changes, and consequently, this group is less impacted
by it. Thus, this could be the reason why they scored lower on this lesson learned.
A similar rationale could be applied to the other lessons learned where there is low
alignment between the project management and engineering groups. Areas such as
vendor data and environmental assessment impact the engineering group much more than
the project management group, and thus, there is low alignment in the score of the two
groups. Another lesson learned where there is low alignment between the two groups is
“Knowledge/experience of management processes to execute large projects”; the manner
in which a project is managed impacts the engineering group much more than the project
managers who actually manage the project, and that is why there is a significant gap.
On the basis of the interviews with the survey participants and analysis of the data, the
researcher thinks that lessons learned numbers 2, 19, and 24 are important lessons learned
which can significantly impact the successful execution of SAGD projects.
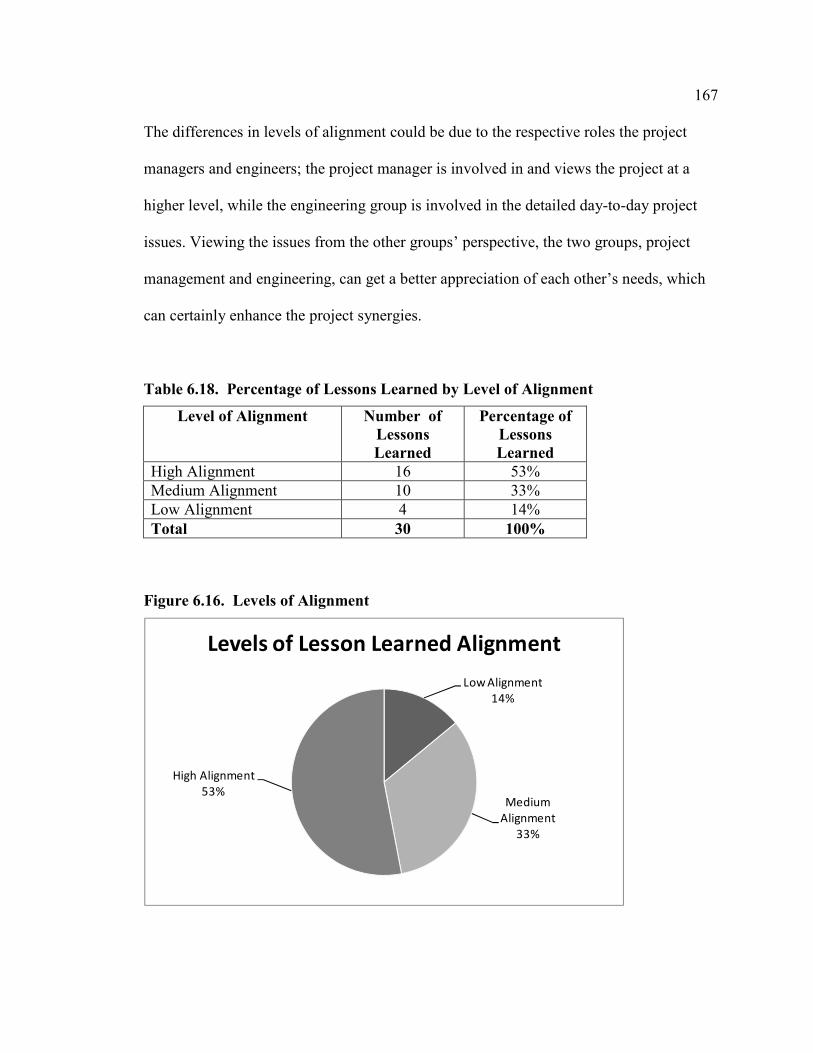
167
The differences in levels of alignment could be due to the respective roles the project
managers and engineers; the project manager is involved in and views the project at a
higher level, while the engineering group is involved in the detailed day-to-day project
issues. Viewing the issues from the other groups’ perspective, the two groups, project
management and engineering, can get a better appreciation of each other’s needs, which
can certainly enhance the project synergies.
Table 6.18. Percentage of Lessons Learned by Level of Alignment
Level of Alignment Number of
Lessons
Learned
Percentage of
Lessons
Learned
High Alignment 16 53%
Medium Alignment 10 33%
Low Alignment 4 14%
Total 30 100%
Figure 6.16. Levels of Alignment
Low Alignment
14%
Medium
Alignment
33%
High Alignment
53%
Levels of Lesson Learned Alignment
168
Finally, the overall results of Round 2 were grouped by area in a similar way to the
groups formed after Round 1 of the surveys; Table 6.19. illustrates the convergence of
these lesson learned. The objective of this grouping is to view the results from a group
perspective as well as to provide an easier approach to discussing and analyzing the
results, which is done in Chapter Seven.
6.7.4 Triangulation
As defined in Chapter Three, triangulation is a means of increasing the reliability,
credibility, and validity of the research. It involves asking other individuals who have
encountered similar situations to review the data. Rankings and the scores of the top
thirty lessons learned were reviewed by two highly experienced project managers in the
oil & gas industry. According to their review of the data, most of the lessons learned and
their results in this study seemed to be aligned or in agreement with what they have
experienced in the SAGD and oil & gas projects that they had worked on.
6.7.5 Top Thirty Lessons Learned Grouped by Area
On the basis of their similarity, the top thirty lessons learned were grouped together by
thematic areas, which were similar to the one developed in Table 6.8. The objective of
grouping was to determine the intensity of the lessons learned, which was indicated by
their numbers in each area; this is illustrated in Table 6.19. The results of the lessons
learned, which are organized sequentially from reservoir to construction (Table 6.19.) are
discussed in greater detail in Chapters Seven and Eight.

169
Table 6.19. Round 2 Survey Results – Score by Area
Area Lesson Learned Score
Reservoir Well defined reservoir data for engineering SAGD facility 8.2
Front-end
Planning
Have clearly defined scope by EDS phase Effective change management process After EDS freeze scope in order to start detailed engineering After EDS, design changes to P&IDs limited to minor items Multi-discipline input into project planning Define design philosophy and technology early
8.5 8.4 8.3 8.3 8.3 7.9
Regulatory Build in the design, regulatory requirements to meet project approval Early environmental assessment
8.2
7.9
Project
Execution
Clear definition of roles/responsibilities/accountabilities of Workshare office Assess operability/maintainability/constructability when engineering modules Place senior/knowledgeable staff in Workshare office Simple well defined and updated work processes & procedure
8.4
8.0
8.0 7.9
Engineering Fully developed and completed P&IDs (IFC) Fix basic process design early Early stakeholder (owner/construction/operation) involvement for design buy-in
8.4 8.4 8.3
Vendor Data Define/clarify vendor data requirements early Timely receipt of vendor data Vendor quality management for larger packages Tie-in payments to vendors based on timely submittal of vendor drawings/data
8.5 8.4 8.3 8.0
Quality Ensure owner quality requirements are met 8.3
Procurement Identify and order long lead items early 8.4
Construction Early involvement of and regular feedback from construction during engineering
7.9
Management Knowledge/experience of management processes to execute large projects
8.6
Schedule Set realistic key schedule milestone dates Plan ahead to take advantage of weather windows – (Northern Alberta)
8.4 7.9
Communication Communication between and within engineering/procurement/construction teams Communication of scope/design changes/technical decisions Communication between stakeholders (owner/engineering/construction/operations) Interface between engineering, construction, and operations
8.6
8.4 8.3
8.1
170
6.8 Summary
In Round 1 of the survey, a total of 339 lessons learned were collected, and of these
lessons learned, a large majority were related project management processes,
engineering, execution, and construction areas. In Round 2, the lessons learned were
summarized and presented to the participants to be rated. Based on the average ratings of
each of the lesson learned the following are the three top ranked lessons learned:
i. Communication between and within engineering, procurement, and construction
teams
ii. Knowledge and experience of management processes to execute large projects
iii. Define and clarify vendor data requirements early
In response to a question regarding lessons learned on the survey, an astounding majority
76% of the participants responded that lessons learned will be repeated on other projects!
A comparison of the project management and engineering participants’ rankings of the
top thirty lessons learned in this study indicated that there is high alignment on 53% of
the lessons learned, medium alignment on 33%, and low alignment on 14%. This result
indicates that the two groups are well aligned on most of the lessons learned. The next
chapter provides an in-depth discussion and analysis of these results.
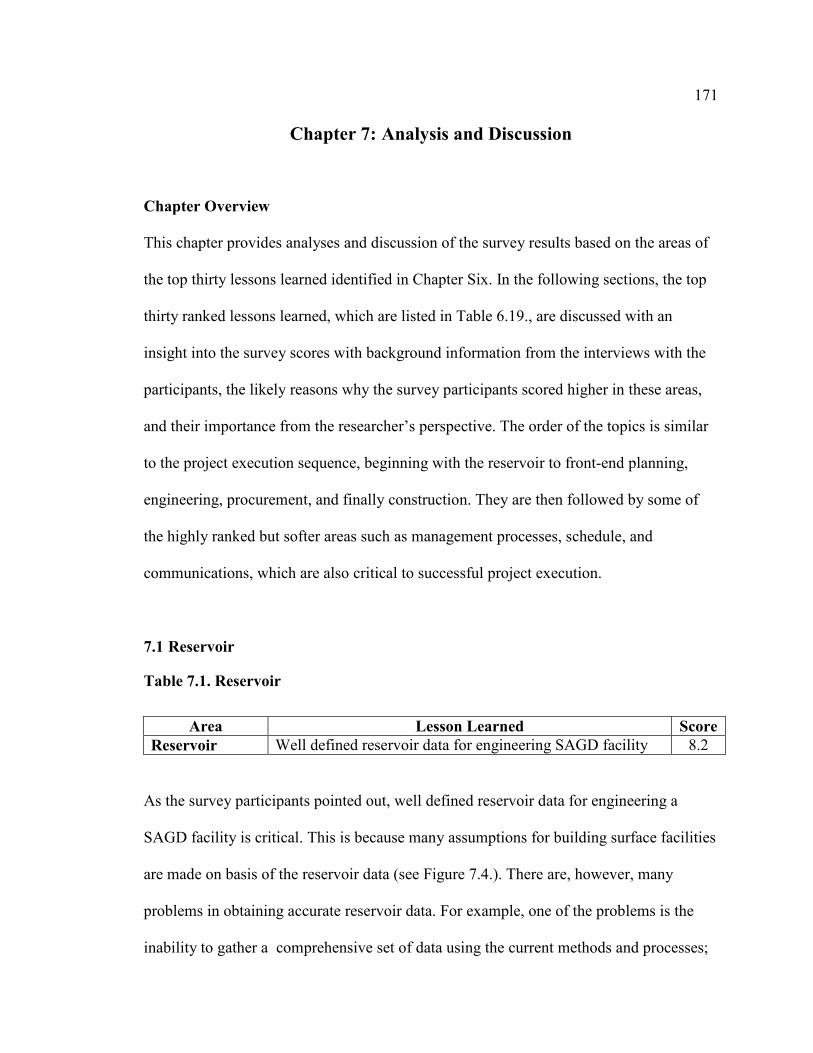
171
Chapter 7: Analysis and Discussion
Chapter Overview
This chapter provides analyses and discussion of the survey results based on the areas of
the top thirty lessons learned identified in Chapter Six. In the following sections, the top
thirty ranked lessons learned, which are listed in Table 6.19., are discussed with an
insight into the survey scores with background information from the interviews with the
participants, the likely reasons why the survey participants scored higher in these areas,
and their importance from the researcher’s perspective. The order of the topics is similar
to the project execution sequence, beginning with the reservoir to front-end planning,
engineering, procurement, and finally construction. They are then followed by some of
the highly ranked but softer areas such as management processes, schedule, and
communications, which are also critical to successful project execution.
7.1 Reservoir
Table 7.1. Reservoir
Area Lesson Learned Score
Reservoir Well defined reservoir data for engineering SAGD facility 8.2
As the survey participants pointed out, well defined reservoir data for engineering a
SAGD facility is critical. This is because many assumptions for building surface facilities
are made on basis of the reservoir data (see Figure 7.4.). There are, however, many
problems in obtaining accurate reservoir data. For example, one of the problems is the
inability to gather a comprehensive set of data using the current methods and processes;
172
this is compounded by the fact that oil sands reservoirs evolve with the changing
underground deposits (Selby, 2010) making it difficult to obtain accurate data. The
second problem is the evolution of this reservoir data in terms of stability, reliability, and
sustainability, from which production flows can be determined (Fernando Gaviria, 2010).
When there are changes to the reservoir data, appropriate changes to the process design
have to be reconfigured in order to optimize production. Incorporating such changes
create tremors to the execution strategy (see Figure 8.3.) consequently impacting all the
respective disciplines’ design and engineering work. These changes impact the design of
the surface facilities, which can sometimes be significant, depending on how much the
reservoir data has changed. Surface design changes can impact the equipment sizes, pipe
sizes, pumps, tanks, etc. Needless to say that the changes include the potential of rework
on the PFDs, P&IDs and other discipline associated drawings.
Due to the unstable reservoir data, the wells drilled may not reach the optimum pay zone
of the oil sands deposits; however, in other cases, there may be an excess of water in the
producer wells. As a result, it is quite possible that even a year or two after
commissioning the surface facilities, a SAGD reservoir may not yield the production
expected during the study phase. This can result in the SAGD plant not operating at full
capacity, as experienced in one of the Alberta projects. Therefore, it is important to look
at the potential range of operations, from the worst case to the best case scenario of the
reservoir performance, and to be able to provide flexibility in the design to meet the
variability in the reservoir operating conditions and minimize significant changes to the
surface facilities. Changing reservoir conditions and the additional time required to
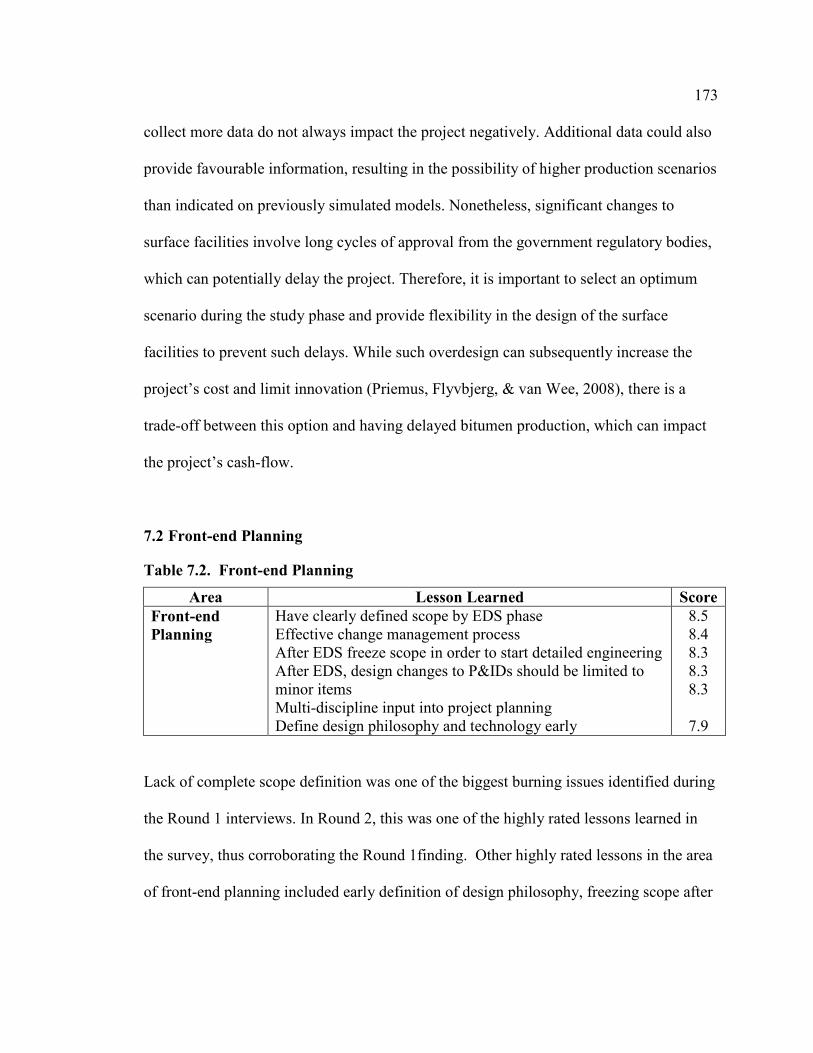
173
collect more data do not always impact the project negatively. Additional data could also
provide favourable information, resulting in the possibility of higher production scenarios
than indicated on previously simulated models. Nonetheless, significant changes to
surface facilities involve long cycles of approval from the government regulatory bodies,
which can potentially delay the project. Therefore, it is important to select an optimum
scenario during the study phase and provide flexibility in the design of the surface
facilities to prevent such delays. While such overdesign can subsequently increase the
project’s cost and limit innovation (Priemus, Flyvbjerg, & van Wee, 2008), there is a
trade-off between this option and having delayed bitumen production, which can impact
the project’s cash-flow.
7.2 Front-end Planning
Table 7.2. Front-end Planning
Area Lesson Learned Score
Front-end
Planning
Have clearly defined scope by EDS phase Effective change management process After EDS freeze scope in order to start detailed engineering After EDS, design changes to P&IDs should be limited to minor items Multi-discipline input into project planning Define design philosophy and technology early
8.5 8.4 8.3 8.3 8.3
7.9
Lack of complete scope definition was one of the biggest burning issues identified during
the Round 1 interviews. In Round 2, this was one of the highly rated lessons learned in
the survey, thus corroborating the Round 1finding. Other highly rated lessons in the area
of front-end planning included early definition of design philosophy, freezing scope after
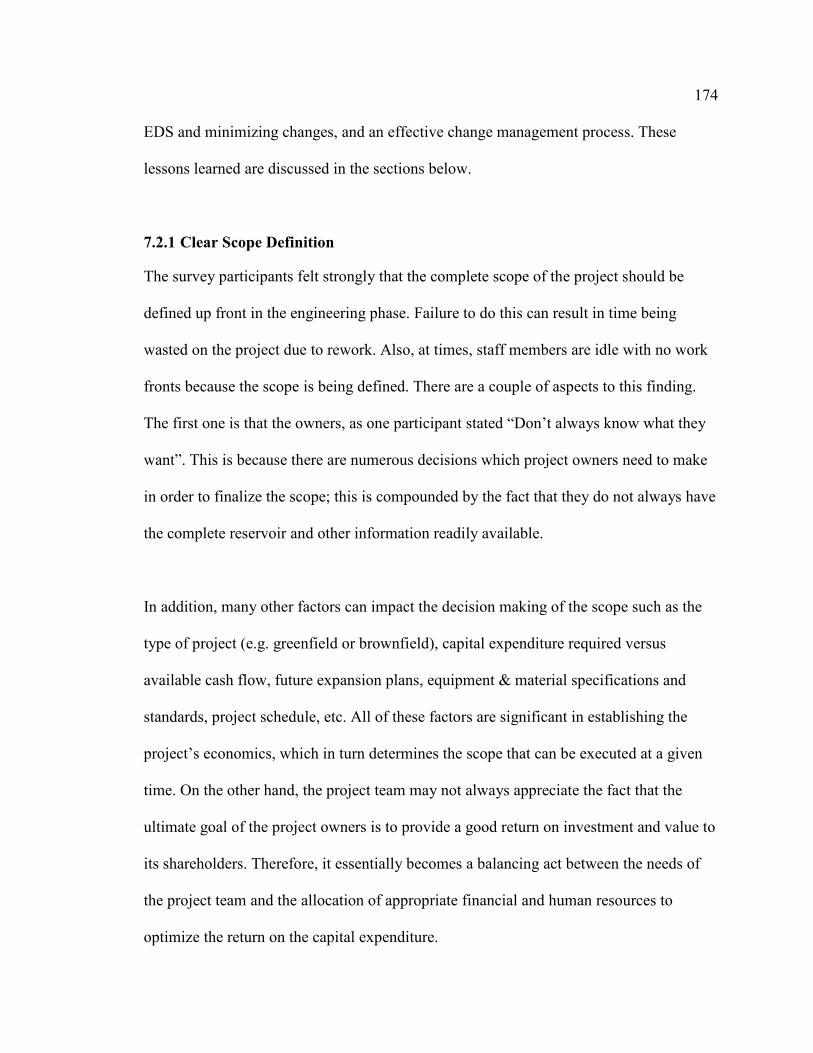
174
EDS and minimizing changes, and an effective change management process. These
lessons learned are discussed in the sections below.
7.2.1 Clear Scope Definition
The survey participants felt strongly that the complete scope of the project should be
defined up front in the engineering phase. Failure to do this can result in time being
wasted on the project due to rework. Also, at times, staff members are idle with no work
fronts because the scope is being defined. There are a couple of aspects to this finding.
The first one is that the owners, as one participant stated “Don’t always know what they
want”. This is because there are numerous decisions which project owners need to make
in order to finalize the scope; this is compounded by the fact that they do not always have
the complete reservoir and other information readily available.
In addition, many other factors can impact the decision making of the scope such as the
type of project (e.g. greenfield or brownfield), capital expenditure required versus
available cash flow, future expansion plans, equipment & material specifications and
standards, project schedule, etc. All of these factors are significant in establishing the
project’s economics, which in turn determines the scope that can be executed at a given
time. On the other hand, the project team may not always appreciate the fact that the
ultimate goal of the project owners is to provide a good return on investment and value to
its shareholders. Therefore, it essentially becomes a balancing act between the needs of
the project team and the allocation of appropriate financial and human resources to
optimize the return on the capital expenditure.

175
The second aspect emerging from the findings is that not enough time is spent in defining
the scope. This is because the project schedules have artificial deadlines (Condon, 2006)
established by the project owners depending on market forces and other factors; these
deadlines can make it extremely difficult to commit enough time and thought to
accurately defining the scope. A well thought out scope helps in minimizing changes,
especially when the project’s design is in the advanced stages. Rework and redesign,
which are by-products of poor scope definition, tend to create disorder in the engineering
execution sequence.
7.2.1.1 Fast Tracking
A major cause of poor scope definition, as demonstrated during the recent boom (2006-
2008), is the external market forces hovering over current and future projects, such as the
rising price of natural resources. In order to react and capitalize on the opportunities
created by market conditions, especially when prices are on the upswing, changing
project execution strategies such as fast-tracking is a natural reaction (see Figure 7.1.).
Such a change in execution strategy results in the shrinking of schedules to accommodate
and capitalize on the opportunity, which requires people to work at a much more rapid
pace than before. In addition, such a strategy requires the overlapping of phases (see
Figure 7.3.), which creates a perception of a poorly defined scope. This fast paced
execution was very evident in the oil & gas sector during the recent boom (2006-2008),
and much of it was due to the economics of oil prices, which rose to a peak of US$147 a
barrel. It should be mentioned that with the drop in oil prices from its peak, oil & gas
projects are now executed at a much more normal pace.

176
Nonetheless, with the numerous books and articles written by various authors about the
“peak oil theory”, where there is increased oil consumption from the emerging markets of
China, India, and Brazil, it is probable that oil prices will rise again in the future. This
will likely bring another round of fast-tracked projects, resulting in issues in and around
the front-end planning, unless some learning has taken place.
Figure 7.1. Impact of Oil Prices on Execution Strategy
Oil
Price
Time
Change in project
execution strategy to
take advantage of
favourable oil prices
7.2.1.2 Traditional versus Current Project Durations
Figure 7.2. (Harris, 2009c) shows the traditional model of execution, which has a
relatively slower pace of execution. In this model, which is still practiced on government
infrastructure projects it takes almost 52 months to complete a project from the beginning
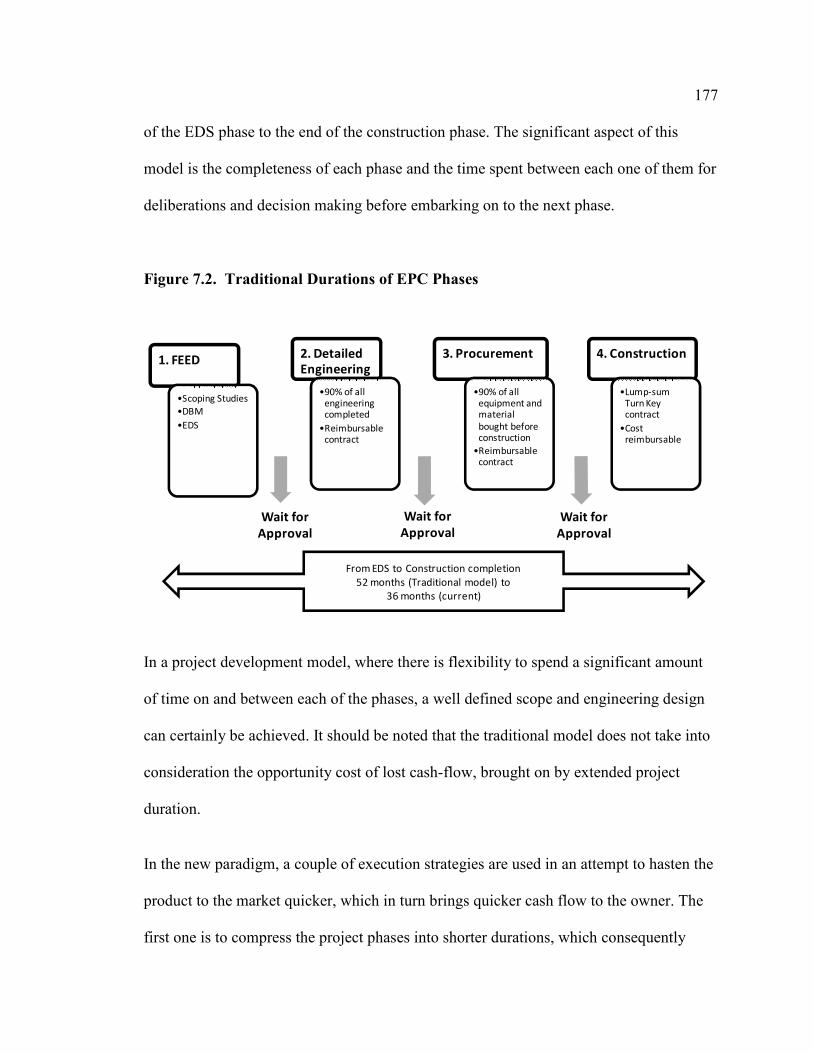
177
of the EDS phase to the end of the construction phase. The significant aspect of this
model is the completeness of each phase and the time spent between each one of them for
deliberations and decision making before embarking on to the next phase.
Figure 7.2. Traditional Durations of EPC Phases
1. FEED
•Scoping Studies
•DBM
•EDS
2. Detailed
Engineering
•90% of all engineering completed
•Reimbursable contract
3. Procurement
•90% of all equipment and material
bought before construction
•Reimbursable contract
4. Construction
•Lump-sum Turn Key contract
•Cost reimbursable
Wait for
Approval
Wait for
Approval
Wait for
Approval
From EDS to Construction completion
52 months (Traditional model) to
36 months (current)
In a project development model, where there is flexibility to spend a significant amount
of time on and between each of the phases, a well defined scope and engineering design
can certainly be achieved. It should be noted that the traditional model does not take into
consideration the opportunity cost of lost cash-flow, brought on by extended project
duration.
In the new paradigm, a couple of execution strategies are used in an attempt to hasten the
product to the market quicker, which in turn brings quicker cash flow to the owner. The
first one is to compress the project phases into shorter durations, which consequently
178
reduces the schedule. However, such a strategy can result in a loss of discipline in the
execution process, which can negatively impact the quality (Harris, 2009b). The second
strategy is to have overlapping project phases, as illustrated in Figure 7.3. In this strategy,
there is an overlap with the DBM phase, initiating just before the conceptual phase is
completed; EDS is started before DBM is completed and so on.
Figure 7.3. Overlapping EPC Phases
FEL 1Concept
FEL 2DBM
FEL 3EDS DE Const
7.2.2 Change Management
On SAGD projects, the construction of the surface facilities are predicated on the
reservoir data, which is known to change over a period of time, even after the wells have
started producing bitumen. Although reservoir data, which is collected over a period of
time from pilot plants set up during the project’s study phase, is available, this data too is
subject to change. The accuracy of this data is also predicated on the length of time upon
which the data has been collected; this results in a better understanding of the reservoir.
Therefore, the changing reservoir conditions coupled with simulations to achieve the
179
optimum bitumen production create a significant impact on the size and capacity of the
surface plant design (Edmunds & Suggett, 1995), which in turn impacts the key initial
deliverables such as PFDs and P&IDs (see Figure 7.4.). SAGD projects have constant
changes which need to be captured in an effective way so that they are communicated to
all the project disciplines and stakeholders. It therefore, becomes imperative that the
scope is comprehensively and well-defined in order to develop a baseline which can be
used for managing changes to the project.
7.2.3 Changes to PFDs and P&IDs
Due to the changing nature of the process design on SAGD projects and resulting
changes to the project, other engineering disciplines sometimes mention in jest that “the
process guys don’t know what they are doing!” While this is not an accurate assessment
of the process discipline, it shows the difficult nature of process design, especially on
SAGD projects, from which PFDs and P&IDs are developed; other engineering
disciplines, such as the mechanical, piping, civil, electrical, and instrument and control
(I&C) disciplines, depend on these drawings to complete the engineering and design for
their respective disciplines. Therefore, changes made to the process design result in
changes to the PFDs and P&IDs, which subsequently impact the other disciplines. As
illustrated in Figure 7.4., the process engineering group is dependent on the reservoir and
pilot plant data, since this data influences decisions on things such as the steam to oil
ratio (SOR). For that reason, it is the changes from the pilot plant data incorporated into
the process design, which is the major cause of incomplete or changing P&IDs (not the
process guys!).
180
As pointed out in the survey, this changing nature of P&IDs which is due to achieving
optimal conditions for the process design in an effort to minimize energy consumption,
has a huge impact on the execution of a SAGD project, particularly on the engineering
and design disciplines; it also impacts the schedule because of the additional time spent
optimizing the design. While it is impossible not to have changes at all to the design, and
therefore, to the P&IDs, changes up to the end of the Engineering Design Specifications
(EDS) phase can be acceptable but they should be controlled and kept to a minimum.
While changing P&IDs is also a problem on other oil & gas projects, the researcher
thinks that the reservoir conditions, which some people call the “black box”, creates a
greater impact on SAGD projects in comparison with other oil & gas projects.
7.2.4 Design Changes and 3D-Modelling
Another reason for the design changes is the versatility of the design tools used in the
process of designing the oil & gas plants. Over the last two decades or so, with powerful
computer aided drawing tools, such as AutoCAD and Smartplant, the ability to design a
three dimensional model of the entire plant, making design changes has become much
easier compared to the days when such tools were not available. During the days when
drawings were done manually using a pencil, ruler, paper, and an eraser, making design
changes required painstaking work requiring a great deal of time. Although studies are
not available, one can see that while improved technology and software tools have
provided greater efficiencies in plant design, it has also resulted in the unintended
consequence of making frequent design changes than before to the detriment of the entire
design process.
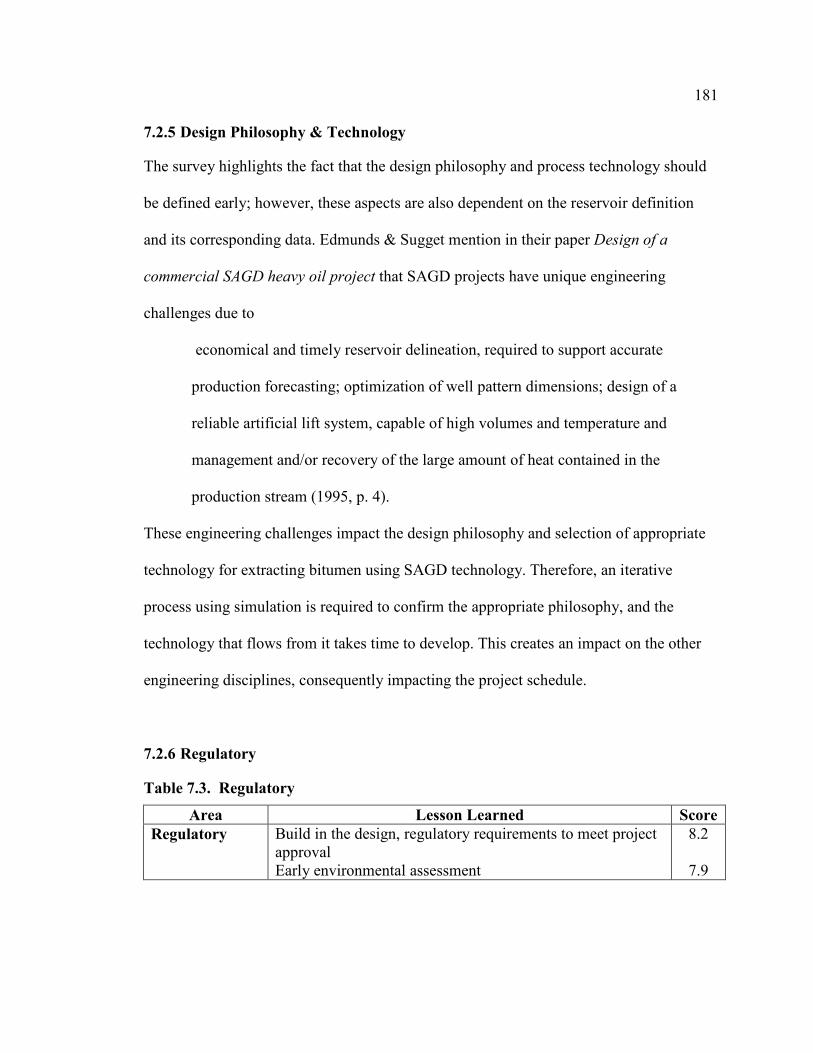
181
7.2.5 Design Philosophy & Technology
The survey highlights the fact that the design philosophy and process technology should
be defined early; however, these aspects are also dependent on the reservoir definition
and its corresponding data. Edmunds & Sugget mention in their paper Design of a
commercial SAGD heavy oil project that SAGD projects have unique engineering
challenges due to
economical and timely reservoir delineation, required to support accurate
production forecasting; optimization of well pattern dimensions; design of a
reliable artificial lift system, capable of high volumes and temperature and
management and/or recovery of the large amount of heat contained in the
production stream (1995, p. 4).
These engineering challenges impact the design philosophy and selection of appropriate
technology for extracting bitumen using SAGD technology. Therefore, an iterative
process using simulation is required to confirm the appropriate philosophy, and the
technology that flows from it takes time to develop. This creates an impact on the other
engineering disciplines, consequently impacting the project schedule.
7.2.6 Regulatory
Table 7.3. Regulatory
Area Lesson Learned Score
Regulatory Build in the design, regulatory requirements to meet project approval Early environmental assessment
8.2
7.9
182
Meeting Regulatory Requirements
The regulatory regime for building oil & gas facilities in Alberta is very strict and for
good reason - to protect its citizens and the environment from catastrophe and damage.
Therefore, in building SAGD and other oil & gas facilities, it is critical to be familiar
with the regulatory bodies and agencies that have jurisdiction over the project. Secondly,
in order to understand the regulatory issues and compliance required, it is necessary to
understand the reasoning and the basis of these regulations and incorporate them into the
design in order to meet the requirements. This understanding should permeate not only
within the Regulatory Approvals team (usually based in the Owner’s group), but also
within the engineering management and design teams. It is also critical to keep up with
any changes that the regulatory bodies bring that could have an impact on the project.
The reason for this caution and alertness is that obtaining regulatory approvals generally
take a very long time, and having to revise and or resubmit applications for approval and
implement any recommended changes by the regulatory bodies can setback the project
significantly in terms of schedule and opportunity cost. Above all, failing to meet all the
regulatory requirements would result in the project not receiving the building permits
required to start construction, thereby preventing the project from moving ahead.
7.2.7 Early Environmental Assessment
Similar to regulatory requirements, environmental assessments are a key component to
receiving project approval for oil & gas projects. It is important to involve environmental
groups early on so as to identify the guidelines and requirements such as baseline
disturbance assessments of the natural habitat surrounding the proposed plant’s vicinity.

183
7.3 Project Execution
Table 7.4. Project Execution
Area Lesson Learned Score
Project
Execution
Clear definition of roles/responsibilities/accountabilities of Workshare office Place senior/knowledgeable staff in Workshare office Assess operability/maintainability/constructability when engineering modules Simple well defined and updated work processes & procedure
8.4
8.0
8.0 7.9
7.3.1 Executing Project in Countries with a Lower Cost Advantage
To get a cost advantage over competitors, North American manufacturers have been
moving the labour component in the production of goods to lower cost countries. This
move has not only impacted the North American manufacturing sector, but it is also
starting to impact the service industries, given that more and more companies are opting
to move to lower cost centers to take advantage of this opportunity. Shifting of services
started with the telephone call centers by moving operations from North America to
lower cost countries like India, Mexico, China and the like.
More recently, although at a slower pace, other service providers, such as engineering
companies, have followed suit. Many large engineering companies, such as Jacobs, Fluor,
AMEC, and KBR, have had their offices worldwide to facilitate the execution of local
projects in the countries in which they operated. However, over the last decade, more
such companies are shifting the engineering work from their North American offices to
offices in countries where there is a significant cost advantage to the client. Some

184
engineering companies call this concept ‘Workshare’, which refers to a situation where
two or more offices worldwide would be involved in executing a single client’s project.
7.3.2 Workshare as an Executing Strategy
Workshare has its benefits and weaknesses; therefore, prior to embarking on a program,
the Workshare offices’ capabilities have to be assessed in order to assure the client that
the work can be executed. Prior to using Workshare as an execution strategy, as rated in
Round 2 of the lessons learned (see Table 7.4.), questions should be raised by owners and
EPC organizations; such questions include how and who will supervise the Workshare
team? How will the trust between the parent office and Workshare be developed in
ensuring that the correct project standards and procedures have been applied? Will the
Workshare be cost effective when applying measures such as productivity and the
additional time that has to be spent by the parent office to check and verify the drawings
produced by the Workshare office? Would the travel by project leads and managers
between the Workshare and parent office be too onerous, and would this pose any risks to
the project? Would there be engineers available in the Workshare office that possesses
the authority from the parent office’s country/province to stamp the drawings?
In addition, are there a clear definition of roles, responsibilities, and accountabilities of
the Workshare office? Having worked on a Workshare project, the researcher can
confirm the criticality of having roles and responsibilities clearly identified to ensure that
there is no ambiguity as to which office is supposed to be working on what scope; how
will the scope be executed? What tools will be used? What deliverables are to be
185
produced by each office? Who will prepare the schedules? What reports need to be
submitted to the parent project office? These are some of the questions that need to be
considered. Indeed, given all the parameters that need to be identified in order to achieve
a successful execution, initiating a Workshare is almost like starting a new project.
Another idea related to the Workshare concept is having a senior knowledgeable project
staff member posted to the Workshare office to provide the Workshare office with
coordination and supervision. This person could also provide technical and project
management support to the Workshare office. In addition, a technical person having a
good knowledge and understanding of the parent office’s standards and procedures could
clarify uncertainties relating to execution, project procedures, standards, quality control,
and other operational aspects. Moreover, by having a presence in the Workshare office, a
fair assessment of the project’s progress and performance, issues, and opportunities could
also be reported to the parent office.
Workshare, however, is not an easy strategy to implement; it requires educating the
Workshare office on the standards and codes of the province or country in which the
project is being executed. This sometimes involves rechecking the drawings at the home-
office to ensure that the standards are being followed and incorporated into the design.
Rework of the design is also required in instances of deficiencies. After all, it is the
parent office which is legally responsible for all engineering aspects relating to the
project; therefore, a high degree of diligence is required to ensure local standards and
codes are being applied and adhered to.

186
7.3.3 Operability, Maintainability and Constructability
When designing a facility during the engineering phase, the owners, project team,
construction, and operations and maintenance groups need to provide their feedback as
key stakeholders of the project. As far as the technical aspects of the project are
concerned, the plant operations group needs to be involved to ensure that what is being
built will be operable and will meet the standards and specifications set out by the
owners. The plant maintenance group is involved to ensure that access and safety
provisions have been incorporated into the design of the facility. The construction team
needs to provide feedback that what is being designed is constructible. Considerations,
such as moving cranes, rigging equipment and, vehicles, manpower density, and safety in
execution, are very important for them. From an execution perspective, the survey shows
that the above factors are particularly important during engineering of modules and all
the respective groups, namely, operations, maintenance, and construction; therefore, they
should provide their feedback so that it can be incorporated into the engineering design.
7.3.4 Simple Well Defined Project Procedures
Every project has procedures that need to be followed in order to have a consistent
engineering design and to be able to produce it efficiently. From preparing a schedule
using Inter Active Planning (IAP) sessions to designing P&IDs to archiving documents,
all these activities have procedures, some of which are provided by the project owner and
others by the EPC contractor; these procedures are written by experienced people who
have worked on projects before. However, the challenge arises when the procedures are
not comprehensive or have too much detail that makes it difficult to follow. In addition,

187
as mentioned earlier, a major question arises whether the procedures are well
communicated. This is important, considering the fact that the people working on projects
come from different backgrounds and may speak different languages, and therefore, may
have different understanding and interpretations of the procedures. Moreover, written
procedures can sometimes be overwhelming to understand and apply, and not having
updated procedures only adds to this challenge. It is from this perspective that the survey
participants felt that procedures should be simple and well defined so that the engineering
execution can be done effectively, efficiently, and therefore, with a high productivity.
7.3.4.1 Cause & Effect
It should also be stated that if deviation of procedures are not identified and corrected at
the beginning or early part of the project, they can result in a significant amount of
rework later on in the project. Such situations subsequently create a cascading impact on
the entire project. Often times, issues on projects are a result of not following project
procedures; in other words, there is a “cause & effect” relationship. While there can be
many reasons for deviation of procedures, a common cause is project team members
following the procedures from the previous project worked on. Many people assume that
the procedure is, for example, the same or not available, and therefore, they do not
always check their assumptions when working on a new project. Such assumptions often
lead to not following through the proper established procedures, which creates deviations,
delays, and rework.
188
7.4 Engineering
Table 7.5. Engineering
Area Lesson Learned Score
Engineering Fully developed and completed P&IDs (IFC) Fix basic process design early Early stakeholder (owner/construction/operation) involvement for design buy-in
8.4 8.4 8.3
7.4.1 Developing P&IDs
Piping and Instrument Diagrams (P&ID) show all the equipment, instruments, and
process and utility lines running through the oil & gas plant. The starting point to
developing P&IDs on a SAGD facility is the oil sands reservoir. To determine the
reservoir conditions and properties, a small pilot plant, which can cost as much as $30
million, is built. Its purpose is to mimic the functions of a large facility so that it can
provide data over a period of time in order to make decisions on the type of surface
facilities that can be built. This data may include a demonstration of the chemistry,
separations and purifications, and approximate yields (Navarrette & Cole, 2001).
The reservoir steam-to-oil ratio (SOR), which is the volume of steam injected to lift
bitumen out of the reservoir and to the surface also needs to be determined. The SOR is
one of the fundamental measures that is used to establish the qualities of the reservoir
(Fernando Gaviria, 2010). For example, a SOR of 3.0 indicates that three barrels of steam
are required to produce one barrel of bitumen. A high SOR indicates that more steam,
and therefore, more natural gas, which is needed to produce the steam, is required to lift
the bitumen, while a low SOR indicates the opposite. Figure 7.4. shows the data

189
collection process from an oil sands reservoir and how it is translated into the designing
of the SAGD plant.
On the basis of the reservoir data and the results from the pilot plant, the design criteria
for the surface facilities is established (Fernando Gaviria, 2010). Using the design
criteria, various scoping studies are done and options for plant design are developed
during the Study phase. From the options developed, a selection for the plant design is
made. The project then proceeds into the DBM phase, where the process flow diagrams
(PFD) are prepared by process engineers. These drawings illustrate the general design
and size of all the pieces of equipment, such as steam generators, heat exchangers,
pumps, and tanks, based on the flow pressure and initial flow rates from the reservoir.
The PFDs also show the heat and material balances and a list of the appropriate process
equipment, major instrument, and control systems required.
The process engineers develop the PFDs into more detailed P&IDs, from which the
piping design and engineering, mechanical, electrical, civil/structural, and instrument &
control (I&C) disciplines can further the design of the SAGD plant. As indicated in the
survey results, having fully developed and completed P&IDs issued for design (IFD)
during early detailed engineering is critical. The IFD P&IDs assure the other engineering
disciplines that there will be no major changes to the process design and that they can
proceed with the detailed design of the plant with minimal changes. It should be clarified
that the engineering disciplines are able to work with P&IDs IFD, as long as they are
issued by the EDS phase. The survey participants indicated that, P&IDs IFC are

190
important, particularly from a construction perspective. This is because IFC drawings
include the vendor data and are issued to construction once all the engineering disciplines
provide their input into the P&IDs, which happens late in the detailed engineering phase.
Figure 7.4. Process of Designing a Plant – From Reservoir to Engineering
ReservoirPilot
Plant
RESERVOIR
DATA
Process Design
PFDs
P&IDs Piping
Mechanical
Electrical
Civil/Structural
Instrument &
Control
7.4.2 Fix Basic Process Design Early
A solution to the late issuing of P&IDs IFC is to issue IFD drawings so that the
engineering disciplines can get started. However, the basic design needs to be completed
as early as possible so that any changes to design and rework can be minimized. On the
other hand, achieving the design early is not a simple issue. There are several
contributing factors to the lateness; of these factors, the most fundamental is the ever
changing oil sands reservoir data, given that having incomplete or changing reservoir

191
data from the pilot plant impacts the process design, which leads to changes to the PFDs
and P&IDs (Fernando Gaviria, 2010).
Secondly, SAGD is a fairly new technology, and therefore, in seeking solutions to
meeting the design conditions, changes to the technology can sometimes impact the
design. Technology selection is usually done during the Study phase. The resulting
design options and the development of PFDs and subsequent P&IDs have to be reviewed
and approved by the owner before they can be IFD before completion of the EDS phase.
The selection of the options is predicated on the economics of the project; this, together
with other decisions which the owner has to firm up, takes time to finalize. Meanwhile,
the engineering disciplines are waiting for confirmation of the design options; however;
the project schedule is fixed and does not change. This is the reason why there is
impatience on the disciplines’ part to fix the basic process design early in order to have
sufficient time to work on the detailed engineering and design.
7.4.3 Stakeholder Approval for Design
When building SAGD projects, there are generally two different owners who can be
considered the major stakeholders of the project. The first owner is the operations group,
which owns the facility; the second owner is the project team, which undertakes the
execution of the project. The project team is supported by the contractors in areas of
engineering, procurement, and construction. Figure 7.5. shows that the two groups are
important stakeholders in the execution of a project. Approval of the design, involves
these and other stakeholders who provide feedback due to their interests in the project.
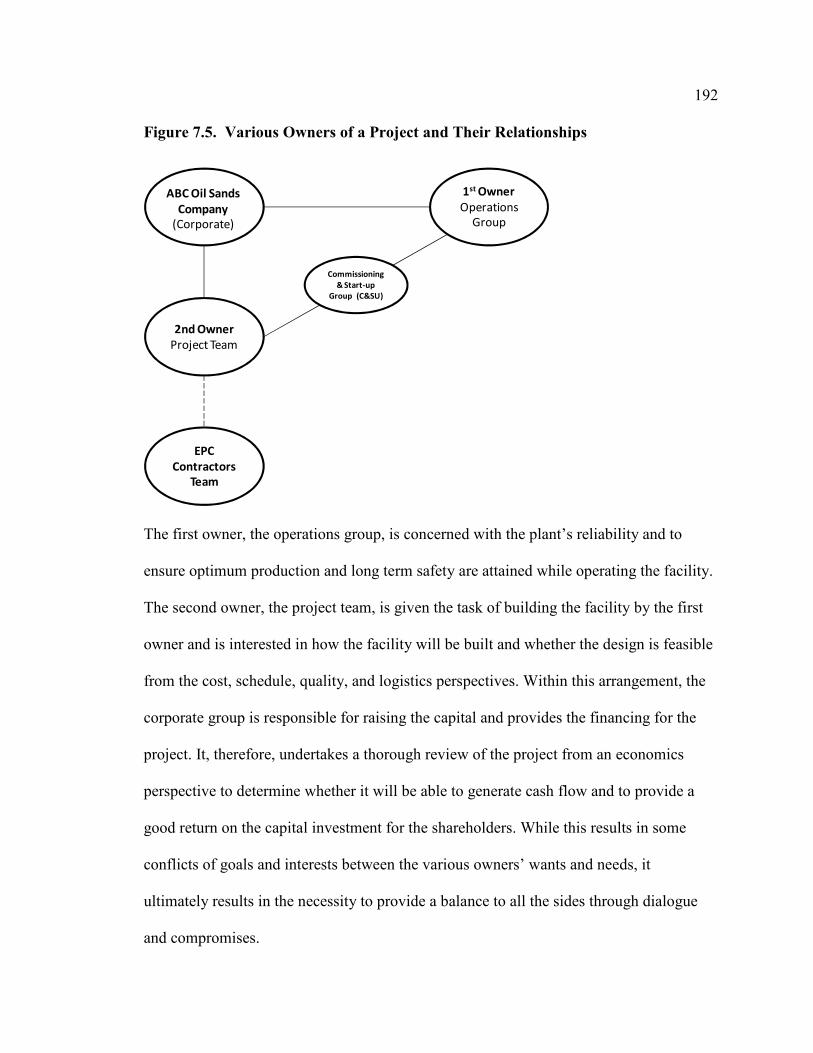
192
Figure 7.5. Various Owners of a Project and Their Relationships
ABC Oil Sands
Company
(Corporate)
1st Owner
Operations
Group
2nd Owner
Project Team
EPC
Contractors
Team
Commissioning
& Start-up
Group (C&SU)
The first owner, the operations group, is concerned with the plant’s reliability and to
ensure optimum production and long term safety are attained while operating the facility.
The second owner, the project team, is given the task of building the facility by the first
owner and is interested in how the facility will be built and whether the design is feasible
from the cost, schedule, quality, and logistics perspectives. Within this arrangement, the
corporate group is responsible for raising the capital and provides the financing for the
project. It, therefore, undertakes a thorough review of the project from an economics
perspective to determine whether it will be able to generate cash flow and to provide a
good return on the capital investment for the shareholders. While this results in some
conflicts of goals and interests between the various owners’ wants and needs, it
ultimately results in the necessity to provide a balance to all the sides through dialogue
and compromises.
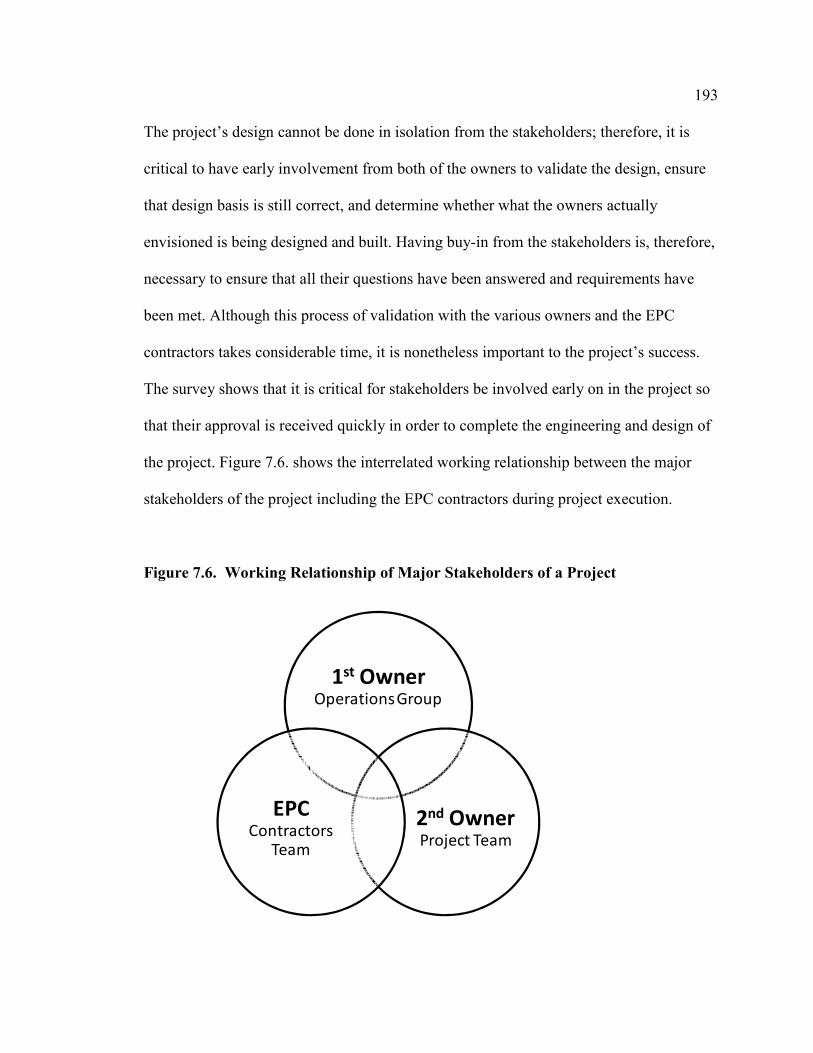
193
The project’s design cannot be done in isolation from the stakeholders; therefore, it is
critical to have early involvement from both of the owners to validate the design, ensure
that design basis is still correct, and determine whether what the owners actually
envisioned is being designed and built. Having buy-in from the stakeholders is, therefore,
necessary to ensure that all their questions have been answered and requirements have
been met. Although this process of validation with the various owners and the EPC
contractors takes considerable time, it is nonetheless important to the project’s success.
The survey shows that it is critical for stakeholders be involved early on in the project so
that their approval is received quickly in order to complete the engineering and design of
the project. Figure 7.6. shows the interrelated working relationship between the major
stakeholders of the project including the EPC contractors during project execution.
Figure 7.6. Working Relationship of Major Stakeholders of a Project
1st Owner Operations Group
2nd Owner Project Team
EPC Contractors
Team
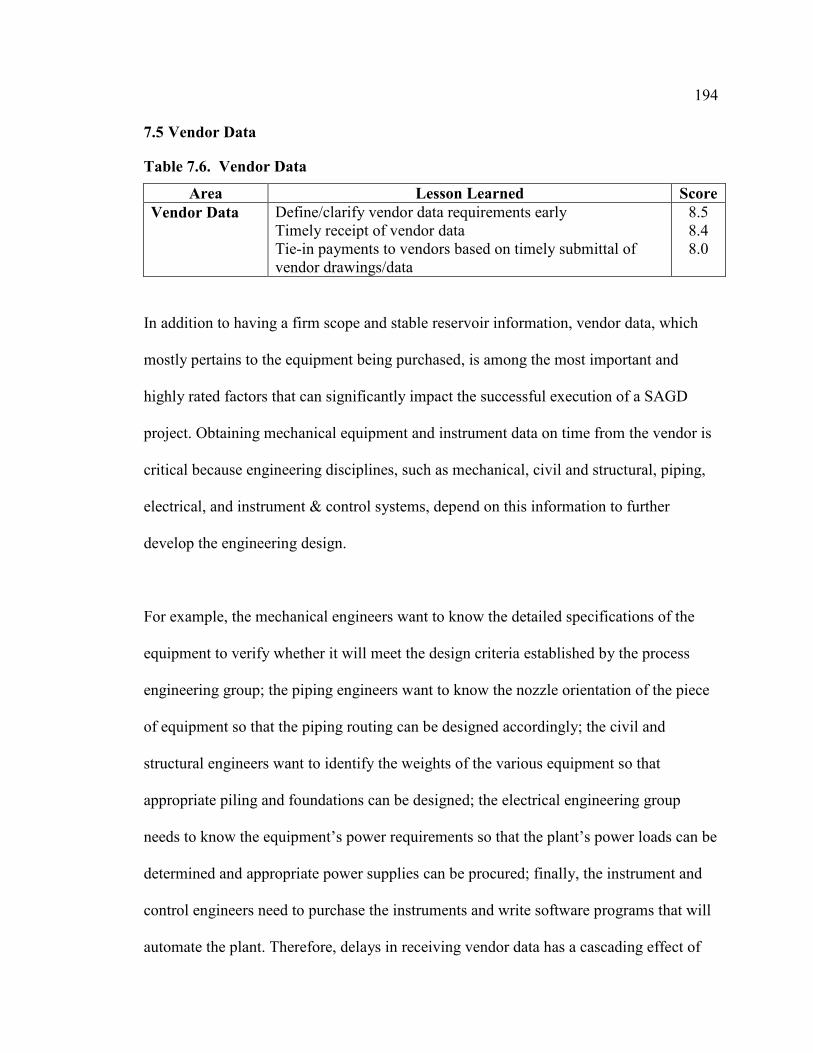
194
7.5 Vendor Data
Table 7.6. Vendor Data
Area Lesson Learned Score
Vendor Data Define/clarify vendor data requirements early Timely receipt of vendor data Tie-in payments to vendors based on timely submittal of vendor drawings/data
8.5 8.4 8.0
In addition to having a firm scope and stable reservoir information, vendor data, which
mostly pertains to the equipment being purchased, is among the most important and
highly rated factors that can significantly impact the successful execution of a SAGD
project. Obtaining mechanical equipment and instrument data on time from the vendor is
critical because engineering disciplines, such as mechanical, civil and structural, piping,
electrical, and instrument & control systems, depend on this information to further
develop the engineering design.
For example, the mechanical engineers want to know the detailed specifications of the
equipment to verify whether it will meet the design criteria established by the process
engineering group; the piping engineers want to know the nozzle orientation of the piece
of equipment so that the piping routing can be designed accordingly; the civil and
structural engineers want to identify the weights of the various equipment so that
appropriate piling and foundations can be designed; the electrical engineering group
needs to know the equipment’s power requirements so that the plant’s power loads can be
determined and appropriate power supplies can be procured; finally, the instrument and
control engineers need to purchase the instruments and write software programs that will
automate the plant. Therefore, delays in receiving vendor data has a cascading effect of
195
delaying all the engineering disciplines, and consequently, impacting the construction of
the facility, putting the project behind schedule.
There are numerous factors for delays in receiving the vendor data. Generally speaking,
the reasons can be classified into two categories, internal reasons, which refer to issues
from within the project, and external, referring to issues brought on by the vendor.
7.5.1 Internal Factors
7.5.1.1 Well Defined Project Scope
The project scope is perhaps the biggest factor that can impact vendor data. When scope
is not fully defined and changes are made to it due to technological or financial
considerations, the design to the equipment to be purchased also changes. This not only
results in changes to the design of the equipment, but also changes to the data relating to
the equipment. Almost 90% of the electrical, instrument and control, and mechanical
equipment are custom made for a specific plant design (Corner, 2010); equipment such as
pumps, vessels, heaters, and exchangers are not always available off the shelf from the
vendor’s shop and have to be fabricated from scratch. This is one of the major reasons
why it is critical to have a well defined scope so that frequent changes to the vendor data
are eliminated, and that it can be provided on a timely basis.
7.5.1.2 Design Changes
When the scope is not well defined, there is a high potential of having numerous design
changes, which impact other engineering disciplines including equipment and other

196
vendors. It should be noted that some of the long lead items, such as equipment on a
SAGD and other oil & gas projects, are ordered on the basis of engineering design that is
only 30% complete. With changes to the plant capacity, due to changes in reservoir data,
plant optimization, and so on, the equipment sizes and capacities change accordingly.
These changes require the engineering design group to revise the previously issued
drawings and re-issue a new set of drawings in order to meet the updated equipment
capacities, which consequently impact the vendors.
Typically, there are three major issues of the engineering design drawings, namely,
issued for (owner’s) review (IFR), issued for design (IFD), and issued for construction
(IFC). With the increasing number of revisions to the drawings, there is an equally
corresponding impact on the vendor because they now have to review the re-issued
engineering drawings, revise the vendor prints, and issue it back to the engineering
design company. Therefore, design changes create a cascading impact on other project
stakeholders such as vendors.
7.5.1.3 Schedule
The design changes described above ultimately create an impact to the engineering, and
subsequently, the construction schedule. Sometimes, the turn-around time in the schedule
for providing the vendor data to the mechanical engineering group is too tight; it does not
take into account, for example, the fact that vendors have sub-vendors to whom they
subcontract some of the work. Therefore, a delay at the sub-vendors shop can impact the
prime vendor, which in turn has the potential to impact the overall project schedule.

197
7.5.1.4 Contractual Relationship with Vendor
To minimize risk, many large oil & gas companies build relationships with vendors so
they could provide them with preferential treatment in terms of pricing and securing a
long-term supply of goods and services. Such relationships are formalized into contracts,
such as sole source, supplier of choice, strategic partner, etc; in theory, this helps reduce
the owner’s risk. While such contracts and relationships are supposed to be beneficial to
both parties, during heated market conditions, there is certain complacency on the part of
the vendors to fulfill their obligations to the owners, as was the case during the recent
boom (2006-2008). This includes areas such as vendor data, where despite having a
supplier of choice agreement or sole source contracts, the motivation to provide this
information on a timely basis was not as strong as one would hope for.
On the other hand, from the procurement department’s perspective, sole source and
supplier of choice relationships have their advantages such as being familiar with the
vendor and their technical skills & capabilities, safety standards, quality, dependability
(or the lack of) service, price, etc. Therefore, there is a certain amount of comfort due to
lower risks in such arrangements. Consequently, there is reluctance to change this
relationship and move to another vendor. In addition, moving to other suppliers requires
time from the procurement and corporate groups to evaluate the vendors, among other
things, which is difficult to find during a fast paced project execution. With such a
predicament, a question arises that, would there be better service provided if the owner
companies moved away from sole source contracts and put out to bid on every contract?
Would this strategy translate into a greater incentive to provide vendor data on time?
198
7.5.2 External Factors
7.5.2.1 Impact of Sub-Vendors
In order to manufacture a piece of equipment, especially large complex ones, the vendor
typically sub-contracts parts of the scope to other sub-vendors. As illustrated in the
example (Corner, 2010) in Figure 7.7., in order to manufacture a pump, a Vendor XYZ
would have three separate sub-vendors. Sub-vendor A would fabricate the casting, sub-
vendor B would make the lube oil skid, and sub-vendor C would manufacture the motor.
Vendor XYZ is now dependant on all the three sub-vendors to provide all the data so that
they can finalize the engineering drawings to provide them to the owner/EPC. The prime-
vendor cannot integrate, consolidate, and complete the vendor package unless
information from all the other vendors is received.
Moreover, in some cases, the sub-vendors themselves have other vendors, whom they
subcontract, thus creating a sequence of vendors. A delay on the part of any single sub-
vendor or sub-sub-vendor has the potential of creating a delay for the entire piece of
equipment. This in turn impacts the project in terms of the engineering sequence and
rework is created as a result. Managing all these vendors and their activities can prove to
be a complex and difficult task for the prime vendor, and if not well-managed, this can
potentially become a bottleneck for the entire project.
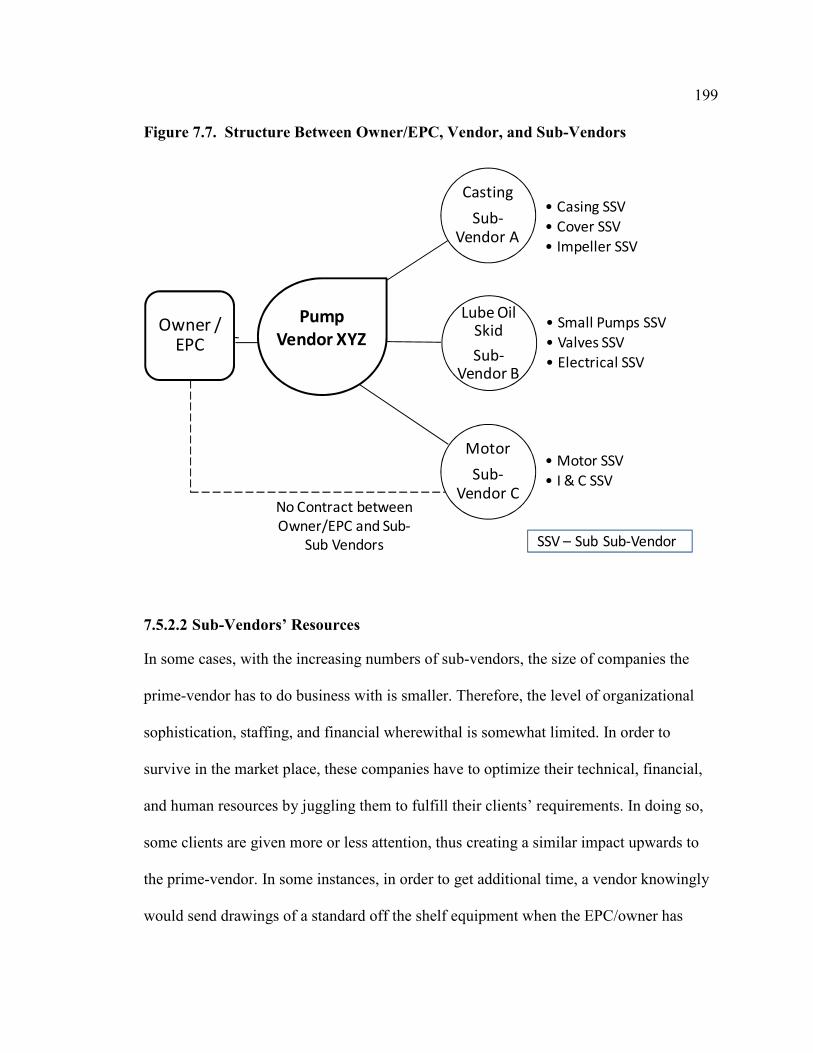
199
Figure 7.7. Structure Between Owner/EPC, Vendor, and Sub-Vendors
Owner / EPC
Casting
Sub-Vendor A
• Casing SSV
• Cover SSV
• Impeller SSV
Lube Oil Skid
Sub-Vendor B
• Small Pumps SSV
• Valves SSV
• Electrical SSV
Motor
Sub-
Vendor C
• Motor SSV
• I & C SSV
Pump
Vendor XYZ
SSV – Sub Sub-Vendor
No Contract between
Owner/EPC and Sub-
Sub Vendors
7.5.2.2 Sub-Vendors’ Resources
In some cases, with the increasing numbers of sub-vendors, the size of companies the
prime-vendor has to do business with is smaller. Therefore, the level of organizational
sophistication, staffing, and financial wherewithal is somewhat limited. In order to
survive in the market place, these companies have to optimize their technical, financial,
and human resources by juggling them to fulfill their clients’ requirements. In doing so,
some clients are given more or less attention, thus creating a similar impact upwards to
the prime-vendor. In some instances, in order to get additional time, a vendor knowingly
would send drawings of a standard off the shelf equipment when the EPC/owner has
200
clearly stated that the order is for custom made equipment. In other cases, vendors would
provide the engineering company Code 2 drawings (where comments from the
owner/EPC are to be incorporated in the drawings to proceed with engineering) when
Code 1 drawings (clean documents where the EPC have no comments resulting from
review of vendor data to go ahead with fabrication) are required. Such anomalies
naturally result in back and forth inquiries between owner/EPC and the vendor, which
provides the sub-vendors additional time until the appropriate personnel, are available to
work on the customer’s order.
7.5.2.3 Schedule
The other issue is the vendor’s inability to receive schedules from the sub-vendors and
track them. Referring to the example Figure 7.7., since Vendor XYZ would not have the
schedules of the Sub-vendors A, B & C, it becomes difficult to provide a good
perspective to be able to inform the owner/EPC on when to expect the data and the
drawings for the equipment.
7.5.2.4 Contractual Relationship between Owner/EPC and Vendors/Sub-Vendors
Another aspect that creates difficulty is that there is no direct contractual relationship
between the owner/EPC and the sub-vendors; the contract is solely between the
owner/EPC and the vendor. The vendor has a contractual relationship with the sub-
vendors. Such a contractual relationship consequently puts the owner/EPC at a
disadvantage; they cannot go directly to the sub-vendors and influence them to expedite
the vendor data, even in situations when the information is time sensitive.

201
7.5.2.5 Vendors’ Technical Capabilities
Within North America, there are a number of specialized vendors who have highly rated
technical expertise in the manufacturing and supplying of certain types of parts and
equipment. These manufacturers are the ones who receive the bulk of the orders, and
because of this, they are a victim of their own success. Consequently, when the vendor
drawings are delayed, the orders are subsequently delayed. One can argue that with
globalization, there are possibly other countries in the world where such equipment could
be purchased. This strategy certainly helps in cases where the manufacturers do not have
sufficient resources locally to execute the work to meet the schedule (Corner, 2010). Due
to the proximity of North American manufacturers and not having to deal with language
and cultural issues, there exists a comfort factor, which ultimately results in reluctance to
procure supplies from outside the North American continent.
In concluding this section, the above reasons, among others, are why the survey
participants have rated timely information of vendor data as very critical to the successful
execution of SAGD projects. This area is and continues to be a major issue on most oil &
gas projects despite the best intentions and commitments from the vendors.
7.6 Quality
Table 7.7. Quality
Area Lesson Learned Score
Quality Ensure owner quality requirements are met Vendor quality management for larger packages
8.3 8.3
202
7.6.1 Meet Owner Quality Requirements
Over the years, oil & gas companies have executed numerous projects, and therefore,
they have built and established their own quality standards and requirements. While some
of these requirements come from the regulatory bodies, such as Alberta Energy
Resources and Conservation Board (ERCB), Alberta Boiler Safety Association (ABSA)
and other standards setting organizations such as American Petroleum Institute (API)
etc., they are integrated into the owner’s quality requirements so that both regulatory and
company requirements can be met simultaneously.
The numerous quality requirements can be as simple as a pipe’s metallurgy to carry
certain petroleum products to the more complex such as standards for electrical or
compressor packages. The quality requirements are checked and verified by either a third
party or the owner’s own quality assurance and control (QA/QC) inspection group.
Inspection for larger and costly equipment is periodically done at the vendor’s shop
during the manufacturing process; for critical equipment, the owner’s representative is
permanently stationed in the vendor’s shop to monitor the quality requirements. Not
meeting the owner’s or the regulatory bodies’ quality requirements can result in rework,
thereby increasing the cost of the project and causing delay to the schedule. Meeting the
owner’s quality requirements, according to the survey participants, is a significant aspect
of the successful execution of SAGD and other oil & gas projects, and therefore, they
have identified it as important by scoring this lesson learned fairly high.
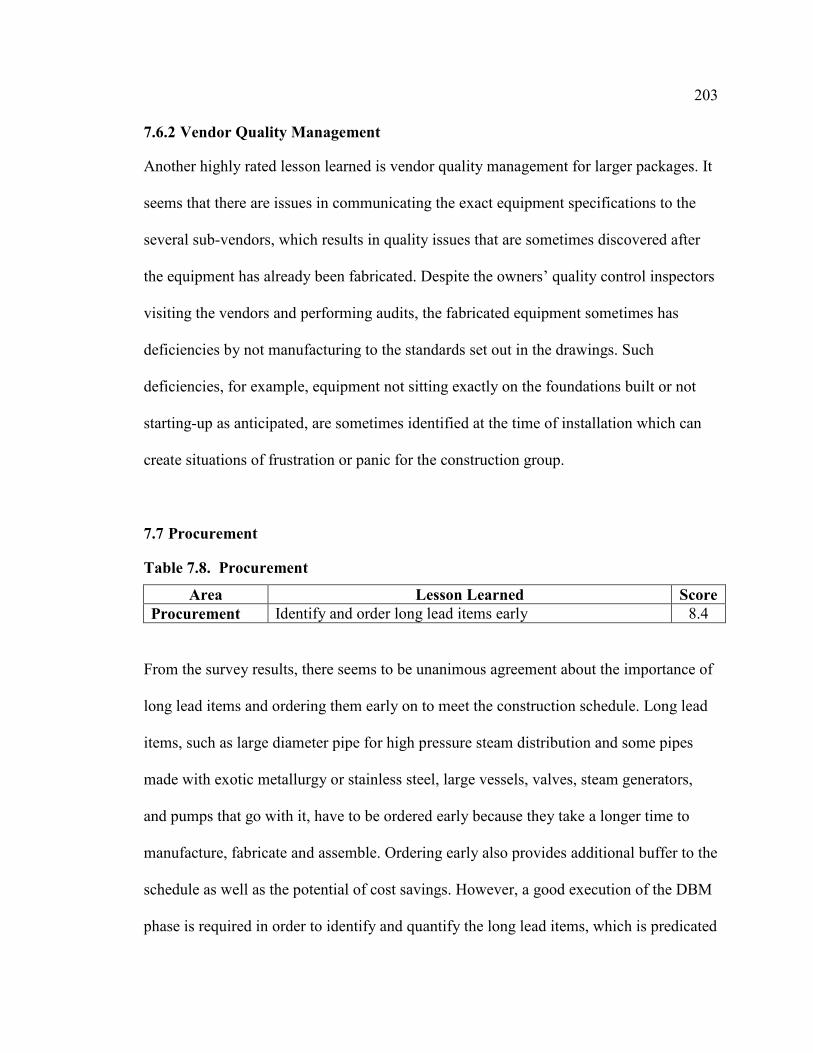
203
7.6.2 Vendor Quality Management
Another highly rated lesson learned is vendor quality management for larger packages. It
seems that there are issues in communicating the exact equipment specifications to the
several sub-vendors, which results in quality issues that are sometimes discovered after
the equipment has already been fabricated. Despite the owners’ quality control inspectors
visiting the vendors and performing audits, the fabricated equipment sometimes has
deficiencies by not manufacturing to the standards set out in the drawings. Such
deficiencies, for example, equipment not sitting exactly on the foundations built or not
starting-up as anticipated, are sometimes identified at the time of installation which can
create situations of frustration or panic for the construction group.
7.7 Procurement
Table 7.8. Procurement
Area Lesson Learned Score
Procurement Identify and order long lead items early 8.4
From the survey results, there seems to be unanimous agreement about the importance of
long lead items and ordering them early on to meet the construction schedule. Long lead
items, such as large diameter pipe for high pressure steam distribution and some pipes
made with exotic metallurgy or stainless steel, large vessels, valves, steam generators,
and pumps that go with it, have to be ordered early because they take a longer time to
manufacture, fabricate and assemble. Ordering early also provides additional buffer to the
schedule as well as the potential of cost savings. However, a good execution of the DBM
phase is required in order to identify and quantify the long lead items, which is predicated
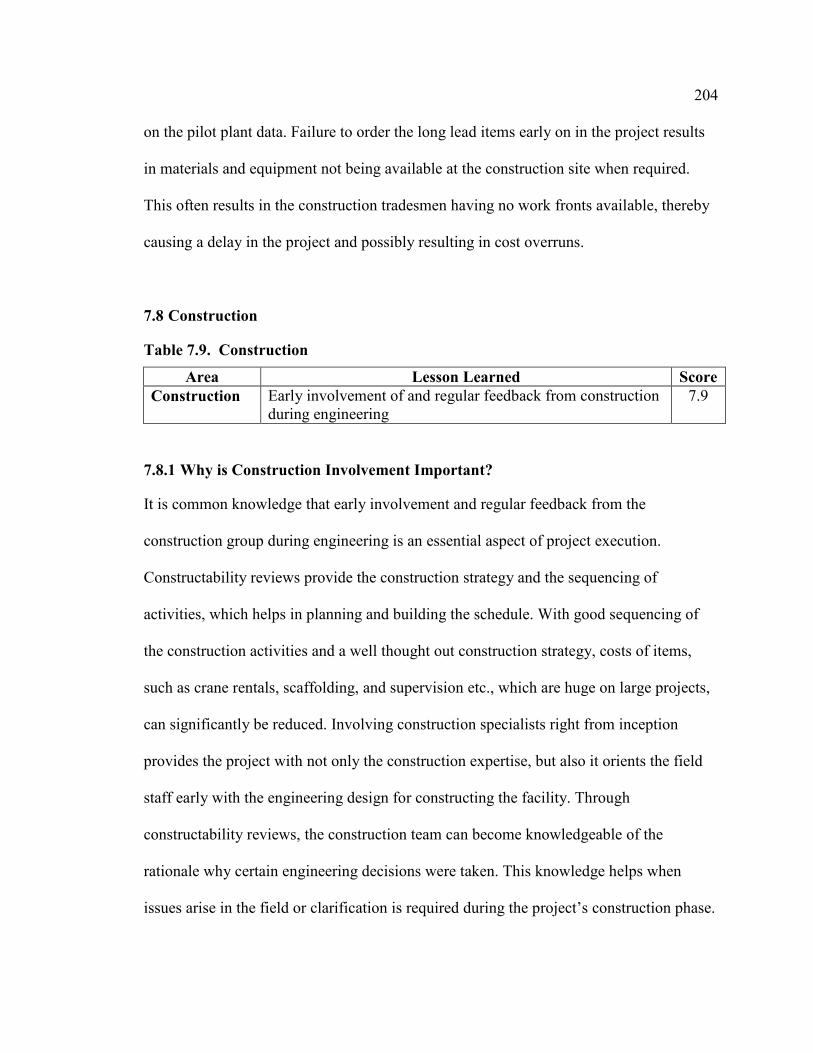
204
on the pilot plant data. Failure to order the long lead items early on in the project results
in materials and equipment not being available at the construction site when required.
This often results in the construction tradesmen having no work fronts available, thereby
causing a delay in the project and possibly resulting in cost overruns.
7.8 Construction
Table 7.9. Construction
Area Lesson Learned Score
Construction Early involvement of and regular feedback from construction during engineering
7.9
7.8.1 Why is Construction Involvement Important?
It is common knowledge that early involvement and regular feedback from the
construction group during engineering is an essential aspect of project execution.
Constructability reviews provide the construction strategy and the sequencing of
activities, which helps in planning and building the schedule. With good sequencing of
the construction activities and a well thought out construction strategy, costs of items,
such as crane rentals, scaffolding, and supervision etc., which are huge on large projects,
can significantly be reduced. Involving construction specialists right from inception
provides the project with not only the construction expertise, but also it orients the field
staff early with the engineering design for constructing the facility. Through
constructability reviews, the construction team can become knowledgeable of the
rationale why certain engineering decisions were taken. This knowledge helps when
issues arise in the field or clarification is required during the project’s construction phase.
205
One issue common on many large projects is that while engineers in the home-office
frequently need construction feedback on their design, there are not always enough
construction representatives or experts available to conduct reviews during the design
phase. In the survey, a rating of 7.9 for the lesson learned “early involvement of and
regular feedback from construction during engineering” is relatively low in the top thirty
lessons learned. This could be because engineers and designers working on the projects
have gotten used to working without the construction group’s complete input, or they
may have come up with alternative strategies to get the construction feedback. Therefore,
they do not see construction feedback as critical any longer.
7.8.2 Degree of Construction Involvement
There are several questions regarding the involvement of the construction team one
should review on projects: to what degree are construction people really involved in the
whole planning process, and if they are, do the project teams receive their undivided
attention? Are construction reviews enough to understand the design, or should the
construction representatives be intimately involved in the design on a daily basis?
Moreover, are the construction representatives available during the planning phase
actually going to be there when the construction actually starts, or will there be another
group with little firsthand knowledge of the conditions and assumptions leading to the
decisions made during the engineering phase? Complete implications of these and other
questions, as simple as they may be, are not given enough thought by the project
management team. One of the project managers in the survey agreed that the lack of
construction people during the design phase is an issue. However, one needs to assess the

206
risks and proceed with the design fully aware that it could possibly create an impact
during the construction phase.
7.8.3 Construction Scope
Another aspect that needs to be considered is the construction scope execution. As
mentioned in the preceding discussion, an important factor to consider is whether the
engineers have a clear understanding of the scope and how it will be executed by the
construction group. For example, in what sequence will the Construction Work Packages
(CWP) be required so that the Engineering Work Packages (EWP) can be prepared in that
order to meet the construction execution strategy? What is the optimum number of
packages that can be accommodated in a CWP for efficient construction execution? All
such information pertaining to the scope needs to be thought out during the front-end
planning and worked backwards to determine the execution sequence
7.9 Management
Table 7.10. Management
Area Lesson Learned Score
Management Knowledge/experience of management processes to execute large projects
8.6
In Round 2 of the survey, apart from communications, knowledge and experience of
management processes to execute large projects was the highest ranked lesson learned.
This was a surprise to the researcher because on large projects such as a SAGD,
engineering underpins everything that happens in designing and building the project. In
addition, decisions taken during engineering have far reaching consequences, and

207
therefore, its potential to have a higher impact on a project could be much greater.
Therefore, one could presume that some aspects of engineering would be more of a
critical lesson learned, and as a result, these aspects would have a greater impact on the
successful execution of a project. To the contrary, the survey participants suggested that
knowledge/experience of management in executing projects is more important and has a
greater impact on project execution. Similar to the survey participants’ placing greater
importance on project management to achieve project success, Krahn concludes in her
study on project leadership that project management tools and techniques can help make
a great impact on the success of a project (2005).
7.9.1 Roles & Responsibilities
A dominant theme in the area of management was the roles and responsibilities of the
team members of the project organization. While every project has an organization chart,
certain questions need to be answered, such as, is the job description for the various
positions clear, and are the roles, responsibilities, and the accountability that goes with it
clearly defined? Is this communicated to the project team members? Do the team
members know how to interface with each other? Are the lines of authority for all
practical purposes followed the way they are, say, in a military organization? The reason
why these questions are important in a project organization is because with clear lines of
authority, overlapping of roles and duplication of effort, which occur on some projects,
can be avoided. More importantly, the project can be controlled and directed with
appropriate decisions by the responsible team members in order to achieve the objectives
set out for their respective areas and the project as a whole.

208
7.9.2 Decision Making
Decision making is another area suggested in the survey which is critical to effective
project management. As one participant stated “Due to risk avoidance in decision
making, people don’t want to own the mistake (if there is one) resulting in more people
being involved in decision making.” This results in, he continued “decision by committee
resulting in sub-optimal decisions”. Needless to say, the voices of the people who are
going to do the actual implementation are not heard. Such decisions are not only sub-
optimal, but also time-consuming, and in reality impacting the project schedule.
7.10 Schedule
Table 7.11. Schedule
Area Lesson Learned Score
Schedule Set realistic key schedule milestone dates Plan ahead to take advantage of weather windows – (Northern Alberta)
8.4 7.9
7.10.1 Realistic Schedule
This area of lessons learned is one of the highly rated areas in the survey, suggesting that
it has a significant impact on the successful execution of SAGD projects. Schedule
impacts everyone on the project, regardless of whether it is the engineering, procurement,
or construction group. The further down in the schedule a group is in terms of completing
the deliverables, the greater its impact to them, which can be positive or negative. Hence,
the schedule needs to be realistic and based on the project execution team’s perspective.
The perception among the project team is that the schedules for project completion are
often prepared by the owner’s corporate departments and handed over to the project team

209
to execute based on some predetermined time frames. In some cases, due to various
reasons, the project teams find it difficult to achieve these dates of completion. Therefore,
the survey participants suggested that there is a need to have schedules that meet the
needs of the owner as a whole and the project team’s ability to execute it.
7.10.2 Developmental Projects
One survey participant fittingly defined SAGD projects as “developmental projects” and
defined it as an innovative project or approach which is new to many people due to lack
of appropriate experience. Developmental projects such as SAGD require many technical
decisions to be taken with many unknowns in terms of scale and schedule. The solution
for this ever-present uncertainty is to spend and provide enough time in the front-end to
check and validate assumptions relating to the reservoir conditions. This will also help in
preventing redesigning parts of the plant later during detailed engineering. Some survey
participants also argued that the initial schedule should be prepared by the project team,
not by the finance or business development teams. This is because, it is the project team
that better understands the activities and deliverables required to carry out the scope and
is therefore in a better position to prepare the schedule which can result in timely project
execution and completion.
7.10.3 Gestation Period
The participants suggested that the schedule should have realistic dates based on standard
deliverable durations (from historical projects), instead of having a compressed schedule
driven by current business and market conditions. Compressing the schedule into one
210
with a shorter duration can result in problems arising later on in the project. In order to
execute the deliverables effectively “do not bypass time proven schedules by reducing
engineering durations,” suggested one seasoned participant. He continued saying “one
cannot have a gestation period which is inadequate...one has to go through the proper
thinking process and have proper information to complete the job”. What he was
implying is that in order to complete certain deliverables, the schedule cannot be
compressed by increasing the number of engineers on the project. Each job is unique, and
therefore, a period of thinking, strategizing, and deliberation is required to ensure that a
good plant design is ultimately achieved. This not only benefits the project owner but the
engineering team as well, given that there is a degree of satisfaction derived from a job
well done!
7.10.4 Procurement
In building the schedule, it is essential to have effective input from the procurement or
supply chain group, which is a major stakeholder on the project. Approximately 35% of
the project’s budget is spent on procuring equipment and bulk materials; therefore,
involving the procurement group early on in the project is essential for planning and
having a realistic schedule, which can result in timely material & equipment deliveries.
7.10.5 Modularization
Another important area that needs to be effectively addressed in the schedule is
modularization. In building SAGD facilities in Northern Alberta, modularization has now
become a key construction strategy. It has become an effective way to get partial
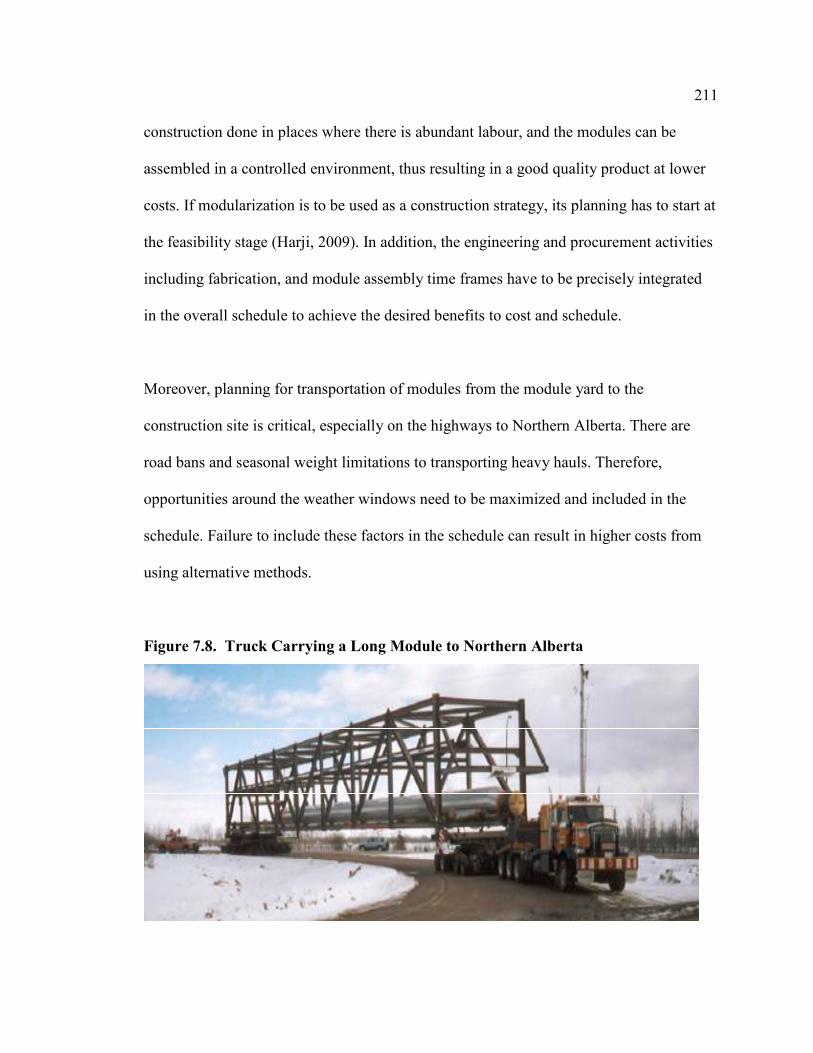
211
construction done in places where there is abundant labour, and the modules can be
assembled in a controlled environment, thus resulting in a good quality product at lower
costs. If modularization is to be used as a construction strategy, its planning has to start at
the feasibility stage (Harji, 2009). In addition, the engineering and procurement activities
including fabrication, and module assembly time frames have to be precisely integrated
in the overall schedule to achieve the desired benefits to cost and schedule.
Moreover, planning for transportation of modules from the module yard to the
construction site is critical, especially on the highways to Northern Alberta. There are
road bans and seasonal weight limitations to transporting heavy hauls. Therefore,
opportunities around the weather windows need to be maximized and included in the
schedule. Failure to include these factors in the schedule can result in higher costs from
using alternative methods.
Figure 7.8. Truck Carrying a Long Module to Northern Alberta
212
7.10.6 Third Party Issues
7.10.6.1 Involvement at Project Meetings
Although third party contractors are major contributors and important stakeholders to a
project, they are not involved as much during the project meetings held with the owner
and the EPC. As a result, they miss out on the communications, and therefore, miss out
on the opportunity to fully appreciate the project’s urgency for certain deliverables. On
the other hand, third party contractors would not always have the human resources to be
represented at all the project meetings, thus complicating the situation.
7.10.6.2 Third Party Deliverables in Master Schedule
Often times, third party deliverables are not included in the overall master schedule in as
much detail as required, which is another reason for the challenge in meeting the
schedule. The root cause is the failure to include in the contract with vendors a
requirement to submit a Level 2/3 schedule. As a result, the project controls team is
unable to monitor and track the delivery of the vendor’s promised deliverables so as to
bring it to the project manager’s attention.
7.10.7 Is the Project Cost or Schedule Driven?
A final point on the topic of schedule, which was not a concern for the project managers
but a concern for the engineers, was to define for the project team whether the project is
cost driven or schedule driven. This point comes from the fact that the engineering team
has to provide the project design consisting of various engineering deliverables. Knowing
where the project owner’s emphasis is in terms of cost or schedule helps the engineers
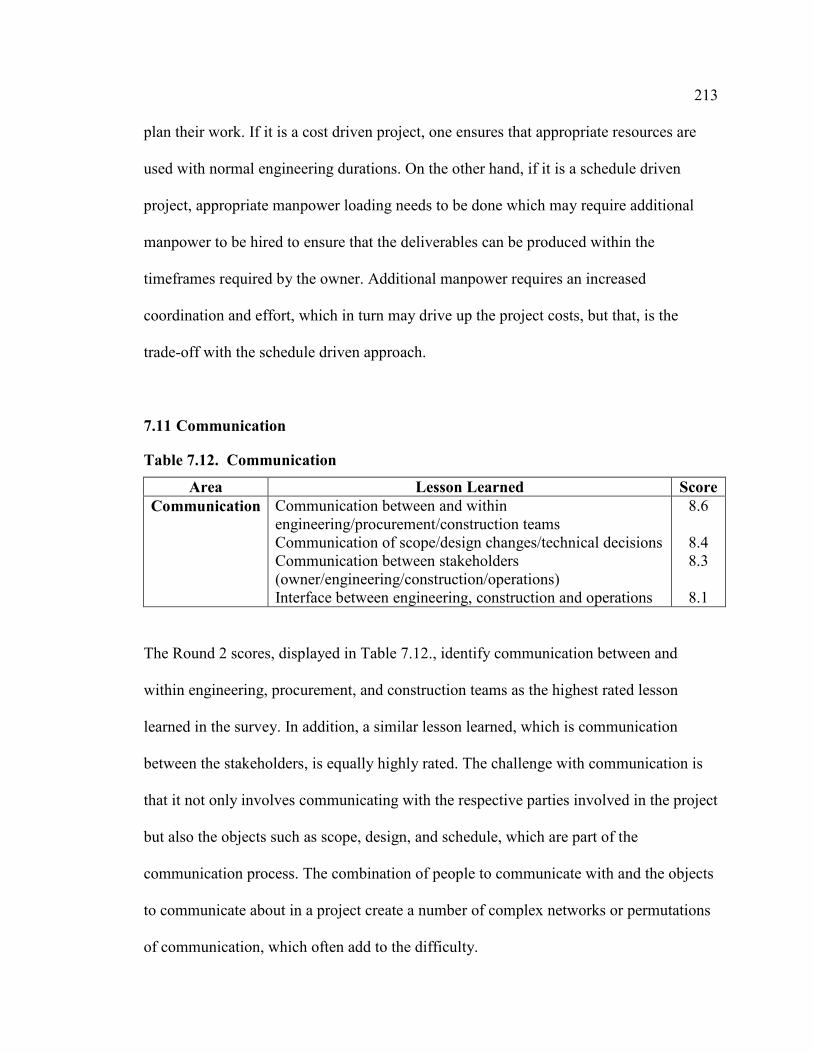
213
plan their work. If it is a cost driven project, one ensures that appropriate resources are
used with normal engineering durations. On the other hand, if it is a schedule driven
project, appropriate manpower loading needs to be done which may require additional
manpower to be hired to ensure that the deliverables can be produced within the
timeframes required by the owner. Additional manpower requires an increased
coordination and effort, which in turn may drive up the project costs, but that, is the
trade-off with the schedule driven approach.
7.11 Communication
Table 7.12. Communication
Area Lesson Learned Score
Communication Communication between and within engineering/procurement/construction teams Communication of scope/design changes/technical decisions Communication between stakeholders (owner/engineering/construction/operations) Interface between engineering, construction and operations
8.6
8.4 8.3
8.1
The Round 2 scores, displayed in Table 7.12., identify communication between and
within engineering, procurement, and construction teams as the highest rated lesson
learned in the survey. In addition, a similar lesson learned, which is communication
between the stakeholders, is equally highly rated. The challenge with communication is
that it not only involves communicating with the respective parties involved in the project
but also the objects such as scope, design, and schedule, which are part of the
communication process. The combination of people to communicate with and the objects
to communicate about in a project create a number of complex networks or permutations
of communication, which often add to the difficulty.
214
Communication is generally a misunderstood word, particularly in execution of oil and
gas projects. George Bernard Shaw is quoted saying “The greatest problem with
communication is the illusion that it is accomplished” (Thinkexist.com, 2010). This is
exactly what happens on projects; the assumption that the other person or party has
received the communication and has understood what is being communicated. This
‘illusion of communication being accomplished’ does not absolve the communicating
party from further responsibility. Unfortunately, this is what generally happens on many
project communications. Due to numerous reasons, none of the attributes of proper
communication are followed on projects. According to Hartman, “Communication is at
the heart of effective project management. It needs to be timely, complete, accurate, and
verified” (2000, p. 29).
7.11.1 Communication Among Whom and Communication About What?
Communication on projects happens in different modes, which have many aspects to it,
especially when dealing with numerous groups, levels, and areas of people. The form and
type of communication is varied, from the written and verbal to communication of
drawings, schedules, and 3D-models. Table 7.13. shows a sample of the various groups
of stakeholders in a project among whom the communication takes place and the objects
of communication, as emerging from this research study.
It should be noted that in Table 7.13., the parties or stakeholders among whom
communication takes place are summarized at a high level; when they are drilled down or
broken down into sub-categories, a large number of stakeholders can emanate from them;

215
and similarly for the topics or object of communication. The table highlights the
complexity of the communication process on a project. While tools, such as a RASCI
chart, a matrix identifying roles and responsibilities of stakeholders, are used at the
beginning of every project, they do not seem to help much. This survey’s finding on
communication breakdown is consistent with results of research done on other projects.
Table 7.13. Characteristics of Communication on SAGD Projects
Communication Among Communication About
Reservoir Engineers The Project
Drilling Engineers Scope Definition
Geology Group Schedule
Regulatory Group Cost
Environmental Groups Site Infrastructure
Finance Material Deliveries
Construction Equipment Packages
Engineering Client Needs
Procurement Procurement Plan
Construction Material Requisitions
Vendors Purchase Orders
Project Management Project Charter
Project Controls Project Goals
Ready for Operations (RFO) Group Deliverables
Commissioning & Start-up (C&SU)
Operations Group
7.11.2 Why is Communication Important?
Communication, from a project perspective, is important because it helps the project’s
team members understand what needs to be done, how it will be done, who will do it, and
the timeframe in which it needs to be completed. A large number of survey participants
indicated that communication of the project scope is the most important area. The scope
of a project defines what needs to be done on the project; it forms the basis of the work
216
from which the goals, objectives, and deliverables are defined. With a well
communicated scope, all the team members of a project have the same view of the work
to be done and the deliverables that needs to be produced by the respective engineering,
procurement, and construction groups.
At the same time, the engineering design and drawings produced from the scope cannot
be done in isolation from the stakeholders. For example, to determine the amount of
steam production required to lift bitumen from the oil sands reservoirs, the reservoir
engineering group needs to communicate the results of the pilot plant studies to the
process group so that the process engineers can design the surface facilities for extracting
the bitumen. As well, the design produced by the process engineering group has to be
communicated back to the reservoir engineers so that they can confirm whether or not it
meets the requirements of the reservoir conditions. Upon confirmation, the same
information in the form of PFDs and P&IDs is communicated by the process group to the
mechanical engineering group to purchase the equipment; to the piping group to
determine the liquid and gas inflows and outflows, pressure and temperature to design the
piping layout of the surface facilities; the civil engineering group to design the piling and
foundation required to set the vessels; to the instrument and controls (I & C) group to
design the controls systems to automate and operate the plant; and finally, the electrical
group to determine the power requirements for the plant and to design the routes and
requirements for the electrical cables.

217
In parallel, information from the engineering disciplines has to be communicated to the
procurement group so that they can start purchasing the equipment and materials, and to
the construction group to plan and build the facility. This simple example of
communication in a SAGD project highlights the number of players and information that
has to be communicated. In addition, change is a common phenomenon on all projects.
Any change to the design, data, or parameters has to be re-communicated to all the
respective parties involved. Therefore, omitting any details or changes in the
communication process to any of the players can create a snowball effect, which can
result in costly delays impacting the project.
7.11.3 Missed Communication
This can include a multitude of items including missed communications on drawings,
such as P&IDs, plot plans, general arrangements, sketches, and other objects, such as
project charters, schedules, purchase orders, cost estimates, etc. - all of which have a lot
of information but are not explicitly communicated to the reader. For example, the fact
that a Primavera schedule has been issued to an engineer or a project manager, does it
necessarily mean that the receiver has understood which deliverables are critical and
when do they have to be issued? Was the receiver apprised of its impact on other
deliverables and on the engineering disciplines if they are not issued on time? This is the
scheduler’s role to communicate such issues impacting the project as well as the basis or
the assumptions upon which the completion dates have been derived. With such
communication, the receiver has a better understanding of the critical activities, which
could help the receiver in making better decisions.
218
In the same manner, many other documents are created on projects which have similar
nuances and implications to the above example but are not well communicated. It is
assumed that the other person will understand what has been described or identified on
paper. This is the crux of the communications conundrum, and which requires multiple
solutions and strategies to resolve.
7.11.4 Root of the Communications Conundrum
There are multiple reasons for ineffective communications on projects, which can be
explained based on anecdotal information and the researcher’s observations.
7.11.4.1 Large Volumes of Data from Software Tools
With the explosion of information on projects from using software tools such as
AutoCAD for 3D-modelling, automated schedules on Primavera and enterprise systems
such as SAP, an incredible volume of data is generated on projects. This information,
together with the high volume of drawings generated on projects, makes it difficult for
the team members to keep up, which ultimately results in missed communication.
7.11.4.2 Cosmopolitan Societies
Given the cosmopolitan societies in which we live, communication on projects is affected
due to people having different languages, cultural backgrounds, and experiences. Also,
written or spoken words can have different meanings and connotations for various
individuals, thereby creating potential situations of miscommunication.

219
7.11.4.3 Multigenerational Teams
The two factors mentioned earlier are compounded by the fact that projects have multi-
generational team members, who have different styles of communication and prefer
different tools to communicate with (Morlan & Gelbtuch, 2010). In an article entitled
Multigenerational teams and their impact in project management, Morlan & Gelbtuch
segment project teams into four different groups: Mature, referring to those born before
the second World War; Baby Boomers, referring to those born after the war, from 1945 to
1964; Gen X, referring to those born between the mid-1960s to early 1980; and finally,
Gen Y, referring to graduates of the new millennium. According to the authors, these
segments of generations have different styles of communication: the Mature segment at
one end preferring “in-person” communication, while the Gen Y at the other end
preferring virtual communication. Figure 7.9., adopted from Morlan & Gelbtuch (2010),
illustrates the preferred communication styles among the different generations.
Figure 7.9. Preferred Communication Styles Among Generations
Mature
• “In-person”
communication
• Mastered Interpersonal
communication skills
Baby
Boomers
• Face time more important
• Follow-up in
writing
Gen X
• Face time less
important
• Seeks open communication
regardless of hierarchy
Gen Y
• Virtual
Communication
• Likes communication
anytime, anywhere
220
7.12 Summary
The results of the survey suggest that spending more time in front-end planning can
significantly improve the project execution. This has been difficult bring about at times
because of the external forces impacting projects, such as higher oil prices, which
encourage changing the project’s execution strategy. Getting vendor data on time is
another major cause for concern in effective project execution. Delays in obtaining data
are often due to the numerous sub-vendors and their vendors involved, over whom the
owner exercises little control.
Other areas that lead to a high impact on effective execution of SAGD projects include
the softer, but significantly important, areas of knowledge and experience of project
management processes as well as communications between the various stakeholders on a
project. Communication, which creates a major impact on projects, has been difficult to
implement efficiently due to its various attributes, among which it is difficult to achieve a
balance. One such attribute that creates imbalance is the preferred styles of
communications among the project team members, from the face-to face communication
with the Mature segment to virtual communication among the Gen Y segment. The next
chapter discusses a model created from this research and various solutions to the issues
identified in the survey for the effective project management of SAGD projects.
221
Chapter 8: The Proposed Model
Chapter Overview
In this chapter, the theory of forces that impact and destabilize project execution is
described. It suggests that as a result of the forces impacting projects, the triple constraint
of cost, schedule, and quality do not always help. A plausible alternative is the SAGD
Execution Triangle or SAGD-ET model developed in this research. This model is
highlighted and discussed in this chapter together with solutions to develop an effective
project execution. In addition to the model, other new concepts produced from this
research relating to vendor data, cost reduction, communication, trust, lessons learned
including a schedule of a SAGD project, are discussed in detail.
8.1 Theory of Forces
Many times during their life cycle, projects encounter forces that impact their execution.
These forces can either be external, that is, they operate outside the organization, or
internal, meaning that they operate from within the organization. Both of these forces
first impact the corporate organization, which then in turn, directly impacts the capital
projects under its development (see Figure 8.1.).
External forces can be broadly categorized in terms of the political, economic, social, and
technological. Internal forces, on the other hand, can include competing projects, project
organizational structure, and project ownership, among others. These external and
internal forces are described in detail in the following sections.
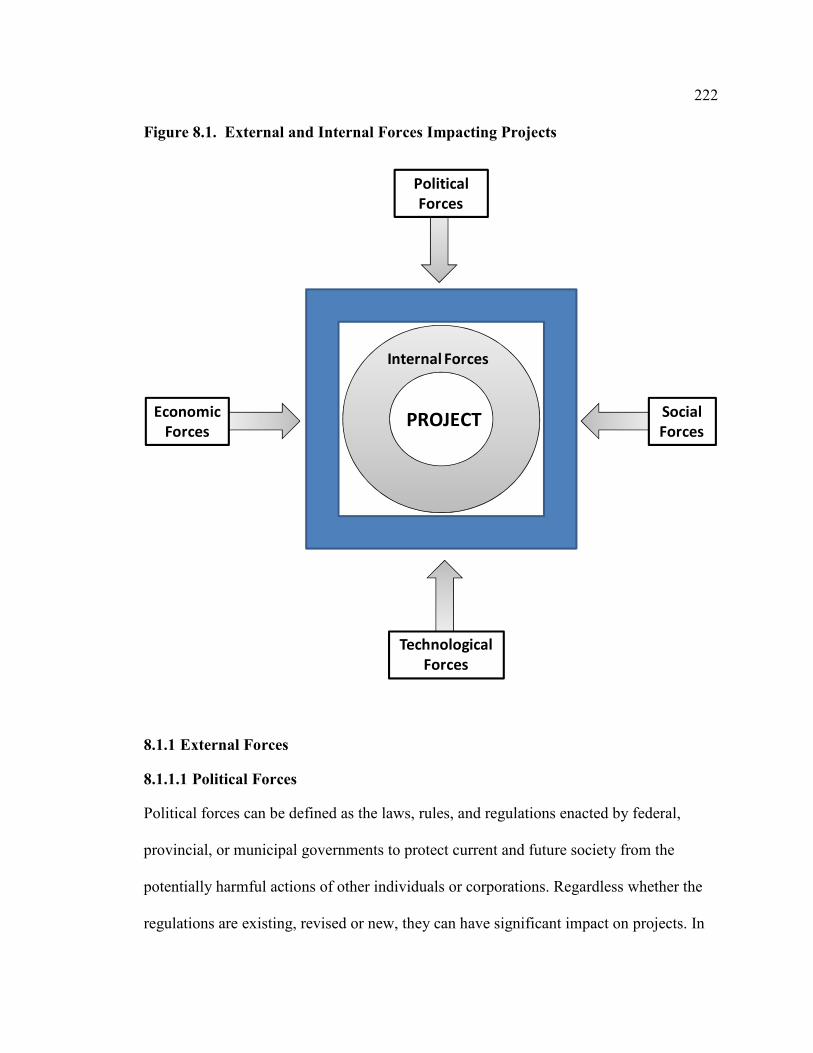
222
Figure 8.1. External and Internal Forces Impacting Projects
PROJECT
Technological
Forces
Economic
Forces
Social
Forces
Political
Forces
Internal Forces
8.1.1 External Forces
8.1.1.1 Political Forces
Political forces can be defined as the laws, rules, and regulations enacted by federal,
provincial, or municipal governments to protect current and future society from the
potentially harmful actions of other individuals or corporations. Regardless whether the
regulations are existing, revised or new, they can have significant impact on projects. In
223
recent years, due to increasing concerns regarding the environment, oil & gas projects
have been subjected to significant political forces, creating major impacts on project
execution, which subsequently result in delays and extra costs (Morris, 1998).
Government regulators are under intense pressure from environmental groups to do more.
Consequently, project owners and management teams have had to be extra vigilant in
order to keep up with the new or revised regulations. Sometimes, the revised regulations
are grand-fathered, or made retroactive, and therefore, they have to be incorporated into
the project design mid-way though the engineering or construction. There have been at
least a couple of the projects that the researcher is aware of in which the engineering
design had to be changed in the middle of the project’s construction phase because the
regulations were grandfathered. While such instances of grandfathering regulations are
rare, the important aspect is that based on the changing political environment, including
change in governments and political philosophies, projects can be significantly impacted.
8.1.1.2 Economic Forces
Economic forces constitute the macro or micro economic factors that impact the economy
of a country. Microeconomic factors include the response of consumers that affect the
demand and supply of goods and services, which in turn affects prices. Macroeconomic
factors, on the other hand, include a country’s growth of goods and services, inflation,
and unemployment, which also have an impact on the supply and demand of goods and
services. A lack of demand, for example, can drive a country’s economy into recession.
Therefore, economic forces, both positive and negative, can have a rapid and significant

224
impact, particularly on large projects. The recent crash in oil prices (2008-2009) is a good
example of a situation where tens of billions of dollars worth of projects in Alberta were
either abandoned, cancelled, or deferred and put on “safe-mode” due to the global
recession (Dunbar, 2009; Polczer, 2010). During recessionary periods, when economic
conditions are generally negative, there is a reduced consumer and corporate demand for
goods and services, which clearly impacts a company’s cash flow. Many oil sands
projects are financed through cash flows generated by the organization as a whole and
borrowing based on a company’s stock market valuations. During periods of reduced
cash flows and depressed stock prices, there is generally less capital available, making it
expensive to borrow. These costs of financing, together with the project’s operating costs,
are incorporated into the project’s economics in order to determine which project can
bring the best rate of return to the organization. Based on the internal rate of return (IRR)
and the net present value (NPV), projects are allowed to advance either with full funding
or less funding, while other projects are temporarily halted. In the event of reduced
capital budgets, the project leaders have to make choices on the strategies to sustain them
going forward.
On the other hand, there could be positive economic conditions, for example, between
2006 and 2008 where oil prices climbed as high as US$147 a barrel. In such conditions,
there is a positive cash flow into the organization. With such a scenario, oil & gas
companies are motivated to change their strategy (see Figure 7.1.) with the aim of
completing projects ahead of schedule in order to benefit from the additional cash-flow
and profits generated as a result of early production. In order to achieve early production,
225
projects are fast-tracked with overlapping project phases (see Figure 7.3.) in order to
capitalize on the opportunity generated from such a scenario but at the risk being
impacted by higher material and equipment costs.
8.1.1.3 Social Forces
Social forces refer to the changing attitudes and values among the citizens regarding the
environment, wildlife, habitat, native people, unions, etc; these changing views can
impact projects in unimaginable ways. Sometimes these forces are also created as a result
of a lack of education on the “hot button” issues among the citizens or organizations not
paying enough attention to their corporate social responsibility (CSR). Although large
corporations, in recent times, have special departments to deal with these social forces,
with today’s internet technology, these undercurrents can flare up very rapidly, catching
the unsuspecting organization off-guard.
8.1.1.4 Technological Forces
Technological forces can be characterized as the changes that take place in the work
processes, engineering, or equipment, which generally improves the activity or function
in terms of time, efficiency, cost, etc. With the oil sands being a fairly young industry, the
technologies employed to extract bitumen from the oil sands, particularly the in situ, is
constantly evolving. While the evolving technologies can bring, for example, additional
oil production, it can also introduce risks in areas such as maintenance and operations of
the facility. According to Morris, unsuitable technology has been one of the reasons,
historically, for failed projects (1998). Indeed, not all technologies bring benefits to the
226
projects; therefore, it is critical to recognize and eliminate inappropriate technology early
enough during the project’s design phase in order to prevent production inefficiencies in
the long run. Sometimes, the technology selected during the DBM phase results in a high
overall project cost; in such situations, the project team has to go back to the feasibility
stage (FEL 1) and evaluate other options that can be implemented with lesser costs.
These iterations to adjust the design causes rework and can impact the schedule with a
potential of cost increases to the project.
8.1.2 Internal Forces
8.1.2.1 Competing Projects
Companies, much like families, decide on an annual basis where and how much money
they will spend each year on new and sustaining projects. The amount of funding
allocated to the project is based on the corporate strategy designed to provide maximum
value to shareholders. However, on the basis of macro-economic forces at play in the
economy, company strategies have to be fine tuned to react accordingly so as to
maximize profits. In doing so, the Board of Directors of the organization may allocate
less or more funding to a certain project(s). This can result in a project having to change
the speed of its execution, which can create a positive or negative impact to the overall
project. For example, in the case of more funding being provided to a project, additional
human resources will be required to complete the engineering design; likewise,
procurement of equipment and materials may need to be advanced so that preliminary
construction work can commence. Reduced funding can have the opposite effect to
project execution.
227
8.1.2.2 The Project Organizational Structure & Decision Making
Project organizational structure is the manner in which project teams are organized; on
some projects, the owner and EPC teams are distinct, and on others, the owner and EPC
teams are integrated. Based on the researcher’s observations, factors such as distinct or
integrated teams and the number of layers or levels in the organizational hierarchy play a
role in how fast the project organization reacts and responds to situations on a project.
During the early phases of a project, many changes to the project take place and
numerous decisions have to be made. In addition, decision making on mega projects is
often weak during the early stages of a project (Priemus, et al., 2008). This is because it
takes time for the individual members on the owner’s as well as the EPC side to get to
know each other and take shape as a team.
The difficulty in decision making, according to Sorenson (oral presentation at a meeting
of the Council on Engineering Systems Universities, Atlanta, December 14, 2005), is due
to the incorrect formulation of the problem; this results in the wrong problem being
addressed, which subsequently leads to an erroneous decision being made (Priemus, et
al., 2008). This is one of the reasons why many organizations in the oil & gas industry are
very deliberate and try to build consensus when making major decisions. However, from
a project perspective, the nimbleness with which the project organization is able to take
decisions and move forward determines how other activities will be impacted.
Decision making is highlighted as a factor because project life cycles, depending on the
type of project, are generally very short, and therefore, the need for projects to respond
228
quickly to events in order to stick to the schedule is very high. A slow decision-making
process or too much back and forth consultation with various stakeholders results in
churn, or indecision (see Figure 8.2.). Consequently, the float in the schedule, if left
unguarded, can get eroded quickly with no buffer remaining between successor activities.
Churn is also a consequence of unfamiliarity with the technology involved, inexperienced
owner and EPC teams, and a lack of appropriate support to the project from the
respective owner and EPC organizations (Staus, 2010). On a new project, churn can delay
in the real start of engineering, which can snowball into impacting the procurement and
construction areas. Eventually, the project has to make up for the lost time by having to
add resources and change execution strategies to meet the schedule deadline; in many
cases, the deadline is fixed and not subject to change. Changing execution strategies can
cause “decoupling”, or out of sequence engineering activities, which consequently results
in an increase in the engineering man-hours. Decoupling can even result in driving some
of the construction activities into undesirable seasonal periods, particularly for Northern
Alberta projects (Staus, 2010).
Due to the delay in making decisions, the engineering and procurement schedules get
shortened. This can result in either the engineering completion getting delayed which,
therefore, impacts the construction completion date; or in the event that the construction
date is firm and cannot change (which is the case with most oil & gas projects) the
engineering activities get completed in the field during the construction phase which can
be very costly.
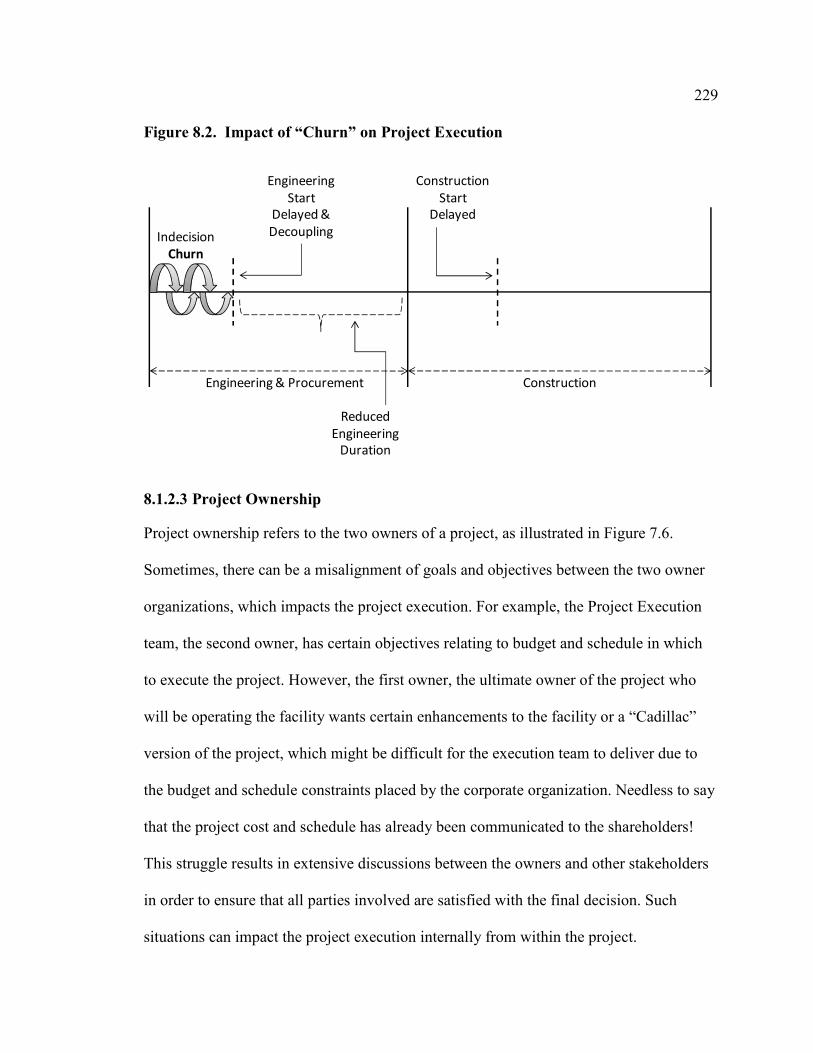
229
Figure 8.2. Impact of “Churn” on Project Execution
Engineering & Procurement Construction
Indecision
Churn
Engineering
Start
Delayed &
Decoupling
Construction
Start
Delayed
Reduced
Engineering
Duration
8.1.2.3 Project Ownership
Project ownership refers to the two owners of a project, as illustrated in Figure 7.6.
Sometimes, there can be a misalignment of goals and objectives between the two owner
organizations, which impacts the project execution. For example, the Project Execution
team, the second owner, has certain objectives relating to budget and schedule in which
to execute the project. However, the first owner, the ultimate owner of the project who
will be operating the facility wants certain enhancements to the facility or a “Cadillac”
version of the project, which might be difficult for the execution team to deliver due to
the budget and schedule constraints placed by the corporate organization. Needless to say
that the project cost and schedule has already been communicated to the shareholders!
This struggle results in extensive discussions between the owners and other stakeholders
in order to ensure that all parties involved are satisfied with the final decision. Such
situations can impact the project execution internally from within the project.

230
8.1.2.4 Financial Considerations
In addition to the project ownership issues, there are financial considerations that can
internally impact the project. Project owners provide funding to their projects on the basis
of profits and cash flow generated by the company. The profits are apportioned in the
order of the organization’s priorities and a strategic plan in order to provide value to
shareholders. Depending on the external forces impacting the organization, particularly
economic factors, the order of priorities can change on a yearly or even quarterly basis.
This is because organizations are at the mercy of the economic forces, which ultimately
determines its ability to raise capital if internally generated cash-flow is inadequate or not
available. A project can, for example, be slated to have full funding in a particular year,
but due to economic forces, the funding is reduced or increased in an attempt to take
advantage of the external conditions. Such changes impact the project regardless of
whether it is in the engineering, procurement, or construction phase. While such start -
stop - accelerate execution is uncommon, it is particularly evident during recessions and
periods of low commodity prices.
8.1.3 Tremors on a Project
The combination of internal and external factors that can potentially impact a project
requires the team and the owner to change and navigate the project’s execution strategy
as the forces start impacting them. A change in strategy, which can be major or minor,
can happen several times during the project’s life cycle as depicted in Figure 8.3.
Consequently, the constant change strategy, speed, and direction to mitigate the external
and internal forces causes tremors on the project execution (Harris, 2009a).
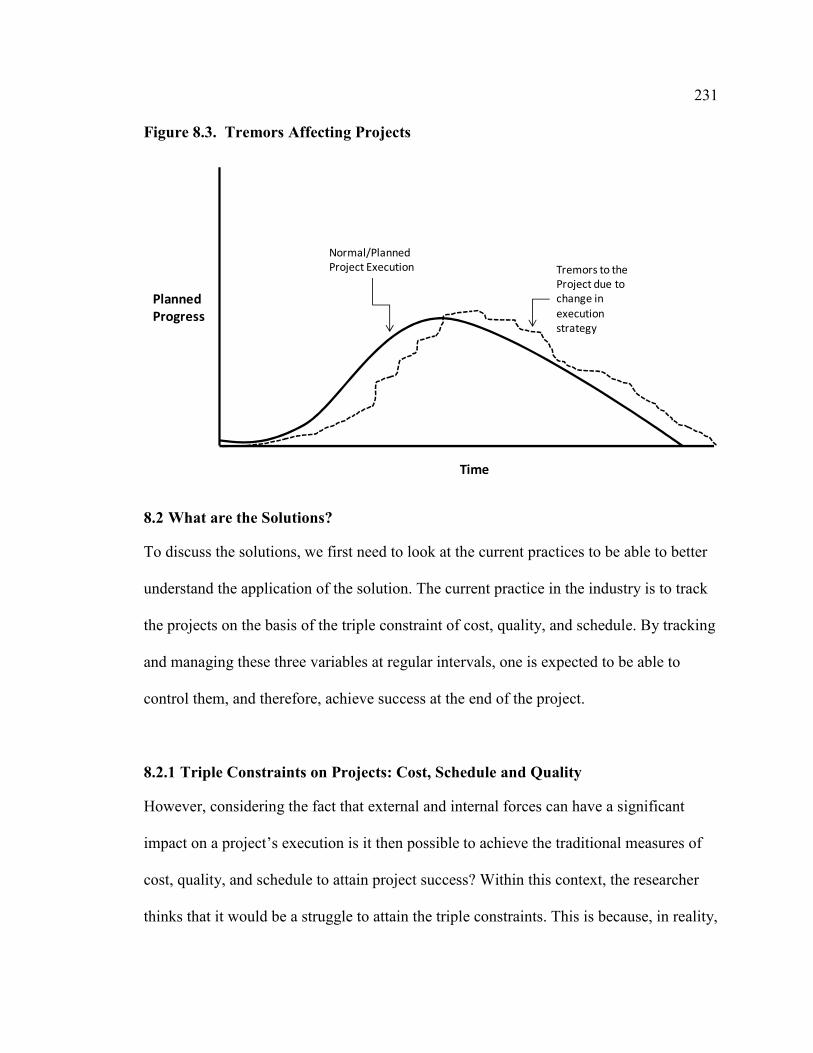
231
Figure 8.3. Tremors Affecting Projects
Tremors to the
Project due to
change in
execution
strategy
Normal/Planned
Project Execution
Time
Planned
Progress
8.2 What are the Solutions?
To discuss the solutions, we first need to look at the current practices to be able to better
understand the application of the solution. The current practice in the industry is to track
the projects on the basis of the triple constraint of cost, quality, and schedule. By tracking
and managing these three variables at regular intervals, one is expected to be able to
control them, and therefore, achieve success at the end of the project.
8.2.1 Triple Constraints on Projects: Cost, Schedule and Quality
However, considering the fact that external and internal forces can have a significant
impact on a project’s execution is it then possible to achieve the traditional measures of
cost, quality, and schedule to attain project success? Within this context, the researcher
thinks that it would be a struggle to attain the triple constraints. This is because, in reality,

232
the external and internal forces are much more powerful and overwhelming, and
therefore, do not provide a conducive environment to achieve equilibrium in the project
for sustained periods of time. In an absolute situation, that is, in the absence of any
external or internal forces, the traditional measures can certainly be achieved. However,
large projects in the oil & gas industry, particularly owned by publicly traded
corporations, are not and cannot be immune to such forces. On such projects, the
traditional measures of cost, quality, and schedule are an “ideal” to achieve, but they
cannot always be achieved.
Moreover, cost, schedule, and quality are only parameters to measure how a project is
performing. It does not guide or suggest to the project manager what actions should be
taken in specific areas of the project to make it successful. Cost, schedule, and quality are
similar to the dashboard of a vehicle; it provides the driver pertinent data about the
vehicle’s performance such as speed, temperature, fuel supply, etc. It does not, however,
recommend any mitigation strategies that can be applied during conditions of wind, rain,
or snow existing outside the vehicle or distractions from cranky kids inside the vehicle.
Similarly, traditional measures of cost, quality, and schedule are not able to assist the
project manager in execution, and therefore, a different approach is required.
8.3 SAGD-Execution Triangle (SAGD-ET)
As stated previously, due to multiple forces at play on a project, the existing triple
constraint model of cost, schedule, and quality is an ideal to be achieved but does not
really support the project manager in the execution of the project. The solution is to apply

233
the SAGD Execution Triangle or SAGD-ET model developed by the researcher on the
basis of results of this study (see Figure 8.4.). The SAGD-ET model suggests that in
order to achieve project success, there are three major areas a project manager needs to
focus on. These three areas are Engineering, Project Management Processes, and
Communication.
The Engineering area fundamentally deals with all aspects of front-end planning,
including complete scope definition and vendor data management. The Project
Management Processes (PM Processes) area involves managing the processes that help in
moving the project forward such as project management, change management, regulatory
approvals, etc. The Communications area includes communication between the wide
range of project stakeholders, such as owners, engineers, contractors etc., among whom
communication should take place and the objects of communication such as drawings,
schedules common to EPC projects that should be communicated to the stakeholders A
stakeholder is anyone who can impact the project or be impacted by it (O'Neil, 2009).

234
Figure 8.4. SAGD Execution Triangle (SAGD-ET)
Engineering
PM Processes Communications
SAGD-ET
SAGD
Execution
Triangle
EngineeringProject Management (PM)
ProcessesCommunication
Well defined reservoir data Simple processes & procedures between
Define design philosophy &
technology early
Knowledge & experience of
management processes
Stakeholders: Owners / E& P /
Construction / Operations
Defined scope by EDS Set realistic key milestone dates Engineering
Freeze scope after EDS Early environmental assessment Procurement
Fix basic process design early Effective change management Construction
Completed P&IDs (IFD) Timely receipt of vendor data of
Build regulatory requirements in
the design
Meet owner’s quality
requirementsScope
Order long lead items early Plan for weather windows Design Changes
Vendor data requirements Technical Decisions
Operability Maintainability
ConstructabilityDrawings
SchedulesVendor quality management
235
8.3.1 Application of SAGD-ET
In Figure 8.4., the SAGD-ET model identifies the pillars of focus – Engineering, PM
processes, and Communication. Each of these pillars has specific areas of opportunity,
which the project manager needs to focus on and track its implementation with the
solutions provided in the sections below. This will enhance effective execution and
increase the chances of the project’s success. In the following sections, each of the areas
is discussed with a brief commentary as well as solutions on how to apply them.
8.4 Engineering
To implement the SAGD Execution Triangle (SAGD-ET), Engineering is the first pillar
to focus on. Within the engineering pillar, the following areas of opportunity need to be
implemented and tracked.
8.4.1 Well Defined Reservoir Data
Most natural resource reservoirs, oil in particular, have uncertainties inherent in them;
these uncertainties can include reserve quantification, reservoir characterization, recovery
factor, expected production, and so forth (Cunha, 2007). According to industry experts,
over the many years of exploration and development, there has been significant data
available and models created for conventional crude oil reservoirs. The oil sands industry,
however, lacks the benefit of this information and its representative models, which makes
predicting oil sands reservoir performance very uncertain. Moreover, the oil sands,
particularly in the Fort Mc Murray area, have thin shale beds, top gas, bottom water, top
water, and intra-bitumen water bearing zones (Nickle, 2007); obtaining good reservoir
236
data thus becomes an elusive element. This lack of high-quality data greatly impacts the
execution of in situ oil sands projects.
In addition, according to experts, a major reason why it is difficult to ascertain the oil
sands reservoirs, and therefore get better quality data, is because in situ technology, such
as Cyclical Steam Stimulation (CSS) and SAGD, has only been heavily used for
commercial operations for about a decade or so. Consequently, there has not been
significant information made available on the quality of Northern Alberta reservoirs,
which is where most of the oil sands projects are located. For this reason, the ability to
produce effective models has been made difficult. It should be mentioned that reservoir
data from the core holes drilled at various locations in the reservoir’s area can provide
good information regarding the potential bitumen production. One can argue that, some
information about the quality of the neighbouring reservoirs, if in production, is publicly
available in Alberta from the Energy Resources and Conservation Board (ERCB).
Therefore, the combination of information from these sources can provide somewhat
reliable data about the reservoirs. However, such information can be limited in terms of
its content to be used for decision making on huge capital investments. Thus, for a new
oil sands developer, information on the SOR and other reservoir characteristics need to be
obtained, at least initially, by building a pilot plant.
8.4.1.1 Build a Pilot Plant
In the absence of conclusive cumulative data, owner’s need to build a pilot plant at their
oil sands properties. The objective should be to collect sufficient data from various
237
reservoir locations over a period of at least 24 months, and analyze it to understand the
reservoir characteristics, including the operating envelope and how they function.
Specifically, one needs to:
• Define an operating range of all the design parameters such as the SOR,
production temperature, produced gas rate, gas composition, produced water
composition, water loss, etc.
• know all the interactions of the design parameters on the plant’s performance
• evaluate reservoir and plant performance across the operating envelope
• Identify the stability, reliability and sustainability (maximum peak) of production
• build different scenarios to design the surface facilities
• define the drilling design
• do a technical cost risk analysis of the various options
• identify pre-investment opportunities which will mitigate impact of future
changes to reservoir performance
Oil sands reservoirs can behave differently over a period of time and sometimes even as
the production is taking place (Fernando Gaviria, 2010). Therefore, using reservoir data
obtained over longer period of time can provide more conclusive data; by using such
data, impact to the design of the surface facilities can greatly be reduced. Therefore, it is
recommended not to start the DBM/EDS phases of building the plant’s surface facilities
without having good reservoir data (Sungaard, 2009).

238
However, in some cases, the changing reservoir conditions do not always create a
negative impact; in spending more time up front and taking advantage of the learnings
from the data or the existing operations, new opportunities can be created, such as the
potential of increasing bitumen production and reducing the SOR, consequently
improving the project’s internal rate of return (IRR). Experts have suggested that by
lowering the SOR by only 10%, the project’s net present value (NPV) can be improved
by approximately $250 million and increase the IRR by almost 2%. A lower SOR means
that less steam is required to get a barrel of oil from the reservoir; lower steam
requirements results in less natural gas being needed to generate the steam, and therefore,
lower costs to the project.
Figure 8.5. A Type Curve Identifying Production from an Oil Sands Reservoir
Time (years)
Oil
Production
(barrels per
day)
Point of declining oil
production from reservoir.
Additional well pairs are
drilled at other locations to
provide steady oil production
Figure 8.5. illustrates the Type Curve of a reservoir, with the oil production on the y-axis
based on the amount of steam injected, and on the x-axis, the period or the life of a
reservoir, which normally around 4-7 years. Just before the existing reservoir has gone
239
beyond the peak production and is at the point of being depleted through declining
production, say at year five, well pairs at other reservoir locations are drilled to get
additional oil production. This method ensures that there is a constant and steady volume
of oil production sent to the central processing plant.
8.4.1.2 Communication among Reservoir, Operations, & Project Group
At the time of designing the surface facility, communication between the key
stakeholders, such as the owner’s reservoir, operations, and project groups, is very
critical. During this time, the new reservoir data continues to come in and be incorporated
into the simulation models in order to optimize the surface facilities. While the reservoir
data is being evaluated, it is critical to exchange information among the stakeholders on,
for instance, well characteristics for designing the well pads, process flows, equipment
sizing, etc. Based on the data, they should get a good understanding of the potential range
of operations and the flexibility in design of the SAGD surface facilities. Using computer
models, the design criteria established from which the plants process design is created.
On the basis of the process design, PFDs and P&IDs are developed from which other
engineering disciplines can engineer and design other aspects of the plant.
8.4.1.3 “What if” Scenario Planning
Since SAGD is a new technology, there are many uncertainties in using it for commercial
applications; however, to date, it is the most reliable in situ method of oil extraction.
Therefore, in examining different reservoirs, a “what-if” analysis needs to be done so as
to understand the operating risks involved. This will not only identify solutions for
240
mitigation, but it can also open up new opportunities for pre-investment in the field
design. As much as design changes due to reservoir conditions impact the project, it can
also provide opportunities, such as higher oil production or a reduction in the SOR, which
can reduce costs or increase revenues to the project. Therefore, it is prudent to be flexible
in the engineering design of equipment and having additional project manpower; because,
design changes can require additional engineering and other resources.
8.4.1.4 Control Flow of Information to the Design Group
Changes to the reservoir data, which sometimes happens on a weekly basis, can
potentially result in changes to the components of the surface facilities, such as pipe
sizes, pump capacities, tank sizes, steam generator capacities, etc. Therefore, to prevent
knee-jerk situations and still accommodate the changes, a couple of things can be done.
Firstly, filter the information and data obtained from the reservoir, and identify the
significant changes. Secondly, control the flow of information from the reservoir group to
the design team to limit the impact on the process conditions of the project. Only when
the owner’s team has consistent and conclusive results from the reservoir should a
decision to make changes to the surface facility be taken. Such decisions would also need
to be predicated on the project’s economics to provide a favourable IRR. At the same
time, have a good communication process across the various teams to relay information
relating to changes to the facilities; in addition, on the engineering side, a management of
change (MOC) process should be established to record changes to the project’s design.
Recording changes helps to provide variance to the project’s base design and costs.
Lastly, build enough float in the schedule to provide time to mitigate potential problems.

241
8.4.2 Define Design Philosophy & Technology Early
From a project perspective, the design philosophy, criteria, and technology to operate the
facility should be selected early, given that indecisiveness in these areas causes delays in
the execution of the rest of the project (see Figure 8.2.). Needless to say, the design
philosophy and technology of SAGD projects are based on the reservoir properties.
Therefore, delays in obtaining conclusive reservoir data can create delays in appropriate
decisions in providing the philosophy, design criteria, and technology criteria to the
design team. However, as suggested in the previous section, because of the significant
impact decisions made in these areas can have on the rest of the plant, sufficient time
should be allocated for the collection and analysis of reservoir data so that suitable long
term decisions can be made.
A major factor impacting SAGD plants is the efficient use of technology. Here,
technology is defined as the use of different capacities of equipment in a diverse
combination in order to optimize steam generation, lifting the oil from the reservoir
(naturally or mechanically), and other aspects in order to assist in the efficient production
of bitumen from the reservoir (Fernando Gaviria, 2010). Selection of each piece of major
equipment, such as a pump, steam generator, tank, vessel, etc., is based on the reservoir
properties. A certain combination of steam and temperature is required to, first, melt the
oil sands into bitumen, and, second, to lift the bitumen which has a low viscosity from the
reservoir to the surface. Therefore, using the wrong combination of equipment and
technology can hinder the achievement of the optimum production flows that one could
expect. While such situations can be corrected after production has commenced by
242
debottlenecking, it is more efficient to achieve optimum production at the outset, rather
than to incur additional costs to correct it later on in the project life cycle.
For these reasons, the design of the surface facilities should be delayed if satisfactory
results with a high degree of confidence have been not been established from reservoir
data (Sungaard, 2009). In order to generate cash flow from the project earlier,
management and or shareholders may want to start construction of the surface facilities
early so as to get the bitumen production to market quickly. However, such hasty action
should be resisted, as it can negatively impact the project through higher capital costs.
8.4.3 Define the Scope by EDS
Scope definition has many elements, such as appropriate technology as well as the project
schedule and economics, which are predicated on the reservoir performance. A
combination of each of these elements is used by the project owners to determine the
complete scope of the project. In the SAGD survey, a major source of frustration among
the participants was the inability to have a clearly defined scope. On the other hand,
project owners have a predicament - they need to be confident about the elements of
scope definition. Therefore, they have to ask certain questions. For instance, on the basis
of the reservoir performance, what is the best combination of technology that can be
used? Also, based on the technology selected, how much will the project cost? What will
be the project’s NPV & IRR be? What is the project’s schedule, and how much time is
available to undertake the project? What are the market conditions? What financial and
human resources are required and available to undertake the project? All of these

243
questions, among many others, have to be considered and confidently answered by the
various stakeholders and owners in the FEL 1 (feasibility phase) before a final decision
on the project’s scope definition can be settled and agreed upon by the owner’s team.
However, a fundamental driver of a project’s scope is based on the availability of funding
to the organization from existing and future cash flows together with financing from the
credit markets. The researcher is reminded of a visit to a developing country, where most
of the buildings in this particular city were partially completed with rebars sticking out
from beams on the rooftops. Upon inquiring the reason for this, he was told that
additional sections (scope) of the buildings would eventually be completed (sometimes
taking many years), depending on how fast the owners get more money or cash-flow!
Although on a different scale, SAGD developers have to make decisions on a similar
rationale; in order to determine a project’s scope, how much cash-flow is available from
existing operations and how much return will the project deliver in the future?
Assuming that a project’s financial considerations are taken care of, another key
consideration is the expediency with which the various options for the capital project
identified during FEL 1 are selected and further defined in the FEL 2 (DBM phase).
There are two different approaches project owners have taken. As illustrated in Figure
8.6., the first one, is having a shorter DBM, followed by long EDS, and then a normal
Detailed Engineering (DE) phase. In the second approach, some companies spend more
time in the FEL 1 & 2, where all the elements of the project scope are defined and issues
resolved, and then, undergo a shorter EDS and a normal DE. The advantage of spending
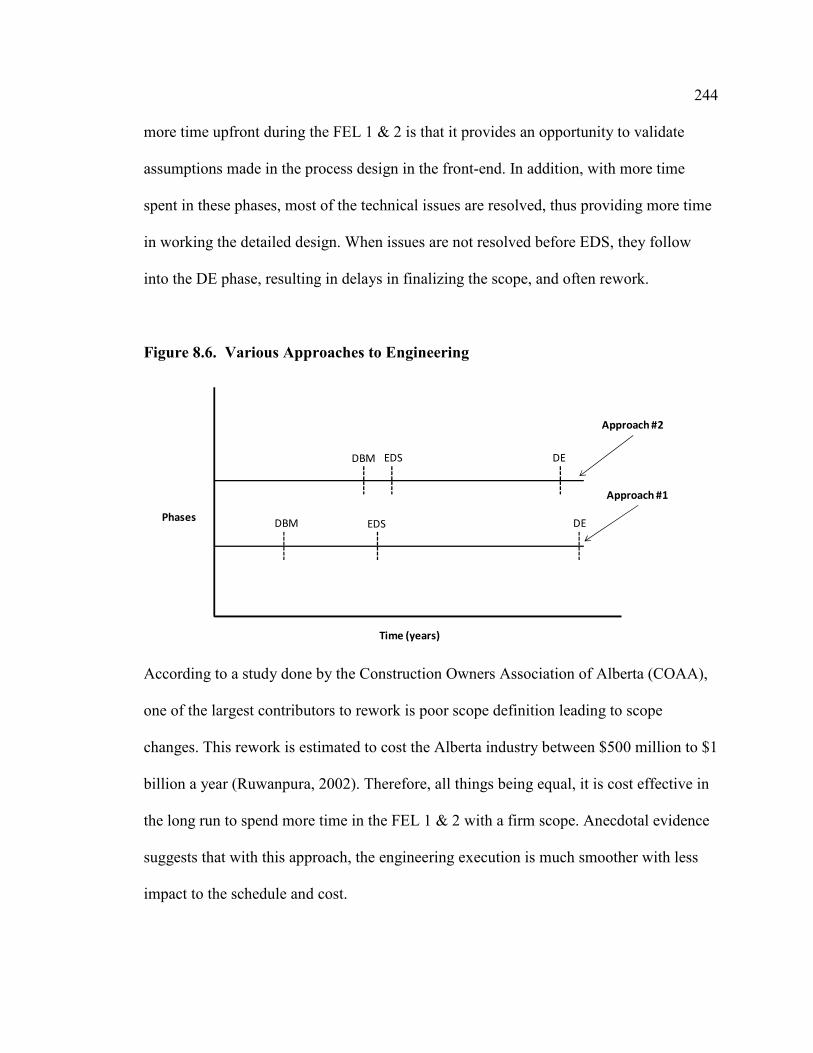
244
more time upfront during the FEL 1 & 2 is that it provides an opportunity to validate
assumptions made in the process design in the front-end. In addition, with more time
spent in these phases, most of the technical issues are resolved, thus providing more time
in working the detailed design. When issues are not resolved before EDS, they follow
into the DE phase, resulting in delays in finalizing the scope, and often rework.
Figure 8.6. Various Approaches to Engineering
Time (years)
Phases
DBM EDS
DBM EDS DE
DE
Approach #2
Approach #1
According to a study done by the Construction Owners Association of Alberta (COAA),
one of the largest contributors to rework is poor scope definition leading to scope
changes. This rework is estimated to cost the Alberta industry between $500 million to $1
billion a year (Ruwanpura, 2002). Therefore, all things being equal, it is cost effective in
the long run to spend more time in the FEL 1 & 2 with a firm scope. Anecdotal evidence
suggests that with this approach, the engineering execution is much smoother with less
impact to the schedule and cost.

245
8.4.4 Freeze Scope after EDS
Another advantage in spending more time upfront in FEL 1 & 2 is that the various design
options can be discussed and deliberated upon before selecting the option with which to
proceed. This provides a level of comfort and confidence and can allow the scope to be
frozen; this in turn assists in better execution of detailed engineering because it provides
clarity regarding what needs to be achieved. When the scope is not frozen, there is
temptation to make design changes, thereby creating a cascading effect, which can impact
the design of the other engineering disciplines; this is a source of great frustration for
engineers and designers.
Needless to say, the rework from the cascading changes increases project costs and
reduces the schedule float. A frozen scope, which will help in better execution of the
project, should be reviewed by the whole project team to ensure that it can be effectively
executed. With all the comments received from the team, it is then essential to have a
well written scope so that there are no ambiguities; it ensures that every member of the
execution team has the same understanding of what needs to be accomplished.
8.4.5 Fix Basic Process Design Early
The early definition of the design philosophy and technology along with a defined scope,
allow for the development of the basic design process early on. However, a few iterations
are required before a good process design can be achieved. After the preliminary design
is prepared by the process group, it is provided to the piping, mechanical, civil &
structural, and instrument & control (I & C) engineering groups to develop the design for
246
their respective areas. For example, on the basis of the preliminary design, the piping
engineering group will need to extend process design to determine the plot plan; based on
the plot plan, the mechanical group will need to establish the nozzle orientations of the
equipment; based on the plot plan, the civil/structural group does a preliminary design of
the process and pipe-rack modules; at the same time, the I & C group has to come up
with the control system, and similarly, the electrical group will need to decide the power
requirements for the facility. There are several such iterations among the disciplines
before the process group can have the basic process design in place. This takes time, but
as mentioned earlier, if the front-end decisions are made quicker, decisions relating to the
process design will follow suit.
8.4.6 Completed P&IDs (IFD)
With the basic process design package completed, the process group needs to start
designing and issuing the PFDs and, later on, the P&IDs to the owner for review (IFR);
changes from the owner and from the 30% model reviews are incorporated at this stage.
Upon final confirmation from the owner, the P&IDs are issued for design (IFD) to the
rest of the engineering disciplines so that they can be used to develop the design further
in the detailed engineering phase. The process of issuing P&IDs described above is rather
simplistic, and many more activities, such as simulations, heat & material balances, and
so forth, have to be completed before the P&IDs can be IFD. During this time, the other
disciplines are waiting for these P&IDs, and they commonly grow impatient. The process
discipline, on the other hand, bears the heavy responsibility of ensuring that the plant
processes they design will work, and for this reason, they are very meticulous and

247
cautious in issuing the P&IDs, which is why they sometimes take longer to issue.
Incomplete and late information from vendors and changes from the reservoir data also
tend to create delays. To overcome this, as identified earlier, the scope needs to be frozen.
Also, the vendor data needs to be expedited (this is discussed in detail in Section 8.4.9.).
8.4.6.1 Ramp up Staffing of the Process Engineering Group
In order to ensure that the process group does not become a bottleneck in issuing of PFD
and P&IDs to the other disciplines, staffing levels in the process group should be ramped
up higher than their normal manpower requirements so that they are able to complete the
significant number of activities they need to perform in order to issue the drawings on a
timely basis.
There are two aspects to the staffing issue; there are some activities which cannot, by
default, be given to the subordinate staff because only the lead process engineers have the
understanding of the entire facility. Therefore, detailing the design elements cannot be
delegated as quickly to the subordinates unless the lead process engineers have completed
their deliverables. As a result, there is a reluctance to have more people on the process
team at the outset during the DBM phase.
The counter argument to the earlier point is that while there is a reluctance to have more
process engineers on the team, it takes much more time to hire and get the process
engineers on board when they are really required. Therefore, it is advantageous to have
top loaded team in the front-end of the project, rather than in the latter phase. This
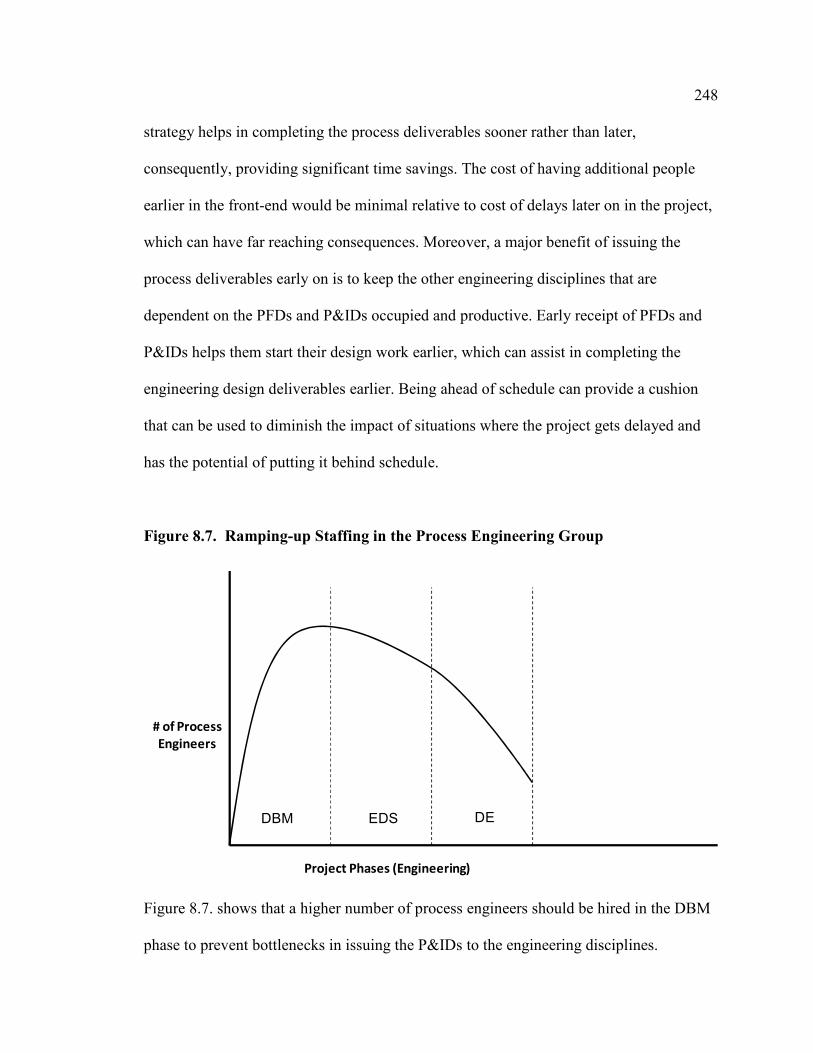
248
strategy helps in completing the process deliverables sooner rather than later,
consequently, providing significant time savings. The cost of having additional people
earlier in the front-end would be minimal relative to cost of delays later on in the project,
which can have far reaching consequences. Moreover, a major benefit of issuing the
process deliverables early on is to keep the other engineering disciplines that are
dependent on the PFDs and P&IDs occupied and productive. Early receipt of PFDs and
P&IDs helps them start their design work earlier, which can assist in completing the
engineering design deliverables earlier. Being ahead of schedule can provide a cushion
that can be used to diminish the impact of situations where the project gets delayed and
has the potential of putting it behind schedule.
Figure 8.7. Ramping-up Staffing in the Process Engineering Group
Project Phases (Engineering)
# of Process
Engineers
DBM DEEDS
Figure 8.7. shows that a higher number of process engineers should be hired in the DBM
phase to prevent bottlenecks in issuing the P&IDs to the engineering disciplines.
249
8.4.7 Build Regulatory Requirements in the Design
The regulatory regime for oil & gas projects in Alberta is very strict. While there are
good reasons for the stringent regulations, they can impact a project if they are not well
understood or properly interpreted. There have been instances where owners of projects
have had to rebuild parts of their facilities, such as certain pipes, valves, facilities, etc., in
order to meet regulatory requirements. Non-compliance can impact project schedule, and
consequently, the timely start-up and operations of the plant. Solutions to meeting
regulatory requirements include:
• The project owner needs to take more responsibility for regulatory compliance
than EPC, as they are more intimate with the entire project than anyone else. This
would complement the expertise of the EPC contractors. For that reason, creating
a Regulatory Department within the owner’s group would be an asset.
• Identify, understand, and document all applicable regulatory requirements.
• Interpret the regulations correctly so that there is a clear understanding of the
requirements; translate the requirements into clear directions for the engineering,
design, and construction.
• Understand the regulator’s perspective in interpreting the regulations.
• Advance warning from the owner’s regulatory subject matter expert (SME) can
provide time to plan mitigation.
• Ensure that there is a dedicated focus on all aspects of regulatory compliance,
both asset compliance (what is being built) and execution (compliance during
project execution).
250
• Project team needs to understand regulatory approvals processes, changes to the
regulations, and documents required to satisfy the requirements.
• The length of the regulatory process should be included in the schedule during the
conceptual planning phases.
• Discussions with regulatory agencies, such as the Alberta Energy Resources
Conservation Board (ERCB), Alberta Environment (AENV) and the Alberta
Sustainable Resources Development (ASRD), among others, should be started at
the project inception in order to identify the information required for approvals
and the timeline, which is often long. This should assist in understanding the
degree of pre-planning required for approvals.
• Soon, after HAZOP reviews are done, early involvement of organizations such as
the Alberta Boiler and Safety Association (ABSA), which deal with the plant’s
safety from a regulatory perspective and apprising them of the specifics of design,
can prevent delays through changes recommended by them.
• Perform regular audits of the project’s design and execution plan at key
milestones, such as DBM, EDS, and DE, to monitor regulatory compliance
throughout the design and engineering phase.
8.4.8 Order Long Lead Items Early
It is common sense to order the long lead items, such as large vessels, equipment,
compressors, etc., on any project as early as possible due to the lengthy duration required
to engineer and fabricate them. However, this becomes difficult to achieve on SAGD
projects because of the ever changing reservoir data, which has an impact on the

251
equipment and tank sizes and capacities. If the recommendations in the previous sections
are used, it would be possible for the project team to identify the long lead items in the
DBM phase together with their sizes and quantities. It is also essential to identify the
durations from databases, vendors and, the team’s experience on the length of time it
would take to procure specific long lead items, such as mechanical & electrical
equipment, inline instrumentation, large diameter & exotic material pipe for high
pressure steam distribution, and steel for the modules. Modules often tend to be on a
project’s critical path; delays in ordering the steel, and subsequently, obtaining shop
space to fabricate, can impact the entire project, as was the case for some projects during
the recent heated market conditions (2006-2008). Another risk is the placing of orders
with vendors of the inline and offline instruments for the modules which are based on the
PFDs. Ordering them early is key factor in establishing a successful module program.
Although deliveries of bulk materials, such as steel, pipe, cable, etc. take longer, they can
be ordered using approximate quantities.
In addition, most of the long lead items have higher costs relative to the other equipment
and materials. They also require special technical expertise to design and engineer them.
In some instances, the vessels, pumps, valves, and equipment, among others, are
fabricated outside of North America in countries such as Germany, Korea, Japan, or Italy.
Therefore, the risk associated with ordering such items is high. Consequently, adequate
time has to be devoted during the DBM phase to ensure that the critical technical
decisions are well thought out, appropriate, and meet the project requirements.

252
8.4.9 Vendor Data Requirements
8.4.9.1 Firm-up Scope with Minimal Design Changes
From the discussion in Chapter 7 on the issues relating to vendor data, the most obvious
solution to this perennial problem is to have a firm scope and a completed design with no
major changes before awarding the contract. Minimizing changes to the scope, and
consequently, to the design, reduces the number of revisions of the design drawings,
which reduces the time required to produce vendor data.
8.4.9.2 Payments Based on Receipt of Vendor Data
One solution, which was among the highly rated lessons learned, is to tie-in progress
payments to vendors based on timely submittal of acceptable and relevant vendor
drawings/data. In practical terms, the payments for the total equipment cost, for example,
would be broken into several milestone payments with a larger percentage of payment
being made at the beginning and at the end of the cycle, when it is critical to have the
data. The timing of the receipt of vendor data based on the identified priorities, quality of
the data (Code 1 or 2) to be submitted and the amount of payment for each of these
milestones should be agreed upon before hand and included in the equipment supply
contact. Code 1 data means that there are no comments from EPC on the drawings and
the vendor should proceed with fabrication; Code 2 data means comments from EPC
should be incorporated in the drawings and then vendor proceed with fabrication. With
this strategy, there also needs to be an alignment between the engineering, expediting,
and accounting departments through project controls that ensure that payments should
only be made when these conditions are met by the vendor.
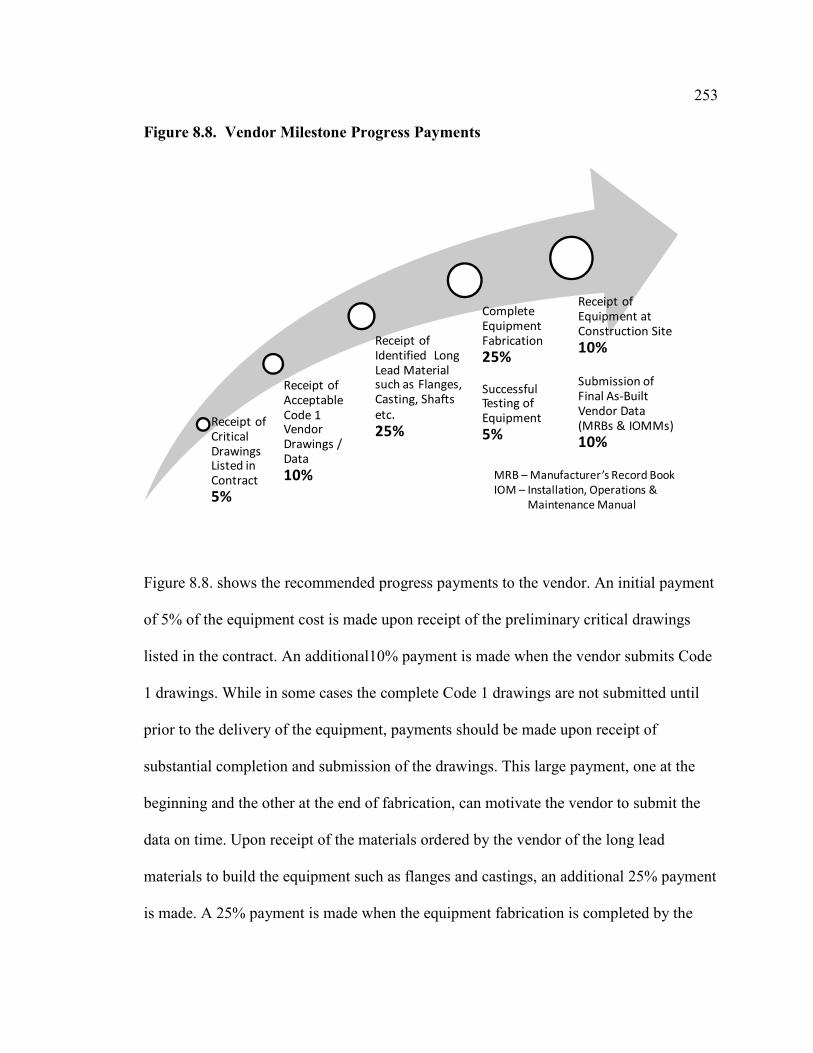
253
Figure 8.8. Vendor Milestone Progress Payments
Receipt of Critical Drawings Listed in Contract
5%
Receipt of Acceptable
Code 1 Vendor Drawings / Data
10%
Receipt of Identified Long Lead Material such as Flanges, Casting, Shafts
etc.
25%
Complete Equipment Fabrication
25%
Successful Testing of Equipment
5%
Receipt of Equipment at Construction Site
10%
Submission of Final As-Built Vendor Data (MRBs & IOMMs)
10%
MRB – Manufacturer’s Record Book
IOM – Installation, Operations &
Maintenance Manual
Figure 8.8. shows the recommended progress payments to the vendor. An initial payment
of 5% of the equipment cost is made upon receipt of the preliminary critical drawings
listed in the contract. An additional10% payment is made when the vendor submits Code
1 drawings. While in some cases the complete Code 1 drawings are not submitted until
prior to the delivery of the equipment, payments should be made upon receipt of
substantial completion and submission of the drawings. This large payment, one at the
beginning and the other at the end of fabrication, can motivate the vendor to submit the
data on time. Upon receipt of the materials ordered by the vendor of the long lead
materials to build the equipment such as flanges and castings, an additional 25% payment
is made. A 25% payment is made when the equipment fabrication is completed by the
254
vendor and another 5% upon successful testing of the equipment in the presence of the
owner’s quality assurance representative. Another 10% payment is made when the
equipment is received at site, and a final 10% payment upon receipt of the complete as-
built vendor data together with the manufacturer’s record book and other documentation.
8.4.9.3 Vendor Incentives
Another strategy to receive vendor data early is to use the carrot and stick approach,
which is, by providing additional payment or accelerated payment based on the
negotiated timelines. Thus if the vendor data and the equipment was supplied based on
the agreed upon schedule at the bid clarification meeting, the vendor would be eligible
for an additional financial payment or the payment milestone could be brought forward
by a certain time period than agreed upon in payment schedule (Corner, 2010). On the
other hand, if there were delays to the agreed vendor data dates, the supplier would not
receive any additional payments for the vendor data. These conditions would have to be
discussed at the bid clarification meeting, and subsequently, included in the contract.
As illustrated in Figure 7.7., the sub-vendors are key stakeholders in the vendor data
process who can potentially delay its timely receipt by the owner/EPC. This situation can
be prevented from occurring if the same incentives suggested for the vendors could also
be extended and provided to the sub-vendors. The incentives would eliminate the
problem from taking place at the grass root level.
255
8.4.9.4 Suppliers Document Index (SDI)
Often times, after the purchase order has been awarded to the vendor, the salesperson
takes the order and begins the suppliers order entry process while the EPC engineers are
waiting for the data to arrive from the vendor. Before this vacuum where there is no data
being submitted by the vendor occurs, there should be a meeting between the vendor’s
engineering group and the owner/EPC to get an alignment and understanding of which
specific drawings or documents are really required from the vendor. Sometimes,
drawings are requested from the vendor on the basis of a previous or similar order; in
many cases, such drawings are already available to engineers but in a different format.
Engineers on occasion might insist on receiving all the drawings and data whether it is
necessary or not. Such requests for vendor drawing and data become too onerous for the
vendor to fulfill. Removing such redundancies can eliminate duplication, resulting in
faster turnaround of data from the vendor.
In every purchase order, there is a requirement for a Suppliers Document Index (SDI)
(see Appendix H), which is a cross-reference document to the Vendor Data Drawing
Requirements (VDDR) listed in Section 3. In this VDDR, all the drawings and
documents required on the project are listed. During the bid clarification meeting, the
required documents can be discussed individually. Any duplicate drawings should be
eliminated from the list; any disputed documents called for review can be agreed to their
status going forward. Through such reviews in the presence of the owner, vendor and
EPC engineer, agreements can be reached and dates established to receive the appropriate
256
drawings. This can be a pragmatic means of meetings the needs of both the engineers as
well as the vendor with a better chance of getting the vendor data on time.
8.4.9.5 Build Good Relations with Vendor
Another way to obtain vendor data on time is to build good relations with the prime-
vendor who can be considered a stakeholder in the project. With good relations, the
owner/EPC can expedite the sub-vendors through their contacts at the prime-vendor.
8.4.9.6 Assign Expeditor to Vendor’s Shop
A contractually allowable remedy, for the owner/EPC is to assign a shop expeditor based
in the sub-vendors shop; this individual’s role would specifically be to expedite the
vendor drawings and related matters (Corner, 2010) and also provide regular updates to
the home-office on the status of the order.
8.4.9.7 Role of Expeditor
It should be noted that the role of the expeditor is very critical during the bid clarification
meeting and after the purchase order has been issued to the vendor. The expeditor’s role
is to ensure clarification and understanding of the vendor data requirements during bid
clarification and follow-up with the supplier to get the drawings and data on time. This
can only be possible if the rules, expectations, and the schedule of receipt of the
respective drawings and data have all been set-up by the expeditor at the beginning of the
project; otherwise, vendors will not react with the same level of urgency if they are
established mid-way through the project (Corner, 2010). The understanding and use of

257
the SDI is vital to ensure timely submission of the vendor data which among other tools
and strategies, the expeditor plays a central role.
8.4.9.8 Vendor Evaluation
In order to reduce the time it takes to receive the vendor data, the technical bid evaluation
for all critical purchase orders should include an evaluation of the number of sub-vendors
and their vendors, which the prime-vendor anticipates. The bid evaluation team can then
determine, with the number of sub-vendors listed, whether there is a risk of vendor data
delay and whether the delay could possibly impact the project. It can also be useful to
also have the sub-vendors present at bid-clarification meetings where the schedule,
vendor data requirements, quality, and other specifications are discussed. This way, the
sub-vendors have first hand information of the owner/EPCs expectations.
8.4.10 Operability, Maintainability & Constructability
The ultimate users of any oil & gas facility are the staff from the operations and
maintenance groups, and they are the key stakeholders in the project. They will be the
people who will run the plant and maintain it. In order to have a good scope definition
and buy-in from operations, maintenance, and construction people, it is important to seek
their input regularly as the facility is being designed and developed. In Alberta, since
most of the engineering and design work for oil & gas facilities is usually done at the
EPC contractors’ offices in Calgary, it becomes difficult for many of the staff working at
operating plants in areas such as Fort McMurray or Cold Lake to always be physically
present in the engineering offices for longer periods of time. Due to their lack of
258
availability, misalignment between the engineering and maintenance & operations groups
is sometimes created. With recent advances in technology, tools such as video
conferencing, WebEx, and Skype are being used more and more. However, it can be very
helpful to have more dedicated time from the maintenance and operations personnel who
will be the ultimate users of the facility being designed.
There can be a couple of solutions to this issue. Considering that this is a critical item in
regards to successful design, the first solution is that the owners, particularly those with a
sizeable capital expansion program such as SAGD plants, should have a large pool of
operators and maintenance people. The owners should also understand that they will be
expanding their facilities, and therefore, this is a long term solution. From this pool, the
operators and maintenance personnel required should be embedded in the engineering
design team. The secondment would be a rotation lasting three months. At the end of this
period, another group of people would arrive at the engineering contractor’s offices.
Although there is a risk of differences in opinion among team members as a result of the
rotation, the advantage is the presence of the key stakeholders during the design phase.
The second solution is to have a replicable design for the SAGD facility, which can then
be used in subsequent projects of similar size and scope. This concept is elaborated on in
Chapter Nine.
A similar approach can also be used for constructability where personnel from the
construction contractors are embedded in the engineering team. While this is currently
practiced, there is a difference in culture among the construction staff, and they find it

259
difficult being restricted to an office environment for long periods of time. A rotation, as
suggested, for the operators and maintenance staff can help in this situation. In addition,
bonuses could be provided to these people who stay at the engineering office until the
end of the design phase. Finally, a clause in the contract could be included requiring the
construction contractor to provide and maintain the availability of key construction
personnel in the engineering Home Office until the design is at least 80% complete.
8.4.11 Vendor Quality Management
Quality is an essential aspect, particularly on oil & gas projects where the products
extracted from the reservoir are flammable and can easily create hazards for people
working on such projects. Therefore, various safety standards are incorporated into the
engineering design to prevent hazards from occurring. It then becomes imperative that
the vendor meet the exact design specifications, as identified in the engineering drawings,
during the period when these designs are fabricated. If this is not done, problems can
arise in the field during or after construction at which point it becomes costly to fix them.
Thus, the role of quality control inspectors is very important because the owners/EPC
rely on their judgement and expertise to verify whether the fabricator is meeting the
standards set out in the engineering design.
With the increasing number of fabricators involved on large projects, many of whom are
based internationally, it is difficult to have the owner’s representatives available and
present at every fabrication shop to verify whether the quality standards on the equipment
fabricated are being followed. Therefore, third party inspectors are hired to help represent
260
the owners/EPC in achieving this task. However, there have been numerous cases where
having third party inspector’s conduct the inspection is seen as not working as effectively
as desired. Some solutions to this issue include:
• Ensuring quality assurance/quality control (QA/QC) and technical design
documents are reviewed with the vendor by the engineering team during the bid
clarification meeting. This will provide the vendor with advance warning of the
tests and checks that will be performed during and upon delivery of the
equipment. Vendors can, therefore, be expected to work to comply with the
owner’s specifications in addition to the required Inspection and Testing Plan.
• On critical equipment, the owner’s staff should be stationed at the fabricator’s
shop to monitor packages for progress and quality; they should also thoroughly
test the equipment before delivery to ensure that there are no deficiencies.
• Third party inspectors should be made more accountable, and they should ensure
quality verification of the equipment is just not a sign-off process; it requires
more stringent checks to ensure QA/QC standards have been met.
• To accomplish the above, the owners/EPC must agree to assign the appropriate
man-hours in the budget for third party inspectors to perform the work.
8.5 Project Management Processes
Project Management Processes (PM Processes) is the second pillar to focus on in order to
implement the SAGD Execution Triangle (SAGD-ET). Within the PM Processes pillar,
the following areas of opportunity need to be implemented and tracked.
261
8.5.1 Simple Processes and Procedures
Project processes and procedures are key elements in engineering; they provide clarity,
uniformity, and consistency in the design and its applications. This in turn helps in
achieving the owner’s quality standards. However, with standards, processes and
procedures established by the numerous technical, regulatory, and corporate
organizations, it becomes an onerous requirement to meet them. In addition, some of
these processes and procedures are located in the various repositories and knowledge
databases of the owners/EPC organizations; searching through the databases and
identifying the correct ones to apply is a time-consuming task. While not minimizing its
importance, according to the survey participants, there needs to be simpler ways to
understand and internalize the processes and procedures and also ensure its correct
application. Needless to say, many of the engineers and support staff work on a wide
range of projects with various owners who have different processes and procedures,
which make the application even more confusing!
Solutions to make the processes and procedures simpler can include:
• Prior to the start of every phase of the project, review with the individual
disciplines the processes and procedures that will be used in the project’s
execution. Ensure that they are updated to meet the specific project requirements.
Emphasis and focus should be placed on the processes that are frequently used
and applied as well as those which the regulatory bodies pay attention to.
• Provide summaries of the frequently used processes and procedures in small
pocket sized booklets that can be quickly referred to by project personnel.
262
• Provide subject matter experts (SME) on every project by discipline that the staff
can contact in situation requiring quick reference or interpretation of a process or
procedure; this will also add to ensuring consistency across projects.
• Processes and procedures should be web-based and housed in intelligent Google-
type databases; this will make it faster to locate the relevant and appropriate
processes and procedures.
• Employ technical writers who have the training and expertise to write the
technical processes and procedures in a simplified and easy to understand manner.
• Ensure that processes, procedures, and/or standards are not changed mid-way
through a project. This can create a lot of rework and out of sequence work. It
also breaks a project’s momentum from having to back track and redo the work,
which subsequently results in falling behind schedule. All this rework results in
additional engineering hours and costs; therefore, it should be avoided.
8.5.2 Knowledge and Experience of Management Processes
Management is defined as “the process of reaching organizational goals by working with
and through people and other organizational resources” (Certo, 1980, p. 9). In her thesis,
Project Leadership: An Empirical Investigation, Krahn quotes Callan from the first
edition of the Harvard Business Review in 1992 who says
The intricacies of business and the personal qualities required are by no means the
same as those in purely technical work, even when this is of great complexity.
The business man is primarily dealing with men, and the engineer with things –
and herein lies in the greatest difference of them all (2005, p. 13).
263
Reflecting on these two statements, a conclusion can be drawn that to get work done on a
project, one needs the technical knowhow. To effectively manage a project, it is vital to
know how to work with people and how to get resolution to project issues in order to
achieve the project objectives. This view is confirmed by the survey participants who
maintain that experience and knowledge of management, are both extremely critical to
the success of projects.
8.5.2.1 Management Education
How does one ensure that knowledge and experience of management processes are
available among people in various positions leading the project? One obvious answer is
to ensure that people in leadership positions have the required knowledge of management
and of managing oil & gas projects. The knowledge of management is not in just
knowing the tools and processes; it is a deeper understanding of roles, responsibilities,
accountabilities, chain of command, lines of authority, motivation, decision making, and
building trust that are vital and required in order to establish the efficient management of
a project. Corporate organizations should, therefore, encourage individuals to educate
themselves in these areas, especially those involved in the management of projects.
Education can provide individuals with the processes on how to manage. Although this
solution has definite merit, it is a long term one, and it can take a while to achieve the
results, especially on projects of 2 to 3 years duration. It should be mentioned that many
corporate organizations have in-house training, which can help in the short term.

264
8.5.2.1.1 Is Leadership and Management the Same?
Based on the researcher’s observation, many of the in-house courses at various
organizations are focused on the leadership aspect, with less attention paid to
management and how to deal with the managerial issues of planning, organizing,
monitoring, feedback, and control. This is an area where there are weaknesses in project
organizations. The question that needs to be asked is “are leadership and management the
same, and does having skills of one area complement the other?” According to Kotter,
management involves processes, which includes planning & budgeting, organizing &
staffing, and controlling & problem solving to produce consistency, which helps keep
multifaceted organizations on time and budget (1990). Leadership, on the other hand,
involves movement, which establishes organizational or project direction, aligns people,
and motivate & inspires them to bring about change (Kotter, 1990). It however seems that
management and leadership on projects often get mixed up, and in some organizations,
there is more emphasis on leadership, rather than management. While this is an
interesting and relevant topic of discussion, it is beyond the scope of this research.
8.5.2.2 Project Organization Chart
One of the more effective solutions is to have an organization chart that is detailed,
current, and communicated to all members of the project team on a regular basis. The
organization chart not only provides the names and titles of people who will execute the
work, it also provides the structure of the project organization, the work areas and
respective elements of the scope, and the reporting structures. While this solution is not a
new one, based on the researcher’s observations and the survey participants’ comments,
265
the project organization chart is ineffectively used and underutilized as a tool on projects.
The disciplined use of the project organization chart can result in eliminating duplication
of effort, underutilization of expertise, inefficient utilization of time, and ineffective
decision making, which are symptoms of ineffectiveness on many projects.
8.5.2.2.1 How can the Organization Chart Work?
An organization chart has a lot of intelligence embedded in it. For example, the position
title describes the scope of work the individual is responsible for; by default,
accountability is included with responsibility. Whoever holds a certain position on the
organization chart is therefore responsible and accountable for the execution of the scope
of work. Responsibility and accountability cannot be separated. The individual holding
the position should be given the authority to also execute the scope of work. Also, it is
essential to have clear lines of authority and responsibility. This means that the person
holding the position is accountable for the decisions, and thus, should also be provided
with the decision making authority to achieve the results to the best of his/her ability.
In practical terms, the lines of authority and responsibility should be communicated to
everyone on the project; these lines should also be respected by all project team
members. Issues, for example, should only be elevated to a higher level of authority if it
remains unresolved at the lower level. This procedure is also important in terms of
communication, especially via email. Often times, more people than required are copied
on an email, resulting in everyone addressed trying to provide a response. While this
sometimes provides options for quicker decision making, it also results in making the
266
lines of authority and responsibility fuzzy and unclear. Therefore, email etiquette and
organizational discipline in who is to be communicated on emails should be established
and run along the same lines as the project organization chart.
The organization chart should also have a job description of each of the positions on it
identifying the role, responsibilities, and limits of authority. This helps in preventing any
overlapping of roles and responsibilities; it also ensures that the appropriate people are
involved for decision making.
Prior to the beginning of every project, a complete organization chart should be available;
the chart should be approved by the project sponsor and director of both the owner and
EPC organizations. Approval at the project sponsor and director level indicates
recognition of the roles, responsibilities, and accountabilities of the respective positions
together with a commitment to adhere to the overall project organization chart. From a
project perspective, this promotes a greater understanding of these roles and reinforces
the respective roles people have to play within their own discipline and with respect to
each other’s disciplines.
8.5.3 Set Realistic Key Milestone Dates
As described earlier in Section 7.10.1, there is often a struggle between the project
owners and the project execution team regarding the timeframe for project completion.
The project owner’s timeframe for completing a project are generally based on the
growth opportunities available, which are based on the state of the economy, the owner’s

267
cash-flow, the price of oil (see Figure 7.1.), the opportunity cost, and in some cases,
regulatory pressures. In contrast, the project execution team’s schedule is based on the
scope of work as well as the funding available, which determines the availability of
manpower to complete the work. The executing team also wants to know if the project is
cost-driven or schedule-driven so that they can plan the project accordingly. To add to the
equation is the ability of the vendors and contractors to deliver on time.
Both, the project owners and the executing team are justified in their positions; however,
there needs to be middle ground that meets both parties’ needs. In order to meet
everyone’s needs, all the stakeholders involved in the project, including the First Owner
(operations group), Second Owner (project team), EPC contractors, owner’s construction
team (see Figure 7.5.), commissioning & start-up team, the reservoir group, as well as the
major vendors and contractors should be involved at the time of FEL 1 in providing their
input in the front-end planning of the project. Therefore, it would be beneficial to award
the EPC contracts early on in FEL 1 so that the engineering and construction contractors
can also be involved in the discussion process at the project’s inception. By taking into
consideration the views of all stakeholders involved, the project owners can obtain a
comprehensive perspective of all the issues, concerns, and opportunities available in
executing the project. This not only helps in establishing project timelines amicably and
to everyone’s satisfaction, but it can also help identify opportunities to lower the project
costs in an effective manner (Harris, 2010).

268
Figure 8.9. Opportunities for Cost Reduction and Schedule Alignment
Project Phases
Costs
FEL 1 EDSDBM DE C&SU OPS
1. Signif icant
cost savings
can be
achieved by
consulting all
project
stakeholders
during FEL 1
2. Alignment
during FEL 1
should be done
among various
project owners
to achieve a
realistic
schedule
Opportunities
and amount of
cost savings
minimizes as
project
advances to
dif ferent
phases
As the design
advances,
costs to the
project go up
signif icantly as
a result of any
changes
In addition, it is important to communicate to the project team the basis of the schedule
so that they can incorporate them into the execution philosophy and strategy. It should be
noted that in the project’s life cycle, the FEL 1 & DBM provide the best opportunities to
lower a project’s cost. There can be opportunities after that point; however, considerable
effort and sacrifices need to be made in order to achieve only marginal savings in the
project overall costs. This inverse relationship between opportunity and costs to achieve
it is reflected in Figure 8.9.
8.5.3.1 Sample Schedule for a SAGD Plant – From Pilot Plant to Oil Production
Figure 8.10. shows a sample schedule for a 40,000 b/d SAGD plant with its major
components of pilot plant, central processing plant and well pads, and gathering lines.
The schedule shows the high level activities that are required from obtaining the reservoir
269
data from the pilot plant, analyzing the data, and based on this information, building the
central processing plant, ultimately yielding the oil production from the reservoir.
Schedule Assumptions
i. General Assumptions
• The sample schedule is for a Greenfield single phase SAGD plant, which can
produce 40,000 barrels per day of bitumen from the oil sands reservoir.
• This is the first SAGD plant undertaken by the project owner; therefore, data
from prior projects is not available. In addition, the developer has no previous
experience of executing SAGD projects.
• Land has already been acquired and will therefore not need to be bought.
• The major components of the plant include building a pilot plant, central
processing plant and well pads, and gathering lines (pipeline). The pipeline
will move the bitumen from the well pads to the central processing plant.
• This schedule assumes the engineering, procurement, and construction of a
single phase SAGD facility. A multi-phased project may require adjusting the
activities and its durations.
• The SAGD technology that is being used has been tested and will
consequently perform well; major changes will therefore not be required
during the construction and operations phases.
• Normal market conditions prevail in the economy; therefore, availability of
engineering services, bulk materials, equipment, third party services, and
construction labour may not cause significant delays.

270
• Electrical power is available and will be obtained from a third party. The
project scope does not include construction of a co-generation plant due to the
current low market rates for surplus power and additional cash-flow required
for building such a facility. This option should be used if a multi-phased
project is being considered.
• Campsite facilities for the trades people is assumed to be available in the
plant’s vicinity, and building new facilities are not required. If a long term
SAGD program is envisaged, then construction of a temporary and/or
permanent campsite should be considered.
ii. Pilot Plant Assumptions
• The pilot plant activities include building a basic central plant and well
pads with the aim of providing data such as SOR, identifying the pay
zones, etc. Based on this data, models will be developed and computer
simulations will be undertaken to identify the reservoir’s production
profile, upon which a long term surface facility will be built.
• Regulatory and permitting – applications will be submitted to the ERCB
for building the pilot plant.
• Two well pairs will initially be drilled to establish reservoir data.
Additional well pairs will be drilled to ascertain production profiles of
other areas of the reservoir.
271
• Reservoir data from the pilot plant will be collected over a period of 45
months; DBM for the central processing plant (surface facilities) will start
after 24 months of steam injection.
iii. Well Pads, Gathering Lines, and Central Processing Plant Assumptions
• Regulatory and environmental permit applications for the well pads, the
central processing plant, and pipelines will be submitted as a single
package.
• A longer period for FEL 1 is provided in order to do a longer term
planning for a project with multiple phases.
• Engineering from the DBM to EDS and DE phases will be continuous;
therefore, the same EPC contractor will carry out the engineering for all
three phases.
• Infrastructure activities include activities, such as earthworks for the entire
site and clearing the land from all the trees and shrubs where the central
processing plant, well pads, and pipelines will be physically located. It
includes laying the underground utilities and power lines that will be
required by the central processing plant and well pads
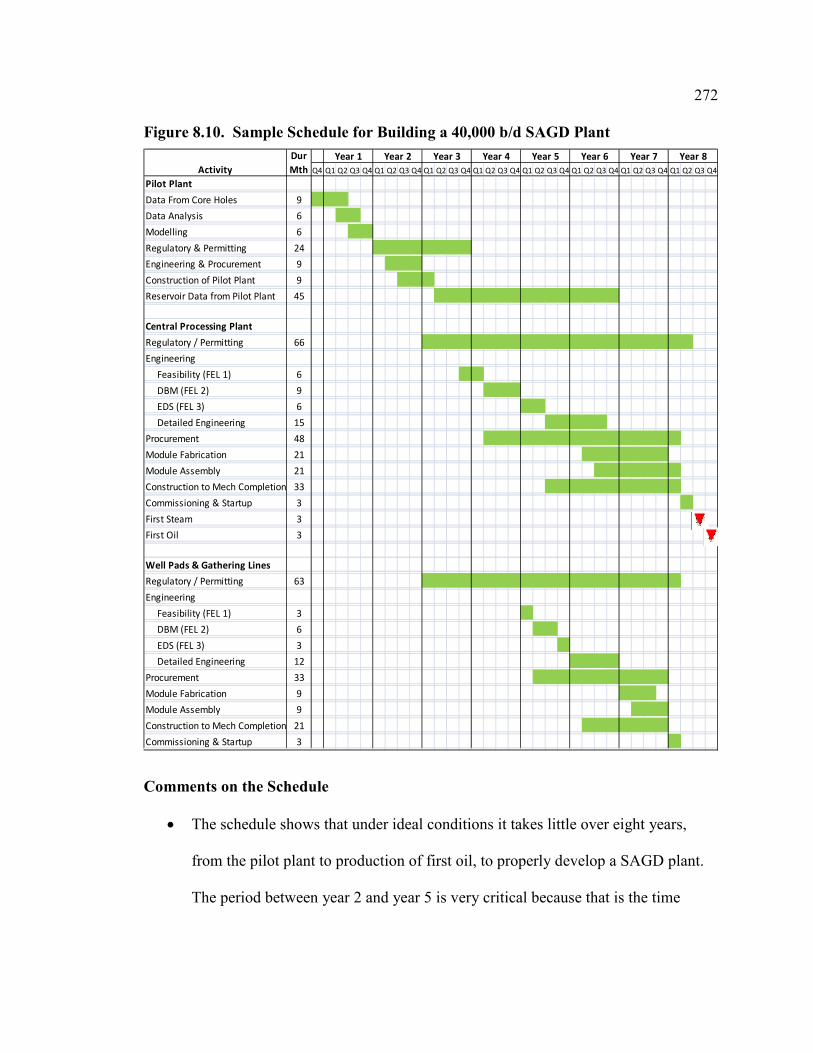
272
Figure 8.10. Sample Schedule for Building a 40,000 b/d SAGD Plant
Q4 Q1 Q2 Q3 Q4 Q1 Q2 Q3 Q4 Q1 Q2 Q3 Q4 Q1 Q2 Q3 Q4 Q1 Q2 Q3 Q4 Q1 Q2 Q3 Q4 Q1 Q2 Q3 Q4 Q1 Q2 Q3 Q4
Pilot Plant
Data From Core Holes 9
Data Analysis 6
Modelling 6
Regulatory & Permitting 24
Engineering & Procurement 9
Construction of Pilot Plant 9
Reservoir Data from Pilot Plant 45
Central Processing Plant
Regulatory / Permitting 66
Engineering
Feasibility (FEL 1) 6
DBM (FEL 2) 9
EDS (FEL 3) 6
Detailed Engineering 15
Procurement 48
Module Fabrication 21
Module Assembly 21
Construction to Mech Completion 33
Commissioning & Startup 3
First Steam 3
First Oil 3
Well Pads & Gathering Lines
Regulatory / Permitting 63
Engineering
Feasibility (FEL 1) 3
DBM (FEL 2) 6
EDS (FEL 3) 3
Detailed Engineering 12
Procurement 33
Module Fabrication 9
Module Assembly 9
Construction to Mech Completion 21
Commissioning & Startup 3
Year 8Year 7
Activity
Dur
Mth
Year 1 Year 2 Year 3 Year 4 Year 5 Year 6
Comments on the Schedule
• The schedule shows that under ideal conditions it takes little over eight years,
from the pilot plant to production of first oil, to properly develop a SAGD plant.
The period between year 2 and year 5 is very critical because that is the time

273
when a significant number of important decisions are made regarding the project
in the short and long term.
• It is vital that the core hole samples be collected during the winter months because
the ground is frozen making it easier to get the samples
• Data modelling can start a few months after the data from the core holes has been
analyzed. It can be a parallel activity after a certain point.
• Since the pilot plant is small in size processing approximately 1,000 b/d, the
engineering and construction activities will be fast tracked in order to save time
which in turn will help obtain reservoir data much earlier.
• Engineering and construction activities for the pilot plant will take less than one
year to complete.
• Reservoir data will be collected for a period of close to 4 years; although for
simulation and modelling purposes, the data will be used after collecting for a
period of two years.
• For central processing plant and well pads, regulatory and permitting activities are
continuous activities from year two onwards since approvals need to be obtained
intermittently for the projects during the various phases including start-up.
• The DBM and EDS phases for the central plant will be 15 months in duration.
This will enable a good scope definition and proper front-end planning.
• Procurement activities start early to ensure active involvement of the procurement
personnel from the beginning in order to assist in the front-end planning.

274
• Construction activities start when detailed engineering is approximately 30%
complete. Construction activities at this point will only involve earthworks
including site clearing and civil works including piling and foundations.
• Modularization activities are identified as two distinct activities, that is,
fabrication and module assembly. This is to show that the two are separate
activities which need to be staggered; if they are not planned in a coordinated
fashion, they can potentially impact each other and creating delays to the overall
construction schedule.
• Transportation of the modules will take place in the winter months to take
advantage of the weather windows and in order to avoid the roads bans.
• Pre-commissioning activities will be done during the last quarter of the
construction phase.
• Mechanical completion identifies the end of the construction period. At this point,
the SAGD central processing plant, well pads and gathering lines will be handed
over to the First Owner (the plant operations group) which will take custody, care
and control of the facilities.
• The operations group will undertake the plant’s commissioning and start-up
activities which will take three months to complete.
• Three months after starting up the plant, steam generated at the central processing
plant will be pumped into the reservoir using the well pads.
• After three months of pumping the steam into the reservoir, the first oil will be
produced and collected into the central plant facilities for further processing.

275
As discussed in Section 8.1, political, economic, social and technological forces can be at
play on every project at any given time. Therefore, the schedule durations may change
depending on the particular forces at play. For example, if oil prices suddenly rose
significantly, then the project owner may decide to build the plant at a faster pace than
normal in order to gain the potential cash-flow that the project can generate.
8.5.3.2 Decision Making
As mentioned in Section 8.1.2.2, decision-making is usually weak during the early stages
of the project, thus resulting in churn. This is generally the case during the FEL 1 stages
as well when critical project decisions have to be made, particularly with very little
information available. Some solutions to making effective decisions efficiently and in a
timely manner include (Priemus, et al., 2008; Williams, Samset, & Sunnevag, 2009) :
• Start the decision making process with a sound problem analysis
• Being aware of bias and eliminate it from the decision alternatives
• Viewing the problem with an outsiders perspective, rather than as an insider
• “Considering the opposite” by asking the question “What are some of the reasons
that my initial judgement might be wrong?” (Williams, et al., 2009, p. 188)
• Use group decision-making using methods such as the Delphi Method (see
Chapter Five) that can help eliminate bias
8.5.4 Early Environmental Assessment
With the strict regulatory requirements in Alberta, early environmental assessment is
imperative in order to be able to proceed with the projects on a timely basis. Specifically,

276
a disturbance assessment of the natural habitat in the surrounding areas of the SAGD
facility is required. Patterns of the natural habitat of the neighbouring areas, including
birds, caribous, bats, wild flower, vegetation, fish, deer, etc., have to be assessed for
being endangered as a result of the construction and operations of the plant. To establish
a good baseline assessment, these species have to be assessed during different times of
the year based on their migratory patterns. To prevent any unknown issues in the future
and to ensure that the dynamics of the environment of the area have been mitigated, it is
prudent to involve the stakeholders early, especially the environmental groups and
entities owning land near the facility. This also ensures that all the stakeholders are
aligned with the project developers. While the owner companies may have some of the
environmental information, it is recommended to get consulting companies who
specialize in undertaking environmental assessment to provide expert and unbiased
perspectives and appropriate mitigation strategies.
8.5.5 Effective Change Management
Despite scoping out the project as clearly as possible, all projects are impacted by
changes at various points during their life cycle; some changes are minor and others are
major; changes can positively or negatively impact the project. They generally include
changes to reservoir data, scope, execution strategy, technology, equipment size,
materials metallurgy, construction sequence, schedule, etc. Hence, there has to be
constant monitoring and vigilance around changes during all phases of execution. It is
important to note that project changes, or Trends as they are called in the industry, are
really an amendment to the contract, especially when they impact the contractor.

277
Therefore, the ability to deal with project changes and the manner in which they are
recognized, accepted, and mitigated are key factors in a project’s execution. On oil & gas
projects, most changes happen during the engineering phases where changes in one area
can impact many other areas simultaneously, including the procurement and construction
areas. If the engineering design is incomplete, then there could be significant number of
changes which can arise during the construction phase of the project. In order to take
appropriate action to mitigate them, the collective impact and the resulting risks of the
changes have to be identified and quantified. The important components of an effective
change management process are explained in the next section.
8.5.5.1 Early Recognition of Changes
Early recognition of changes to a project is very critical because it helps to draw the
project manager’s attention to the area where there could be potential problems.
Recognition is important because it provides an early warning system to the project, the
owners, and the stakeholders. Changes on the project, be it from the engineering,
procurement, or construction areas or a combination of all of them, need to be
acknowledged as soon as awareness of it is created; one can recognize the change upfront
and start dealing with it, or ignore it and hope that it will not happen. The former option
provides enough time to plan strategies to mitigate if the change is real and does
materialize. To provide an early warning system, project team members should be
encouraged to initiate a project change notice (PCN) as soon as they come across a
potential change situation. This alerts other team members including the project manager
and allows them to identify the cascading impact of the change to their respective areas.

278
The latter option of ignoring the change or acknowledging it late can result in less time
available to react and mitigate it.
8.5.5.2 Acceptance of Change
Upon recognition and assessment of the change, a decision to accept and acknowledge
the change is important. Sometimes, there is a delay in accepting the change, which could
be due to reasons such as:
• too early in the project to determine the impact of the change
• insufficient data to determine the impact of the change
• time to identify which party is responsible for the costs of the change; this
depends on the type of contract, for example lump-sum or cost reimbursable
• uncertainty about the owner’s reaction to the change
• insufficient contingency funds to cover the change
It is prudent to deal with changes as soon as they are recognized. This means that changes
have to be approved on a timely basis; this can be done though regular change
management meetings which can be scheduled on a weekly or biweekly basis. Failure to
get quick approval for the changes can sometimes cost more in later stages because the
design becomes more mature in its development, and therefore, the impact of changing
the design later and its cascading impact can be much greater. In addition, working with a
set of approved changes is critical to the contract, as it provides a good basis for cost
control. However, on most SAGD and oil & gas projects, the owner of the project will be
open to accepting the change if it improves the safety, operability, or maintainability of
279
the facility. This is because these are critical areas, which can severely obstruct the plant
operations in the long term if it is not taken care of during the engineering and
construction phases.
8.5.5.3 Mitigation to Changes
Mitigation strategies need to be identified early and implemented quickly. The
identification of solutions also helps to decide on the best option based on the most
current available information. Due to the nature of some changes, which can impact a
large number of areas, a detailed estimate needs to be prepared in order to quantify the
change. The quantification includes the addition or reduction of engineering and field
manpower, equipment and material quantities (and their respective costs), and the
associated impact to schedule. Based on this complete information, the owner can decide
whether or not to proceed with the change. Depending on when the change is identified
during the project’s phase, if it is possible, delaying the implementation of the change
until after the facility has been constructed or undertaking it during subsequent phases of
the project can be a better decision. Sometimes, implementing large scale changes can be
too disruptive to the engineering or construction execution sequence; delaying the
implementation in some cases can be a better option.
8.5.5.4 Changes on SAGD Projects
As discussed in detail in Section 7.1, changes in building the surface facilities of a SAGD
plant as a result of changing reservoir conditions is much more pronounced and requires
an effective change management process. Reservoir data, which consists of a Type Curve
280
or well characteristics as illustrated in Figure 8.5. identifies the oil production vis-a-vis
the steam injected into the reservoir. On the basis of the information analyzed and
interpreted from a reservoir’s type curve, changes to the surface facilities, such as the
number of well pads, equipment sizing, etc., need to be made.
However, as recommended earlier, the team designing the surface facilities should, to a
certain extent, be shielded from the frequent yet minor changes to the reservoir data.
Otherwise, there would be too many changes to the design, which can prove to be
disruptive to the engineering sequence executing the work. This is why there needs to be
a good deal of synchronization and communication between the key individuals and
stakeholders on the reservoir, operations, and the project management teams regarding
the changes emanating from the reservoir data. This group would also decide on whether
or not to change the design basis and criteria of the surface facilities. It is prudent though
to establish a cut off point after which changes emanating from the reservoir should be
differed to the debottlenecking phase unless they are significant.
8.5.5.4.1 Implement Management of Change (MOC) Process Early
For this reason, it is imperative to implement a Management of Change (MOC) process
as early as possible in the project cycle, with tight controls. It is also important to record
all the current and potential changes to the surface facilities. Due to the lack of complete
information available from the reservoir and because of the conservative nature of the
engineers, the equipment and vessel sizes are designed with a higher capacity or
oversized duty compared to cases where all the information is perfect and readily

281
available. This inclusion of a safety factor, from a project perspective, increases the
project’s total cost. Through the exchange of information and an increased dialogue
between the three parties, the two project owners and the EPC contractor, a better
understanding of the risks impacting the project and each party’s perspectives in dealing
with it can be achieved. The MOC process also helps in providing the necessary
information to assess the impact of various options and decisions to mitigate the
associated risks. Ultimately, the MOC process keeps the stakeholders informed, achieves
their buy-in, and assists in keeping track of the additions and deletions to the project
scope, which in turn ensure the project costs do not overrun the approved budgets.
8.5.5.4.2 Risk Analysis
It is also important to conduct a good technical and execution risk analysis. A risk
analysis can be conducted on the entire project or, depending on the phase of the project,
only on specific areas. For an effective risk analysis, it is prudent to involve all the
stakeholders who will be working on the project in order to solicit their opinions. If
possible, get a cross-section of people within the project organization so as to get a better
understanding of areas most susceptible to risk.
It is recommended that the initial risk sessions should be done based on the Delphi
Method (see Chapter Five), instead of holding sessions where all the major players are
present. Often at such sessions, there are various organizational players, with different
ranks, positions, and expertise involved which can result in the dominant players doing
most of the talking rather than collecting a cross-section of views and opinions. Such

282
situations can be a hindrance for bashful people to present their thoughts, consequently
depriving the project of valuable information. From the researcher’s experience, the
Delphi Method can be an excellent technique to collect the perspectives of different
people, which can then be analyzed during the public session and later by using software
tools such as @risk or PertMaster.
8.5.5.4.3 Important Points on the Change Management Process
From a project control perspective, a good change management process can efficiently
facilitate record keeping of all changes to the project. However, there are certain areas to
which one needs to pay particular attention, which are listed below (Clark & Lorenzoni,
1997):
• The contractor should avoid verbal authorizations to any change as there is no
backup documentation available; the implementation of the change can be
challenged by the owner in the event of a dispute.
• As much as possible, changes should be evaluated with accurate cost estimates
and the potential schedule impacts; failure to have these identified indicates that
final project costs are unknown, which breeds doubt in the numbers.
• Ensure all the changes are included in the control estimate.
• Budget shifts should be included in the control estimate; absence of this indicates
that the estimates do not reflect the project execution plan.
• Ensure that a good quality backup documentation to the cost estimates and
schedule impact is available in the event of a challenge in the court of law.
283
8.5.6 Timely Receipt of Vendor Data
Please refer Sections 7.5 and 8.4.9 where an exhaustive discussion on vendor data
requirements and timely receipt of vendor data is presented.
8.5.7 Meet Owner’s Quality Requirements (QA/QC)
Quality Assurance (QA) is about ensuring that “we will deliver the expected quality and
scope”; Quality Control (QC) on the other hand, “is about making sure that we have
delivered the expected quality and scope” (F. Hartman, 2010, p. 14). Quality standards
are an important element for every owner of a project. The primary concern for every
owner is safety during the plant operations, especially when dealing with petro-chemical
facilities. Therefore, the project owner establishes and specifies the quality requirements
for almost all aspects, which explains in detail how the activities will be done and
delivered by their own organization and engineering, procurement, and construction
contractors. The owner’s quality standards generally incorporate internal as well as
external quality requirements.
The external requirements are established by government regulations, codes, statutes,
permitting requirements, as well as industry “best” work practices. Internal quality
standards are established with the aim of achieving certain profitability, productivity, and
competitiveness which meets the strategic plan of the organization as a whole (Hiltz,
1994). Based on the quality standards established, the owner sets out a quality assurance
(QA) program, which ensures that the standards are being met. Hiltz comprehensively
defines quality assurance as “the managerial process that determine the organization,

284
design, objectives and resources, and that provide the project team, client and
shareholders with performance standards and feedback on the project’s performance”
(1994, pp. 8K-4 Vol 2). A list of sample procedures is identified in Appendix I.
The owner of the project ensures that the quality control (QC) standards established for
all material, equipment, and services are being followed; quality control is “the technical
process that examines, analyze and report the project’s progress and conformance with
performance requirements” (Hiltz, 1994, pp. 8K-6 Vol 2). The EPC contactors also assist
the owners of the project in auditing and verifying that the standards put in place are
being followed; in cases where they are not being followed, performance improvement
notices (PIN) are issued by the quality department to the respective discipline to ensure
that corrective action is taken immediately.
8.5.7.1 Enhance Role of Quality Discipline
Generally, on large projects, the Quality department is well versed with the project
documents and how they are organized. This group is also knowledgeable of the
procedures because they conduct regular audits of its application projects. With these
mandates, together with knowledge of the documents and procedures, the Quality
department’s role should then include orienting new people as they come on board during
the project’s various phases and as teams get built-up. They should orient the new team
members regarding the various project documents, communication flows (to the
respective people) of such documents, how they are stored on and retrieved from the
various databases, and the roles and responsibilities of the various people in the project
organization. Such an orientation helps the team members better understand the flows,
285
people, and procedures, which would ultimately help in enhancing project
communications.
8.5.8 Plan for Weather Windows
For Northern Alberta projects, one has to be cognizant of the weather patterns and the
restrictions to use the highways for transporting heavy equipment and modules. These
include load height restrictions of not more than 29.5 feet on trucks or trailers, various
weight restrictions during the five shipping seasons, restrictions from overhead power
lines, restrictions due to bridge weight bearing capacities, and specific highway routes for
shipping heavy loads dictated by legislation (Oshanek, 2010). These factors have to be
incorporated in the planning phase and the construction schedules. Attention should also
be paid to any subsequent changes to the plan to ensuring that the weather windows and
transportation requirements are not missed.
8.6 Communications
Effective communications on EPC projects can be a very complex and overwhelming
task. This is due to the numerous attributes and elements that impact the process of
communication. The attributes include style, parties, channels, flows, objects, and
generations. Studies have shown that there is a positive correlation between the amount
of communication and the performance achieved in engineering the design (Knoop,
vanBreemen, Vergeest, & Wiegers, 1996). By not considering communications in the
project’s organizational strategy, there can be unintended consequences, which can
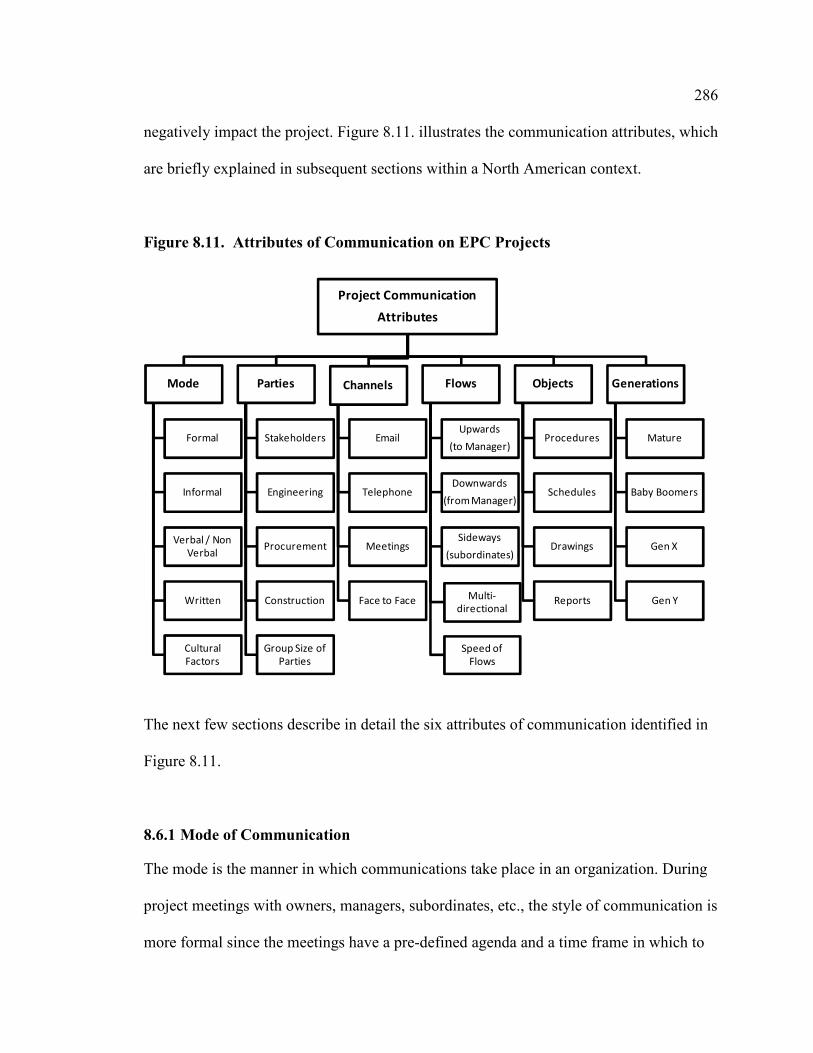
286
negatively impact the project. Figure 8.11. illustrates the communication attributes, which
are briefly explained in subsequent sections within a North American context.
Figure 8.11. Attributes of Communication on EPC Projects
Project Communication
Attributes
Mode
Formal
Informal
Verbal / Non
Verbal
Written
Cultural
Factors
Parties
Stakeholders
Engineering
Procurement
Construction
Group Size of
Parties
Channels
Telephone
Meetings
Face to Face
Flows
Upwards
(to Manager)
Downwards
(from Manager)
Sideways
(subordinates)
Multi-
directional
Speed of
Flows
Objects
Procedures
Schedules
Drawings
Reports
Generations
Mature
Baby Boomers
Gen X
Gen Y
The next few sections describe in detail the six attributes of communication identified in
Figure 8.11.
8.6.1 Mode of Communication
The mode is the manner in which communications take place in an organization. During
project meetings with owners, managers, subordinates, etc., the style of communication is
more formal since the meetings have a pre-defined agenda and a time frame in which to
287
complete the meeting. Away from meetings and formal settings, the communication
style is less formal, as if one is talking to a friend. However, most of this communication
is mostly business related. An important aspect is the verbal and non-verbal
communication; the latter is significant because it conveys many messages. For example,
a person’s body language is a good source of non-verbal communication, which varies
based on culture and gender. Within these modes, there is the cultural element which can
alter the meaning of what is being communicated. Most oil & gas projects in North
America have team members who come from different parts of the world and have
different ways of communication, which are often rooted in their culture of origin. In
addition, for many of them, English is not their first language. This results in different
levels of understanding, which is also reflected in the written and verbal communication.
8.6.2 Parties to Communication
This includes the various groups of people among whom communication takes place on
projects, The major groups on oil & gas projects include stakeholders, such as owners
including their ready for operations (RFO) and commissioning & start-up (C&SU) teams,
engineering, procurement, and construction teams. Communication happens internally,
externally, and across these groups. The distinguishing feature about these groups,
especially on projects, is that they are all in different locations, which makes it difficult
logistically to bring them together. Sometimes they work at different times, for example,
the construction group or Workshare in overseas countries. Such dynamics provide
certain disadvantages to communicating effectively and on a timely basis. In addition, the
288
size of the various groups involved in the project’s effort can be large, making it more
challenging to communicate.
For example, a large SAGD project producing 60,000 b/d can possible employ
approximately 400 to 500 people in the engineering and procurement areas, 2000 to 3000
people in the construction area, hundreds of other people working in the vendors and sub-
contractor areas, and other stakeholders in different locations. With such numbers of
people working on a single project, effective communications can certainly prove
daunting and challenging even at best of times. According to Weaver, as the number of
people working on a project increases, the number of relationships between them
increases significantly and can be determined by the formula (Weaver, 2007):
(N x (N-1))/2 where N represents the number of team members
Using this formula, on a project involving 400 people in the engineering and procurement
areas only, there can be 79,800 relationships! This number illustrates how enormous
complex the communications problem can get and the need to ensure that it is happening
effectively on projects, regardless of the size.
8.6.3 Channels of Communication
The predominant channel of communications on projects over the last 10 to 15 years has
been email. This is a very efficient tool for instantaneous communication and particularly
for transmitting large documents and drawings. The drawback of email is that there is too
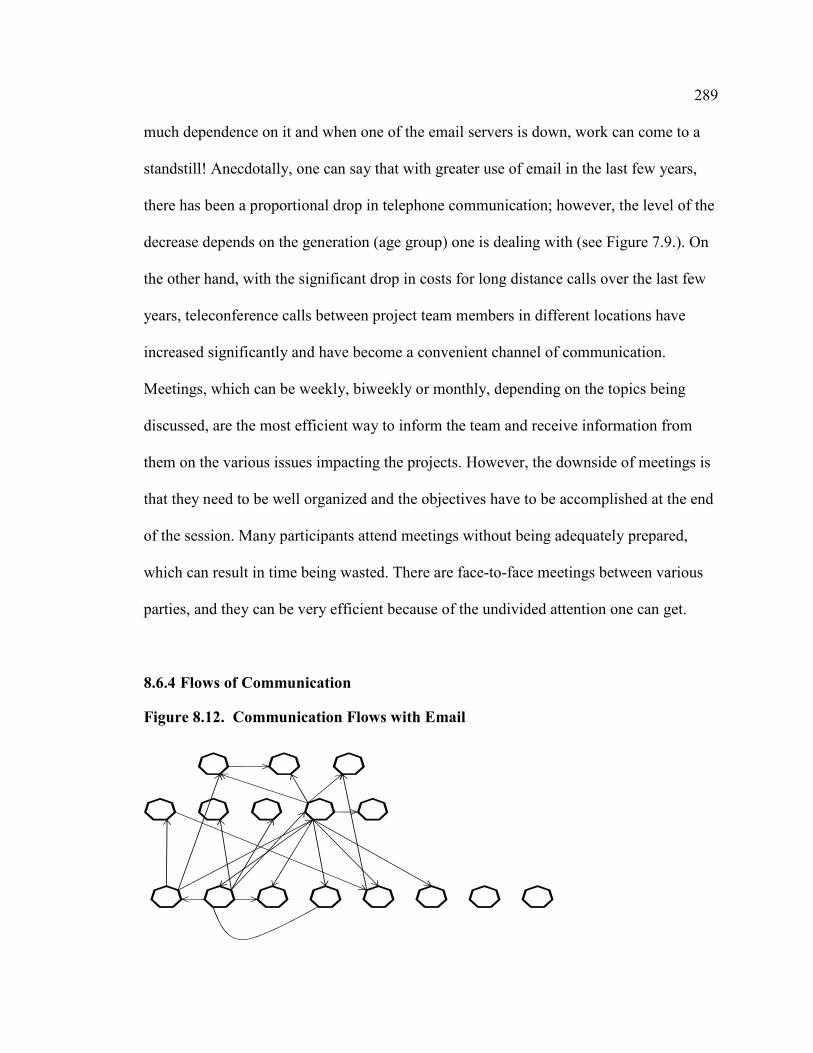
289
much dependence on it and when one of the email servers is down, work can come to a
standstill! Anecdotally, one can say that with greater use of email in the last few years,
there has been a proportional drop in telephone communication; however, the level of the
decrease depends on the generation (age group) one is dealing with (see Figure 7.9.). On
the other hand, with the significant drop in costs for long distance calls over the last few
years, teleconference calls between project team members in different locations have
increased significantly and have become a convenient channel of communication.
Meetings, which can be weekly, biweekly or monthly, depending on the topics being
discussed, are the most efficient way to inform the team and receive information from
them on the various issues impacting the projects. However, the downside of meetings is
that they need to be well organized and the objectives have to be accomplished at the end
of the session. Many participants attend meetings without being adequately prepared,
which can result in time being wasted. There are face-to-face meetings between various
parties, and they can be very efficient because of the undivided attention one can get.
8.6.4 Flows of Communication
Figure 8.12. Communication Flows with Email

290
Communication generally flows upwards from subordinates to the superior, downwards
from the superior to the subordinates, and sideways among the team members. These
flows depend on how the message is being communicated and which channels of
communication are used. For example, with email communications, these flows can have
multiple directions and flows, as people have the ability to send the same email to
multiple parties; this causes the communication flows to be very fuzzy. While this has its
advantages, it also has the potential for not communicating important information to
many individuals. Figure 8. 12. shows the multi-directional flows of communication
using email, which can get sporadic, resulting in the blurring of the chain of command in
a project organization.
8.6.5 Objects of Communication
Oil & gas projects require communication on various aspects of the project. These
aspects include procedures, schedules, drawings, reports, etc; this can add up to hundreds
of thousands of documents on large projects. This is why EPC contractors and owners
have large databases, which form a repository where these documents are mandated by
management to be stored so that they can be retrieved efficiently by anyone working on
the project, including when project is operational.
8.6.6 Generations
As illustrated in Figure 7.9., project teams have members of different generations, such as
Mature, Baby Boomers, Gen X, and Gen Y, who prefer different styles and methods of
communication. Project teams have always had members of different generations

291
working on them; however, over the last 10 years or so, with the introduction and
proliferation of new technologies such as email, text messaging, BlackBerry, iPhone, etc.,
the differentiation in the modes of communication between these generations has become
more pronounced. While there are advantages and disadvantages associated with each
form and style of communication, the important aspect is to ensure that it is, “timely,
complete, accurate and verified” (F. Hartman, 2000, p. 29).
8.6.7 Solutions to Improve Communications on Projects
The discussion in the previous sections illustrates that communication, as simple a
concept as it seems, is a complex process involving numerous interdependencies and
variables of its attributes. This is particularly evident when communication is viewed
from the context of oil & gas projects with the various stakeholders situated in different
locations, using different channels of communication, having different issues and
interests to be fulfilled, and needing to work with various objects across multicultural and
multigenerational team members.
Figure 8.11. also demonstrates the complexity in building an effective model of
communication for oil & gas and SAGD projects. Although this area is beyond the scope
of this research and the researcher’s expertise, in the subsequent sections, some solutions
are recommended for both owner and EPC companies that can be undertaken in
executing SAGD projects to make communication on projects more effective.
292
8.6.7.1 Build a Culture of Trust
Trust is a key component for enhancing communication. There are many definitions of
trust, depending on the context or situation. Within the context of communication, trust
can be defined as “firm belief or confidence in the honesty, integrity, reliability, justice
etc. of another person or thing” (Wiley, 2010, p. Para 1.a.). Roberts & O’Reilly’s
research on communication patterns between subordinates and their superiors suggests
that there is significant relation between trust and the desire to communicate (1974).
Their research suggests that a subordinate is more inclined to communicate with his/her
superior if there is a high degree of trust. In fact, their research suggests that trust is an
important precursor to having openness and accuracy with which superiors and
subordinates interact and communicate; the authors state that when there is a low degree
of trust among groups, it results in “inadequate data-flow, which in turn, causes groups to
continue to operate with partial efficiency” (Roberts & O'Reilly III, 1974, p. 212). While
there is no doubt about the importance of good communication, the data-flow among
groups and the efficiency with which the project operates is the key reason why trust is so
critical. Hence, trust is a major component in ensuring the free flow of information.
In order to improve communication on projects, it is fundamental to establish a culture of
trust within the organization. This can be done by creating more openness and
transparency in the work between the subordinates and their superiors and various
stakeholders such as engineering, procurement, construction, and owner’s, etc., as well as
other groups across the organization. Hartman, who has done considerable research in the
area of trust, concurs that it is an important component in project execution and says,
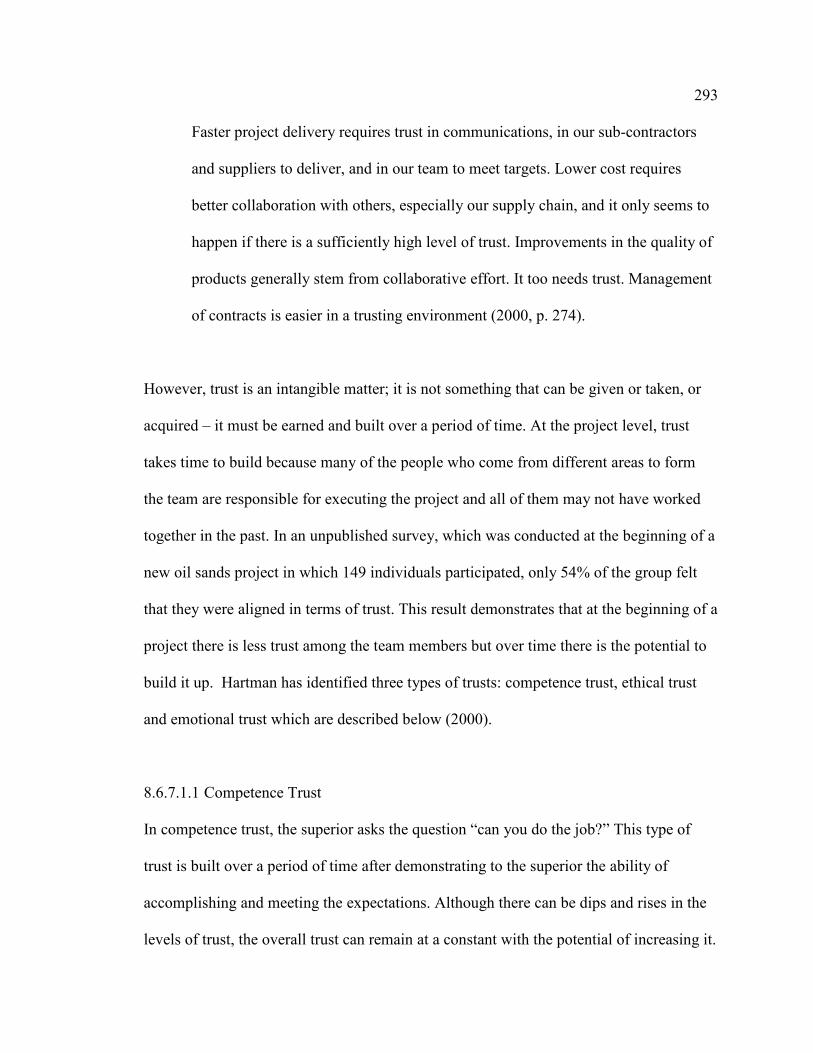
293
Faster project delivery requires trust in communications, in our sub-contractors
and suppliers to deliver, and in our team to meet targets. Lower cost requires
better collaboration with others, especially our supply chain, and it only seems to
happen if there is a sufficiently high level of trust. Improvements in the quality of
products generally stem from collaborative effort. It too needs trust. Management
of contracts is easier in a trusting environment (2000, p. 274).
However, trust is an intangible matter; it is not something that can be given or taken, or
acquired – it must be earned and built over a period of time. At the project level, trust
takes time to build because many of the people who come from different areas to form
the team are responsible for executing the project and all of them may not have worked
together in the past. In an unpublished survey, which was conducted at the beginning of a
new oil sands project in which 149 individuals participated, only 54% of the group felt
that they were aligned in terms of trust. This result demonstrates that at the beginning of a
project there is less trust among the team members but over time there is the potential to
build it up. Hartman has identified three types of trusts: competence trust, ethical trust
and emotional trust which are described below (2000).
8.6.7.1.1 Competence Trust
In competence trust, the superior asks the question “can you do the job?” This type of
trust is built over a period of time after demonstrating to the superior the ability of
accomplishing and meeting the expectations. Although there can be dips and rises in the
levels of trust, the overall trust can remain at a constant with the potential of increasing it.
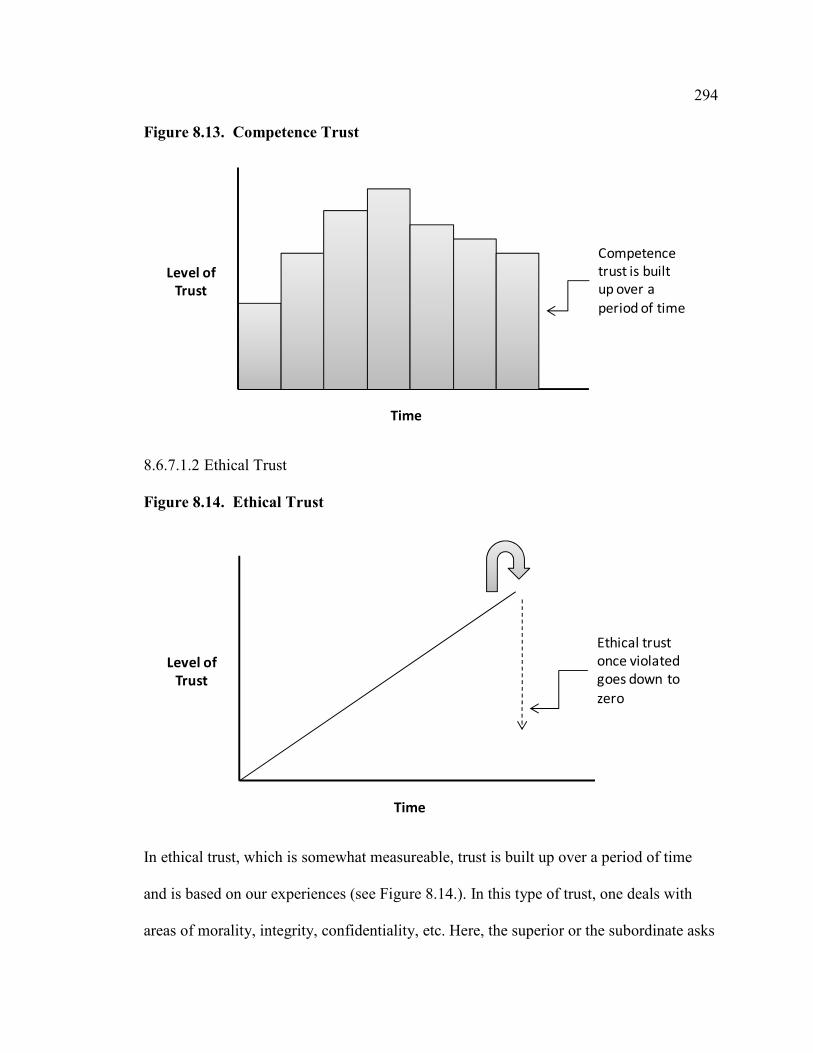
294
Figure 8.13. Competence Trust
Time
Level of
Trust
Competence
trust is built
up over a
period of time
8.6.7.1.2 Ethical Trust
Figure 8.14. Ethical Trust
Ethical trust
once violated
goes down to
zero
Time
Level of
Trust
In ethical trust, which is somewhat measureable, trust is built up over a period of time
and is based on our experiences (see Figure 8.14.). In this type of trust, one deals with
areas of morality, integrity, confidentiality, etc. Here, the superior or the subordinate asks
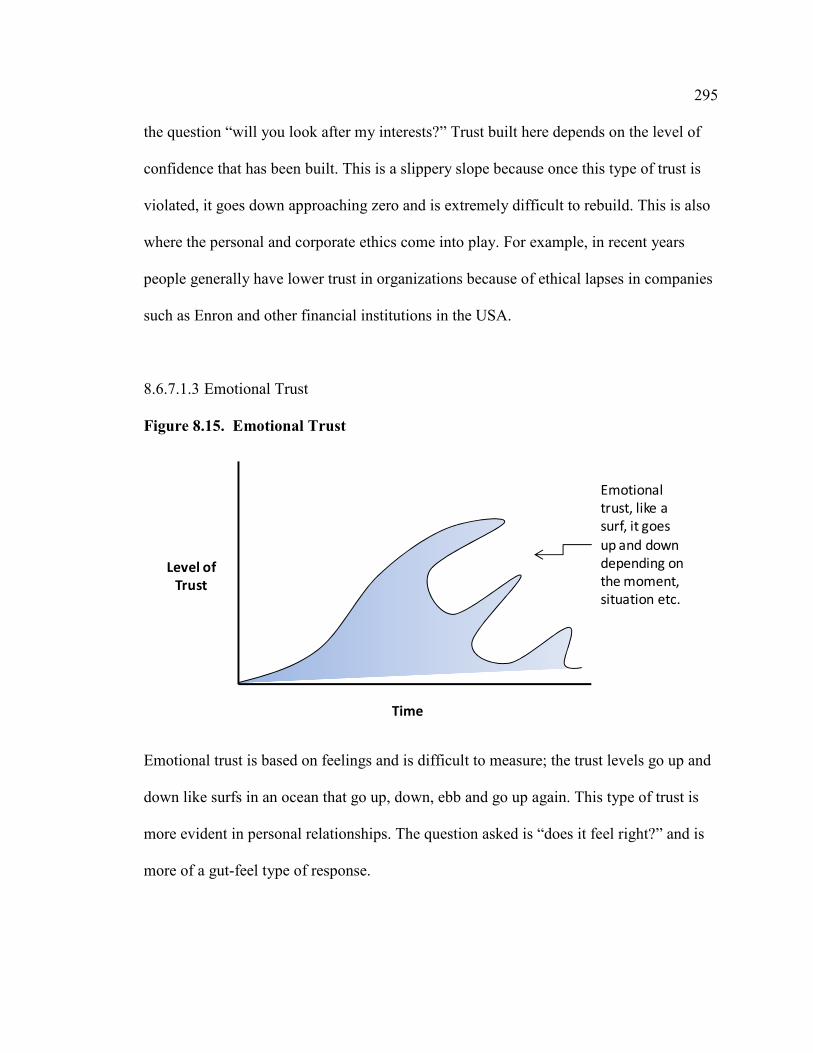
295
the question “will you look after my interests?” Trust built here depends on the level of
confidence that has been built. This is a slippery slope because once this type of trust is
violated, it goes down approaching zero and is extremely difficult to rebuild. This is also
where the personal and corporate ethics come into play. For example, in recent years
people generally have lower trust in organizations because of ethical lapses in companies
such as Enron and other financial institutions in the USA.
8.6.7.1.3 Emotional Trust
Figure 8.15. Emotional Trust
Emotional
trust, like a
surf, it goes
up and down
depending on
the moment,
situation etc.
Time
Level of
Trust
Emotional trust is based on feelings and is difficult to measure; the trust levels go up and
down like surfs in an ocean that go up, down, ebb and go up again. This type of trust is
more evident in personal relationships. The question asked is “does it feel right?” and is
more of a gut-feel type of response.

296
8.6.7.1.4 How to Increase Trust in Organizational Settings
Communications can be increased in an organizational setting by increasing the level of
trust. This can be done by increasing the credibility achieved by performing a task for a
superior or subordinate. Figure 8.16. illustrates a theory on how to increase trust in an
organizational setting. It starts with a task which needs to be accomplished by a
subordinate (#1); the quality of the performance and delivery (#2) results in an increased
or decreased amount of credibility for that person (#3); on the basis of the task
performed, trust is built up (#4). Increased trust, therefore, results in increased
communication (#5), because the person has met the superior’s requirement of the task
and has, therefore, proved to be more dependable.
Figure 8.16. Increasing Trust in Organizational Setting
1. Task
2. Deliver
3. Increased Credibility
4. Higher
Trust
5. Increased
Comm-unication
In a journal article in The International Association of Facilitators Handbook, Paul T. P.
Wong provides some simple, but very powerful points on how to increase trust in an
organizational setting (Schuman, 2006), which include:

297
• Always clarify and qualify your promises to make sure that you don’t set up
unrealistic or erroneous expectations
• Honesty is the best policy. Always tell the truth, even if it might get you into
trouble.
• Have the courage to confront and take corrective actions when there is a problem.
• Trust people first until they prove themselves untrustworthy.
• Empower and validate others until they disqualify themselves by betraying your
trust repeatedly.
• Communicate openly and honestly, and explain your decisions.
• Earn people’s trust by building a reputation for being competent and trustworthy.
• Make decisions based on core values and principles, rather than expediency.
8.6.7.2 Project Organization Chart
Communications on a project can be made more efficient by putting greater emphasis and
following the established hierarchy in the project organization chart. The project
hierarchy clarifies the process of how team members will and should be informed. Also,
the clutter is removed by involving only the appropriate people required in the flow of
communication. This also helps in making the decision-making process more effective
and much faster.
Although it is the current practice, particularly within the engineering and some other
project groups, to prepare a RASCI chart at the project’s inception for the communication
of documents and drawing for various approvals. However, this concept can be extended
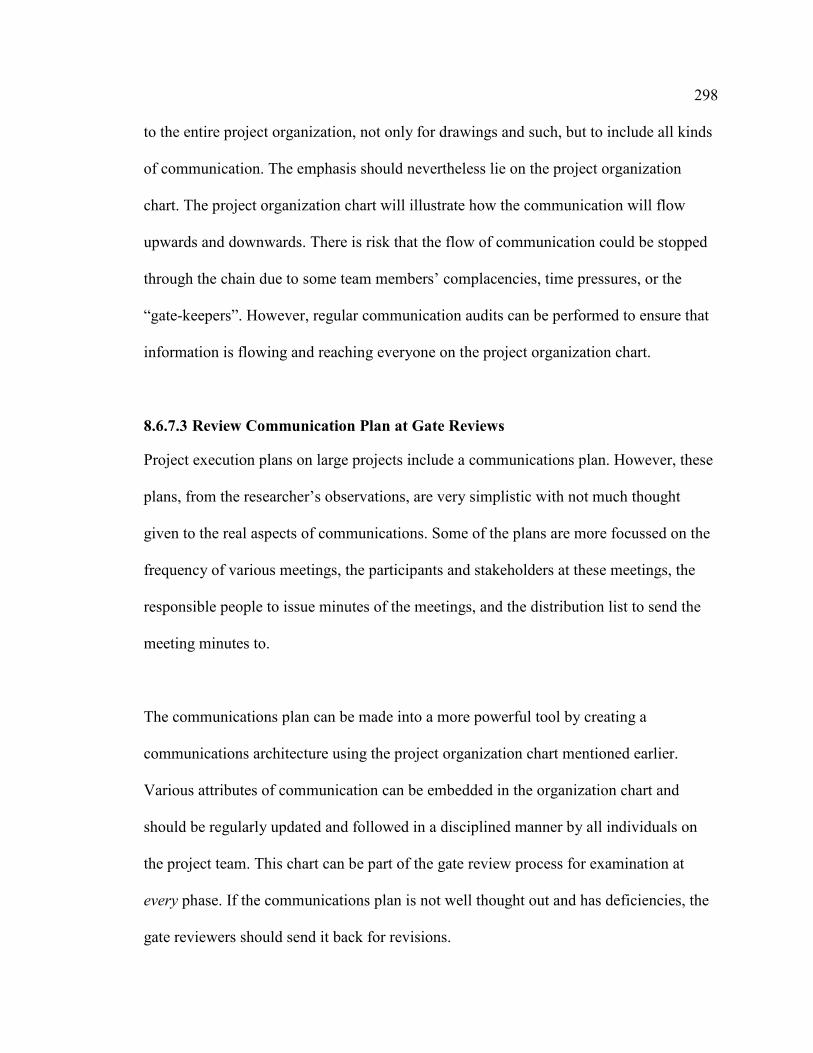
298
to the entire project organization, not only for drawings and such, but to include all kinds
of communication. The emphasis should nevertheless lie on the project organization
chart. The project organization chart will illustrate how the communication will flow
upwards and downwards. There is risk that the flow of communication could be stopped
through the chain due to some team members’ complacencies, time pressures, or the
“gate-keepers”. However, regular communication audits can be performed to ensure that
information is flowing and reaching everyone on the project organization chart.
8.6.7.3 Review Communication Plan at Gate Reviews
Project execution plans on large projects include a communications plan. However, these
plans, from the researcher’s observations, are very simplistic with not much thought
given to the real aspects of communications. Some of the plans are more focussed on the
frequency of various meetings, the participants and stakeholders at these meetings, the
responsible people to issue minutes of the meetings, and the distribution list to send the
meeting minutes to.
The communications plan can be made into a more powerful tool by creating a
communications architecture using the project organization chart mentioned earlier.
Various attributes of communication can be embedded in the organization chart and
should be regularly updated and followed in a disciplined manner by all individuals on
the project team. This chart can be part of the gate review process for examination at
every phase. If the communications plan is not well thought out and has deficiencies, the
gate reviewers should send it back for revisions.
299
8.6.7.4 Communications Interface Coordinator
Communications on projects can be significantly improved by elevating its importance
among project organizations. One of the ways in which this can be done is to have a
permanent position on every project team for a Communications Interface Coordinator.
This person’s role would be to ensure that the project has a detailed communications
plan. Also, this individual would create awareness of the communications process among
all the team members, train the team members in effective communications, and audit the
communications process in the project to ensure that information is flowing and that there
are no gaps or bottlenecks in the process.
In addition, the Communications Interface Coordinator should be present and available at
every project and engineering review meeting in order to understand the team members’
information requirements. Regular reviews with heads of owner and EPC organizations
should be done to identify satisfaction levels in relation to communications on the project
and to resolve the issues that have been elevated to their level. It can be argued that
including such a position on the project could add to the cost of the project; however, the
flip side is that with the current communication problems encountered on projects, not
having such a position can cost the project even more money. The Communications
Interface Coordinator can in fact save the project money and the position will pay for
itself from the benefits gained from having efficient communications on the project.
300
8.6.7.5 Elevate Importance of Communications on Projects
Similar to safety, which is heavily emphasised in EPC and owner organizations,
communications and trust are areas that should be given greater importance. Improving
communications, as we have seen, can have significant advantages in the execution of
projects. Frequent communication sessions regarding all aspects of the projects should be
held. However, these areas cannot improve overnight because of the fluid nature of work
teams, which come together as a team and disband at the end of the project; they then
move on to the next project, or some may leave the company to go elsewhere.
Nonetheless, this is an area that can have a significant impact in terms of cost and
schedule over the long term in the execution of projects.
8.6.7.6 Educating Project Teams on How to Communicate Better
Courses on effective communications on EPC projects need to be developed with local
universities. The curriculum should be based on some of the attributes of communication
described earlier as well as other areas which would make the courses both effective and
practical. These courses should then be taught to the project teams prior to the start of
each project, and they should be mandatory. At EPC organizations, all the staff have to
take some courses such as safety, and leadership, among others. Within those courses,
communications should be included as one of the mandatory ones for all to take.
8.7 Importance of Lessons Learned
The importance of lessons learned cannot be understated; they are important because
when lessons learned are implemented and become part of the work processes and

301
procedures, they make an organization into a a “learning organization”. Such
organizations then become more efficient in the work they do and provide value to their
internal and external customers. However, there are questions that must be addressed. For
example, which department within the overall owner or EPC organization should
undertake this effort and ultimately take ownership of the lessons learned collected on all
projects executed? How quickly can the lessons learned be incorporated in the project
procedures, where they have a better chance of being implemented? Are there advantages
or disadvantages to making changes to the project procedures, or should other means of
capturing and disseminating these lessons be used? These considerations are vital in order
to fully make use of the lesson learned exercise, which is done at the end of every project.
8.7.1 Method of Communicating Lessons Learned
Apart from incorporating the lessons learned into project procedures, one also needs to
examine how they are passed on and communicated to teams working on new projects.
Currently, most lessons learned are written up by a previous project and discussed during
lessons learned sessions prior to new projects getting started. However, from the
researcher’s perspective, communicating using this method is not a powerful means of
conveying the lessons learned. This is because on paper, the emotions of criticality, pain,
urgency, and frustration, which the previous team members experienced and are
expressed during the lessons learned review sessions, are often missing. In other words,
the context of the lesson is missing; hence, the subsequent team reviewing them finds it
difficult to fully appreciate their importance.
302
To provide this context, the researcher recommends videotaping lessons learned sessions,
either in a group setting or individually, so that the new project team can watch them
before embarking on a new project. Using this approach requires some considerations of
privacy and legality, which may need to be reviewed together with having in-house
experts who can record videos. The overall impact and retention of the lessons learned
using this method of communication would significantly be higher than reading them.
8.8 Summary
Projects do not operate in vacuum; they are constantly impacted by external and internal
forces. While such forces can be mitigated partially, execution strategies designed to
shield the project from these impacting forces have to be constantly altered, which create
tremors on the project. A project is similar to a space ship, where the navigation and path
have to be constantly changed in order to avoid the space debris and meteors that can
potentially damage it. The SAGD-ET model provides a solution to this problem with its
focus on three major components of engineering, project management processes, and
communication. The SAGD-ET model provides a balanced and practical method to
successfully and effectively deliver SAGD and other oil & gas projects. The SAGD-ET
model also identifies solutions to areas such as communications among various project
stakeholders as well as knowledge and experience of project management and vendor
data, which are the significant drivers impacting project execution
303
Chapter 9: Conclusions and Recommendations
Chapter Overview
This is the final chapter of the thesis. It provides a discussion on the major conclusions
resulting from the research study which includes ten key areas of focus for successful
execution of SAGD projects. Based on the literature review and the researcher’s
observation of the in situ technologies currently available, it appears that generally,
SAGD is a proven and reliable technology due to its widespread use on many oil sands
projects in Alberta. From the analysis in Chapter Seven and the solutions provided in
Chapter Eight, this chapter also provides recommendations on how future SAGD projects
can be executed from a project management perspective. The researcher makes a strong
case for using replication as a strategy, including its benefits and limitations. Finally, this
chapter highlights the contributions of this research study to the project management
body of knowledge including execution of SAGD and oil & gas projects in particular. In
addition, recommendations for future areas of research are identified based on the
deficiencies in the existing project management literature observed by the researcher.
9.1 Review of Project Objectives
The overarching objective of this research was to identify the major areas of focus in
project management in order to build a model for the successful execution of SAGD
projects. To achieve this, the overarching objective was sub-divided into specific
objectives which included:

304
i. Conducting a two to three round survey using the Delphi Method
ii. Collecting lessons learned from industry professionals who had worked on SAGD
projects in Alberta
iii. Identifying why they are lessons learned and establishing their context
iv. Identifying solution(s) and recommendations for the lessons learned
v. Creating a model based on the critical lessons learned for the successful execution
of SAGD projects
The researcher was successfully able to accomplish all of the above objectives set out at
this research study’s inception. This was achieved by collecting and analyzing 339
lessons learned through surveys using the Delphi Method with various experts and
specialists who have worked on SAGD projects in the EPC industry. Based on the
analysis, the researcher created a project execution model called the SAGD Execution
Triangle or SAGD-ET.
9.2 Conclusions and Recommendations
From the research objectives, literature review, Round 1and 2 Delphi surveys, the top
thirty lessons learned identified in Chapter Six, in-depth analysis of findings, discussions,
and the SAGD-ET model, the researcher makes the following conclusions and
recommendations to successfully execute SAGD projects:
9.2.1 Reservoir Uncertainties Impact Design of Surface Facilities
Despite collecting enough reservoir data, there can be significant unknowns in the
properties of the oil sands reservoir, which have the potential to create uncertainty when
305
designing and building a SAGD plant. Uncertainties which can have either a positive or
negative effect, impacts the engineering and design of the surface facilities. This impact
can potentially lead to the re-design and reconfiguration of some of the plant’s process
conditions. Redesign consequently impacts the other engineering disciplines including
mechanical, piping, civil/structural, instrument & control systems, and electrical. This is
the major distinguishing aspect of engineering and constructing SAGD plants from other
oil & gas facilities where the design parameters are fixed to a large extent upon proper
scope definition. Generally speaking, except for the uncertainty created by reservoir
conditions, the engineering and design involved in building SAGD plants is not
dissimilar from building other oil & gas facilities such as sulphur, hydrogen, and coking
plants as well as refineries and the like. The results of this research, apart from those
relating to the reservoir conditions, are therefore equally applicable to the project
management of other oil & gas facilities.
Recommendation
From a project management perspective, improvements to the reservoir predictability can
help minimize changes to the surface facilities. This in turn can make the design more
definitive during the FEED phase, consequently lowering the amount of iterative redesign
and rework. The ability to have a definitive design can have a positive and cascading
impact on all the areas including procurement and construction.
Fundamentally, therefore, the oil sands developer should in addition to obtaining the core
samples build a pilot plant and ensure that good quality of data is available from the
306
reservoir. The design and engineering phase of the project, specifically the DBM/EDS
phase, should not be initiated without having analyzed this data first and obtaining a good
basis and understanding. Scenario planning should be carried out so as to consider the
various alternatives available in order to understand the risks; this in turn would assist in
determining the optimum design conditions. However, such actions have to be taken
quickly and decisively so that the design and engineering of the SAGD plant can start
according to the established schedule. Otherwise, there is the potential to delaying the
start of operations resulting in loss of cash flow and profit.
Although different reservoirs have different properties, for the long term, as more
information about these qualities is gathered by individual oil sands’ developers and the
regulatory bodies such as the ERCB, more learnings can publicly be available from
which improved models of reservoir predictability and production can be developed.
9.2.2 Engineering - SAGD Technology is Evolving
SAGD is a fairly young technology; it was invented by Dr Roger Butler, who introduced
it in 1978 (Deutsch & McLennan, 2005). It is only over the last decade or so and with the
rise in oil prices that this technology has been heavily used for commercial applications.
From an environmental perspective, with the attractiveness of this proven in situ
technology and with the recent negative publicity received for mining the oil sands, more
oil companies in Alberta are considering the use of SAGD where feasible. However, this
technology is changing, with new improvements being added in order to enhance
production, reduce the steam required (which therefore reduces the power and water
307
usage), and lower costs of production. The use of electrical submersible pumps (ESP) is
one such recent addition which has helped increase the flow of bitumen volume to the
surface, resulting in a reduction in steam and pressure (F. Gaviria, et al., 2007). Such
applications reduce the SOR, and consequently, lower production costs.
Recommendation
Oil sands developers need to keep up with development of in situ technology, as it can
possibly help lower the productions costs. However, while technology will continue to
evolve, decisive action has to be taken by the project owner on the combination of
technologies to use for the SAGD facility. Otherwise, there can be a tendency to over
evaluate the options, resulting in “analysis paralysis” leading to higher opportunity costs.
9.2.3 Spend More Time During Front-end Planning
Based on the survey results, it is highly beneficial to spend more time in the front-end of
the project, rather than fixing errors later in the field. This approach will cost the project
less money and will increase the likelihood of completing the project on schedule. On a
typical SAGD project, the cost of engineering can be between 8% and 15% of the total
project’s costs. In relative terms, engineering is much cheaper than construction, which
can be around 40% to 50% of the project’s total costs. Anecdotal evidence suggests that it
costs five times more to fix an error in the field than in the engineering Home-office.
308
Recommendation
This lesson of not spending enough time in the front-end of the project has been learnt by
owners and contractors on many different projects; however, only a disciplined approach
to project execution can help avoid such situations in the future. The wise saying “plan
the work and work the plan” still rings true in project work. Therefore, it is prudent to
spend more time during the engineering phase; ensure that the scope is well defined and
frozen after the EDS phase and focus on the design aspects, especially during the front-
end of the project. In addition, using the SAGD-ET model in project execution as
described in Chapter Eight, can offer substantial efficiencies during the engineering
phases. The impact of using SAGD-ET model can also create a positive spill-over effect
in the procurement and construction phases.
9.2.4 Regulatory/Environmental
The various regulatory and environmental legislation for executing oil & gas and SAGD
projects in Alberta keep on changing and are getting tougher.
Recommendation
Owners and EPC companies need to stay abreast of the changes in the regulations; they
need to understand the interpretation and the implication of the various regulations on
their projects so as to ensure that they are not impacted or blindsided by them.
Recognizing the impacts of these ever-changing regulations on the industry, the Province
of Alberta has setup a commission to identify how regulatory and environmental
309
processes can be streamlined in order to assist them in reducing the delays in the project
approval process and other areas.
9.2.5 Project Execution
According to the theory of forces, project execution strategies are subject to change due
to the political, economic, social, and technological forces that impact projects. In order
to stay in business and generate value for their shareholders, companies, particularly
publicly traded ones, have to constantly change their project execution strategies, which
causes tremors to the projects and destabilizing them in the short term.
Recommendation
While it may be prudent and acceptable to change the project execution strategy, extreme
strategies such as fast-tracking should be avoided unless the organization has prior
experience in implementing it. Such strategies results in undertaking unnecessary risks,
which are often detrimental to the project and the executing team. A much more efficient
and effective approach would be to use the SAGD-ET model, which can just be as
expeditious, as long as the building blocks of engineering, PM processes, and
communications are followed.
9.2.6 No Engineering Related Issues
From all the surveys, interviews and data collected, none of the participants identified
any issues or problems specific to the design or engineering of the SAGD plant or facility
that impact successful project execution. This is because in the EPC industry, over the

310
years, substantial engineering experience has been accumulated in the designing of oil &
gas facilities. In addition, when looking at the equipment and materials required to design
and build a SAGD facility, it appears at a high level to be a simple process. What makes
building a SAGD plant a complex process are the unknown properties of the oil sands
reservoir, which some people refer as “the black box”. For example, the amount of steam
in combination with the appropriate amount of pressure and temperature injected into the
reservoir to get the oil to the surface requires constant manipulation; this can be a
destabilizing factor in the oil production. Apart from this factor, the survey participants
seemed comfortable in producing the engineering, procurement, and construction
deliverables of SAGD projects.
Recommendation
In order to make project execution more effective, it is critical to build on the experience
gained and preserve the intellectual capital by retaining the teams that have worked
together on previous SAGD projects. In such teams, especially where the members have
worked cooperatively and understand each other’s work habits, communication styles,
timeliness, etc. there is much to be gained rather than having execution teams put
together from scratch. Such teams require additional time to gel and come together,
which can be inefficient. Moreover, teams that have worked together for longer periods
potentially have better coordination in the engineering and other related aspects of the
project. These teams with longevity also have the experience and knowledge of a certain
owner’s specifications, procedures, and standards, therefore bringing efficiencies to the
project in the long-run by executing the project deliverables in a shorter time period.
311
9.2.7 Vendor Data
In addition to reservoir data, vendor data is another destabilizing force on SAGD
projects. Every oil & gas project gets impacted by late vendor data. The vendors depend
on their sub-vendors to get the sub-components of the equipment; these sub-vendors
generally work with limited human and financial resources. Therefore, problems at a sub-
vendor’s shop can impact the vendor, and consequently, the entire project. On the other
hand, changes in the engineering and design, which are sometimes caused by changes in
reservoir data, impact the vendors and sub-vendors in a similar fashion because vendor
data has to be revised. Such delays and revisions of vendor data can be frustrating for
both sides, the owner/EPC and the vendor/sub-vendors.
Recommendation
Having all the parties involved in the procurement process, including the owners, EPC,
vendors, and sub-vendors, present at bid clarification meetings for purchases of
equipment and materials can ensure efficient resolution of many of these issues earlier in
the project life cycle.
9.2.8 Meeting Owner’s Quality Standards
Meeting the owner’s quality standards is very critical to project success. The standards,
which are very precise in nature, are often based on the SAGD technology selected and
the organization’s safety standards including those of the technical bodies and regulatory
agencies. This is especially important where fabrication of equipment and bulk material
is done outside North America where there can be issues due to language and culture.

312
Recommendation
For essential equipment, it is important that the owner’s staff should be stationed at the
fabricator’s shop. By taking this step, the owner can get information on non-conformance
of quality standards much quicker, and which can provide enough time to react and
correct the situation. In addition, third party inspectors should be made much more
accountable when signing off and taking possession on deliveries of non-critical
equipment.
9.2.9 Procurement
While it is common knowledge to order long lead equipment and material early, the
uncertainty in the reservoir conditions can impact in finalizing the equipment and tank
sizes and quantities of the certain specialty bulk material.
Recommendation
Some of the pre-cursor activities to ordering equipment and material should first be
finalized so as to provide enough time to place the orders with the respective vendors.
This means that the scope has to be well defined and frozen. The modularization of the
SAGD plant, if contemplated, should be defined early during the planning phase (DBM)
in order to determine the approximate quantities of steel that will be required. At the
same time, it is imperative to look for shop space early in order to meet the module
program’s fabrication and assembly schedule

313
9.2.10 Construction - Modularization
Modularization is now recognized and accepted as an effective construction strategy,
especially for building oil & gas projects in Northern Alberta. This is because the areas
where most of the Canadian oil sands projects are located, such as Fort McMurray and
Cold Lake, are quite remote, which create issues of labour scarcity. Exorbitant amounts
of money have to be spent to move, house, and feed the labour force in order to build the
SAGD plants. Building modules in areas with abundant labour and transporting them up
north can reduce the labour costs significantly; while giving the advantage of
constructing the modules in a controlled shop environment where the owners quality
standards can be met and possibly enhanced.
Recommendation
Despite the significant experience built among Alberta fabricators, learnings on
modularization from other countries, such as Japan and South Korea, who have been
using this concept for a longer time, should be explored and adopted. This can help the
design and fabrication groups in improving the efficiency in coordinating their efforts and
meeting the project schedules. The engineering disciplines in project teams need to be
provided with more practical knowledge and education on modularization, particularly in
areas of contracts and scheduling in order to undertake a coordinated effort between
fabricators, owners, and EPC companies. Scheduling is also important in order to
maximize construction during the short weather windows available in Northern Alberta.
314
9.2.11 Knowledge and Experience of Project Management
Knowledge and experience of project management is essential in leading projects. It is
the highest ranking factor that significantly impacts the successful execution of SAGD
projects. However, it is the application of management knowledge and how the
experience of management is used that makes a difference in the execution. Among some
owner and EPC organizations, there is confusion between management and leadership,
which are not a substitute for each other.
Recommendation
Educating project teams on management processes such as chain of command, lines of
responsibility and authority, the importance of following the organization chart, effective
decision making, and building trust among others can enhance and improve the
understanding of project management. This understanding of project management
nuances can then lead to better and disciplined project execution.
9.2.12 Schedule
There is often a misalignment of achievable schedule time frames between the project
owners and the project execution team. The owner’s time frames are often based on the
project economics and the cash flow projections; while the executing team’s time frames
are based on the extent of the scope, how well it is defined and whether it is possible to
complete the deliverables within the time frames available. While both parties are
justified in their positions, a middle ground needs to be arrived at in order to meet
everyone’s needs.

315
Recommendation
During the feasibility stage (FEL 1), the owner’s team should involve the EPC
contractors in formulating the schedule for the project, rather than preparing it in
isolation. This will enable the owner’s team to understand the opportunities and
constraints from the executing team’s perspective. At the same time, the executing team
can be provided with the owner’s perspective which can result in a win-win solution
amicable to both parties.
9.2.13 Communication
Communication is a major issue on projects. It is a simple process but the mechanics of
communication are misunderstood. George Bernard Shaw is known to have said that
“The single biggest problem in communication is the illusion that it has taken place
(Thinkexist.com, 2010)”. This assumption among the parties that communication has
happened is the root of the problem. In addition, with the numerous attributes of
communication, it becomes even more difficult to efficiently communicate with one
another within in a project organization. This difficulty stems from the fact that there are
numerous and various players who have a range of objectives to fulfill from the
communications process. To make it more complex, these individuals work within a
multicultural and multigenerational environment and are spread out in various locations
locally and internationally. Furthermore, all the respective team members are trying to
achieve the same project objectives by accomplishing them within a certain budget and
timeframe. Thus, it is easy to see how this diversity of attributes can create a huge
complexity in the communication process on projects.

316
Recommendation
With the available knowledge and current communication practices on SAGD projects,
this issue may be difficult to resolve in the short term, especially on large, fast-paced
projects, which have increasingly shorter schedule durations. However, the attributes of
communication developed in this research can be used to develop a practical
communications plan. The plan should be audited for its effectiveness and revised for
each phase of the project depending on the project’s complexity, the number of
stakeholders and the duration of the project. In addition, a Communications Interface
Coordinator should be appointed to the project whose role is to facilitate the
communications process and remove any perceived obstacles to its smooth functioning.
9.2.14 Lessons Learned
Lessons are not being learned on projects to the degree that they should be. In the SAGD
survey, 76% of the participants said that the lessons learned will be repeated on other
projects; in other words, there is a chance that the mistakes made in previous projects will
be repeated in future projects. There are many reasons for this, but the fundamental issue
is that when lessons learned are passed on to the next team, the context of the lesson is
often missing. Moreover, it is not always easy to appreciate a lesson learned when it is in
a written form because it lacks the emotion of pain, urgency, and forewarning. This
makes it difficult for the next team to understand the importance of the lessons learned
and proves challenging for them to internalize the issues.

317
In addition, the researcher thinks that lessons learned on projects as in the case of the
some of the lessons learned in the SAGD survey are project procedures that were not
followed in the first place and then end up as a lesson learned; a real lesson learned is
doing something different and learning from it. It should be mentioned that from this
study’s perspective, having some procedure related lessons learned being included in the
survey did not create any impact on the research and its results. The objective in this
study of identifying the lessons learned was, in essence, to find out the issues and critical
areas for effectively executing a SAGD project which was accomplished successfully.
Recommendation
Lessons learned are an invaluable source of knowledge and experience to an
organization, be it the owner or the EPC contractor. They should be well recorded and
maintained in databases where the staff can have access to them for use on future
projects. In order not to lose the context, new technologies can be used to capture the
lessons learned rather than recording them in the written form only. For example, the
lessons learned can be video recorded in group sessions or individual settings; the videos
based on different topics can then be made available for others to view as they start new
projects. This method also has the advantage of including digital information such as 3D-
Model cuts, spreadsheets, drawings, photographs etc. in the video. The video recorded
lessons learned files can as well be embedded into the written electronic files in order to
have the benefit of both the written and audio-visual mediums.
318
9.2.15 Perceptions of Project Managers and Engineers
While there is medium to high alignment on most factors that lead to the successful
execution of SAGD projects, there are a few but critical areas where there is low
alignment between the two groups. These areas include: the need for well defined
reservoir data for engineering SAGD facility, having the knowledge/experience of
management processes to execute large projects, tying payments to vendors based on
timely submittal of drawings/data, the need for an early environmental assessment.
Recommendation
Project managers are generally focussed on the broader issues of the project and look at
the bigger picture. The engineering group, on the other hand, is involved in the day-to-
day details of the design and engineering of the project. This difference in responsibilities
sometimes causes misalignment between the two groups’ vision of the project. Achieving
alignment between the project management and engineering groups by having frequent
daily meetings on issues of the day can enhance the understanding of the needs and
perspectives of each other’s areas, which can lead to enhanced communication and
improved execution of SAGD projects.
9.2.16 The Delphi is an Effective Survey Method
For this research study, where there were many unknown issues, the Delphi Method
proved to be a suitable and appropriate survey tool. The Delphi Method provided the
survey participants with the ability to voice their opinions of the lessons learned in Round
1, reflect on their and other peoples’ opinions in Round 2, and rate them in a discreet,
319
unbiased and democratic manner. Consensus can be difficult to build especially, when
there are highly experienced experts and specialists from different areas such as
engineering, procurement, construction, project management, and project support.
Recommendation
The Delphi Method provides the ability to get diverse qualitative points of view,
synthesize them, and get agreement in a simple and unbiased manner. As long as the
survey participants are knowledgeable about the topic being surveyed, the Delphi Method
can be a very democratic process in reaching a consensus. Although it can take longer to
complete the surveys and finalize the results in the Delphi Method, the experience for
both the participants and the researcher can be very engaging and exciting. The Delphi
Method should increasingly be used on investigations relating to project management
especially where the issues are latent and unknown.
9.2.17 Plant Replication
While the conclusions and recommendations discussed in the previous sections are
different in their functionality, from a project execution point of view, they are all inter-
connected. Implemented together, the project execution can certainly be made more
effective. A more holistic approach to improve and achieve success in the execution of
SAGD projects requires changes that can impact the entire project execution in tandem -
from the project’s feasibility to engineering, procurement, construction, and
commissioning. In order to create such a comprehensive impact and one which can
provide a sustainable impact, the researcher recommends replication of SAGD plants as a
320
long term strategy. Replication in this context is defined as building multiple SAGD
plants in generally the same reservoir area over a period of time with the same amount of
bitumen production capacity. In other words, if the reservoir capacity has a potential
production of 160,000 barrels per day, the SAGD plant should be built in four phases
with each having a capacity of producing 40,000 barrel per day.
9.3 Contributions of the Research
Knowledge of project management has been around for the last 50 years or so, thus, it
can be considered a young area of specialization. Within that body of knowledge, the
amount of information available on the project management of oil & gas projects is
considerably less. This research has added to the body of knowledge valuable models as
well as several theories based on primary research, in terms of theoretical and practical
contribution to industry practices and to the project management processes. The
contributions can be applied to the following areas:
Theoretical Contributions of the Research
9.3.1 Development of the SAGD-ET Model
The major contribution of this research to the project management body of knowledge
and to the academic theories is the addition of a new model to execute oil & gas projects,
with emphasis on SAGD projects in particular. The SAGD-ET model, which has
practical applications, focuses on three major areas, namely engineering, project
management processes, and communication. These areas, when used in combination with
321
its individual components, provide a powerful tool to successfully execute SAGD
projects. With minor modifications, this model can also be applied to other industries.
9.3.2 Theory of Forces Impacting Project Execution
A major theory this research identified is that oil & gas projects are subject to external
and internal forces, which can be extreme at times. During project execution, the
engineering, procurement, and construction of projects come under considerable external
pressures, which include, but are not limited to, political, economical, social, and
technological pressures. These forces are compounded by internal forces from the
owner’s corporation, resulting in the project organization having to change course and
strategies constantly in order to mitigate these issues. Since projects cannot be executed
in a vacuum, these forces have to be taken into consideration during project execution.
Contribution of the Research to Industry Practices
9.3.3 Added Pioneering Knowledge to Project Management of SAGD Projects
In situ oil extraction from the oil sands and the SAGD technology within it are new and
growing fields whose importance will significantly increase in the decades to come. This,
consequently, will increase the number of SAGD projects within Alberta. This research
provides pioneering project management knowledge at a basic level to current and future
project managers, engineers, and support staff working on SAGD projects.
322
9.3.4 Identification and Ranking of Factors for Successful Execution
This research identified and ranking of over 90 factors that impact the successful
execution of oil & gas and particularly SAGD projects; such data has not been previously
available. While this data was collected for SAGD projects, due to similarities in
execution, it can be, to a great extent, applied to other oil & gas projects as well. The
rankings of the factors provide good indicators of areas where improvement in project
execution can be achieved. The rankings can also be used as a checklist to diagnose
potential issues impacting a project.
9.3.5 Commentary to Project Procedures
Every owner and EPC company has procedures and work processes. The processes and
procedures are instructions on what to do and how to execute certain aspects of the
project. However, from a project development perspective, they do not provide any
commentary regarding how to make the processes and procedures more effective.
Moreover, they do not provide the rationale on what and why certain things can go
wrong. This research provides a commentary on the potential bottlenecks that can arise
during project execution and how to manage them.
9.3.6 Lessons Learned
Lesson learned as a topic in oil & gas project management literature has been a vague
concept. While it has been overly emphasized as an activity in the execution of projects,
the collected lessons learned are grossly underused. This research has surveyed and
323
identified the causes of underuse and identified solutions to ensure that lessons learned
are well utilized and better understood.
9.3.7 Development of a Comprehensive SAGD Project Schedule
A comprehensive Level 1 schedule for developing a SAGD project, from building the
pilot plant, central processing plant, and well pads & gathering lines to getting the first oil
from the reservoirs, was developed. This schedule can be useful in identifying the major
activities required in developing a SAGD plant; it also illustrates the timeframe required
in planning, engineering, procuring, and constructing the project. The schedule provides a
complete view of undertaking a SAGD project.
Contribution of Research to Project Management Processes
9.3.8 Communication Attributes on EPC Projects
Communication is a major issue on most projects; however, during periods of
communication breakdown, it has been difficult to diagnose the bottlenecks in order to
prepare solutions to mitigate them. This research has added to the body of knowledge
attributes of project communication and its various sub-components; these are the factors
which make effective communications on projects extremely challenging.
9.3.9 Impact of Churn (indecision) on Projects
Another theory added to the body of literature is churn or indecision. Churn which, the
project team is not conscious of during execution, eats away into the project schedule,
resulting in less time available to complete the project than originally planned for.
324
9.3.10 Timely Receipt of Vendor Data
This research identified delays in issuing vendor data as one of the major factors that
impact the success of SAGD and oil & gas projects. Knowledge on the causes of this
major but hidden factor has not been well documented in the literature. This research has
added valuable theories on the causes of the delays and practical solutions for mitigation.
9.3.11 Knowledge and Experience of Management Processes
This area is of great importance for the successful execution of projects. This research
has identified ways on how knowledge and experience of management processes can be
enhanced in project organizations. In addition, the use of a project organization chart as a
reference point for authority, responsibility, and decision making are highlighted.
9.3.12 Increasing Trust in Organizational Setting
A theory for increasing trust in organizations was developed. Higher levels of trust can
increase the amount of communication. The model developed identifies the steps required
to increase trust, which ultimately leads to improved communication on projects.
9.3.13 Consolidation of Literature of Oil & Gas Project Management
The number of articles and research currently available dealing with oil & gas project
management is very limited and fragmented. This research was able to bring all the
important topic areas on engineering, procurement, and construction that impact project
execution into a single comprehensive document. This document can, therefore, be a
good reference for improving project execution.
325
9.4 Limitations of the Research
The limitations in undertaking this research include the following:
• The geographical locations of most of the SAGD projects included in this
research are in Northern Alberta.
• Stakeholders outside the immediate periphery of the project organization, such as
regulatory and environmental agencies, vendors, and sub-vendors, are not
included in the survey.
• While the results and conclusions of this research are applicable to a wide range
of SAGD and oil & gas projects, the lessons learned collected in this research are
not exhaustive. Additional projects in the survey could possibly have added other
lessons learned not already identified in this research.
• Due to the long duration in executing a SAGD project, testing of the SAGD-ET
model was not possible within timelines established for this research
9.5 Suggested Areas for Future Research
As mentioned earlier, for effective project execution, it is the management of the softer
areas within engineering, procurement, and construction that make the projects
successful. From this research, the areas such as contracts, communication, and decision
making among others can enhance the success of projects. However, little research has
been done in these areas, especially in the oil & gas sector. The sections below provide a
glimpse of these areas of further research.

326
9.5.1 Lump-sum Turn Key Contracts in Alberta’s Oil & Gas Industry
Due to the collapse in oil prices and with the ensuing recession (2008-2010), many
projects in Alberta’s oil & gas industry abruptly came to a standstill. The costs of the new
projects, most of them in the oil sands sector, were not sustainable with the low oil prices.
In a recent analysis, SAGD projects would require, at a 12% discount rate, cost
reductions of 25% in order to achieve a breakeven point of $55 per barrel (Dunn, 2009).
One of the ways in which Albertan oil & gas companies are trying to meet this breakeven
point is by changing their construction contracting strategy from a cost-reimbursable to
one of lump-sum contracts. However, upon reviewing the literature, this researcher
realized that not much information in this area is available in the public domain. Research
into this area would be very useful, particularly within the Alberta context.
9.5.2 Enhancing Communications on Oil & Gas Projects
In many surveys and writings, communication has been identified as a major problem. As
illustrated in Figure 8.11. given the many attributes involved in the communication
process, it becomes difficult to resolve this issues, especially when projects are of a short
term nature. Nonetheless, research in this area related to oil & gas projects would
certainly be beneficial in enhancing project execution. The attributes of communication
provided in this research can be a good starting point for additional research in this area.
9.5.3 Decision Making on Oil & Gas Projects
Decision making, during the front-end planning, which often results in churn, is another
area where research is required. Priemus et. al (2008) have done some useful work in the

327
area of decision making on mega projects; however, it centers on large infrastructure
projects. Research on decision making on projects in the oil & gas industry would be
valuable.
9.5.4 Analysis of Modularization Compared to Stick-Built Construction
A study with an Alberta perspective on the benefits of modularization needs to be
undertaken, given that there is very little information currently available on this topic.
The results of the study would help in leveraging the benefits of modularization that have
already been gained by the various oil & gas projects. Moreover, lessons learned from
other industries in other countries, such as Japan, Korea etc. who have used
modularization for a longer period of time than in Alberta need to be provided to the
owners of Alberta’s oil & gas projects which would help improve current practices.
9.5.5 Development of an Effective Model for Timely Receipt of Vendor Data
Vendor data is one of the dominant themes in this research. It significantly impacts
execution of oil & gas projects, and yet, not much literature has been written on this
topic. While the researcher has endeavoured in this thesis to highlight as much
information as possible on this topic area, an effective model for processing vendor data
is required. The model should include mapping out the vendor data process, various
stakeholders involved, bottlenecks, schedules, issues from the owner/EPC, and vendors’
perspectives and solutions so as to make this iterative process more effective.
328
9.5.6 Replication of Oil & Gas Facilities
Most oil & gas facilities are often built to specification, meaning that the design is
customized and not standardized. Using a standardized design has benefits as well as
drawbacks. While the discussion in this chapter identifies the potential of achieving cost
savings in certain areas, a detailed study is required to validate them.
9.6 Summary
This chapter provided the conclusions and recommendations of this research study. The
study concludes that the oil sands reservoir conditions impact the design of the SAGD
surface facilities. To mitigate this factor, more reservoir data should be acquired and
more time should be spent during the front-end of the engineering design phase.
Communications, vendor data, and regulatory approvals are significant areas that can
impact the successful execution of a SAGD project. Modularization is an effective
strategy to reduce manpower requirements at the construction site.
While there were no engineering issues that impacted successful project management, in
order to effectively execute oil & gas projects and SAGD in particular, considerable
thought should be given to replication as a strategy. The replication strategy, resulting in
a standardized design, can help effectively mitigate the many issues encountered in
building SAGD projects, such as incomplete scope definition, fully developed P&IDs,
delays in getting vendor data, appropriate technology, quality management, regulatory
issues, and so on. Replication minimizes these issues because of standardizing design,
from which the project can benefit substantially through the costs savings achieved.
329
However, in order to take this path of replication, oil sands developers using SAGD
technology should have a long term plan, given that this would enable them to build the
SAGD plants in a more sequential and disciplined manner. Although there are limitations
to replication due to changes in technology, plant soil conditions, vendors, regulations,
the economy, and the like, sticking to the replication strategy with a long term goal can
bring benefits to the developer in the long run.
This thesis has contributed to the body of knowledge relating to oil & gas project
management and particularly SAGD in many ways including the development of the
SAGD-ET model, the theory of external and internal forces impacting projects, ranking
of factors to achieve successful execution of projects, identifying the attributes of
communication on EPC projects, the theory of churn that eats away at the project
schedule, the development of a comprehensive schedule to develop a SAGD project, and
finally, consolidating the literature on oil & gas project management.
During this project, the researcher found insufficient information on the following areas
on which further research would add to the body of knowledge: lump-sum turnkey
contracts in Alberta’s oil & gas industry, communications on oil & gas projects, decision
making on oil & gas projects, analysis of modularization versus stick-built construction
in Alberta, and building an effective model for timely receipt of vendor data.
9.7 Epilogue
In conclusion, the rationale of this research study and its ultimate result can be
summarized with a fitting quote from Creswell (2007b):

330
The rationale (of qualitative research) is not the discovery of new elements, as in
natural scientific study, but rather the heightening of awareness of experience
which has been forgotten and overlooked. By heightening awareness and creating
dialogue, it is hoped research can lead to better understanding of the way things
appear to someone else and through that insight lead to improvements in practice
(Barritt, 1986, p. 20).
The researcher hopes that the voices of the participants of this study will be heard and
that it will create a dialogue among the various specialists in the EPC industry on how to
keep on learning and retain this learning in order to make the project management of
future oil & gas projects and SAGD in particular more effective.

331

332
References
Adler, M., & Ziglio, E. (1996). Gazing into the Oracle: The Delphi Method and its
Application to Social Policy and Public Health. London: Jessica Kingsley Publishers.
AEUB. (2007). Alberta's reserves 2006 and supply/demand outlook 2007 - 2016: Alberta Energy and Utilities Board.
Aga Khan. (1985). Speech at the inauguration of the Aga Khan University. Karachi, Pakistan.
Barlow, J. (2000). Innovation and learning in complex offshore construction projects. Research Policy(29), 973-989.
Barritt, L. (1986). Human sciences and the human image. Phenomenology and Pedagogy,
4(3), 14-22. Belout, A. (1998). Effects of human resource management on project effectiveness and
success: Toward a new conceptual framework. International Journal of Project Management(16), 21-26.
Berends, T. (2006). Cooperative contracting on major engineering and construction projects. Engineering Economist, 51(1), 35-51.
Berends, T. C., & Dhillon, J. S. (2004). An analysis of contract cost phasing on engineering and construction projects. Engineering Economist, 49(4), 327-337.
Berends, T. C., & Dhillon, J. S. (2004). An analysis of contract cost phasing on engineering and construction projects. Engineering Economist, 49(4), 327-337.
Bickman, L., D.J., R., & Hedrick, T. E. (1998). Applied research design. In L. Thousand Oaks, CA: Sage.
Birkland, T. A. (2009). Disasters, lessons learned, and fantasy documents. Journal of Contingencies and Crises Management, 17(3), 146-156.
Bitz, I. e. a. (1991). Basic project management. American Management Association. Blankinship, S. (2008). Modular Construction Gains Ground. Power Engineering,
112(3), 54-62. Bogdan, R. C., & Taylor, S. K. (1975). Introduction to qualitative research methods. New
York: John Wiley. Bogus, S. M., Molenaar, K. R., & Diekmann, J. E. (2005). Concurrent engineering
approach to reducing design delivery time. Journal of Construction Engineering
and Management, 131(11), 1179-1186. Brkic, D. (2007). Optimising risk by adopting new 'convertible' contracts. Paper
presented at the Rice Global E&C Forum. Brkic, D., & Romani, D. (2009). Unconventional contractual schemes for fast-track
projects in the oil & gas industry. Paper presented at the Protech-2009. Broder, J. M. (2010). Obama oil drilling plan draws critics. Retrieved April 10, 2010,
from http://www.nytimes.com/2010/04/01/science/earth/01energy.html Buckingham, P. (1994). International process plant contracts for use on other
performance-based projects. Construction Law and Management, 120(1), 192-210.

333
Butler, R. M. (1994). Steam-assisted Gravity Drainage: Concept, Development, Performance and Future. The Journal of Canadian Petroleum Technology, 33(2), 44-50.
Butler, R. M. (2001, May 14). Application of SAGD, related processes growing in Canada. Oil & Gas Journal, 74-78.
Byrne, J., Elgohary, M., Canas, B., Shemavonian, D., Ricciuti, R., & Hiebert, L. (2008). ACR - 1000® constructability and modularization. Paper presented at the 16th International Conference on Nuclear Engineering, ICONE16 2008, May 11, 2008 - May 15, 2008, Orlando, FL, United states.
Camps, J. A. (1996). Simple steps help minimize costs, risks in project contracts. Oil and
Gas Journal, 94(4), 32-35. CAPP. (2009a). Canada's oil sands (pp. 2). Calgary, Alberta: Canadian Association of
Petroleum Producers (CAPP). CAPP. (2009b). Canada's oil, natural gas and oil sands - Overview and outlook. CAPP. (2010, June 09). 2010-2025 Canadian crude oil forecast and market outlook.
Retrieved September 04, 2010 Carrillo, P. (2005). Lessons learned practices in the engineering, procurement and
constrcution sector. Engineering, Construction and Architectural Management,
12(3), 236-250. Certo, S. C. (1980). Principles of modern management functions and systems. Dubuque,
Iowa: Wm. C. Brown Company. Chaffin, W., & Telley, W. (1980). Individual Stability in Delphi Studies. Technological
Forecasting and Social Change(16), 67-73. CII. (2002). Implementing the prefabrication, Modularization, and offsite fabrication
decision framework: Guide and tool. Austin, TX: University of Texas at Austin. CII. (2004). Preview of Constructability Implementation. Austin, TX: The University of
Texas at Austin. Clark, F. D., & Lorenzoni, A. B. (1997). Applied Cost Engineering. New York, NY:
Marcel Dekker, Inc. Cleland, D. I., & Gareis, R. (2006). Global project management handbook: McGraw Hill
Professional Collyerand, D., & Reheis-Boyd, C. (2009). N. American Strategy should link energy,
climate concerns. Retrieved July 2, 2010, from http://www.ogj.com/ogj/en-us/article-tools-template.articles.oil-gas-jourmanl.volume-107.Issue_26.General_Interest.Special_Report_N_American_strategy_should_link_energy_climate_concersns.html
Commission, E. (2006). Delphi Survey. Retrieved December 22, 2009, from http://forlearn.jrc.ec.europa.eu/guide/2_scoping/meth_delphi.htm
Condon, E. J. (2006). The project game: Strategic estimating on major projects. University of Calgary, Calgary, Alberta.
Corner, W. (2010). Vendor data. In A. Halari (Ed.) (Personal Communication ed.). Calgary, Alberta.
Creswell, J. W. (2007a). Qualitative Inquiry and Research Design: Choosing Among
Five Approaches. Thousand Oaks, CA: Sage Publications.
334
Creswell, J. W. (2007b). Qualitattive inquiry & research design: Choosing among five
approaches (2nd ed.). Thousand Oaks, CA: Sage Publications. Cuhls, K., Breiner, S., & Grupp, H. (1995). Delphi method. Germany: Fraunhofer
Institute for Systems and Innovation Research. Cunha, J. C. (2007). Recent developments in risk analysis - Applications for petroleum
engineering. Paper presented at the 2007 SPE Annual Technical Conference and Exhibition.
Dalkey, N. C. (1969). The Delphi Method: An Experimental Study of Group Opinion (Vol. RM-5888-PR). Santa Monica, CA: The Rand Corporation, New York.
Dalkey, N. C., & Helmer, O. (1963). An Experimental Application of the Delphi Method to the Use of Experts. Management Science, 9(3), 458-467.
Day, J., & Bobeva, M. (2005). A Generic Toolkit for the Successful Management of Delphi Studies. The Electronic Journal of Business Reasearch Methodology, 3(2), 103-116.
Delbeq, A., Van de Ven, A., & Gustafson, D. H. (1975). Group Techniques for Program Planning: A Guide to Nominal Group and Delphi Processes. Glenview, USA: Scott Foresman and Company.
Deutsch, C. V., & McLennan, J. A. (2005). Guide to SAGD (Steam Assisted Gravity Drainage) reservoir characterization using geostatistics Centre for Computational
Geostatistics (CCG) Guidebook Series (Vol. 3, pp. 120). Edmonton, Alberta: Centre for Computational Geostatistics.
Dey, P. K. (1997). Petroleum pipeline construction planning: A conceptual framework. Paper presented at the Second International Petroleum Conference & Exhibition.
Dey, P. K., Tabucanon, M. T., & Ogunlana, S. O. (1996). Petroleum pipeline construction planning: a conceptual framework. International Journal of Project Management, 14(4), 231-240.
Dixon, A. J., Pound, L. D., & Korgan, R. (1987). A pipeline information system. Paper presented at the NCGA Mapping and Geographic Systems Conference.
Duhon, H. J., & Elias, J. S. (2008). Why is it difficult to learn lessons: Insights from
decision theory and cognitive science. Paper presented at the 2007 SPE Annual Technical Conference and Exhibition.
Dunbar, B. (2009). Oil Sands Outlook: How will the Challenges Facing the Industry
Affect Growth? Paper presented at the 2009 Global Petroleum Conference. Dunn, J. (2009). Cost reductions may rekindle some oil sands investment. Oil and Gas
Journal, 107(26), 43-46. Edmunds, N. R., & Suggett, J. C. (1995). Design of a commercial heavy oil SAGD
project. Paper presented at the International Heavy Oil Symposium. ERCB. (2010a). Oil sands. Retrieved September 4, 2010 ERCB. (2010b). Oil sands development. Retrieved April 26, 2010, from
http://www.ercb.ca/portal/server.pt/gateway/PTARGS_0_0_312_249_0_43/http;/ercbContent/publishedcontent/publish/ercb_home/public_zone/oil_sands/development/
Flyvbjerg, B., Bruzelius, N., & Rothengatter, W. (2003). Megaprojects and risk: An
antomy of ambition. Cambridge, UK: Cambridge University Press.

335
Gaviria, F. (2010). Discussion on Steam to Oil Ratio (SOR) for application of SAGD technology in Northern Alberta. In A. Halari (Ed.) (Personal Communication ed., pp. 7). Calgary, Alberta.
Gaviria, F., Santos, R., & Rivas, O. (2007). Pushing the boundaries of artificial lift applications: SAGD ESP installations in Canada. Paper presented at the 2007 SPE Annual Technical Conference and Exhibition.
Gehrig, D. R. (1996). Practical elements of project management for underground construction. Mining Engineering, 48(4), 40-46.
Gibbins, R. (2006). The relevance and role of contractors in mining. Paper presented at the International Mine Management Conference.
Gordon, C. M. (1994). Choosing appropriate construction contracting method. Journal of Construction Engineering and Management, 120(1), 196-210.
Gordon, T. J. (1994). The Delphi Method: The Futures Group. Government of Alberta. (2009/2010). Alberta oil sands quarterly update. Calgary,
Alberta. Government of Alberta. (2010). Talk about oil sands. Retrieved April 26, 2010, from
www.oilsands.alberta.ca Harji, A. (2009). Overview of constructing oil & gas projects. In A. Halari (Ed.)
(Personal Communication ed.). Calgary, Alberta. Harris, K. (2009a). Executing oil & gas projects. In A. Halari (Ed.) (Personal
Communication ed.). Calgary, Alberta. Harris, K. (2009b). Impact of oil prices on project execution. In A. Halari (Ed.) (Personal
Communication ed.). Calgary, Alberta. Harris, K. (2009c). Traditional durations of EPC projects. In A. Halari (Ed.) (Personal
Communication ed.). Calgary, Alberta. Harris, K. (2010). Lowering project costs. In A. Halari (Ed.) (Personal Communication
ed.). Calgary, Alberta. Hartman, F. (2000). Don't park your brain outside: A practical guide to improving
shareholder value with SMART Management. Newton Square, PA: Project Management Institute.
Hartman, F. (2008). Preparing the mind for dynamic management. International Journal of Project Management, 26(3), 258-267.
Hartman, F. (2010). ENCI 689 Advanced project management practices and principles Session 5 notes University of Calgary. In Students (Ed.) (University of Calgary class ed., pp. 16). Calgary, Alberta.
Hartman, F. T., & Snelgrove, P. (1996). Risk allocation in lump-sum contracts - concept of latent dispute. Journal of Construction Engineering and Management, 122(3), 291-296.
Helmer, O. (1983). Looking Forward: A guide to Futures Research. Thousand Oaks, CA: Sage.
Hiltz, M. J. (1994). Project Management Handbook of Checklists (Vol. 2). Ottawa, Ontario: MarkCheck Publishing.
Ika, L. A. (2009). Project Success as a Topic in Project management Journals. Project Management Journal, 40(4), 6-19.

336
Jacobs. (2009). Life cycle assessment of North American and imported crudes: Jacobs Consultancy.
Jameson, P. H. (2007). Is modularization right for your project? Hydrocarbon
Processing, 86, 47-53. Jergeas. (2008). Analysis of the front-end loading of Alberta mega oil sands projects.
Project Management Journal, 39(4), 95-104. Jergeas, G. (2009). Improving construction productivity on Alberta oil & gas capital
projects. Calgary, Alberta: Alberta Finance and Enterprise. Jergeas, G., & Van der Put, J. (2001). Benefits of Constructability on Construction
Projects. Journal of Construction Engineering and Management, 127(4), 281-290. Jergeas, G. F. (2008). Analysis of the front-end loading of Alberta mega oil sands
projects. Project Management Journal, 39(4), 95-104. Jergeas, G. F., & Ruwanpura, J. (2009). Why Cost and Schedule Overruns on Mega Oil
Sands Projects? Practice Periodical on Structural Design and Construction, 1(1), 10.
Johnson Jr, D. R. (1987). Lump Sum Contracting: An owner's Perspective. Cost
Engineering (Morgantown, West Virginia), 29(2), 8-11. Jones, C. G. (2002). A Delphi Evaluation of Agreement between Organizations. In H. A.
Linstone & M. Turoff (Eds.), The Delphi Method Techniques and Applications. Karlsen, J. T. (2002). Project stakeholder management. Engineering Management
Journal, 14(4), 19-24. Knoop, W. G., vanBreemen, E. J. J., Vergeest, J. S. M., & Wiegers, T. (1996, August 26-
28). Enhancing engineering performance through more intensive communication. Paper presented at the Third ISPE International Conference on Concurrent Engineering: Research and Applications, Toronto, Ontario.
Kotter, J. P. (1990). A force for change: How leadership differs from management. New York, NY: Simon & Schuster.
Krahn, J. L. (2005). Project Leadership: An Empirical Investigation. University of Calgary, Calgary, Alberta.
Krauss, C., & Rosenthal, E. (2010, 8:00pm). Mired in Canada's oil sands. The New York
Times Retrieved May 18, 2010 Kuprenas, J. A. (2003). Project management actions to improve design phase cost
performance. Journal of Management in Engineering, 19(1), 25-3225. Lavrakas, P. J. (Ed.) (2008) Encyclopedia of survey research methods (Vols. 1).
Thousands Oaks, CA: Sage Publications. Lincoln, Y. S., & Guba, E. G. (1985). Naturalistic inquiry. Beverly Hills, CA: Sage. Linestone, H. L. (Ed.). (1978). The Delphi Technique. London: Greenwood Place. Lozon, J. P. (2008). Evaluating value improving practices for large scale projects.
University of Calgary, Calgary, Alberta. Luxford, J. (2006). Project development and construction management. Paper presented
at the International Mine Management Conference. MacPherson, S. (2009). Qualitative Research Methods, University of Calgary EDER
603.13.L04. In Students (Ed.) (Class Lecture ed.). Calgary, Alberta. Martino, J. (1999). Thirty Yars of Change and Stability. Technological Forecasting and
Social Change(62), 13-18.
337
Maruyama, M. Commentaries on the "Quality of Life" Concept. McCarthy, S. (2010). Oil sands on track to be biggest source of U.S. oil imports.
Retrieved May 19, 2010, from http://www.theglobeandmail.com/report-on-business/industry-news/energy-and-resources/oil-sands-on-track-to-be-biggest-source-of-us-oil-imports/article1574854/
McColl, D., Mei, M., Millington, D., & Kumar, C. (2008). Green Bitumen: The role of
nuclear, gasification, and CSS in Alberta's oil sands: Part I - Introduction and
overview. Calgary, Alberta: Canadian Energy Research Institute. Moritis, G. (2004, March 15). Suncor's George: Oil sands a long-life, low risk resource.
Oil & Gas Journal, 37-38. Morlan, C., & Gelbtuch, J. B. (2010). Multigenerational teams and their impact in project
management. PMI - Community Post, 3. Morris, W. G. (1998). Why project management doesn't always make business sense.
Project Management, 4(1), 12-16. Navarrete, P., & Cole, W. (2001). Planning, estimating, and control of chemical projects.
New York, NY: Marcel Dekker. Nickle. (2007). SAGD: Spin vs reality. New Tchnology Magazine, 2010 (September), 1-
9. Noort, D. J., & Adams, C. (2006). Effective mining project management systems. Paper
presented at the International Mine Management Conference. Novakowski, N., & Wellar, B. (2008). Using the Delphi techniques in normative
planning research: methodological design considerations. Environment &
Planning, 40(A), 1485 - 1500. O'Connor, J. T., & Miller, S. J. (1995). Overcoming Barriers to Successful
Constructability Implementation Efforts. Journal of Performance of Constructed
Facilities, 9(2), 117-128. O'Neil, M. D. (2009). Stakeholders. In BSEN719 (Ed.) (Project External Issues course,
Haskayne School of Business, University of Calgary ed.). Calgary, Alberta. Oshanek, T. (2010). Module transportation to northern Alberta. In A. Halari (Ed.)
(Personal Communication in email describing module transportation considerations ed.). Calgary, Alberta.
Palmer, J., & Mukherjee, T. (2006). Megaproject execution. Paper presented at the 2006 SPE Annual Technical Conference and Exhibition.
Pedwell, K., Hartman, F. T., & Jergeas, G. F. (1998). Project capital cost risks and contracting strategies. Cost Engineering (Morgantown, West Virginia), 40(1), 37-41.
Pocock, J. B., Kuennen, S. T., Gambatese, J., & Rauschkolb, J. (2006). Constructability State of Practice Report. Journal of Construction Engineering and Management,
132(4), 373-383. Polczer, S. (2010). Oilsands Exit 2009 on Comeback Trail. 1. Retrieved January 1, 2010,
from http://www.calgaryherald.com/technology/Oilsands+exit+2009+comeback+trail/2397127/story.html

338
Priemus, H., Flyvbjerg, B., & van Wee, B. (Eds.). (2008). Decision-making in mega
projects: Cost-benefit analysis, planning and innovation. Cheltenham, UK: Edward Elgar.
Rapp, D. B. (2006). Taking the fast track: Streamlining major deepwater projects. World
Oil, 227(5), D97-D98. Rapp, D. B. (2007, May). Developing the right concept for offshore developments.
Offshore. Reinschimdt, K., & Trejo, D. (2006). Economic value of building faster. Journal of
Construction Engineering and Management, 132(7), 759-766. Reymert, D. (2002). Malampaya deep water gas-to-power project: onshore gas plant
value engineering and flawless startup. Paper presented at the 2002 Offshore Technology Conference.
Rickards, J. V. (2000, September 7-16). The Alliance Pipeline story: Managing a multi-
billion dollar project on a fast track. Paper presented at the Project Management Institute Annual Seminars & Symposium, Houston, TX.
Roberts, K. H., & O'Reilly III, C. A. (1974). Failures in upward communication in organziations: Three possible culprits. Academy of Management, 17(2), 205-215.
Rodgers, B. L., & Cowles, K. V. (1993). The Qualitative Research Audit Trail: A complex Collection of Documentation. Research in Nursing Health, 19(3), 319-340.
Rowe, G., & Wright, G. (1999). The Delphi Technique as a Forecasting Tool: Issues and Analysis. International Journal of Forecasting, 15(4), 353 - 375.
Ruwanpura, J. K. (2002). Most significant causes for rework due to engineering
deliverables. Calgary, Alberta. Sadleowski, M. (1986). The Problem of Rigor in Qualitative Reasearch. Advances in
Nursing Science, 8(3), 27 - 37. Salancik, J. R., Wenger, W., & Helfer, E. (1971). The Construction of Delphi Event
Statements. Technological Forecasting and Social Change, 3(1), 65-73. Sandrea, R. D. (2009). An In-depth view of future world oil & gas supply - A quantitative
model. Retrieved April 10, 2010, from http://www.pennenergy.com/index/articles/display
Saxton, J. (2006). Canadian oil sands: A new force in the world oil market Washington, DC: Joint Economic Committee, United States Congress.
Schuman, S. (Ed.). (2006). Creating a culture of collaboration: The International
Association of Facilitators Handbook. San Francisco, CA: Jossey-Bass. Selby, J. (2010). Changing oil sands reservoir conditions. In A. Halari (Ed.) (Personal
Communication ed.). Calgary, Alberta. Singh, S. (1997). Lump-sum contract performance - Singapore experience. Paper
presented at the AACE International Conference. Skumolski, G., Hartman, F., & DeMaere, R. (2000). Superior and threshold project
competancies. Project Management, 6(1), 10-15. Skumolski, G. J., Hartman, F. T., & Krahn, J. (2007). The Delphi Method for Graduate
Reasearch. Journal of Information Technology Education, 6, 1-21.

339
Song, L., Mohamed, Y., & AbouRizk, S. M. (2009). Early Contractor Involvement in Design and Its Impact on Construction Schedule Performance. Journal of Management in Engineering, 25(1), 12-20.
Staus, B. (2010). Decoupling of engineering activites. In A. Halari (Ed.) (Personal Communication ed.). Calgary, Alberta.
Strauss, A., & Corbin, J. (1998). Basics of qualitative research: Techniques and procedures for developing grounded theory. Thousand Oaks, CA: Sage.
Sungaard, D. (2009). Executing SAGD projects. In A. Halari (Ed.) (Personal Communication ed., pp. 5). Calgary, Alberta.
Swenson, M. (2007). Triangulation: A trancendental process. Retrieved March 19, 2010, from http://www.interpretiveleadership.com/article/Triangulation.htm
Thinkexist.com. (2010). Retrieved August 29, 2010, from http://thinkexist.com/quotation/the_single_biggest_problem_in_communication_is/155222
Turoff, M., & Linstone, H. A. (2002). The Delphi Method: Techniques and Applications: Addison-Wesley Publishing Company Inc.
Vanderklippe, N. (2009) Eyeing the benefits of a pure oil play. Vol. 2010. Energy. Toronto, Ontario: The Globe and Mail.
Walkup, G. W., & Ligon, J. R. (2006). The good, the bad, and the ugly of stage-gate project management process in the oil and gas industry. Paper presented at the 2006 SPE Annual Technical Conference and Exhibition.
Ward, S. C., Chapman, C. B., & Curtis, B. (1991). On the allocation of risk in construction projects. International Journal of Project Management, 9, 140-147.
Weaver, P. (2007). A simple view of 'Complexity' in project management. Paper presented at the WPM Week Singapore.
Weick, K. (1995). Sensemaking in Organizations. Thousand Oaks, CA: Sage Publications.
Wiley, J. (2010). Webster's New World College Dictionary Retrieved June 12, 2010, from www.yourdictionary.com/trust
Williams, T. M., Samset, K., & Sunnevag, K. (Eds.). (2009). Making essential choices
with scant information. London: Palgrave Macmillan. Willis, J. W., Jost, M., & Nilakanta, R. (2007). Foundations of qualitative reserach
interpretive and qualitative approaches. Thousand Oaks, CA: Sage. Willoughby, T. J. (1995). Managing design under lump-sum contract. Journal of
Management in Engineering, 11(2), 21-25. Winestock, A. (2004). Chapter B7 Steam Assisted Gravity Drainage (SAGD). Yates, J. K., & Battersby, L. C. (2003). Master builder project delivery system and
designer construction knowledge. Journal of Construction Engineering and
Management, 129(3), 635-644. Yin, R. K. (2003). Case study research: Design and method (3rd ed.). Thousand Oaks,
CA: Sage.

340
Appendix A: Lessons Learned Collected From Round 1 Survey

341
Due to page limitations for bindery, the lessons learned collected from Round 1 of the
survey are not included. However, they can be made available by contacting the
researcher at the following email address: [email protected].

342
Appendix B: Ranking of Lessons Learned From Round 2

343
Appendix C: University of Calgary Research Ethics Board Consent

344
Appendix D: Survey Responses Tracking Sheet

345
Appendix E: Lessons Learned Ratings on Scatter Graph

346
Due to page limitations for bindery, the lessons learned ratings on scatter graph are not
included. However, they can be made available by contacting the researcher at the
following email address: [email protected].

347
Appendix F: Round 1 Survey Form

348
Appendix G: Round 2 Survey Form

349
Appendix H: Suppliers Document Index (SDI)

350
Appendix I: Project Performance Standards


