

REFINERY H2 & CO2 MANAGEMENT: KEY PLAYERS IN THE IMMINENT GHG COMPLIANCE
M. Pagano
Sapienza Università di Roma
Authors M. Pagano – Refining Technology Specialist – TECHNIPS. Di Pasquale – University “Sapienza Università di Roma”A. Gragnani – Refining Product Line & Technologies - TECHNIPSanjiv Ratan – H2 Chief Technology Officer – TECHNIP

Global Warming is melting the ice of the poles
Source: Norwegian Science Council
• Global warming most likely is a result of human activities
• Nevertheless for the coming years most of the energy is expected to come from non‐renewable resources to sustain the economic growth especially in the emerging countries

KYOTO PROTOCOLSIGNED AND RATIFIED
SIGNED BUT NOT RATIFIED
NOT SIGNED
World Commitment to KYOTO
NATIONS THAT ARE REDUCING THEIR CO2 EMISSIONS
NATIONS THAT ARE STABILIZING THEIR CO2 EMISSIONS
NATIONS ALLOWED TO INCREASE THEIR CO2 EMISSIONS
NATIONS NOT CALLED TO MAKE A COMMITMENT REGARDING THEIR CO2 EMISSION
NATIONS THAT HAVE NOT SIGNED THE KYOTO PROTOCOL
Kyoto protocol envisions reduction of 5% in the GHG over the period 2008‐2012 compared to 1990 level for Annex II countries

Setting cup to the GHG emitters• Large emitter scheme covers power generators, oil refining,
cement, steel & other metals, pulp & paper + other large combustion plants, including more than 10,000 installations in 27 EU countries
• Joint Implementation(JI): emission reductions which arise from project investments in other countries when both countries have their own Kyoto emission targets (Annex II)
• Certified Emission Reductions (CERs) can be obtained by implementing emission reduction projects in developing nations that have ratified (or acceded to) the Kyoto Protocol.
• CO2 emissions can be regulated by two systems:– Carbon Tax– ETS with CO2 credits auctioning
• EU has selected the 2nd solution with a cap & trade system:– Emissions permits (*) correspond to a cap fixed by the EU– Industrial plant may offset their excess emissions by acquiring permits
from other sources able or willing to emit below their established cup
(*) 1 ton of CO2 = 1 permit

TRENDS IN THE EUROPEAN UNION
NATIONS ALLOWED TO INCREASE THEIR CO2 EMISSIONS
NATIONS THAT ARE STABILIZING THEIR CO2 EMISSIONSNATIONS THAT ARE REDUCING
THEIR CO2 EMISSIONS
NATIONS ALLOWED TO INCREASE
PORTUGAL + 27%
GREECE + 25%
ITALY ‐ 6%
NATIONS ON REDUCTION TREND
LUXEMBURG ‐ 28%
GERMANY & DENMARK ‐ 21%
Whole commitment of the EU = -8% N.A.A.P.N.A.A.P.(i.e.National Allocation Allowance Plan)
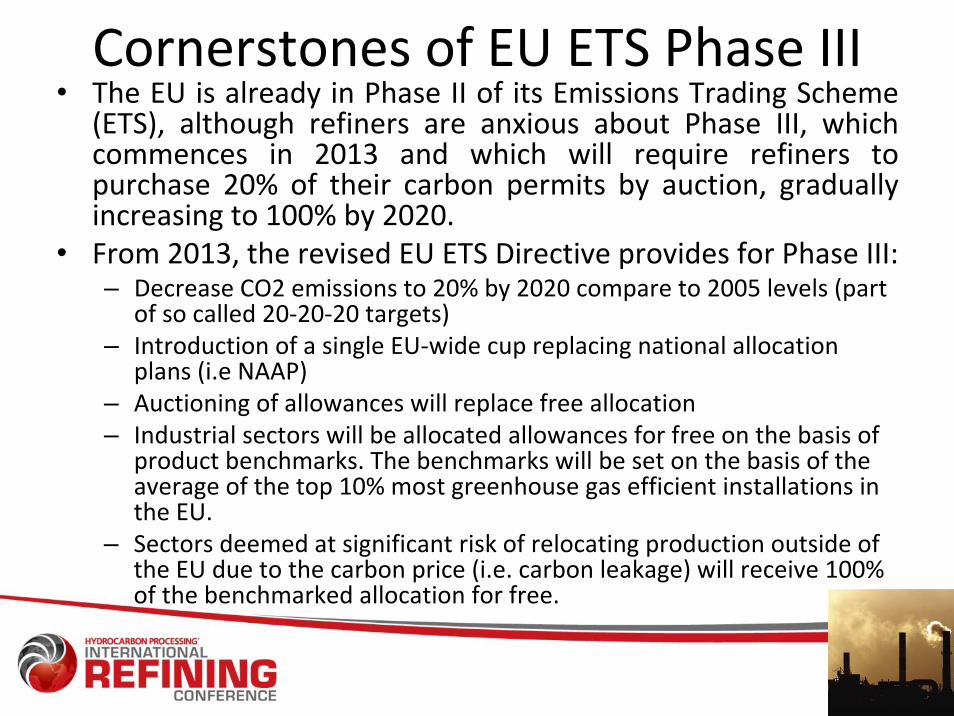
Cornerstones of EU ETS Phase III• The EU is already in Phase II of its Emissions Trading Scheme
(ETS), although refiners are anxious about Phase III, which commences in 2013 and which will require refiners to purchase 20% of their carbon permits by auction, gradually increasing to 100% by 2020.
• From 2013, the revised EU ETS Directive provides for Phase III:– Decrease CO2 emissions to 20% by 2020 compare to 2005 levels (part
of so called 20‐20‐20 targets)– Introduction of a single EU‐wide cup replacing national allocation
plans (i.e NAAP)– Auctioning of allowances will replace free allocation– Industrial sectors will be allocated allowances for free on the basis of
product benchmarks. The benchmarks will be set on the basis of the average of the top 10% most greenhouse gas efficient installations in the EU.
– Sectors deemed at significant risk of relocating production outside of the EU due to the carbon price (i.e. carbon leakage) will receive 100% of the benchmarked allocation for free.

The ultimate challenge of the refining industry is to find a compromise among global increasing in energy consumption and mitigation of its environmental impact with the following task:
• Handle the financial risks of carbon dioxide emissions
• Plan for Advanced carbon capture, sequestration, and widen hydrogen‐production technologies
• Creates the technical and economics basis for use of a global energy mix with a long‐term goal of “zero emissions”.
Challenges of the Refining Industry (1/2)LongLong‐‐medium termmedium term

Challenges of the Refining Industry (2/2)Short termShort term
• The majority of refinery CO2 evolves through hydrogen and energy production—i.e. steam reforming and the combustion of natural gas, refinery gas, and coke.
• Refiners face the unique dilemma of balancing GHG emissions with the production of more ultra‐clean fuels, while processing increasingly heavier and sourer crudes.
• Due to clean fuel mandates, refinery hydrogen requirements are growing, demanding increased production, which bring to a significant amounts of CO2 as by‐product.
• This impact of the CO2 on the Hydrogen production cost will encourage refiners to look at optimizing or re‐optimizing their hydrogen balances

Why Managing H2 & CO2• Deep conversion refineries with and high level of bottom‐of‐the‐barrel conversion can have an H2 demand up to 2.7%wt of total crude input
10

Why Managing H2 & CO2
11
• A modern high conversion refinery produces:– 0.33÷0.4 ton CO2 per ton of crude (without residue gasification) (*)
– 0.7 ton CO2 per ton of crude (with residue or coke gasification)
• Lots of CO2 sources in the refinery are scattered all around the plot plan making difficult the recovery
• Coupling H2 and utilities production in the HGU or IGCC can be a way of having a single source for CO2 capture
• The impact of the EU carbon emissions & trading scheme on a refinery is very complex– Use of LP model can help to asses the impact of ETS emissions costs on the refinery operation and
configuration
(*) 0.21÷0.28 excluding CO2 quota for internal power production

Case study“An FCCAn FCC‐‐centric Refinerycentric Refinery””
12

Case study highlights
13
• The Refinery is an high conversion plant placed in an industrial area of the European Community, on line since 1970.
• The conversion core is the FCC.
• More than 50% of the power generated in the plant is sent to the national grid (i.e. separate regulation for power generation).
• The production strategy of the plant has moved in the time from a gasoline maximization target to a middle distillate maximization target following the well‐enstablished regional dieselization trends.
• Revamping investment strategies have been dictated in the past by:– Clean fuel compliance (i.e. new HP HDS train, new Mild Hydrocracker unit, new ETBE unit, Visbreaker re‐conversion)
• Some energy optimization projects have been carried out as side projects of big revamping projects within the boundary limits of 3÷5 years maximum pay off time– Re‐instrumentation of obsolete DCS/PCS systems

Crude CharacterizationKirkukBlend REBCO * Arabian Lt Siberian Lt Brent
Gravity, °API 35.1 32 33.4 35.1 38.3
Specific gravity, 60°F/60°F 0.8493 0.87 0.8581 0.8486 0.835
Sulphur total, wt% 1.97 1.8 1.77 0.57 0.4
Metals (Ni + V), wt ppm 40 na 16.8 21 7
Conradson Carbon, wt% 3.8 na 3.58 2.5 2.13
TAN, mg KOH/g 0.2 na na 0.05 0.1
LPG C3+C4 yield, wt% 1.8 na 1.0 1.0 1.9
Naphtha yield (C5 -150°C), wt% 17.3 na 14.6 15.9 21.1
Kero yield (150°C - 240°C), wt% 15.0 na 16.2 14.7 15.3
Diesel yield (240°C-350°C), wt% 19.5 20.8 20.5 21.8 21.7
Reduced crude (350+ °C), wt% 46.5 50.0 47.7 46.3 40.0
(*) Russian Export Blend Crude Oil


“APP” : ADAPTATION PLANT PROGRAMThe Road‐map for an effective CO2 reduction plan
• Move the analysis from a Reliable Overall Hydrogen & Utility Balance
• Identify the step line with the horizons for the CO2 emission permits as fixed by the regulatory authority
• Rank the viable CO2 reduction solutions:– Low/Easy winning, low TIC
– Medium complexity, medium TIC
– High complexity, medium/high TIC
TIC : Total investment cost

Overall Hydrogen & UTILITY BALANCEDAILY UTILITYCONSUMPTION
POWER(KWH/D)
STEAM(T/D)
FUEL FIRED(GCAL/D)
COOLING WATER (M3/D)
CDU/VDU 74020,8 907,2 2469,6 94953,6SAT GAS PLANT AND ANCILLARIES
44553,6 2116,8 19891,2
ISOM C4 2080,0 52,0 2600,0ISOM C5-C6 27043,3 1377,1 13,3 19193,1NAPHTA HYDROTREATER
60248,4 551,1 638,2 1102,3
CATALYTIC REFORMER
210812,9 -379,4 1804,6 40238,7
KERO HYDROTREATER
46388,8 157,9 178,1 3014,7
DIESEL HYDROTREATER
79413,0 270,3 304,9 5160,8
MILD HYDROCRACKER
355254,9 212,6 1919,1 65357,0
CATALYTIC CRAKER
243608,8 -657,2 355,0 67983,9
DELAYED COKER 123068,9 264,7 1080,5 32999,0UNSATURATED GAS PLANT
67901,2 238,3 23911,9
ALKYLATION 51194,0 496,5 24,5 42133,4ETBE UNIT 3708,4 117,6 2543,1H2 PLANT 42483,0 -1462,7 1514,1 4299,8SRU 25989,1 -671,8 428,5 15731,7
TOT PROCESS UNITS 1457769,0 3591,1 10730,5 441114,1
UNITÀ UTILITIES & OFF-SITES
162523,2 1579,2 3202,1 39648,0
TOT REFINERY 1620292,2 5170,3 13932,5 480762,1
MWe T/H MWt M3/H67,5 215,4 675,1 20031,8
DAILY UTILITYCONSUMPTION
POWER(KWH/D)
STEAM(T/D)
FUEL FIRED(GCAL/D)
COOLING WATER (M3/D)
CDU/VDU 74020,8 907,2 2469,6 94953,6SAT GAS PLANT AND ANCILLARIES
44553,6 2116,8 19891,2
ISOM C4 2080,0 52,0 2600,0ISOM C5-C6 27043,3 1377,1 13,3 19193,1NAPHTA HYDROTREATER
60248,4 551,1 638,2 1102,3
CATALYTIC REFORMER
210812,9 -379,4 1804,6 40238,7
KERO HYDROTREATER
46388,8 157,9 178,1 3014,7
DIESEL HYDROTREATER
79413,0 270,3 304,9 5160,8
MILD HYDROCRACKER
355254,9 212,6 1919,1 65357,0
CATALYTIC CRAKER
243608,8 -657,2 355,0 67983,9
DELAYED COKER 123068,9 264,7 1080,5 32999,0UNSATURATED GAS PLANT
67901,2 238,3 23911,9
ALKYLATION 51194,0 496,5 24,5 42133,4ETBE UNIT 3708,4 117,6 2543,1H2 PLANT 42483,0 -1462,7 1514,1 4299,8SRU 25989,1 -671,8 428,5 15731,7
TOT PROCESS UNITS 1457769,0 3591,1 10730,5 441114,1
UNITÀ UTILITIES & OFF-SITES
162523,2 1579,2 3202,1 39648,0
TOT REFINERY 1620292,2 5170,3 13932,5 480762,1
MWe T/H MWt M3/H67,5 215,4 675,1 20031,8
Hydrogen Consumption(98000 Nm3/h)
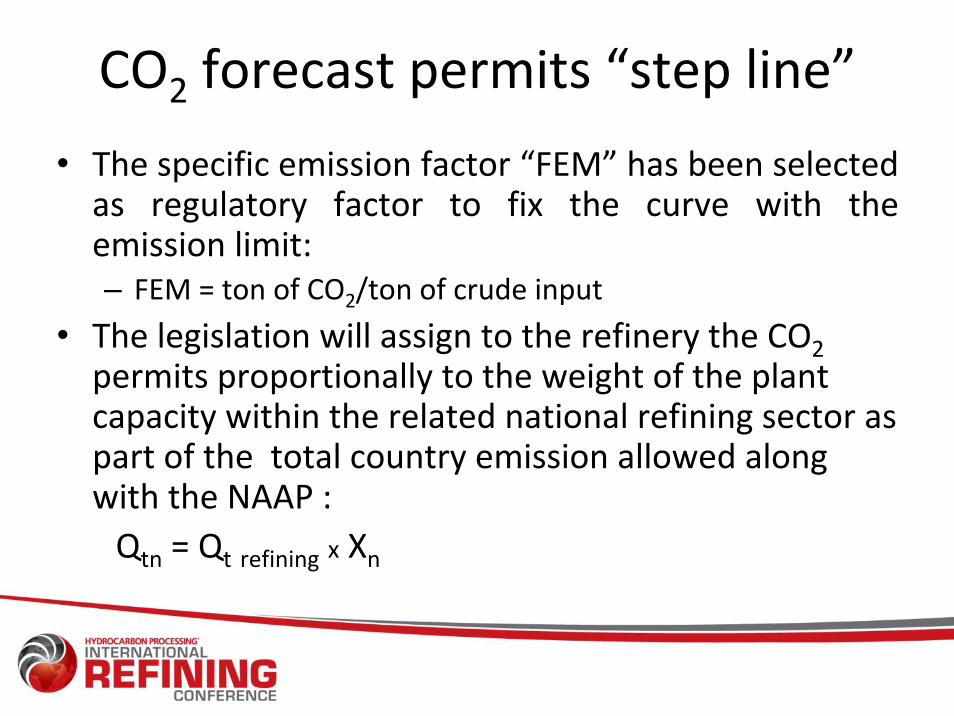
CO2 forecast permits “step line”
• The specific emission factor “FEM” has been selected as regulatory factor to fix the curve with the emission limit:– FEM = ton of CO2/ton of crude input
• The legislation will assign to the refinery the CO2permits proportionally to the weight of the plant capacity within the related national refining sector as part of the total country emission allowed along with the NAAP :Qtn = Qt refining x Xn

CO2 forecast permits “step line”
Permits after 2020Permits after 2020
Hystorical Baseline emissions 2005Hystorical Baseline emissions 2005--20082008
Permits for 2008Permits for 2008--20202020
Phase IIPhase II Phase IIIPhase III
? further -20%
-30%
Phase IPhase I

ENERGY SAVING SOLUTIONSS uddivis ione emis s ioni di CO2
C AS O 2IMP H2 21,0%
C OMBUS TIB IL IBR UC IATI 70,1%
FC C C OKE 8,9%
S uddivis ione emis s ioni di C O2 C AS O 3
C OMBUS TIB IL IBR UC IATI63,1%
IMP H2 24,6%
FC C C OKE 12,3%
Switch to a full firing with Switch to a full firing with low carbon fuellow carbon fuel(Improving by 3(Improving by 3÷÷5% heaters efficiency)5% heaters efficiency)
Refinery fuels = NG, FG, Fuel oilRefinery fuels = NG, FG, Fuel oil
Refinery fuels = NG, FG, Fuel oilRefinery fuels = NG, FG, Fuel oil
--15% CO15% CO22 emissions avoidedemissions avoided
FEM = 0,253 ton of CO2/ton of crude (*)FEM = 0,253 ton of CO2/ton of crude (*)
Fuel Substitution (the 1Fuel Substitution (the 1st st action to undertake)action to undertake)
(*) excluding CO2 for internal power productionPower plant is a NG fired combined cycle with net export to the grid

CO2 emissions by process & utility units
R ipartiz ione emis s ioni di CO2 per unità
H2 S MR 24,58%
OTHE RS 5,90%
H2 P LANT 6,85%
DCU 4,89%
MHC 8,69%
NHT+CCR 11,06%
CDU/VDU 11,18%
FCC COK E 12,35%
U & O 14,50%

STEAM LOSSES MINIMIZATIONSTEAM LOSSES MINIMIZATION
ENERGY SAVING SOLUTIONS
Source : UOPSource : UOP

DESCRIPTION of “APP” SOLUTIONSDescription Complexity TIC Remarks
APP0 Fuel Substitution LOW LOW Easy winning
APP1 Heat recovery improvement onCDU/VDU, MHC, DCU, CCR
HIGH HIGH Air preheating. Heat integration Pinch analysis, High flux HEs
APP3 BAT & new generation catalysts forNHT, KHT, DHT, MHC
LOW HIGH
APP4 H2 Management LOW/MEDIUM LOW H2 pinch analysis
APP5 CO2 capture in the SMR& CCS
LOW HIGH/(VERY HIGH ?)
APP2 Utilities optimizationFlaring reduction; steam recovery &
optimization
LOW/MEDIUM LOW/MEDIUM
APP6 CO2 capture from boilers stack(postcombustion & CCS)
MEDIUM HIGH(VERY HIGH ?)

Economic factors for CO2 reduction
• Stream factor = 333 days• Equity = 30% of the investment• Amortization = 12÷20 years• Discount rate = 8%• For the economic analysis it has been assumed:
Price of CO2 avoided = Price of CO2 captured via CCS (*)• From costs stand point it has been also assumed that each
non captured/avoided CO2 emission exceeding the allowed cup has a penalty of 40 USD per Ton of CO2 emitted
(*) CCS should also includes additional costs related to pipeline trasportation, compression/re‐compression drilling etc. which are still not yet defined at this stage of ETS.

HYDROGEN & CO2 MANAGEMENT

YEAR
EMISSION TRENDS
YEAR Femsp
AdaptationProgram
P.O.T.
2005÷2008 0,253
2008÷2012 0,245 APP 4 3
2008÷2012 0,192 APP 5 5,5
2008÷2012 0,184 APP 2 7,4
After 2020 0,168 APP 3 7,9
After 2020 0,157 APP 1 12,6
After 2020 0,128 APP 6 16
CURVE 1 CURVE 2
GOM ($/bbl) 4 4+2sen(2πt/6+π/2)
CO2 Price ($/T) 30 30
CURVE 1
CURVE 2
TECHNICAL & ECONOMICAL SUMMARY
(*) The Net Refining Margin has been assumed equal to 4 USD/BLL
Adaptation step lineAdaptation step line
Permits step linePermits step line

Conclusions• The imminent GHG compliance will lead the Refining Industry to face the onerous
task of cleaner products with lower quality crudes involving a substantial CO2 emission reduction
• The challenge will open to revamping opportunities to address the objectives for extended energy efficiecy programs, which in the past were neglected due to the economic viability criteria of maximum “3÷5 years pay‐out time”
• The analysis has shown that the cost for the CO2 reduction can range from 0,9 to 2,5 USD/BLL with an erosion of the Net Operating Margin within the range of 22,5% to 65%.
• Considering the current economy downturn and possible future worsening of the refining margin, the erosion of the net operating margin due to the CO2 reductioncould lead the european refining industry to the margins of the middle 1990 decade unless reverting CO2 costs on consumers.
• Anyway there will be strong incentives for Residue Gasification and for centralized steam & power production through H2 technology coupled with CO2 sequestration and H2 over the fence distribution.
• The forthcoming CO2 auctioning will bring into a volatile market for the acquisition of CO2 permits which impact on the european refining industry is at moment unpredictable

Questions?
Thanks for the attention

Disclaimer
This Presentation is based on forward‐looking information and statements that are subject to risks and uncertainties that could cause actual results to differ. The statements included in this Presentation are based on current expectations, estimates and projections about global economic conditions. Important factors that could cause actual results to differ materially from those expectations include, among others, economic and market conditions, oil prices, changes in governmental regulations, interest rates, fluctuations in currency exchange rates etc. Although the Authors believes that those expectations and the Presentation are based upon reasonable assumptions, they can give no assurance that those expectations will be achieved or that the actual results will be as set out in the Presentation.


![G. Diego Gatta– Università di Milano, Italy [diego ... · G. Diego Gatta– Università di Milano, Italy [diego.gatta@unimi.it] F. Nestola – Università di Padova, Italy DAC](https://cdn.vdocuments.us/doc/165x107/60aefb27f8519950d57ca61b/g-diego-gattaa-universit-di-milano-italy-diego-g-diego-gattaa-universit.jpg)
