Unit 6Economic Indicators &
Goals
Economic Indicators• Different aspects of economic activity that,
when evaluated together, indicate the health and direction of the economy
• Some are considered leading indicators– Indicators change before the economy changes
• Some are considered coincident indicators– Indicators change when the economy changes
• Some are considered lagging indicators– Indicators change after the economy changes
Gross Domestic Product (GDP)• The monetary value of all the finished goods and
services produced in the United States during a specified time period– Measured in dollars
• Real GDP (real GDP per capita = real GDP/population)– the value of the GDP after taking out the effect of price
changes– using this number takes out the effects of inflation and
relates to real buying power
• Nominal GDP– GDP is determined by evaluating the production of goods
and services at current prices

• GDP is used to measure economic size & growth– the change in the level of economic activity from one year
to another
• Includes the following:– Consumer spending
• Spending by individuals on goods and services• Referred to as private consumption
– Business spending on capital• Businesses buying equipment, expanding facilities, etc.• Referred to as investment
– Government spending• Purchases by the government of goods & services from the private
sector• Payments to government employees
• GDP Equation • Only include final goods
• Items purchased for final use• Example: automobiles, kitchen appliances, computers, etc.
• Do not include Intermediate goods (purchased for resale or used to produce other goods)
• Example: farmers wheat (will be ground into flour and sold) the flour can be intermediate
• Expenditure approach: • GDP = Consumption + Investment +
Government Spending + Net Exports
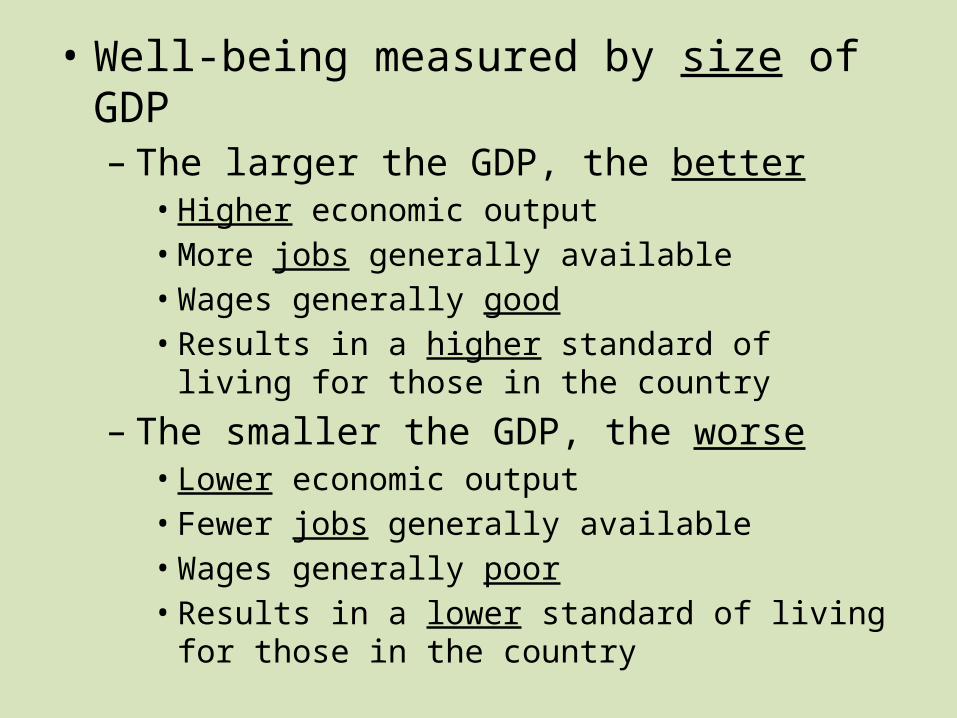
• Well-being measured by size of GDP– The larger the GDP, the better
• Higher economic output• More jobs generally available• Wages generally good• Results in a higher standard of living for those in the
country
– The smaller the GDP, the worse• Lower economic output• Fewer jobs generally available• Wages generally poor• Results in a lower standard of living for those in the
country

• Rate of change important– Growth is good; shrinking is bad– How fast or slow it is growing or shrinking is
important, too• Low growth (<2% annualized growth) is bad, since the
economy isn’t growing rapidly enough to account for increases in the labor force and/or replace jobs lost in any previous downturn
• Runaway growth (>4% annualized growth) is bad, because it is usually due to price inflation for some type of asset (housing, etc.)
• Ideal growth is between 2% & 4% (2.5 – 3.5% is considered best) per year
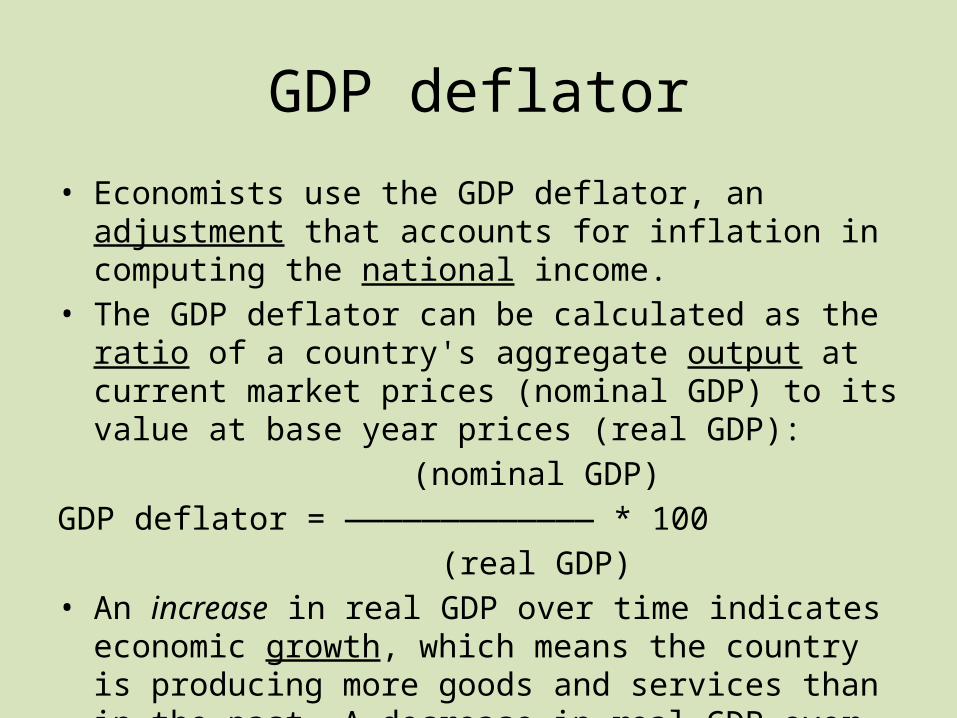
GDP deflator
• Economists use the GDP deflator, an adjustment that accounts for inflation in computing the national income.
• The GDP deflator can be calculated as the ratio of a country's aggregate output at current market prices (nominal GDP) to its value at base year prices (real GDP):
(nominal GDP)GDP deflator = ————————————— * 100 (real GDP)• An increase in real GDP over time indicates economic growth,
which means the country is producing more goods and services than in the past. A decrease in real GDP over time indicates economic contraction.
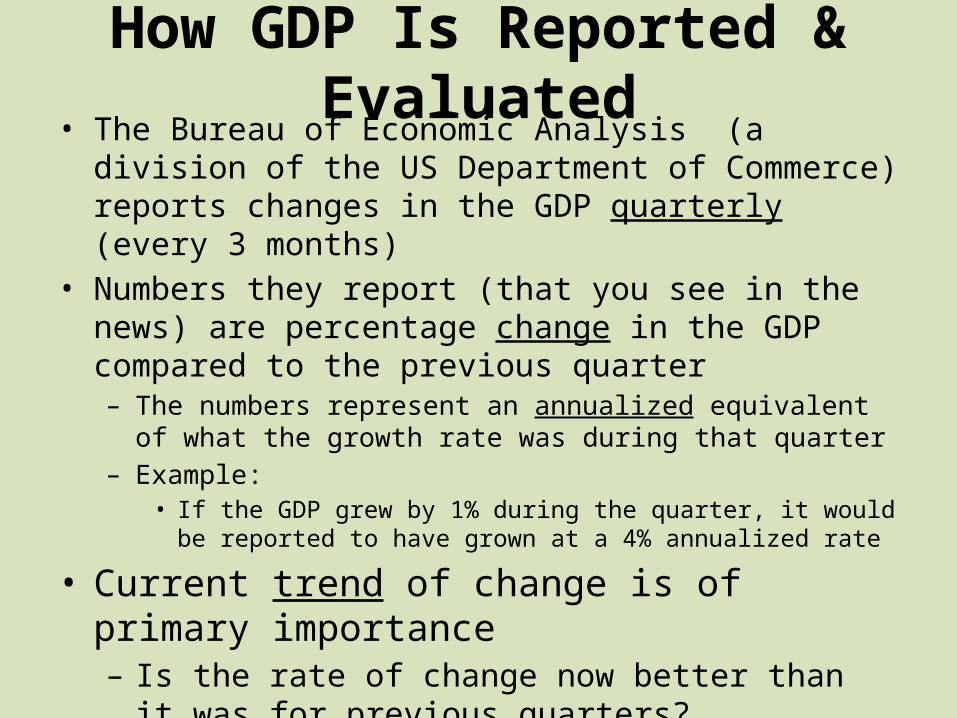
How GDP Is Reported & Evaluated• The Bureau of Economic Analysis (a division of the US
Department of Commerce) reports changes in the GDP quarterly (every 3 months)
• Numbers they report (that you see in the news) are percentage change in the GDP compared to the previous quarter– The numbers represent an annualized equivalent of what the growth
rate was during that quarter– Example:
• If the GDP grew by 1% during the quarter, it would be reported to have grown at a 4% annualized rate
• Current trend of change is of primary importance– Is the rate of change now better than it was for previous
quarters?
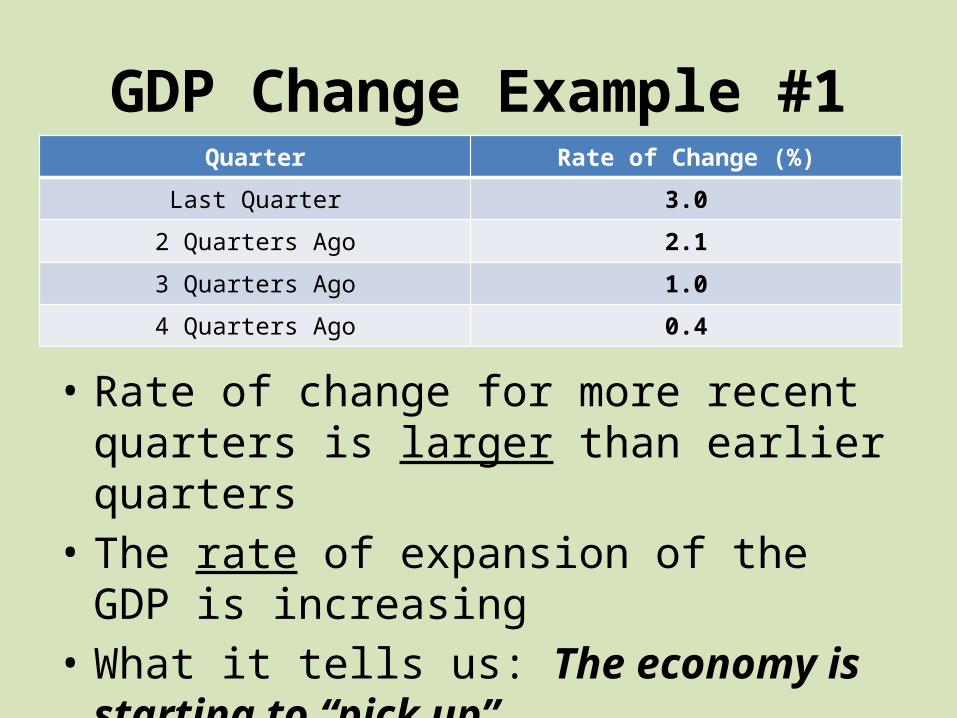
GDP Change Example #1
• Rate of change for more recent quarters is larger than earlier quarters
• The rate of expansion of the GDP is increasing• What it tells us: The economy is starting to
“pick up”
Quarter Rate of Change (%)
Last Quarter 3.0
2 Quarters Ago 2.1
3 Quarters Ago 1.0
4 Quarters Ago 0.4
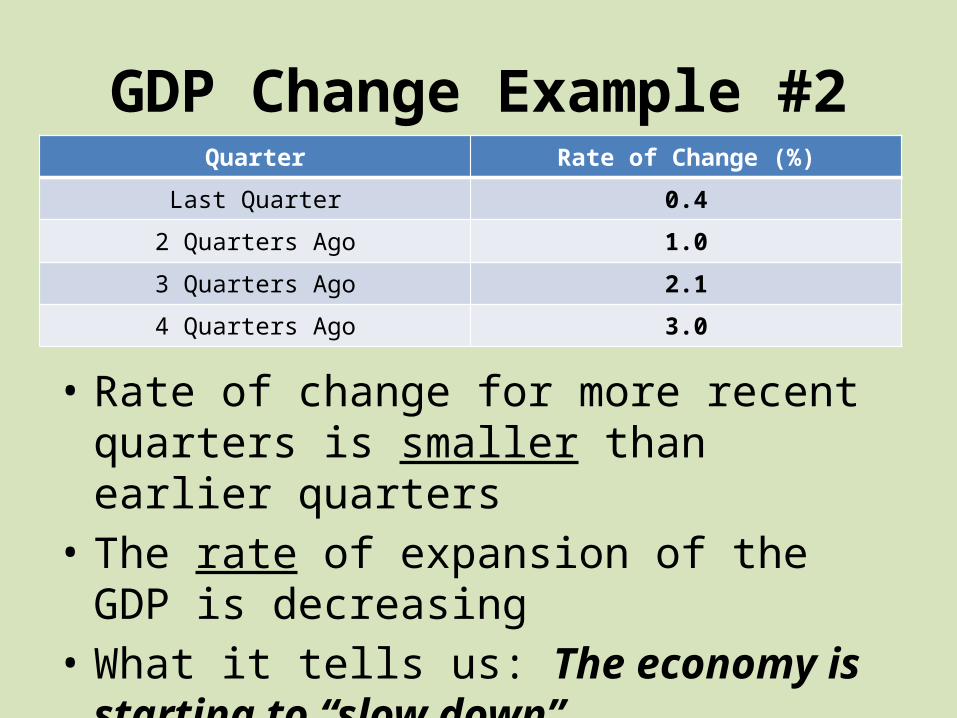
GDP Change Example #2
• Rate of change for more recent quarters is smaller than earlier quarters
• The rate of expansion of the GDP is decreasing• What it tells us: The economy is starting to
“slow down”
Quarter Rate of Change (%)
Last Quarter 0.4
2 Quarters Ago 1.0
3 Quarters Ago 2.1
4 Quarters Ago 3.0

GDP Change Example #3
• Rate of change for more recent quarters is smaller than earlier quarters and now has gone negative
• The GDP is decreasing (contracting)• What it tells us: The economy is “taking a
nose-dive”
Quarter Rate of Change (%)
Last Quarter -1.5
2 Quarters Ago 0.4
3 Quarters Ago 1.0
4 Quarters Ago 2.1
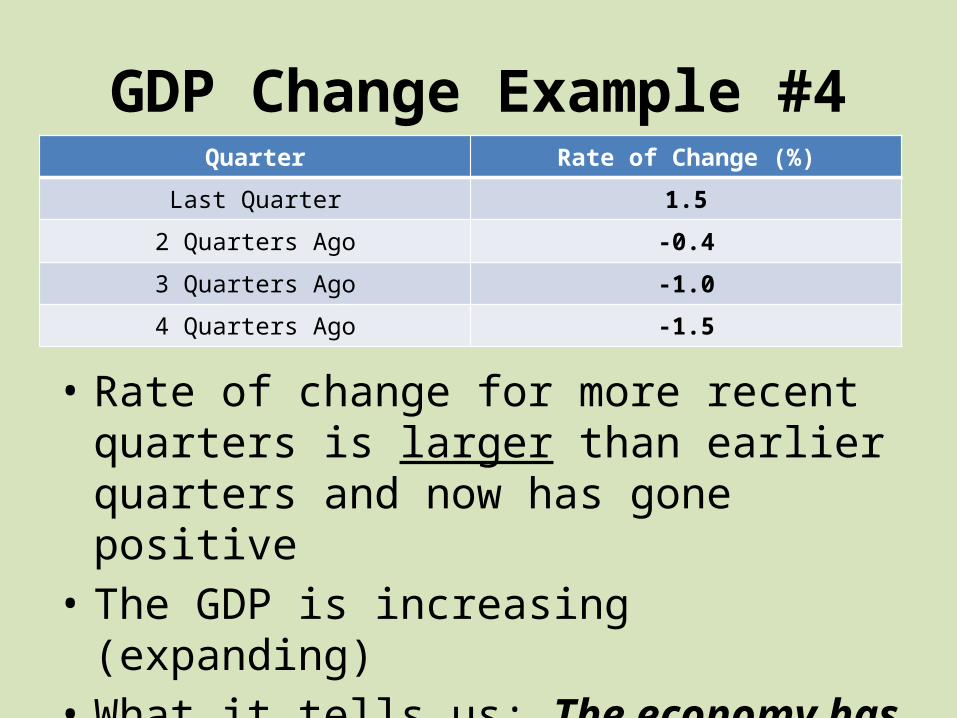
GDP Change Example #4
• Rate of change for more recent quarters is larger than earlier quarters and now has gone positive
• The GDP is increasing (expanding)• What it tells us: The economy has “turned the
corner”
Quarter Rate of Change (%)
Last Quarter 1.5
2 Quarters Ago -0.4
3 Quarters Ago -1.0
4 Quarters Ago -1.5

In-Class ActivityGDP Measuring the Country’s
Output

Unemployment
• The condition of those who are willing and able to work and are actively seeking work but who do not currently work
• in order to be counted among the ranks of the unemployed, you must be:– willing and able to work– actively seeking work
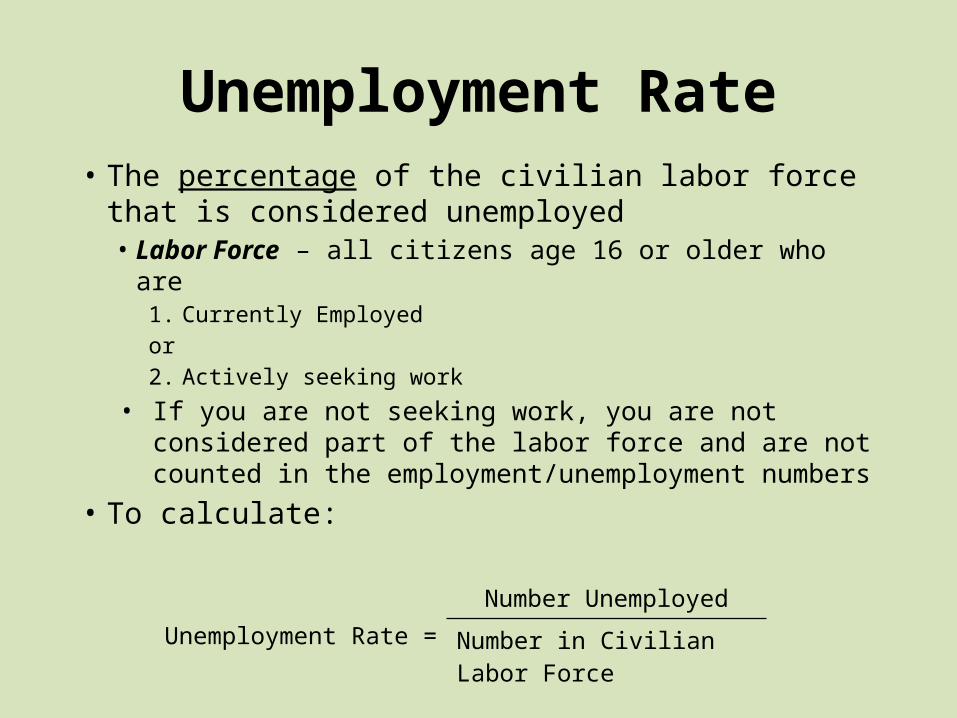
Unemployment Rate• The percentage of the civilian labor force that is
considered unemployed• Labor Force – all citizens age 16 or older who are
1. Currently Employedor2. Actively seeking work
• If you are not seeking work, you are not considered part of the labor force and are not counted in the employment/unemployment numbers
• To calculate:
Unemployment Rate =Number Unemployed
Number in Civilian Labor Force
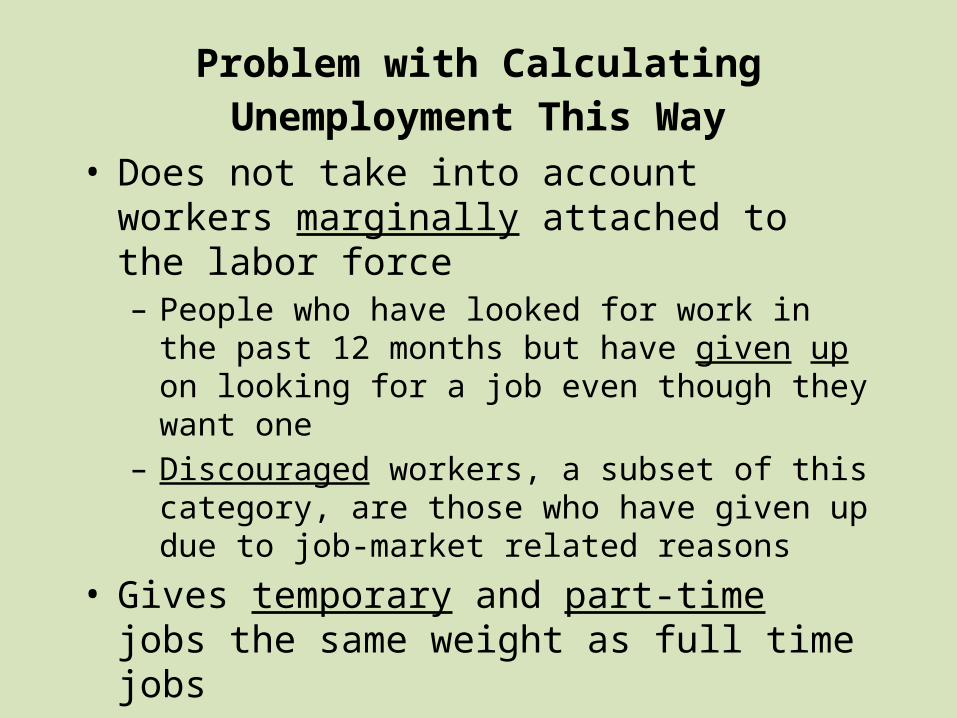
Problem with Calculating Unemployment This Way
• Does not take into account workers marginally attached to the labor force– People who have looked for work in the past 12
months but have given up on looking for a job even though they want one
– Discouraged workers, a subset of this category, are those who have given up due to job-market related reasons
• Gives temporary and part-time jobs the same weight as full time jobs– Worker may want to work full-time, but he/she can’t
get the hours (underemployed)

Unemployment Is a BAD Thing• A high unemployment rate is bad for the economy
– People out of jobs = less money to spend– Less money to spend = less production needed (less
stuff made or services provided)– Less production needed = fewer jobs needed – Fewer jobs needed = layoffs/downsizing (additional
increases in unemployment)– More people collecting unemployment compensation
is an additional drag on the economy• The government needs to tax or borrow that money to pay
them, reducing economic activity that would have otherwise been done with that money

Unemployment Rate that is Increasing is Bad
• More people losing jobs = less $$ to spend• Less spent = less bought• Less bought = less made• Less made = fewer employees needed• Fewer employees needed = increased
unemployment• Negative cycle keeps repeating but will
eventually stop– How bad things get will vary

UNLESS…• If the unemployment rate is going up because
workers are re-entering the workforce, this is a good thing– Ex: 100,000,000 workers; 10,000,000 unemployed
• 10% unemployment
– If 100,000 discouraged/marginally attached workers decide to re-enter the workforce
• 100,100,000 workers; 10,100,000 unemployed• 10.1% unemployment• Unemployment increases, but not because workers lost
jobs
Unemployment Rate that is Decreasing is Good
– More people getting jobs = more $$ to spend– More $$ to spend = more stuff needs to be
provided– More stuff needs to be provided = increases in
production– Increases in production = more workers needed– More workers needed = reduction in
unemployment– Positive cycle begins

UNLESS…• If the unemployment rate is going down
because workers are leaving the workforce, this is a bad thing– Ex: 100,000,000 workers; 10,000,000 unemployed
• 10% unemployment
– If 100,000 workers give up and leave the workforce
• 99,900,000 workers; 9,900,000 unemployed• 9.9% unemployment• Unemployment drops, but not because unemployed
workers got jobs

OR…
• If the unemployment rate is going down because the jobs that are created are only part-time or temporary, this is a BAD thing– Those workers more than likely want permanent,
full-time jobs– Workers are probably under-employed

Types of Unemployment• Structural Unemployment
– unemployment resulting from skills that do not match what employers require
– being geographically separated from job opportunities• Cyclical Unemployment
– unemployment resulting from too low a level of aggregate demand
– a.k.a. demand deficiency unemployment– people want less => producers make less
• Frictional Unemployment– unemployment when people are temporarily
between jobs
• Seasonal Unemployment– unemployment of people who are out of work
because of factors that vary with the time of year

Economic Goal:Full Employment
– Employment of about 95% of the labor force
– Allows for 5% for frictional and seasonal unemployment
• Methods of reducing unemployment– Education and training
• Helps reduce structural unemployment
– Match skill requirements to job• Job may have unnecessarily high qualifications• Labor unions may restrict entry into jobs
– Lower minimum wage• High minimum wage can add to structural
unemployment because employers don’t want to pay that much for the job
– Increasing aggregate demand• If demand goes up, employers will hire more people so
they can increase production to meet demand
Can You Tell Which Country Is More Productive?
Total productivity = Output quantity/input quantity
Workforce productivity (often called labor productivity) is the ratio of output to the input of labor.
Workforce productivity = produced output/ labor input

Productivity is considered to be higher when either one of the following is true:
a) you produce more output with the same amount of input as before, orb) you produce the same amount of output with less input than before.
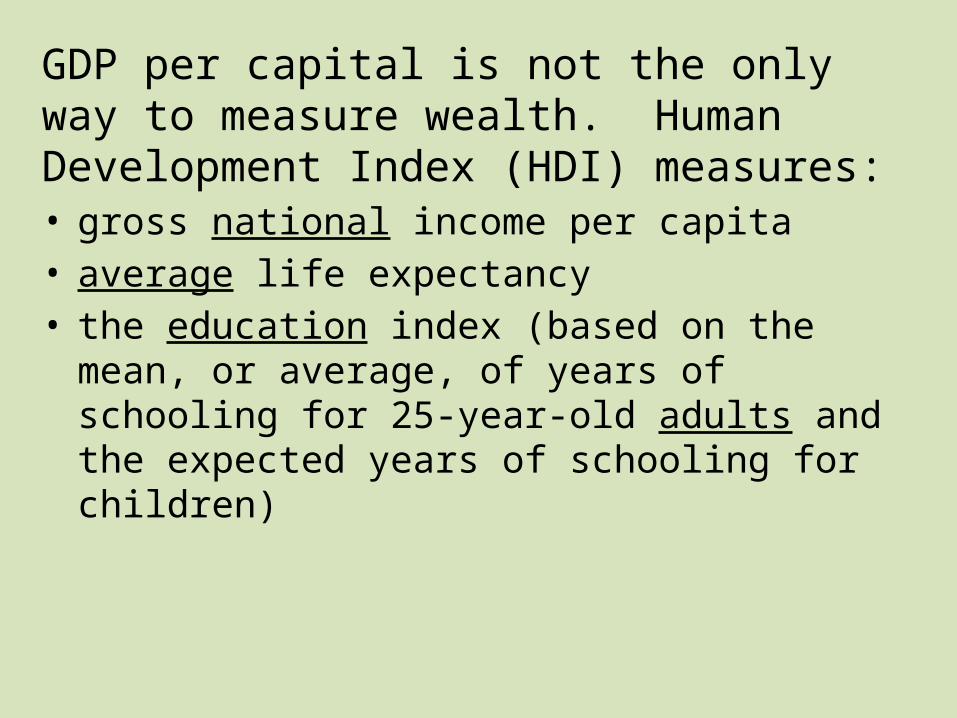
GDP per capital is not the only way to measure wealth. Human Development Index (HDI) measures:• gross national income per capita• average life expectancy• the education index (based on the mean, or average, of
years of schooling for 25-year-old adults and the expected years of schooling for children)

Based on HDI which countries are the wealthiest? Poorest?
Review
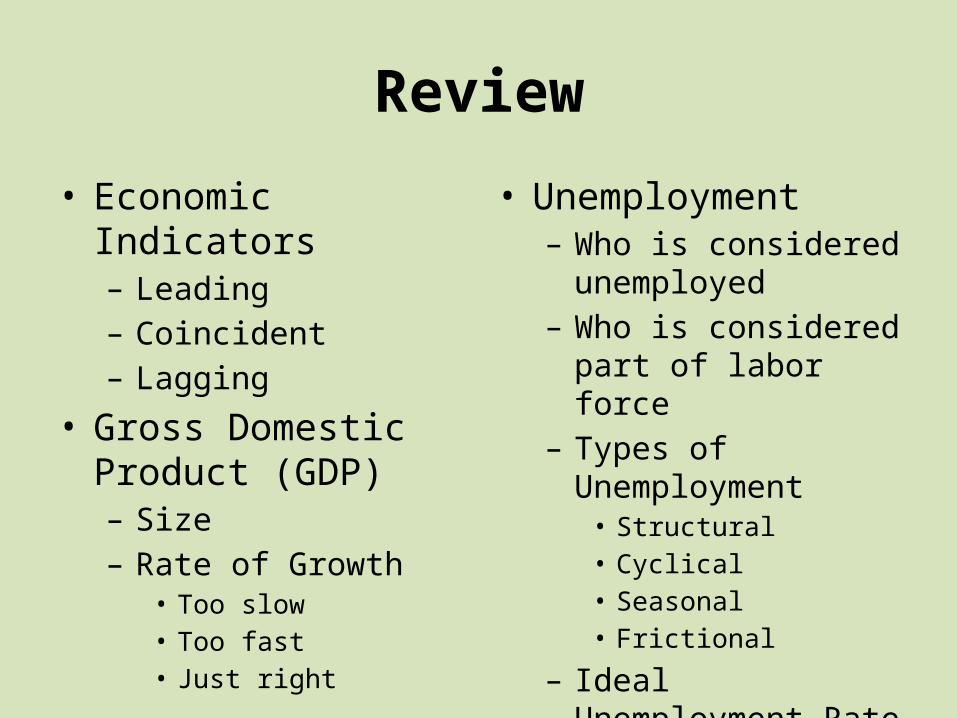
• Economic Indicators– Leading– Coincident– Lagging
• Gross Domestic Product (GDP)– Size– Rate of Growth
• Too slow• Too fast• Just right
• Unemployment– Who is considered
unemployed– Who is considered part
of labor force– Types of Unemployment
• Structural• Cyclical• Seasonal• Frictional
– Ideal Unemployment Rate

In-Class ActivityThe Mysteries of Unemployment

Inflation• A sustained rise in the general level of prices
– some prices may rise rapidly, some may rise slowly, some may actually fall
– in inflation, more prices rise than fall
• Inflation causes uncertainty in the marketplace for both consumers and businesses

Less Extreme Inflation May Actually Stimulate an Economy
• Wages rise more slowly than the prices of products
• Prices are high in relation to wages• Producers make high real profits• Production expands; more workers are hired• Workers increase spending• Quantity demanded increases• The economy prospers
• Goal inflation rate in the US: 2%
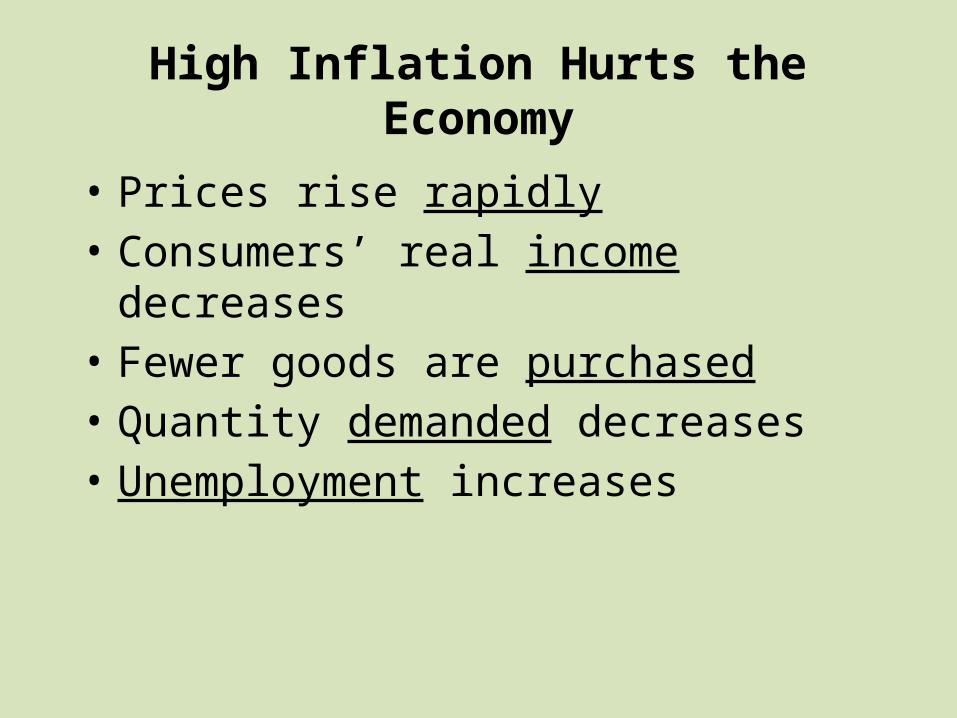
High Inflation Hurts the Economy
• Prices rise rapidly• Consumers’ real income decreases• Fewer goods are purchased• Quantity demanded decreases• Unemployment increases
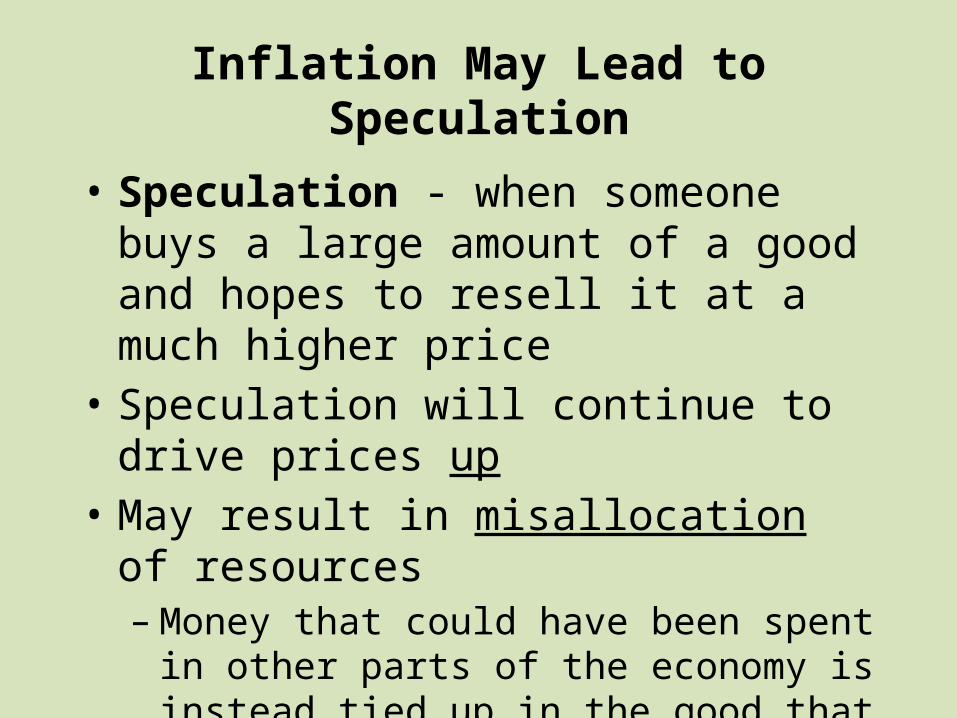
Inflation May Lead to Speculation
• Speculation - when someone buys a large amount of a good and hopes to resell it at a much higher price
• Speculation will continue to drive prices up • May result in misallocation of resources
– Money that could have been spent in other parts of the economy is instead tied up in the good that is experiencing price inflation
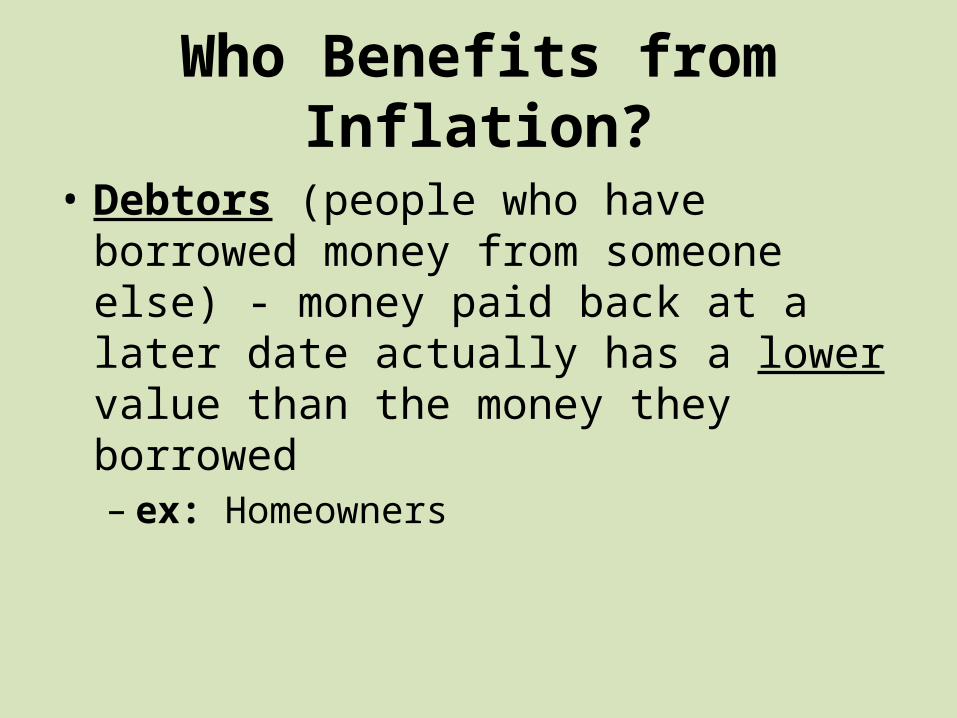
Who Benefits from Inflation?
• Debtors (people who have borrowed money from someone else) - money paid back at a later date actually has a lower value than the money they borrowed– ex: Homeowners
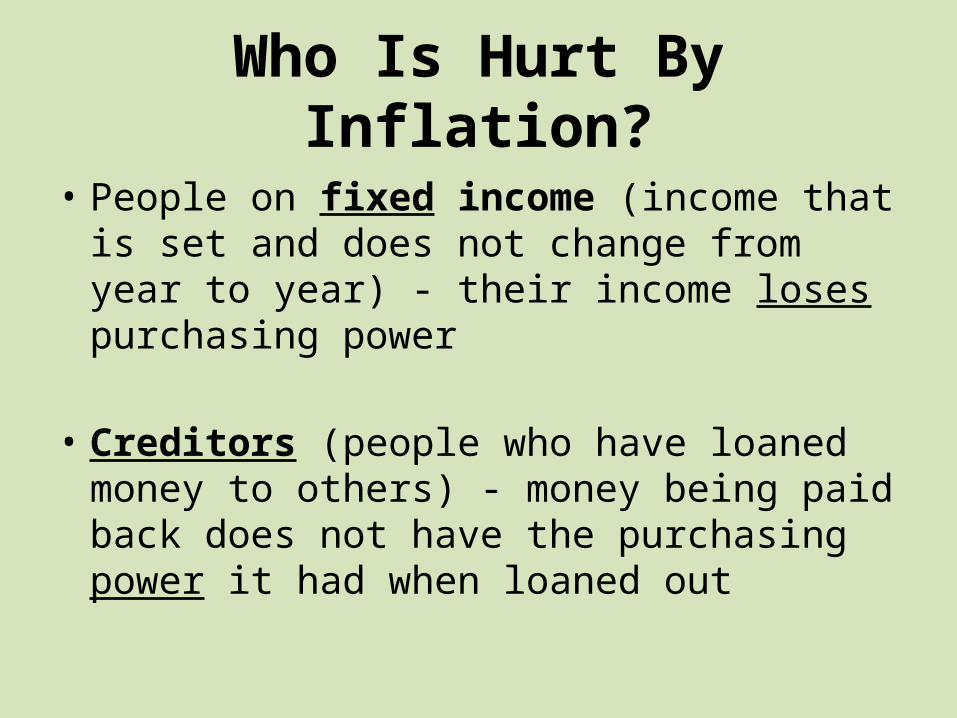
Who Is Hurt By Inflation?
• People on fixed income (income that is set and does not change from year to year) - their income loses purchasing power
• Creditors (people who have loaned money to others) - money being paid back does not have the purchasing power it had when loaned out
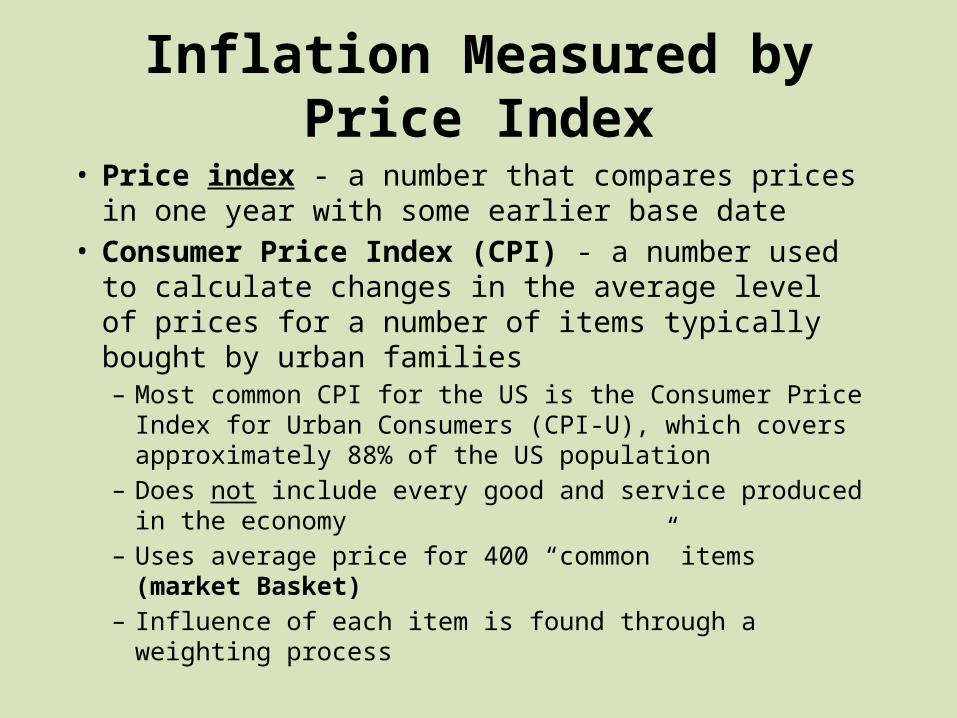
Inflation Measured by Price Index
• Price index - a number that compares prices in one year with some earlier base date
• Consumer Price Index (CPI) - a number used to calculate changes in the average level of prices for a number of items typically bought by urban families– Most common CPI for the US is the Consumer Price Index
for Urban Consumers (CPI-U), which covers approximately 88% of the US population
– Does not include every good and service produced in the economy
– Uses average price for 400 “common” items (market Basket)
– Influence of each item is found through a weighting process

How do you calculate Price Index?• To calculate the value of this market basket,
multiply the quantity of each item by its price. Then, add up the total spent on all the items in the basket.
• Market Basket (year) = (Qty × Price) + (Qty × Price) + (Qty × Price)
• Market Basket (2000) = (200 × $0.50) + (20 × $10.00) + (5 × $20.00)
• So, for the year 2000, the value of the market basket was $400.00.
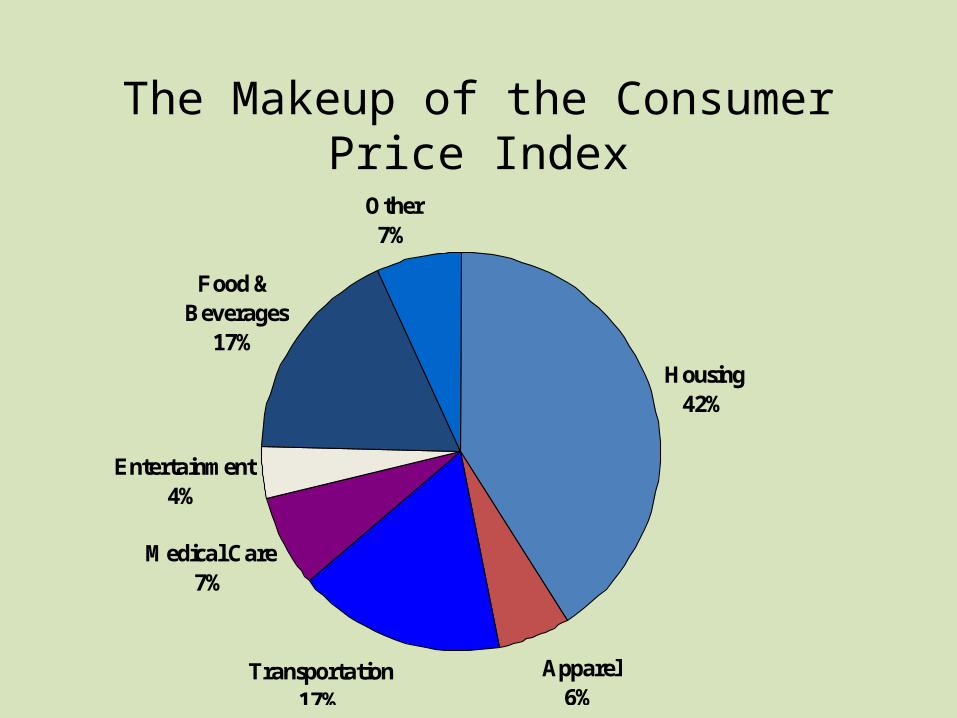
The Makeup of the Consumer Price Index
Housing42%
Apparel6%
Transportation17%
Medical Care7%
Entertainment4%
Food & Beverages
17%
Other7%
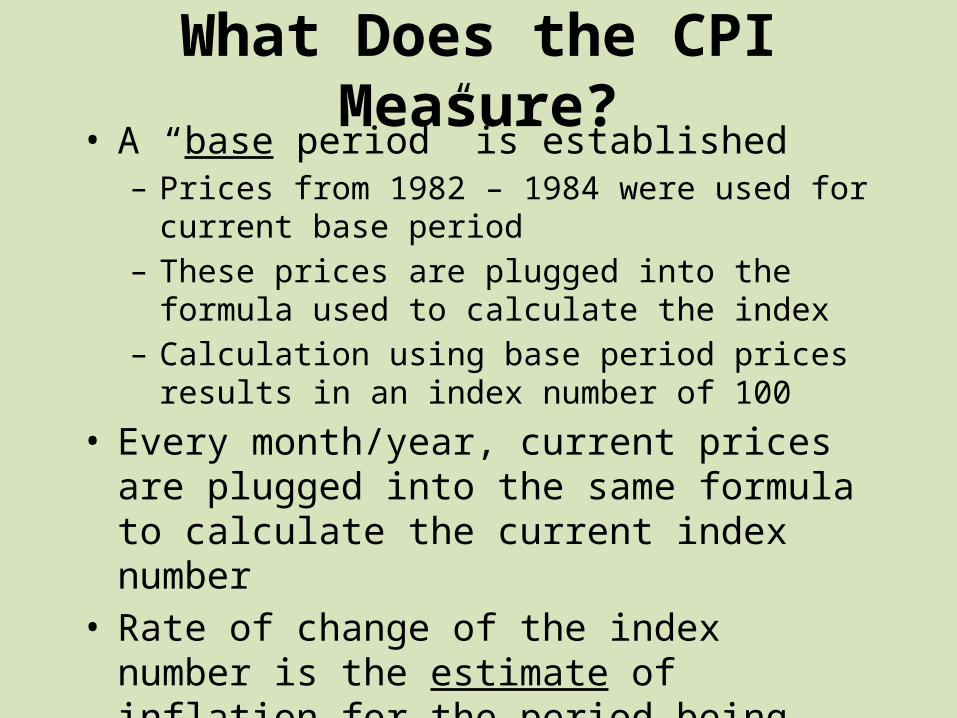
What Does the CPI Measure?• A “base period” is established
– Prices from 1982 – 1984 were used for current base period
– These prices are plugged into the formula used to calculate the index
– Calculation using base period prices results in an index number of 100
• Every month/year, current prices are plugged into the same formula to calculate the current index number
• Rate of change of the index number is the estimate of inflation for the period being calculated

How to Use the CPI to Compute the Rate of Inflation
Rate of Inflation =Most Recent CPI – Earlier CPI
Earlier CPI
=202.416 – 201.800
201.800
=0.616
201.800
= 0.003 = 0.3%
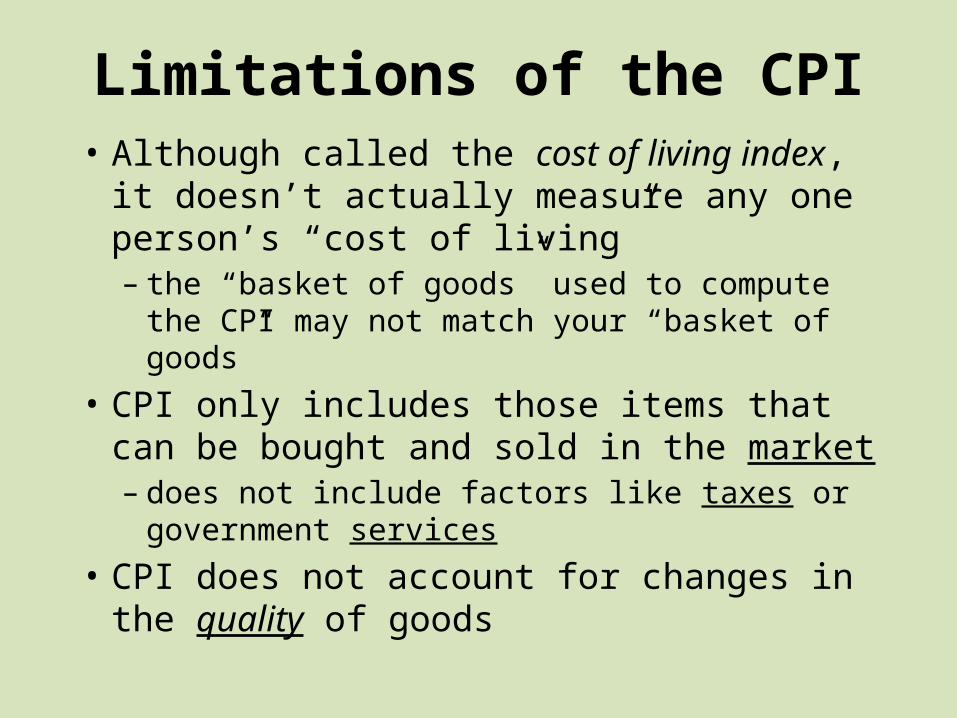
Limitations of the CPI• Although called the cost of living index, it
doesn’t actually measure any one person’s “cost of living”– the “basket of goods” used to compute the CPI
may not match your “basket of goods”• CPI only includes those items that can be
bought and sold in the market– does not include factors like taxes or
government services• CPI does not account for changes in the
quality of goods

Difference between CPI & PPI
• Another measurement is the Producer Price Index (PPI)• Calculated based on the selling prices that the producers receive
for a basket of goods. • The PPI is different from the CPI because producers not only sell
consumption goods to consumers, they also sell intermediary goods and raw materials to other producers.
• PPI could measure…• …the increased cost of cotton for clothing manufacturers.• …the increased cost of ingredients for food manufacturers.• …the increased cost of steel for machinery manufacturers.
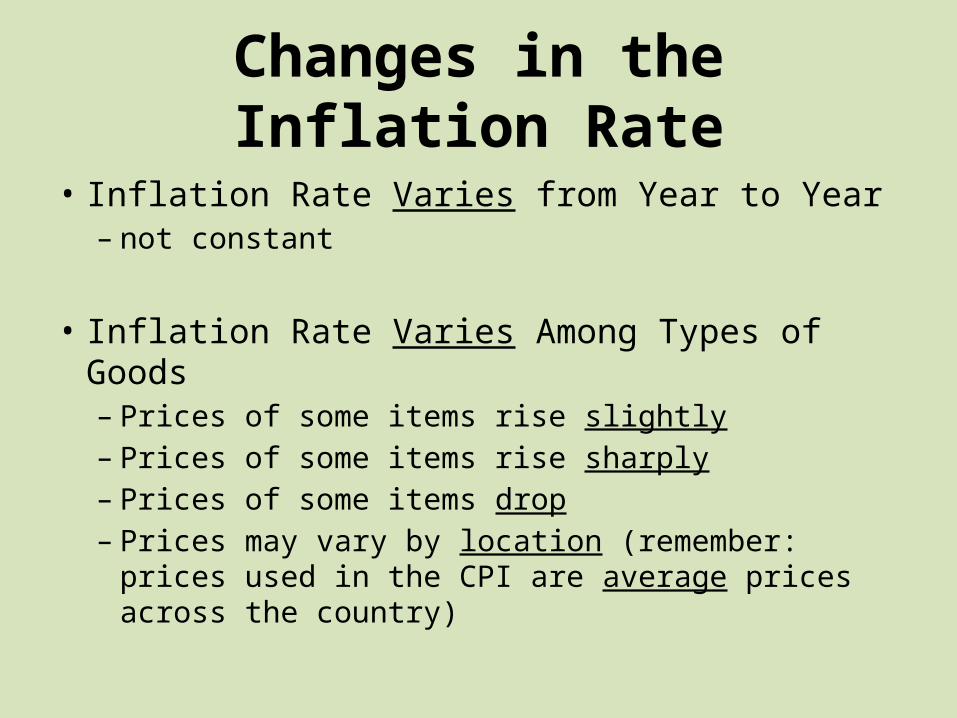
Changes in the Inflation Rate
• Inflation Rate Varies from Year to Year– not constant
• Inflation Rate Varies Among Types of Goods– Prices of some items rise slightly– Prices of some items rise sharply– Prices of some items drop– Prices may vary by location (remember: prices used
in the CPI are average prices across the country)
In-Class AssignmentThe Effects of Inflation
Business Cycle
• Pattern of repeated expansion and contraction of a country’s GDP
• Passes through four phases
Phases of the Business Cycle
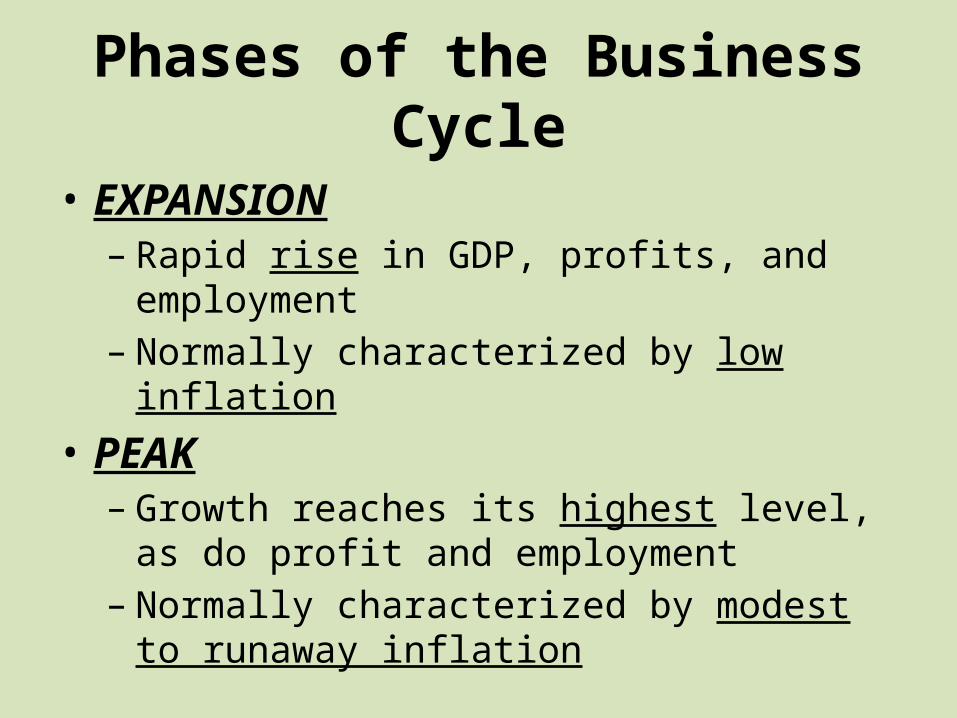
• EXPANSION– Rapid rise in GDP, profits, and employment– Normally characterized by low inflation
• PEAK– Growth reaches its highest level, as do profit and
employment– Normally characterized by modest to runaway
inflation
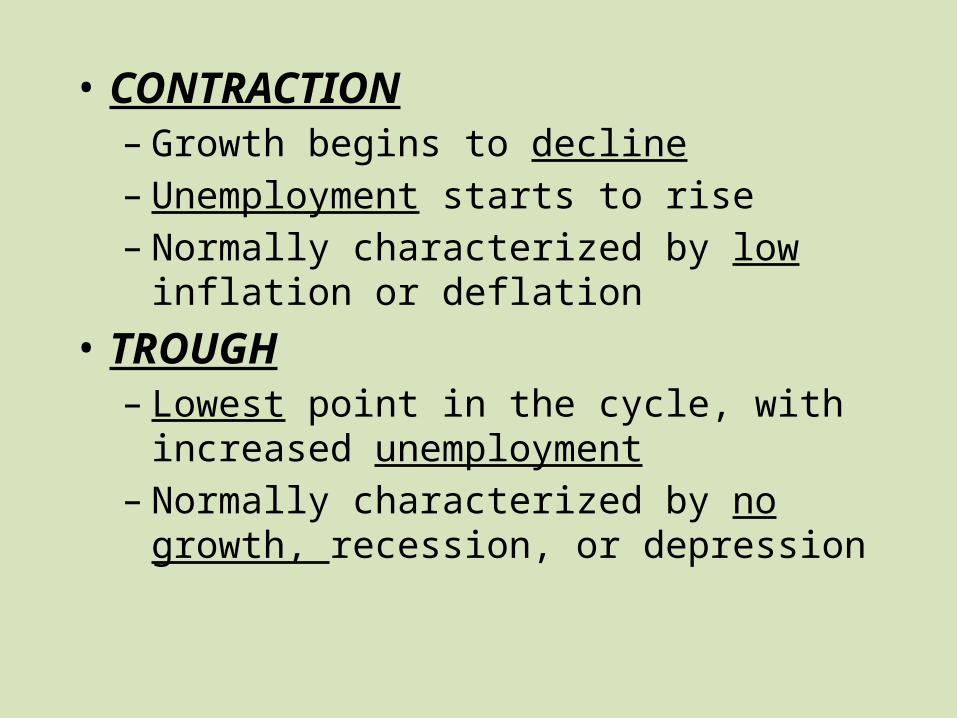
• CONTRACTION– Growth begins to decline– Unemployment starts to rise– Normally characterized by low inflation or
deflation• TROUGH
– Lowest point in the cycle, with increased unemployment
– Normally characterized by no growth, recession, or depression

Time
GDP(rate of change)
TROUGHEXPANSION
Rapid rise in:- GDP- Profits- - EmploymentUsually has Low inflation
PEAK
Highest levels of:- GDP- Profits- - EmploymentUsually has Moderate to runaway inflation
CONTRACTION
- GDP begins decline- - unemployment risesUsually hasLow inflation or deflation
Lowest levels of:- GDP- Profits- EmploymentReferred to asNo GrowthRecessionDepression
Recessions & Depressions
• Recession – a period of declining economic activity usually measured as a decrease in GDP for at least two consecutive quarters (6 months)
• Depression – a prolonged economic downturn characterized by plunging real GDP and extremely high unemployment

In-Class AssignmentEconomic Ups & Downs
Review
• Inflation– Who is helped– Who is harmed– Speculation– Consumer Price Index
• What makes it up• Problems with calculation
– Ideal Inflation Rate
• Business Cycle– Expansion– Peak– Contraction– Trough

LeadingEconomic Indicators
• Different aspects of economic activity that are believed to indicate the direction the economy is heading– Supposed to predict economic activity for the next 6
months
• Positive trends in these indicators are supposed to indicate the economy is improving
• Negative trends in these indicators are supposed to indicate the economy is worsening
Main Leading Economic Indicators
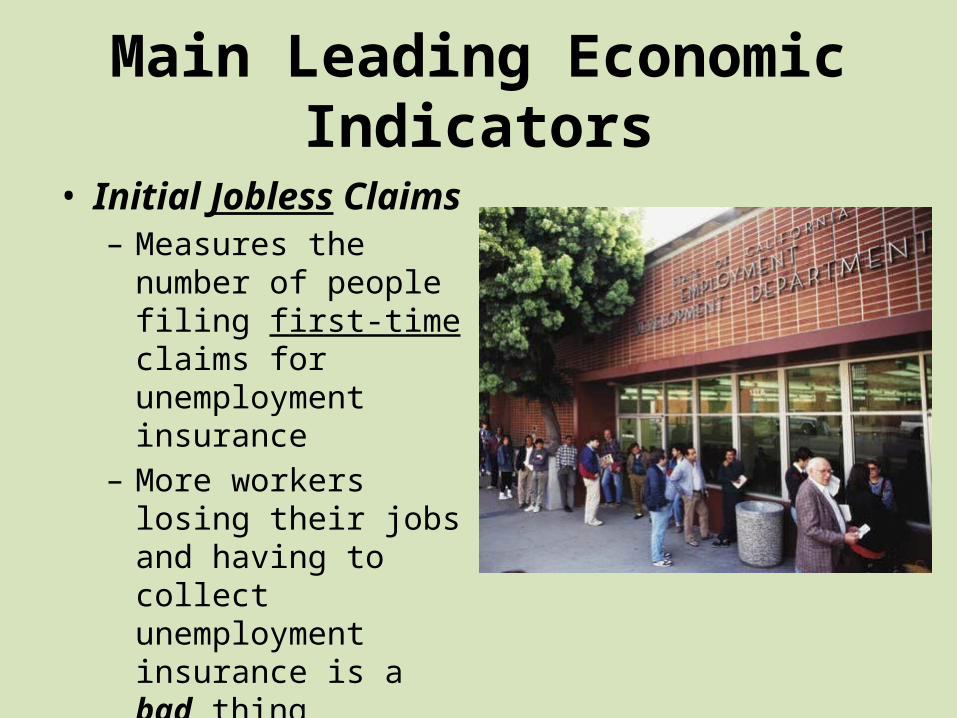
• Initial Jobless Claims– Measures the number of
people filing first-time claims for unemployment insurance
– More workers losing their jobs and having to collect unemployment insurance is a bad thing
– Indicates production of goods & services is going down
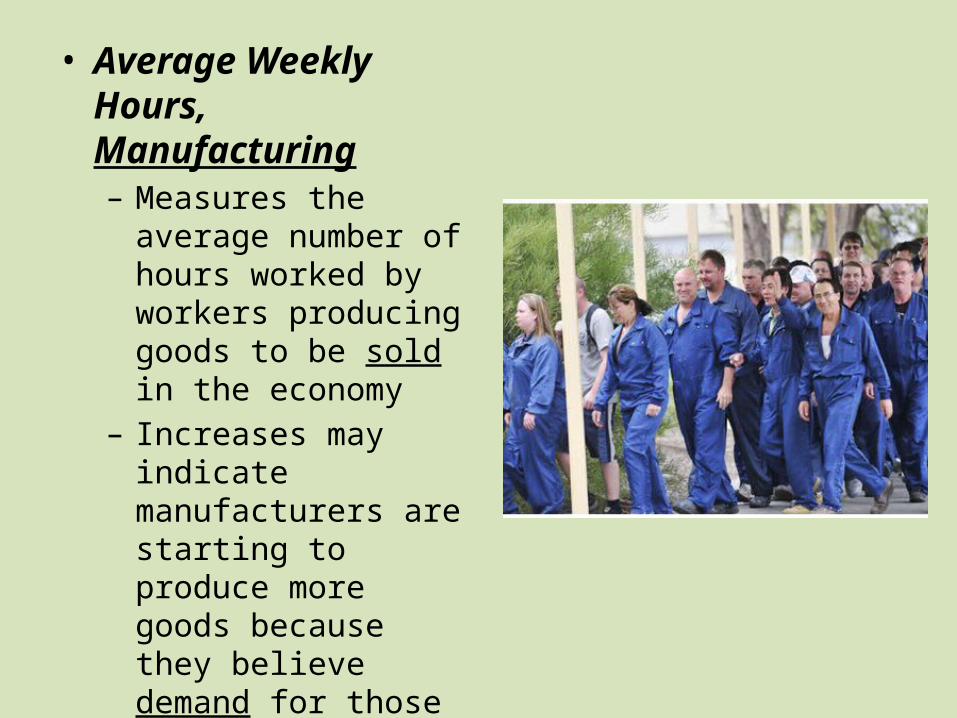
• Average Weekly Hours, Manufacturing– Measures the average
number of hours worked by workers producing goods to be sold in the economy
– Increases may indicate manufacturers are starting to produce more goods because they believe demand for those goods is increasing

• Manufacturer’s New Orders – Consumer Goods & Materials– Measures changes in
the level of orders made by retailers for goods to be purchased by consumers
– Increases could indicate expected in increase in consumer demand by retailers
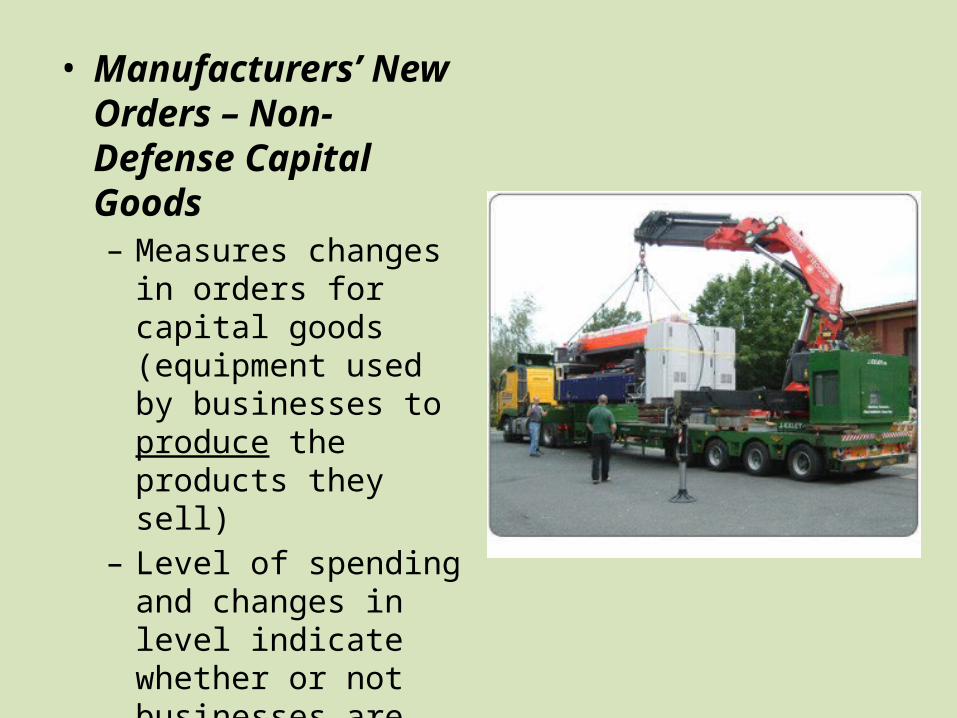
• Manufacturers’ New Orders – Non-Defense Capital Goods– Measures changes in
orders for capital goods (equipment used by businesses to produce the products they sell)
– Level of spending and changes in level indicate whether or not businesses are replacing or adding equipment to increase production
• Institute for Supply Management (ISM) Index of New Orders– Survey of purchasing
executives of roughly 300 industrial companies
– Considered single best snapshot of factory sector health

• Building Permits – New Private Housing Units– Measures level of
residential construction permits being issued
– Housing construction is major part of US economy
– Increases in construction will have major impacts on the economy
• Stock Prices – Standard & Poor’s 500 (S&P 500)– Major stock index that is
believed to represent the health of the stock market as a whole
– Many believe that the stock market tends to go up before the economy starts improving, making it a good predictor of changes coming in the economy
• Leading Credit Index– Developed by an
organization called The Conference Board
– Measures changes in the financial and credit markets
– Changes to conditions in financial markets will impact businesses’ ability to gain access to credit in the near future, which will impact those businesses’ ability to expand
• Interest Rate Spread – Treasury Less Federal Funds– Difference between interest rate on
10-year Treasury Bonds and the Federal Funds Rate (the interest rate banks charge each other for overnight loans to each other)
– If investors are worried about economic downturns, they will usually sell off their short-term bonds and buy longer-term bonds to protect against short-term losses, driving the rate of return on the long-term bonds down
– This spread, if negative, usually signals the beginning of a recession

• Average Consumer Expectations for Business Conditions– Measured in the
Consumer Confidence Index
– Judges the mood of consumers toward the future of the economy
– Confidence in the economy tends to lead toward increased spending in the economy
Coincident Economic Indicators• Gross Domestic Product (GDP)• Employees on Non-Agricultural Payrolls
– Reflects net hiring and firing in all sectors but agricultural and the smallest businesses
– Considered one of the biggest gauges in measuring the health of the economy
• Index of Industrial Production– Covers physical output at all stages of production
in all industries– Index historically has captured the majority of
fluctuations in output
• Manufacturing & Trade Sales– When combined with retail spending by
consumers, this measures all spending within the economy
• Personal Income Less Transfer Payments– Transfer Payment – payment that involves no
economic activity• Social Security• Welfare• Unemployment
– Measures personal income due to economic activity
Lagging Economic Indicators
• Unemployment• Inflation• Commercial & Industrial Loans Outstanding
– Measures loans being taken out by businesses– Since businesses normally need to borrow more
during times of reduced profit, these loans normally go up after the businesses experience reduced profits
• Ratio of Consumer Installment Credit to Personal Income– Consumers tend to hold off on getting personal
loans until after a recession ends– Ratio will go up when consumers are more
confident about the future, which will occur after the change
• Average Prime Rate Charged by Banks– The key rate on which banks base all of their other
loan rates– Changes in this rate tend to lag behind movement
of general economic activities• Others
In-Class AssignmentThe Current Indexes of
Economic Indicators

In-Class ActivityQueue Blues at the Central Store

A little bit more

World Bank and International Monetary Fund (IMF)
• Founded in 1944 to help rebuild the world's economy after World War II.
• IMF goals today are to alleviating world poverty by providing financial assistance and encouraging investment by allowing countries to borrow money.
• The World Bank loans money to low-income countries to complete specific projects. For example, a country that wants to improve its education system might get a loan from the World Bank to build new schools and train new teachers

Hyperinflation
• Most economies have some inflation each year. For example, the U.S. economy's inflation rate has varied from about 2% to 6% per year since 1990. But what if a country experiences a rapidly increasing inflation rate? This type of "out of control" inflation, known as hyperinflation, usually is very harmful to an economy.
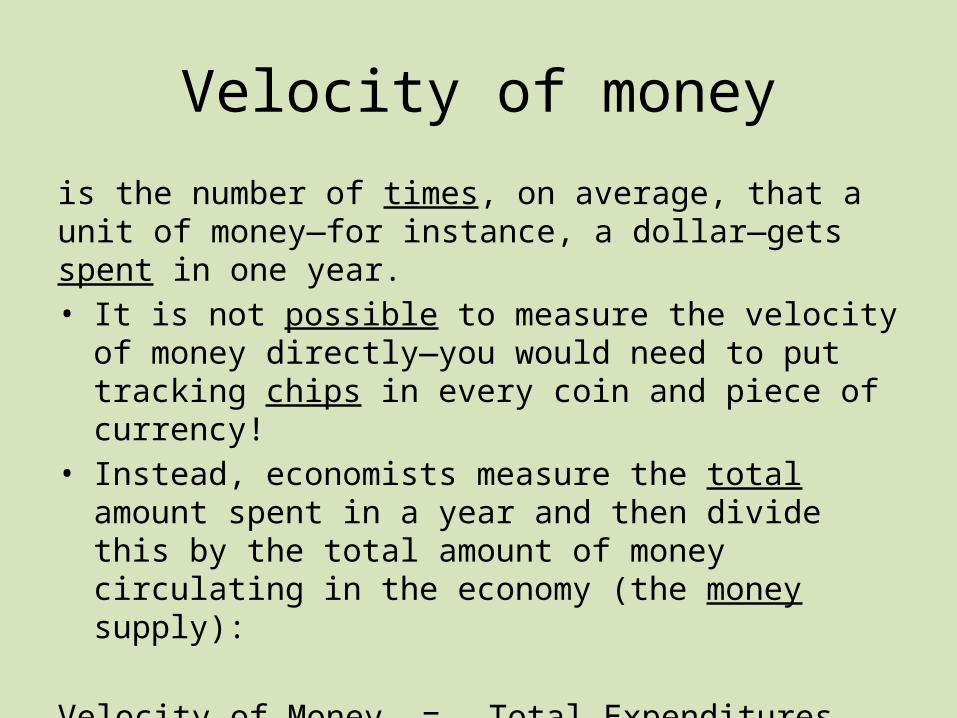
Velocity of money
is the number of times, on average, that a unit of money—for instance, a dollar—gets spent in one year.• It is not possible to measure the velocity of money directly—
you would need to put tracking chips in every coin and piece of currency!
• Instead, economists measure the total amount spent in a year and then divide this by the total amount of money circulating in the economy (the money supply):
Velocity of Money = Total Expenditures ——————————
Money Supply


