
Unit 1: MoneyUnit 1: Money
Interest RatesInterest Rates9/16/20109/16/2010

DefinitionsDefinitionsinterest rate interest rate –
the price of time(not the price of money)
price paid for rental of funds
yield to maturity yield to maturity –interest rate that equates the present valueof payments received from a credit market
instrument with its value today

present discounted value (PDV) present discounted value (PDV) –today’s value of future payment
cash flows cash flows –cash payments to holder of a security
bond bond –debt security with periodic payments
for a specified period of time
DefinitionsDefinitions

Credit Market InstrumentsCredit Market InstrumentsTypes of credit market instruments• simple loan • fixed-payment loan (fully amortized loan)• discount bond (zero-coupon bond)• coupon bond

Simple LoanSimple Loan
simple loan simple loan –lender provides funds to borrower;at the maturity date the principal
plus additional interest is due

Simple LoanSimple Loan
PV = FV/(1 + i)n
PV ≡ present valueFV ≡ future value (or CF for cash flow)i ≡ yield to maturity (or interest rate)n ≡ time to maturity (usually in years)
FV = PV(1 + i)n

Fixed-Payment LoanFixed-Payment Loan
fixed-payment loan fixed-payment loan –lender provides funds to borrower;
funds are repaid by making thesame payment every period withpart of the principal plus interest
for a set number of years

Fixed-Payment LoanFixed-Payment LoanPV = FP/(1 + i)1 + FP/(1 + i)2 +
FP/(1 + i)3 + … + FP/(1 + i)n
PV ≡ present valueFP ≡ future paymenti ≡ interest raten ≡ time to maturity (usually in years)

Fixed-Payment LoanFixed-Payment LoanPV = FP/(1 + i)1 + FP/(1 + i)2 +
FP/(1 + i)3 + … + FP/(1 + i)n
PV = [FP/(1 + i)] [1 + 1/(1 + i)1 + 1/(1 + i)2 + … + 1/(1 + i)n-1]
The second term (1 + 1/(1 + i)1 + etc.) is the present value of an ordinary annuity. It can be found in tables on the Internet and in the back of financial and accounting textbooks for values of i and n.

Present Value of Ordinary AnnuityPresent Value of Ordinary Annuity

Discount BondDiscount Bond
discount bond (zero-coupon bond) discount bond (zero-coupon bond) –bought at a price below face value;face value repaid on maturity date

Discount BondDiscount Bond
PV = FV/(1 + i)n
PV ≡ present valueFV ≡ future value (or CF for cash flow)i ≡ yield to maturity (or interest rate)n ≡ time to maturity (usually in years)

Discount BondDiscount Bond
i = (F - P)/PP ≡ current price of bondF ≡ face value of bondP = PVF = FVn = 1 (maturity in 1 year)
PV = FV/(1 + i)n
P = F/(1 + i)1
P + Pi = FPi = F - Pi = (F – P)/P

Coupon BondCoupon Bond
coupon bond coupon bond –pays the owner of the bond a fixed
interest payment (coupon payment)every period until the maturity date
when face value is repaid

Coupon BondCoupon BondPV = FV/(1 + i)n + C/(1 + i)1 +
C/(1 + i)2 + … + C/(1 + i)n
PV ≡ present valueFV ≡ future valueC ≡ coupon paymenti ≡ interest raten ≡ time to maturity (usually in years)

Coupon BondCoupon BondPV = FV/(1 + i)n + C/(1 + i)1 +
C/(1 + i)2 + … + C/(1 + i)n
PDV of bond selling pricePDV of coupon payments
Coupon payments calculation can be simplified using ordinary annuity tables.

ConsolConsol
consol (perpetuity) consol (perpetuity) –a coupon bond with no maturity
date and no repayment of principal

FV = 0n = ∞
PV = C/(1 + i)1 + C/(1 + i)2 + … + C/(1 + i)∞
PV = C[1/(1 + i)1 + 1/(1 + i)2 + … + 1/(1 + i)∞]PV = C[1/i] = C/iPc = C/iC
ConsolConsol
PC = C/iC

Rate of ReturnRate of Return
R = iC + gR ≡ rate of returniC ≡ current yieldg ≡ rate of capital gain
Rate of return for 1 year.

BondsBondsInsights• rise in interest rates → fall in bond prices i↑ → PB↓• prices and returns more volatile for long term bonds than short term bonds• even bonds with huge interest rates can have negative returns if interest rates rise• when holding periods don’t match maturity periods, there is interest rate risk

Fisher EquationFisher Equation
i = r + πe
i ≡ nominal interest rater ≡ real interest rateπe ≡ expected inflation
The Fisher equation shows that lenders need to build in expected inflation to get the returns they want.

Fisher EquationFisher Equation
i = r + πe
This is a simplified approximate form.(1 + i) = (1 + r)(1 + πe)1 + i = 1 + r + πe + rπe
i = r + πe + rπe
rπe ≈ 0i = r + πe

Bond DemandBond DemandDeterminates of Bond Demand• wealth: W↑ → BD↑• expected returns: Re↑ → BD↑• risk or uncertainty: risk↑ → BD↓• liquidity: liquidity↑ → BD↑

Bond SupplyBond SupplyDeterminates of Bond Supply• profitability of investments: I profitability↑ → BS↑• expected inflation: πe↑ → BS↑• government deficit: (G – T)↑ → BS↑

Graphical VersionGraphical Version
PB
B
BD
BS
Bond market:stock analysis

Graphical VersionGraphical VersionBond demand
W↑ → BD↑ → PB↑
higher wealthshifts the BD curve out
move along BS
price of bonds goes up
PB
PB1
PB2
BD'
B
BD
BS

Graphical VersionGraphical VersionBond demand
ie↓ → Re↑ →BD↑ → PB↑
lower expectedinterest rate
raise expected returnsshifts the BD curve out
move along BS
price of bonds goes up
PB
PB1
PB2
BD'
B
BD
BS

Graphical VersionGraphical VersionBond demand
πe↓ → Re↑ →BD↑ → PB↑
lower expected inflation
raise expected returnsshifts the BD curve out
move along BS
price of bonds goes up
PB
PB1
PB2
BD'
B
BD
BS

Graphical VersionGraphical VersionBond demand
risk↓ → BD↑ → PB↑
lower riskinessraise expected returnsshifts the BD curve out
move along BS
price of bonds goes up
PB
PB1
PB2
BD'
B
BD
BS

Graphical VersionGraphical VersionBond demand
liquidity↑ →BD↑ → PB↑
higher liquidityshifts the BD curve out
move along BS
price of bonds goes up
PB
PB1
PB2
BD'
B
BD
BS

Graphical VersionGraphical VersionBond supply
I profit↑ →BS↑ → PB↓
higher investment profitability
shifts the BS curve outmove along BD
price of bondsgoes down
PB
PB1PB2
B
BD
BS
BS'

Graphical VersionGraphical VersionBond supply
πe↑ →BS↑ → PB↓
higher expected inflation
shifts the BS curve outmove along BD
price of bondsgoes down
PB
PB1PB2
B
BD
BS
BS'
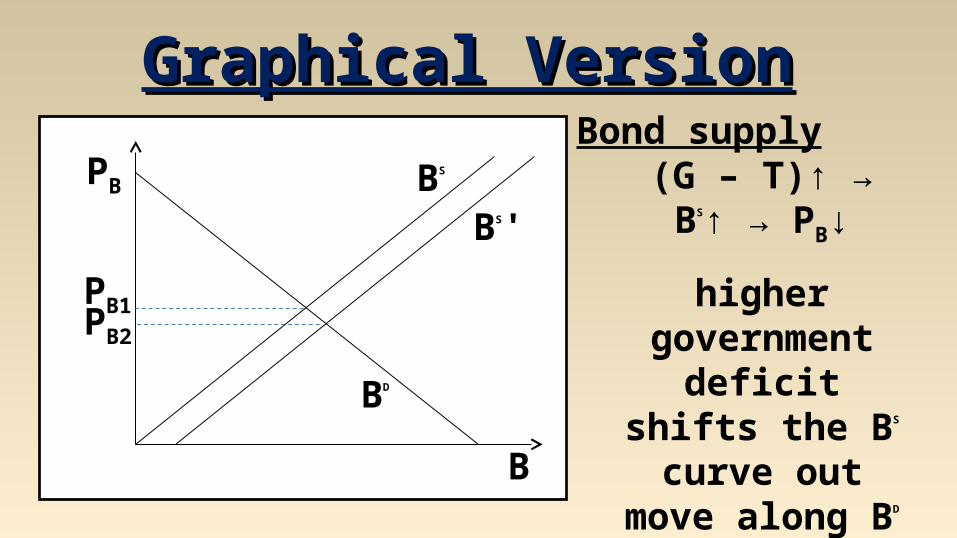
Graphical VersionGraphical VersionBond supply
(G – T)↑ →BS↑ → PB↓
higher government deficit
shifts the BS curve outmove along BD
price of bondsgoes down
PB
PB1PB2
B
BD
BS
BS'

Graphical VersionGraphical Version
Graphical notes• Some factors influence both supply and demand (e.g., expected inflation)• bond price and the interest rate are inversely related, so when we see bond price go down that means interest rate goes up

Graphical VersionGraphical Version
i
L/time
LD
LS
Bond market:flow analysis
The same factors that effect the
stock bond market will effect the flow
bond market.

Graphical VersionGraphical Versionflow analysis
iH to iL is the bid/ask spread
at La not Le due to transactions costs
i
L/time
LD
LS
iH
iL
La Le
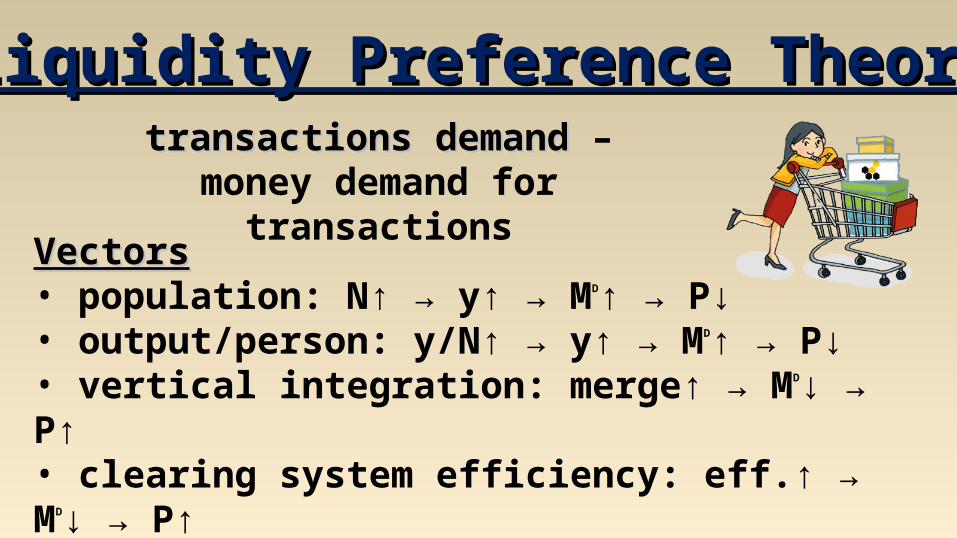
Liquidity Preference TheoryLiquidity Preference Theorytransactions demand transactions demand –
money demand for transactions
VectorsVectors• population: N↑ → y↑ → MD↑ → P↓• output/person: y/N↑ → y↑ → MD↑ → P↓• vertical integration: merge↑ → MD↓ → P↑• clearing system efficiency: eff.↑ → MD↓ → P↑

Liquidity Preference TheoryLiquidity Preference TheoryVectorsVectors• population: e.g., black death, baby boom• output/person: e.g., Internet revolution (productivity)• vertical integration: e.g., oil company buys gas stations• clearing system efficiency: e.g., credit card use

Liquidity Preference TheoryLiquidity Preference Theoryportfolio demand portfolio demand –
money demand as a store of value(captures precautionary and speculative)
VectorsVectors• wealth: W↑ → MD↑ → P↓• uncertainty: uncertainty↑ → MD↑ → P↓• interest differential: i↑ → MD↓ → P↑• anticipations about inflation: πe↓ → MD↑ → P↓

Liquidity Preference TheoryLiquidity Preference TheoryVectorsVectors• wealth: e.g., win the lottery• uncertainty: e.g., travel to a foreign country• interest differential: i.e., interest rate soars• anticipations about inflation: e.g., print money non-stop

Graphical VersionGraphical Version
MD
MS
i
M

Interest RateInterest Rate
Effects on interest rate• liquidity effect: MS↑ → i↓• income effect: MS↑ → W↑, y↑ → i↑• price-level effect: MS↑ → P↑ → i↑• fisher effect: MS↑ → πe↑ → i↑
Keynes talked about the liquidity effect. Friedman rebutted him by noticing the other secondary effects.

i
timeA B
Interest RateInterest RateA• liquidity effect
B• income effect• price-level effect• fisher effect
liquidity effect larger

i
timeA B
Interest RateInterest RateA• liquidity effect
B• income effect• price-level effect• fisher effect
liquidity effect smallerslow adjustment

i
timeA B
Interest RateInterest RateA• liquidity effect• fisher effect
B• income effect• price-level effect
liquidity effect smallerfast adjustment


