Download - Undergraduate Research: Critical Thinking in Action Lynn Grinnell, PhD College of Business

Undergraduate Research:
Critical Thinking in Action
Lynn Grinnell, PhDCollege of Business
Agenda
• Background: Why is primary research an awesome way to teach critical thinking?
• Case study: Market research in Sustainable Business Strategies
• Activity: Develop an undergraduate research projects
SPC’s Critical Thinking Definition
• CASPER– Communication– Analysis– Synthesis– Problem-solving– Evaluation– Reflection
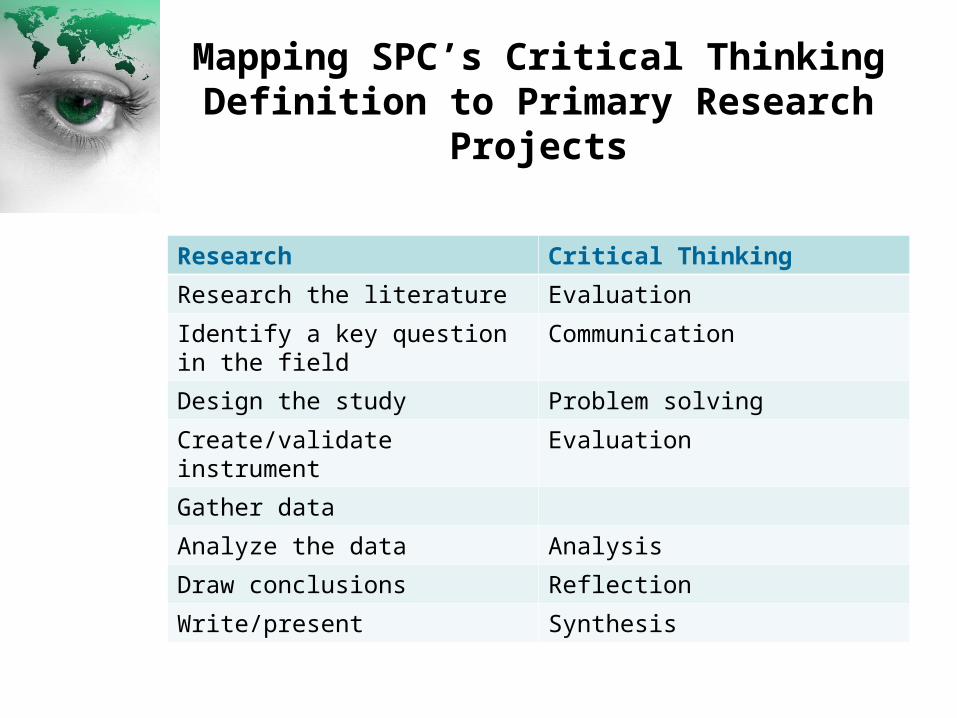
Mapping SPC’s Critical Thinking Definition to Primary Research
Projects
Research Critical Thinking
Research the literature Evaluation
Identify a key question in the field
Communication
Design the study Problem solving
Create/validate instrument Evaluation
Gather data
Analyze the data Analysis
Draw conclusions Reflection
Write/present Synthesis
CASE STUDY
Team Project:Market Research on Mass Transit
Prior Research: What works in products
• Saving money • Convenience• Perceived quality• Personal relationships• Technology and innovation• Solutions that work, not that
sound good
From: Convincing the Unconvinced
Prior Research: What works in policy
language• Independence• Personal responsibility
– Helping people personally• Integrity and ethics • Stewardship• Local solutions• Limited, not big, government
solutions• Concern about
– Costs– Next generation– Personal health
From: Convincing the Unconvinced
Key Questions
• If prior research (focus group) shows Participants Agree/Strongly agree:– Alternatives to cars– Reduce gasoline use– Reduce use of natural resources– Reduce waste
• Then why do the affluent not ride mass transit? (e.g., buses)
• What features/benefits would convince them to ride the bus?
• Primary research • Questionnaires/surveys• One-to-one interviews• Telephone interviews• Focus groups• Blogs
– Bottom line – what sells?
• Secondary– Strategies for the Green Economy EarthJustice
market research– Convincing the Unconvinced: presentation to
Sustainable Florida conference– Information from already published sources: Books,
journals, papers, libraries, Internet
Green Marketing Research:Research Methods
From: Green Business Practices for Dummies
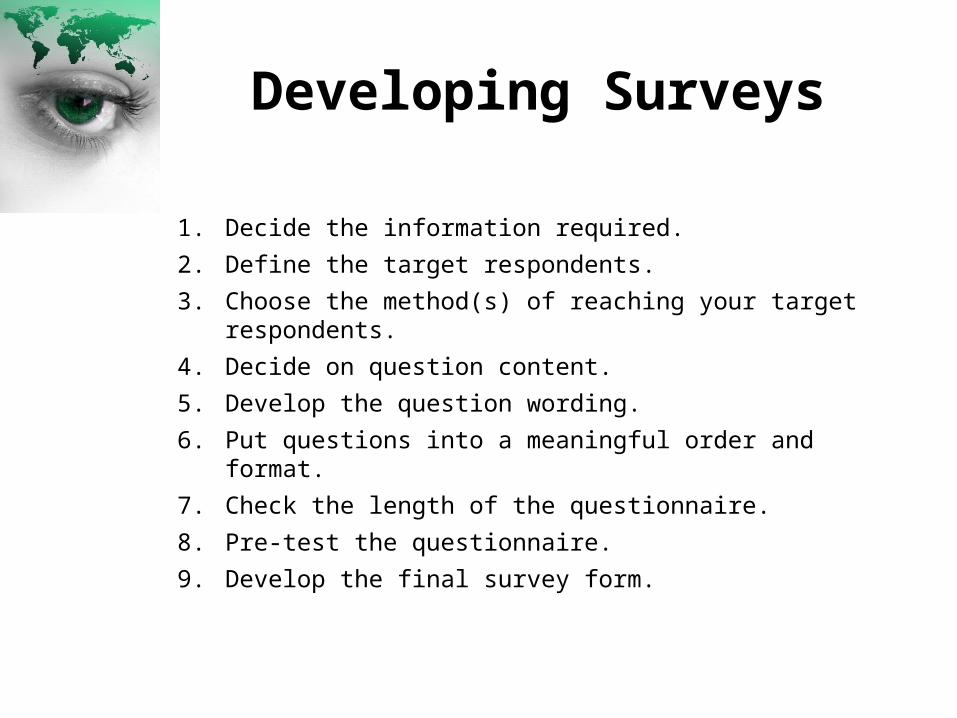
Developing Surveys
1. Decide the information required.
2. Define the target respondents.
3. Choose the method(s) of reaching your target respondents.
4. Decide on question content.
5. Develop the question wording.
6. Put questions into a meaningful order and format.
7. Check the length of the questionnaire.
8. Pre-test the questionnaire.
9. Develop the final survey form.
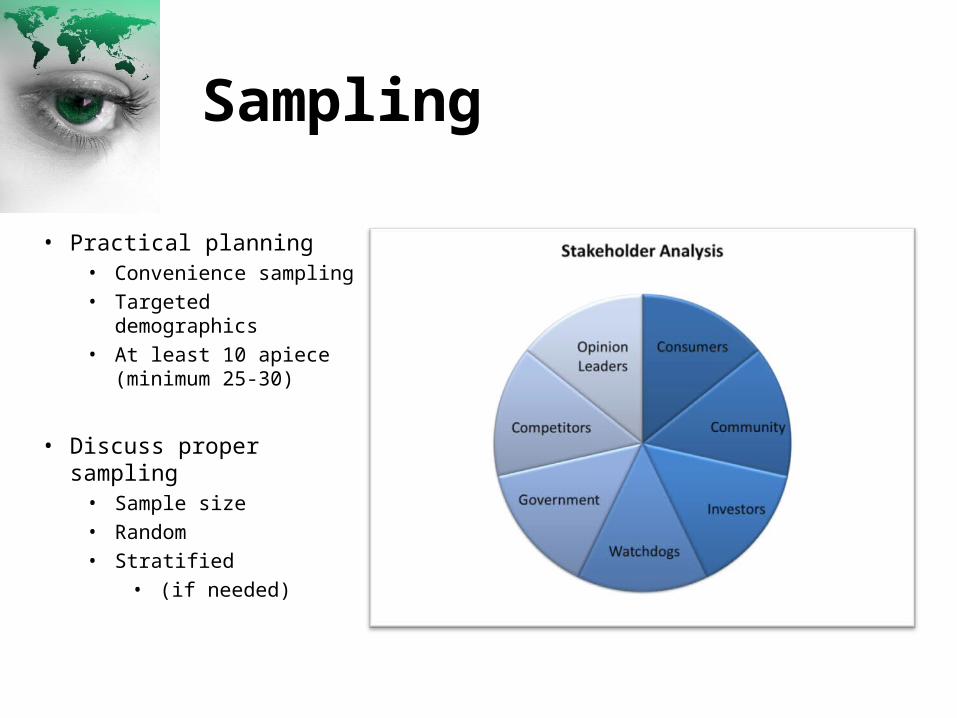
Sampling
• Practical planning• Convenience sampling• Targeted
demographics• At least 10 apiece
(minimum 25-30)
• Discuss proper sampling• Sample size• Random• Stratified
• (if needed)
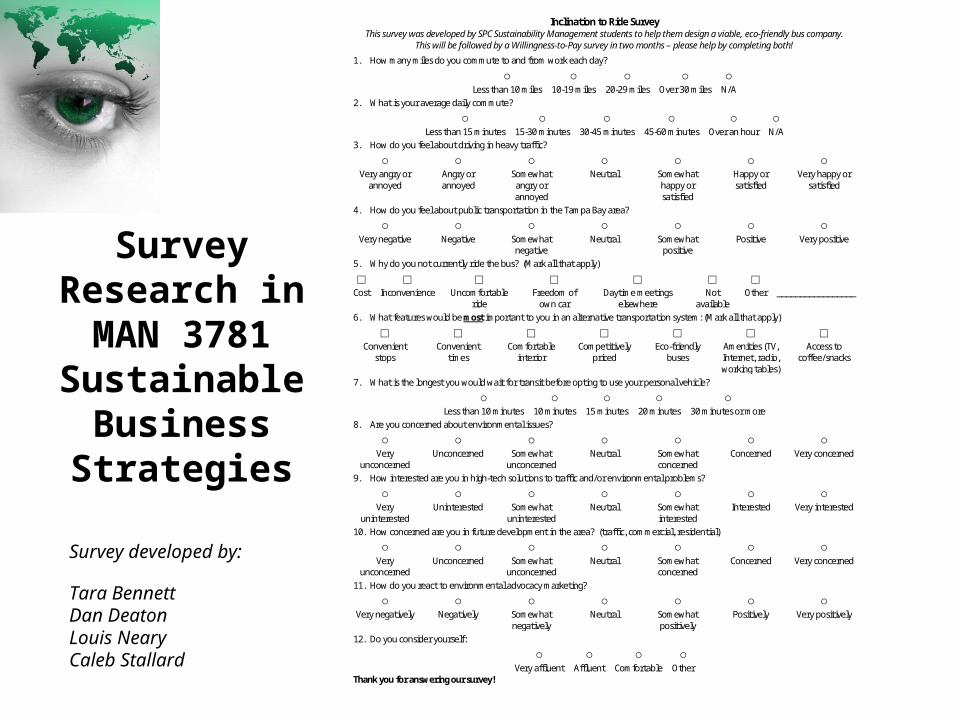
Survey Research in MAN 3781
Sustainable Business
Strategies
Inclination to Ride Survey This survey was developed by SPC Sustainability Management students to help them design a viable, eco-friendly bus company.
This will be followed by a Willingness-to-Pay survey in two months – please help by completing both!
1. How many miles do you commute to and from work each day?
○ ○ ○ ○ ○ Less than 10 miles 10-19 miles 20-29 miles Over 30 miles N/A
2. What is your average daily commute?
○ ○ ○ ○ ○ ○ Less than 15 minutes 15-30 minutes 30-45 minutes 45-60 minutes Over an hour N/A
3. How do you feel about driving in heavy traffic?
○ ○ ○ ○ ○ ○ ○ Very angry or
annoyed Angry or annoyed
Somewhat angry or annoyed
Neutral Somewhat happy or satisfied
Happy or satisfied
Very happy or satisfied
4. How do you feel about public transportation in the Tampa Bay area?
○ ○ ○ ○ ○ ○ ○ Very negative Negative Somewhat
negative Neutral Somewhat
positive Positive Very positive
5. Why do you not currently ride the bus? (Mark all that apply)
□ □ □ □ □ □ □ Cost
Inconvenience Uncomfortable
ride Freedom of
own car Daytime meetings
elsewhere Not
available Other _________________
6. What features would be most important to you in an alternative transportation system: (Mark all that apply)
□ □ □ □ □ □ □ Convenient
stops Convenient
times Comfortable
interior Competitively
priced Eco-friendly
buses Amenities (TV, Internet, radio, working tables)
Access to coffee/snacks
7. What is the longest you would wait for transit before opting to use your personal vehicle?
○ ○ ○ ○ ○ Less than 10 minutes 10 minutes 15 minutes 20 minutes 30 minutes or more
8. Are you concerned about environmental issues?
○ ○ ○ ○ ○ ○ ○ Very
unconcerned Unconcerned Somewhat
unconcerned Neutral Somewhat
concerned Concerned Very concerned
9. How interested are you in high-tech solutions to traffic and/or environmental problems?
○ ○ ○ ○ ○ ○ ○ Very
uninterested Uninterested Somewhat
uninterested Neutral Somewhat
interested Interested Very interested
10. How concerned are you in future development in the area? (traffic, commercial, residential)
○ ○ ○ ○ ○ ○ ○ Very
unconcerned Unconcerned Somewhat
unconcerned Neutral Somewhat
concerned Concerned Very concerned
11. How do you react to environmental advocacy marketing?
○ ○ ○ ○ ○ ○ ○ Very negatively Negatively Somewhat
negatively Neutral Somewhat
positively Positively Very positively
12. Do you consider yourself:
○ ○ ○ ○ Very affluent Affluent Comfortable Other
Thank you for answering our survey!
Survey developed by:
Tara BennettDan DeatonLouis NearyCaleb Stallard
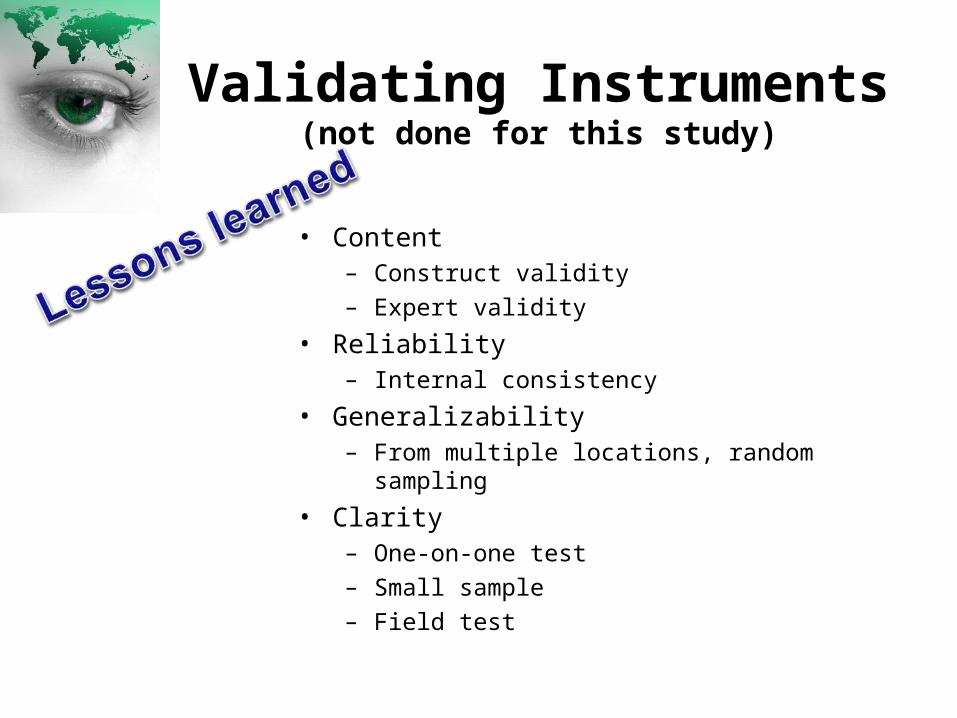
Validating Instruments(not done for this study)
• Content– Construct validity– Expert validity
• Reliability– Internal consistency
• Generalizability– From multiple locations, random sampling
• Clarity– One-on-one test– Small sample– Field test
Online Survey Development
• Zoomerang or Survey Monkey– Survey Monkey
• 10 questions/survey• 100 responses/survey• Real-time results• Collect data via weblink, email, Facebook or
embed in blog/website
– Zoomerang• 12 questions/survey• 100 responses/survey• Real-time, online reports
– Example:• http://
www.zoomerang.com/Survey/WEB22D5EM2QKFJ
Analysis: Histograms
• What does a histogram show?– Number of cases in each group along a continuum
– Example: Amount of paper used
– Likert scale: Very satisfied to Very dissatisfied
– Shows the central tendency and variation
• When do you use it? – When you have questions like:
• How does the number of low users compare with the number of moderate users and high users?
• Are more people satisfied or dissatisfied? (Is the distribution skewed?)
• Are most people in a broad range or a narrow range? (How wide is the variation?)
• Are there one or two that are really out of line? (Are there outliers?)
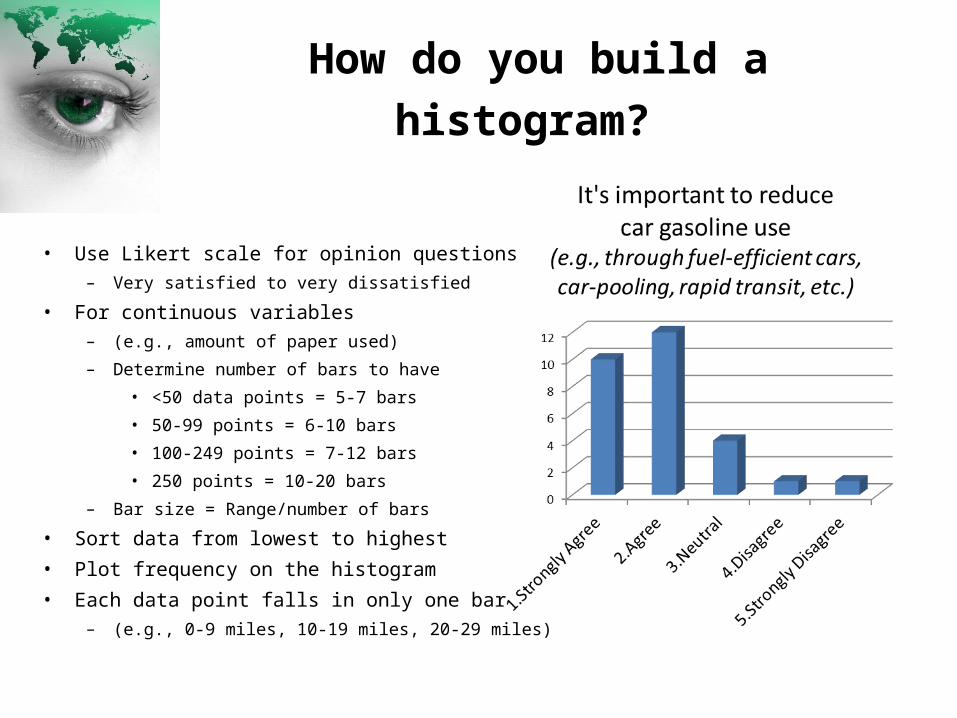
How do you build a histogram?
• Use Likert scale for opinion questions– Very satisfied to very dissatisfied
• For continuous variables – (e.g., amount of paper used)
– Determine number of bars to have
• <50 data points = 5-7 bars
• 50-99 points = 6-10 bars
• 100-249 points = 7-12 bars
• 250 points = 10-20 bars
– Bar size = Range/number of bars
• Sort data from lowest to highest
• Plot frequency on the histogram
• Each data point falls in only one bar – (e.g., 0-9 miles, 10-19 miles, 20-29 miles)
Analysis: Pareto charts
• When do you use them?– Problem-solving: To identify the problems that, if
solved, will have the greatest effect on improvement– To prioritize solutions– Categorical variable (not continuous)
• What does a Pareto chart show?– Separate the “vital few” from the “trivial many”– Combination chart: raw number and percent of total– Based on the Pareto principal
• 80% of the problems result from 20% of the causes

How do you build a Pareto
chart?Example: Water Audit
LAWN 7131.8 72.2%BATH 1815.0 90.5%FLUSH 601.2 96.6%WASH. MACH. 146.6 98.1%SHOWER 80.0 98.9%DISHWASHER 64.2 99.6%WASH BY HAND 42.9 100.0%TOTAL 9881.7
Pareto Chart - Step 1
0.0
1000.0
2000.0
3000.0
4000.0
5000.0
6000.0
7000.0
8000.0
LAW
NBATH
FLUSH
WASH. M
ACH.
SHOWER
DISHW
ASHER
WASH B
Y HAND
Gal
lon
s u
se
d
Pareto Chart - Step 2
0.0
1000.0
2000.0
3000.0
4000.0
5000.0
6000.0
7000.0
8000.0
LAW
NBATH
FLUSH
WASH. M
ACH.
SHOWER
DISHW
ASHER
WASH B
Y HAND
Ga
llo
ns
use
d
-15.0%
5.0%
25.0%
45.0%
65.0%
85.0%
105.0%
Pareto Chart - Step 3
0.0
1000.0
2000.0
3000.0
4000.0
5000.0
6000.0
7000.0
8000.0
Ga
llo
ns
use
d
0.0%10.0%20.0%
30.0%40.0%50.0%60.0%70.0%
80.0%90.0%100.0%
Publishing/Presenting Results
• Local/state conferences
• Web publishing– Blogs– Peer-reviewed
• IRB requirements– Approval– Consent (include in online survey form)
Activity: Research StudyCritical thinking in your discipline
• Given prior knowledge of stakeholders in your discipline, develop a questionnaire on a controversial issue* in your discipline:
– Individually: Develop 4-5 survey questions
– Share survey questions with partner/small group
– Brainstorm additional questions
– Discuss the demographics you want to collect
– Create a 1-page, 10-question survey (including demographics)
* Controversial issues will promote critical thinking on different points of view, assumptions, inferences that can be made

QUESTIONS?


