i
Ultrasonic Mapping Device
A Major Qualifying Project submitted to the faculty of the
Worcester Polytechnic Institute
Electrical and Computer Engineering Department
in partial fulfillment of the requirements for the
Degree of Bachelor of Science
April 28, 2016
Daniel Farrington
Robert Fleming
Daniel Hill
Justin Morrow
Advised by:
Professor John Orr

ii
Abstract
This project designs and develops a device capable of assisting rescue workers with visualizing a
room with hazards and limited visibility. The project focuses on the development of a device capable of
creating a simple two-dimensional image of the room using an array of ultrasonic sensors. The final
prototype of this device is capable of measuring distances inside a room and sending this data wirelessly
to a separate device, which generates the map and displays it to the user.
iii
Table of Contents
Abstract ...................................................................................................................................................... ii
Table of Figures .......................................................................................................................................... v
Table of Equations ...................................................................................................................................... v
1. Introduction ....................................................................................................................................... 1
1.1. Extended Goals ........................................................................................................................... 2
2. Background ........................................................................................................................................ 3
2.1. Mapping Technologies ................................................................................................................ 3
2.1.1. Electromagnetic Radiation .................................................................................................. 3
2.1.2. Sound Waves ...................................................................................................................... 7
2.2. Processing ................................................................................................................................. 10
2.3 Power Source ........................................................................................................................... 11
2.3.1 Batteries ........................................................................................................................... 11
2.4 Thermal Insulation and Fireproofing ........................................................................................ 13
3 Design ............................................................................................................................................... 15
3.1 Specifications ............................................................................................................................ 15
3.1.1 Distance Sensors and Mapping ......................................................................................... 15
3.1.2 Wireless Transmission ...................................................................................................... 16
3.1.3 Physical Specifications ...................................................................................................... 16
3.2 Device Design ........................................................................................................................... 16
3.3 Choice of Mapping Technology ................................................................................................. 19
3.4 Ultrasonic Sensors .................................................................................................................... 19
3.5 Arduino Uno Microcontroller ................................................................................................... 21
3.5.1 Motor Shield ..................................................................................................................... 22
3.6 Stepper Motor .......................................................................................................................... 23
3.7 Physical Structure ..................................................................................................................... 24
iv
3.8 Wireless Transmission .............................................................................................................. 25
3.9 Generating a Two-Dimensional Map ........................................................................................ 26
3.10 Power Source ........................................................................................................................... 26
3.11 Heat Protection ........................................................................................................................ 27
3.12 3D Implementation Ideas ......................................................................................................... 28
4 Testing and Results ........................................................................................................................... 29
4.1 Ultrasonic Sensors .................................................................................................................... 29
4.2 Wireless Transmission .............................................................................................................. 31
4.3 Physical Structure and Stepper Motor Rotation ....................................................................... 32
4.4 Software Implementation ......................................................................................................... 32
4.4.1 Transmitter Module .......................................................................................................... 33
4.4.2 Receiver Module ............................................................................................................... 34
4.4.3 MATLAB ............................................................................................................................ 34
4.5 Full Device Testing .................................................................................................................... 35
5 Conclusion ........................................................................................................................................ 39
Appendix A – Battery Value Analysis ........................................................................................................ 40
Appendix B - Code .................................................................................................................................... 41
Appendix C – Schematic of Transmitter Module ...................................................................................... 46
Appendix D – Schematic of the Receiver Module ..................................................................................... 47
Appendix E – Parts List ............................................................................................................................. 48
References ............................................................................................................................................... 49
v
Table of Figures
Figure 1: Concept for Device ...................................................................................................................... 2
Figure 2: The Electromagnetic Spectrum [2] .............................................................................................. 4
Figure 3: Basic Sonar Diagram [12] ............................................................................................................. 8
Figure 4: Lithium-Ion Battery [16] ............................................................................................................ 13
Figure 5: Temperature variance at different elevations in a burning room [18] ....................................... 14
Figure 6: Design of the Device .................................................................................................................. 17
Figure 7: Block Diagram of Transmitter Module ....................................................................................... 18
Figure 8: Block Diagram of Receiver Module ............................................................................................ 18
Figure 9: LV-EZ1 Sensor ............................................................................................................................ 20
Figure 10: LV-EZ1 Beam Characteristics.................................................................................................... 21
Figure 11: Stepper Motor connected to the Arduino via a Shield ............................................................. 23
Figure 12: SM-42BYG011 Motor ............................................................................................................... 23
Figure 13: Cage Structure before mounting components ......................................................................... 24
Figure 14: nRF24L01 Transceiver .............................................................................................................. 25
Figure 15: Ultrasonic Sensors Range Testing ............................................................................................ 29
Figure 16: Initial Testing Setup ................................................................................................................. 30
Figure 17: Code Flow Diagram .................................................................................................................. 33
Figure 18: GUI of the MATLAB program ................................................................................................... 34
Figure 19: First test with MATLAB plotting ............................................................................................... 35
Figure 20: Fully Constructed Transmitter Module .................................................................................... 36
Figure 21: Map of a room using 1 sensor ................................................................................................. 37
Figure 22: 3 Sensor Beams Overlapping ................................................................................................... 37
Table of Equations Equation 1: Distance traveled by a wave .................................................................................................... 5
Equation 2: Speed of Light through a Medium ........................................................................................... 5
Equation 3: Velocity of Sound Wave through a gas .................................................................................... 7
Equation 4: Impedance Experienced by a Sound Wave .............................................................................. 8
Equation 5: Active Sonar ............................................................................................................................ 8
Equation 6: Passive Sonar .......................................................................................................................... 9
1
1. Introduction
There have been numerous advancements in the development of mapping technologies in
recent years. These technologies are used in applications such as autonomous robots, which need to
map out a room to avoid obstacles before moving forward. The basic concept behind these technologies
is that a wave of energy is sent out from a transmitter, reflects off of surfaces, and a receiver then picks
up the reflected wave. The distance between the sensor and the surface can be calculated based on the
time difference between sending and receiving the wave.
This project focuses on mapping individual rooms in hazardous environments, where the layout
of the room cannot be determined by sight, by using one of these mapping technologies. In many
situations, it is not safe for a person to enter a room without knowing the layout of the room or any
obstacles that may be in their way. This is especially true in a dangerous situation such as a burning
building; firefighters would need to navigate the building as quickly as possible to rescue anybody who
may be trapped inside, and seeing the layout of a room before entering will allow them to avoid
obstacles that may be blocking their path.
The objective of this project is to design and prototype a basic 2D mapping device. The
prototype must be able to function in a smoke-filled room with limited visibility. It must contain a
wireless transmission system to communicate to a computer outside the room, which will generate the
map. The main goals of this project are as follows:
Design a device that can use ultrasonic sensors to measure distances inside a room. It
must be able to collect information about the entire room in a short time.
The device must send this data to a secondary device, which will upload the data to a
computer to create a map.
Construct a prototype device as a demonstration, providing a “proof-of-concept.”
Test the prototype device to ensure proper performance in the intended environment.
The exact specifications of this device are described in detail in Section 3.1.
2
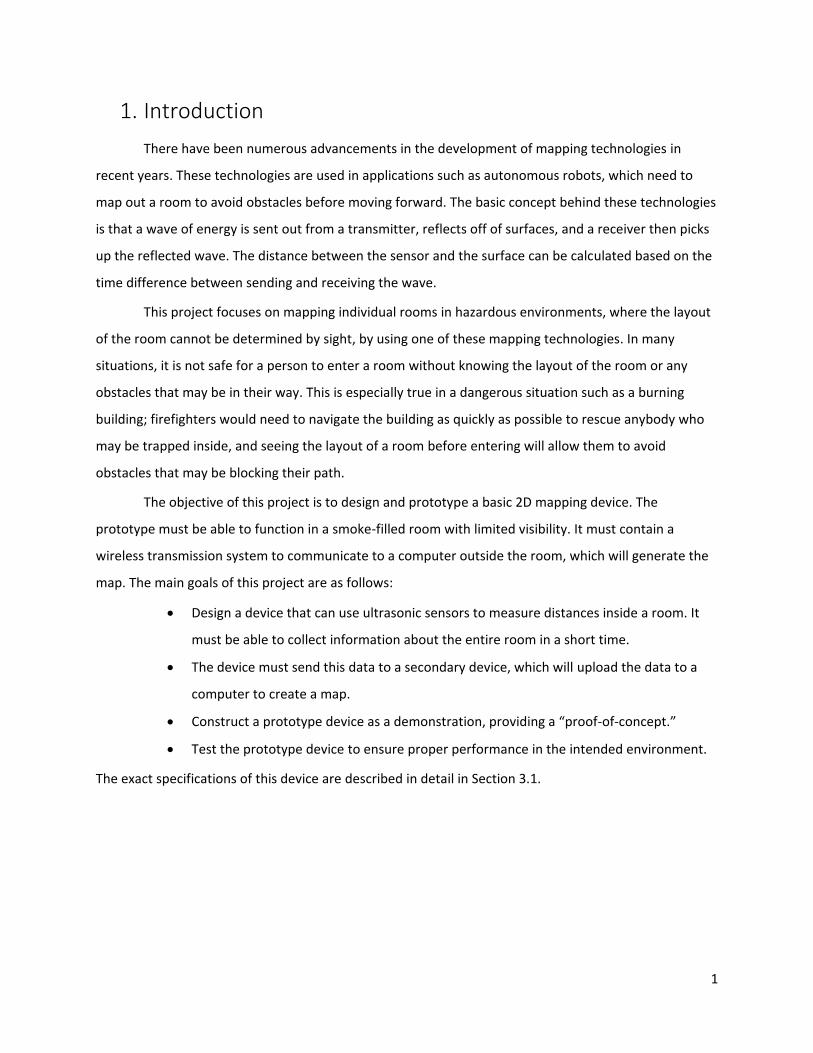
Figure 1: Concept for Device
Figure 1 shows how the device is intended to work. The device, indicated by the gray square in
the first image, will send out signals which will then reflect back off of a surface or obstacle. Signals will
be sent out and received in 360 degrees from the device (on a 2D plane), to ensure the entire room is
seen. All of these signals will be recorded, and the distance from the device to the surface will be
calculated. This data will then be sent to a receiver module, which is connected to a computer, as
indicated in the second image. This data will be used to create a map of a room, as shown by the third
image.
1.1. Extended Goals
The original goals of this project were to have the device create a full 3-dimensional image of
the room. It would be fireproof, as to function in a burning room without problems. It would also be
durable enough to be thrown into a room, so the user would simply have to throw the device into a
window from the outside and receive a map after a short time. It was quickly realized that this project
would not accomplish these goals, as they were simply too ambitious. It was decided instead to start
small and create a simple device and add on to it if possible. Despite not achieving these extended goals
during the course of this project, they were still considered during the design process. The methods to
achieve these goals are documented in Section 3.
3
2. Background
For this project, there were two methods for room-mapping to choose from: electromagnetic
energy and sound waves. To decide between these two technologies, they must be compared and
contrasted to see which would be better suited to this project. This research included not just
information about the technologies themselves and how they work, but also how they have already
been used in products that already exist on the market. This project required research in other areas as
well; these areas include the power source for the device, insulation technology to protect it from the
environment, wireless transmission to send data from the device to a computer, and software to create
the room map using the collected data. The following sections provide background information about all
of the required components for this project.
2.1. Mapping Technologies
The term “mapping technologies” refers to the different technologies available to measure
distance to map a room. The two major types of technologies are electromagnetic energy and sound
waves; both of these categories also include a wide variety of frequencies. All these different
frequencies must be compared to decide on the most useful one for this project.
2.1.1. Electromagnetic Radiation
Electromagnetic radiation is a form of energy produced by photons moving through space. [1]
The spectrum of electromagnetic radiation covers a wide range of frequencies, from gamma waves to
radio waves, each with its own behaviors. Electromagnetic waves can be used to determine the distance
from the source of the wave to the first obstacle the wave reflects from by recording when they are sent
out from the transmitter and when they are received again. This technology has been used in laser
rangefinders for many years; by adapting this technology and using multiple range-finders, data can be
collected about an entire room, instead of a single point.
4
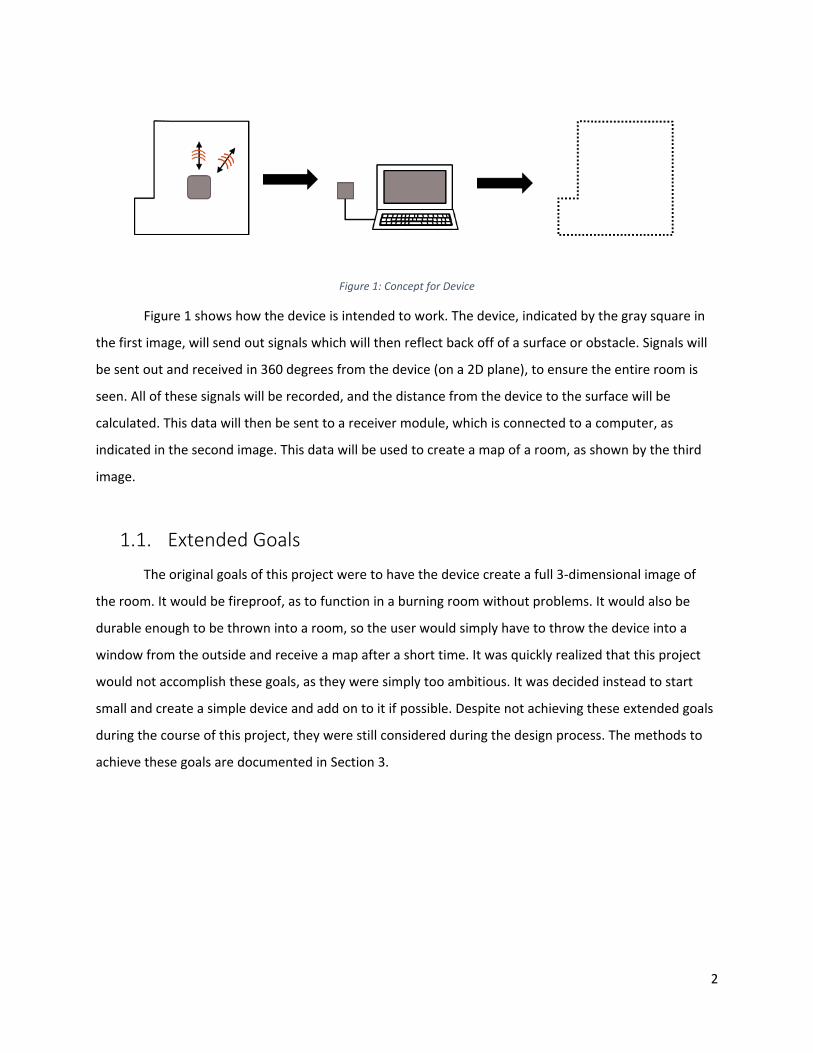
Figure 2: The Electromagnetic Spectrum [2]
Since this project is intended to work in environments filled with smoke and dust, not all
frequencies of electromagnetic energy will be usable. Low frequency waves, such as radio waves and
microwaves, will not be useful for this project. They easily penetrate through most solid obstacles, such
as walls. Medium frequency radiation, such as ultraviolet and visible light, will not work due to smoke
and dust in the room; they cannot penetrate the smoke to scan the room, which is one of the most
important aspects of the design. Very high frequency radiation, such as gamma rays and some X-rays,
will not be useful either. Though they can penetrate smoke and dust without much interference, they
require a much greater amount of power to generate. This means the price and the size of the device
would both increase. These wavelengths may also penetrate materials that need to be seen, such as
walls and obstacles in the room, which defeats the purpose of the entire project. In addition, gamma
rays and x-rays can be very dangerous to humans, meaning they should probably not be used at all.
Infrared waves are one of the best options for this category. Infrared light can pass through
smoke and other vision-obscuring substances without a problem, but will not penetrate walls or other
obstacles. [3] Infrared is currently used by NASA to gather images of planets and stars in space which
would otherwise be covered by smoke or clouds. [4] However, though smoke will not be a problem, fire
may interfere with infrared beams, as they are sensitive to heat. In a burning building, this means
infrared light may not be usable at all.
2.1.1.1. Radar
Radar systems use radio waves to determine, among other things, the distance to an object. The
frequency used would need to be low enough to not interact with the smoke, but high enough so that it
5
is reflected off of walls instead of penetrating through them. The measurements are performed by
sending out an electromagnetic signal, then measuring the signal again when it is reflected back at the
source. When the signal is received again, the time between when the signal is sent and received is
determined. This time delay, along with the speed of light, is used to calculate the distance travelled by
the wave. Since the speed of the wave will be known, the distance can be calculated using Equation 1:
𝒅 =𝒄 ∗ 𝒕
𝟐
Equation 1: Distance traveled by a wave
In this equation, t is the elapsed time between when the signal was sent and when it was
received, c is the speed of light, which can be calculated by taking the frequency (f) of a wave and
multiplying it by that wave’s wavelength (λ). The time it takes for the light to travel includes both the
time to the object and the time back; this means the distance traveled will be twice the distance from
the sensor to the obstacle reflecting the light, which is why it is divided in two. This calculation also
assumes that source and the object being detected remain in the same location throughout the entire
time. All of these techniques are meant for use in a normal air environment, but the principles that they
act upon can also be translated to work for any situation in almost any environment.
When light is travelling through a medium, its speed will not be the same constant c. The actual
velocity can be calculated if the index of refraction of the medium is known as shown in Equation 2:
𝒗 =𝒄
𝒏
Equation 2: Speed of Light through a Medium
In this equation, v is the velocity of light in the medium, c is the speed of light, and n is the index of
refraction in that medium. In a medium such as heavy smoke, this will be especially important, as the
speed of light will be significantly different than in a vacuum. The new velocity can simply be substituted
2.1.1.2. Lidar
Lidar is a contraction for “light radar.” This means that it works similarly to radar, but instead of
using radio waves to gather data, it uses beams of light, or lasers. Lidar is used for many different
purposes, from mapping terrain from the sky [6] or speed-detecting laser guns. [7] Lidar technology is
actually quite simple; a pulse of light is sent out from the Lidar device, the light is reflected back off a
surface, the Lidar device receives the reflected signal and determines the distance the pulse has
6
travelled based on the time it took to return. The basic calculation for distance using Lidar is the same as
radar (Equation 1), as they function almost identically. However, this formula is only true in a vacuum,
and becomes much more complicated in reality. This is due to many factors, including refraction in the
air due to heat, scattering when the beam hits an object, and much more. Lidar can work with a variety
of frequencies, including infrared [8], which seems to be the best option for working in a smoke-filled
room.
2.1.1.3. Existing Products
Electromagnetic mapping itself is not a technology that needs to be developed from scratch;
many products available now use lasers or other forms of light to create images. For example, there is a
company named 3D Laser Mapping which focuses entirely on using lasers to create maps of areas. [6]
One product they have is the ZEB1, which is a hand-held tool which records images using lasers while
the user walks through an area, and a 3D map is created based on this data in a short time. The
downside of this device is that it does take time; the image is not created instantly, and the user must
walk around the area to gather the data. This company does have another similar product, which is
mounted onto a robotic platform instead of being held by a person, which means it can be used in
potentially dangerous environments without worrying. However, like before, this process takes time to
create the image, which means it is not suitable for emergency use.
Another example of electromagnetic mapping is the “Kintinuous” project. This project uses the
Microsoft Kinect as its camera. The Kinect is a device developed by Microsoft which uses cameras to
detect and track motion; while originally intended for use with video games, the potential of the Kinect
has led to its use in many other areas. The Kinect functions using multiple cameras, each facing the same
location but offset from each other. The images from the cameras can then be combined, creating a
“3D” image. One project which uses the Kinect sensor is the Kinect Fusion, which is a “3D object
scanning and model creation using a Kinect for Windows sensor.” [9] The Kinect Fusion uses the Kinect’s
multiple camera setup to scan objects and create 3D models using the images. The Kinect Fusion was
expanded for the Kintinuous project, which can create full 3D models of entire rooms almost instantly.
[10] The biggest downside of this project, and the Kinect in general, is that it relies entirely on visible
light. This greatly limits its usage in the environments our project is intended to work in, as visible light
cannot penetrate smoke. However, the Kinect Fusion software may still prove useful in creating a map
of a room using a different type of light.

7
2.1.2. Sound Waves
Sound is a form of vibration that propagates as a wave of pressure and mechanical displacement
through a medium. Because sound is mechanical wave, the characteristics of that wave can be defined if
the initial cause of the wave, as well as the medium the wave is traveling through, is known. The velocity
of a sound wave through an ideal gas can be calculated using Equation 3:
𝐯 = √𝜸𝑹𝑻
𝑴
Equation 3: Velocity of Sound Wave through a gas
The velocity of the wave is represented by v. The character γ stands for the specific heat ratio,
while T is the absolute temperature of the gas in Kelvin. The character R represents the molar gas
constant and M is the molar mass of the gas the wave is passing through. As shown by Equation 3, the
speed of sound depends upon the characteristics of the medium it traverses. If the medium is known,
then the speed of the wave can be calculated.
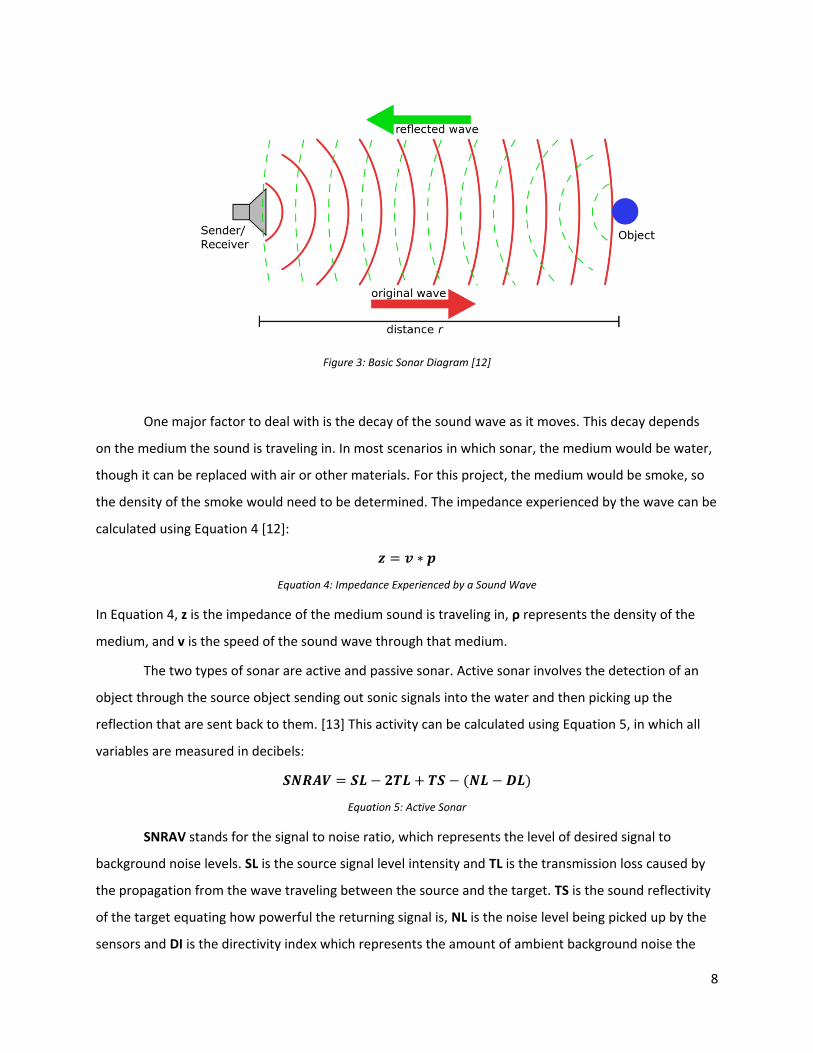
2.1.2.1. Sonar
Sonar is the process in which an object is located by the use of reflecting sound waves. This
process works by sending out a specific sound signal, which will be partially reflected by any object that
it hits, and the device or organism which sent out the signal will receive the reflected signal. When the
sound wave makes contact with an object, such as a solid wall, some of the sound will be absorbed by
the material, while the rest of it will be reflected back. Sonar functions very similarly to measuring
distance using electromagnetic energy; Equation 1 can still be used, except the speed of light must be
replaced with the speed of the sound wave.
8
Figure 3: Basic Sonar Diagram [12]
One major factor to deal with is the decay of the sound wave as it moves. This decay depends
on the medium the sound is traveling in. In most scenarios in which sonar, the medium would be water,
though it can be replaced with air or other materials. For this project, the medium would be smoke, so
the density of the smoke would need to be determined. The impedance experienced by the wave can be
calculated using Equation 4 [12]:
𝒛 = 𝒗 ∗ 𝒑
Equation 4: Impedance Experienced by a Sound Wave
In Equation 4, z is the impedance of the medium sound is traveling in, ρ represents the density of the
medium, and v is the speed of the sound wave through that medium.
The two types of sonar are active and passive sonar. Active sonar involves the detection of an
object through the source object sending out sonic signals into the water and then picking up the
reflection that are sent back to them. [13] This activity can be calculated using Equation 5, in which all
variables are measured in decibels:
𝑺𝑵𝑹𝑨𝑽 = 𝑺𝑳 − 𝟐𝑻𝑳 + 𝑻𝑺 − (𝑵𝑳 − 𝑫𝑳)
Equation 5: Active Sonar
SNRAV stands for the signal to noise ratio, which represents the level of desired signal to
background noise levels. SL is the source signal level intensity and TL is the transmission loss caused by
the propagation from the wave traveling between the source and the target. TS is the sound reflectivity
of the target equating how powerful the returning signal is, NL is the noise level being picked up by the
sensors and DI is the directivity index which represents the amount of ambient background noise the
9
sensors are rejecting. Once the signal has been detected, the source uses the same equation as it does
with radar to calculate the distance.
Passive sonar works by detecting the noises sent out by other objects, such as the hum of
engines in a submarine, which are then used to find other underwater objects. [13] This is calculated, in
decibels, using Equation 6, which uses the same variables as the active sonar equation.
𝑺𝑵𝑹𝑨𝑽 = 𝑺𝑳 − 𝑻𝑳 − (𝑵𝑳 − 𝑫𝑰)
Equation 6: Passive Sonar
Since the sound wave being detected is coming directly from the object being detected, the
transmission loss is not being doubled. Also since the sound wave is not being reflected off an object,
the sound reflectivity level, TS, can be eliminated from the equation. These factors make passive sonar
much easier to use; however, it relies on the target making sound of its own. This means it would not be
possible to determine distance using passive sonar, unless the exact frequency and strength of the
sound wave is known before detection.
2.1.2.2. Ultrasonic Environment Mapping
Using sound waves to map out an area is commonly used to help with navigation when it is not
possible to see the surrounding area. It is particularly useful in the field of robotics, where machines
must be able to move without aid. An example of this is the Dolphin system [14], invented to help guide
robots. This system uses ultrasonic sounds (sounds with frequencies above 20 kHz) to map out the
environment. The higher frequency sounds do not penetrate through many materials, such as most
walls, and they are not generated by many other sources in the environment, resulting in very little
interference. The map of the environment is generated by sending out ultrasonic waves through a series
of transducers placed upon a robot. Any sound waves that are bounced back are analyzed to determine
the direction and distance of their source. Once the calculations have been done, the obstacle’s
approximate distance from the robot can be calculated and the object can be placed into its relative
spot on the map. When all detected objects have been placed, the computer maps out a safe path
around the obstacles for the robot to transverse.
Ultrasonic mapping is generally useful for mapping due to the amount of detail that can be
detected. For example Researchers at the École Polytechnique Fédérale de Lausanne’s School of
Computer and Communications Sciences mapped a cathedral to within a few millimeters of detail. [15]
They were able to achieve this using a specialized algorithm they created. Their process shows how
10
much information can be gained from using sound waves as a medium for mapping out an environment.
This exact method requires multiple sensors placed around the room, all of which can pick up the sound
waves and determine how long they have been traveling. This algorithm is also capable of filtering the
rebounding sounds to keep track of which exact signal is being received at any time, providing a great
amount of detail. This method requires access to the room and prior setup, which is not always possible.
Despite these issues, this project shows the viability of using sound as a mapping tool.
2.2. Processing
To control all the components in this device, two processors are required. The first will need to
control a transceiver in order to send and receive data, and then route this data to an attached
computer. The second will control the chosen sensors, a second transceiver to receive small signals and
send the sensor data to the first transceiver, and all other components on the device. The two options
considered for these roles are a microcontroller (MCU) and a field-programmable gate array (FPGA).
Microcontrollers are small integrated circuits which contain a microprocessor, memory, and additional
peripherals in a single package and can be programmed to perform different tasks. The processor of a
microcontroller generally operates sequentially, meaning that instructions are executed in order, one
after another. They can handle multiple tasks at once by switching rapidly between tasks, allowing for a
degree of parallelism. Microcontrollers are very inexpensive, usually under $30.
An FPGA is also an integrated circuit, in which the internal logic gates are configured by the user.
They make use of lookup tables to achieve good performance: instead of computing the value of the
inputs using an ALU, the outputs are predetermined and stored in lookup tables. The values of these
tables, and the necessary pathways between the tables and any extra logic are determined at synthesis,
the FPGA equivalent of compilation. This causes FPGAs to excel over microcontrollers in parallel and
low-latency operations, but as a result they are generally more expensive than microcontrollers. FPGAs
are programmed using hardware description languages (HDL), such as VHDL or Verilog, while most
microcontrollers are programmed using common languages such as C. The languages share some similar
syntax, but the overall approach to developing with the two is very different. In C, each instruction
follows a sequential order one after the other. In an HDL, the code describes a logic system, and the
execution of this system can take any pathway through this system at any time, depending on the
inputs.
On-device computations should be kept to a minimum. Most of the expected computations

11
should be handled by an off-site computer, to which the device will transmit the necessary data. This
means the processor on the device will only be required to control the components of the device itself,
rather than performing extensive parallel computations on the incoming sensor data. This fact, coupled
with the cheaper price of microcontroller options, makes the microcontroller a better choice for this
application.
2.3 Power Source
Due to the nature of this project, there are certain requirements that the power source must
meet. In search and rescue situations, having the device's power drain and die is not an option. The
device must be compact and transportable as well, meaning it should not have to be powered by a wire.
The chosen power source must have a large enough capacity to power the entire device, including all
sensors, the processor, and any other components, but it must also be small enough as to not increase
the size of the device.
2.3.1 Batteries
As the device needs to be wireless, batteries are a viable option. These batteries could be either
single-use of rechargeable. Characteristics that must be taken into account include battery size, cell
voltage, energy capacity (measured in milliamp-hours [mAh]), rate of discharge (in storage), risks, and
cost. A value analysis based on typical AA, single-use batteries was performed on these three types of
batteries based on the characteristics listed. Each characteristic was assigned a point value (1-3) based
on its usefulness to the project. The assigned values were summed to create a total score for each
battery, and the choice of battery type was made based on this total score. Reference Appendix A for
the complete value analysis.
2.3.1.1 Rechargeable vs. Single-Use
Rechargeable batteries are one general option that was investigated. When using rechargeable
batteries, a single battery can be charged, used and discharged, and re-charged again for future uses.
This cuts down the cost of purchasing replacement batteries. However, many rechargeable batteries
must be kept on standby, sometimes using caution to prevent overcharging, and monitored to prevent
too much discharge in storage. Rechargeable batteries cannot come without a battery charger. This is an

12
often over-looked factor that can lead to some less-than-desirable situations if the batteries are
discharged and no replacements are on-hand.
Single-use batteries are another general option that was looked at. In an emergency situation, it is
vital that the device operates without issue. Using a single-use battery eliminates this worry, as a new
battery will always be fully charged before use. Of course, this will also raise the cost of operating the
device, as using a new battery every time will be more expensive than getting multiple uses out of a
single battery. However, one only needs to ensure that there are additional batteries on hand instead of
worrying about an operating battery charger. The need for overcharge prevention is eliminated and the
discharge rate is slowed down significantly in storage compared to rechargeable batteries.
After comparing these two options, it was decided that single-use batteries are the best choice for
this project. In an emergency situation, a fully-operable power source is critical. With rechargeable
batteries, there are simply too many factors that could result in a power source that is not operating to
its full capacity or is unprepared to power the device at all. Single-use batteries are not without fault,
but are more reliable in an emergency situation, such as a search-and-rescue mission where time may
be constrained. Now, a decision on battery type must be made. Three different types of batteries were
investigated. Each of these types may come in either rechargeable, single-use, or both. Only the single-
use versions of each type were included in the value analysis in Appendix A. These types of batteries
include nickel metallic hydride (NiMH), lithium-ion (Li-ion), and alkaline.
2.3.1.2 NiMH
NiMH batteries are exclusively rechargeable and thus were not included in the value analysis in
Appendix A. The characteristics of a typical rechargeable, AA NiMH battery are as follows. The cell
voltage of a single NiMH battery is 1.2V, meaning that for a 12V application, 10 AA NiMH batteries
would be required. The energy capacity of a single AA NiMH battery is 2,700mAh and the monthly rate
of discharge is 30%. When using NiMH batteries, it is typical to use caution in applications that may
result in exposure to heat or impact. They come at a cost of $60 per 7.2V pack (six AA batteries).
2.3.1.3 Li-Ion
Li-ion batteries scored a 10 on the value analysis. The cell voltage of a single Li-ion battery is
1.5V, meaning that for a 12V application, 8 AA Li-ion batteries would be required. The energy capacity of
a single AA Li-ion battery can range from about 2,500mAh to as much as 3,400mAh and the monthly

13
rate of discharge is less than 5%. Like with NiMH batteries, one should take caution to avoid exposure to
heat or impact when using Li-ion batteries. They are, by a wide margin, the most expensive of the
battery types investigated at $100 per 7.2V pack.
Figure 4: Lithium-Ion Battery [16]
2.3.1.4 Alkaline
Alkaline batteries scored a 14 on the value analysis. As with Li-ion batteries, the cell voltage of a
single alkaline battery is 1.5V. The energy capacity of a single AA alkaline battery is 2,800mAh and the
monthly rate of discharge is less than 1%. When using alkaline batteries, corrosion may occur with a
pressure build-up. This corrosion can lead to hydrogen leaks. In the field, hydrogen leaks are a large
concern if exposed to open flame. For the prototype, however, this is not of much concern. Alkaline
batteries come at a low cost of $5 per 9V pack (six pack of AA batteries).
2.4 Thermal Insulation and Fireproofing
It will be necessary to protect the device from the heat of a burning room. The device must be
fireproof, and must not melt. It may be necessary to fully surround the device in a resistant material in
order to protect the equipment. This may cause issues if the sound or light waves cannot penetrate the
material well. In addition, while the insulating material slows the transfer of heat into the device, the
opposite is also true. Heat produced by the device itself may be problematic.

14
Figure 5: Temperature variance at different elevations in a burning room [18]
Figure 5 displays experimental data in which temperatures were measured from the floor to the
ceiling during a house fire. Ideally, the device will not be more than a foot in diameter, thus it should sit
less than a foot high on the floor. According to Figure 5, the device should not be subject to more than
500°F. However, this will vary depending on the type of fire.
One potential material capable of withstanding such heat is Polybenzimidazole (PBI) fiber. PBI is
commonly used in firefighter gear due to its very low thermal conductivity and high heat deflection
point, the temperature at which the material deforms under load. However, this material is very
expensive, meaning it will not be usable for a prototype.
15
3 Design
The first step in developing a device is creating a set of specifications for the device. Once the
specifications have been decided, the device must be designed and built to match them.
3.1 Specifications
These specifications serve as guidelines for the project. They have been developed by the
project team based on previous projects that have been done in this field (as discussed in Section 2).
3.1.1 Distance Sensors and Mapping
The sensors that collect data about the room are the most important components in the device.
They must meet the following specifications:
Measure distances of at least 20 feet
Distances must be accurate within 6 inches
Sensor energy must be able to penetrate high density smoke
Must be able to record from all sensors at least once per second
Must record at least 180 data points in a room to be able to form a map
The 20-foot recording distance was chosen as most rooms are less than 40 feet wide, and if the device is
placed in the center of the room, it will be able to cover this distance. The density of smoke in a burning
room depends upon the air flow of the room and the composition of the smoke itself, which depends on
the cause of the fire. The sensors must be able to read through low and high density smoke with
minimal signal loss.
In order to create an accurate map, the sensors must record enough data points to cover any
potential obstacles. 180 data points were chosen for the first prototype, as this would allow a data point
to be taken every 2 degrees. At the specified maximum distance of 20 feet, this would mean data points
are being taken every 0.68 feet, or approximately 8 inches. This is acceptable, as most objects that
would pose a hazard in a room, such as a chair, table, or a support beam, would be more than 8 inches
wide. The 6-inch accuracy requirement is to ensure that the map stays usable. Given the design of the
device, the user will be given a map of the room on a 2D plane. If an obstacle or wall appears 6 inches
closer or farther away, it will not pose a problem to the user; it is unlikely that they will ever be that
close to an obstacle, or they will be prepared to encounter it before getting too close.
16
In order to keep the measurement process short, the sensors should be able to record data at a
relatively high speed; 1 second per reading accounts for the time it takes for the motor to rotate and the
wireless system to transmit, though it is unlikely that a full second is required for each step. Finally, the
sensors should only detect objects that are directly in front of them, not at an angle. If a data point is
taken every 2 degrees, the sensors should not detect anything at an angle of larger than 2 degrees.
3.1.2 Wireless Transmission
The device must be able to communicate wirelessly with a computer to create the map; it is
extremely unlikely that a computer would be brought into the room with the device. The wireless
system must fit these specifications:
Minimum of 100 ft transmission range
Must be able to transmit through smoke and solid objects
To keep the user of the computer safe, the wireless system should be able to transmit at least 100 feet.
This eliminates any potential danger of having the computer in a hazardous environment. Because the
transmitter will be inside a room filled with smoke, the signal must be able to penetrate the smoke, as
well as the walls of the room and any obstacles, to reach the receiver. The content of each transmission
will be minimal, only containing initial control signals, and then the range data gathered by the sensors.
3.1.3 Physical Specifications
The device should be small and lightweight, allowing rescue workers to transport it easily. The
durability of the device is not a concern at this time, as it will be placed on a surface, not thrown into a
room.
The chosen power source must be able to power the device for the duration of the mapping
process, but not use too much excess power. The exact amount of power required depends on the
chosen components, but it should remain as low as possible.
3.2 Device Design
The overall design of the device went through many changes before the final design was
developed. The device consists of two parts: the transmitter module, which consists of the sensors, a
processor, a stepper motor, and a wireless transceiver, and the receiver module, which consists of only a
17
processor and a wireless transceiver. All of these components for both modules must be chosen to meet
the specifications for this device.
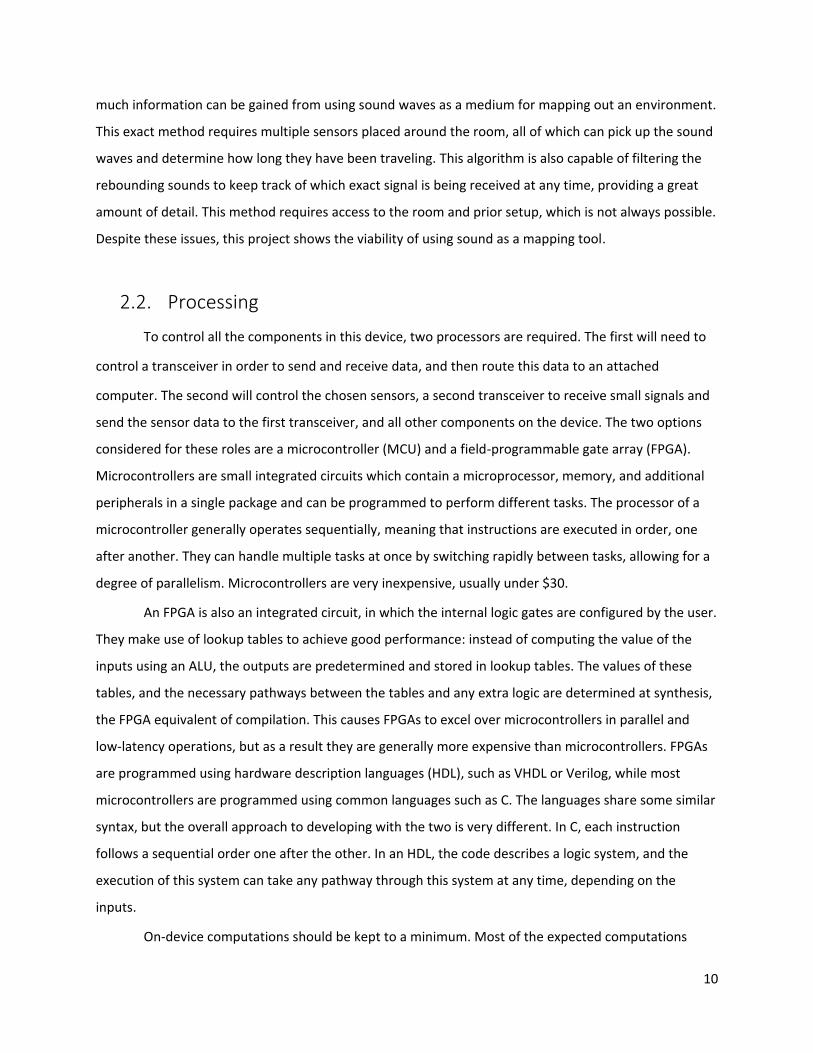
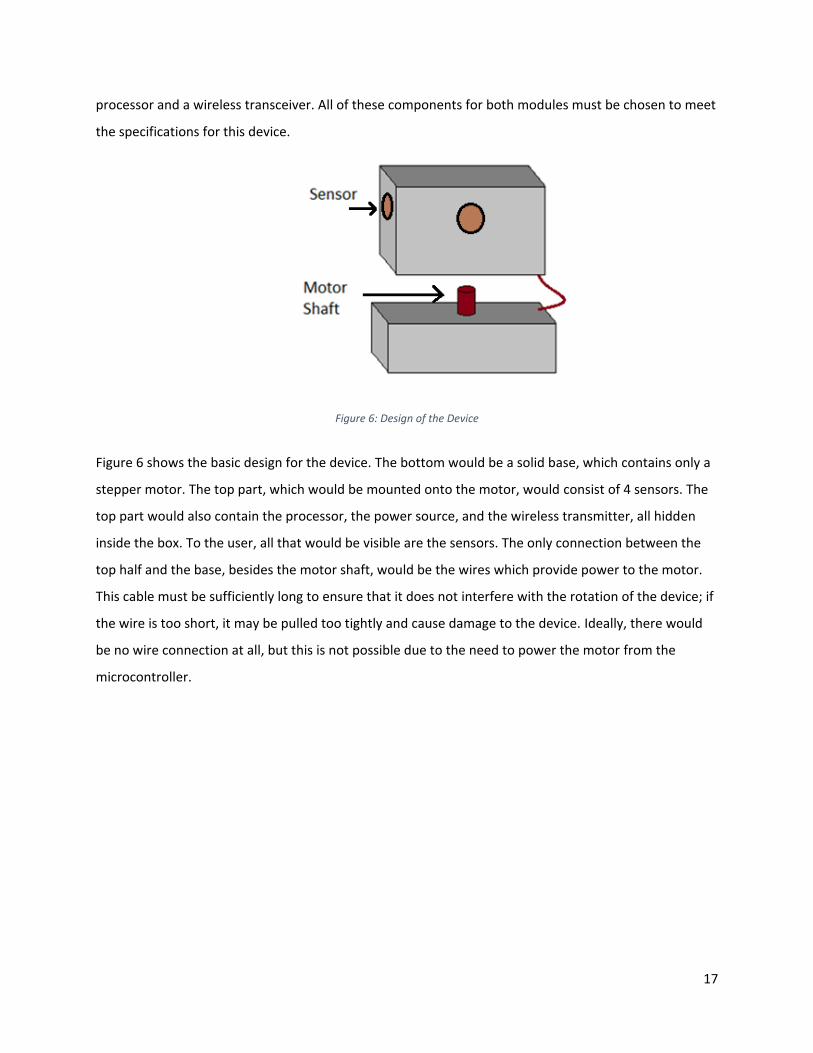
Figure 6: Design of the Device
Figure 6 shows the basic design for the device. The bottom would be a solid base, which contains only a
stepper motor. The top part, which would be mounted onto the motor, would consist of 4 sensors. The
top part would also contain the processor, the power source, and the wireless transmitter, all hidden
inside the box. To the user, all that would be visible are the sensors. The only connection between the
top half and the base, besides the motor shaft, would be the wires which provide power to the motor.
This cable must be sufficiently long to ensure that it does not interfere with the rotation of the device; if
the wire is too short, it may be pulled too tightly and cause damage to the device. Ideally, there would
be no wire connection at all, but this is not possible due to the need to power the motor from the
microcontroller.
18
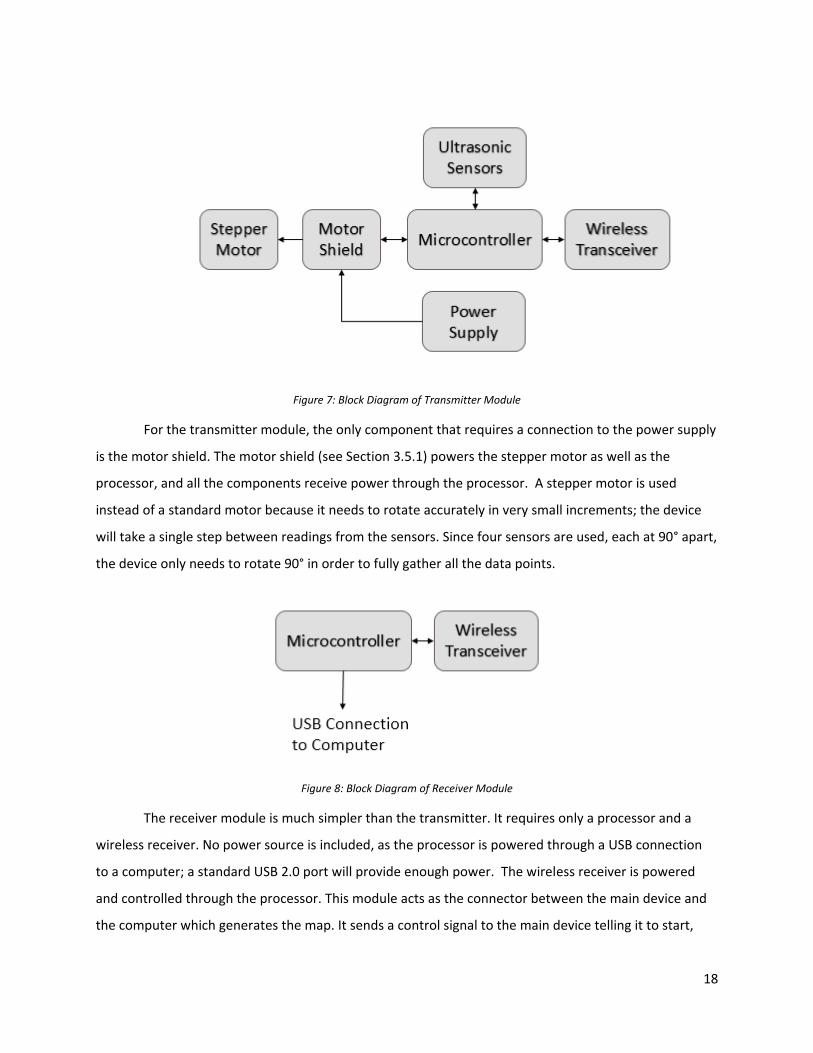
Figure 7: Block Diagram of Transmitter Module
For the transmitter module, the only component that requires a connection to the power supply
is the motor shield. The motor shield (see Section 3.5.1) powers the stepper motor as well as the
processor, and all the components receive power through the processor. A stepper motor is used
instead of a standard motor because it needs to rotate accurately in very small increments; the device
will take a single step between readings from the sensors. Since four sensors are used, each at 90° apart,
the device only needs to rotate 90° in order to fully gather all the data points.
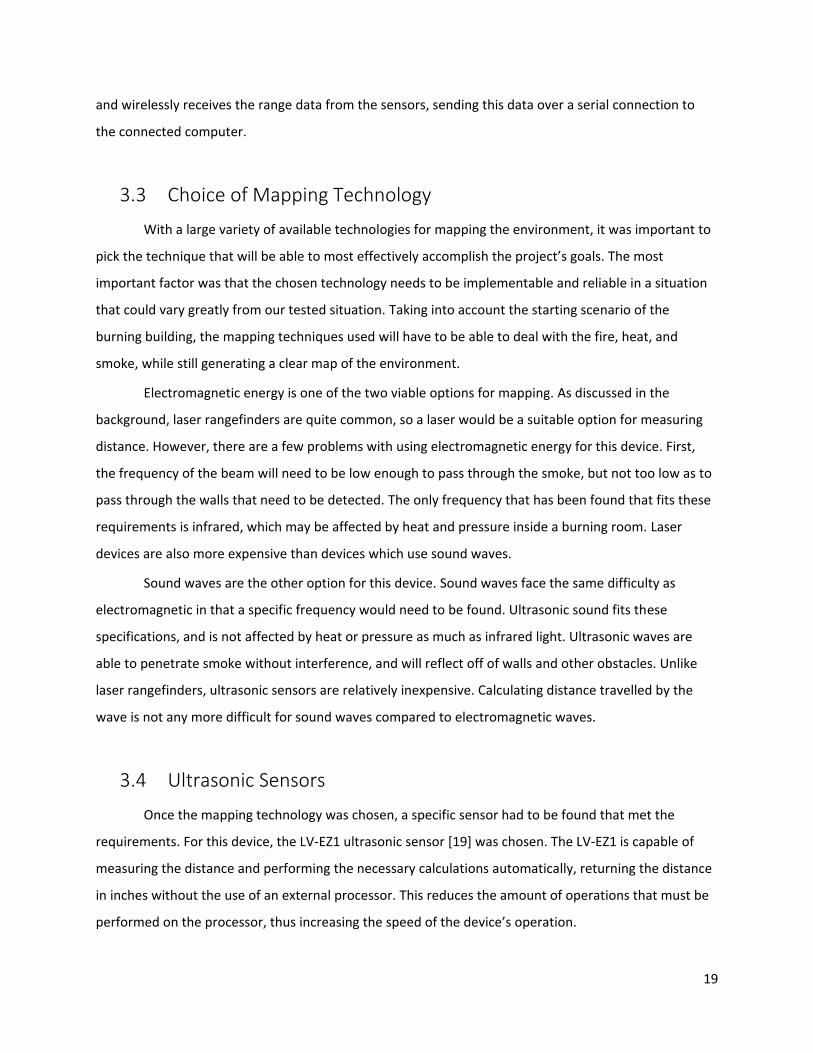
Figure 8: Block Diagram of Receiver Module
The receiver module is much simpler than the transmitter. It requires only a processor and a
wireless receiver. No power source is included, as the processor is powered through a USB connection
to a computer; a standard USB 2.0 port will provide enough power. The wireless receiver is powered
and controlled through the processor. This module acts as the connector between the main device and
the computer which generates the map. It sends a control signal to the main device telling it to start,
19
and wirelessly receives the range data from the sensors, sending this data over a serial connection to
the connected computer.
3.3 Choice of Mapping Technology
With a large variety of available technologies for mapping the environment, it was important to
pick the technique that will be able to most effectively accomplish the project’s goals. The most
important factor was that the chosen technology needs to be implementable and reliable in a situation
that could vary greatly from our tested situation. Taking into account the starting scenario of the
burning building, the mapping techniques used will have to be able to deal with the fire, heat, and
smoke, while still generating a clear map of the environment.
Electromagnetic energy is one of the two viable options for mapping. As discussed in the
background, laser rangefinders are quite common, so a laser would be a suitable option for measuring
distance. However, there are a few problems with using electromagnetic energy for this device. First,
the frequency of the beam will need to be low enough to pass through the smoke, but not too low as to
pass through the walls that need to be detected. The only frequency that has been found that fits these
requirements is infrared, which may be affected by heat and pressure inside a burning room. Laser
devices are also more expensive than devices which use sound waves.
Sound waves are the other option for this device. Sound waves face the same difficulty as
electromagnetic in that a specific frequency would need to be found. Ultrasonic sound fits these
specifications, and is not affected by heat or pressure as much as infrared light. Ultrasonic waves are
able to penetrate smoke without interference, and will reflect off of walls and other obstacles. Unlike
laser rangefinders, ultrasonic sensors are relatively inexpensive. Calculating distance travelled by the
wave is not any more difficult for sound waves compared to electromagnetic waves.
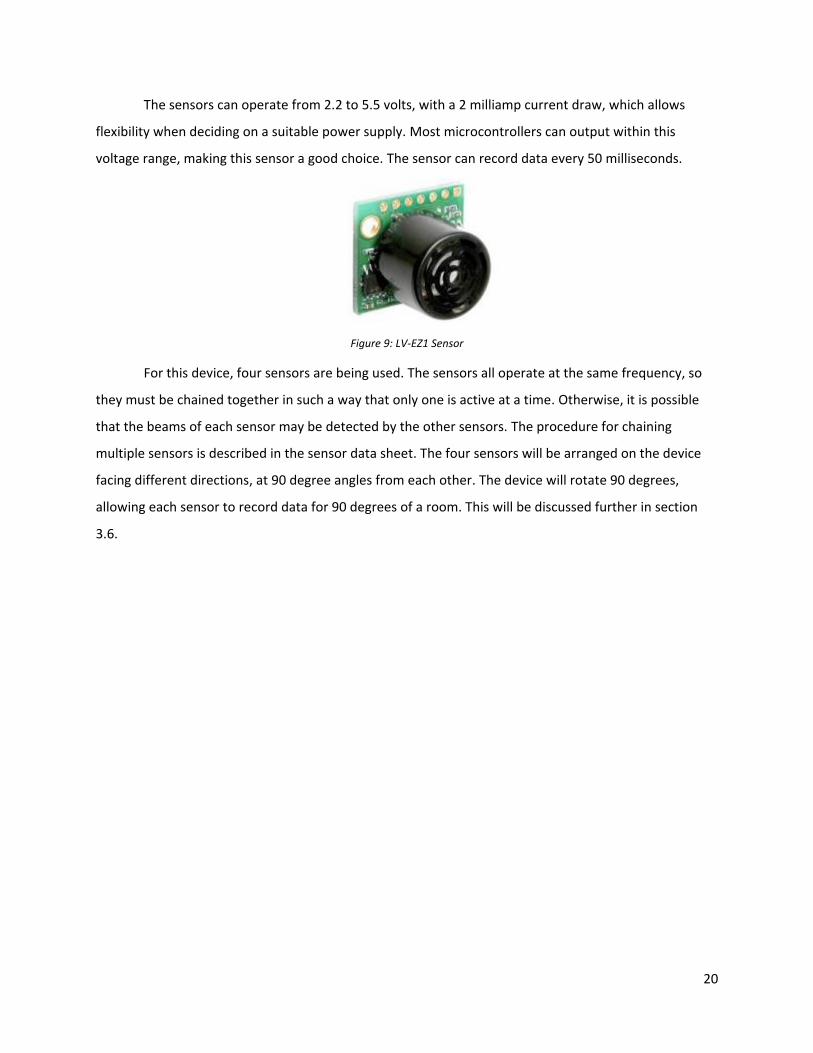
3.4 Ultrasonic Sensors
Once the mapping technology was chosen, a specific sensor had to be found that met the
requirements. For this device, the LV-EZ1 ultrasonic sensor [19] was chosen. The LV-EZ1 is capable of
measuring the distance and performing the necessary calculations automatically, returning the distance
in inches without the use of an external processor. This reduces the amount of operations that must be
performed on the processor, thus increasing the speed of the device’s operation.
20
The sensors can operate from 2.2 to 5.5 volts, with a 2 milliamp current draw, which allows
flexibility when deciding on a suitable power supply. Most microcontrollers can output within this
voltage range, making this sensor a good choice. The sensor can record data every 50 milliseconds.
Figure 9: LV-EZ1 Sensor
For this device, four sensors are being used. The sensors all operate at the same frequency, so
they must be chained together in such a way that only one is active at a time. Otherwise, it is possible
that the beams of each sensor may be detected by the other sensors. The procedure for chaining
multiple sensors is described in the sensor data sheet. The four sensors will be arranged on the device
facing different directions, at 90 degree angles from each other. The device will rotate 90 degrees,
allowing each sensor to record data for 90 degrees of a room. This will be discussed further in section
3.6.

21
Figure 10: LV-EZ1 Beam Characteristics
Figure 10 shows the beam pattern of the LV-EZ1, as included in the datasheet. As the distance
increases, the sensor becomes less capable of detecting smaller objects; at 5 feet (graph A), the sensor
can detect an object with a 0.25-inch diameter, but at 8 feet it can only detect an object of 1 inch or
greater. The sensor is capable of detecting an 11-inch wide board at 20 feet, which means it can easily
detect any larger obstacles at any range. Unfortunately, the beam is cone-shaped, which means the
sensors can detect obstacles at an angle. At short distances, the cone is not very pronounced and it will
not cause any issues. At longer ranges, however, the beam can reach a width of up to 3 feet, which is
very noticeable and may result in incorrect readings. More details about the cone of detection are
discussed in Section 4.1.
3.5 Arduino Uno Microcontroller
To control the device, an Arduino Uno was chosen. Arduino microcontrollers are specifically
advertised as being good choices to prototype devices; they provide an IDE (integrated development
environment) which can use any C code; many components also provide code libraries to work

22
specifically with the Arduino (see Sections 3.5.1 and 3.8). According to the technical specifications [20],
the Arduino Uno board requires an input voltage of 6-20 volts, which is regulated down to a usable
voltage. This means the chosen power source for the Arduino can vary as much as required for the other
components. The Uno contains 6 analog I/O pins, which are required to read data from the ultrasonic
sensors and to control the stepper motor. 6 pins are required for the device, as 4 are used for the
ultrasonic sensors and 2 are required to control the stepper motor. The analog pins output up to 50 mA
of current, which is more than enough for the ultrasonic sensors. There are also 14 digital I/O pins,
which are required to control the wireless transmission system.
Two Arduino boards are being used for this project; one for the actual device, which detects and
transmits the data, and another for the wireless receiver, which is connected to the external computer.
The external Arduino is only connected to a single wireless receiver, which means its only job for this
project is to receive the data from the device and upload it to the computer. The internal Arduino needs
to perform much more than the external one. This microcontroller is responsible for receiving data from
the four ultrasonic sensors and controlling the transceiver in order to transmit sensor data to the
receiver module, as well as controlling a stepper motor which rotates the sensors. In order to accurately
control the stepper motor, a motor shield is needed.
3.5.1 Motor Shield
In order for the Arduino to accurately control and power a stepper motor, it must be attached to
a motor shield. A motor shield is a module that attaches to the Arduino board, allowing the motor to be
controlled by the Arduino like any other simple peripheral device. The chosen motor shield for this
project is the Adafruit Arduino Motor Shield V2 [20]. The code libraries required to interface a stepper
motor with this shield are included on Adafruit’s website [21]. The motor shield allows the Arduino to
control the torque and direction of the motor. The stepper motor also requires 12 volts, which the
Arduino cannot output on its own. A 12-volt power supply is connected to the motor shield, which
powers the Arduino as well.
23
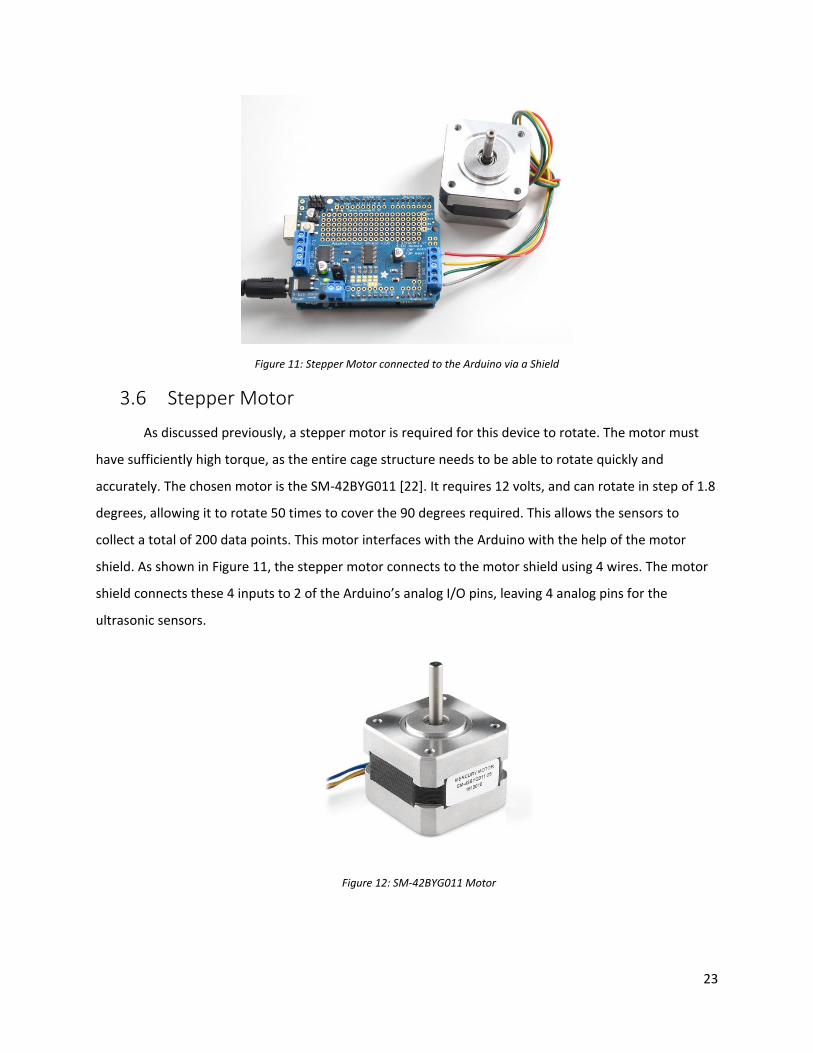
Figure 11: Stepper Motor connected to the Arduino via a Shield
3.6 Stepper Motor
As discussed previously, a stepper motor is required for this device to rotate. The motor must
have sufficiently high torque, as the entire cage structure needs to be able to rotate quickly and
accurately. The chosen motor is the SM-42BYG011 [22]. It requires 12 volts, and can rotate in step of 1.8
degrees, allowing it to rotate 50 times to cover the 90 degrees required. This allows the sensors to
collect a total of 200 data points. This motor interfaces with the Arduino with the help of the motor
shield. As shown in Figure 11, the stepper motor connects to the motor shield using 4 wires. The motor
shield connects these 4 inputs to 2 of the Arduino’s analog I/O pins, leaving 4 analog pins for the
ultrasonic sensors.
Figure 12: SM-42BYG011 Motor
24
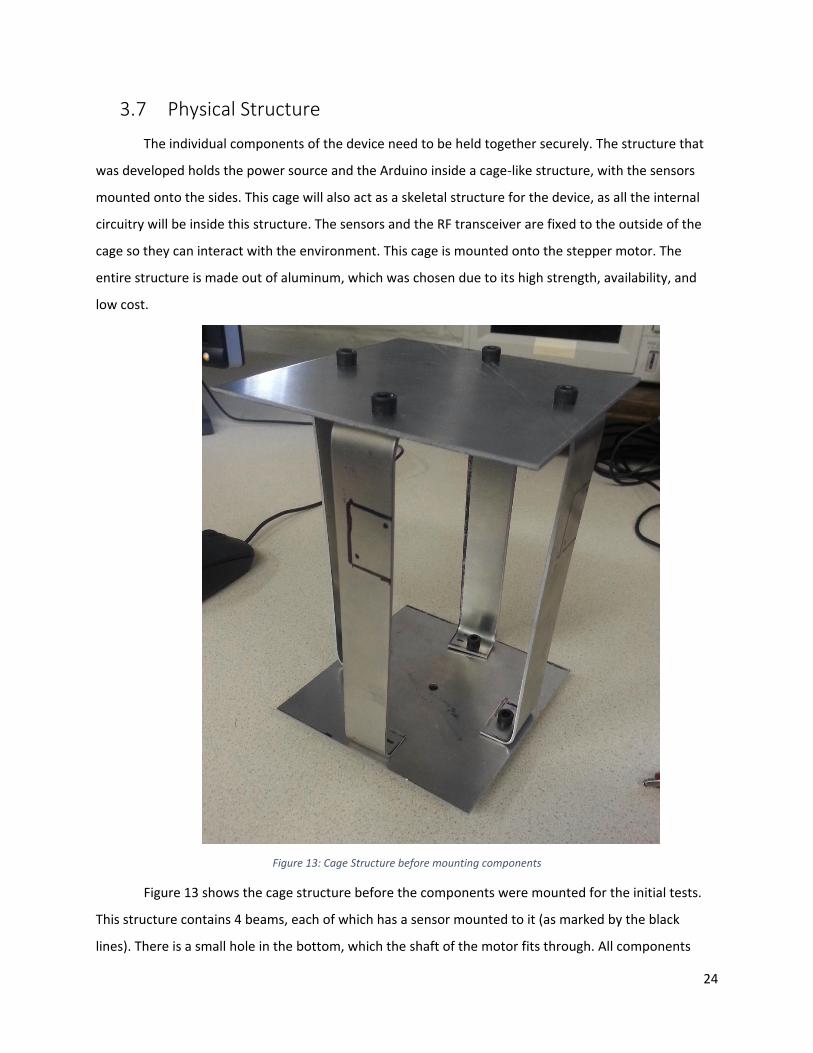
3.7 Physical Structure
The individual components of the device need to be held together securely. The structure that
was developed holds the power source and the Arduino inside a cage-like structure, with the sensors
mounted onto the sides. This cage will also act as a skeletal structure for the device, as all the internal
circuitry will be inside this structure. The sensors and the RF transceiver are fixed to the outside of the
cage so they can interact with the environment. This cage is mounted onto the stepper motor. The
entire structure is made out of aluminum, which was chosen due to its high strength, availability, and
low cost.
Figure 13: Cage Structure before mounting components
Figure 13 shows the cage structure before the components were mounted for the initial tests.
This structure contains 4 beams, each of which has a sensor mounted to it (as marked by the black
lines). There is a small hole in the bottom, which the shaft of the motor fits through. All components
25
except for the stepper motor are mounted inside this cage. The benefits of the cage design are that it
allows the device to be rewired easily; the device does not need to be opened and sealed again every
time a change is made to the design. It also keeps it very lightweight, which is safer for the motor. The
cage is connected to the motor shaft using a shaft collar. This collar is firmly attached to the cage using 2
screws, and is held onto the shaft using a set screw.
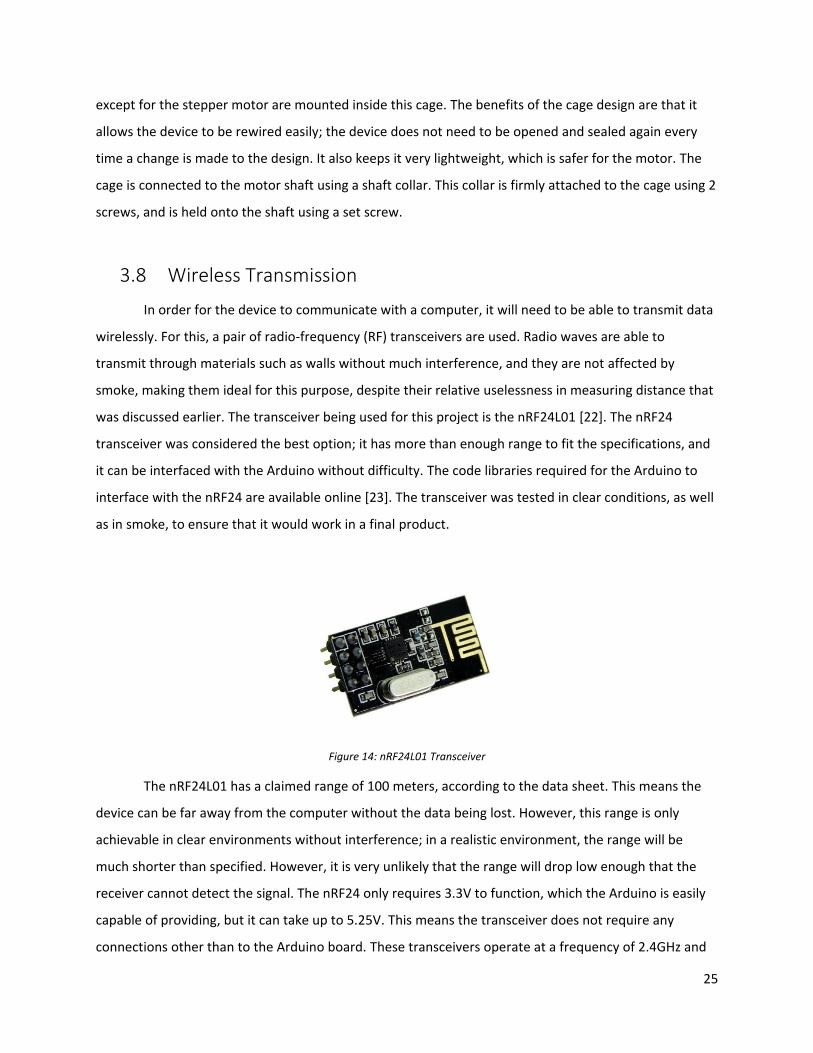
3.8 Wireless Transmission
In order for the device to communicate with a computer, it will need to be able to transmit data
wirelessly. For this, a pair of radio-frequency (RF) transceivers are used. Radio waves are able to
transmit through materials such as walls without much interference, and they are not affected by
smoke, making them ideal for this purpose, despite their relative uselessness in measuring distance that
was discussed earlier. The transceiver being used for this project is the nRF24L01 [22]. The nRF24
transceiver was considered the best option; it has more than enough range to fit the specifications, and
it can be interfaced with the Arduino without difficulty. The code libraries required for the Arduino to
interface with the nRF24 are available online [23]. The transceiver was tested in clear conditions, as well
as in smoke, to ensure that it would work in a final product.
Figure 14: nRF24L01 Transceiver
The nRF24L01 has a claimed range of 100 meters, according to the data sheet. This means the
device can be far away from the computer without the data being lost. However, this range is only
achievable in clear environments without interference; in a realistic environment, the range will be
much shorter than specified. However, it is very unlikely that the range will drop low enough that the
receiver cannot detect the signal. The nRF24 only requires 3.3V to function, which the Arduino is easily
capable of providing, but it can take up to 5.25V. This means the transceiver does not require any
connections other than to the Arduino board. These transceivers operate at a frequency of 2.4GHz and
26
have a minimum data rate of 250kbps. The transceivers are only required to send a very small amount
of data at a time, so this data rate is sufficiently high. The only concern with this device is the 2.4GHz
frequency; it is possible that it may interfere with other devices, as many other commercial devices use
the same frequency range.
3.9 Generating a Two-Dimensional Map
While the physical device is the biggest component of this project, it is also vital that the
software performs its job correctly. The software being used for this part of the project is MATLAB,
which is a program capable of performing complex mathematical calculations with large amounts of
data. The entire operation of the device is actually controlled from the MATLAB program.
The MATLAB script required for this project takes in a specified number of distances (in this
case, 200), separates them into multiple arrays (one for each sensor), and creates a polar plot using
these distances. As four sensors are being used, this means there will be four arrays, each representing
90 degrees of the room. These four arrays can all be combined into a single list of data, which can be
plotted easily.
One downside of using MATLAB to perform the calculations is that it requires a computer with
MATLAB installed to operate. This can be a huge problem for many potential users of this device, as
MATLAB costs over $2000 for a personal license. In order to get around this issue, standalone software
can be written to perform the calculations and create the polar plot. However, this is not something that
will be done during the course of this project.
3.10 Power Source
Choosing an appropriate power source is crucial to ensuring the reliability of the mapping
device. In order to fit the needs of this device, the power source must be portable and able to provide
output for long periods of time without fully discharging. Different types of batteries were compared
and their pros and cons weighed against one another.
The power source will evolve with the progression of this project. For the proof-of-concept
stage, the device does not necessarily need to be portable. In this stage, the device will be powered
through a wired connection to a computer, where the data from the sensors will be sent. In later stages
where the communication is wireless, the device will be battery-powered. Single-use alkaline batteries

27
are the optimal choice for this project due to their reliability versus rechargeable batteries. It was
decided that alkaline batteries would be used due to their performance in the value analysis. Without
having to worry about hydrogen leaks from charging and with the proper heat protection, the threat of
an explosion occurring is diminished.
The Arduino inside the device requires little power to operate, relative to the stepper motor.
The chosen power source for the device is a set of 8 alkaline AA batteries. These batteries provide 12
volts, which is enough to power the stepper motor, as well as the other components. The Arduino and
the motor shield can easily be powered from this source, so the device only requires a single power
source. The 4 sensors and the RF transceiver can all be powered from the Arduino as well. For the
receiver module, only the Arduino needs power, as the RF transceiver can be powered from the
Arduino. Since this module needs to be connected to a computer, it can simply run off USB power.
3.11 Heat Protection
The device is intended to work in a burning building; this means it must be able to withstand
heat. For this project, adding heat protection would be very difficult. It was decided that this part of the
project would not be considered at this time. However, the modifications required for adding heat
protection have been discussed.
Protecting the device would require an insulating material to cover the device. As discussed in
Section 2.4, PBI fiber would be a suitable material. However, PBI is very expensive, and the cost of the
device would need to be raised accordingly. The chosen ultrasonic sensors, the LV-EZ1, are required to
face the outside of the device without obstruction. This would require a hole into the device for each
sensor, reducing the effect of the insulation. Additionally, the sensors have a plastic casing, which would
almost certainly melt in strong heat.
In order to make this device heat resistant, it would require a few design changes. The biggest
change would the sensors; a sensor would need to be found that could withstand the heat without
melting. To protect the sensors, some sort of material would need to cover them to protect them from
heat, but it would also need to not block the ultrasonic waves. Finding such a material may prove
incredibly difficult.
28
3.12 3D Implementation Ideas
To expand this device’s capabilities to mapping a full 3D environment, many more design
decisions are required. First, the physical design would need to be changed; the current device consists
of 4 sensors, each facing a different direction, attached to a motor. This allows the device to collect data
about a single 2D plane. To capture a full room, this system will need to be expanded. One idea is to
have the sensors all attached to a ring. This ring can rotate, like the current device, to capture data
about a single plane. This ring, however, would also be on a hinge; this would allow the ring to face
different directions, gathering data from enough 2D planes to form a model. Unfortunately, this would
probably be very difficult to implement. The rotation time of the current model is negligible while the
device is operating, as the rotation time is shorter than the time required to send the data wirelessly via
the RF transceiver. However, with a second motor, the time would increase dramatically. The current
model rotates 50 times before returning to its starting position; the new model would require 50
rotations per plane. If the ring is tilted 50 times, this would require 2500 rotations. Each rotation would
also require a wireless data transfer, adding even more time to the operation. This idea would be
possible to implement, but it may not actually be feasible due to the time it would take to operate. The
current 2D model operates in approximately 1 minute, with 50 rotations. At the same speed, 2500
rotations would take 50 minutes, which is far too long to be useful in an emergency situation.
29
4 Testing and Results
Testing each component before constructing the device is critical to its operation. The initial
testing would ensure that the chosen components are reliable and
4.1 Ultrasonic Sensors
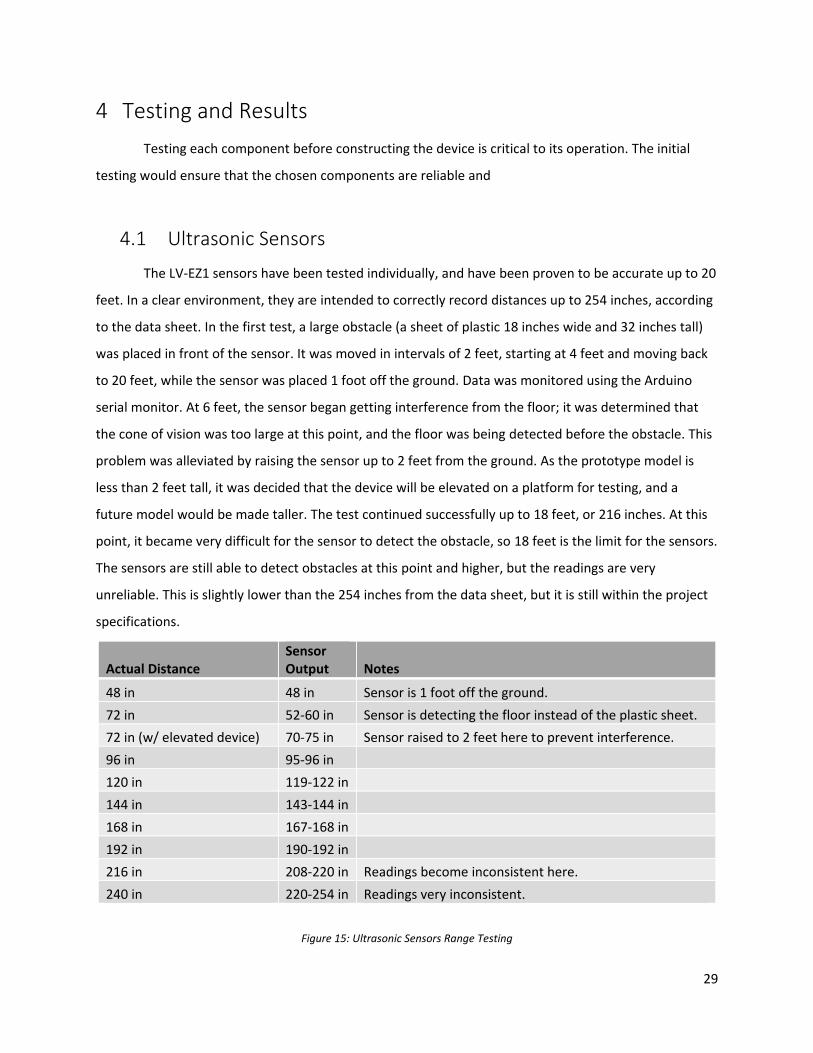
The LV-EZ1 sensors have been tested individually, and have been proven to be accurate up to 20
feet. In a clear environment, they are intended to correctly record distances up to 254 inches, according
to the data sheet. In the first test, a large obstacle (a sheet of plastic 18 inches wide and 32 inches tall)
was placed in front of the sensor. It was moved in intervals of 2 feet, starting at 4 feet and moving back
to 20 feet, while the sensor was placed 1 foot off the ground. Data was monitored using the Arduino
serial monitor. At 6 feet, the sensor began getting interference from the floor; it was determined that
the cone of vision was too large at this point, and the floor was being detected before the obstacle. This
problem was alleviated by raising the sensor up to 2 feet from the ground. As the prototype model is
less than 2 feet tall, it was decided that the device will be elevated on a platform for testing, and a
future model would be made taller. The test continued successfully up to 18 feet, or 216 inches. At this
point, it became very difficult for the sensor to detect the obstacle, so 18 feet is the limit for the sensors.
The sensors are still able to detect obstacles at this point and higher, but the readings are very
unreliable. This is slightly lower than the 254 inches from the data sheet, but it is still within the project
specifications.
Actual Distance Sensor Output Notes
48 in 48 in Sensor is 1 foot off the ground.
72 in 52-60 in Sensor is detecting the floor instead of the plastic sheet.
72 in (w/ elevated device) 70-75 in Sensor raised to 2 feet here to prevent interference.
96 in 95-96 in 120 in 119-122 in 144 in 143-144 in 168 in 167-168 in 192 in 190-192 in 216 in 208-220 in Readings become inconsistent here.
240 in 220-254 in Readings very inconsistent.
Figure 15: Ultrasonic Sensors Range Testing
30
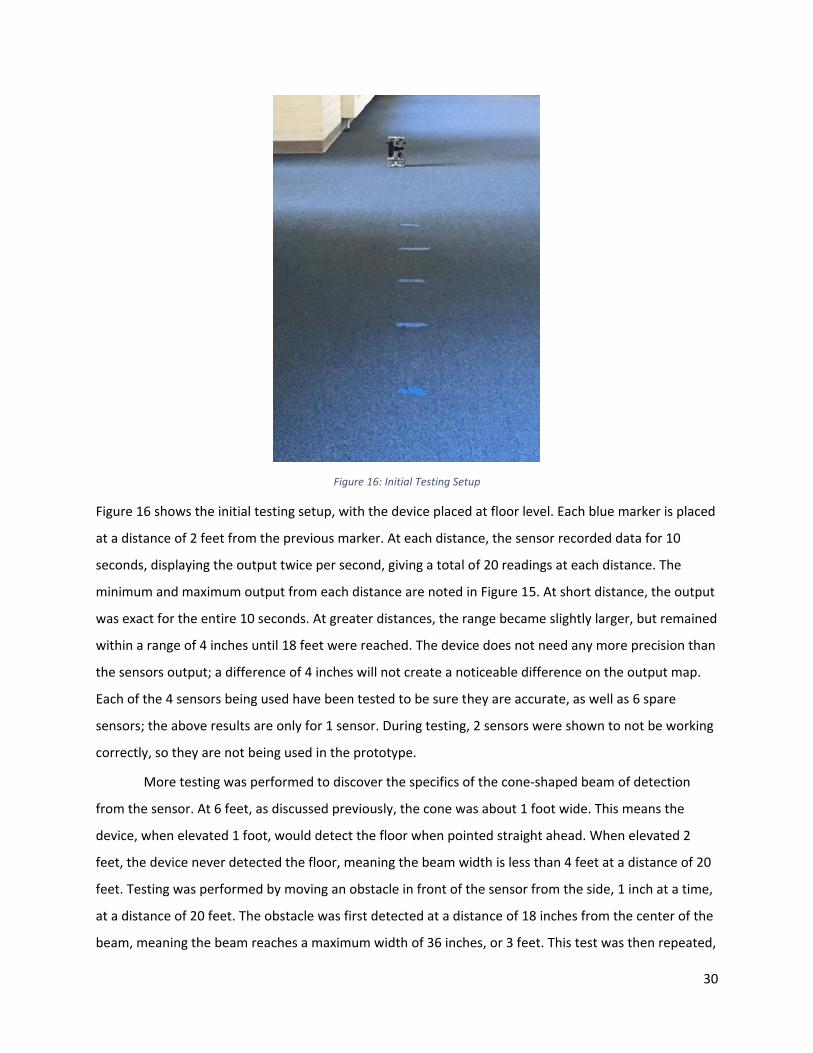
Figure 16: Initial Testing Setup
Figure 16 shows the initial testing setup, with the device placed at floor level. Each blue marker is placed
at a distance of 2 feet from the previous marker. At each distance, the sensor recorded data for 10
seconds, displaying the output twice per second, giving a total of 20 readings at each distance. The
minimum and maximum output from each distance are noted in Figure 15. At short distance, the output
was exact for the entire 10 seconds. At greater distances, the range became slightly larger, but remained
within a range of 4 inches until 18 feet were reached. The device does not need any more precision than
the sensors output; a difference of 4 inches will not create a noticeable difference on the output map.
Each of the 4 sensors being used have been tested to be sure they are accurate, as well as 6 spare
sensors; the above results are only for 1 sensor. During testing, 2 sensors were shown to not be working
correctly, so they are not being used in the prototype.
More testing was performed to discover the specifics of the cone-shaped beam of detection
from the sensor. At 6 feet, as discussed previously, the cone was about 1 foot wide. This means the
device, when elevated 1 foot, would detect the floor when pointed straight ahead. When elevated 2
feet, the device never detected the floor, meaning the beam width is less than 4 feet at a distance of 20
feet. Testing was performed by moving an obstacle in front of the sensor from the side, 1 inch at a time,
at a distance of 20 feet. The obstacle was first detected at a distance of 18 inches from the center of the
beam, meaning the beam reaches a maximum width of 36 inches, or 3 feet. This test was then repeated,
31
to determine when the cone reaches its maximum width. The test was repeated in 1 foot intervals,
starting at a distance of 20 and moving closer to the sensor with each test. The beam reached a width of
3 feet (the maximum width) at 12 feet from the sensor. The sensor will not detect anything that is more
than 1.5 feet away from the center of the beam at any distance.
Other basic testing was performed with different materials, using the same setup. A large cloth
was placed in front of the sensor and moved at the same intervals, and the sensor was able to detect it
clearly. A plate of glass was also tested, to be sure the sensor detects transparent objects; the glass was
detected exactly as expected. The sensors were also tested at short range; as told in the data sheet, the
sensors are not able to clearly detect anything below 6 inches; everything at 6 inches or closer appears
as 6 inches, as this is the minimum of the sensor. All of these tests were conducted with the sensor
connected to the Arduino, with modified code that is not included in the final device.
These sensors have also been tested in fog created by a fog machine, to simulate smoke, and
performed as intended. Each sensor was tested individually by being pointed at a wall 8 feet (96 inches)
away. The output was monitored via the Arduino serial monitor. The density of the fog was slowly
increased, while the output was observed. As the density increased, there was no change in the output
from the sensor. This test was repeated at a distance of 10 feet (120 inches). Again, there was no change
as the fog density increased. This proves that the sensors operate effectively in a low-visibility
environment. 4 sensors were tested to ensure that they all worked as intended.
Once the sensors were tested individually, they were chained together and tested as a group.
Connecting the sensors together require additional wiring between them, as discussed in the data sheet.
When chained together, a pulse is sent to the first sensor, which performs its reading and then signals
the next sensor to read. Once all sensors are finished, a new pulse is sent and the process repeats. For
testing, all 4 sensors being used were placed in a straight line and pointed at the same obstacle. In the
first test, they were simply pointed at a ceiling with a height of 72 inches from the sensors. This test
made sure the sensors were not interfering with each other. All 4 sensors output a measurement of 72
inches when they were tested, meaning they do not interfere with each other at all in this situation.
4.2 Wireless Transmission
The wireless transmission system for the device was tested by placing the transmitter module at
various distances from the receiver. This test was performed using the same setup as the sensor tests;
the transmitter and receiver were placed at varying distances, increasing 2 feet at a time, and tested
32
with a sensor that was confirmed to be working correctly. The data from the sensor could be seen on
both the transmitter and the receiver through serial connections to computers. Without interference,
the receiver would not receive any data at 30 feet. This does not match the advertised 100 feet that the
transceivers should be reaching, nor does it reach the specification for the device. This test has been
reproduced both indoors and outside, giving the same results. When tested through a wall, the
transceivers functioned exactly the same way, showing that the signal is not affected by a single wall.
Testing could not be performed with multiple walls, as the short range does not allow this test to be
performed.
4.3 Physical Structure and Stepper Motor Rotation
The first step with constructing the physical model was to make sure the stepper motor worked
correctly. Connecting the motor shield to the Arduino was a simple process, as the shield contains
clearly marked pins for where it needs to attach. Connecting the stepper motor to the shield is also fairly
simple; as it is a bipolar motor, it wires to be connected to the shield. Once the motor was attached
correctly, it needed to be tested. The first test did not succeed; the motor would not rotate at all. It was
discovered shortly after that this was due to the incorrect requires four code libraries being used. The
correct code libraries are available directly from Adafruit, as previously mentioned. Once the code was
modified to use the correct libraries, the motor performed as expected.
Once the cage structure was built, it was tested with the motor. The motor, as expected, is
capable of holding the cage structure and rotating it quickly. The rotation takes about half a second to
turn 1 step, which happens between readings from the sensors.
4.4 Software Implementation
The code for this project is split into 3 parts: The Transmitter module, the Receiver module, and
the MATLAB program. The transmitter and receiver modules are both on Arduino boards, which means
they are written in C. All of the final code is included in Appendix C.

33
Figure 17 shows the flow diagram of the code for this project. The specifics of each module are
discussed below.
The RF transceiver and the motor shield required specific code libraries to interface with the
Arduino. The libraries required for these devices were available for use on the Arduino Forums (INSERT
SOURCE) and the Adafruit website, respectively.
4.4.1 Transmitter Module
The Transmitter module is the part of the device which will be inside a room. This device works
by waiting for a signal to begin, then taking readings with the sensors. After each sensor reads distances,
the device rotates 1 step (1.8 degrees) and reads distances again. This repeats until all 200 data points
are recorded, and the data is then sent to the Receiver module.
Figure 17: Code Flow Diagram
34
4.4.2 Receiver Module
The Receiver module first waits for a signal from MATLAB to begin via serial connection. Once it
receives this signal, it transmits a Start signal to the transmitter module via the RF transceiver. Once it
sends this signal, it enters a loop and waits to receive data back from the transmitter module. Every time
it receives data, it immediately sends it to MATLAB.
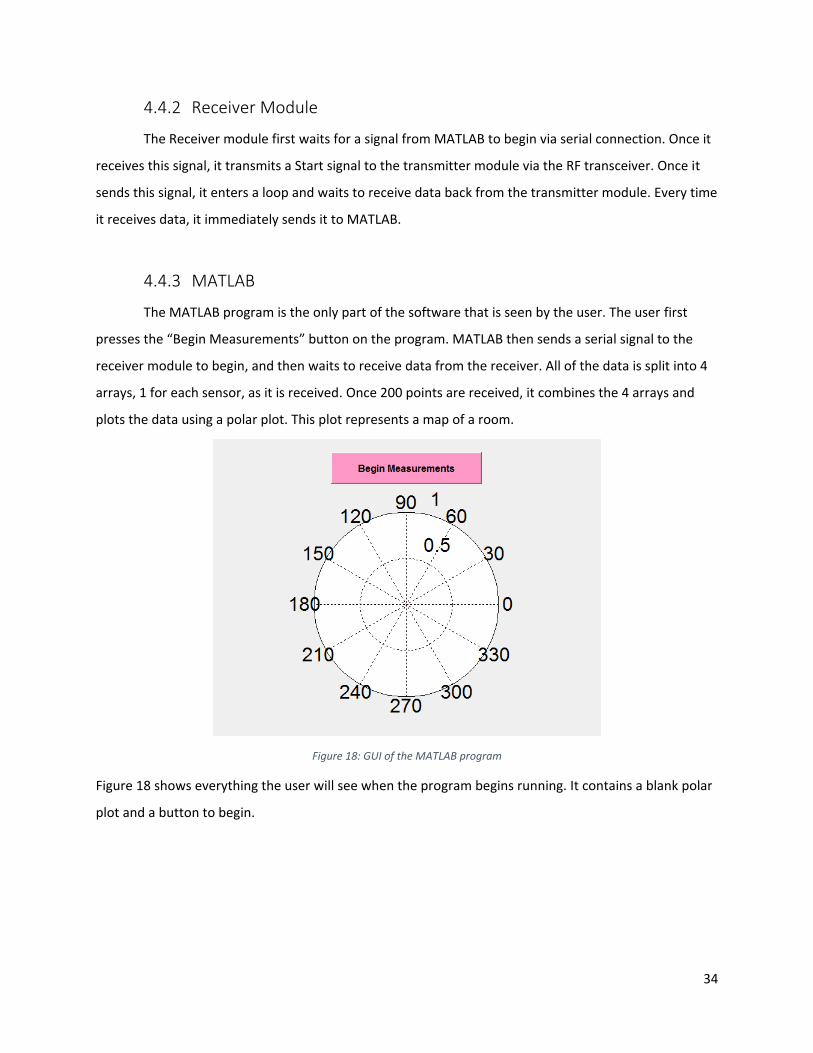
4.4.3 MATLAB
The MATLAB program is the only part of the software that is seen by the user. The user first
presses the “Begin Measurements” button on the program. MATLAB then sends a serial signal to the
receiver module to begin, and then waits to receive data from the receiver. All of the data is split into 4
arrays, 1 for each sensor, as it is received. Once 200 points are received, it combines the 4 arrays and
plots the data using a polar plot. This plot represents a map of a room.
Figure 18: GUI of the MATLAB program
Figure 18 shows everything the user will see when the program begins running. It contains a blank polar
plot and a button to begin.
35
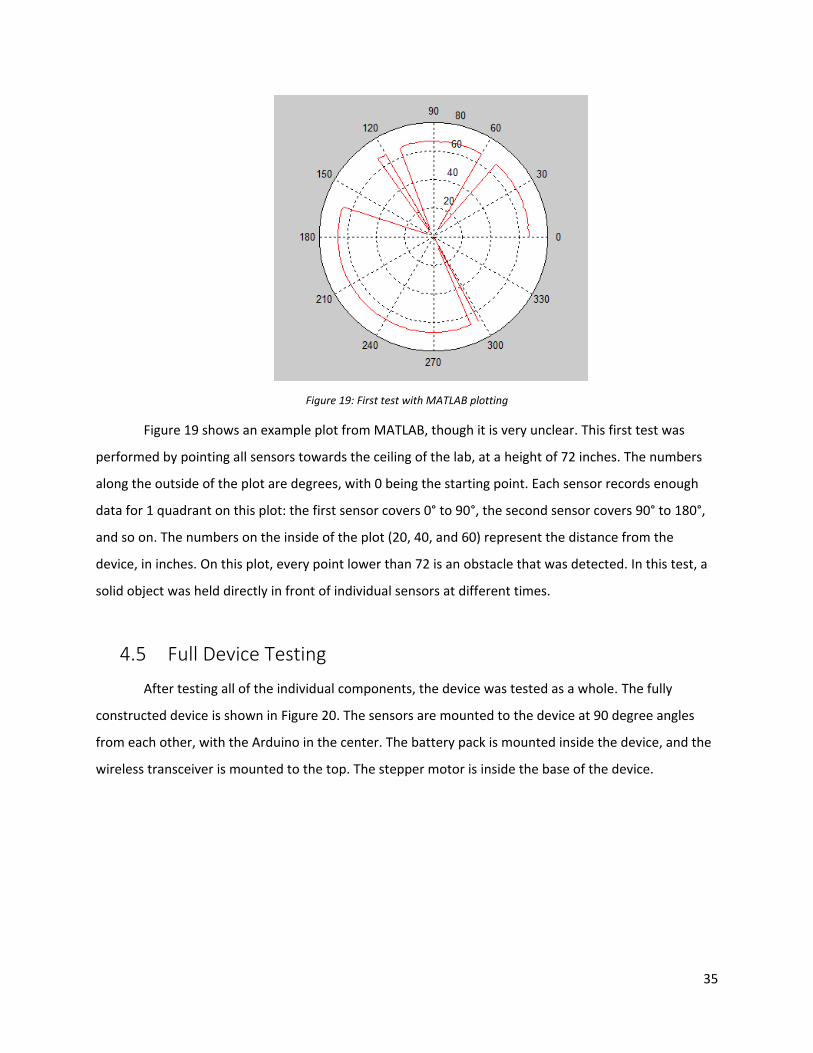
Figure 19: First test with MATLAB plotting
Figure 19 shows an example plot from MATLAB, though it is very unclear. This first test was
performed by pointing all sensors towards the ceiling of the lab, at a height of 72 inches. The numbers
along the outside of the plot are degrees, with 0 being the starting point. Each sensor records enough
data for 1 quadrant on this plot: the first sensor covers 0° to 90°, the second sensor covers 90° to 180°,
and so on. The numbers on the inside of the plot (20, 40, and 60) represent the distance from the
device, in inches. On this plot, every point lower than 72 is an obstacle that was detected. In this test, a
solid object was held directly in front of individual sensors at different times.
4.5 Full Device Testing
After testing all of the individual components, the device was tested as a whole. The fully
constructed device is shown in Figure 20. The sensors are mounted to the device at 90 degree angles
from each other, with the Arduino in the center. The battery pack is mounted inside the device, and the
wireless transceiver is mounted to the top. The stepper motor is inside the base of the device.
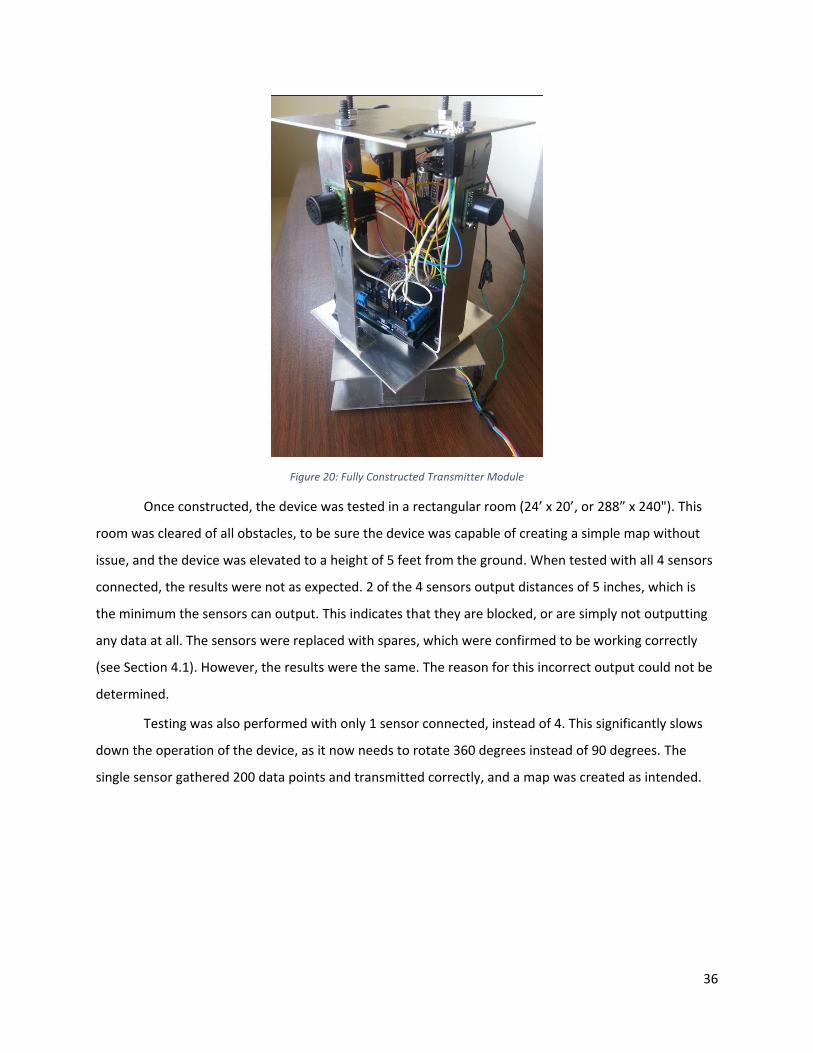
36
Figure 20: Fully Constructed Transmitter Module
Once constructed, the device was tested in a rectangular room (24’ x 20’, or 288” x 240"). This
room was cleared of all obstacles, to be sure the device was capable of creating a simple map without
issue, and the device was elevated to a height of 5 feet from the ground. When tested with all 4 sensors
connected, the results were not as expected. 2 of the 4 sensors output distances of 5 inches, which is
the minimum the sensors can output. This indicates that they are blocked, or are simply not outputting
any data at all. The sensors were replaced with spares, which were confirmed to be working correctly
(see Section 4.1). However, the results were the same. The reason for this incorrect output could not be
determined.
Testing was also performed with only 1 sensor connected, instead of 4. This significantly slows
down the operation of the device, as it now needs to rotate 360 degrees instead of 90 degrees. The
single sensor gathered 200 data points and transmitted correctly, and a map was created as intended.

37
Figure 21: Map of a room using 1 sensor
Figure 21 shows the result of the single-sensor test. This test was performed in a rectangular room, 24
feet by 20 feet. As shown, the sensor has great difficulty detecting corners inside a room. While the final
distance to the corner appears correct, the surrounding walls are clearly not shown as they should be.
The walls of the room can be seen at 0°, 90°, 180°, and 270°. These walls appear slightly curved due to
the cone-shaped beam of the sensors, as shown in Figure 22. In this figure, 3 different beams from the
same sensor are shown against a single wall or obstacle.
Figure 22: 3 Sensor Beams Overlapping
38
As the device rotates, the sensors should be detecting different parts of the wall; since the wall is flat,
the sensor readings should differ by about 1 inch. The distance between the sensor and the wall should
slightly increase. However, as shown in Figure 23, the cones of detection overlap at some points (as
indicated by the dark shade of gray). This means they are all reading the same distance, which means
the outputs will all be the same. This is not intended, and the only way to reduce this effect would be to
replace the sensors with different sensors with smaller beam widths.
39
5 Conclusion
Currently, the device is capable of receiving a signal from MATLAB in order to start operation,
gather 200 data points, and report them back to MATLAB, where a 2D plot of the room using the data is
created. This plot displayed a degree of inaccuracy, which can likely be attributed to the beam width of
the energy transmitted by the sensors: they would repeatedly report the same distance for a single wall,
instead of steadily increasing the distance as the angle from the center of the wall increased.
There are many ways this project can be expanded or improved on in the future to accomplish
the original goals. First, the inaccuracies in the graph would need to be addressed. This would be done
by replacing the LV-EZ1 with a much more accurate ultrasonic sensor, with a much smaller beam width.
This would almost certainly remove any of the problems that are currently occurring. The device would
need to be made fireproof, or at least heat resistant in some way. It is unlikely the device will be used in
a room where there is smoke but no other hazards, so it must be able to survive such an environment.
The device should also be able to handle being thrown; this is a huge step, as most of the electrical
components are fragile, especially the Arduino board. The motor must also be able to survive the
impact, which is unlikely. Most of the components would probably need to be encased in shock-
absorbent material, or replaced entirely. The device would need to land upright if thrown as well, as it
cannot create a map if all of the sensors are facing the floor. Lastly, the device would be expanded to
the 3D domain, as discussed previously. With these improvements, an ultrasonic mapping device is
certainly feasible.
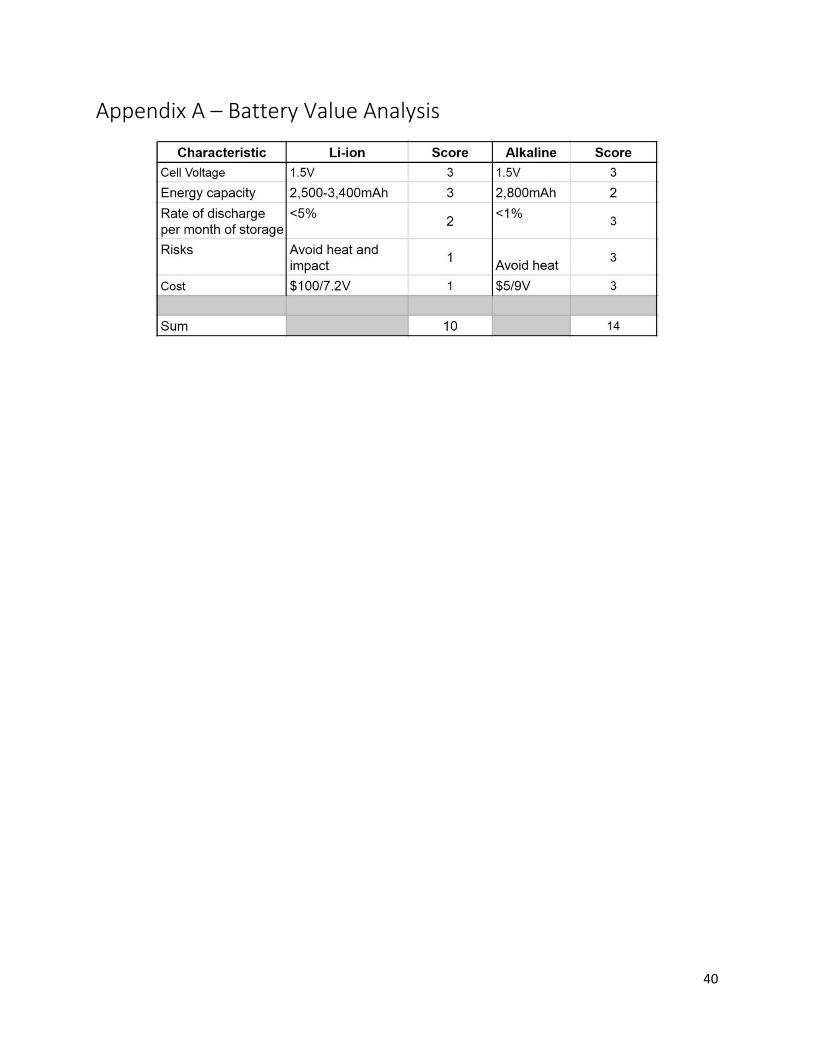
40
Appendix A – Battery Value Analysis
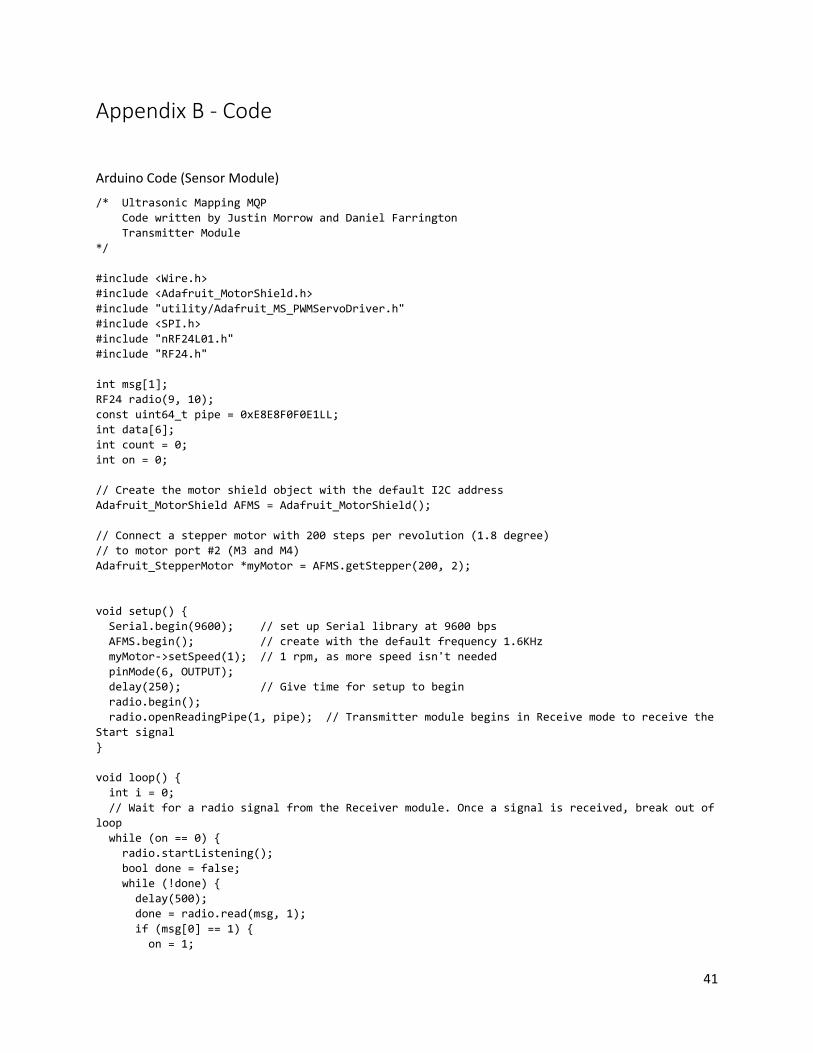
41
Appendix B - Code
Arduino Code (Sensor Module)
/* Ultrasonic Mapping MQP
Code written by Justin Morrow and Daniel Farrington
Transmitter Module
*/
#include <Wire.h>
#include <Adafruit_MotorShield.h>
#include "utility/Adafruit_MS_PWMServoDriver.h"
#include <SPI.h>
#include "nRF24L01.h"
#include "RF24.h"
int msg[1];
RF24 radio(9, 10);
const uint64_t pipe = 0xE8E8F0F0E1LL;
int data[6];
int count = 0;
int on = 0;
// Create the motor shield object with the default I2C address
Adafruit_MotorShield AFMS = Adafruit_MotorShield();
// Connect a stepper motor with 200 steps per revolution (1.8 degree)
// to motor port #2 (M3 and M4)
Adafruit_StepperMotor *myMotor = AFMS.getStepper(200, 2);
void setup() {
Serial.begin(9600); // set up Serial library at 9600 bps
AFMS.begin(); // create with the default frequency 1.6KHz
myMotor->setSpeed(1); // 1 rpm, as more speed isn't needed
pinMode(6, OUTPUT);
delay(250); // Give time for setup to begin
radio.begin();
radio.openReadingPipe(1, pipe); // Transmitter module begins in Receive mode to receive the
Start signal
}
void loop() {
int i = 0;
// Wait for a radio signal from the Receiver module. Once a signal is received, break out of
loop
while (on == 0) {
radio.startListening();
bool done = false;
while (!done) {
delay(500);
done = radio.read(msg, 1);
if (msg[0] == 1) {
on = 1;
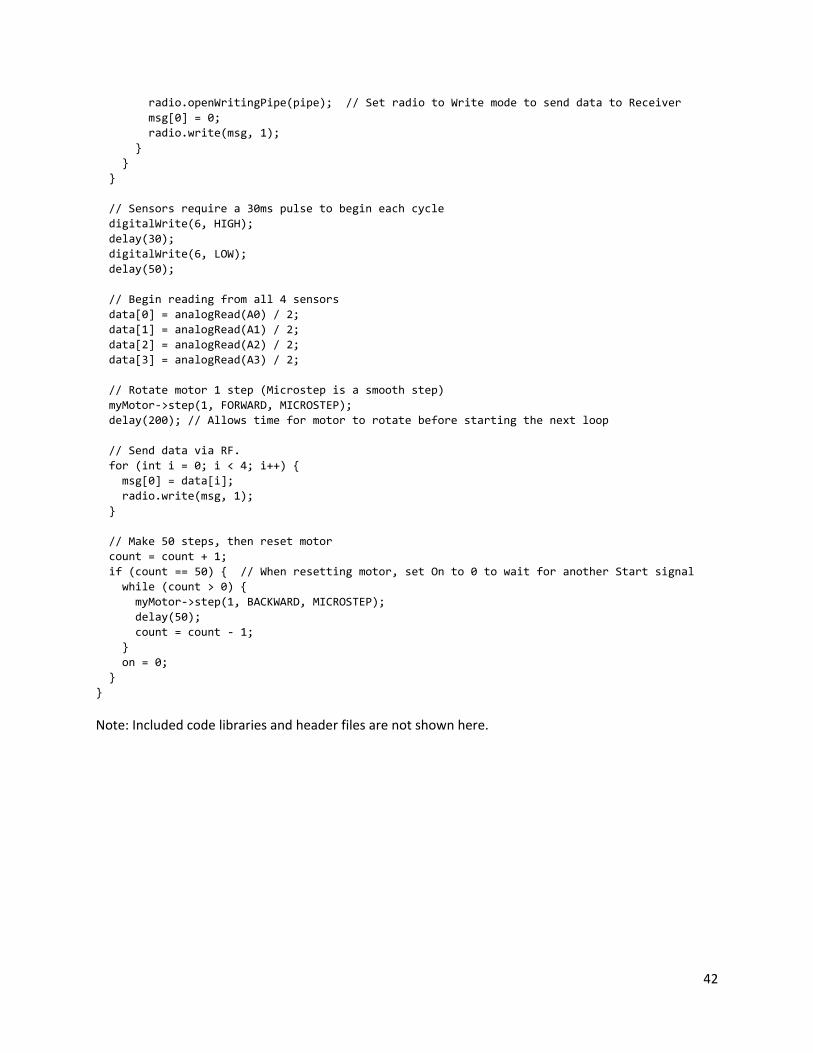
42
radio.openWritingPipe(pipe); // Set radio to Write mode to send data to Receiver
msg[0] = 0;
radio.write(msg, 1);
}
}
}
// Sensors require a 30ms pulse to begin each cycle
digitalWrite(6, HIGH);
delay(30);
digitalWrite(6, LOW);
delay(50);
// Begin reading from all 4 sensors
data[0] = analogRead(A0) / 2;
data[1] = analogRead(A1) / 2;
data[2] = analogRead(A2) / 2;
data[3] = analogRead(A3) / 2;
// Rotate motor 1 step (Microstep is a smooth step)
myMotor->step(1, FORWARD, MICROSTEP);
delay(200); // Allows time for motor to rotate before starting the next loop
// Send data via RF.
for (int i = 0; i < 4; i++) {
msg[0] = data[i];
radio.write(msg, 1);
}
// Make 50 steps, then reset motor
count = count + 1;
if (count == 50) { // When resetting motor, set On to 0 to wait for another Start signal
while (count > 0) {
myMotor->step(1, BACKWARD, MICROSTEP);
delay(50);
count = count - 1;
}
on = 0;
}
}
Note: Included code libraries and header files are not shown here.
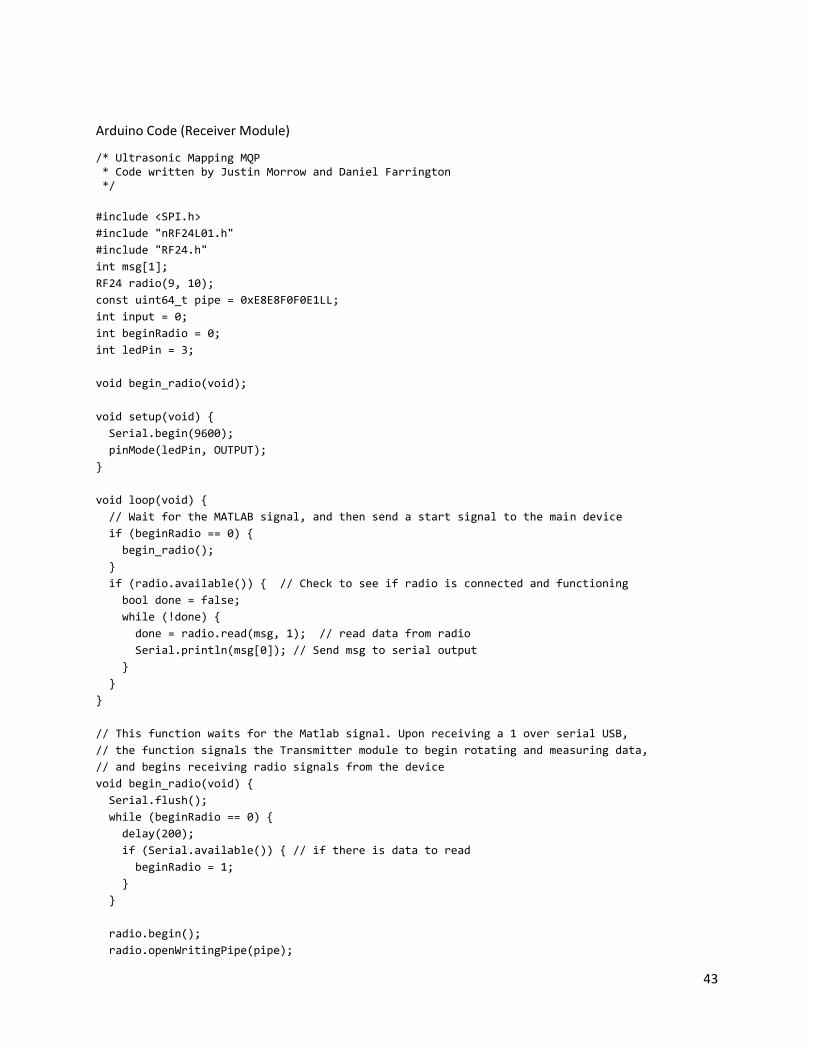
43
Arduino Code (Receiver Module)
/* Ultrasonic Mapping MQP * Code written by Justin Morrow and Daniel Farrington */
#include <SPI.h>
#include "nRF24L01.h"
#include "RF24.h"
int msg[1];
RF24 radio(9, 10);
const uint64_t pipe = 0xE8E8F0F0E1LL;
int input = 0;
int beginRadio = 0;
int ledPin = 3;
void begin_radio(void);
void setup(void) {
Serial.begin(9600);
pinMode(ledPin, OUTPUT);
}
void loop(void) {
// Wait for the MATLAB signal, and then send a start signal to the main device
if (beginRadio == 0) {
begin_radio();
}
if (radio.available()) { // Check to see if radio is connected and functioning
bool done = false;
while (!done) {
done = radio.read(msg, 1); // read data from radio
Serial.println(msg[0]); // Send msg to serial output
}
}
}
// This function waits for the Matlab signal. Upon receiving a 1 over serial USB,
// the function signals the Transmitter module to begin rotating and measuring data,
// and begins receiving radio signals from the device
void begin_radio(void) {
Serial.flush();
while (beginRadio == 0) {
delay(200);
if (Serial.available()) { // if there is data to read
beginRadio = 1;
}
}
radio.begin();
radio.openWritingPipe(pipe);
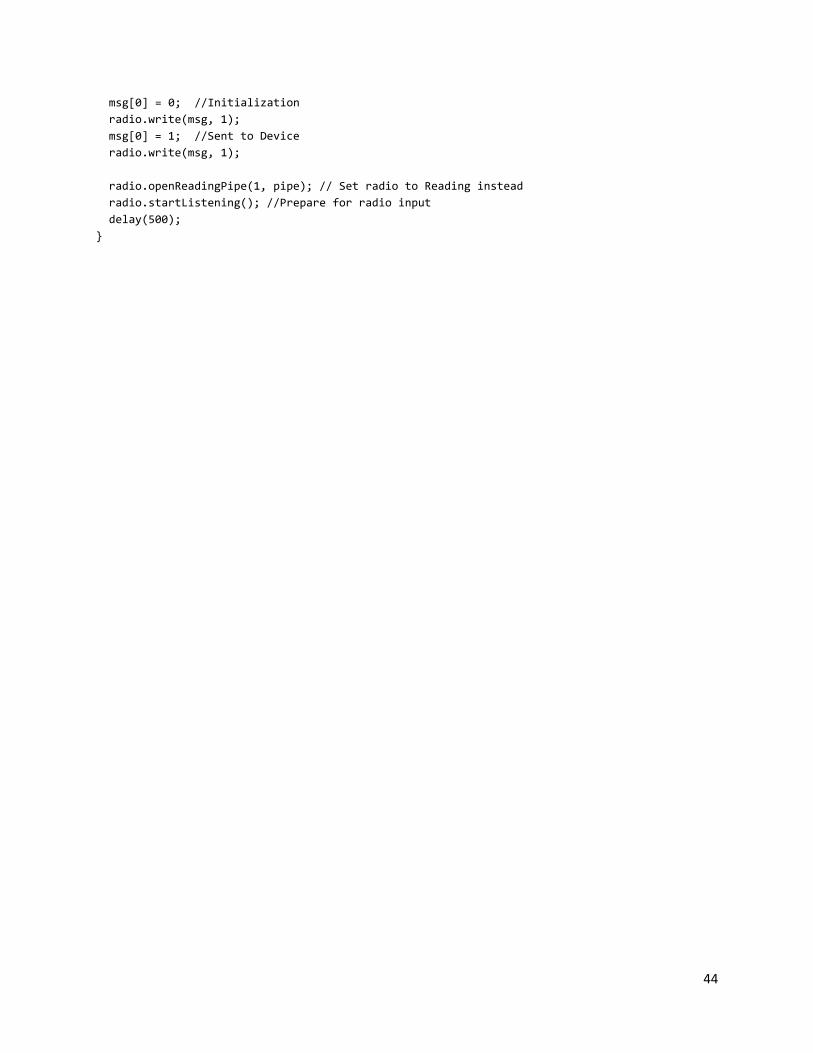
44
msg[0] = 0; //Initialization
radio.write(msg, 1);
msg[0] = 1; //Sent to Device
radio.write(msg, 1);
radio.openReadingPipe(1, pipe); // Set radio to Reading instead
radio.startListening(); //Prepare for radio input
delay(500);
}
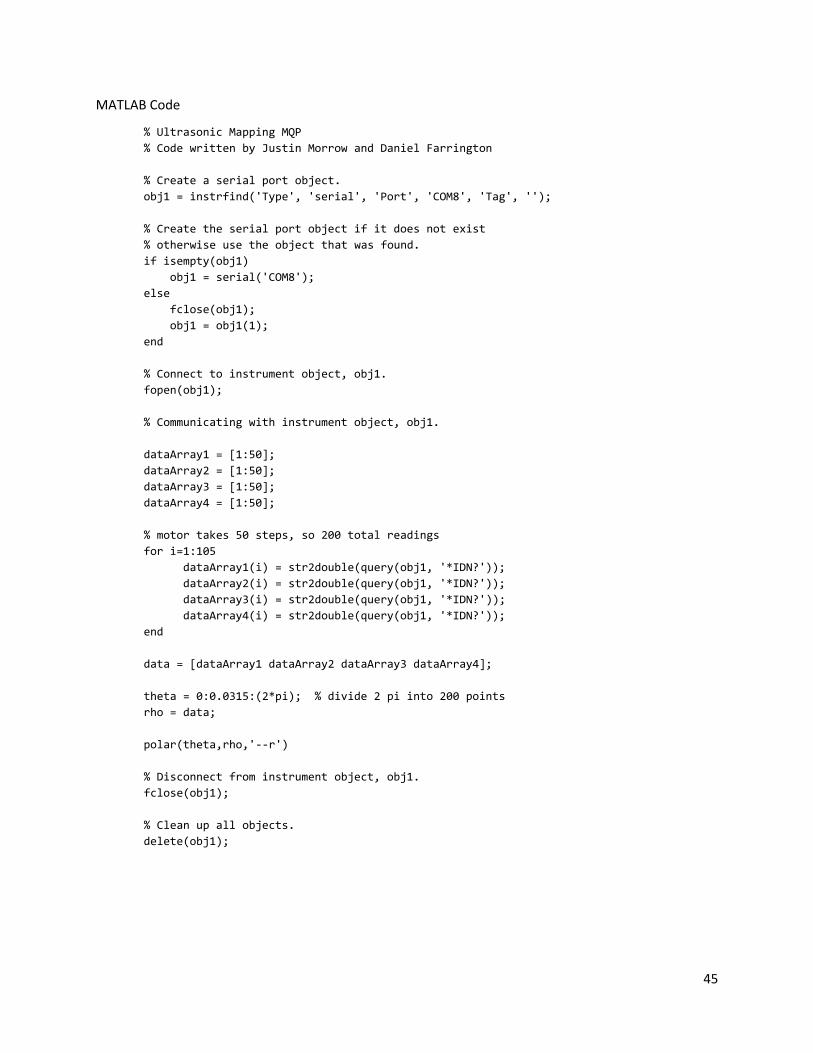
45
MATLAB Code
% Ultrasonic Mapping MQP
% Code written by Justin Morrow and Daniel Farrington
% Create a serial port object.
obj1 = instrfind('Type', 'serial', 'Port', 'COM8', 'Tag', '');
% Create the serial port object if it does not exist
% otherwise use the object that was found.
if isempty(obj1)
obj1 = serial('COM8');
else
fclose(obj1);
obj1 = obj1(1);
end
% Connect to instrument object, obj1.
fopen(obj1);
% Communicating with instrument object, obj1.
dataArray1 = [1:50];
dataArray2 = [1:50];
dataArray3 = [1:50];
dataArray4 = [1:50];
% motor takes 50 steps, so 200 total readings
for i=1:105
dataArray1(i) = str2double(query(obj1, '*IDN?'));
dataArray2(i) = str2double(query(obj1, '*IDN?'));
dataArray3(i) = str2double(query(obj1, '*IDN?'));
dataArray4(i) = str2double(query(obj1, '*IDN?'));
end
data = [dataArray1 dataArray2 dataArray3 dataArray4];
theta = 0:0.0315:(2*pi); % divide 2 pi into 200 points
rho = data;
polar(theta,rho,'--r')
% Disconnect from instrument object, obj1.
fclose(obj1);
% Clean up all objects.
delete(obj1);
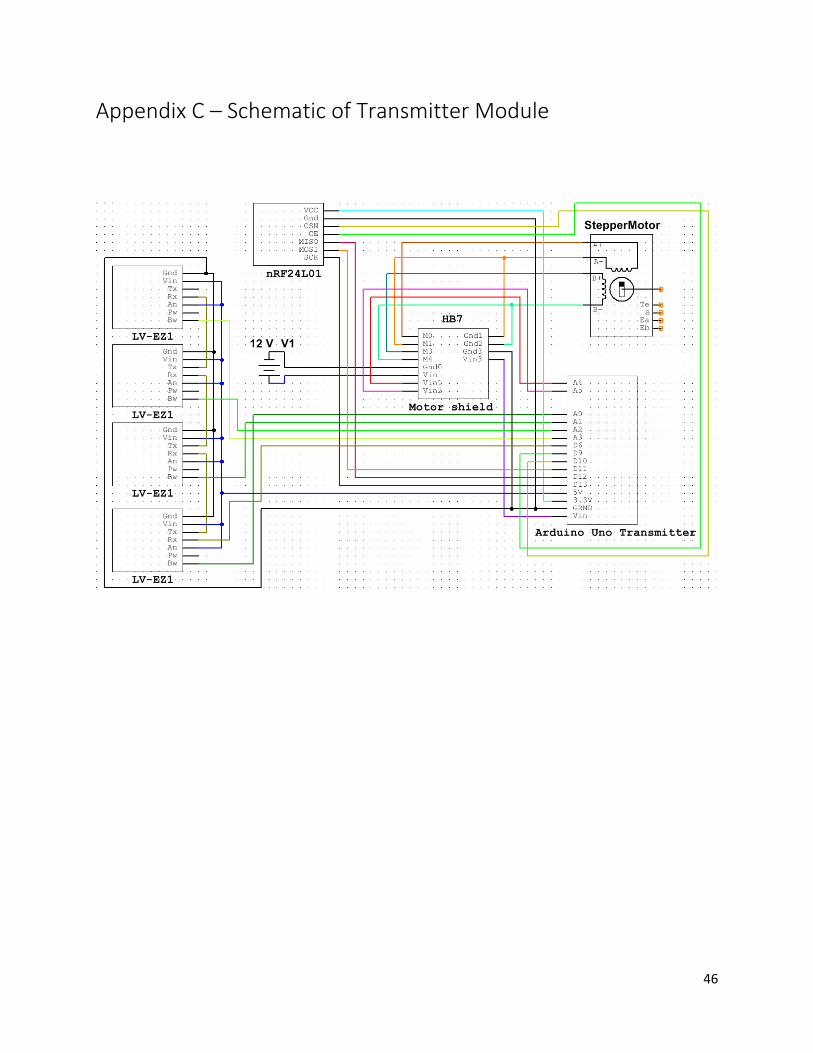
46
Appendix C – Schematic of Transmitter Module

47
Appendix D – Schematic of the Receiver Module
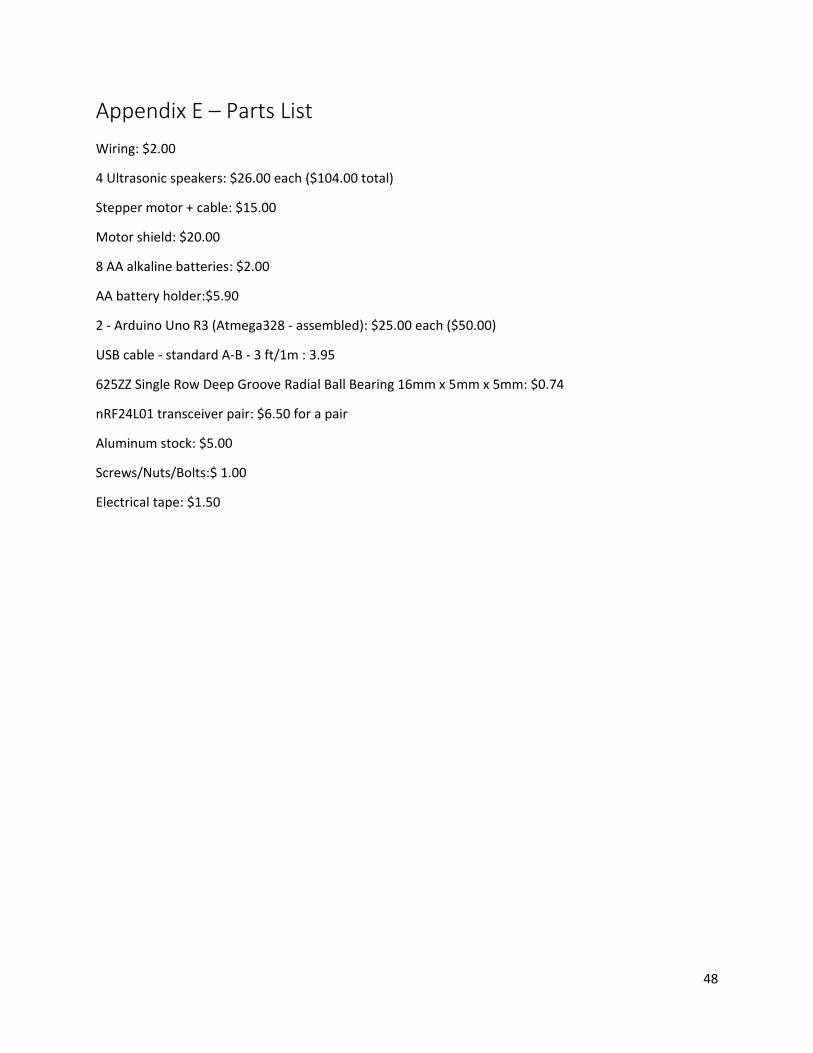
48
Appendix E – Parts List
Wiring: $2.00
4 Ultrasonic speakers: $26.00 each ($104.00 total)
Stepper motor + cable: $15.00
Motor shield: $20.00
8 AA alkaline batteries: $2.00
AA battery holder:$5.90
2 - Arduino Uno R3 (Atmega328 - assembled): $25.00 each ($50.00)
USB cable - standard A-B - 3 ft/1m : 3.95
625ZZ Single Row Deep Groove Radial Ball Bearing 16mm x 5mm x 5mm: $0.74
nRF24L01 transceiver pair: $6.50 for a pair
Aluminum stock: $5.00
Screws/Nuts/Bolts:$ 1.00
Electrical tape: $1.50
49
References
[1] Lawrence Berkeley National Laboratory, "Electromagnetic Radiation," U.S. Department of Energy,
[Online]. Available: http://www2.lbl.gov/MicroWorlds/ALSTool/EMSpec/. [Accessed 11 October
2015].
[2] Climate Science Investigations, "Electromagnetic Radiation," Florida Center for Environmental
Studies, 24 August 2015. [Online]. Available: http://www.ces.fau.edu/nasa/module-2/radiation-
sun.php. [Accessed 13 October 2015].
[3] J. W. Starr and B. Lattimer, "A Comparison of IR Stereo Vision and LIDAR for use in Fire
Environments," Virginia Tech, Blacksburg, VA, USA, 2012.
[4] NASA, "Tour of the Electromagnetic Spectrum," 15 August 2014. [Online]. Available:
http://missionscience.nasa.gov/ems/. [Accessed 17 September 2015].
[5] U.S. Navy Avionic Department, "Two-Way Radar Equation (Monostatic)," in Electronic Warfare and
Radar Systems Engineering Handbook, Point Mugu, California, Naval Air Warfare Center Weapons
Division, 2013, pp. 4.4.1 - 4.6.2.
[6] 3D Laser Mapping, 2015. [Online]. Available: http://www.3dlasermapping.com. [Accessed 16
September 2015].
[7] M. Gonglach, "How Police Laser Guns Work," LaserJammer.net, 17 December 2012. [Online].
Available: http://www.laserjammer.net/2012/how-police-laser-guns-work/. [Accessed 21
September 2015].
[8] National Oceanic and Atmospheric Administration (NOAA) Coastal Services Center, Lidar 101: An
Introduction to Lidar Technology, Data, and Applications, Charleston, SC: NOAA Coastal Services
Center, 2012.
[9] Microsoft, "Kinect Fusion," 2015. [Online]. Available: https://msdn.microsoft.com/en-
us/library/dn188670.aspx. [Accessed 23 September 2015].
[10] T. Whelan, J. McDonald, M. Kaess, M. Fallon, H. Johannsson and J. J. Leonard, "Kintinuous: Spatially
Extended KinectFusion," National University of Ireland Maynooth, 2012. [Online]. Available:
http://www.cs.nuim.ie/research/vision/data/rgbd2012/. [Accessed 18 September 2015].
50
[11] "Sonar Principle," Wikimedia Commons, 3 October 2005. [Online]. Available:
https://commons.wikimedia.org/wiki/File:Sonar_Principle_EN.svg. [Accessed 13 October 2015].
[12] "Sound Reflection," Acoustics Research Institute of the East China Sea, [Online]. Available:
http://www.sal2000.com/ds/ds3/Acoustics/Wave%20Reflection.htm. [Accessed 1 October 2015].
[13] W. C. Knight, R. G. Pridham and S. M. Kay, "Digital Signal Processing for Sonar," Proceedings of the
IEEE, Vol. 69, pp. 1451-1503, November 1981.
[14] A. Elfes, "A Sonar-Based Mapping and Navigation System," Carnegie-Mellon University, Pittsburgh,
PA, 1986.
[15] M. Peckham, "We Can Now Map Rooms Down to the Millimeter with a Finger Snap," 19 June 2013.
[Online]. Available: http://techland.time.com/2013/06/19/we-can-now-map-rooms-down-to-the-
millimeter-with-a-finger-snap/. [Accessed 21 September 2015].
[16] J. Troiano, "How do Lithium Ion Batteries Work? A Nanotechnology Explainer.," 15 October 2013.
[Online]. Available: http://sustainable-nano.com/2013/10/15/HOW-DO-LITHIUM-ION-BATTERIES-
WORK/. [Accessed 1 October 2015].
[17] J. M. A.D. Putorti Jr, "Full-Scale House Fire Experiment for InterFIRE VR," InterFIRE, 6 May 1998.
[Online]. Available: http://www.interfire.org/features/fire_experiment.asp. [Accessed 29
Sempember 2015].
[18] MaxBotix Inc., "LV-MaxSonar -EZ Series," [Online]. Available: http://maxbotix.com/documents/LV-
MaxSonar-EZ_Datasheet.pdf. [Accessed 3 October 2015].
[19] Arduino, "Arduino Uno Overview," 2016. [Online]. Available:
https://www.arduino.cc/en/Main/ArduinoBoardUno. [Accessed 21 January 2016].
[20] Adafruit, "Adafruit Motor Shield V2 for Arduino," [Online]. Available:
https://learn.adafruit.com/adafruit-motor-shield-v2-for-arduino. [Accessed 15 January 2016].
[21] l. ada, "Using Stepper Motors," Adafruit, 4 May 2015. [Online]. Available:
https://learn.adafruit.com/adafruit-motor-shield-v2-for-arduino/using-stepper-motors. [Accessed
10 December 2015].
[22] "Stepper Motor with Cable," SparkFun, [Online]. Available:
https://www.sparkfun.com/products/9238. [Accessed 30 November 2015].
51
[23] "nRF24L01," Nordic Semiconductor, [Online]. Available:
http://www.nordicsemi.com/eng/Products/2.4GHz-RF/nRF24L01. [Accessed 30 November 2015].
[24] Sunnyflorida, "nRF24L01 and UNO R3 Tutorial," Arduino, 22 December 2012. [Online]. Available:
http://forum.arduino.cc/index.php?topic=138663.0. [Accessed 15 November 2015].
[25] "Disposable vs. Rechargeable Batteries," Real Simple Home & Lifestyle Network, 2015. [Online].
Available: http://www.realsimple.com/work-life/technology/shopping-gadgets/disposable-
rechargeable-batteries. [Accessed 21 September 2015].
[26] N. Brazeau, F. Dzefi, J. Koech and N. Mosher, "3-D Room Surface Mapping," University of
Massachusetts, [Online]. Available:
http://www.ecs.umass.edu/ece/sdp/sdp12/parente/mdrreportfinal.pdf. [Accessed 27 September
2015].
[27] S. Carlile, "The Physical and Psychophysical Basis of Sound Location," in Virtual Auditory Space:
Generation and Applications, R.G. Landes Company, 1996, pp. 27-54.
[28] Isidor Buchmann, "Battery University," Cadex Electronics, Inc., 01 11 2010. [Online]. Available:
http://batteryuniversity.com/learn/article/whats_the_best_battery. [Accessed 12 10 2015].


