
Ultrafast Coherent Optical Signal
Processing using Stabilized Optical
Frequency Combs from Mode-
locked Diode Lasers Peter J. Delfyett
CREOL, The College of Optics and Photonics, University of Central Florida, Orlando, Florida 32816-2700
University of California
Santa Barbara, CA
December 5, 2012

2
Outline
• Motivation – Background
• Key Technologies
– Stabilized Optical Frequency Combs
– Arcsine Phase & Linear Intensity Modulators w/ Comb Filter
– Direct Phase Detection (w/o external local oscillator) w/ Comb Filter
• Applications
– Arbitrary Waveform Measurements
– Arbitrary Waveform Generation
– Pattern Recognition using Matched Filtering Techniques
• Summary and Conclusions

3
Motivation
Why Diode Based Fiber Lasers? • Diode lasers are small (100’s microns), electrically efficient
(>70%), wavelength agile (300 nm to >10 microns via
bandgap engineering).
• Robust, no moving / mechanical parts
• Broad bandwidth potential for large tuning bandwidth.
• Operates over very broad temperature ranges.
• Cost effective, direct electrically (battery) pumped.
• Can engineer the cavity Q to be >> than conventional cavities
• Potential for photonic integrated circuits, e.g., electronics,
lasers, modulators & detectors – full functioning
optoelectronic systems on a chip
computing & signal processing at the speed of light!

4
Ultrawideband Communications
Synthetic Aperture Imaging Sensing, Detecting and Response
Applications Enabled By Optical Frequency Combs
Advanced Waveform Generation/Measurement

5
Time Interleaved Pulse Trains Time Overlaid Pulse Trains
Interleaved Supermode Spectra Overlaid Supermode Spectra
P
ow
er
Time
Po
wer
Optical Frequency
Am
pli
tud
e
Time
Po
wer
Po
wer
Time
Optical Frequency
Am
pli
tud
e
Po
wer Time
ei
ei2
E(-)
E(-2)
E()
2
Po
we
r
eit
eit2t
fML
c/L
TC=L/c
c/L
fML
T= 1/fML
A1=1
A2=1
A3=0.5
Harmonic Modelocked Lasers Schematic Representations

6
0 200 400 600 800 1000 12000
50
100
150
200
250Intensity of Optical Pulse Train
Time
Inte
nsity
0 100 200 300 400 500 600 700 800 900 1000
195
200
205
210
215
220
225
230
235
Intensity of Optical Pulse Train
Time
Inte
nsity
210 220 230 240 250 260 270 280 290 300 3100
0.1
0.2
0.3
0.4
0.5
0.6
0.7
0.8
0.9
1
Optical Spectrum of Pulse Train
Frequency
Watt
s/H
z
20 40 60 80 100 120 140
-80
-60
-40
-20
0
20
RF Power Spectrum of Pulse Train
Frequency
dB
/Hz
Supermode Noise Spurs
(a)
(c)
(b)
(d)
Optical Pulse Train Intensity Optical Pulse Train Intensity
Optical Spectrum of Pulse Train RF Power Spectrum of Pulse Train

7
Low Noise Modelocked Diode Lasers
Via
Stabilization of the Frequency Comb

8
Fundamentally Modelocked Lasers
Time
Optical Frequency
fmod=c/L
=10 GHz
L
c/L
T=100 ps
~
Po
wer
Po
wer
Log Frequency
RF Power Spectrum
Corner frequency moves to
large offset frequencies w/ short cavities
1 pulse in the cavity
Corner
Frequency
SOA
System Noise Floor
RF Power Spectrum
Frequency

9
Harmonically Modelocked Lasers
Time
Optical Frequency
fmod=Nc/L
=10 GHz
L
c/L
T=100 ps
~
SOA
Po
wer
Po
wer
Log Frequency
RF Power Spectrum
Supermodes
System Noise Floor
Example: Ring Laser
Mode Spacing=10 MHz
fmod= 10 GHz
N=1000
N pulses in the cavity
N Independent longitudinal
mode groups
Coupled Modes
Corner
Frequency
10GHz RF Power Spectrum

10
Harmonic Modelocking & Supermode
Suppression
Fmod=nc/L
= 10GHz
L
T=100 psec
~
Time
Optical Frequency
10GHz
T=100 psec
P
ow
er
Po
wer
Time
Optical Frequency
10GHz
T=100 psec
Po
wer
Po
wer
SOA
=10GHz
Fmod=nc/L
=10GHz
L
~
Supermode
Suppression Filter
SOA

11
Ii
T
1 R exp i d i
64
0.0 I2i
T2
1 R2 exp i di
8
0.0
0
0.2
0.4
0.6
0.8
1
1.2
0
0.2
0.4
0.6
0.8
1
1.2
Frequency
Tran
smis
sio
n
Frequency
Tran
smis
sio
n
(a)
(b)
Nested Optical Cavities
R1=R2=90%; T1=T2 =10%; FSR2 / FSR1 =8
Cavity Product Identical to R=99%; T=1%

12
Harmonically Mode-locked Lasers &
Supermode Suppression
ν
Modulation rate
The etalon free spectral range must match the mode-locking rate.
Laser cavity modes must coincide with etalon transmission peaks.
Mode spacing
Etalon transmission
Laser cavity
10.24 GHz
SOA
IM
PC I
PC
DCF
DC
etalon
PC
PC
DCF
FL
SOA: semiconductor optical amplifier
PC: polarization controller
IM: intensity modulator
I: isolator
DCF: dispersion compensating fiber
FL: fiber launcher
FL

13
Setup
SOA
VOD OPS
IM
I I
PC PC
PC
Output
DC
PC
Free Space
Optics FPE
PM
Cir
PBS
PID
O PS
PC
PC
PD
640 MHz
Laser Cavity
PDH Loop
I: isolator
SOA: semiconductor optical
amplifier
OPS: Optical phase shifter
PD: photodetector
PC: polarization controller
IM: intensity modulator
PBS: polarization beam splitter
FPE: Fabry-Perot etalon
PID: PID controller
PM: phase modulator
Cir : optical circulator
OPS: Optical Phase Shifter
VOD: Variable Optical Delay
DCF: Dispersion Comp. Fiber
PDH: Pound Drever Hall
Ultra-low noise osc.
at 10.287GHz

14
Laser is constructed on a optical breadboard and thermally and
acoustically isolated with foam insulation.
Actively MLL with intracavity 1000 Finesse
etalon

15
The pulses are compressed to 1.1 ps autocorrelation FWHM by using a
dual grating compressor.
Sampling scope and autocorrelation traces
Actively MLL with intracavity 1000 Finesse
etalon

16
•The 10 dB spectral width of the optical spectrum is ~8.3nm.
•The comb line has a ~50dB signal-to-noise ratio
Optical spectrum
Actively MLL with intracavity 1000 Finesse
etalon
High Resolution – Comb Line
17
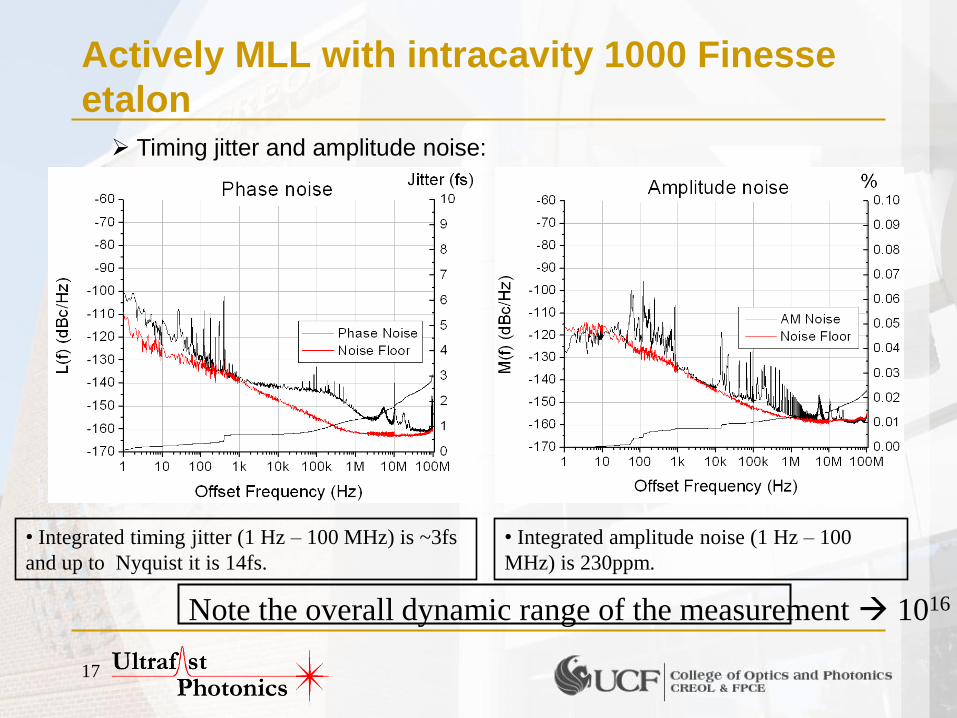
Timing jitter and amplitude noise:
Actively MLL with intracavity 1000 Finesse
etalon
• Integrated timing jitter (1 Hz – 100 MHz) is ~3fs
and up to Nyquist it is 14fs.
• Integrated amplitude noise (1 Hz – 100
MHz) is 230ppm.
Note the overall dynamic range of the measurement 1016 )

18
•The linewidth of the laser with the 1000 Finesse etalon was measured as ~ 500 Hz
(Note the relative ratio of the carrier frequency to the linewidth ~ 1012)
•Stability of 150 kHz over 30 sec
(NB: Measurements are limited by the CW laser linewidth & stability)
MLL
CW laser
PC RFSA
OSA
-20 -10 0 10 20-70
-60
-50
-40
-30
-20
-10
0
Am
plit
ude
(d
Bm
)
Frequency (GHz)
High Resolution Spectrum Analyzer
CW laser
Stabilized Frequency Comb lines
Optical linewidth/stability measurement.
Actively MLL with intracavity 1000 Finesse
etalon
Stability
19
Low Noise Modelocked Diode Lasers
The Effect of Intracavity Power

20
SCOW Amplifier SCOWA – Slab-Coupled Optical Waveguide Amplifier
J. J. Plant, et. al. IEEE Phot. Tech. Lett., v. 17, p.735
(2005)
W. Loh, et. al. IEEE J. Quant. Electron., v. 47, p. 66
(2011)
0 5 10 15 20 25 300
3
6
9
12
15
Pout
(dBm)
Ga
in (
dB
)
1 A
2 A
3 A
4 A

21
Etalon stabilized HMLL Experimental setup
CIR: Circulator DBM: Double Balanced Mixer FPE: Fabry-Perot Etalon ISO: Isolator LPF: Low-Pass Filter OC: Output Coupler (Variable) PC: Polarization controller PD: Photodetector PID: Proportional-Integral-Differential Controller PM: Phase Modulator PS: Phase Shifter PZT: Piezoelectric Transducer (Fiber Stretcher) SOA: Semiconductor Optical Amplifier (SCOWA) VOD: Variable Optical Delay
Pound-Drever-Hall Loop
Optical Path
Electrical Path
SCOWA
IM
PC
PC
ISO ISO
FPE (FSR = 10.287 GHz)
OC
PS
PID
DBM
PD
CIR
LPF
PM
PC
PC PC
10.287 GHz
500 MHz
PC
Laser Output
Ultra-low
noise oscillator
Long fiber cavity provides narrow resonances
Fabry-Pérot Etalon provides wide mode spacing
Pound-Drever-Hall loop locks both cavities
An ultra-low noise oscillator is used to drive the laser
VOD PZT
I. Ozdur, et. al., PTL, v. 22, pp. 431-433 (2010)
F. Quinlan, et. al., Opt. Express 14, 5346-5355 (2006)
PBS

22
-80
-70
-60
-50
-40
-30
-20
Pow
er
(dB
m)
Frequency (100 MHz/div)
Span: 1 GHz
Res. BW: 1 MHz
~60 dB
High-Resolution Optical Spectrum Optical Spectrum
1544 1546 1548 1550
-70
-60
-50
-40
-30
-20
-10
Pow
er
(dB
m)
Wavelength (nm)
~60 dB
10.24 10.26 10.28 10.30 10.32-110
-100
-90
-80
-70
-60
-50
-40
-30
-20
-10
0
Rela
tive P
ow
er
(dB
)
Frequency (GHz)
Span: 100 MHz
Res. BW: 3 kHz
Radio-Frequency Spectrum
1 10 100 1k 10k 100k 1M 10M 100M
-170
-160
-150
-140
-130
-120
-110
-100
-90
-80
-70 Residual Phase Noise
Noise Floor
Poseidon Oscillator Absolute Noise
L(f
) (d
Bc/H
z)
Frequency Offset (Hz)
0.0
0.5
1.0
1.5
2.0
2.5
3.0
Inte
gra
ted T
imin
g J
itte
r (f
s)
Single sideband phase noise spectrum
Etalon-stabilized
laser (10.287 GHz)
Etalon-stabilized
laser (10.285 GHz)
Real-time Spectrum Analyzer
Real-time spectrogram
Tim
e (3
5 s
)
4 2 0 -2 -4
Frequency Offset (MHz)
Optical Frequency Stability Measurement
Etalon-based Ultralow-noise Frequency
Comb Source

23
Oscillator characterization
-40 -30 -20 -10 0 10 20 30 40
0.0
0.5
1.0
Compressed AC
Transform Limited AC
AC
Tra
ce (
a.u
.)
Delay (ps)
p = 930 fs
10.24 10.26 10.28 10.30 10.32
-100
-80
-60
-40
-20
0
Re
lative
Po
we
r (d
B)
Frequency (GHz)
Span: 100 MHz
Res. BW: 3 kHz
Pulses are compressible to close to the transform limit
Photodetected RF tone has >90 dB dynamic range
Intensity Autocorrelation RF Power Spectrum

24
Amplification Output power and spectral characteristics
-60
-40
-20
-60
-40
-20
1552 1554 1556 1558 1560 1562 1564
-60
-40
-20 I=4A, P
out=320 mW
I=4A, Pout
=214 mW
Directly from MLL
Op
tica
l P
ow
er
(dB
m)
Wavelength (nm)

25
1 10 100 1k 10k 100k 1M 10M 100M
-170
-160
-150
-140
-130
-120
-110
-100
-90
-80
-70(iv)
(iii)
(ii) (i) All-anomalous Cav.
(ii) Disp. Comp. Cav.
(iii) All-anomalous and Covega
(iv) Poseidon Oscillator
Noise Floor
L(f
) (d
Bc/H
z)
Frequency Offset (Hz)
(i)
0
2
4
6
8
10
In
teg
rate
d J
itte
r (f
s)
and SCOWA
Timing Jitter SSB Phase Noise Comparison

26
Outline
• Motivation – Background
• Key Technologies
– Stabilized Optical Frequency Combs
– Arcsine Phase & Linear Intensity Modulators w/ Comb Filter
– Direct Phase Detection (w/o external local oscillator) w/ Comb Filter
• Applications
– Arbitrary Waveform Measurements
– Arbitrary Waveform Generation
– Pattern Recognition using Matched Filtering Techniques
– High Precision Laser Radar w/ Unambiguous Ranging &
Velocimetry
• Summary and Conclusions

27
General Ideas for OFC Modulation
Desirable Modulator Qualities for real time OFC applications:
Current methods of modulating light intensity:
– Direct modulation of diode driving current → Frequency chirp
– External modulation:
• Electro-optic modulators (EOM) → Nonlinear modulation transfer function
and Relatively high Vπ
• Electro-absorption modulators (EAM) → Poor optical power handling,
High insertion loss and Sensitive to temperature and wavelength
Proposed concept for OFC modulation:
Injection locking a resonant cavity w/ gain (VCSEL) arcsine phase modulation
NB: Linear intensity modulator in an interferometric configuration
- Linear modulation transfer function
- Large modulation bandwidth
- Low Insertion Loss (negative..?)
- Low Vπ
- Good power handling capability
- Comb filtering, tunable, arrays

28
Injection-Locked Resonant Cavity as an “Arcsine Phase
Modulator”
ω1
ω0
Master laser
ω1
Slave laser ω0
Adler’s equation*:
φ ∆ω = 𝑠𝑖𝑛−1∆𝜔
𝜔𝑚
∆ω = 𝝎𝟏 −𝝎𝟎
2𝜔𝑚: locking range
*A. E. Siegman, Lasers, 1986
φ ∆ω
∆ω = 𝝎𝟏 −𝝎𝟎
𝛑
𝟐
−𝛑
𝟐
Locking range
ω0
ω1

29
V
f(t) ~
π/2
Iin
V
T(V)
))((sin 1 tf
I’0 ,ω1 )2
)(1(
tfII inout
Resonant cavity linear modulator • Phase response
• Stable locking range
• Calculate SFDR
f(t) ~
Iin
T(V)
)2
)cos(1(
inout II
Electro-optic Mach-Zehnder modulator
VtV /)(0
Resonant Cavity Interferometric Modulator Comparison to a Conventional MZ Modulator
outI
outI

30
Filtering &
Modulation
Optical Spectrum RF Spectrum
f1
VCSEL
Bias T
AC Modulation; f1,
DC current= I1
Phase Modulation & Filtering -Channel selection concept
I(ω)
ω f
P(f)
Ch. 1
DC=I1
Ch. 2
DC=I2
…
Ch. 1
Ch. N
Ch. 2
…
Comb Modulated Output
0 ω= ω + f1

31
Filtering &
Modulation
VCSEL
Bias T
AC Modulation; f2
DC current= I2
Phase Modulation & Filtering -Channel selection concept
…
Ch. 1
Ch. N
Ch. 2
…
Comb Modulated Output
RF spectrum
f2 f
P(f) ω= ω + f2 I(ω)
ω Ch. 1
DC=I1
Ch. 2
DC=I2
0
Optical Spectrum 8.6 8.7 8.8 8.9 9.0
193.405
193.410
193.415
193.420
193.425
193.430 Measurement
Linear fit
Fre
quency (
TH
z)
DC Driving Current (mA)
Slope ~ 50 GHz/mA
Frequency vs. Current
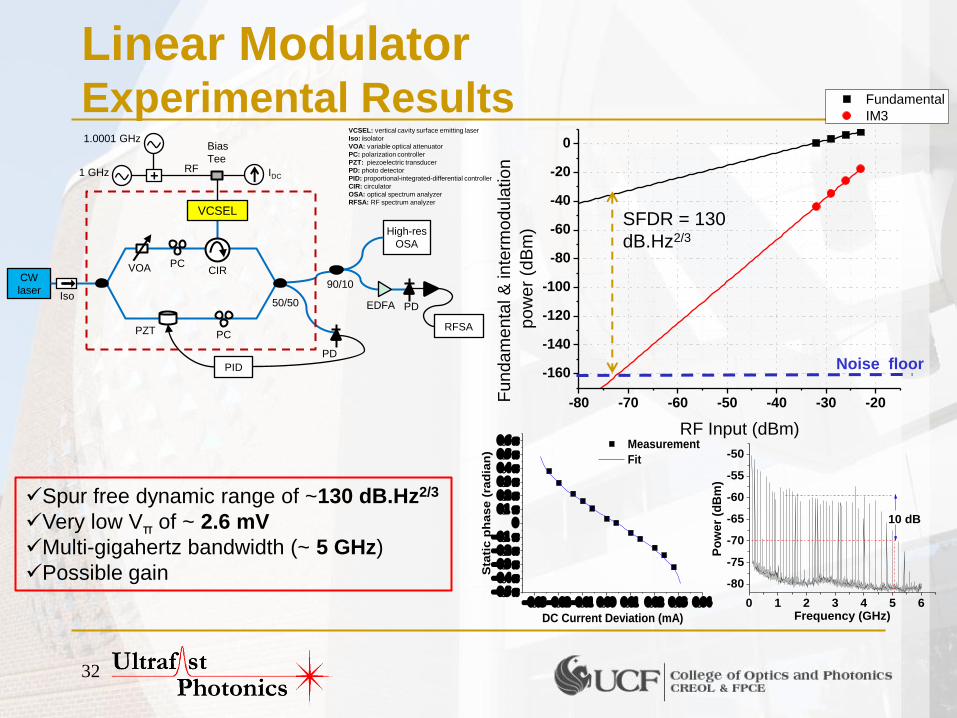
32
Linear Modulator Experimental Results
0 1 2 3 4 5 6
-80
-75
-70
-65
-60
-55
-50
Po
we
r (d
Bm
)
Frequency (GHz)
10 dB
00 00 00 000 00 00 00 000
0
0
0
0
0
0
0
0
0
0
0 Measurement
Fit
Sta
tic p
hase (
rad
ian
)
DC Current Deviation (mA)
1 GHz
1.0001 GHz
CW
laser
PID
RFSA
VCSEL
High-res
OSA
+
Bias
Tee
EDFA
IDC RF
VOA PC
50/50 Iso
PD
PD
90/10
PZT
VCSEL: vertical cavity surface emitting laser
Iso: isolator
VOA: variable optical attenuator
PC: polarization controller
PZT: piezoelectric transducer
PD: photo detector
PID: proportional-integrated-differential controller
CIR: circulator
OSA: optical spectrum analyzer
RFSA: RF spectrum analyzer
CIR
Spur free dynamic range of ~130 dB.Hz2/3
Very low Vπ of ~ 2.6 mV
Multi-gigahertz bandwidth (~ 5 GHz)
Possible gain
PC
-80 -70 -60 -50 -40 -30 -20
-160
-140
-120
-100
-80
-60
-40
-20
0
Fundamental
IM3
Fu
nd
am
enta
l &
in
term
odu
latio
n
pow
er
(dB
m)
RF Input (dBm)
Noise floor
SFDR = 130
dB.Hz2/3

33
Outline
• Motivation – Background
• Key Technologies
– Stabilized Optical Frequency Combs
– Arcsine Phase & Linear Intensity Modulators w/ Comb Filter
– Direct Phase Detection (w/o external local oscillator) w/ Comb Filter
• Applications
– Arbitrary Waveform Measurements
– Arbitrary Waveform Generation
– Pattern Recognition using Matched Filtering Techniques
– High Precision Laser Radar w/ Unambiguous Ranging &
Velocimetry
• Summary and Conclusions

34
Direct demodulation of phase
modulated signals
• Operating principle: Detecting light-induced changes in the
forward voltage of an optically injection locked VCSEL operating
above threshold.
• Physical origin: Voltage change is due to the change in the
carrier density in the active region of the VCSEL when driven by
an external phase modulated light.
V(ω)
Δω ωh
ωl ωo
I (ω) &
ψ(ω)
ω
Locking
range N. Hoghooghi, et. al, IEEE Photonics Technology
Letters, 22(20), pp. 1509-1511, 2010.

35
Phase
detector
0 π
0 π
Optical spectrum RF spectrum
0 π
0 π
f1 f2
VCSEL
Bias T
AC voltage
DC voltage
Channel filtering concept
I(ω)
ω f
P(f)
Ch. 1
fmod=f1
Ch. 2
fmod=f2
…
Ch. 1
Ch. N
Ch. 2
…

36
Demodulation & channel filtering with
an injection-locked VCSEL
PC: polarization controller
PM: phase modulator
IM: intensity modulator
CIR: circulator
OSA: optical spectrum analyzer
RFSA: RF spectrum analyzer
CW
laser IM
PM
PM
PM
VCSEL
12.5 GHz
Ch.3
(1 GHz)
Ch.2
(0.9 GHz) Ch.1
(0.8 GHz)
RFSA
OSA
DC
RF
CIR Bias T
WD
M
filter N
x1
co
mb
iner
PC
PC
PC
PC
Electrical path
Optical path
1538.2 1538.4 1538.6-60
-50
-40
-30
-20
-10
0
Po
wer
(dB
)
Wavelength (nm)
Ch.1 Ch.2 Ch.3
VCSEL

37
Experimental results of three channel
system
1538.1 1538.2 1538.3 1538.4 1538.5-60
-50
-40
-30
-20
-10
0
Wavelength (nm)
Po
we
r (d
B)
1538.1 1538.2 1538.3 1538.4 1538.5-60
-50
-40
-30
-20
-10
0
Po
we
r (d
B)
Wavelength (nm)
1538.1 1538.2 1538.3 1538.4 1538.5-60
-50
-40
-30
-20
-10
0
Po
we
r (d
B)
Wavelength (nm)
Ch.1 Ch.2 Ch.3
750 800 850 900 950 1000-95
-90
-85
-80
-75
-70
-65
RBW 30 kHz
Span 270 MHz
Po
we
r (d
Bm
)
Frequency (MHz)
SNR ~ 60
dBc/Hz
750 800 850 900 950 1000-95
-90
-85
-80
-75
-70
-65
Po
wer
(dB
m)
Frequency (MHz)
RBW 30 kHz
Span 270 MHz
SNR ~ 60
dBc/Hz
750 800 850 900 950 1000-95
-90
-85
-80
-75
-70
-65RBW 30 kHz
Span 270 MHz
Po
we
r (d
Bm
)
Frequency (MHz)
SNR ~ 62
dBc/Hz
Optical
spectra
Corresponding
detected RF
spectra
First demonstration of direct demodulation and channel filtering of
phase modulated signals with SNR of 60 dBc/Hz.

38
Linear Modulator Concept for “Pulsed” Light
Received RF signal
- A resonant cavity (Fabry-Perot) with multiple resonances, injection locked by a mode-
locked laser as the frequency comb.
- By simultaneous modulation of the period combs, one imparts arcsine phase modulation
on each injected comb.
1/frep
MLL
Fabry-Perot Laser FSR=frep
FP Optical
Frequency
FP resonances
Corresponding phase responses
Injected comb lines from the MLL
Imparted phase on each injected combs

39
Outline
• Motivation – Background
• Key Technologies
– Stabilized Optical Frequency Combs
– Arcsine Phase & Linear Intensity Modulators w/ Comb Filter
– Direct Phase Detection (w/o external local oscillator) w/ Comb Filter
• Applications
– Arbitrary Waveform Measurements
– Arbitrary Waveform Generation
– Pattern Recognition using Matched Filtering Techniques
• Summary and Conclusions

40
Multi-heterodyne detection of
frequency combs Motivation
• Extremely complex arbitrary waveforms can be generated with
frequency combs
• Instantaneous bandwidth in the order of several THz
W
D
M
W
D
M
PM AM
PM AM
… … Mode-locked
laser
dt ~ 1/BW
f
A
f f
A
f
BW
WDM

41
ff(1)rep
2f(1)rep
f(2)rep
δ
δ
Δ
RF
Po
we
r Sp
ect
ral D
en
sity
½f(1)rep
Photo-detection
ν
Δ Δ+δ Δ+2δ
f(1)rep
ν
f(2)rep
Op
tica
l P
ow
er
Spe
ctra
l De
nsi
ty
Comb Source
Comb Source
D
Oscilloscope
RFSA
Diagnostics
frep
PLLLPF
(a)
(b)
Multi-heterodyne Detection of
Frequency Combs (Optical Sampling)
•Each pair of comb-lines generates a unique RF beat-note
•The RF beat-note retains the relative phase between the comb-lines

42
Multi-heterodyne detection of
frequency combs Experimental results – Mode-locked laser combs
Effective repetition rate detuning ~600 kHz
Total Optical BW ~ 17nm → ~2.12THz
Compression factor ~ 17,000x
10 GHz spacing optical comb is mapped into a 600 kHz spacing RF comb
Optical spectra
1500 1600 1475 1575 1550 1525 Wavelength (nm)
Po
wer
(5 d
B/d
iv.)
First two sets of RF beat notes
50 250 0 200 150 100 Frequency (MHz)
Pow
er (
dB
m) -50
-60
-70
Frequency (MHz) 140 160 180
-50
-60
-70
-80 Pow
er (
dB
m)
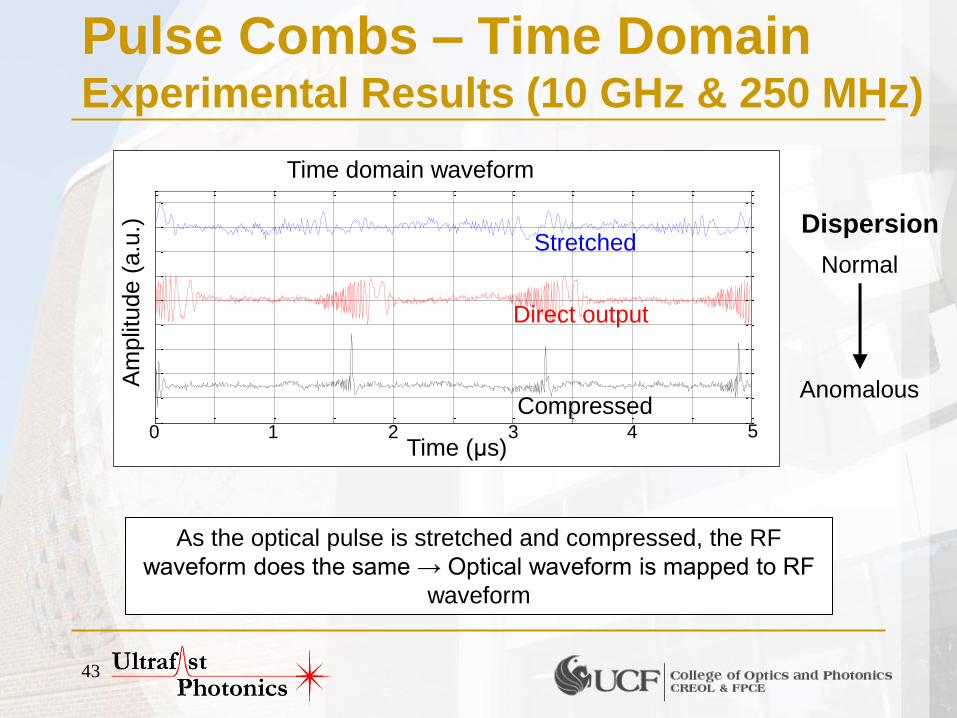
43
Pulse Combs – Time Domain Experimental Results (10 GHz & 250 MHz)
As the optical pulse is stretched and compressed, the RF
waveform does the same → Optical waveform is mapped to RF
waveform
Normal
Anomalous
Dispersion
0 0.5 1 1.5 2 2.5 3 3.5 4 4.5 5-50
-40
-30
-20
-10
0
10
20
30
40
time [s]
Vo
lta
ge
[m
V]
1 2 3 4 0 5 Time (μs)
Am
plit
ude (
a.u
.)
Time domain waveform
Stretched
Direct output
Compressed

44
Phase Modulated CW Combs Experimental Results
Real time
oscilloscope
RFSA CW Laser Phase
Modulator
~10 GHz
Erbium Fiber
Mode-locked
Laser

45
Multi-heterodyne detection of
frequency combs Experimental results – Phase modulation combs
1 2 3 4 Time (s)
0
0
-20
-40
20
40
Am
pli
tude
(mV
)
Time domain waveform
1 2 3 4 Time (s)
0
70
60
80
90
Inst
anta
neo
us
Fre
quen
cy (
MH
z) Instantaneous frequency
65 70 75 80 Frequency (MHz)
60
Am
pli
tude
(a.u
.)
Fourier transform
Phas
e (
)
-1
0
1
The optical waveform chirp is mapped to the
RF waveform
Spectral phase information can be retrieved

46
Outline
• Motivation – Background
• Key Technologies
– Stabilized Optical Frequency Combs
– Arcsine Phase & Linear Intensity Modulators w/ Comb Filter
– Direct Phase Detection (w/o external local oscillator) w/ Comb Filter
• Applications
– Arbitrary Waveform Measurements
– Arbitrary Waveform Generation
– Pattern Recognition using Matched Filtering Techniques
• Summary and Conclusions

47
Optical DACs using Frequency
Comb Filtering – Static Approach
T
T
1/T
1/T
Time
Time
Frequency
Frequency
Inte
nsi
ty
Inte
nsi
ty
Inte
nsi
ty
48
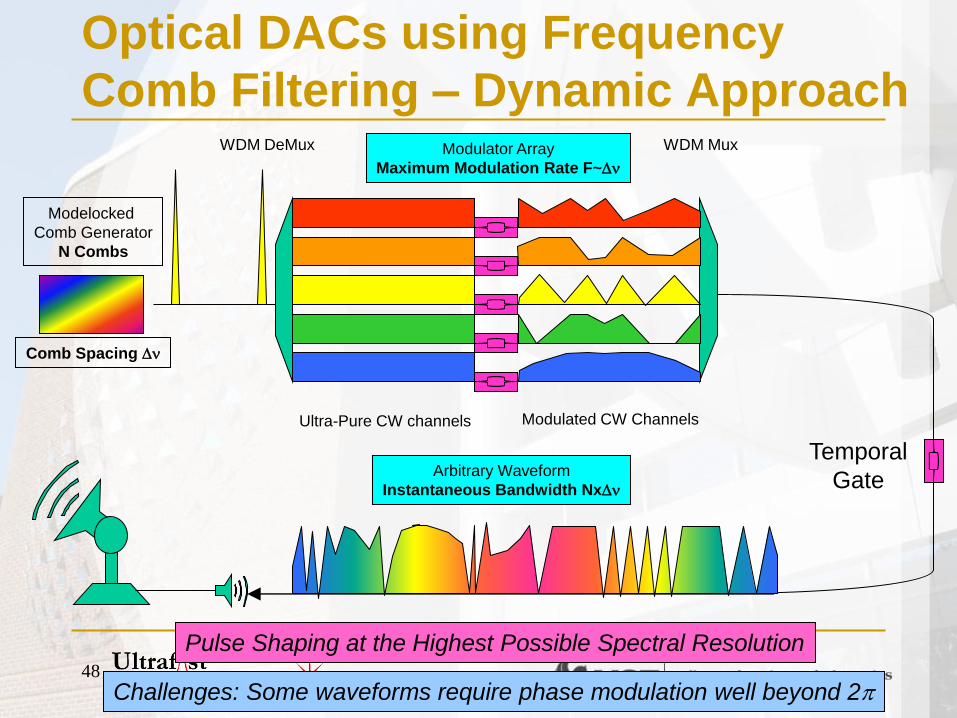
Modelocked
Comb Generator
N Combs
WDM DeMux Modulator Array
Maximum Modulation Rate F~
WDM Mux
Arbitrary Waveform
Instantaneous Bandwidth Nx
Ultra-Pure CW channels Modulated CW Channels
Comb Spacing
Temporal
Gate
Pulse Shaping at the Highest Possible Spectral Resolution
Challenges: Some waveforms require phase modulation well beyond 2
Optical DACs using Frequency
Comb Filtering – Dynamic Approach
49 49
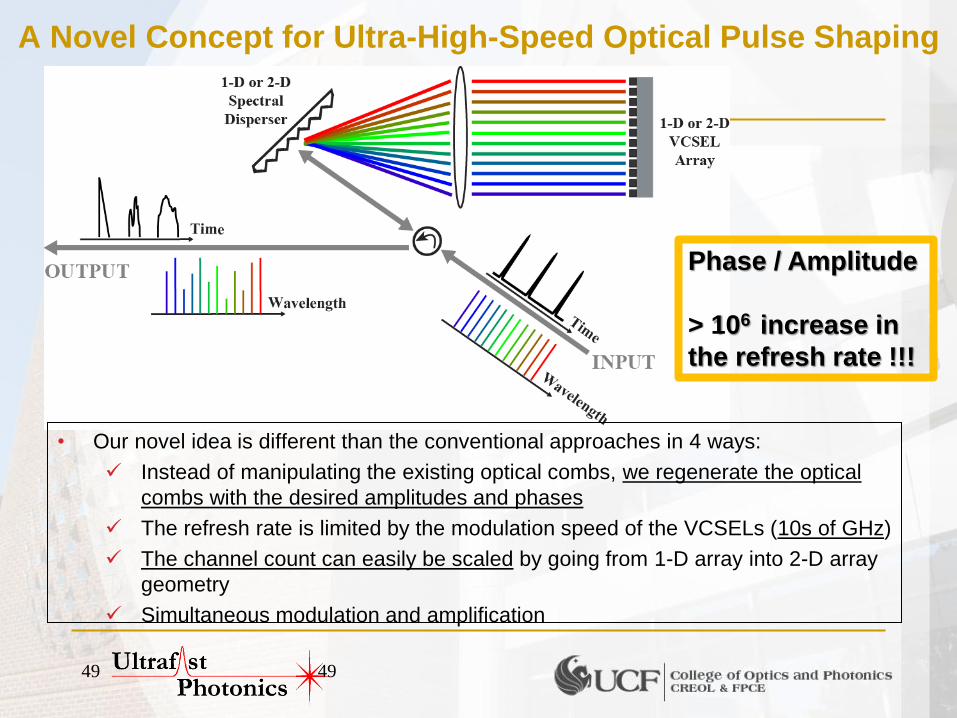
A Novel Concept for Ultra-High-Speed Optical Pulse Shaping
• Our novel idea is different than the conventional approaches in 4 ways:
Instead of manipulating the existing optical combs, we regenerate the optical
combs with the desired amplitudes and phases
The refresh rate is limited by the modulation speed of the VCSELs (10s of GHz)
The channel count can easily be scaled by going from 1-D array into 2-D array
geometry
Simultaneous modulation and amplification
Phase / Amplitude
> 106 increase in
the refresh rate !!!

50
High-speed Reconfigurable Optical
Arbitrary Waveform Generation
• Four optical comblines, independently modulated and
coherently combined
• Wavelength demux and mux pair
– 6.25 GHz channel spacing
• Each modulator – Injection-locked VCSEL with
current modulation

51
1538
.80
1538
.85
1538
.90
1538
.95
1539
.00
1539
.05
1539
.10
1539
.15
1539
.20
1539
.25
1539
.30
1539
.35
1539
.40
1539
.45
1539
.50
1539
.55
1539
.60
-70
-60
-50
-40
-30
-20
-10
0
Pow
er
(dB
m)
Wavelength (nm)
0.0 0.1 0.2 0.3 0.4 0.5-5.0
0.0
5.0
10.0
15.0
20.0
25.0
30.0160 ps
Vo
lta
ge
(m
V)
Time (ns)
~30 ps
Experimental Setup Optical Frequency Comb Source
• Generated by modulation
of CW laser
• Adjust DC bias voltages,
RF phases and amplitudes
to achieve five combs of
equal power

52
Experimental Setup Demux, Mux Specifications
• Essex Hyperfine WDM filters
– Fiber-pigtailed input and outputs
– Channel spacing of 6.25 GHz
– Adjacent channel isolation ~ 22
dB
– Gaussian shaped passband
– 3 dB channel bandwidth ~ 3.5
GHz
• Mux, Demux are a matched pair

53
Intensity Profile of Rapidly
Updated Optical Waveforms VCSEL 1 2 3 4
RF frequency (MHz) 4 5 6 7
VCSEL 1 2 3 4
RF frequency (MHz) 1562.5 3125 781.25 2343.75
5.120n 6.400n0
100m
200m
Voltage (
V)
Time (s)
0.00
1.28
n
2.56
n
3.84
n
5.12
n
6.40
n
7.68
n
8.96
n0
100m
200m
Voltage (
V)
Time (s)
Photodetected RF spectrum
0.00 6.25G 12.50G 18.75G 25.00G
-60
-40
-20P
ow
er
(dB
m)
Frequency (Hz)

54
VCSEL 1 2 3 4
RF frequency (MHz) 1562.5 3125 781.25 2343.75
194.
747
194.
754
194.
760
194.
766
194.
772
194.
778
194.
785
-60
-50
-40
-30
-20
-10
VCSEL 1 2 3 4
Freq.(MHz) 1562.5 3125 781.25 2343.75
RF (dBm) -13 +2 -19 -14
VCSEL 3 IL 2010-10-13-1.trc
Po
we
r (d
Bm
)
Frequency (THz)
Optical Spectrum
Intensity Profile of Rapidly
Updated Optical Waveforms

55
Reconfigurable Cross Connect Switch /
Pulse Shaping Code Reconfiguration
Information from any wavelength can be arbitrarily switched
between channelsat rates approaching channel spacing.
100 times faster that the existing MEMS technology.
DC3
DC4
DC1
DC2
DC1
DC2
DC3
DC4

56
Outline
• Motivation – Background
• Key Technologies
– Stabilized Optical Frequency Combs
– Arcsine Phase & Linear Intensity Modulators w/ Comb Filter
– Direct Phase Detection (w/o external local oscillator) w/ Comb Filter
• Applications
– Arbitrary Waveform Measurements
– Arbitrary Waveform Generation
– Pattern Recognition using Matched Filtering Techniques
• Summary and Conclusions

57
Matched Filtering using OFC’s

58
Comparison to OCDMA • Optical Code Division Multiple
Access (OCDMA)
– Spectral modulation, temporal
spread
• Decoding:
– Needs non-linear optical
thresholding because of slow
response time of photodetectors
• Coherent detection technique
is linear
– Requires less optical power
Heritage and Weiner, IEEE JSTQE, 2007
Jiang et al., IEEE PTL, 2004

59
Complete Experimental Setup

60
Interference using Orthogonal
Codes • Using orthogonal codes gives best contrast between
different binary sequences
- PD
PD
Differential
signal
λ
0,π,0,π
1 2 3 4
λ
0,0,0,0
1 2 3 4
λ 1 2 3 4
λ 1 2 3 4
0
- PD
PD
Differential
signal
λ
0,0,0,0
1 2 3 4
λ
0,0,0,0
1 2 3 4
1
λ 1 2 3 4
λ 1 2 3 4
1111
1111
1111
1111
DCode
C Code
BCode
ACode

61
5.11
mismatchmatch
mismatchmatchQ
301022
1
QerfcBER
, Summary of Results of Matched Filtering

62
Outline
• Motivation – Background
• Key Technologies
– Stabilized Optical Frequency Combs
– Arcsine Phase & Linear Intensity Modulators w/ Comb Filter
– Direct Phase Detection (w/o external local oscillator) w/ Comb Filter
• Applications
– Arbitrary Waveform Measurements
– Arbitrary Waveform Generation
– Pattern Recognition using Matched Filtering Techniques
• Summary and Conclusions

63
Summary • Demonstrated key technologies and applications using OFC’s
• Key Technologies
– Stabilized optical frequency combs (1.5 fsec jitter; <1kHz, 10Hz)
• Lowest noise mode-locked comb source at 10 GHz & 1550nm
– Linear intererometric intensity modulators & channel filtering
• First linear interferometric modulator (130 dB/Hz2/3 SFDR, Vπ =2.6mV)
– Direct phase detection and channel filtering (>60 dBc/Hz)
• Applications
– Arbitrary waveform measurements (A to D Converter )
• Reconstruction of Incoherent (Independent) Sources
– Arbitrary waveform generation (D to A Converter)
• Fastest true real-time waveform generation (Mod Rates: >3GHz; IB: >22 GHz)
– Matched filtering w/ differential photodetection (BER=10-30)
64

65
• Optical intensity and phase response vs. Δω
– Δω controlled via current modulation of VCSEL
• Intensity change is small
• Phase difference between master and slave light, φ0 :
Fundamentals of Injection Locking Using VCSELs as Modulators
Locking range = ωL
ωfr ω ω1
A.E. Siegman, Lasers, Chap. 29, University Science Books, 1986
F. Mogensen, et al., IEEE J. Quantum Electronics., vol. 21, 1985
Phase response
Output intensity
tansin 11
0
f
L
α – Linewidth enhancement factor
Ph
ase
Δω =ω1 – ωfr
f 1
0 cot2
Slave Laser
(VCSEL)
Master
Laser
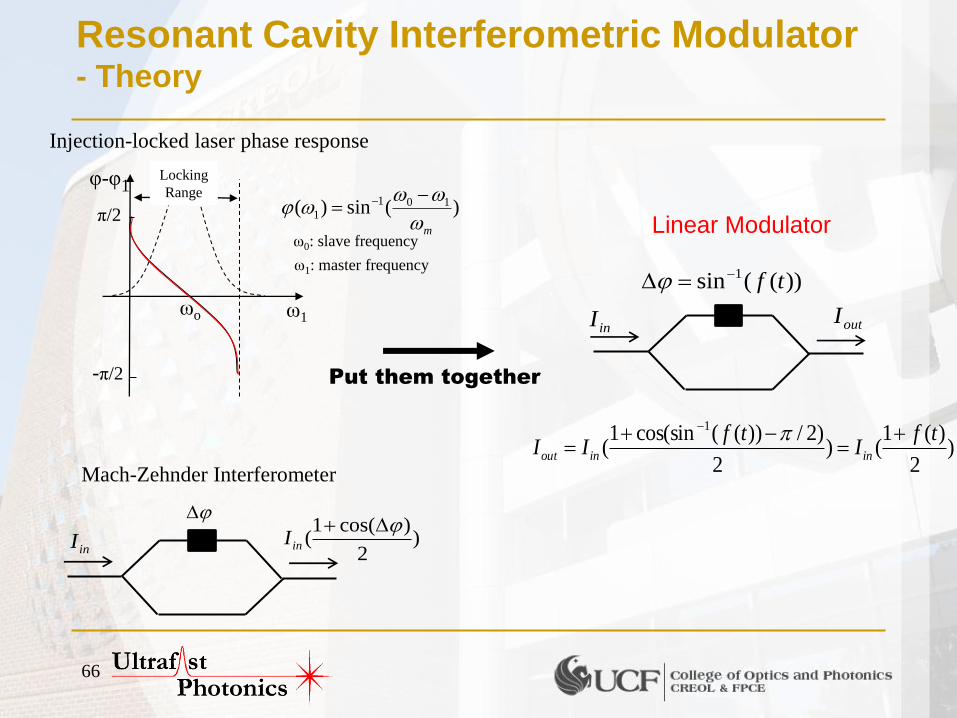
66
Resonant Cavity Interferometric Modulator - Theory
)(sin)( 101
1
m
ω0: slave frequency
ω1: master frequency
)2
)cos(1(
inI
)2
)(1()
2
)2/))((cos(sin1(
1 tfI
tfII ininout
Linear Modulator
))((sin 1 tf
inI
inI outI
Mach-Zehnder Interferometer
Injection-locked laser phase response
ω1
π/2
-π/2
ωo
φ-φ1 Locking
Range
Put them together

67
V
f(t) ~
π/2
Iin
V
T(V)
))((sin 1 tf
I’0 ,ω1 )2
)(1(
tfII inout
Resonant cavity linear modulator • Phase response
• Stable locking range
• Calculate SFDR
f(t) ~
Iin
T(V)
)2
)cos(1(
inout II
Electro-optic Mach-Zehnder modulator
VtV /)(0
Resonant Cavity Interferometric Modulator - Comparison to a conventional MZ modulator
outI
outI

68
Filtering &
Modulation
Optical Spectrum RF Spectrum
f1
VCSEL
Bias T
AC Modulation; f1,
DC current= I1
Phase Modulation & Filtering -Channel selection concept
I(ω)
ω f
P(f)
Ch. 1
DC=I1
Ch. 2
DC=I2
…
Ch. 1
Ch. N
Ch. 2
…
Comb Modulated Output
0 ω= ω + f1

69
Filtering &
Modulation
VCSEL
Bias T
AC Modulation; f2
DC current= I2
Phase Modulation & Filtering -Channel selection concept
…
Ch. 1
Ch. N
Ch. 2
…
Comb Modulated Output
RF spectrum
f2 f
P(f) ω= ω + f2 I(ω)
ω Ch. 1
DC=I1
Ch. 2
DC=I2
0
Optical Spectrum 8.6 8.7 8.8 8.9 9.0
193.405
193.410
193.415
193.420
193.425
193.430 Measurement
Linear fit
Fre
quency (
TH
z)
DC Driving Current (mA)
Slope ~ 50 GHz/mA
Frequency vs. Current

70
Linear interferometric modulator setup
CW
laser
Piezo
driver
RFSA
VCSEL
High-res
OSA
Bias
Tee IDC
RF
VOA PC
50/50 Iso
PD PZT
CIR
PC
VCSEL: vertical cavity surface emitting
laser
Iso: isolator
VOA: variable optical attenuator
PC: polarization controller
PZT: piezoelectric transducer
PD: photo detector
CIR: circulator
High-res OSA: High resolution optical
spectrum analyzer
RFSA: RF spectrum analyzer
Electrical path
Optical path
0 1 2 3 4 5 6
-80
-75
-70
-65
-60
-55
-50
Po
wer
(dB
m)
Frequency (GHz)
10 dB
00 00 00 000 00 00 00 000
0
0
0
0
0
0
0
0
0
0
0 Measurement
Fit
Sta
tic p
hase (
rad
ian
)
DC Current Deviation (mA)
0.00 0.05 0.10 0.15 0.20 0.250.15
0.20
0.25
0.30
0.35
0.40
Vo
lta
ge
(V)
Time(sec)
Vπ ~ 2.6 mV
-10 dB bandwidth
~5 GHz

71
V(t)
F
ω
ω1 ω2 2ω2 2ω1 3ω1 3ω2
2ω2 –ω1 2ω1 –ω2
ω2
ω1
2ω1-ω2
2ω2-ω1
3ω2
3ω1
2ω2
2ω1
=
+
+
+
Noise floor
Spur-free
dynamic range
(SFDR)
ω
How to measure linearity of a modulator? -Two-tone experiment
Iin
Iout
Modulator
N. Hoghooghi and P. J. Delfyett, IEEE Journal of Lightwave
Technology, 29(22), pp.3421-342, 2011.

72
Analog link employing linear modulator
1 GHz
1.0001 GHz
CW
laser
PID
RFSA
VCSEL High-res
OSA
+
Bias
Tee
EDFA
IDC
RF
VOA PC
50/50 Iso
PD
PD 90/10
PZT
CIR
PC
VCSEL: vertical cavity surface emitting laser
Iso: isolator
VOA: variable optical attenuator
PC: polarization controller
PZT: piezoelectric transducer
PD: photo detector
PID: proportional-integrated-differential controller
CIR: circulator
OSA: optical spectrum analyzer
RFSA: RF spectrum analyzer
1 km of
fiber
Electrical path
Optical path

73
Spur-free dynamic range measurement
of the link
-80 -70 -60 -50 -40 -30 -20
-160
-140
-120
-100
-80
-60
-40
-20
0
Fundamental
IM3
Fundam
enta
l &
inte
rmodula
tion
pow
er
(dB
m)
RF Input (dBm)
Noise floor
Power of the fundamental is a factor of >3,000,000^2
higher than third-order intermodulation power.
Order of the magnitude better than DARPA project
goal.
0.999 1.000 1.001 1.002
-60
-50
-40
-30
-20
-10
0
10
Po
we
r (d
Bm
)
Frequency (GHz)
Sample RF spectrum
10 20 30 40 50 60 70 80 90 100
-160
-150
-140
-130
-120
-110
-100
-90
-80
RIN
[d
Bc
/Hz]
10 20 30 40 50 60 70 80 90 1000
0.05
0.1
0.15
0.2
0.25
Frequency Offset [MHz]
Inte
gra
ted
RM
S R
IN (
%)
RIN
SFDR = 130 dB.Hz2/3

74
L
c/2L
Modelocking Basics A Review
Optical Cavity Allowed Modes
Laser Medium
Laser Cavity
Spontaneous Emission Spectrum
Laser Spectrum

75
c=
o=2
m o
o
o+ m o- m
T=2L/c
P=2/
E-Field
E-Field Spectrum
Modulated
E-Field
E-Field Spectrum
Modelocked Spectrum
Modulator
Modelocking Basics A Review

76
Coherent Optical Signal Processing &
Communications using Optical Frequency Combs
•What are optical frequency combs?
Coherent, stabilized cw optical frequencies generated on a periodic frequency grid, (e.g.,
a set of longitudinal modes from a modelocked laser).
Why re-visit coherent communications/signal processing?
•Allows the use of E(t) as compared to I(t) high spectral efficiency.
(80x -200xincrease)
•Coherent combs of stabilized optical frequencies are easily obtainable from mode-
locked lasers.
•Channel conditioning can be done simply ((frequency stabilization of the entire comb as
compared to individual lasers).
•Sets of combs at separate locations can be made coherent (frequency and phase)
Modelocked Spectrum
T=2L/c
P=2/ Modulator
Optical Frequency Combs

77
Ultrafast Photonics Group
Fundamental Physics Quantum Dot
Ultrafast Light- Matter
Dynamics
New Device Development Q-Dot Optical Amplifiers
Modulators & Photodetectors
Active Optical Filters
Systems Applications Optical Networks for Signal Processing &
Communications
Optical Sampling for A-to-D Converters
Arbitrary Waveform Generation
Precision Laser Radar
http://creol.ucf.edu
http://up.creol.ucf.edu

78
Stabilized Comb Source Specs
• 1.1ps pulse width with and 50 dB suppresion
to the next observable optical mode.
• 500 Hz optical linewidth and sub 150 kHz
maximum frequency deviation in 30 seconds.
• 3 fs integrated timing jitter from (1 Hz–100
MHz) and 14 fs timing jitter extrapolated to
Nyquist (1 Hz – 5.14 GHz).
Simultaneous optical frequency stabilization and supermode suppression
of a 10.287 GHz harmonically mode-locked laser with:
Ozdur I., et al,” A semiconductor based 10-GHz optical comb source with 3 fs integrated timing jitter
(1Hz-100MHz) and ~500 Hz comb linewidth” Photonic Technology Letters Vol. 22, No. 6, March 15, 2010.

79
Oscillator characterization Optical Spectra
1550 1555 1560
-80
-70
-60
-50
-40
-30
Pow
er
(dB
m)
Wavelength (nm)
Optical Spectrum
0 10 20 30 40 50 60
-0.2
-0.1
0
0.1
0.2
time (s)
Fre
quency O
ffset
(MH
z)
Spectrogram
-1.0 -0.5 0.0 0.5 1.0
-80
-70
-60
-50
-40
-30
-20
-10
0
Rel. P
ow
er
(dB
)
Frequency Offset (MHz)
Span: 2 MHz
Res. BW. 100 Hz
Single comb-line
beat-note
2 kHz FWHM Lorentzian
1 kHz FWHM Lorentzian

80
Phase and amplitude noise
1 10 100 1k 10k 100k 1M 10M 100M
-170
-160
-150
-140
-130
-120
-110
-100
-90
-80
-70
-60
L(f
) (d
Bc/H
z)
Frequency Offset (Hz)
0
2
4
6
8 Directly from MLL
Amplified (Pout
~ 200 mW)
In
teg
rate
d T
imin
g J
itte
r (f
s)
Single Sideband Phase Noise
1 10 100 1k 10k 100k 1M 10M 100M
-170
-160
-150
-140
-130
-120
-110
-100
-90
-80
-70
-60
M(f
) (d
Bc/H
z)
Frequency Offset (Hz)
Directly from MLL
Amplified
0.00
0.02
0.04
0.06
0.08
0.10
In
teg
rate
d A
M N
ois
e (
%)
Pulse-to-pulse energy fluctuations

81
Oscillator characterization Pulses
-40 -30 -20 -10 0 10 20 30 40
0.0
0.5
1.0
Compressed AC
Transform Limited AC
AC
Tra
ce (
a.u
.)
Delay (ps)
p = 930 fs
10.24 10.26 10.28 10.30 10.32
-100
-80
-60
-40
-20
0
Re
lative
Po
we
r (d
B)
Frequency (GHz)
Span: 100 MHz
Res. BW: 3 kHz
Pulses are compressible to close to the transform limit
Photodetected RF tone has >90 dB dynamic range

82
Conclusions
• An optical comb source has been built with:
– Stable (instability < 300 kHz @ 194 THz over 60 s), low line-width (< 1
kHz) optical comb
– High repetition rate (10 GHz) optical pulse-train
– Short pulses generated from a dispersion compensated cavity (τp<1 ps)
• Power Amplification with a Slab-Coupled Optical Waveguide
Amplifier yields
– High optical power (up to 390 mW, > 5 mW per comb-line)
– No evident degradation in Phase (14 fs jitter integrated to Nyquist) and
Amplitude Noise (< 0.03%, 1 Hz to 100 MHz)

83
Linear Intensity Modulator
System Configuration
-Iso: Isolator
-PC: Polarization Controller
-PS: Optical Phase Shifter
-VOA: Variable Optical Attenuator
-TEC: Temperature Controller
-Cir : Circulator
-VCSEL: Vertical Cavity Surface Emitting Laser
-RFSA: Radio Frequency Spectrum Analyzer
-OSA: Optical Spectrum Analyzer

84
Concept of Photonic Arbitrary Waveform Generation
Static Fourier Analysis
K
k
kk tkAA
tf1
00 )cos(
2)(
k : periodic frequency components
Ak: amplitude of the kth frequency component
αk phase of the kth frequency component
Performance Characteristics
Limited to periodic signals
Minimum periodicity ~ Mode spacing - filter spacing
Accuracy determined by number of combs


