
1
Ultra-Low Voltage Electrowetting
A thesis submitted for the degree of
Doctor of Philosophy
Nico E. A. Cousens
Supervisor: Anthony R. J. Kucernak
Department of Chemistry
Imperial College London

Abstract
2
Abst ract
Electrowetting, the manipulation of surface wettability with an electric field, is an emerging
technology used in next generation displays and cameras. This has been made possible by the
development of ‘electrowetting-on-dielectric’ by Berge in 1993. However, such a system
operates on large voltages poorly suited to portable devices.
In recent years, theoretical and experimental results have suggested that electrowetting using
the interface between two immiscible electrolyte solutions (ITIES) may provide a solution to
this problem. By applying less than 1 V to such a system, it is possible to induce substantial
changes in the wettability—and hence the shape—of liquid droplets. However, there is a large
degree of hysteresis in such a system meaning that there is a poor correlation between droplet
shape and applied potential. Furthermore, the stability of the ITIES over long periods is of
concern.
This thesis attempts to address the current problems with ITIES electrowetting highlighted
above. By moving to smoother and more lubricated surfaces, a substantial reduction in
hysteresis was seen. These surfaces were produced by template stripping. In addition, several
other surfaces were prepared as potential electrowetting substrates. These involved surface
functionalisation by plasma treatment or the reduction of diazonium compounds; preparation
of ultra smooth glassy carbon and preparation of a hydrophobic conducting polymer. The
potential range over which an ITIES is stable was also improved with the use of a novel
mixed organic solvent phase.
By optimising the electrode and electrolyte compositions, an electrowetting system operating
on less than 1 V with a contact angle range of 53o and a gap of only 100 mV between forward
and reverse scans was possible. Other electrowetting systems with no hysteresis were also
developed, although these did not operate within the potential limits defined by the onset of
Faradaic processes.

Acknowledgements
3
First and foremost, I would like to thank my supervisor Professor Anthony Kucernak for all
of his invaluable help, advice and inspiration.
Furthermore, I would also like to thank the following without whom, in all sincerity, this
thesis would not have been possible: Prof. Alexei Kornyshev, Dr. Monica Marinescu, Vlad
Turek, Dr. Daren Caruana, Steve Atkins, Prof. Alexander Bismark, Dr. Siti Shamsuddin, Andy
Dolan, Dr. Tim Albrecht, Simon Dowland, George Barnes, David James, Graham Smith, Dr.
Denis Kramer, Dr. Chris Zalitis and Dr. Venkat Narayanan.
The copyright of this thesis rests with the author and is made available under a Creative
Commons Attribution Non-Commercial No Derivatives licence. Researchers are free to copy,
distribute or transmit the thesis on the condition that they attribute it, that they do not use it
for commercial purposes and that they do not alter, transform or build upon it. For any reuse
or redistribution, researchers must make clear to others the licence terms of this work.
Acknowle dgeme nts
This thesis is my own work in accordance with university guidelines.
Signed: Nico Cousens Date: 8th December 2012

Contents
4
Abstract ............................................................................................................................. 2
Acknowledgements .......................................................................................................... 3
List of Abbreviations ...................................................................................................... 10
List of Symbols ............................................................................................................... 12
List of Figures ................................................................................................................ 15
List of Tables .................................................................................................................. 24
Chapter 1: Introduction .................................................................................................. 25
1.1 Wetting ........................................................................................................................................ 25
1.1.1 The Young equation .......................................................................................................... 25
1.1.2 Heterogeneous surfaces ..................................................................................................... 27
1.1.3 Surface roughness ............................................................................................................... 27
1.2 Contact angle hysteresis ............................................................................................................ 28
1.3 Electrowetting ............................................................................................................................ 29
1.3.1 Early electrowetting studies .............................................................................................. 30
1.3.2 Further developments in electrowetting ......................................................................... 33
1.3.3 Electrowetting on dielectric .............................................................................................. 34
1.4 Electrowetting with two electrolytes ....................................................................................... 36
1.4.1 The interface between two immiscible electrolytes ....................................................... 37
1.4.2 Electrowetting with ITIES ................................................................................................ 39
1.4.3 Theoretical model ............................................................................................................... 40
1.4.4 Experimental results .......................................................................................................... 42
1.4.4.1 First experimental results ........................................................................................... 42
1.4.4.2 Pulsing .......................................................................................................................... 44
1.4.4.3 Challenges .................................................................................................................... 46
1.5 Applications of electrowetting ................................................................................................. 46
1.5.1 Lenses ................................................................................................................................... 46

Contents
5
1.5.2 Displays ................................................................................................................................ 47
1.5.3 Digital microfluidics ........................................................................................................... 48
1.5.4 Other applications .............................................................................................................. 49
1.6 Conclusions ................................................................................................................................. 50
1.7 References ................................................................................................................................... 52
Chapter 2: Liquid|Liquid Interfaces ............................................................................. 55
2.1 Extending the ITIES polarisation window ............................................................................ 55
2.1.1 Motives................................................................................................................................. 55
2.1.2 Ion transfer .......................................................................................................................... 56
2.1.3 Electrolyte effects ............................................................................................................... 59
2.1.4 Solvent effects ..................................................................................................................... 61
2.1.5 Experimental ....................................................................................................................... 62
2.1.6 Results and discussion ....................................................................................................... 63
2.1.6.1 Hydrophobicity of the organic ions ......................................................................... 63
2.1.6.2 Hydrophilicity of the aqueous ions .......................................................................... 64
2.1.6.3 Organic solvent ........................................................................................................... 66
2.1.6.4 Salting out effect ......................................................................................................... 69
2.1.7 Other applications .............................................................................................................. 72
2.2 The ionic liquid | oil interface ................................................................................................. 73
2.2.1 Background ......................................................................................................................... 73
2.2.2 Choosing the solvent and ionic liquid ............................................................................. 74
2.2.3 Experimental ....................................................................................................................... 76
2.2.4 Results and discussion ....................................................................................................... 77
2.2.4.1 Cyclic voltammetry ..................................................................................................... 77
2.2.4.2 Transfer of doped ions .............................................................................................. 79
2.2.4.3 Impedance measurements ......................................................................................... 81

Contents
6
2.3 Conclusions ................................................................................................................................. 83
2.4 References ................................................................................................................................... 84
Chapter 3: Ultra-Flat Surfaces ........................................................................................ 87
3.1 Template stripping ..................................................................................................................... 87
3.1.1 Overview.............................................................................................................................. 87
3.1.2 Alternative methods ........................................................................................................... 90
3.1.2.1 Annealing ..................................................................................................................... 90
3.1.2.2 PDMS surface adhered gold ..................................................................................... 91
3.2 Ultra-flat metal surfaces ............................................................................................................ 92
3.2.1 Experimental ....................................................................................................................... 92
3.2.2 Results and discussion ....................................................................................................... 93
3.2.2.1 Roughness .................................................................................................................... 93
3.2.2.2 Contact angle ............................................................................................................... 95
3.2.2.3 Stability ......................................................................................................................... 96
3.3 Glassy carbon ............................................................................................................................. 98
3.3.1 Properties ............................................................................................................................. 98
3.3.2 Precursors .......................................................................................................................... 101
3.3.3 Sample preparation........................................................................................................... 102
3.4 Ultra-flat carbon surfaces ........................................................................................................ 104
3.4.1 Experimental ..................................................................................................................... 104
3.4.1.1 Phenol formaldehyde synthesis .............................................................................. 104
3.4.1.2 9,10-bis(phenylethynyl)anthracene preparation ................................................... 104
3.4.1.3 Pyrolysis procedure .................................................................................................. 105
3.4.1.4 Conductivity measurements .................................................................................... 105
3.4.2 Results and discussion ..................................................................................................... 106
3.4.2.1 Preparation and pyrolysis ........................................................................................ 106

Contents
7
3.4.2.2 Surface roughness ..................................................................................................... 107
3.4.2.3 Conductivity .............................................................................................................. 109
3.5 Conclusions ............................................................................................................................... 110
3.5.1 Metal surfaces ................................................................................................................... 110
3.5.2 Carbon surfaces ................................................................................................................ 111
3.6 References ................................................................................................................................. 112
Chapter 4: Fluorinated Electrodes ................................................................................ 115
4.1 Electrochemical functionalisation ......................................................................................... 115
4.1.1 Electrografting .................................................................................................................. 116
4.1.1.1 Overview .................................................................................................................... 116
4.1.1.2 Diazonium grafting................................................................................................... 117
4.1.1.3 Monolayer formation ............................................................................................... 119
4.1.2 Experimental ..................................................................................................................... 122
4.1.2.1 Synthesis of sterically hindered, fluorinated diazonium salt ............................... 123
4.1.2.2 Electrochemical reduction of diazonium salts ..................................................... 125
4.1.3 Results ................................................................................................................................ 126
4.1.3.1 Electrochemical reduction ....................................................................................... 126
4.1.3.2 Contact angle ............................................................................................................. 126
4.1.3.3 Electrochemical surface area ................................................................................... 128
4.2 Plasma fluorination .................................................................................................................. 129
4.2.1 Experimental ..................................................................................................................... 130
4.2.1.1 Fluorination ............................................................................................................... 130
4.2.1.2 Contact angle measurements .................................................................................. 131
4.2.1.3 Electrochemical characterisation ............................................................................ 131
4.2.2 Contact angle .................................................................................................................... 132
4.2.3 AFM ................................................................................................................................... 133

Contents
8
4.2.4 Electrochemistry ............................................................................................................... 134
4.2.4.1 Cyclic voltammetry ................................................................................................... 134
4.2.4.2 Capacitance ................................................................................................................ 135
4.2.4.3 Underpotential deposition ....................................................................................... 136
4.2.4.4 Electron transfer ....................................................................................................... 137
4.2.5 CFC-22 versus perfluoropropane .................................................................................. 137
4.2.6 Discussion ......................................................................................................................... 138
4.3 Derivatised conducting polymer coatings ............................................................................ 139
4.3.1 Experimental ..................................................................................................................... 139
4.3.1.1 EDOT-F synthesis ................................................................................................... 139
4.3.1.2 Electropolymerisation .............................................................................................. 140
4.3.1.3 Template stripping .................................................................................................... 140
4.3.2 Contact angle .................................................................................................................... 141
4.3.3 Surface roughness ............................................................................................................. 142
4.3.4 Conductivity ...................................................................................................................... 143
4.4 Conclusions ............................................................................................................................... 143
4.5 References ................................................................................................................................. 145
Chapter 5: Electrowetting ............................................................................................ 148
5.1 Experimental ............................................................................................................................. 148
5.1.1 General experimental setup ............................................................................................ 148
5.1.2 Chemicals and glassware ................................................................................................. 150
5.1.3 Sputtered electrodes ......................................................................................................... 150
5.1.4 Surface tension measurements ....................................................................................... 151
5.2 Ultra-flat surfaces ..................................................................................................................... 151
5.2.1 Metal surfaces ................................................................................................................... 151
5.2.2 Carbon surfaces ................................................................................................................ 153
Contents
9
5.3 Fluorinated electrodes ............................................................................................................. 154
5.3.1 Plasma fluorinated surfaces............................................................................................. 154
5.3.2 PEDOT-F coated surfaces ............................................................................................. 155
5.3.3 Diazonium functionalised surfaces ................................................................................ 156
5.3.4 Summary ............................................................................................................................ 156
5.4 Electrolyte effects .................................................................................................................... 157
5.4.1 Organic electrolyte ions ................................................................................................... 157
5.4.2 Aqueous electrolyte ions ................................................................................................. 158
5.5 Concentration effects .............................................................................................................. 159
5.5.1 Organic electrolyte concentration .................................................................................. 159
5.5.2 Aqueous electrolyte concentration ................................................................................ 161
5.5.3 Jumping droplet ................................................................................................................ 162
5.6 Solvent effects .......................................................................................................................... 163
5.6.1 Different solvents ............................................................................................................. 163
5.6.2 Electrowetting of 3-chloro-1-propanol ......................................................................... 166
5.6.3 Salting out with other solvents ....................................................................................... 171
5.6.4 Mixed solvents .................................................................................................................. 171
5.7 Conclusions ............................................................................................................................... 172
5.8 References ................................................................................................................................. 175
Chapter 6: Conclusions ................................................................................................ 177
6.1 General conclusions................................................................................................................. 177
6.2 Electrowetting devices ............................................................................................................ 177
6.3 Future work .............................................................................................................................. 178

List of Abbreviations
10
List of A bbreviations
AFM Atomic force microscopy
BTPPA Bis(triphenylphosphoranylidene)ammonium
CH Cyclohexane
CP 3-Chloro-1-propanol
CV Cyclic voltammogram
DCE 1,2-Dichloroethane
DBH 1,6-Dibromohexane
EDOT-F Pentadecafluoro-octanoic acid 2,3-dihydro-
thieno(3,4-b)(1,4)dioxin-2-ylmethylester
EWOD Electrowetting on dielectric
GC Gouy-Chapman
HOPG Highly oriented pyrolytic graphite
ITIES Interface between two immiscible electrolytes
MWT Mott and Watts–Tobin
PC Propylene carbonate
PEDOT Poly-(3,4-ethylenedioxythiophene)
PEDOT-F Fluorinated PEDOT derivative
PTFE Polytetrafluoroethylene
PZC Point of zero charge
RHE Reversible hydrogen electrode
RMS Root mean square

List of Abbreviations
11
TBAP Tetrabutylammonium perchlorate
TBA Tetrabutylammonium
TFPB Tetrakis[3,5-bis(trifluoromethyl)phenyl]borate
TMA Tetramethylammonium
TPB Tetraphenylborate

List of Symbols
12
List of Sym bols
Latin
Activity of ion i in the oil phase
Activity of ion i in the aqueous phase
Ade Droplet|electrode area
Adw Droplet|aqueous phase area
Anion concentration in aqueous phase
Cation concentration in aqueous phase
C Capacitance
E Energy
E1/2 Half-wave potential
Formal transfer potential of an ion i
f1 Fraction of surface 1 with contact angle
f2 Fraction of surface 2 with contact angle
F Faraday constant
I Current
Aqueous solubility product
Mass transfer coefficient of ion i in phase a
Mass transfer coefficient of ion i in phase b
n Number of moles of electrons transferred
r Roughness factor
R Ideal gas constant

List of Symbols
13
s Conductivity probe spacing
t Thickness
T Temperature
U Potential
Ub Bias potential
Up Pulse potential
UPZC Potential of PZC
Vd Droplet volume
zi Charge on ion i
Greek
Contact angle
1 Contact angle on surface 1
2 Contact angle on surface 2
flat Contact angle on flat surface
PZC Contact angle at PZC
rough Contact angle on rough surface
Y Young contact angle
Surface energy
da Droplet|air surface energy
de Droplet|electrode surface energy

List of Symbols
14
ds Droplet|solid surface energy
dw Droplet|aqueous phase
sa Solid|air surface energy
we Aqueous phase|electrode surface energy
wePZC Aqueous phase|electrode surface energy at PZC
Gibbs energy
Standard Gibbs energy of transfer of ion i from aqueous phase to oil
Laplace pressure
Standard anion transfer potential from aqueous phase to IL
Standard cation transfer potential from aqueous phase to IL
Galvani potential difference between aqueous and oil phases
Standard Galvani potential difference of ion transfer between aqueous and oil
phases of ion i
Capacitive energy of droplet|electrode interface
Capacitive energy of droplet|aqueous phase interface
Capacitive energy of aqueous phase|electrode interface
Chemical potential of ion i in the oil phase under reference conditions
Chemical potential of ion i in the aqueous phase under reference conditions
Resistivity
Galvani potential in oil phase
Galvani potential in aqueous phase
List of Figures
15
List of Figures
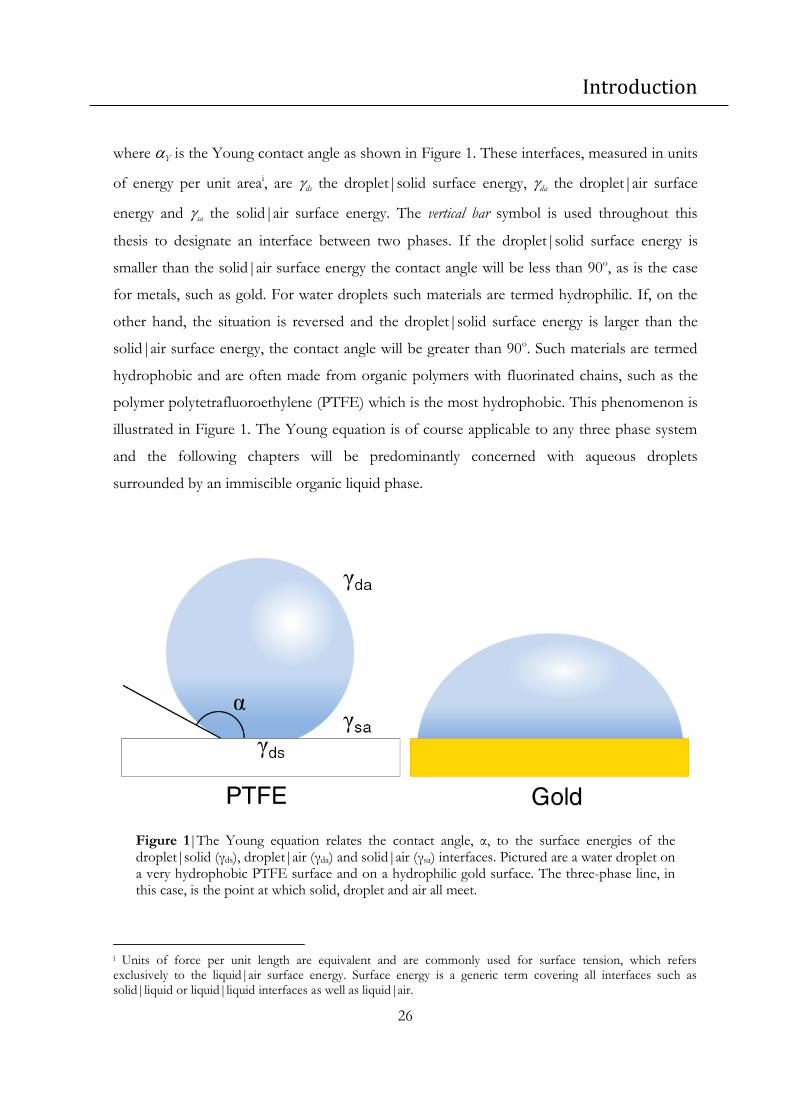
Figure 1|The Young equation relates the contact angle, α, to the surface energies of the
droplet|solid (γds), droplet|air (γda) and solid|air (γsa) interfaces. Pictured are a water droplet
on a very hydrophobic PTFE surface and on a hydrophilic gold surface. The three-phase line,
in this case, is the point at which solid, droplet and air all meet. ................................................... 26
Figure 2|(Left) A water droplet on a flat hydrophobic polymer surface exhibits the natural
equilibrium contact angle. (Middle) A rougher surface exaggerates the macroscopic contact
angle. (Right) When the surface is very rough air pockets are trapped under the droplet, as this
is a lower energy configuration. This is known as the Cassie-Baxter state. .................................. 28
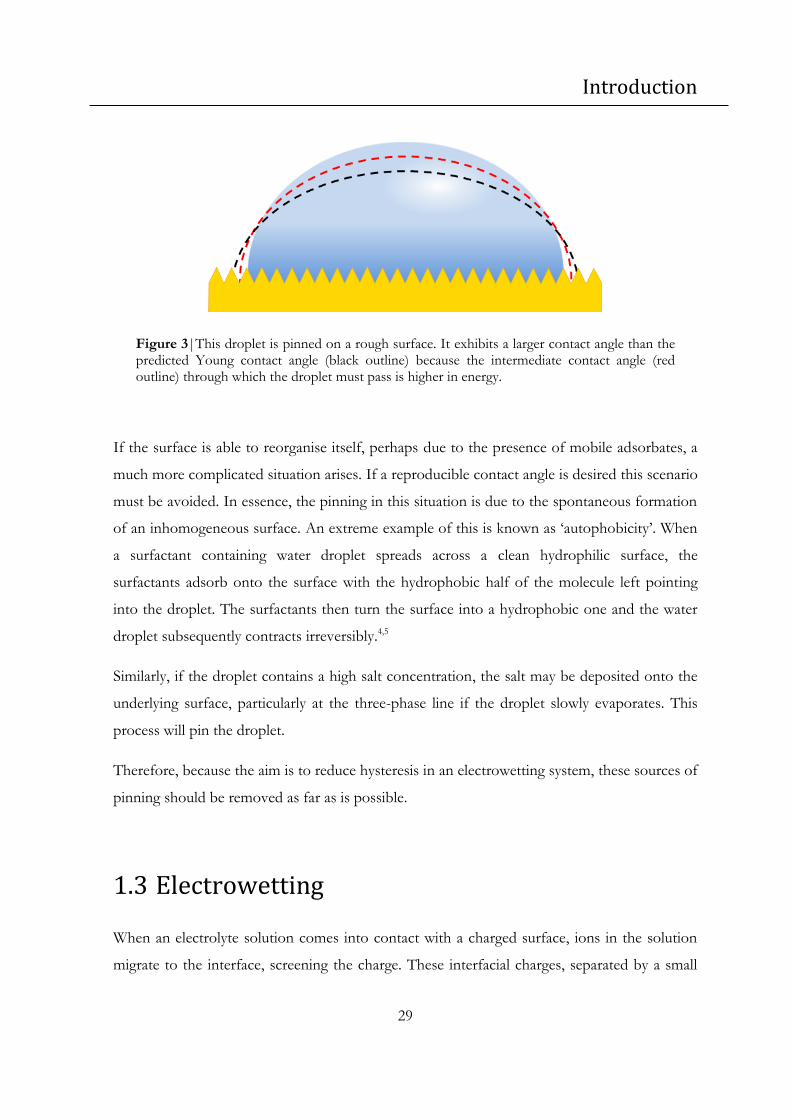
Figure 3|This droplet is pinned on a rough surface. It exhibits a larger contact angle than the
predicted Young contact angle (black outline) because the intermediate contact angle (red
outline) through which the droplet must pass is higher in energy. ................................................ 29
Figure 4|Geometry of the early electrowetting experiments performed by Frumkin. A
toluene droplet sits on a mercury electrode surrounded by an ionic solution. When a potential
is applied an electrochemical double layer forms at the electrode|aqueous phase interface.
This lowers the surface energy and the contact angle changes in accordance with the Young
equation. ................................................................................................................................................. 31
Figure 5|[Taken from Cousens9] A recreation of Frumkin’s experiment from 1932. A
1,2-dichloroethane droplet sits on a mercury electrode surround by 0.1 mol dm–3 LiCl
solution. Potentials are versus an Ag/AgCl reference electrode. .................................................. 33
Figure 6|EWOD is similar to conventional electrowetting with the addition of a dielectric
layer on top of the electrode, where the electrode is now solid rather than liquid mercury. The
dielectric layer prevents Faradaic processes at the electrode, allowing large potentials to be
applied. .................................................................................................................................................... 35
Figure 7|Illustration of the formation of a back-to-back electrical double layer when an
ITIES is polarised. The top half contains an inorganic salt dissolved in water while the bottom
half contains a bulky organic salt in an organic solvent. When a bias is applied (1 V) the ions
migrate to the electrodes. The ions are restricted to their respective phases resulting in the
formation of a back-to-back electrochemical double layer. (Far right) The electric field
distribution shows how the potential decays in the double layers and not in the bulk. ............. 38
Figure 8|[Taken from Vanýsek26] Cyclic voltammogram of the ITIES formed from LiCl in
water and TBATPB in nitrobenzene. About the PZC (at approximately 300 mV) there is a

List of Figures
16
small double layer charging current. At each end of the voltammogram ion transfer currents
arise. ........................................................................................................................................................ 39
Figure 9|Electrowetting with ITIES. The addition of electrolyte to the droplet means that all
three droplet surface energies are now potential dependant, where previously only the aqueous
phase|electrode surface energy was affected. The Young equation shows that the contact
angle is particularly sensitive to the liquid|liquid energy. Therefore, changing this surface
energy may result in a significant contact angle change. ................................................................. 40
Figure 10|[Taken from Monroe30] Theoretically derived graphs of the electrowetting
response of a droplet with a Young contact angle of 77o. The different lines correspond to
different models of the double layer capacitance. ............................................................................ 42
Figure 11|[Taken from Kornyshev et al.37] Low voltage driven contact angle variation for a
0.1 µL nitrobenzene droplet containing 0.01 mol dm–3 TBATPB surrounded by 0.5 mol dm–3
aqueous LiCl on a sputtered gold electrode. A large hysteresis can be seen between forward
and reverse scans. .................................................................................................................................. 43
Figure 12|[Taken from Kornyshev et al.37] Illustration of how contact angle pinning is
reduced by a pulsed-potential control technique. (a) Electrowetting dynamics for a 0.1 μL
droplet of 0.1 mol dm–3 TBATPB in nitrobenzene surrounded by aqueous 0.5 mol dm–3 LiCl
on a sputtered-gold substrate. Pinning is reduced by potential pulses of ±2.0 V over the
constant bias of –0.65 or 0.00 V versus Ag/AgCl. The lower part of the diagram shows the
applied potential profile. During the periods 0-4.5 s and 24-32 s, the electrode was
disconnected and so the potential is uncontrolled. (b) Absolute difference between the cosine
of the angle in the ith pinned state and the ‘final’ value of this cosine, which is essentially
established after the tenth pulse. It can be seen that the droplet approaches an equilibrium
shape. ...................................................................................................................................................... 44
Figure 13|[Taken from M. Marinescu39] (Left) Model of electrowetting dynamics facilitated
by pulsing. Experimental results presented in Figure 12 with modelled fit. Cycle Steps: (–1)
position after Up = 1 V on Ub = 0, (0) Ub = –0.65 V, (1-10) Up = –1 V, (11) Ub = 0, (12-21) Up
= 1 V. (Right) Predicted effect of friction force F0 on final contact angle. Experimental
parameters: –0.65/0 V biases, –1/1 V pulses, TBATPB conc. = 0.1 mol dm–3,
LiCl conc. = 0.5 mol dm–3. Other parameters: droplet mass = 1.2×10⁻¹⁰ kg,
water/nitrobenzene viscosity difference = 0.3×10⁻⁵ kg s–1, Young’s angle = 1o, Upzc = 0.3 V,

List of Figures
17
friction force = 1.65×10⁻⁵ N. Up, Ub and Upzc are the pulse potential, bias potential and point
of zero charge respectively. ................................................................................................................. 45
Figure 14|(Left and middle) Cross section of an electrowetting lens. The droplet (shown in
red) rests on the sides of an annular electrode. It acts as a lens as it has a different refractive
index to the surrounding aqueous phase. Its curvature can be varied incrementally from
convex to concave by changing the potential applied. (Right) [Taken from www.varioptic.com,
May 2012] Electrowetting variable focus liquid lens made by Varioptic. The metal case
diameter is 7.75 mm. Suitable for 30 fps video. Operating temperature range of –20 to 60 °C.
The lens contains no mechanical components. ................................................................................ 47
Figure 15|[Photograph taken from Feenstra43] Cartoon and photograph of an electrowetting
pixel. When a potential is applied the droplet covers the bottom of the cell. The droplet
contains a dye to colour the pixel. When the potential is turned off the cell returns to its
original configuration. .......................................................................................................................... 48
Figure 16|[Taken from Kim46] Illustration of the four fundamental droplet operations needed
in microfluidics. The operations are controlled by the switching on or off of the discrete
electrodes. ............................................................................................................................................... 49
Figure 17|[Taken from Kang24] Streamlines and oscillation patterns for oscillating bubbles at
different frequencies. Bubble volume = 1 µL and VRMS = 80 V. ................................................... 50
Figure 18|[Taken from Kim51] Illustration of the principle behind a liquid-state field-effect
transistor, or LiquiFET. It operates with a 2.5-3 V drain voltage with on/off current ratios
greater than 10000:1. ............................................................................................................................ 50
Figure 19|[Taken from Marinescu2] Potential across a nonspecific ITIES with monovalent
ions as a function of applied system potential where Δ Φds is the potential drop between the
droplet and surrounding, cd is the concentration in the droplet and the concentration in the
surrounding phase is 0.5 mol dm–3. It can be seen that the potential across the liquid|liquid
interface decreases with increasing droplet electrolyte concentration. ......................................... 56
Figure 20|[Taken from Vanýsek5] Diagram of a four electrode cell used to study the cyclic
voltammetry of an ITIES. The adjusting plunger is used to position the interface between the
two reference electrodes. The diameter of the cell where the interface is positioned is kept
small (approximately 5 mm) to reduce the total ionic current and minimise resistive losses.6,7 58
Figure 21|(Left to right) Chemical structure of tetrabutylammonium, tetraphenylborate,
bis(triphenylphosphoranylidene)ammonium and tetrakis[3,5-bis(trifluoromethyl)phenyl]borate

List of Figures
18
ions. The two ions on the left, used for the first electrowetting experiments, are clearly smaller
than the ions on the right, suggesting they would be less soluble in water and therefore less
likely to cross the ITIES.16 ................................................................................................................... 61
Figure 22|Experimental cell for characterising the electrochemical window of an ITIES. ..... 63
Figure 23|Illustration of the effect of using 1 mmol dm–3 BTPPATFPB in the DCE organic
phase rather than TBATPB, also 1 mmol dm–3, which contains much smaller ions. The
electrolyte in the aqueous phase is 5 mmol dm–3 NaCl. Scan rate = 10 mV s–1. The flat regions
of the cyclic voltammograms indicate where the ITIES is stable. ................................................. 64
Figure 24|CVs of 5 mmol dm–3 NaCl, LiF or MgSO4 in water with 1 mmol dm–3
BTPPATFPB in DCE. Scan rate = 10 mV s–1. The Galvani potential differences (ow ) have
been calculated by using the standard transfer potential of the TMA+ ion (ow =160 mV) as
a reference. ............................................................................................................................................. 65
Figure 25|CVs of the same system used in Figure 24 but with an organic phase consisting of
a 1:1 volume mixture of DCE and cyclohexane. Scan rate = 10 mV s–1. The maximum
currents result from the same ion transfers shown in Figure 24. .................................................. 67
Figure 26|CVs of the same system used in Figure 24 for MgSO4 in DCE and mixed
DCE:CH. The scans are over a broader potential range and hence the transfer currents are
larger. These large peaks are better suited to the curve fitting method of Shao et al. used to
measure the Gibbs energy of transfer of the related ions. At these large currents the fine
structure of the double layer current is not seen. The sharp features of the return peaks for the
mixed solvent are characteristic of solvent transferring back across the interface along with the
ions.9 The capacitance of the interface about the PZC is also shown. ......................................... 69
Figure 27|CVs illustrating the effect of varying the concentration of MgSO4 with an organic
phase of 1:1 volume mixture of DCE and cyclohexane. Scan rate = 10 mV s–1. ........................ 70
Figure 28|(Left) Ethylammonium nitrate, EAN. (Middle) 1-butyl-3-H-imidazolium nitrate.
(Right) 1-hexyl-3-methylimidazolium chloride. ................................................................................ 75
Figure 29|Cyclic voltammograms of the interface between EAN and 10 mmol dm–3
BTPPATFPB in various solvents: a) DCE, b) DBH and c) a mixture of DCE and CH. Scan
rate 10 mV s–1. Corrected for resistive losses. The imaginary component of the impedance at
10 Hz is also plotted, with the minimum assumed to be the PZC. ............................................... 78
Figure 30|Cyclic voltammogram of the ITIES between EAN and 10 mmol dm–3
BTPPATPFB in DCE/CH (solid line). The addition of 0.5 mmol dm–3 tetraoctylammonium

List of Figures
19
bromide shifts the cyclic voltammogram of the EAN|mixed solvent ITIES upwards (dashed
line). This is the result of the addition of a mass transfer limited current (approximately 20
µA cm–2) due to the transfer of Br– across the interface. The offset of the voltammogram as a
function of Br- ion concentration is also shown (inset). ................................................................. 80
Figure 31|Impedance spectrum of EtNH3NO3|DCE/CH interface at PZC with an
interfacial area of 0.28 cm2. Scan from 500-0.1 Hz. Fit for Randles circuit shown on graph
(grey line). Solution resistance RS=8.8±0.2 kΩ, charge transfer resistance RCT=5.6±1.7 kΩ,
constant phase element ZCPE=9.9±4.1 µS sn, n=0.71±0.8 and Warburg impedance
ZW=54.9±3.1 µS s0.5. This CPE corresponds to an interfacial capacitance of 137 µF cm–2.45 ... 81
Figure 32|Impedance spectrum of EtNH3NO3|DBH interface at PZC and +125 mV with
an interfacial area of 0.28 cm2. Scan from 10-0.1 Hz. ..................................................................... 82
Figure 33|[Taken from Woodard14] The topside of a conventional evaporated gold surface
(left) and its counterpart underside formed by template stripping (right). ................................... 89
Figure 34|[Taken from Chai11] Variation of contact angle of a water droplet on a freshly
exposed gold surface with time. The increase in the contact angle shows a change in the gold
surface energy over time, supposedly as a result of adsorption of atmospheric organics. ......... 90
Figure 35|[Taken from Masens18] Scanning probe micrographs of template stripped gold
films on mica. The annealing process results in the formation of large microdomains. ............ 91
Figure 36|[Taken from Pattier15] Schematic route for the formation of a silicon-PDMS-thiol-
gold array. ............................................................................................................................................... 91
Figure 37|AFM image (Area: 4.3 μm × 4.3 μm; RMS roughness: 3.9 Å; Peak height: 2.9 nm).
................................................................................................................................................................. 93
Figure 38|AFM images of template stripped gold (left) and sputtered gold (right) surfaces
over a large area. template stripped gold area: 80 μm × 80 μm; RMS roughness: 4.5 Å; Peak
height: 28.4 nm. Sputtered Gold Area: 80 μm × 80 μm; RMS roughness: 40.3 Å; Peak height:
184 nm. The sputtered surface is clearly contaminated with large dust particles while the
template stripped gold surface only has a few small peaks. ............................................................ 94
Figure 39|(Left) Photograph of template stripped gold immediately after stripping. The
backlight is reflected in the right-hand corner. (Right) Photograph of sputtered gold
immediately after removal from sputter machine. The images are both back lit at a shallow
angle to highlight any surface contaminants. Only a few specks of dust can be seen on the
freshly stripped surface while the entirety of the sputtered surface is covered with dust. ......... 95

List of Figures
20
Figure 40|Template stripped gold after long-term exposure to water. Clearly this surface is
very different to the one shown in Figure 39. .................................................................................. 97
Figure 41|[Taken from Harris25] Illustration of the proposed structure of a non-graphitised
glassy carbon based on fullerene type elements. .............................................................................. 99
Figure 42|Phenol formaldehyde, formed by co-polymerisation of phenol and formaldehyde.
The alternating phenol/methylene units form chains which are cross-linked via tri-substituted
phenol units. ........................................................................................................................................ 101
Figure 43|9,10-bis(phenylethynyl)anthracene. This molecule melts at 240 oC, allowing it to
take on the shape of the template it sits on. At higher temperatures it decomposes forming a
solid which can then be pyrolysed. It contains only carbon and hydrogen and has a high
proportion of single and double bonds, meaning less rearrangement or mass loss is needed to
form glassy carbon. ............................................................................................................................. 102
Figure 44|[Data taken from Bhatia35] Linear shrinkage (■) and variation of electrical
resistivity (▲) of phenol formaldehyde resin with increasing pyrolysis temperature. .............. 103
Figure 45|(Left) Phenol formaldehyde precursor on quartz disk. (Middle) After heating to
90 oC, the precursor melts and mates with the surface of the flat template. It then begins to
cross link forming a hard solid. (Right) After pyrolysis glassy carbon forms. ........................... 106
Figure 46|(Left) 9,10-bis(phenylethynyl)anthracene precursor material on quartz disk.
(Middle) Upon heating to 250 oC the precursor melts and appears to polymerise, forming a
hard, black and shiny solid. (Right) After pyrolysis glassy carbon forms. .................................. 107
Figure 47|AFM image of template stripped phenol formaldehyde derived glassy carbon. Area
5 μm × 5 μm; RMS roughness: 6.5 Å; Peak height: 10.8 nm. ...................................................... 108
Figure 48|AFM image of template stripped 9,10-bis(phenylethynyl)anthracene derived glassy
carbon. Area 5 μm × 5 μm; RMS roughness: 2.6 Å; Peak height: 8.7 nm. ................................ 108
Figure 49|[Taken from Yang5] Illustration of the mechanism of surface functionalisation of a
glassy carbon electrode (GCE) via amine or phosphate oxidation. ............................................ 116
Figure 50|Mechanism of surface functionalisation by a generic diazonium compound. The
one electron reduction of the diazonium species produces an aryl free radical and molecular
nitrogen which diffuses away. The radical then attacks the surface forming a covalent bond.
............................................................................................................................................................... 118
Figure 51|[Taken and modified from Belanger3] Voltammetry of the electrochemical
reduction of 4-nitrobenzenediazonium (5 mmol dm–3 in 0.1 mol dm–3 H2SO4, scan rate = 100

List of Figures
21
mV s–1). The first scan, scan a, shows a broad reduction peak centred on –60 mV. In the
second scan, scan b, the peak has disappeared. This is explained by the formation of an
organic layer which blocks access of the 4-nitrobenzenediazonium to the electrode. ............. 119
Figure 52|Illustration of the ‘formation-degradation’ method for surface monolayer
preparation. The disulphide functionality can be oxidised to a thiol, detaching all but the first
aromatic ring from the electrode surface. Similarly, the hydrazone group can be chemically
cleaved, leaving behind an aldehyde. ................................................................................................ 120
Figure 53|[Taken from Combellas et al.21] Illustration of how kinetically hindering the phenyl
ring of the diazo compound prevents the growth of a multilayer. .............................................. 122
Figure 54|Reaction for the synthesis of the sterically hindered, fluorine containing diazonium
salt 3,5-bis(2-ethoxyhexafluoroisopropyl)benzenediazonium tetrafluoroborate. ...................... 125
Figure 55|Contact angle of water on glassy carbon before and after 3,5-bis(2-
ethoxyhexafluoroisopropyl)benzenediazonium tetrafluoroborate functionalisation. ............... 126
Figure 56|Reduction in redox current of [Fe(CN)6]4-/[Fe(CN)6]
3− couple due to blocking of
surface of glassy carbon electrode functionalised by 3,5-Bis(2-
ethoxyhexafluoroisopropyl)benzene. K3[Fe(CN)6] concentration 5 mmol dm−3, 0.1 mol dm−3
KCl, scan rate 100 mV s−1. ................................................................................................................ 128
Figure 57|The exposure of common organic polymers such as polyethylene to oxygen
plasma adds a variety of oxygen containing functional groups to the surface. A similar result
can be achieved via the free radical (plasma) induced polymerisation of an allyl-containing
monomer with the desired functionality. In this instance allyl alcohol is polymerised to
produce a thin surface layer which adheres strongly to the underlying surface through Van der
Waals interactions. .............................................................................................................................. 129
Figure 58|Contact angle of water on template stripped gold after exposure to CFC-22 and
perfluoropropane plasmas. Exposure times varied from 6 s to 300 s. Contact angle measured
10 times on each of three separate gold surfaces. Error bars are ±1 standard deviation. ....... 132
Figure 59|AFM images of template stripped gold after various CFC-22 plasma exposure
times. Surface area 500×500 nm2. .................................................................................................... 133
Figure 60Cyclic voltammograms of plain template stripped gold (...) and template stripped
gold after 6 s exposure to PFP plasma (_) in 0.1 mol dm–3 NaF solution. Scan rate 100 mV s–1.
Peak 1 is the result of reduction of oxygen in the solution and disappears as the solution is

List of Figures
22
degasssed. It should be noted that peak 2 increases while peak 3 decreases with subsequent
scans. This is possibly due to a rearrangement of the template stripped surface. ..................... 134
Figure 61Underpotential deposition of 12 mmol dm–3 Pb(NO3)2 in 10 mmol dm–3 NaCl and
100 mmol dm–3 HNO3 on a) etched gold wire, b) template stripped gold and c) template
stripped gold after exposure to PFP plasma for 60 s. Scan rate 20 mV s–1. When comparing a)
with b) and c), there is a change in ratio of the peak areas. One possible explanation for this is
a change in the ratios of different crystal facets on the different polycrystalline gold surfaces.
............................................................................................................................................................... 137
Figure 62|Pentadecafluoro-octanoic acid 2,3-dihydro-thieno(3,4-b)(1,4)dioxin-2-
ylmethylester, or EDOT-F can be electropolymerised to form the conductive hydrophobic
polymer PEDOT-F.37 ......................................................................................................................... 139
Figure 63|(Top) Photograph of a water droplet on a superhydrophobic PEDOT-F surface
with a 156o contact angle. (Bottom) Scanning electron micrograph of the same surface. The
high surface area and porosity of the surface dramatically increase the hydrophobicity. ........ 142
Figure 64|Template stripped PEDOT-F. 5.3 nm RMS roughness. 17.6 nm peak height. .... 143
Figure 65|Experimental geometry for varying the potential across a liquid droplet. The glass
cuvette is approximately 5 cm in each dimension. A CCD camera with microscope lens then
records a video of the droplet through the cuvette wall and First Ten Ångstroms analysis
software is used to measure the contact angle. ............................................................................... 149
Figure 66|Typical electrowetting responses of a 0.1 µL droplet of 0.1 mol dm–3 TBATPB in
DCE surrounded by 0.01 mol dm–3 LiCl solution. Comparison between sputtered (rough
surface) and template stripped (smooth surface) electrodes illustrating the effect of surface
roughness on hysteresis. The droplets started at –1 V and every 10 s the potential was reduced
by 0.1 V until it reached 0 V, at which point the scan was reversed. The error on each point is
±2 degrees. ........................................................................................................................................... 152
Figure 67|Typical electrowetting response for fluoroplasma functionalised gold surface. A
very large change in contact angle is seen initially, with a quick response time. However, the
droplet is completely pinned on the return scan. This may be caused by an unstable surface
which rearranges underneath the moving droplet. ........................................................................ 155
Figure 68Cartoon illustrating a possible cause of hysteresis. When a potential is applied, the
electrode is screened by an electrochemical double layer. Water molecules become aligned to
the strong electric field and also screen the surface charge by adsorbing to the surface. This

List of Figures
23
coincides with contraction of the droplet. Even after the potential has been relaxed, a layer of
water molecules remain trapped at the surface, preventing the hydrophobic droplet from
spreading back across the electrode. ................................................................................................ 159
Figure 69|Electrowetting response for 0.1 mol dm–3 LiCl aqueous phase with DCE droplet.
There is a reduction in hysteresis when TBATPB is removed from the droplet. ..................... 160
Figure 70|Change in electrowetting response of a pure DCE droplet as aqueous electrolyte
concentration is varied. Template stripped gold was used as the electrode. At 0.10 mol dm–3
LiCl there is a minimum in the hysteresis between forward and reverse scans. This coincides
with a maximum in the difference between the lowest and highest attainable contact angles.
............................................................................................................................................................... 162
Figure 71Electrowetting response of a DCE droplet on template stripped gold surrounded
by 0.10 mol dm–3 LiCl solution. As the potential is switched between –0.1 V and –0.9 V, the
contact angle jumps between two different values. After over 100 potential pulses the same
contact angle variation is seen. The ‘equilibration period’ represents the first cycle before the
droplet begins to reproducibly cycle between two values. ............................................................ 163
Figure 72|Electrowetting response of 3-chloro-1-propanol with an aqueous phase of LiCl of
varying concentrations. At 0.12 mol dm–3 and 0.20 mol dm–3 LiCl the system is heavily pinned.
Remarkably, however, at 0.16 mol dm–3 LiCl the pinning disappears. The contact angles at low
values can only be read to an accuracy of ±2 degrees. Therefore, at 0.16 mol dm–3 LiCl there is
almost no hysteresis within the error of the contact angle measurements. ................................ 167
Figure 73|Cyclic voltammetry of 0.1 mol dm–3 LiCl saturated with 3-chloro-1-propanol. The
addition of 0.05 mol dm–3 NaOH delays the onset of a Faradaic reaction, suggesting that the
current is due to the high proton concentration in solution brought about by the Brønsted
acidity of 3-chloro-1-propanol. ......................................................................................................... 168
Figure 74|Electrowetting response for the 3-chloro-1-propanol system with an aqueous
phase of 0.05 mol dm–3 NaOH and 0.01 mol dm–3 LiCl on template stripped gold. ............... 169
Figure 75|Electrowetting response of a mixed DCE:3-chloro-1-propanol 1:3 droplet, with
0.15 dm–3 LiCl in the aqueous phase. This is the only known example of low voltage
electrowetting at positive potentials on a solid (rather than mercury) surface. ......................... 170
List of Tables
24
List of Tables
Table 1|Size of polarisation window for different electrolytes. In all cases the organic
electrolyte was 1 mmol dm–3 BTPPATFPB. The limits are arbitrarily defined as the potential at
which the current rises to ±1 μA cm–2. ............................................................................................. 71
Table 2|Variation in RMS roughness of template stripped gold with the epoxy used in the
surface fabrication. Also shown is how roughness slowly increases after the gold has been
exposed to the atmosphere and how the roughness increases more quickly after the gold has
been submerged in water. The ‘failed’ surfaces were very rough immediately after being
removed from their templates. They exhibited large cracks which could easily be made out by
the naked eye. ........................................................................................................................................ 96
Table 3|Properties of high temperature glassy carbon compared with graphitic carbon. Data
taken from Kinoshita unless otherwise stated.31 Values are purely illustrative as glassy carbon
properties are dependent upon precursor material and pyrolysis conditions. aGold 111, defined
as onset of oxide growth. bMeasured with coumarin present in solution. .................................. 100
Table 4|Conductivity of phenol formaldehyde and 9,10-bis(phenylethynyl)anthracene derived
glassy carbons based on final pyrolysis temperature. There is an error of ±20% due to the
difficulty in measuring the sample thickness................................................................................... 110
Table 5|Contact angle of water on gold, glassy carbon and copper before and after
functionalisation with 3,5-bis(2-ethoxyhexafluoroisopropyl)benzene. Errors indicate ±1
standard deviation. .............................................................................................................................. 127
Table 6|Electrochemical capacitance as a function of gold exposure time to CFC-22 and
perfluoropropane plasmas. The error in the measurements is approximately ±10% due to
estimation of the surface area of the electrodes. ............................................................................ 136
Table 7|Contact angle of water on PEDOT-F surfaces of varying thicknesses. Films were
deposited from 0.05 mol dm-3 TBAClO4 and 0.01 mol dm-3 EDOT-F in PC. The
electropolymerisation potential was 0.7 V versus Ag/Ag+ reference. Errors indicate ±1
standard deviation. .............................................................................................................................. 141

Chapter 1: Introduction
25
Chapter 1: Introduction
The structure of this thesis is such that Chapter 1 will introduce electrowetting. It begins with
a description of simple wetting phenomena before moving on to how electric charge can
affect the wetting of a surface. The rest of the chapter will cover the history of electrowetting
from its inception in 1875 by Gabriel Lippmann right through to cutting edge applications in
microfluidics and display technologies. It will also look at the theory and first experimental
demonstrations of electrowetting with two electrolytes which were the direct inspiration for
this thesis. Chapters 2, 3 and 4 will then describe efforts directed at solving many of the issues
associated with electrowetting at low voltages. These issues include stabilisation of the
liquid|liquid interface and the preparation of very smooth, fluorinated surfaces to create a
‘lubricated’ electrode. Finally, Chapter 5 will bring all of these foundations together to provide
a systematic study of electrowetting at exceptionally low voltages.
1.1 Wetting
Wetting is the phenomenon by which a liquid spreads across a surface. While some liquids
may completely wet a solid, others repel the surface and form droplets. The extent of wetting
or surface coverage is characterised by the contact angle a droplet makes at the three-phase
line (designated by alpha in Figure 1). This line is the point at which the solid surface, liquid
droplet and surrounding medium meet.
1.1.1 The Young equation
The contact angle of a liquid droplet on a solid surface surrounded by air is related to the
surface energies of its three interfaces by the Young equation:1
(Equation 1)
Introduction
26
where Y is the Young contact angle as shown in Figure 1. These interfaces, measured in units
of energy per unit areai, are ds the droplet|solid surface energy, da the droplet|air surface
energy and sa the solid|air surface energy. The vertical bar symbol is used throughout this
thesis to designate an interface between two phases. If the droplet|solid surface energy is
smaller than the solid|air surface energy the contact angle will be less than 90o, as is the case
for metals, such as gold. For water droplets such materials are termed hydrophilic. If, on the
other hand, the situation is reversed and the droplet|solid surface energy is larger than the
solid|air surface energy, the contact angle will be greater than 90o. Such materials are termed
hydrophobic and are often made from organic polymers with fluorinated chains, such as the
polymer polytetrafluoroethylene (PTFE) which is the most hydrophobic. This phenomenon is
illustrated in Figure 1. The Young equation is of course applicable to any three phase system
and the following chapters will be predominantly concerned with aqueous droplets
surrounded by an immiscible organic liquid phase.
Figure 1|The Young equation relates the contact angle, α, to the surface energies of the droplet|solid (γds), droplet|air (γda) and solid|air (γsa) interfaces. Pictured are a water droplet on a very hydrophobic PTFE surface and on a hydrophilic gold surface. The three-phase line, in this case, is the point at which solid, droplet and air all meet.
i Units of force per unit length are equivalent and are commonly used for surface tension, which refers exclusively to the liquid|air surface energy. Surface energy is a generic term covering all interfaces such as solid|liquid or liquid|liquid interfaces as well as liquid|air.

Introduction
27
1.1.2 Heterogeneous surfaces
Beyond simple homogeneous surfaces, the patterning or nano-structure of a surface will also
affect its wettability.
Wetting on surfaces composed of two different materials is described by the Cassie equation:1
(Equation 2)
where f1 and f2 are the fractions of surfaces with contact angles α1 and α2 respectively.
A special application of the Cassie equation occurs for nano-structured surfaces with a very
large roughness or real surface area.2 In such a situation, rather than wet the entire surface it
becomes favourable to trap air pockets under the droplet as illustrated in Figure 2. This
trapping of air results is an unusual application of (Equation 2, where 1 is the droplet|solid
contact angle and 2 the droplet|air contact angle.
1.1.3 Surface roughness
As mentioned above, surface roughness also has an effect on the macroscopic contact angle.
Surface roughness exaggerates the contact angle of the perfectly flat surface according to the
following relation:1
(Equation 3)
where rough is the contact angle of the rough surface, flat is the contact angle of the perfectly
flat surface and r is the roughness factor which is the ratio of the real surface area to the
projected surface area. Hence hydrophobic surfaces appear more hydrophobic and
hydrophilic surfaces appear more hydrophilic as they get rougher.

Introduction
28
Figure 2|(Left) A water droplet on a flat hydrophobic polymer surface exhibits the natural equilibrium contact angle. (Middle) A rougher surface exaggerates the macroscopic contact angle. (Right) When the surface is very rough air pockets are trapped under the droplet, as this is a lower energy configuration. This is known as the Cassie-Baxter state.
1.2 Contact angle hysteresis
A concept essential to this thesis is that of contact angle hysteresis, which is also closely
related to pinning of the three-phase line.
Contact angle hysteresis is generally considered to result from a combination of surface
roughness; surface heterogeneity; rearrangement of the surface under the droplet; or surface
adsorption of solutes or impurities in the droplet.1 Surface roughness or heterogeneity results
in pinning when the droplet becomes trapped in a local energy minimum, from which it
cannot easily escape. This trapping of the droplet means that as it spreads or contracts across a
surface it will not reach the contact angle predicted by the Cassie or Young equations, which
corresponds to its true minimum energy state (Figure 3). It has been shown that this type of
pinning can be overcome by agitating the droplet with an external force such as a lateral
vibration.3 The agitation gives the droplet an energy ‘kick’, helping it break free of its trapped
state.
Introduction
29
Figure 3|This droplet is pinned on a rough surface. It exhibits a larger contact angle than the predicted Young contact angle (black outline) because the intermediate contact angle (red outline) through which the droplet must pass is higher in energy.
If the surface is able to reorganise itself, perhaps due to the presence of mobile adsorbates, a
much more complicated situation arises. If a reproducible contact angle is desired this scenario
must be avoided. In essence, the pinning in this situation is due to the spontaneous formation
of an inhomogeneous surface. An extreme example of this is known as ‘autophobicity’. When
a surfactant containing water droplet spreads across a clean hydrophilic surface, the
surfactants adsorb onto the surface with the hydrophobic half of the molecule left pointing
into the droplet. The surfactants then turn the surface into a hydrophobic one and the water
droplet subsequently contracts irreversibly.4,5
Similarly, if the droplet contains a high salt concentration, the salt may be deposited onto the
underlying surface, particularly at the three-phase line if the droplet slowly evaporates. This
process will pin the droplet.
Therefore, because the aim is to reduce hysteresis in an electrowetting system, these sources of
pinning should be removed as far as is possible.
1.3 Electrowetting
When an electrolyte solution comes into contact with a charged surface, ions in the solution
migrate to the interface, screening the charge. These interfacial charges, separated by a small

Introduction
30
distance, behave as a capacitor and store electrostatic potential energy. The separated charges
are known as an electrochemical double layer capacitor. It is localised at the interface and
therefore contributes to the total surface energy, still measured in energy per unit area. If the
surface charge can be varied, it becomes possible to vary the total surface energy. This process
can result in a change in the shape of a droplet, as dictated by the Young equation. It is this
change in shape, resulting from an electrically induced change in surface wettability, which is
known as electrowetting.
1.3.1 Early electrowetting studies
Electrowetting was first described by Gabriel Lippmann in 1875 when he noticed that the
addition of electrostatic charge could modify capillary forces at an interface.6 Then in the
1930s Frumkin et al. used the same principle to study oil droplets on mercury surrounded by
an aqueous electrolyte.7 The experimental geometry used by Frumkin is described in Figure 4.
As a potential is applied to the mercury electrode, an electrochemical double layer forms at the
interface between the electrode and the aqueous phase. The migration of charge to the
interface is spontaneous and therefore must lead to a reduction in the surface energy.
Consequently, the electrode|aqueous phase interface grows at the expense of the
electrode|droplet interface.

Introduction
31
Figure 4|Geometry of the early electrowetting experiments performed by Frumkin. A toluene droplet sits on a mercury electrode surrounded by an ionic solution. When a potential is applied an electrochemical double layer forms at the electrode|aqueous phase interface. This lowers the surface energy and the contact angle changes in accordance with the Young equation.
The contact angle shows a parabolic dependence on the applied potential with a minimum at
the point of zero charge (PZC), where the PZC is the potential at which the electrical surface
charge density is zero and therefore the point at which there is no electrostatic contribution to
surface energy. The parabolic dependence stems from the relationship between the applied
potential and the energy stored in the double layer capacitor:
(Equation 4)
where E is the energy stored in the capacitor, C is the double layer capacitance, U is the
applied potential and UPZC is the potential at the point of zero charge.
Thus, the electrode|aqueous phase surface energy in the presence of an external potential can
be divided into two separate components:
(Equation 5)

Introduction
32
where is the total aqueous phase|electrode surface energy and is the aqueous
phase|electrode surface energy at the PZC. can be thought of as the surface energy
arising from potential independent intermolecular interactions such as Van der Waals forces
and dipole interactions. This simple model assumes that the double layer capacitance is
independent of potential. While this is not the case, this added complication does not alter the
outcome of this line of argument.
If we insert this new term for the aqueous phase|electrode surface energy into the Young
equation, the dependence of the contact angle on potential is revealed:8
(Equation 6)
where is the contact angle at the PZC and is the droplet|aqueous phase surface
energy. If physically reasonable values for these parameters are used (let =30o,
C=20 μF cm–2, =10 mJ m–2), the decrease in cos α is five times the square of the applied
potential (measured in Volts). These values would mean the contact angle would have
increased to 56o at 0.25 V versus PZC and would have attained a maximum 180o at 0.93 V.
Therefore, as Frumkin found experimentally, small potentials induce substantial changes in the
contact angle.
There are two main limitations to this approach to electrowetting. Firstly, the range of
accessible contact angles is largely determined by the range of accessible potentials. In turn,
this is limited by the onset of Faradaic processes which are irreversible electrochemical
reactions at the electrode. Secondly, a reproducible variation in contact angle has only been
seen on mercury. Mercury is unique in that it is atomically smooth and homogeneous and
thereby unsusceptible to pinning. However, as mercury is a liquid, there is little possibility to
use this method for the portable applications of electrowetting discussed later.

Introduction
33
Figure 5|[Taken from Cousens9] A recreation of Frumkin’s experiment from 1932. A 1,2-dichloroethane droplet sits on a mercury electrode surround by 0.1 mol dm–3 LiCl solution. Potentials are versus an Ag/AgCl reference electrode.
1.3.2 Further developments in electrowetting
After Frumkin, it appears that very little work was done on electrowetting for the next four
decades. Eventually, however, interest slowly began to return. In 1981, Beni and Hackwood
devised an electrowetting display and optical switch based on the flow of liquids driven by
changes in surface wettability.10-12 Their first device designs used gold or indium tin oxide
electrodes although later devices used mercury. Not very much is known about the limitations
or successes of this system and there is no analysis of the electrowetting response. In 1992,
Sondag-Huethorst and Fokkink demonstrated electrowetting on gold coated with an
insulating alkane-thiol layer.13,14 The thiols were terminated with a ferrocene group which
could be reversibly oxidised. On doing so, there was a change in the wettability of the surface
with a maximum contact angle variation of about 25o. However, this showed a very large
hysteresis owing to reorganisation of the thiol layer as discussed in Section 1.2. The largest
reproducible change in contact angle was only 10o. Whitesides et al. also used a thiol modified
gold surface to design an electrowetting system.15 By electrochemically adsorbing/desorbing
an alkane terminated thiol, the contact angle of an oil droplet on the electrode was varied.
These methods of electrowetting are fundamentally different to those presented thus far
because the surface energy is changed by altering the chemical nature of the surface rather
than an increase in electrostatic potential energy. Nonetheless, the Whitesides method enables
a change in contact angle of 91o at a rate of approximately 2 Hz, the disadvantage being that
only two different contact angles are accessible while conventional electrowetting can access
any contact angle (in principle).

Introduction
34
1.3.3 Electrowetting on dielectric
The biggest leap forward for electrowetting came with the development of electrowetting on
dielectric, commonly known as EWOD. This technology, pioneered by Berge in the 1990s, is
currently used in many electrowetting devices.16,17 However, despite its maturity and wide
application, EWOD has several limitations, opening the door for new types of electrowetting.
The basic geometry for EWOD is shown in Figure 6. It shows an immiscible oil droplet
surrounded by water containing a simple salt, much as before. Crucially however, the oil and
water are separated from the electrode by a thin layer of dielectric material which prevents
Faradaic processes occurring. When a potential is applied, ions migrate to the
dielectric|aqueous phase interface storing energy in a capacitor. This process lowers the
surface energy resulting in electrowetting. Again the energy stored in the capacitor is described
by (Equation 4) shown earlier. When (Equation 4) is combined with the Young equation, the
result is the Lippmann-Young equation relating applied potential to contact angle for EWOD
systems:17
(Equation 7)
where Y is the Young contact angle and dw is the surface energy of the droplet|aqueous
phase. This is very similar to (Equation 6 except that the PZC is usually neglected in this
instance as the required voltages are much larger than the PZC.
The capacitance of the interface is now much smaller because of the larger separation of the
charges either side of the dielectric layer. While the Lippmann-Young equation states that this
reduces the magnitude of the electrowetting response, this is compensated for by the large
potentials which can be applied. Furthermore, because the energy stored increases with the
square of the potential, a large change in contact angle can still be achieved.

Introduction
35
Figure 6|EWOD is similar to conventional electrowetting with the addition of a dielectric layer on top of the electrode, where the electrode is now solid rather than liquid mercury. The dielectric layer prevents Faradaic processes at the electrode, allowing large potentials to be applied.
The nature and thickness of the dielectric layer are very important. At very large potential
gradients the dielectric material will breakdown. This problem means that while thin layers
increase the capacitance of the interface they are also less robust. Usually, the dielectric layer is
a combination of an oxide coated with a hydrophobic polymer. The oxide is robust with a
larger relative permittivity while the polymer can be used to tailor the wetting properties of the
interface. Wetting properties are essential for two reasons. Firstly, as can be seen from the
Lippmann-Young equation, the minimum attainable contact angle is the Young angle, or the
angle in the absence of an applied bias. Thus, a small Young angle increases the range of
attainable contact angles. Secondly, Berge et al. have shown that a small Young angle and low
surface polarity reduce contact angle hysteresis, an important result inspiring much of the
work in Chapter 4 of this thesis.18
As well as being limited by breakdown of the dielectric layer, a phenomenon known as
‘contact angle saturation’ limits the contact angles accessible to EWOD. While the Lippmann-
Young equation suggests that a contact angle of 180o is attainable (this corresponds to de-
wetting of the droplet from the surface), instead the contact angle becomes constant at large
potentials. The reason behind this is still the subject of debate but probably results from the

Introduction
36
large electric fields in the vicinity of the three phase line which can ionise the surroundings
and inject charge carriers into the dielectric layer.8
Similar to EWOD is dielectrophoresis. This phenomenon is identical to EWOD except that
an AC potential is needed and there are no electrolytes present in either phase. Despite being a
fundamentally different phenomenon, dielectrophoresis has almost identical capabilities and
limitations to EWOD and therefore has similar potential applications.8
The one obvious set back of EWOD is the large operating potential. While Berry has reported
a 100o contact angle change with only a 3 V bias, portable devices using electrowetting
continue to operate at 15-120 V.19-21 Given that lithium-ion batteries used in the majority of
today’s portable technologies have a nominal cell potential of only 3.6 V, an electrowetting
system operating below 3.6 V might greatly reduce the energy consumption, size and
complexity of these devices. The ‘two electrolyte’ electrowetting system discussed in the next
section is a possible way to achieve this.
1.4 Electrowetting with two electrolytes
Electrowetting with two electrolytes was first proposed by Monroe, Daikhin, Urbakh and
Kornyshev in 2006.22 By putting an electrolyte in the droplet as well as the surrounding phase
they devised a model of electrowetting which predicted a change in contact angle at very low
potentials.
Firstly, this section will describe the nature of the interface between two immiscible electrolyte
solutions—commonly referred to by the acronym ITIES—which is of importance to the
model. Then it will give a brief description of this model before finally looking at the first
experimental results of electrowetting with two electrolytes.
Introduction
37
1.4.1 The interface between two immiscible electrolytes
An ITIES consists of two immiscible liquids—one liquid is usually water; the other an oil such
as 1,2-dichloroethane (DCE) or nitrobenzene.23 The water or aqueous phase of an ITIES
contains an inorganic electrolyte such as LiCl, which consists of small ions with a high charge
density. The organic phase contains a bulky organic electrolyte of opposite nature like
tetrabutylammonium tetraphenylborate (TBATPB). Crucially, the electrolytes are selected such
that they are soluble in only one of the phases. Therefore, not only are the two solvents
immiscible, the electrolytes dissolved in them are restricted to their respective halves of the
interface.
The main consequence of an ITIES is that when a potential is applied across the liquid|liquid
interface, a back-to-back ionic double layer forms. This double layer means that the
liquid|liquid interface now behaves as a capacitor where before it didn’t. This concept is
shown in more detail in Figure 7. Also shown is the potential distribution. The potential drop
is distributed exclusively across the four double layers where the local electric fields can be as
high as 107 V cm–1.24 This is not the case for EWOD or conventional electrowetting because
not all liquids in contact with the electrode contain an electrolyte. As a result the electric field
distribution for EWOD is much more complicated. This is partly why EWOD modelling is so
difficult and contact angle saturation phenomena are currently poorly understood.

Introduction
38
Figure 7|Illustration of the formation of a back-to-back electrical double layer when an ITIES is polarised. The top half contains an inorganic salt dissolved in water while the bottom half contains a bulky organic salt in an organic solvent. When a bias is applied (1 V) the ions migrate to the electrodes. The ions are restricted to their respective phases resulting in the formation of a back-to-back electrochemical double layer. (Far right) The electric field distribution shows how the potential decays in the double layers and not in the bulk.
An ITIES is possible because the Gibbs energy of transfer of ions from one phase to the
other is prohibitively high. However, as the potential across the droplet increases, the potential
drop, or Galvani potential difference, across the ITIES also increases. Eventually it becomes
energetically favourable for the ion to cross the interface and the ITIES begins to break down.
The potential at which this occurs is defined by the Gibbs energy of transfer of the ion.25
When working with an ITIES it is essential to know beyond which potentials ion transfer will
occur and cyclic voltammetry of the liquid|liquid interface is the best tool for determining
this. It is useful to see at which potentials significant currents, resulting from ion transfer,
arise. About the PZC there is no ion transfer across the interface and only a small current is
seen as a result of the double layer charging. As seen in Figure 8, when the potential moves
away from the PZC, eventually there is a sharp rise in current. Whether this current is a result
of inorganic ions moving into the organic phase or organic ions moving to the aqueous phase
depends on which process is more energetically costly. Of course, if both ion transfers are of
similar energy, both will contribute to the current simultaneously.

Introduction
39
Figure 8|[Taken from Vanýsek26] Cyclic voltammogram of the ITIES formed from LiCl in water and TBATPB in nitrobenzene. About the PZC (at approximately 300 mV) there is a small double layer charging current. At each end of the voltammogram ion transfer currents arise.
1.4.2 Electrowetting with ITIES
The geometry for electrowetting with an ITIES is essentially the same as for conventional
electrowetting but with the addition of electrolyte to the droplet. In conventional
electrowetting or EWOD only the electrode|aqueous phase surface energy changes. However,
when there is electrolyte in the droplet, ions migrate to all three interfaces (Figure 9) and all
three surface energies become potential dependant. The next section will cover how the
consequences of this have been modelled in detail by Monroe et al., however, a quick
inspection of the Young equation gives an idea of what might happen. The difference between
the electrode|aqueous phase and electrode|droplet surface energies is divided by the
droplet|aqueous phase surface energy. Therefore, the contact angle becomes very sensitive to
changes in the droplet|aqueous phase surface energy. It was hoped that as a result, there
would be a larger driving force for shape change. This would make low voltage shape change
on non-ideal surfaces possible. An added consequence of electrowetting with ITIES is a

Introduction
40
smothering of the tendency of electric fields to diverge at the three-phase boundary. In
EWOD this distorts the truncated spherical shape of the droplet but this effect is negligible
with ITIES.8 This means that if the densities of both liquids are similar, or if the droplet is
small—negating buoyancy effects—the droplet will be a perfect truncated sphere. This makes
it an ideal lens, as discussed further in Section 1.5.
Figure 9|Electrowetting with ITIES. The addition of electrolyte to the droplet means that all three droplet surface energies are now potential dependant, where previously only the aqueous phase|electrode surface energy was affected. The Young equation shows that the contact angle is particularly sensitive to the liquid|liquid energy. Therefore, changing this surface energy may result in a significant contact angle change.
1.4.3 Theoretical model
The model devised by Monroe, Daikhin, Urbakh and Kornyshev calculates the droplet
geometry which minimises the Gibbs energy of the droplet at a given potential. The full
equation is given below27-30:
[ ]
[ ] (Equation 8)
where d, e and w are the droplet, electrode and aqueous phase respectively, is the surface
energy due to intermolecular interactions, is the capacitive energy (based on the potential

Introduction
41
dependant capacitance and potential drop), A is the area, Vd is the droplet volume and Δp the
Laplace pressure. The surface energy terms are assumed to be independent of potential. The
capacitances of the double layers are estimated using standard electrochemical double layer
theory. The best description of the double layers are Verway-Niessen theory and Gouy-
Chapman (GC) diffuse-layer theory combined with the elementary Mott and Watts–Tobin
(MWT) approximation for the inner-layer part.31 These models have been justified by
experiment: the structure of the ITIES has been probed by surface energy measurements,
cyclic voltammetry, electrochemical impedance spectroscopy and optical second harmonic
generation (SHG).32-36 SHG actually provides direct optical measurement of the accumulation
of electrolyte in the interfacial region. Due to the screening of the electric field at each
interface the potential distribution can be calculated analytically. Obviously, the electric field
distribution is needed to calculate the potential drop across the double layers and thus
calculate the energy stored therein. This essential element is why the model cannot be applied
to EWOD: the complex electric field distribution is unknown.
Using experimental data for surface energies and capacitances, the resulting curves of potential
against contact angle predict that low potentials induce large changes in droplet shape, with
the contact angle eventually reaching 180o. They also predict that increasing the electrolyte
concentration, whilst keeping the electrolyte concentrations inside and outside of the droplet
equal, should increase the electrowetting response.
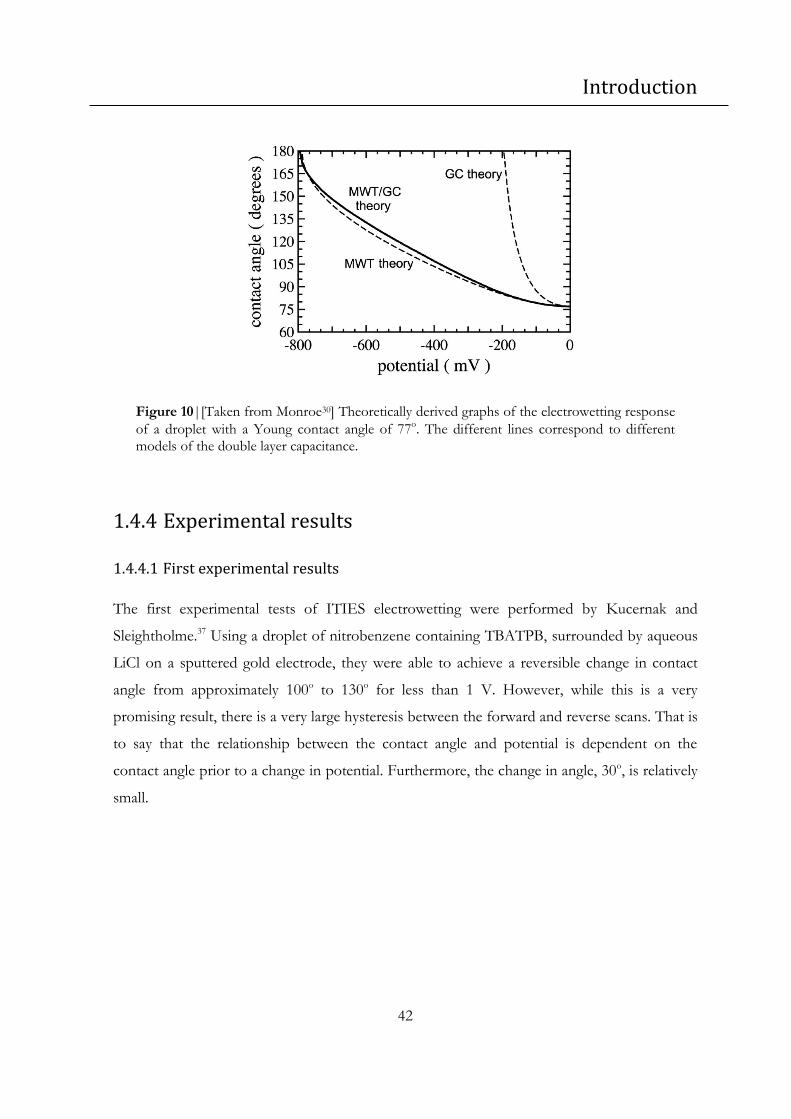
Introduction
42
Figure 10|[Taken from Monroe30] Theoretically derived graphs of the electrowetting response
of a droplet with a Young contact angle of 77o. The different lines correspond to different
models of the double layer capacitance.
1.4.4 Experimental results
1.4.4.1 First experimental results
The first experimental tests of ITIES electrowetting were performed by Kucernak and
Sleightholme.37 Using a droplet of nitrobenzene containing TBATPB, surrounded by aqueous
LiCl on a sputtered gold electrode, they were able to achieve a reversible change in contact
angle from approximately 100o to 130o for less than 1 V. However, while this is a very
promising result, there is a very large hysteresis between the forward and reverse scans. That is
to say that the relationship between the contact angle and potential is dependent on the
contact angle prior to a change in potential. Furthermore, the change in angle, 30o, is relatively
small.

Introduction
43
Figure 11|[Taken from Kornyshev et al.37] Low voltage driven contact angle variation for a 0.1 µL nitrobenzene droplet containing 0.01 mol dm–3 TBATPB surrounded by 0.5 mol dm–3 aqueous LiCl on a sputtered gold electrode. A large hysteresis can be seen between forward and reverse scans.
So critically, electrowetting with ITIES solves the issue of a high operating voltage but several
other issues, essential to the performance of an electrowetting device, need to be resolved. For
example, this technology would not be suitable for electro-variable lenses where the desired
contact angle must be achieved quickly and precisely to obtain sharply focused images.
Like the Lippmann-Young equation for EWOD, the theory also predicts a maximum contact
angle of 180o at large potentials. For unknown reasons this was not been seen experimentally.
Instead, contact angle saturation is seen and the largest contact angles achieved were less than
140o. In this instance however, breakdown of the dielectric layer (used in EWOD) cannot be
invoked to explain the phenomenon. Also the model predicts a symmetric electrowetting
response about the PZC. However, ITIES electrowetting was only seen at potentials negative
of the PZC, with no response seen at positive potentials.

Introduction
44
1.4.4.2 Pulsing
In order to reduce hysteresis in the system described above, Kornyshev et al. applied a
sequence of short (50 μs), high voltage (2-3 V) pulses on top of the applied bias potential.37 As
mentioned earlier, small vibrations can be used to ‘de-pin’ droplets by giving them a small kick
of energy to escape their trapped state. This pulsing method uses the same principle but is
much more convenient for an electrowetting system. The pulses last only 50 µs to ensure that
no Faradaic processes have time to occur. As seen in Figure 12, the pulses seem to drive the
droplet towards an equilibrium contact angle.
Figure 12|[Taken from Kornyshev et al.37] Illustration of how contact angle pinning is reduced by a pulsed-potential control technique. (a) Electrowetting dynamics for a 0.1 μL droplet of 0.1 mol dm–3 TBATPB in nitrobenzene surrounded by aqueous 0.5 mol dm–3 LiCl
on a sputtered-gold substrate. Pinning is reduced by potential pulses of ±2.0 V over the constant bias of –0.65 or 0.00 V versus Ag/AgCl. The lower part of the diagram shows the
applied potential profile. During the periods 0-4.5 s and 24-32 s, the electrode was disconnected and so the potential is uncontrolled. (b) Absolute difference between the cosine
of the angle in the ith pinned state and the ‘final’ value of this cosine, which is essentially established after the tenth pulse. It can be seen that the droplet approaches an equilibrium shape.

Introduction
45
This pulsing method has been dealt with theoretically by Marinescu et al.38,39 There are two
forces assumed to be acting on the droplet when a potential is applied. A driving force, which
tends to bring the droplet to its equilibrium shape for the applied potential, and a friction
force opposing this motion. As the displacement of the three-phase contact line after each
pulse is much larger than the characteristic dimension of the roughness of the studied gold
surface, the resistance to the motion of the contact line can be described in a first
approximation by a position independent mean friction force. A good fit with experimental
data is achieved (Figure 13).
Figure 13 also illustrates how a small percentage change in the frictional force can have a large
effect on the observed contact angle. The frictional force can be seen to affect both the
maximum and minimum contact angles, where large frictional forces limit the contact angle
range. There is also a dramatic difference in the contact angle change after the first pulse: with
a frictional force of 1.80×10⁻⁵ N the angle changes by only 13o while for a frictional force of
1.50×10⁻⁵ N the angle changes by 25o.
Such a model is useful because it can provide valuable insight into the importance of particular
parameters such as surface friction and PZC. This in turn allows better informed decisions to
be made on how to improve an electrowetting system.
Figure 13|[Taken from M. Marinescu39] (Left) Model of electrowetting dynamics facilitated by pulsing. Experimental results presented in Figure 12 with modelled fit. Cycle Steps: (–1) position after Up = 1 V on Ub = 0, (0) Ub = –0.65 V, (1-10) Up = –1 V, (11) Ub = 0, (12-21) Up = 1 V. (Right) Predicted effect of friction force F0 on final contact angle. Experimental parameters: –0.65/0 V biases, –1/1 V pulses, TBATPB conc. = 0.1 mol dm–3, LiCl conc. = 0.5 mol dm–3. Other parameters: droplet mass = 1.2×10⁻¹⁰ kg, water/nitrobenzene viscosity difference = 0.3×10⁻⁵ kg s–1, Young’s angle = 1o, Upzc = 0.3 V,

Introduction
46
friction force = 1.65×10⁻⁵ N. Up, Ub and Upzc are the pulse potential, bias potential and point of zero charge respectively.
1.4.4.3 Challenges
Clearly, there are still several hurdles to overcome before two electrolyte electrowetting can
realistically compete with EWOD. Pulsing reduces pinning but does not eliminate the
problem while also complicating the system. It also has a much slower response time than
EWOD. Therefore, an electrode/electrolyte combination which is unyielding to the effects of
pinning would be a better solution. Furthermore, owing to its cost, gold is not an ideal
electrode material.
The quality of fit of the theoretical model for two electrolyte electrowetting is also yet to be
confirmed. This would need to be done on an electrode which exhibited no or very little
pinning.
1.5 Applications of electrowetting
Based on EWOD, various electrovariable optical devices have been designed. These designs
should work equally well with EWOD and ITIES electrowetting. Electrowetting has also
found use in microfluidic devices.
1.5.1 Lenses
Electrovariable lenses, pioneered by Varioptic, are already on the market and can be used in
mobile phones, webcams and barcode readers to name but a few applications.40,41 If, as is
usually the case, the oil and water phases of an electrowetting system have different refractive
indices, light entering the droplet will be refracted. Furthermore, if the densities of the two
phases are similar and if the droplet is kept small, the droplet naturally takes on the shape of a
spherical cap, which is the shape of a lens. The key difference in an electrovariable system is
that rather than moving the lens mechanically to bring objects into focus, the shape of the
droplet is controlled by the applied potential to vary its focal length. This reduces both

Introduction
47
susceptibility to mechanical failure and the volume the lens occupies. Of course, opaque
electrodes such as the ones described above cannot be used without a design modification.
Instead, the droplet sits inside an open annulus made from two different electrodes. The
concept is shown in Figure 14.
Figure 14|(Left and middle) Cross section of an electrowetting lens. The droplet (shown in red) rests on the sides of an annular electrode. It acts as a lens as it has a different refractive index to the surrounding aqueous phase. Its curvature can be varied incrementally from convex to concave by changing the potential applied. (Right) [Taken from www.varioptic.com, May 2012] Electrowetting variable focus liquid lens made by Varioptic. The metal case diameter is 7.75 mm. Suitable for 30 fps video. Operating temperature range of –20 to 60 °C. The lens contains no mechanical components.
One potential limitation is the distortion of the lens by gravity. The extent of the distortion is
determined by the difference in densities of the two fluids and the surface energy between
them. Using water and oil the limit of the lens diameter is about 10 mm. Large lenses are
possible if the density of the surrounding medium is equal to that of the droplet and this can
be achieved using water and specially engineered silicone oils.
1.5.2 Displays
Another promising application of electrowetting is for display technologies. If the droplet
contains a dissolved dye, electrowetting can be used to cause the droplet to fill or vacate a
small cell, thus altering the cell’s colour. Using this principle displays which are similar in

Introduction
48
appearance to liquid crystal displays can be made. Crucially however, these displays are much
more energy efficient (with energy savings in the range of 50-80 per cent compared to liquid
crystal displays).42 The high energy efficiency arises from the fact that no energy is consumed
while the picture is static. This approach is also a competitor for use in electronic paper. For a
review of EWOD pixel design see Andelman et al.40
Figure 15|[Photograph taken from Feenstra43] Cartoon and photograph of an electrowetting pixel. When a potential is applied the droplet covers the bottom of the cell. The droplet contains a dye to colour the pixel. When the potential is turned off the cell returns to its original configuration.
1.5.3 Digital microfluidics
The fastest growing application of electrowetting is in the field of microfluidics. Using
EWOD, discrete droplets can be moved onto individually addressable electrodes, so called
‘digital microfluidics’. A series of electrodes are designed so that by turning one electrode off
and its neighbour on, a droplet will hop between them. It is possible to create, cut, transport
30 V

Introduction
49
and merge droplets in this way (Figure 16).Uses include all current applications of lab-on-a-
chip based microfluidics such as the polymerase chain reaction and other bioassays.44,45
Droplets can also be moved by dielectrophoresis, the manipulation of a pure electrolyte free
liquid using an AC field, and this is often preferred as whatever is contained within the
droplets (perhaps chemical reactants or biological material) is not contaminated by the
presence of an electrolyte.
Figure 16|[Taken from Kim46] Illustration of the four fundamental droplet operations needed in microfluidics. The operations are controlled by the switching on or off of the discrete electrodes.
1.5.4 Other applications
Unusual uses of electrowetting include: the use of high frequency AC electrowetting of an air
bubble as a means of underwater propulsion;47,48 an electrowetting beam deflector which,
through the use of multiple electrodes, can control the angle of a flat meniscus;49 miniaturized
ultrasound scanners;50 and liquid-state field-effect transistors which work by electrowetting
between competitive insulating and conducting fluids to control the on/off current.51

Introduction
50
Figure 17|[Taken from Kang24] Streamlines and oscillation patterns for oscillating bubbles at different frequencies. Bubble volume = 1 µL and VRMS = 80 V.
Figure 18|[Taken from Kim51] Illustration of the principle behind a liquid-state field-effect transistor, or LiquiFET. It operates with a 2.5-3 V drain voltage with on/off current ratios greater than 10000:1.
1.6 Conclusions
While electrowetting has a long history starting with Lippmann in 1875, it is only fairly
recently that it has made the transition from being a phenomenon of purely fundamental
interest to becoming a practical technology. This is done by companies such as Liquavista who

Introduction
51
now produce electrowetting displays. These displays, along with other current applications, are
based on EWOD, which enables the fast and reliable manipulation of liquid droplets.
Nonetheless, EWOD requires a large voltage to work, increasing the power consumption of
these devices.
Recently, electrowetting with ITIES has been shown to enable droplet manipulation on solid
surfaces using much lower voltages. However, this is not without issue as the droplets are
‘pinned’, limiting the control over droplet shape. Despite efforts to alleviate this issue using a
‘voltage pulsing’ technique; fast, reproducible droplet shapes are still not possible.
The hope of this thesis is that the ITIES electrowetting phenomenon might be better
understood both at a practical and fundamental level. The primary obstacle to IITES
electrowetting is pinning, and the following chapters describe methods to try to reduce this.
These methods range from producing ultra-flat surfaces, to creating fluorinated, yet
conductive, electrodes. Furthermore, as ITIES electrowetting is still a relatively unstudied
phenomenon, the effect of the aqueous phase electrolyte and droplet composition is also
studied, with some unexpected results. Another issue, the stability of the liquid|liquid
interface, is also resolved. All of these effects are finally brought together to create an
optimised low voltage electrowetting system.

Introduction
52
1.7 References
1 Adamson, A. W. & Gast, A. P. Physical Chemistry of Surfaces. 6th edn, (John Wiley & Sons, Inc., 1997).
2 Cassie, A. B. D. & Baxter, S. Wettability of Porous Surfaces. Transactions of the Faraday Society 40, 546-551 (1944).
3 Daniel, S., Chaudhury, M. K. & de Gennes, P. G. Vibration-actuated Drop Motion on Surfaces for Batch Microfluidic Processes. Langmuir : the ACS journal of surfaces and colloids 21, 4240-4248 (2005).
4 Adamson, A. W. Physical Chemistry of Surfaces. 5th edn, (John Wiley & Sons, Inc., 1990). 5 de Gennes, P. G. The Dynamics of Reactive Wetting on Solid Surfaces. Physica A:
Statistical Mechanics and its Applications 249, 196-205, doi:10.1016/s0378-4371(97)00466-4 (1998).
6 Lippmann, G. Relation entre les Phénomènes Électriques et Capillaires. Ann. Chim. Phys. 5, 494-549 (1875).
7 Frumkin, A. N., Kabanow, B. & Nekrasow, M. Kapillarelektrische Erscheinungen und Benetzung von Metallen durch Elektrolytlösungen. I. Phys. Z. Sovijetunion 1, 255-284 (1932).
8 Mugele, F. & Baret, J.-C. Electrowetting: From Basics to Applications. Journal of physics. Condensed matter 17, R705 (2005).
9 Cousens, N. E. A. Shape Changing Liquid Droplets, Imperial College London, (2009). 10 Beni, G. & Hackwood, S. Electro-wetting Displays. Applied physics letters 38, 207-209
(1980). 11 Beni, G., Hackwood, S. & Jackel, J. L. Continuos Electro-wetting Effect. Applied physics
letters 40, 912-914 (1982). 12 Jackel, J. L., Hackwood, S. & Beni, G. Electro-wetting Optical Switch. Applied physics
letters 40, 4-6 (1982). 13 Sondag-Huethorst, J. A. M. & Fokkink, L. G. J. Potential-dependent Wetting of
Octadecanethiol-modified Polycrystalline Gold Electrodes. Langmuir 8, 2560-2566, doi:10.1021/la00046a033 (1992).
14 Sondag-Huethorst, J. A. M. & Fokkink, L. G. J. Potential-Dependent Wetting of Electroactive Ferrocene-Terminated Alkanethiolate Monolayers on Gold. Langmuir 10, 4380-4387, doi:10.1021/la00023a074 (1994).
15 Gorman, C. B., Biebuyck, H. A. & Whitesides, G. M. Control of the Shape of Liquid Lenses on a Modified Gold Surface Using an Applied Electrical Potential across a Self-Assembled Monolayer. Langmuir 11, 2242-2246, doi:10.1021/la00006a063 (1995).
16 Vallet, M., Berge, B. & Vovelle, L. Electrowetting of Water and Aqueous Solutions on Poly(ethyleneterephthalate) Insulating Films. Polymer 37, 2465-2470 (1996).
17 Quilliet, C. & Berge, B. Electrowetting: A Recent Outbreak. Current Opinion in Colloid & Interface Science 6, 34-39, doi:10.1016/s1359-0294(00)00085-6 (2001).
18 Maillard, M., Legrand, J. & Berge, B. Two Liquids Wetting and Low Hysteresis Electrowetting on Dielectric Applications. Langmuir 25, 6162-6167, doi:10.1021/la804118y (2009).

Introduction
53
19 Hayes, R. A. & Feenstra, B. J. Video-speed Electronic Paper Based on Electrowetting. Nature 425, 383-385 (2003).
20 Kuiper, S. & Hendriks, B. H. W. Variable-focus Liquid Lens for Miniature Cameras. Applied physics letters 85, 1128-1130 (2004).
21 Berry, S., Kedzierski, J. & Abedian, B. Low Voltage Electrowetting Using Thin Fluoroploymer Films. Journal of colloid and interface science 303, 517-524 (2006).
22 Monroe, C. W., Daikhin, L. I., Urbakh, M. & Kornyshev, A. A. Principles of Electrowetting with Two Immiscible Electrolytic Solutions. Journal of physics. Condensed matter 18, 2837-2869 (2006).
23 Markin, V., Volkov, A. & Volkova-Gugeshashvili, M. Structure of Nonpolarizable Water/nitrobenzene Interface: Potential Distribution, Ion Adsorption, and Interfacial Tension. The journal of physical chemistry. B 109, 16444-16454 (2005).
24 Flatté, M., Kornyshev, A. & Urbakh, M. Nanoparticles at Electrified Liquid-liquid Interfaces: New Options for Electro-optics. Faraday discussions 143, 109-115 (2009).
25 Reymond, F., Fermin, D., Lee, H. & Girault, H. Electrochemistry at Liquid|Liquid Interfaces: Methodology and Potential Applications. Electrochimica Acta 45, 2647-2662 (2000).
26 Vanysek, P. & Ramirez, L. Interface between Two Immiscible Liquid Electrolytes: A Review. Journal of the Chilean Chemical Society 53, 1455-1463 (2008).
27 Monroe, C., Daikhin, L., Urbakh, M. & Kornyshev, A. Principles of Electrowetting with Two Immiscible Electrolytic Solutions. Journal of physics. Condensed matter 18, 2837-2869 (2006).
28 Monroe, C. W., Daikhin, L. I., Urbakh, M. & Kornyshev, A. A. Electrowetting with Electrolytes. Physical Review Letters 97, 136102 (2006).
29 Monroe, C., Urbakh, M. & Kornyshev, A. The Distinctive Electrowetting Properties of ITIES. Journal of physics. Condensed matter 19, 375113 (2007).
30 Monroe, C., Urbakh, M. & Kornyshev, A. Double-Layer Effects in Electrowetting with Two Conductive Liquids. Journal of the Electrochemical Society 156, P21-P28 (2009).
31 Monroe, C. W., Urbakh, M. & Kornyshev, A. A. Double-Layer Effects in Electrowetting with Two Conductive Liquids. Journal of the Electrochemical Society 156, P21-P28, doi:10.1149/1.2971190 (2009).
32 Conboy, J. & Richmond, G. Examination of the Electrochemical Interface between Two Immiscible Electrolyte Solutions by Second Harmonic Generation. The journal of physical chemistry. B 101, 983-990 (1997).
33 Koczorowski, Z., Paleska, I. & Kotowski, J. Streaming Method Study of Interfaces between Immiscible Electrolyte-Solutions. Journal of electroanalytical chemistry and interfacial electrochemistry 235, 287-298 (1987).
34 Girault, H. & Schiffrin, D. The Measurement of the Potential of Zero Charge at the Interface Between Immiscible Electrolyte-Solutions. Journal of electroanalytical chemistry and interfacial electrochemistry 161, 415-417 (1984).
35 Trojánek, A. n., Lhotský, A., Mareček, V. r. & Samec, Z. Limited Agreement between the Interfacial Tension and Differential Capacity Data for the Polarised Water|1,2-dichloroethane Interface. Journal of Electroanalytical Chemistry 565, 243-250, doi:10.1016/j.jelechem.2003.10.018 (2004).
36 Samec, Z., Lhotský, A., Jänchenová, H. & Mareček, V. r. Interfacial Tension and Impedance Measurements of Interfaces between Two Immiscible Electrolyte

Introduction
54
Solutions. Journal of Electroanalytical Chemistry 483, 47-56, doi:10.1016/s0022-0728(00)00051-6 (2000).
37 Kornyshev, A. A. et al. Ultra-low-voltage Electrowetting. The Journal of Physical Chemistry C 114, 14885-14890, doi:10.1021/jp101051e (2010).
38 Marinescu, M., Urbakh, M., Barnea, T., Kucernak, A. R. & Kornyshev, A. A. Electrowetting Dynamics Facilitated by Pulsing. The Journal of Physical Chemistry C 114, 22558-22565, doi:10.1021/jp1052634 (2010).
39 Marinescu, M. Electrovariable Liquid Interfaces for Optical Applications: Structure and Dynamics, Imperial College London, (2012).
40 Shamai, R., Andelman, D., Berge, B. & Hayes, R. Water, Electricity, and Between ... On Electrowetting and Its Applications. Soft matter 4, 38-45 (2008).
41 Kuiper, S. & Hendriks, B. in IEEE Spectrum (2004). 42 Ehrlich, D. Liquavista Launches Low Power Displays,
<http://www.cleantech.com/news/3716/liquavista-launches-low-power-displays> (2008).
43 Feenstra, J. in Information Display Vol. 22 2-5 (2006). 44 Berthier, J. et al. Some Examples of Micro-devices for Biotechnology Developed at the
Department of Technologies for Life Sciences and Healthcare of the LETI. International Journal of Nanotechnology 7, 802-818 (2010).
45 Jensen, E. C., Bhat, B. P. & Mathies, R. A. A Digital Microfluidic Platform for the Automation of Quantitative Biomolecular Assays. Lab on a chip 10, 685-691 (2010).
46 Cho, S., Moon, H. & Kim, C. Creating, Transporting, Cutting, and Merging Liquid Droplets by Electrowetting-based Actuation for Digital Microfluidic Circuits. Journal of microelectromechanical systems 12, 70-80 (2003).
47 Chung, S. Electrowetting Propulsion of Water-floating Objects. Applied physics letters 95, 014107 (2009).
48 Ryu, K., Zueger, J., Chung, S. & Cho, S. Underwater Propulsion Using AC-Electrowetting-Actuated Oscillating Bubbles for Swimming Robots. Mems 2010: 23rd Ieee International Conference On Micro Electro Mechanical Systems, Technical Digest, 160-163 (2010).
49 de Boer, B. Control of an Electrowetting-based Beam Deflector. Journal of applied physics 107, 063101 (2010).
50 Deladi, S. Miniaturized Ultrasound Scanner by Electrowetting. Applied physics letters 97, 064102 (2010).
51 Kim, D. Y. Liquid-state Field-effect Transistors using Electrowetting. Applied physics letters 90, 43507 (2007).

Chapter 2: Liquid|Liquid Interfaces
55
Chapter 2: Liquid|Liquid Inte rface s
At the end of Chapter 1 the first experimental results of electrowetting with an interface
between two immiscible electrolytes (ITIES) were discussed. In Chapter 2, a major practical
concern with this system is addressed: the stability of the ITIES over the range of potentials
used for electrowetting. In order to nullify this potential complication, the ITIES electrolytes
and solvents were optimised, resulting in a polarisation window in excess of 1.2 V. This ITIES
polarisation window optimisation leads into the development of a new type of ITIES, the
interface between an ionic liquid and an organic solvent.
2.1 Extending the ITIES polarisation window
2.1.1 Motives
As will be discussed in more detail below, at large potentials an ITIES breaks down as ions
begin to cross from one phase to the other. However, for ITIES electrowetting, the value of
the potential applied across the liquid|liquid interface is not known. This is because the
potential applied to the whole system is shared between the liquid|liquid and solid|liquid
interfaces. The Galvani potential difference across the ITIES will be less than the total applied
bias, but this may still be a substantial potential. For example, when 1 V is applied to the entire
system versus PZC, even if only 10 per cent of this potential is dropped across the
liquid|liquid interface, 100 mV can be enough to drive ions across the interface (this can be
seen from Figure 8, page 39).
The stability of the ITIES is a concern for at least three reasons. Firstly, the long term stability
of the system is paramount: there is no value in an electrowetting system that will cease to
function after several hours. Secondly, the transfer of ions between two phases creates a
pseudo-capacitance which may cause electrowetting, but not for the putative reasons given in
Chapter 1.1 It is also assumed in the theoretical model of Monroe et al. that the ITIES behaves
ideally at all potentials. Finally, transferring ions can precipitate in the opposite phase; this
leads to ‘hazing’ of the interface which interferes with the surface’s optical properties.

The Liquid|Liquid Interface
56
The potential drop can be estimated theoretically, which, based on the model of Monroe et al.,
has been done by Marinescu.2 As illustrated in Figure 19, the potential drop over the ITIES is
indeed only a small percentage of the total potential drop between the electrodes. It predicts
that by using 0.001 mol dm–3 electrolyte in the droplet and 0.5 mol dm–3 electrolyte in the
aqueous phase, there is a maximum potential drop across the interface of approximately
±150 mV. Therefore, assuming that there are no detrimental effects to the electrowetting
response, as large a polarisation window as possible would seemingly be important.
Figure 19|[Taken from Marinescu2] Potential across a nonspecific ITIES with monovalent ions as a function of applied system potential where Δ Φds is the potential drop between the droplet and surrounding, cd is the concentration in the droplet and the concentration in the surrounding phase is 0.5 mol dm–3. It can be seen that the potential across the liquid|liquid interface decreases with increasing droplet electrolyte concentration.
2.1.2 Ion transfer
When a potential is applied across the liquid|liquid interface a back-to-back ionic double layer
forms. This is possible because the Gibbs energy of transfer of ions from one phase to the
other is prohibitively high. However, as the potential across the interface increases, the
Galvani potential difference across the ITIES increases.3 This potential is defined as:
(Equation 9)
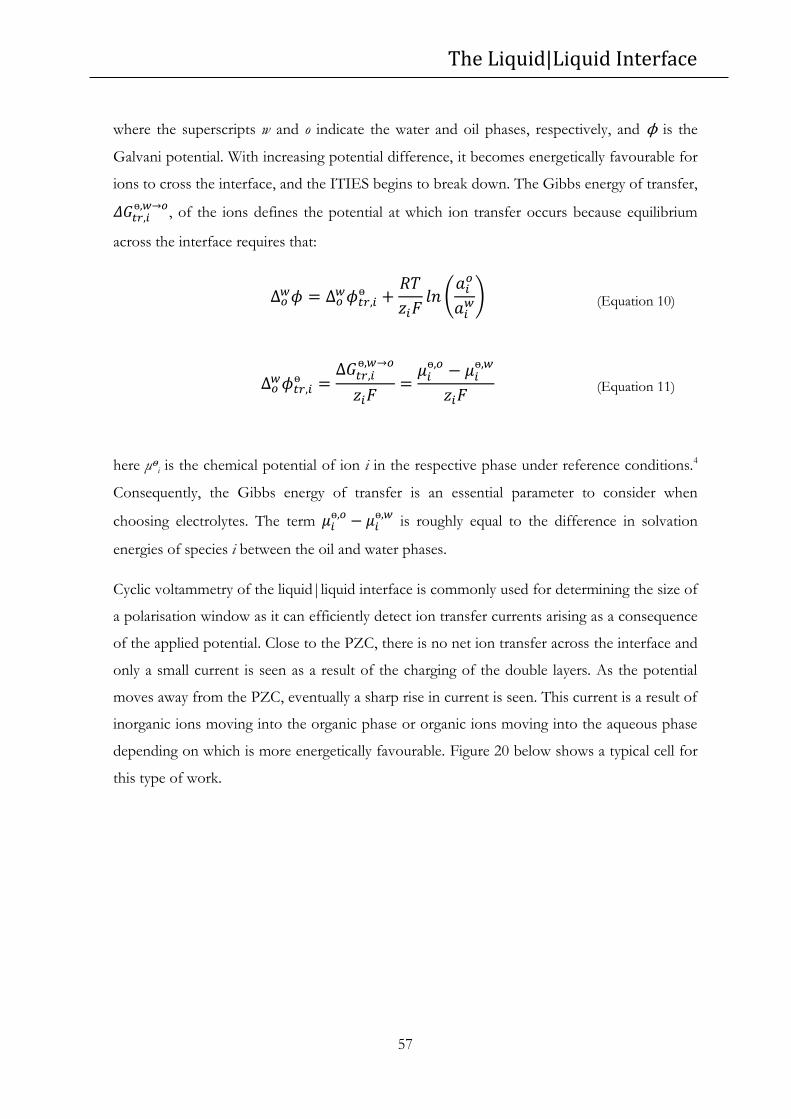
The Liquid|Liquid Interface
57
where the superscripts w and o indicate the water and oil phases, respectively, and ϕ is the
Galvani potential. With increasing potential difference, it becomes energetically favourable for
ions to cross the interface, and the ITIES begins to break down. The Gibbs energy of transfer,
, of the ions defines the potential at which ion transfer occurs because equilibrium
across the interface requires that:
(
) (Equation 10)
(Equation 11)
here μ i is the chemical potential of ion i in the respective phase under reference conditions.4
Consequently, the Gibbs energy of transfer is an essential parameter to consider when
choosing electrolytes. The term
is roughly equal to the difference in solvation
energies of species i between the oil and water phases.
Cyclic voltammetry of the liquid|liquid interface is commonly used for determining the size of
a polarisation window as it can efficiently detect ion transfer currents arising as a consequence
of the applied potential. Close to the PZC, there is no net ion transfer across the interface and
only a small current is seen as a result of the charging of the double layers. As the potential
moves away from the PZC, eventually a sharp rise in current is seen. This current is a result of
inorganic ions moving into the organic phase or organic ions moving into the aqueous phase
depending on which is more energetically favourable. Figure 20 below shows a typical cell for
this type of work.

The Liquid|Liquid Interface
58
Figure 20|[Taken from Vanýsek5] Diagram of a four electrode cell used to study the cyclic voltammetry of an ITIES. The adjusting plunger is used to position the interface between the two reference electrodes. The diameter of the cell where the interface is positioned is kept small (approximately 5 mm) to reduce the total ionic current and minimise resistive losses.6,7
The ion transfer currents are governed by the same principles as conventional redox processes
at the electrode|solution interface. Usually this is in the mass transport limited domain where
electron transfer is fast and the current limiting step is diffusion. The half-wave potential,
⁄ , of a transferring ion, as measured by cyclic voltammetry, is therefore related to the
formal transfer potential of an ion i,
, by the mass transfer coefficients, mi, of ion i in each
phase:
⁄
(Equation 12)
It is usually taken that
is equal to the reciprocal of the ratio of the viscosities of the
respective solvents because these values are difficult and time consuming to measure.8,9 This
way the standard Gibbs energy of transfer of an ion, i, can be calculated:8

The Liquid|Liquid Interface
59
(Equation 13)
This method is convenient when the concentration of the ion of interest is low and hence the
peak currents are also low. This is generally the case only when the ion of interest is not the
supporting electrolyte, which is required to be more concentrated in order to instil the
conductivity of the electrolyte solutions and also prevent migration of ions of the species of
interest. The potentials at which the supporting electrolyte transfers are described as the limits
of the ITIES polarisation window. Due to the precipitation of ion pairs at the interface when
large ion transfer currents are seen, along with the large resulting resistive losses, it is difficult
to accurately measure the half-wave potential of supporting electrolyte ions. A non-trivial
solution to this, relating the forward and return peak currents to the half-wave potential, has
been formulated by Shao et al.9
As seen in (Equation 11, the Gibbs energy of transfer depends upon the relative chemical
potential of an ion in the aqueous phase and oil phase. The chemical potential is closely
related to the solvation energy of the ion as solvation of the ion by other molecules is the
primary component of its Gibbs energy. Solvation energies are a net result of a complex
interplay between solute and solvent. Nonetheless, three fundamental aspects provide a
structured approach to alter the Gibbs energy of solvation and, thus, the polarisation window:
the interaction between the ions and water, namely hydrophobicity of the ions in the organic
phase and hydrophilicity of the ions in the aqueous phase; interaction between the ions and
the organic solvent (that is, the solvation strength of the organic solvent); and many-body
interactions such as the salting out effect.7
2.1.3 Electrolyte effects
The properties of the electrolytes used in the ITIES are essential in expanding the potential
range over which the ITIES is stable. This section discusses what electrolyte properties result
in a large window.
The more hydrophobic an ion is, the more it will want to reside in the oil phase and the larger
its Gibbs energy of transfer between water and oil will be. Without needing to know what the

The Liquid|Liquid Interface
60
actual energy of transfer is, ions that are hydrophobic by intuition can be chosen to try to find
an electrolyte with a large polarisation window. Hydrophobicity of organic ions should
increase with the ion size and with the inclusion of hydrophobic atoms such as fluorine.10 This
can be seen in a study by Lhotský et al. where the ITIES polarisation window increases as the
length of the alkyl chains of a quaternary ammonium ion are increased.11 Similarly Kontturi et
al. have demonstrated this effect using the p-[4-chlorotetrakis]tetraphenylborate anion rather
than the more common yet related tetraphenylborate anion. The former salt simply substitutes
a hydrogen atom on the phenyl ring for a chlorine atom, yet this small change results in a
200 mV or 50 per cent increase in the size of the polarisation window.12
The aqueous phase is as important as the organic phase in determining the polarisation
window. Aqueous ions should have a very high charge density and solvation energy in water.
These include ions such as Li+, Mg2+, F– and SO42–.
The salting out effect can also be used to increase the polarisation window. This can be
understood as the competition for water molecules in the aqueous phase resulting in the
exclusion of other ions. For example, in a concentrated solution (2 mol dm–3) of MgSO4 in
water there is strong demand for water molecules to solvate and stabilise the highly charged
ions. If another ion is introduced, this must be solvated at the expense of MgSO4 ions raising
the phase’s internal energy. This higher internal energy increases the Gibbs energy of transfer
into the aqueous phase, as shown by Schiffrin et al.7,13 This effect does not show a linear
increase in Gibbs energy of transfer with concentration, but begins to have a dramatic effect at
a critical concentration. As with traditional salting out phenomena, the effect is more prolific
with electrolytes higher in the Hofmeister series.7,13
Based on the above criteria, the organic electrolyte studied was
bis(triphenylphosphoranylidene) ammonium tetrakis[3,5-bis(trifluoromethyl)phenyl]borate.
This electrolyte, shown in Figure 21, is similar to the electrolyte
bis(triphenylphosphoranylidene) ammonium tetrakis(pentafluorophenyl) borate commonly
used by the group of Girault which has been shown to give large polarisation windows.14,15
This was compared to tetrabutylammonium tetraphenylborate (TBATPB), the electrolyte
which was used for the first electrowetting experiments by Kornyshev et al.16 A broad range of
electrolytes in the aqueous phase were also studied.

The Liquid|Liquid Interface
61
Figure 21|(Left to right) Chemical structure of tetrabutylammonium, tetraphenylborate, bis(triphenylphosphoranylidene)ammonium and tetrakis[3,5-bis(trifluoromethyl)phenyl]borate ions. The two ions on the left, used for the first electrowetting experiments, are clearly smaller than the ions on the right, suggesting they would be less soluble in water and therefore less likely to cross the ITIES.16
2.1.4 Solvent effects
It has also been suggested that changing the solvent could be an effective way of increasing
the polarisation window.17 The effect of solvent derives from the fact that ions have different
solvation energies in different solvents. For instance, the standard Gibbs energy of transfer of
Mg2+ from water to nitrobenzene is 64 kJ mol–1, while its transfer from water to
1,2-dichloroethane (DCE) is 114 kJ mol–1.18 This is why DCE has superseded nitrobenzene
(relative permittivities of 10.7 and 34.8 respectively) as the most common ITIES solvent.19
When choosing an organic solvent there are two constraints: the solvent must be almost
totally immiscible with water and must also be able to dissolve organic salts. The solvent
1,6-dibromohexane (DBH) was found to satisfy these criteria while also being very non polar
(relative permittivity of only 5.0), potentially restricting transfer of ions from the aqueous
phase.19 Furthermore, cyclohexane (CH) was mixed with DCE to create a ‘tailored’ solvent.
Specifically, pure CH is unsuitable as it will not dissolve organic salts. However, it was found
that when it is combined with a better solvent such as DCE, this mixture is able dissolve the
desired salt while remaining relatively non-polar, creating a solvent with an ideal blend of
properties.

The Liquid|Liquid Interface
62
2.1.5 Experimental
The organic electrolyte BTPPATFPB was precipitated from two solutions of BTPPACl
(≥98%, Fluka) and NaTFPB (kindly supplied by Prof. T. Kakiuchi, Kyoto University)
dissolved in a 1:2 mixture of methanol and water and then recrystallised from hot acetone.
TBATPB (≥99%, Sigma), NaCl (≥99.8%, Sigma-Aldrich), LiCl (99.0%, Aldrich), MgCl2
(99.0%, Aldrich), KCl (≥99.5%, Sigma-Aldrich), 37% HCl (reagent grade, Sigma-Aldrich), LiF
(≥99.995%, Aldrich), NaF (99.5%, Sigma-Aldrich), MgSO4.7H2O (analytical grade, VWR),
TMACl (≥99.0%, Fluka), DCE (≥99.0%, Sigma-Aldrich), DBH (98% Acros Organics) and
CH (≥99%, Sigma-Aldrich) were used as supplied. Aqueous solutions were prepared with
ultrapure water (resistivity 18.2 MΩ cm) from a Millipore Elix 5 water purification system.
The temperature of all experiments was 20±2 oC.
The electrochemical cell was a four electrode cell similar in principle to that used by Samec et
al. and illustrated in Figure 22.6 The surface area of the interface was 0.28 cm2. An oil/water
junction (5 mmol dm–3 aqueous BTPPACl) with Ag/AgCl wire was used as the reference
electrode for the organic phase and an Ag/AgCl wire was used for the aqueous phase. The
aqueous phase was doped with tetramethylammonium chloride (TMACl) as a reference for
the potential scale of the Galvani potential difference (Δow φ [TMA+] = 160 mV).20
A Gamry Reference 600 potentiostat was used to study the cyclic voltammetry of the
liquid|liquid interface. The scan rate was 10 mV s–1. The positive and negative potential limits
of the scans were determined by the potential at which a current of 1 µA cm–2 was measured.
The cyclic voltammograms (CVs) reported here are the tenth scan. Following initial variations
in current, after about five scans the CVs would remain constant.
The relative permittivity of the mixed solvent was measured using a homemade capacitance
cell and a Solartron 1260 Impedance Analyser. The cell consisted of two parallel glass slides
(75mm×25 mm) sputtered with gold, separated by two glass coverslips (approximately
340 μm). A range of solvents with relative permittivities similar to that of the mixed solvent
were used to calibrate the cell.

The Liquid|Liquid Interface
63
Figure 22|Experimental cell for characterising the electrochemical window of an ITIES.
2.1.6 Results and discussion
2.1.6.1 Hydrophobicity of the organic ions
First the effectiveness of BTPPATFPB compared to TBATPB was established. The use of
this very bulky organic electrolyte had the desired effect in that the polarisation window was
increased from about 200 mV to 700 mV (Figure 23). The potential limits throughout were
arbitrarily defined as the potential at which the current rises to ±1 µA cm–2. This suggests that
the ITIES between TBATPB and NaCl is limited by the transfer of TBA+ and TPB– ions.
This was confirmed when the salt in the aqueous phase (NaCl) was changed to a more
hydrophilic salt (such as LiF) and there was no effect on the potential limits. Conversely,

The Liquid|Liquid Interface
64
varying the organic salt does vary the potential limits. As is seen in the next section, when
BTPPATFPB is used, the window becomes dependant of the salt in the aqueous phase.
Figure 23|Illustration of the effect of using 1 mmol dm–3 BTPPATFPB in the DCE organic phase rather than TBATPB, also 1 mmol dm–3, which contains much smaller ions. The electrolyte in the aqueous phase is 5 mmol dm–3 NaCl. Scan rate = 10 mV s–1. The flat regions of the cyclic voltammograms indicate where the ITIES is stable.
2.1.6.2 Hydrophilicity of the aqueous ions
When the extremely hydrophobic BTPPATFPB is in the organic phase, it can be seen that the
potential limits change as the aqueous electrolyte is varied (Figure 24, Table 1). This suggests
that the potential limits are defined by the inorganic salt rather than the organic salt.i Figure 24
shows the windows for NaCl, LiF and MgSO4. Unsurprisingly, at negative potentials Mg2+
transfers after Na+ and Li+ because it is bivalent and therefore has a higher charge density. At
positive potentials, the monovalency of F– seems to be balanced by its small radius while the
bivalency of SO42– is counteracted by its larger radius and both transfer at the same potential.
It follows that the larger monovalent chloride ion transfers at a lower potential.
i It is still possible that the transfer of MgSO4 ions (MgSO4 shows the largest polarisation window) is limited by the organic electrolyte. However, as will be seen later, results from salting out using MgSO4 seem to imply that this is not the case.

The Liquid|Liquid Interface
65
As well as illustrating the trend in hydrophilicity of these ions and showing that the aqueous
electrolyte does indeed have a significant effect on the polarisation window, these particular
salts are highlighted because they were found to give the largest windows for a chloride salt, a
monovalent salt and a bivalent salt. The chloride salt, although it has the smallest window, is
useful because it can be used with a small and convenient Ag/AgCl wire reference electrode.
LiF provides the largest window for a monovalent electrolyte, for which the ITIES
electrowetting model has been derived. Furthermore, fluoride is preferable to chloride because
it does not specifically adsorb onto gold, a potential complication when using chloride (for
electrowetting in particular). MgSO4 provides the largest window although an ITIES
electrowetting system with bivalent ions has not yet been modelled.
Figure 24|CVs of 5 mmol dm–3 NaCl, LiF or MgSO4 in water with 1 mmol dm–3
BTPPATFPB in DCE. Scan rate = 10 mV s–1. The Galvani potential differences (ow ) have
been calculated by using the standard transfer potential of the TMA+ ion (ow =160 mV) as a
reference.
If the window is limited by inorganic ions as seems to be the case, this puts a fundamental
limit on the window size. This is because there are no suitable ions with a greater charge
density than the likes of Li+, Mg2+, F– and SO42–. While ions such as Al3+ or Be2+ do have a
The Liquid|Liquid Interface
66
higher charge density, they strongly affect the solution pH (for example AlCl3 forms HCl in
water) meaning that H3O+ and OH– ions start to limit the window instead. In the next section,
to further increase the window, the organic solvent is changed to raise the energy of these ions
in the phase they transfer to.
2.1.6.3 Organic solvent
In order to further extend the polarisation window beyond the limits seen above, rather than
changing the ions, the organic phase was changed. As has already been noted, solvent has a
very significant effect on the standard Gibbs energy of transfer of an ion. The two solvents
chosen to replace DCE were DBH and a 1:1 mixture of DCE and CH. DBH has a relative
permittivity of 8.5 and the relative permittivity of the mixture was measured to be 5.1 ±0.1.21
These values are lower than the relative permittivity of DCE, yet crucially, they also dissolve
BTPPATFPB (concentrations >10 mmol dm–3 at room temperature are possible in the mixed
solvent).
Figure 25 shows the polarisation windows resulting from the mixed DCE:CH solvent. There
is a substantial increase in the size of the windows for all electrolytes tested. Taking MgSO4 as
an example, compared to DCE the window increases from 911 mV to 1208 mV, an increase
of over 30 per cent. Furthermore, this window is believed to be largest window reported in
the published literature.22

The Liquid|Liquid Interface
67
Figure 25|CVs of the same system used in Figure 24 but with an organic phase consisting of a 1:1 volume mixture of DCE and cyclohexane. Scan rate = 10 mV s–1. The maximum currents result from the same ion transfers shown in Figure 24.
From the CVs in Figure 26, the actual free energies of transfer,
, of Mg2+ and SO42–
were calculated. These CVs, rather than the ones in Figure 25, were used because the currents
are larger, making the curve fitting method of Shao et al. more reliable.9 This method involves
the fitting of working curves relating the quotient of the end-of-scan and return peak currents
to the quotient of the return peak potential and half-wave potential. The half-wave potential
can then be used to calculate the Gibbs energy of transfer (Equation 12). Upon moving from
DCE to mixed DCE:CH,
[Mg2+] rose from 114 kJ mol−1 to 116 kJ mol–1 (less than
the estimated error and therefore not statistically significant) while
[SO42–] rose from
98 kJ mol–1 to 113 kJ mol–1. This implies that the solvation energy of SO42– is affected by the
solvent much more than the solvation energy of Mg2+. This corresponds to a total increase of
17 kJ mol–1, although the error in each value is estimated at ±2 kJ mol–1 due to the error in the
position of the PZC. These values are in agreement with current literature values.23
The PZC itself is located using the interfacial capacitance data, also shown in Figure 26, as
measured by impedance spectroscopy. According to Debye-Hückel theory, the PZC is at the
capacitance minimum, providing a different method for finding the PZC (the other method
The Liquid|Liquid Interface
68
being the use of an ion with an established transfer potential, in this case TMA+).8 The
capacitance minimum as determined by both methods were within 10 mV of each other.
Using the PZC as determined by impedance spectroscopy, the TMA+ transfer potential in
mixed DCE:CH,
[TMA+], was calculated as 232±10 mV. The error arises from the
broad capacitance minimum which does not allow precise determination of the PZC. For
future experiments, this value—which, as expected, is larger than the value for pure DCE—
can now be used to locate the PZC in DCE:CH without having to use impedance
spectroscopy, a substantially more time consuming and complex method.
The capacitance at the PZC decreases from 3.57 μF cm–2 for pure DCE to 3.25 μF cm–2 for
mixed DCE:CH. The capacitance about the PZC is also substantially lower for the mixed
solvent. In accordance with double layer theory, this decrease would be expected due to the
lower relative permittivity of the mixed solvent relative to pure DCE.

The Liquid|Liquid Interface
69
Figure 26|CVs of the same system used in Figure 24 for MgSO4 in DCE and mixed DCE:CH. The scans are over a broader potential range and hence the transfer currents are larger. These large peaks are better suited to the curve fitting method of Shao et al. used to measure the Gibbs energy of transfer of the related ions. At these large currents the fine structure of the double layer current is not seen. The sharp features of the return peaks for the mixed solvent are characteristic of solvent transferring back across the interface along with the ions.9 The capacitance of the interface about the PZC is also shown.
On the other hand, the DBH decreases the size of the window when compared with DCE,
despite having a much lower relative permittivity. This is fairly surprising as a lower relative
permittivity solvent is often a poorer solvent for highly charge ions.24,25 Furthermore, from
Table 1 (which shows the polarisation windows of all solvent/electrolyte combinations
studied) it can be seen that with a DBH organic phase, LiF has a substantially larger
polarisation window than MgSO4. This is the opposite of what is seen for a DCE or mixed
solvent organic phase, perhaps suggesting that there is a different mechanism of solvation in
DBH compared to the other solvents.
2.1.6.4 Salting out effect
Finally, the salting out effect was investigated. This has previously been used to increase the
size of the polarisation window.7,13 However, the polarisation window needs to be limited by

The Liquid|Liquid Interface
70
the transfer of organic ions (such as when TBATPB is used) for salting out to have an effect.
Therefore, salting out should not be possible for the system under study which has been
shown to be limited by the transfer of aqueous ions.
At first Figure 27 confirms that the window limits are defined by the inorganic rather than the
organic ions. This is because increasing the MgSO4 concentration from 5 mmol dm–3 to 50
mmol dm–3 decreases the size of the polarisation window (increases the current at smaller
potentials in accordance with the Butler-Volmer equation). However, the window for
2 mol dm-3 MgSO4 is larger than for 5 mmol dm–3 MgSO4. This is unexpected because
previous results indicate that the inorganic ions are transferring into the organic phase, so
increasing the aqueous phase concentration cannot ‘salt out’. Therefore, the origin of this
effect is currently not known.
Figure 27|CVs illustrating the effect of varying the concentration of MgSO4 with an organic phase of 1:1 volume mixture of DCE and cyclohexane. Scan rate = 10 mV s–1.

The Liquid|Liquid Interface
71
Aqueous electrolyte
Concentration /mmol dm–3
Organic solvent
Electrochemical window/mV
HCl 5 DCE 664
KCl 5 DCE 648
LiCl 5 DCE 728
LiF 5 DCE 858
MgCl2 5 DCE 771
MgSO4 5 DCE 911
NaCl 5 DCE 754
NaF 5 DCE 853
LiF 5 1:1 DCE:CH 1172
MgSO4 5 1:1 DCE:CH 1208
MgSO4 50 1:1 DCE:CH 1091
MgSO4 500 1:1 DCE:CH 1134
MgSO4 2000 1:1 DCE:CH 1256
NaCl 5 1:1 DCE:CH 1044
LiF 5 DBH 775
MgSO4 5 DBH 684
NaCl 5 DBH 561
Table 1|Size of polarisation window for different electrolytes. In all cases the organic electrolyte was 1 mmol dm–3 BTPPATFPB. The limits are arbitrarily defined as the potential at which the current rises to ±1 μA cm–2.

The Liquid|Liquid Interface
72
2.1.7 Other applications
The relevance of this work to electrowetting will be further explored in Chapter 5. However, it
also has application for other uses of ITIES where the size of the polarisation window is of
importance such as for the reversible adsorption of nanoparticles at an ITIES. The larger the
window the larger the potential that can be applied to the system creating a stronger driving
force for adsorption/desorption of the nanoparticles. More details can be found in [26] and [27].
The Liquid|Liquid Interface
73
2.2 The ionic liquid | oil interface
2.2.1 Background
Interest in ionic liquids (ILs) stems from their unique combination of properties. These
include very low vapour pressure, high polarity, electrochemical and thermal stability, and
reasonable electrical conductivity. In particular, low melting point ionic liquids—so called
room temperature ILs—are of interest for practical applications such as solvents for
electroplating of base metals and as electrolytes for batteries, capacitors and electrochromic
devices.28 Furthermore, their polarity means that they are often ‘greener’ alternatives to
organic solvents for chemical synthesis.29
Most ILs, being very polar, are hydrophilic and will absorb large amounts of water if exposed
to the atmosphere. However, if the ionic liquids contain large ions, often with fluorinated side
chains and functional groups, they become immiscible with water. By studying the transfer of
the ions in such ionic liquids, Quinn et al. were able to quantify the hydrophobicity of these
ions.30 This in turn is useful for the ‘task specific design’ of ILs, particularly as extraction
solvents for synthesis where hydrophobic ILs are particularly useful.
As discussed above, an ITIES consists of two immiscible liquids which are traditionally water
and an organic solvent such as DCE or nitrobenzene.31 Using these hydrophobic ILs,
Kakiuchi has been able to make a polarisable water|IL interface, analogous to a conventional
ITIES with the organic phase replaced by an IL. The largest window for such an ITIES
appears to be around 300 mV for tetraoctylammonium
nonafluorobutylsulfonyltrifuluromethylsulfonylimide at room temperature while at 60 oC,
tetraheptylammonium tetrakis[3,5-bis(trifluoromethyl)phenyl]borate exhibits a window of
1.1 V at a micro interface.32-34 With a window of at least 200 mV, it is possible to study the
transfer of ions from the aqueous phase into the IL phase and to measure their free energies
of transfer.

The Liquid|Liquid Interface
74
The size of the polarisable window can be used to quantify the hydrophobicity of the IL,
where large windows indicate a high degree of hydrophobicity. The size of the window is
related to the solubility of the IL in water:35
(
) (Equation 14)
(Equation 15)
where is the solubility product in water,
is the standard ion transfer potential, is
the aqueous concentration and subscript and are the anion and cation respectively.
Therefore, this is a convenient method to accurately measure the miscibility of the two phases
and assess the suitability of certain ILs as biphasic solvents.
In this section, it is shown for the first time that a hydrophilic ionic liquid can be used to
replace the aqueous phase if a suitable organic solvent is used.
2.2.2 Choosing the solvent and ionic liquid
As discussed above, the aqueous phase of a polarisable ITIES contains an inorganic
electrolyte, such as NaCl, which consists of small ions with a high charge density while the
organic phase contains an electrolyte comprising larger ions with less localized charge such as
tetrabutylammonium tetraphenylborate. Hydrophobic ILs themselves are similar in that they
often consist of ions such as those in the organic phase because these large asymmetric ions
pack together poorly giving them their characteristically low melting points. This means that
hydrophobic ionic liquids are a good substitute for the organic phase as they are immiscible
with water and their constituent ions have high free energies of transfer into water, resulting in
a polarisable ITIES. Their large size also means that many of them conveniently form low
melting points ILs.
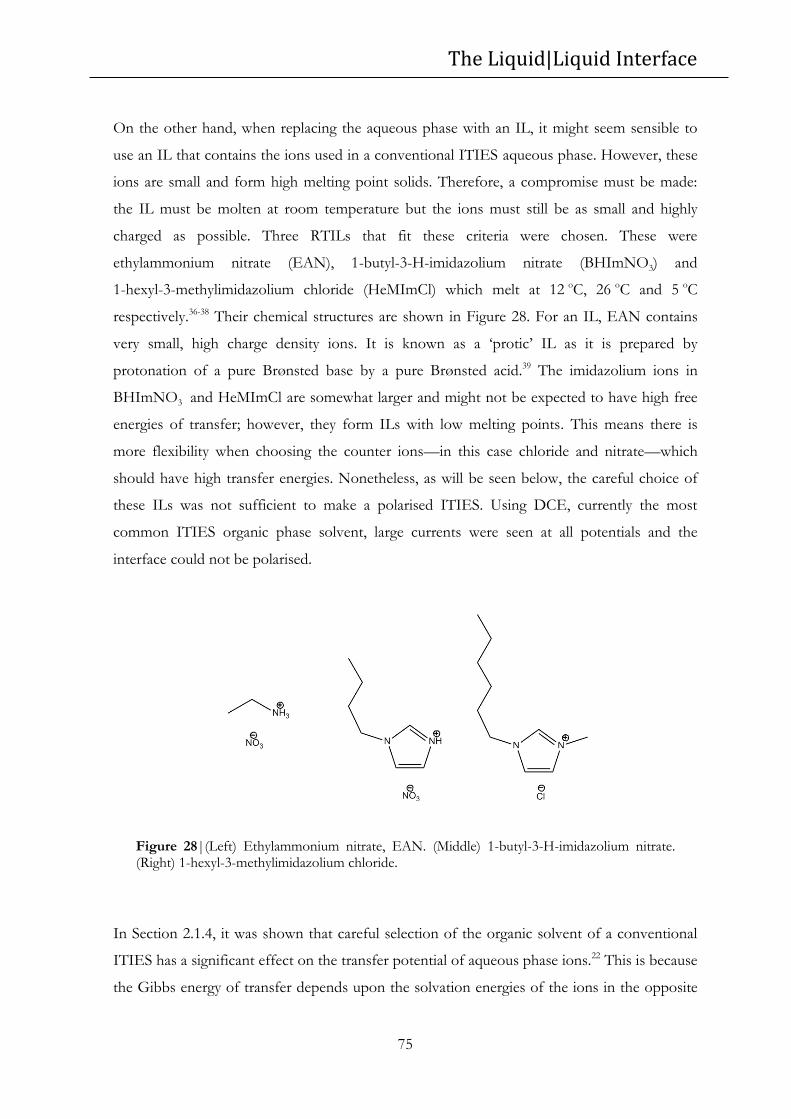
The Liquid|Liquid Interface
75
On the other hand, when replacing the aqueous phase with an IL, it might seem sensible to
use an IL that contains the ions used in a conventional ITIES aqueous phase. However, these
ions are small and form high melting point solids. Therefore, a compromise must be made:
the IL must be molten at room temperature but the ions must still be as small and highly
charged as possible. Three RTILs that fit these criteria were chosen. These were
ethylammonium nitrate (EAN), 1-butyl-3-H-imidazolium nitrate (BHImNO3) and
1-hexyl-3-methylimidazolium chloride (HeMImCl) which melt at 12 oC, 26 oC and 5 oC
respectively.36-38 Their chemical structures are shown in Figure 28. For an IL, EAN contains
very small, high charge density ions. It is known as a ‘protic’ IL as it is prepared by
protonation of a pure Brønsted base by a pure Brønsted acid.39 The imidazolium ions in
BHImNO3 and HeMImCl are somewhat larger and might not be expected to have high free
energies of transfer; however, they form ILs with low melting points. This means there is
more flexibility when choosing the counter ions—in this case chloride and nitrate—which
should have high transfer energies. Nonetheless, as will be seen below, the careful choice of
these ILs was not sufficient to make a polarised ITIES. Using DCE, currently the most
common ITIES organic phase solvent, large currents were seen at all potentials and the
interface could not be polarised.
Figure 28|(Left) Ethylammonium nitrate, EAN. (Middle) 1-butyl-3-H-imidazolium nitrate. (Right) 1-hexyl-3-methylimidazolium chloride.
In Section 2.1.4, it was shown that careful selection of the organic solvent of a conventional
ITIES has a significant effect on the transfer potential of aqueous phase ions.22 This is because
the Gibbs energy of transfer depends upon the solvation energies of the ions in the opposite

The Liquid|Liquid Interface
76
phase. By using this same mixed solvent, as well as the solvent DBH, the Gibbs energy of
transfer of the ions in the ionic liquid could be raised, making a polarised ITIES possible.
Cyclic voltammetry of the liquid|liquid interface was again used to determine the size of the
polarisation window. The PZC was also located by impedance spectroscopy.40
2.2.3 Experimental
Electrochemical measurements were performed with a Gamry Reference 600 potentiostat
with impedance analyser. Liquid|liquid experiments were performed in a custom built glass
cell with a similar design to that used by Samec et al. which had been modified to allow
reference electrodes to be placed near the interface in order to reduce their impedance.6 The
surface area of the liquid|liquid interface was 28 mm2. The complete cell was:
Ag|AgCl|IL|BTPPATFPB(oil) 10 mmol dm–3|AgTFPB|Ag
where the oil phase was either DCE, DBH or a 1:1 mixture of DCE and cyclohexane and
BTPPATFPB is the organic electrolyte bis(triphenylphosphoranylidene)ammonium
tetrakis[3,5-bis(trifluoromethyl)phenyl]borate. In the case of EAN and HBImNO3,
10 mmol dm–3 ethylammonium chloride was added to provide a stable reference potential.
The low chloride concentration means that its transfer is diffusion limited and so it should not
affect the polarisation window.
Preparation of BTPPATFPB is reported elsewhere.22 HeMImCl (≥97%, Sigma-Aldrich), DBH
(98%, Acros Organics), DCE (≥99.0%, Sigma-Aldrich) and CH (≥99%, Sigma-Aldrich) were
used as supplied. EAN and HBImNO3 were prepared by equimolar addition at 0 oC of 65%
nitric acid (Suprapur, Merck) to 2 mol dm–3 ethylamine in tetrahydrofuran (Acros Organics)
and 2 mol dm-3 1-butylimidazole (98%, Sigma-Aldrich) in tetrahydrofuran, respectively. All
ionic liquids were dried overnight under vacuum at 110 oC to remove water and
tetrahydrofuran. The AgTFPB|Ag reference electrode was prepared by anodising a silver wire
in a 10 mmol dm–3 solution of BTPPATFPB at +1 V for 30 min. All experiments were
conducted at 20±2 oC. BHImNO3 was found to be liquid at this temperature despite the
literature value of its melting point of 26 oC, possibly due to super cooling of the liquid or
incorrect literature melting point.37

The Liquid|Liquid Interface
77
The impedance at 10 Hz (10 mV amplitude) was measured at 5 mV intervals in order to locate
the PZC. At selected potentials, the frequency response from 0.1 Hz to 500 Hz was measured.
Higher frequencies resulted in experimental artefacts as reported elsewhere.41 In order to
minimise these artefacts, the impedance of the reference electrodes must be kept as low as
possible, meaning that the reference electrode on the organic side must be placed as close as
possible to the interface due to the high resistivity of the organic phase.
2.2.4 Results and discussion
2.2.4.1 Cyclic voltammetry
All ITIES using HBImNO3 and HeMImCl could not be polarised and instead showed purely
resistive behaviour. However, using EAN with either DBH or mixed DCE:CH, a polarisable
ITIES was possible. Figure 29 shows the increase in polarisation window moving from DCE
(Figure 29 a) to DBH (Figure 29 b) to mixed DCE/CH (Figure 29 c).
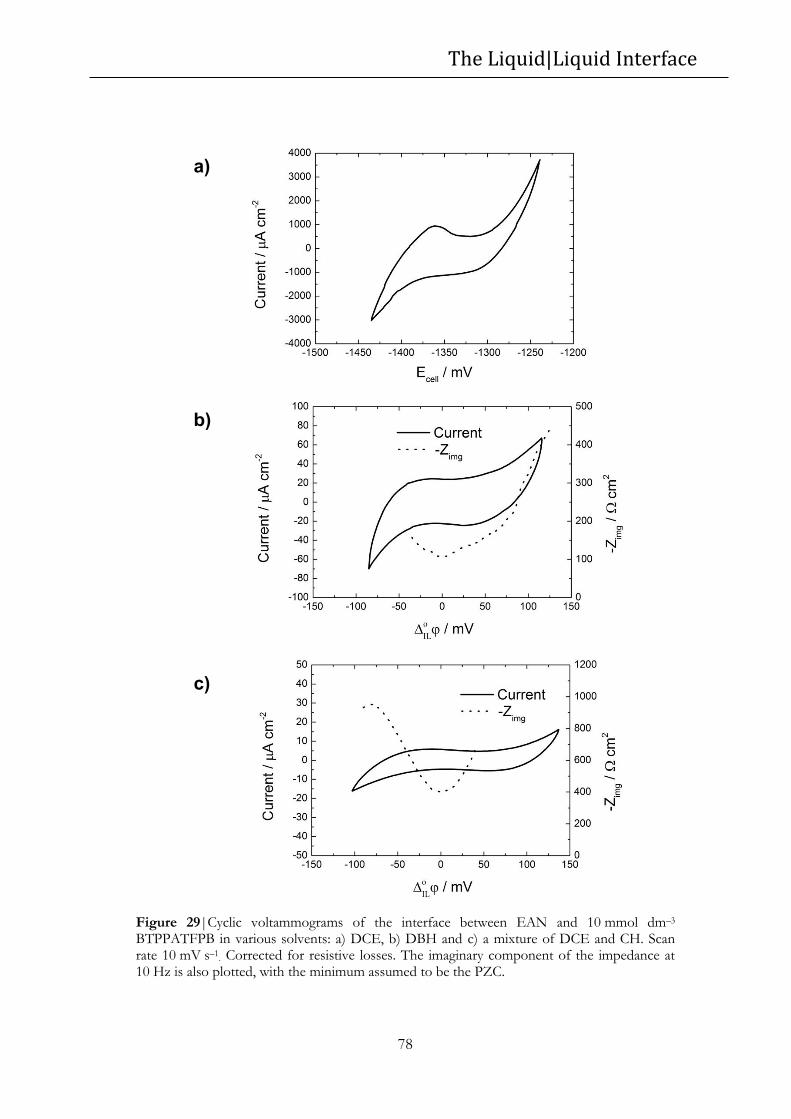
The Liquid|Liquid Interface
78
Figure 29|Cyclic voltammograms of the interface between EAN and 10 mmol dm–3 BTPPATFPB in various solvents: a) DCE, b) DBH and c) a mixture of DCE and CH. Scan rate 10 mV s–1
. Corrected for resistive losses. The imaginary component of the impedance at 10 Hz is also plotted, with the minimum assumed to be the PZC.
a)
b)
c)

The Liquid|Liquid Interface
79
With DCE, while there is a small potential range within which the current levels off, the
currents are still very large (>500 µA cm–2) and thus cannot be attributed to double layer
charging which is usually at least an order of magnitude smaller. Using DBH—which has a
relative permittivity of 5.0 as opposed to 10.4 for DCE—clearly broadens the polarisation
window and the currents in the middle of the window have dropped to approximately
20 µA cm–2. The Gibbs energy of transfer of the ions has clearly increased. Finally, using the
mixed DCE:CH solvent a polarisable window of over 150 mV can be achieved. This is very
similar in size to the largest windows between IL and water at 25 oC (although much larger
windows have been reported at higher temperatures with high melting point ILs).32,33,42 It is
also large enough to potentially study ion transfer of less hydrophilic ions within the window.
The window extends further on the positive side suggesting that the ethylammonium ion has a
larger transfer potential than the nitrate ion.
Two conclusions can be drawn from these results. Firstly, the choice of IL is crucial in
achieving a polarisable window as out of the three ILs tested, only one of them (EAN) was
successful. This is perhaps unsurprising as the imidazolium ion is much larger than the
ethylammonium ion and therefore likely to be more soluble in the organic phase. Secondly,
the organic solvent is an essential component of this new type of ITIES. It seems that a
polarisable ITIES is simply not possible with conventional solvents such as DCE, which is too
polar and is able to efficiently solvate the transferring ions.
2.2.4.2 Transfer of doped ions
An ITIES can be doped with extra ions which transfer within the potential limits set by the
supporting electrolytes.4 The ion of interest must have a smaller Gibbs energy of transfer than
the supporting electrolyte ions and is usually not very concentrated so that peak currents are
kept low. This results in a small peak within the window, even though the supporting
electrolyte is higher in concentration.
Many ions were tested to see if they would transfer within the potential limits of the IL ITIES,
however, none could be found. The salts tested in the IL phase were tetramethylammonium
chloride, tetraoctylammonium chloride and ethylammonium tetraphenylborate at 10
mmol dm–3 concentration. The large organic ions in these compounds were expected to have

The Liquid|Liquid Interface
80
relatively small energies of transfer into the organic phase; however, no change in the cyclic
voltammetry was seen. This is understandable as the transfer potential of
tetramethylammonium (an even smaller ion) from water to DCE/CH has previously been
calculated as +232 mV, well outside the available window.22 Similarly, the addition of
0.5 mmol dm–3 BTPPACl, BTPPABF4, BTPPATPB to the oil phase had no effect on the
voltammetry within the polarisation window, suggesting that the constituent ions of these salts
transfer outside of the polarisation window. On the other hand, the addition of 0.5 mmol dm-3
TBAPF6, TBABr, BTPPACl and BTPPABF4 meant that the interface could no longer be
polarised, as shown in Figure 30. This suggests that the anions in these salts transfer at all
potential within the ITIES polarisation window.
Figure 30|Cyclic voltammogram of the ITIES between EAN and 10 mmol dm–3
BTPPATPFB in DCE/CH (solid line). The addition of 0.5 mmol dm–3 tetraoctylammonium
bromide shifts the cyclic voltammogram of the EAN|mixed solvent ITIES upwards (dashed line). This is the result of the addition of a mass transfer limited current (approximately 20 µA cm–2) due to the transfer of Br– across the interface. The offset of the voltammogram as a function of Br- ion concentration is also shown (inset).

The Liquid|Liquid Interface
81
2.2.4.3 Impedance measurements
Impedance measurements were used to locate the position of the PZC and study the
capacitance of the interface. It was found that there was a minimum in the imaginary
component of the impedance in the middle of the polarisable window (Figure 29). A
minimum in the imaginary component corresponds to a maximum in the interfacial
capacitance. This is unusual as for simple electrolyte solutions, a minimum in interfacial
capacitance is seen (as described by Guoy-Chapman theory). This minimum in the imaginary
component of the impedance, which presumably coincides with the PZC, can be explained by
the ionic liquid double layer model of Bazant et al. and has also recently been reported
experimentally.43,44 Figure 31 shows Nyquist and Bode plots for the EAN|mixed solvent
ITIES at PZC. The data is fit to a standard Randles circuit (inset).
Figure 31|Impedance spectrum of EtNH3NO3|DCE/CH interface at PZC with an interfacial area of 0.28 cm2. Scan from 500-0.1 Hz. Fit for Randles circuit shown on graph (grey line). Solution resistance RS=8.8±0.2 kΩ, charge transfer resistance RCT=5.6±1.7 kΩ, constant phase element ZCPE=9.9±4.1 µS sn, n=0.71±0.8 and Warburg impedance ZW=54.9±3.1 µS s0.5. This CPE corresponds to an interfacial capacitance of 137±64 µF cm–2.45
The interfacial capacitance is calculated to be 137±64 µF cm–2, while fitting a simple capacitor,
as is commonly seen in the literature, yields a capacitance of 7.4±3.7 µF cm–2.40 These values
are less than the value calculated using the double layer region from the cyclic voltammetry
(400-500 µF cm–2) which suggests that there may still be a small ion transfer current in what
would be considered the double layer region. This conclusion is supported by the fairly small

The Liquid|Liquid Interface
82
charge transfer resistance of 20.0 kΩ cm–2 and the presence of a 45o line on the Nyquist plot
indicative of a Warburg element resulting from diffusion of transferring ions.8
The Randles circuit with Warburg element also seem to be a good fit for the EAN|DBH
ITIES. Figure 32 shows how the Warburg element becomes prominent further from the PZC
where there is a large ion transfer current.
Figure 32|Impedance spectrum of EtNH3NO3|DBH interface at PZC and +125 mV with an interfacial area of 0.28 cm2. Scan from 10-0.1 Hz.
The Liquid|Liquid Interface
83
2.3 Conclusions
In order to try to increase the polarisable potential window of an ITIES, a range of
electrolytes and solvents were studied. It was shown that by using a more polar organic phase
(a mixture of DCE and cyclohexane rather than pure DCE), the polarisation window could be
increased by over 30%. An aqueous phase containing MgSO4 combined with a mixed solvent
organic phase resulted in a polarisable potential window of over 1.2 V.
It is likely that further tailoring of the organic phase, by using other solvents in or different
solvent ratios, would lead to even larger potential windows. However, this will be counter
balanced by a decrease in electrolyte solubility in the organic phase.
Using this mixed solvent, it was shown for the first time that a polarisable water-free ITIES is
possible. A 150 mV polarisation window was achieved which is similar in size to the
water|RTIL window at 25 oC of Kakiuchi.32 This was made possible by the use of the protic
ionic liquid ethylammonium nitrate, while other imidazolium based ionic liquid interfaces
could not be polarised. Impedance spectroscopy results were fitted to a Randles circuit in
order to successfully measure the capacitance of the interface and locate the PZC.
In the future, larger windows may well be possible using similar protic room temperature ILs,
such as choline nitrate; by using ILs with higher melting points or by moving to a less polar
solvent mixture.46

The Liquid|Liquid Interface
84
2.4 References
1 Hájková, P., Homolka, D., Mareček, V. & Samec, Z. The Double Layer at the Interface between Two Immiscible Electrolyte Solutions: Capacity of the Water|1,2-dichloroethane Interface. Journal of electroanalytical chemistry and interfacial electrochemistry 151, 277-282, doi:10.1016/s0022-0728(83)80441-0 (1983).
2 Marinescu, M. Electrovariable Liquid Interfaces for Optical Applications: Structure and Dynamics, Imperial College London, (2012).
3 Volkov, A. & Deamer, D. Liquid-Liquid Interfaces Theory and Methods. (CRC, 1996). 4 Samec, Z. Electrochemistry at the Interface between Two Immiscible Electrolyte
Solutions. Pure and applied chemistry 76, 2147-2180 (2004). 5 Vanysek, P. & Ramirez, L. Interface between Two Immiscible Liquid Electrolytes: A
Review. Journal of the Chilean Chemical Society 53, 1455-1463 (2008). 6 Samec, Z., Marecek, V. & Homolka, D. Double-Layers at Liquid|Liquid Interfaces.
Faraday discussions of the Chemical Society 77, 197-208 (1984). 7 Geblewicz, G., Kontturi, A., Kontturi, K. & Schiffrin, D. Salting Out of Hydrophobic
Ions at Immiscible Electrolyte Interfaces. Journal of electroanalytical chemistry and interfacial electrochemistry 217, 261-269 (1987).
8 Bard, A. J. & Faulkner, L. Electrochemical Methods. Fundamentals and Applications. 2nd edn, (John Wiley and Sons, 2001).
9 Shao, Y., Stewart, A. A. & Girault, H. H. Determination of the Half-wave Potential of the Species Limiting the Potential Window. Measurement of Gibbs Transfer Energies at the Water/1,2-dichloroethane Interface. Journal of the Chemical Society, Faraday Transactions 87, 2593-2597 (1991).
10 Dalvi, V. & Rossky, P. Molecular Origins of Fluorocarbon Hydrophobicity. Proceedings of the National Academy of Sciences of the United States of America 107, 13603-13607 (2010).
11 Lhotsky, A., Marecek, V., Zalis, S. & Samec, Z. Specific Adsorption of Tetraalkylammonium Cations at the Water|1,2-dichloroethane Interface Revisited. Journal of electroanalytical chemistry and interfacial electrochemistry 585, 269-274 (2005).
12 Berry, S., Kedzierski, J. & Abedian, B. Low Voltage Electrowetting Using Thin Fluoroploymer Films. Journal of colloid and interface science 303, 517-524 (2006).
13 Kontturi, A., Kontturi, K., Murtomaki, L. & Schiffrin, D. Application of Scaled Particle Theory to the Salting Out of Single Hydrophibic Ions. Journal of the Chemical Society. Faraday transactions 86, 931-936 (1990).
14 Fermin, D. J., Dung Duong, H., Ding, Z., Brevet, P.-F. & Girault, H. H. Photoinduced Electron Transfer at Liquid|Liquid Interfaces Part II. A study of the Electron Transfer and Recombination Dynamics by Intensity Modulated Photocurrent Spectroscopy (IMPS). Physical Chemistry Chemical Physics 1, 1461-1467 (1999).
15 Su, B. et al. Reversible Voltage-Induced Assembly of Au Nanoparticles at Liquid|Liquid Interfaces. Journal of the American Chemical Society 126, 915-919, doi:10.1021/ja0386187 (2003).
16 Kornyshev, A. A. et al. Ultra-low-voltage Electrowetting. The Journal of Physical Chemistry C 114, 14885-14890, doi:10.1021/jp101051e (2010).
17 Koczorowski, Z., Paleska, I. & Geblewicz, G. Electrochemical Study of the Immiscible Electrolyte Solution Interface between Water and a Mixed Organic-Solvent. Journal of electroanalytical chemistry and interfacial electrochemistry 164, 201-204 (1984).

The Liquid|Liquid Interface
85
18 Yoshida, Y. et al. Evaluation of Gibbs Free Energy for the Transfer of a Highly Hydrophilic Ion from an Acidic Aqueous Solution to an Organic Solution Based on Ion Pair Extraction. Analytica Chimica Acta 452, 149-161 (2002).
19 Knovel Critical Tables. 2nd edn, (Knovel, 2008). 20 Abid, J.-P., Abid, M., Bauer, C., Girault, H. H. & Brevet, P.-F. Controlled Reversible
Adsorption of Core−Shell Metallic Nanoparticles at the Polarized Water|1,2-Dichloroethane Interface Investigated by Optical Second-Harmonic Generation†. The Journal of Physical Chemistry C 111, 8849-8855, doi:10.1021/jp067181x (2007).
21 Handbook of Chemistry and Physics. Vol. 87 (CRC Press, 2006). 22 Cousens, N. E. A. & Kucernak, A. R. Increasing the Potential Window of the
Interface between Two Immiscible Electrolyte Solutions to More than 1.2V. Electrochemistry Communications 13, 1539-1541, doi:10.1016/j.elecom.2011.10.015 (2011).
23 Zhou, M., Gan, S., Zhong, L., Su, B. & Niu, L. Ion Transfer Voltammetry by a Simple Two Polarized Interfaces Setup. Analytical chemistry 82, 7857-7860 (2010).
24 Paruta, A. N., Sciarrone, B. J. & Lording. Correlation between Solubility Parameters and Dielectric Constants. Journal of pharmaceutical sciences 51, 704-705 (1962).
25 Gorman, W. G. & Hall, G. D. Dielectric Constant Correlations with Solubility and Solubility Parameters. Journal of pharmaceutical sciences 53, 1017-1020 (1964).
26 Flatté, M., Kornyshev, A. & Urbakh, M. Understanding Voltage-induced Localization of Nanoparticles at a Liquid–liquid Interface. Journal of physics. Condensed matter 20, 073102 (2008).
27 Flatté, M., Kornyshev, A. & Urbakh, M. Nanoparticles at Electrified Liquid-liquid Interfaces: New Options for Electro-optics. Faraday discussions 143, 109-115 (2009).
28 Buzzeo, M. C., Evans, R. G. & Compton, R. G. Non-Haloaluminate Room-Temperature Ionic Liquids in Electrochemistry—A Review. ChemPhysChem 5, 1106-1120, doi:10.1002/cphc.200301017 (2004).
29 Welton, T. Room-Temperature Ionic Liquids. Solvents for Synthesis and Catalysis. Chemical Reviews 99, 2071-2084, doi:10.1021/cr980032t (1999).
30 Quinn, B. M., Ding, Z., Moulton, R. & Bard, A. J. Novel Electrochemical Studies of Ionic Liquids. Langmuir 18, 1734-1742 (2002).
31 Volkov, A. & Deamer, D. Liquid-Liquid Interfaces: Theory and Methods. (CRC Press, 1996).
32 Kakiuchi, T. & Tsujioka, N. Cyclic Voltammetry of Ion Transfer Across the Polarized Interface between the Organic Molten Salt and the Aqueous Solution. Electrochemistry Communications 5, 253-256, doi:10.1016/s1388-2481(03)00039-0 (2003).
33 Ishimatsu, R., Nishi, N. & Kakiuchi, T. Wide Polarized Potential Windows at the Interface between Water and an Ionic Liquid, Tetraheptylammonium Tetrakis[3,5-bis(trifluoromethyl)phenyl]borate. Chemistry Letters 36, 1166-1167 (2007).
34 Kakiuchi, T. & Nishi, N. Ionic Liquid/Water Interface: A New Electrified System for Electrochemistry. Electrochemistry 74, 942-948 (2006).
35 Kakiuchi, T., Tsujioka, N., Kurita, S. & Iwami, Y. Phase-boundary Potential Across the Nonpolarized Interface between the Room-temperature Molten Salt and Water. Electrochemistry Communications 5, 159-164, doi:10.1016/s1388-2481(03)00013-4 (2003).
36 Marsh, K. N., Boxall, J. A. & Lichtenthaler, R. Room Temperature Ionic Liquids and their Mixtures - A Review. Fluid phase equilibria 219, 93-98 (2004).
37 Mantz, R. A. et al. Molten Salts XIV: Proceedings of the International Symposium. (The Electrochemical Society Inc., 2006).

The Liquid|Liquid Interface
86
38 Fendt, S., Padmanabhan, S., Blanch, H. W. & Prausnitz, J. M. Viscosities of Acetate or Chloride-Based Ionic Liquids and Some of Their Mixtures with Water or Other Common Solvents. Journal of Chemical & Engineering Data 56, 31-34, doi:10.1021/je1007235 (2010).
39 Austen Angell, C., Ansari, Y. & Zhao, Z. Ionic Liquids: Past, Present and Future. Faraday discussions 154, 9-27 (2012).
40 Silva, F. & Moura, C. On the Measurement of the Impedance of ITIES - The Nitrobenzene|Water and 1,2-Dichloroethane|Water Interfaces. Journal of Electroanalytical Chemistry 177, 317-323 (1984).
41 Wiles, M. C., Schiffrin, D. J., VanderNoot, T. J. & Silva, A. F. Experimental Artifacts Associated with Impedance Measurements at Liquid—Liquid Interfaces. Journal of electroanalytical chemistry and interfacial electrochemistry 278, 151-159, doi:10.1016/0022-0728(90)85130-w (1990).
42 Nishi, N., Imakura, S. & Kakiuchi, T. Wide Electrochemical Window at the Interface between Water and a Hydrophobic Room-temperature Ionic Liquid of Tetrakis[3,5-bis(trifluoromethyl)phenyl]borate. Analytical chemistry 78, 2726-2731 (2006).
43 Bazant, M. Z., Storey, B. D. & Kornyshev, A. A. Double Layer in Ionic Liquids: Overscreening versus Crowding. Physical Review Letters 106, 046102 (2011).
44 Drüschler, M. et al. New Insights into the Interface between a Single-crystalline Metal Electrode and an Extremely Pure Ionic Liquid: Slow Interfacial Processes and the Influence of Temperature on Interfacial Dynamics. PCCP. Physical chemistry chemical physics 14, 5090-5099 (2012).
45 Hsu, C. H. & Mansfeld, F. Technical Note: Concerning the Conversion of the Constant Phase Element Parameter Y0 into a Capacitance. Corrosion 57, 747-748, doi:10.5006/1.3280607 (2001).
46 Abbott, A. P., Boothby, D., Capper, G., Davies, D. L. & Rasheed, R. K. Deep Eutectic Solvents Formed between Choline Chloride and Carboxylic Acids: Versatile Alternatives to Ionic Liquids. Journal of the American Chemical Society 126, 9142-9147, doi:10.1021/ja048266j (2004).

Chapter 3: Ultra-Flat Surfaces
87
Chapter 3: Ult ra-Flat S urfaces
Previous work has shown that while low voltage electrowetting with very low contact angle
hysteresis is simple to achieve on mercury, this is not the same on other electrode materials.1-3
For example, electrodes made by sputtering gold onto quartz exhibited a large amount of
hysteresis in the contact angle/voltage response.
Electrowetting on mercury is driven by a change in surface energy due to charging of the
electrochemical double layer. The double layer capacitance of mercury is very similar to the
double layer capacitance on other metals such as gold, so capacitance does not seem to be a
plausible reason as to why electrowetting works on mercury rather than gold.4,5 If the
differences between mercury and other metals are considered, the most obvious dissimilarity is
that mercury is a liquid at room temperature. As a consequence, the mercury surface is
atomically smooth.6 It is also self-healing: it cannot be scratched or damaged by physical
means. Therefore, it was reasoned that if gold too could be made atomically flat, the hysteresis
might be reduced and unrestricted electrowetting could be achieved on gold.
This view point has been supported by the work of Marinescu, whose work is discussed in
Chapter 1.3,7 In short, the theoretical model for an electrowetting system with pulsing
suggested that reducing the frictional force on the droplet would allow the equilibrium contact
angle to be achieved with fewer pulses. One of the origins of this frictional force could be
surface roughness. As a result, substantial effort has been put into the preparation of such
surfaces, with template stripping being the method of choice. As well as preparation of metal
surfaces by conventional template stripping, the technique was extended to the preparation of
ultra-flat glassy carbon surfaces.
3.1 Template stripping
3.1.1 Overview
Template stripping is a process used to transfer the smoothness of a template material to a
metal surface. Today, it is commonly used to prepare atomically flat surfaces for imaging
techniques such as AFM and scanning tunnelling microscopy (STM).8 It is the principal

Ultra-Flat Surfaces
88
method chosen to produce flat surfaces for the electrowetting experiments described in
Chapter 5.
In 1993, Hegner et al. were the first to use template stripping to produce large atomically flat
gold surfaces intended for scanning probe microscopy.9 The process was experimentally very
simple. The first step involved epitaxial growth of a gold film on mica. The gold surface was
then adhered to a silicon wafer with epoxy. Finally, the mica was either chemically or
physically removed from the underside of the gold to leave an atomically flat surface, reported
to have a root mean square (RMS) roughness of 3 Å over 25 μm2. Priest et al. later suggested
using gypsum to grow the gold on.10 The benefits of this were that the gypsum was much
easier to remove than the mica and larger flat domains (>2500 μm2) could be achieved. Figure
33 shows the difference between the topside of a gold surface, and the underside of that
surface once it has been stripped.
Recently, Chai and Klein have extended the original Hegner method to even larger areas by
growing the gold on 3-6 μm thick single crystallographic plane facets of mica that are
molecularly smooth on both sides.11 As a result atomically flat domains (RMS roughness
<3 Å) are seen over areas on the scale of 1 cm2. This is the scale of area needed to test low
voltage electrowetting as droplets are roughly 1 mm in diameter and ideally, the electrode
surface should be homogeneously smooth under the entire droplet.
The stability of the surface in contact with salt solutions and organic solvents is also important
to consider. The literature suggests that immersion in water has no negative effect on the
roughness. However, the downside of the template stripping method is that it requires the use
of an epoxy. It has been found that the epoxy, if not carefully selected, can swell as it absorbs
organic solvents, damaging the metal surface.12,13

Ultra-Flat Surfaces
89
Figure 33|[Taken from Woodard14] The topside of a conventional evaporated gold surface (left) and its counterpart underside formed by template stripping (right).
Interestingly, it has been reported that the topside of a deposited gold surface effects the
roughness of the surface below it.10 This means that different gold deposition methods, such
as sputtering and evaporation, can produce different degrees of roughness from the same
template. For sputtered gold surfaces, the area which is in the plasma flame where the atoms
are most energetic creates a significantly rougher surface.15
As noted in Chapter 1, the roughness of the surface will affect the equilibrium contact angle as
increasing roughness increases the real surface area relative to the geometric area.16 An
additional effect on gold is the adsorption of organic species from the ambient atmosphere.
These organics have a dramatic effect the contact angle of the surface. Upon exposure of a
newly created gold surface, the contact angle of a sessile water droplet on the surface gradually
changes from 20o to almost 80o (Figure 34).11 Chai speculates that this is the result of
hydrophobic organic molecules in the air adsorbing to an otherwise hydrophilic surface,
although other possibilities include a moderately slow reorganisation of the gold or an
interaction between the water and the gold. Chai’s opinion is shared by Bewig and Zisman
who state that any hydrophilic surface, when exposed to any atmosphere other than a purified
gas, will develop a more hydrophobic surface as a result of organic contamination.17

Ultra-Flat Surfaces
90
Figure 34|[Taken from Chai11] Variation of contact angle of a water droplet on a freshly exposed gold surface with time. The increase in the contact angle shows a change in the gold surface energy over time, supposedly as a result of adsorption of atmospheric organics.
3.1.2 Alternative methods
3.1.2.1 Annealing
Annealing—a high temperature surface treatment conducted in an inert atmosphere—is a
commonly used technique for preparing smooth metal surfaces as it significantly reduces RMS
roughness.18 However, it also causes the surface to form microdomains known as clusters
(Figure 35).10 Whilst the RMS roughness may decrease (reducing frictional forces in an
electrowetting experiment) the clusters may create local energy minima for the droplet to
become stuck in. Therefore, annealing was not used as it was decided that regularity of the
surface should be a priority.

Ultra-Flat Surfaces
91
Figure 35|[Taken from Masens18] Scanning probe micrographs of template stripped gold films on mica. The annealing process results in the formation of large microdomains.
3.1.2.2 PDMS surface adhered gold
Gold can be adhered to polydimethylsiloxane (PDMS) functionalised with a thiol surface
termination (Figure 36). The top layer is either directly deposited onto the thiol coated surface
or transferred via a template to improve the surface roughness.12,15 Simple direct deposition
methods yield RMS roughnesses of 6-7 Å with a 15-20 nm grain size while more involved
templating methods yield 2-4 Å RMS roughness with a 500 nm grain size. Despite the fact that
this method avoids the use of an epoxy interlayer, which may not be stable in the presence of
organic solvents, the relatively small grain size coupled with the additional complexity of this
method meant that template stripping was preferred.
Figure 36|[Taken from Pattier15] Schematic route for the formation of a silicon-PDMS-thiol-gold array.

Ultra-Flat Surfaces
92
3.2 Ultra-flat metal surfaces
3.2.1 Experimental
A 100 nm layer of gold, copper or platinum was sputtered onto 2 cm × 7.5 cm VWR
International Super Premium glass microscope slides. Immediately prior to sputtering, the
glass was cleaned as follows:
1. Soaked in a solution of 0.1 mol dm–3 potassium permanganate + 0.18 mol dm–3
sulphuric acid for 1-2 h to oxidise any organics
2. Rinsed with acidified hydrogen peroxide solution (0.36 mol dm–3 H2SO4 + 0.18
mol dm-3 H2O2)
3. Rinsed with ultrapure water six times
4. Dried under a stream of nitrogen
5. Dried upright at 110 oC for 5 min
All sputtering was performed using an Emitech K575X sputterer; Emitech TK8859 gold
targets, Emitech TK8879 titanium targets and Emitech TK8845 copper targets. Surface
morphologies were characterised with an Agilent Technologies 5500 AFM using Windsor
Scientific PPP-NCH probes. Image processing involved surface levelling and was performed
using Agilent PicoView version 1.8 software.
Glass rectangles (approximately 1 cm × 2 cm) were then stuck to the gold coated microscope
slide with one half of the glass rectangle hanging over the edge of the microscope slide. The
glass was stuck down with a variety of epoxies including Buehler Epo-Thin Low Viscosity
Epoxy Resin; Duralco 4525 All Purpose Room Temperature Curing Epoxy; Duralco 4703
Adhesive, Coating and Potting Epoxy; RS Quickset Epoxy; Araldite 2011 Multi Purpose
Epoxy and Epo-Tek 377 High Temperature Epoxy. Following curing of the epoxies
according to manufacturer guidelines, the glass rectangles were pulled off the microscope slide
when needed, revealing a smooth clean metal surface.
Contact angles were measured from photographs taken with a CCD (from a Phillips
SPC900NC webcam) through a video zoom microscope (Edmund Optics Infinity K2/S Long
Distance Video Lens) at 20× magnification. Contact angles were subsequently measured using
Fta32 2.0 contact angle software (First Ten Ångstroms). All reported contact angles are
advancing contact angles averaged over five measurements.

Ultra-Flat Surfaces
93
3.2.2 Results and discussion
3.2.2.1 Roughness
Template striping was used to produce smooth electrode surfaces. The roughness of the
resulting surfaces was characterised by AFM. Figure 37 shows a typical micrograph of a
template stripped gold surface prepared using Buehler Epo-Thin epoxy and a glass
microscope slide template. The features are on the order of only several nanometres, with an
RMS roughness of 3.9 Ǻ and peak height of 2.9 nm. The peak corresponds to roughly 12 gold
atoms stacked on top of each other, and so it can be said that the roughness is on the atomic
scale.19 This surface is much smoother than the sputtered gold surfaces used for previous
electrowetting experiments, which were at least an order of magnitude rougher.14 Oddly, the
roughness of the template stripped surface was less than that of the template (RMS roughness
of VWR International Super Premium glass microscope slide 15.1 Ǻ). This suggests that the
gold may not exactly mate with the surface or take on its exact configuration.
Figure 37|AFM image (Area: 4.3 μm × 4.3 μm; RMS roughness: 3.9 Å; Peak height: 2.9 nm).
However, as electrowetting occurs over macroscopic areas, the roughness over much larger
distances is perhaps more important, as the length scale effecting pinning may be important.
Figure 38 shows template stripped gold and sputtered gold surfaces over 80 μm2. As well as an
order of magnitude difference in roughness, there is a much more striking difference between
the surfaces: the presence of large dust particles. While the template stripped surface has only

Ultra-Flat Surfaces
94
a few large peaks over the entire area (maximum height 28.4 nm) the sputtered surface has
many peaks which are substantially larger (maximum height 184 nm).
Figure 38|AFM images of template stripped gold (left) and sputtered gold (right) surfaces over a large area. template stripped gold area: 80 μm × 80 μm; RMS roughness: 4.5 Å; Peak height: 28.4 nm. Sputtered Gold Area: 80 μm × 80 μm; RMS roughness: 40.3 Å; Peak height: 184 nm. The sputtered surface is clearly contaminated with large dust particles while the template stripped gold surface only has a few small peaks.
These dust particles are not a result of prolonged exposure to the ambient atmosphere, but
deposit over short time periods. Figure 39 shows a photograph of a sputtered electrode
immediately after sputtering. It should be noted that while the electrode looks very dusty in
the photograph, the surface appears very clean to the naked eye if not deliberately lit in such a
way as to highlight the dust on the surface. The fact that the sputtered surfaces attract dust
more quickly than freshly stripped surfaces suggests they may be left with a weak electrostatic
charge after sputtering.

Ultra-Flat Surfaces
95
Figure 39|(Left) Photograph of template stripped gold immediately after stripping. The backlight is reflected in the right-hand corner. (Right) Photograph of sputtered gold immediately after removal from sputter machine. The images are both back lit at a shallow angle to highlight any surface contaminants. Only a few specks of dust can be seen on the freshly stripped surface while the entirety of the sputtered surface is covered with dust.
These results are an excellent illustration of one of the less obvious benefits of template
stripping: the surfaces are protected from atmospheric contamination until immediately prior
to use. It may also be the case that the pinning seen on template stripped surface is not so
much a result of average roughness but rather because of the presence of large dust particles
on the surface. This theme is discussed further in Chapter 5.
3.2.2.2 Contact angle
As mentioned in Chapter 1, surface roughness affects the contact angle of a droplet on the
surface. Increasing roughness lowers the water contact angle if the surface is hydrophilic and
increases it if the surface is hydrophobic. As the metal surfaces produced in this study were
hydrophilic, and they were less rough than common gold surfaces, the contact angle was
expected to be greater than 60-65o, the common range of contact angles for water on gold.20
Freshly stripped gold had a very small contact angle (measured as 25±5o). However, the
contact angle slowly increased with time (as explained in Section 3.1.1) and after 24 hours the
contact angle was 67o which is relatively high for gold, as expected for a smooth surface. This
was presumably due to the adsorption of organics onto the surface rather than a roughening
of the surface which would have the effect of reducing the contact angle.

Ultra-Flat Surfaces
96
3.2.2.3 Stability
Template stripped gold surfaces, made using the various epoxies listed in Section 3.2.1, were
left in water for four hours and then dried at room temperature. AFM was then used to assess
the change, if any, in surface roughness and morphology. The smoothest and most stable
surfaces were made using Buehler Epo-Thin, although Epo-Tek 377 surfaces were very
similar, as can be seen from Table 2.
RMS Roughness / Å
Freshly stripped
72 h in air 4 h in water
Buehler Epo-Thin 3.9 6.9 8.3
Epo-Tek 377 4.6 6.7 8.9
Duralco 4525 8.7 12.7 14.6
Duralco 4703 8.2 11.0 29.1
RS Quickset Failed Failed Failed
Araldite Failed Failed Failed
Table 2|Variation in RMS roughness of template stripped gold with the epoxy used in the surface fabrication. Also shown is how roughness slowly increases after the gold has been exposed to the atmosphere and how the roughness increases more quickly after the gold has been submerged in water. The ‘failed’ surfaces were very rough immediately after being removed from their templates. They exhibited large cracks which could easily be made out by the naked eye.
As well as these microscopic changes, in many cases macroscopic blemishes and a ‘rippled’
texture, visible to the naked eye, also appeared on the surface following exposure to water
(Figure 40). Eventually, the water would creep in between the gold and the epoxy, seriously
damaging the entire surface.

Ultra-Flat Surfaces
97
Figure 40|Template stripped gold after long-term exposure to water. Clearly this surface is very different to the one shown in Figure 39.
One possible explanation for these defects is a reorganisation of the surface due to a
difference in the gold|air and gold|water surface energies. Alternatively, there may have been
small pinholes in the gold surface through which the water entered.
This result demonstrates that the epoxy used for template stripping has a dramatic effect on
the quality and stability of the resulting gold surface, especially if the surface is exposed to
water as is the case for electrowetting. Buehler Epo-Thin appears to make the most water
stable surfaces. This epoxy is designed to be stable at high temperatures and also has a very
low viscosity. Epo-Tek 377 is also a high temperature, low viscosity epoxy and appears to
produce the second most stables surfaces, behind the Buehler Epo-Thin. This suggests that
these are important properties for stability and any future work should test similar products
from other manufactures for the possibility of an even better epoxy.
These results are in direct contrast to the common claim that template stripped gold is stable
in water.21 While it is possible that a difference in the method of surface preparation could be
responsible, this is unlikely due to the simplicity of the process. Moreover, it seems that the
surface is inherently unstable and the nature of the epoxy is critical in determining the stability.

Ultra-Flat Surfaces
98
3.3 Glassy carbon
Carbon, often in the form of glassy carbon, is a commonly used electrode material.22 It has
many desirable properties such as its excellent chemical stability, electrochemical window,
mechanical strength and hydrophobicity. As will be seen in Chapter 4, it can also be effectively
functionalised by diazonium compounds. For these reasons, preparation of ultra-flat glassy
carbon for use as a substrate for electrowetting was attempted.
Glassy carbons are prepared by pyrolysis of an organic precursor material at 1000-3000 oC in
an inert atmosphere. Many mesoporous glassy carbons have been prepared from porous
templates such as zeolites and silica.23 The precursor is polymerised inside the template, which
is then etched away leaving a polymer skeleton. The skeleton will retain this structure, even
after pyrolysis. The template stripping of glassy carbon described here is analogous to this
process. The general method proposed was to mate a carbon polymer with a flat template and
then pyrolyse the polymer. On removal of the template a flat glassy carbon surface should be
left. Any previous attempts at such a process in the literature are unknown to the author
3.3.1 Properties
Glassy carbon was first made in 1962 by Yamada and Sato by the high temperature pyrolysis
of a phenolic resin in an inert atmosphere.24 Its structure was first thought to be essentially
graphitic; however, recent studies using transmission electron microscopy have suggested a
fullerene type structure (Figure 41).25

Ultra-Flat Surfaces
99
Figure 41|[Taken from Harris25] Illustration of the proposed structure of a non-graphitised glassy carbon based on fullerene type elements.
Owing to this unique structure, glassy carbon has a very low porosity and a very low
permeability to gases, unlike graphitic carbons. This can be seen from Table 3, which contains
the properties of a typical glassy carbon. Template stripped glassy carbon would have many
benefits over template stripped gold (or other template stripped metals). It has a larger
electrochemical window than gold, while retaining similar wetting properties, double layer
capacitance and mechanical strength. Although its bulk resistivity is higher than that of gold,
template stripped gold is very thin and therefore has a comparable resistance to thicker glassy
carbon electrodes. Glassy carbon is also much cheaper than gold. The biggest potential
advantage of template stripped glassy carbon would be its resistance to organic solvents. Due
to the epoxy used, template stripped gold is not stable in certain solvents; the surface
spontaneously roughens.13 This means it may not be suitable as a substrate for electrowetting.
On the other hand, template stripped glassy carbon is not expected not to have this problem
as no epoxy is needed and it is itself resistant to most solvents.
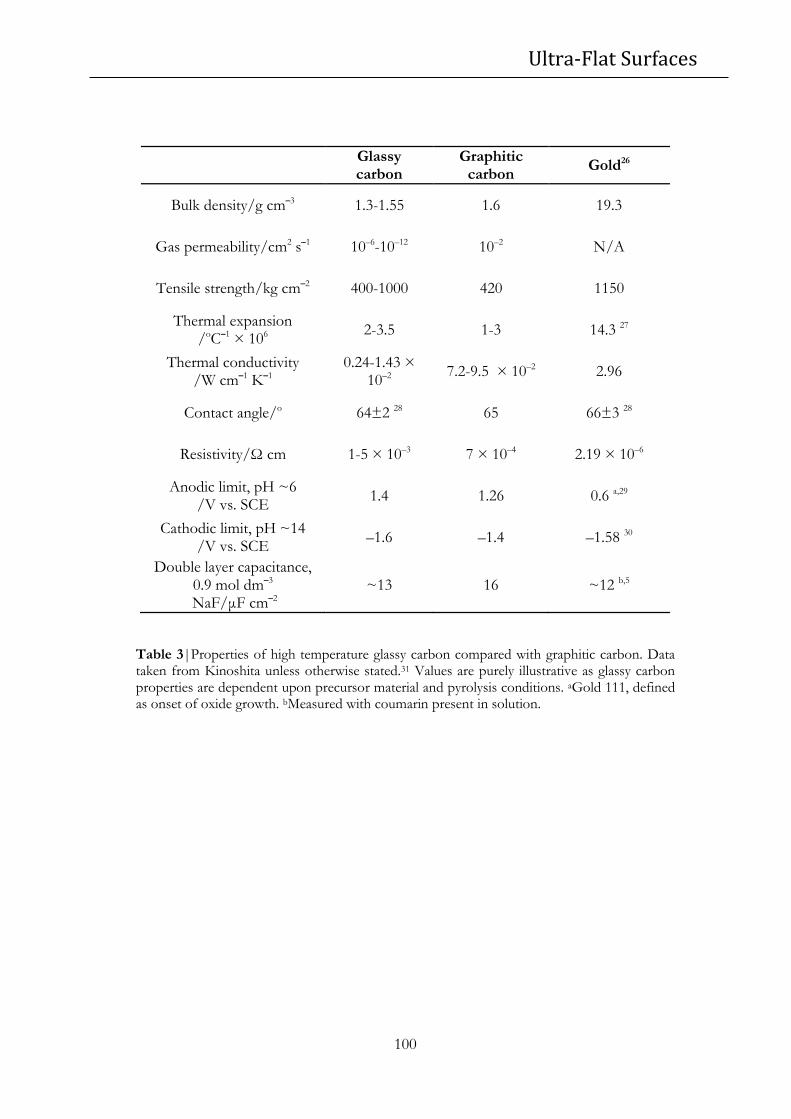
Ultra-Flat Surfaces
100
Glassy carbon
Graphitic carbon
Gold26
Bulk density/g cm–3 1.3-1.55 1.6 19.3
Gas permeability/cm2 s–1 10–6-10–12 10–2 N/A
Tensile strength/kg cm–2 400-1000 420 1150
Thermal expansion /oC–1 × 106
2-3.5 1-3 14.3 27
Thermal conductivity /W cm–1 K–1
0.24-1.43 × 10⁻²
7.2-9.5 × 10⁻² 2.96
Contact angle/o 64±2 28 65 66±3 28
Resistivity/Ω cm 1-5 × 10⁻³ 7 × 10⁻⁴ 2.19 × 10⁻⁶
Anodic limit, pH ~6 /V vs. SCE
1.4 1.26 0.6 a,29
Cathodic limit, pH ~14 /V vs. SCE
–1.6 –1.4 –1.58 30
Double layer capacitance, 0.9 mol dm–3
NaF/μF cm–2 ~13 16 ~12 b,5
Table 3|Properties of high temperature glassy carbon compared with graphitic carbon. Data taken from Kinoshita unless otherwise stated.31 Values are purely illustrative as glassy carbon properties are dependent upon precursor material and pyrolysis conditions. aGold 111, defined as onset of oxide growth. bMeasured with coumarin present in solution.

Ultra-Flat Surfaces
101
3.3.2 Precursors
Glassy carbon is produced by pyrolysis of a carbon containing precursor material at elevated
temperatures. Phenolic resins (Figure 42), along with many other organic polymers such as
poly(furfuryl alcohol), poly(vinyl chloride), cellulose and poly(acrylonitrile) can be used to
make glassy carbon.32,33
Figure 42|Phenol formaldehyde, formed by co-polymerisation of phenol and formaldehyde. The alternating phenol/methylene units form chains which are cross-linked via tri-substituted phenol units.
Pyrolysis is usually performed at temperatures between 1000-3000 oC; however, Callstrom et
al. have produced high quality glassy carbons at temperatures of only 600 oC.34 This is
achieved by using precursors with a high carbon to hydrogen ratio; molecules with a high
double and triple bond content. This means that less atomic rearrangement and elimination is
required to form the glassy carbon structure. Therefore, glassy carbon forms at a lower than
usual temperature. Template stripping uses a template to form the ultra-flat surface. At high
temperatures, the glass or quartz template is liable to deform and so a low temperature
pyrolysis was preferable.
In order to make template stripped glassy carbon, the precursor needs to take on the shape of
the template. This means that the precursor cannot be hard but instead must flow. Yet, at the
same time it must not be too liquid or else it will run off the surface of the template. In order
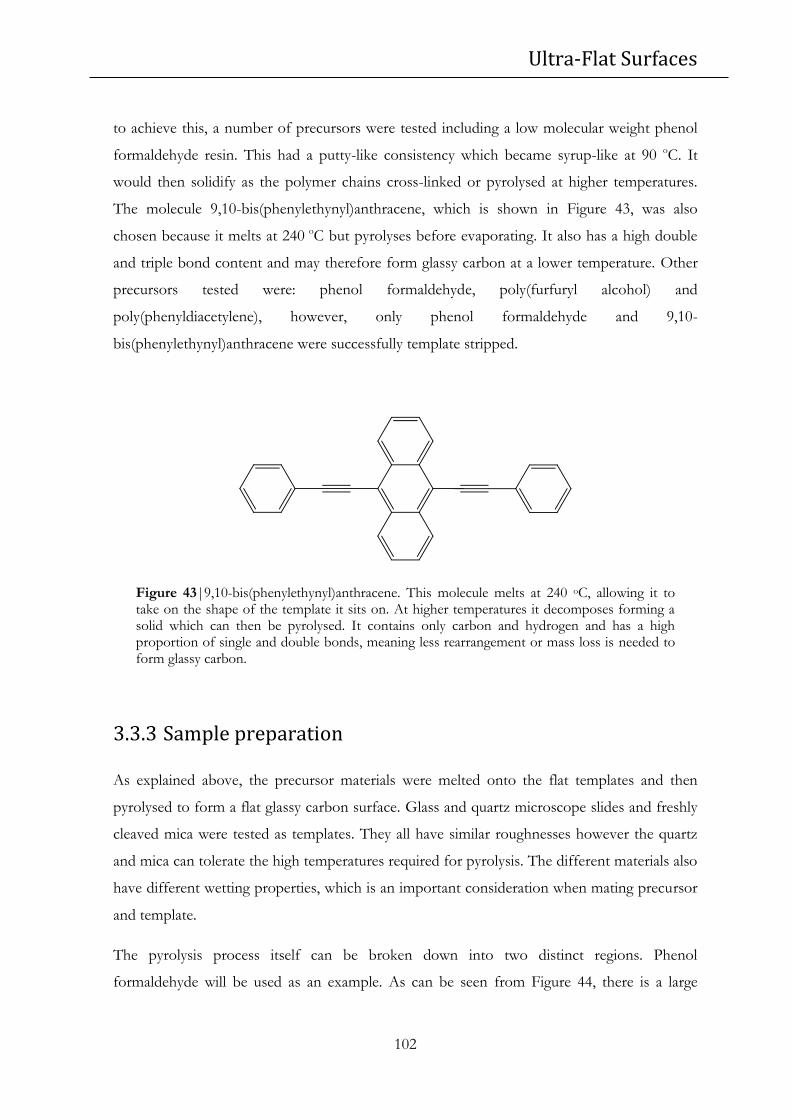
Ultra-Flat Surfaces
102
to achieve this, a number of precursors were tested including a low molecular weight phenol
formaldehyde resin. This had a putty-like consistency which became syrup-like at 90 oC. It
would then solidify as the polymer chains cross-linked or pyrolysed at higher temperatures.
The molecule 9,10-bis(phenylethynyl)anthracene, which is shown in Figure 43, was also
chosen because it melts at 240 oC but pyrolyses before evaporating. It also has a high double
and triple bond content and may therefore form glassy carbon at a lower temperature. Other
precursors tested were: phenol formaldehyde, poly(furfuryl alcohol) and
poly(phenyldiacetylene), however, only phenol formaldehyde and 9,10-
bis(phenylethynyl)anthracene were successfully template stripped.
Figure 43|9,10-bis(phenylethynyl)anthracene. This molecule melts at 240 oC, allowing it to take on the shape of the template it sits on. At higher temperatures it decomposes forming a solid which can then be pyrolysed. It contains only carbon and hydrogen and has a high proportion of single and double bonds, meaning less rearrangement or mass loss is needed to form glassy carbon.
3.3.3 Sample preparation
As explained above, the precursor materials were melted onto the flat templates and then
pyrolysed to form a flat glassy carbon surface. Glass and quartz microscope slides and freshly
cleaved mica were tested as templates. They all have similar roughnesses however the quartz
and mica can tolerate the high temperatures required for pyrolysis. The different materials also
have different wetting properties, which is an important consideration when mating precursor
and template.
The pyrolysis process itself can be broken down into two distinct regions. Phenol
formaldehyde will be used as an example. As can be seen from Figure 44, there is a large

Ultra-Flat Surfaces
103
decrease in sample volume between 350 oC and 650 oC. This coincides with a significant
reduction in mass as molecules such as water, methane, carbon monoxide and hydrogen are
eliminated.35,36 By the time the sample has been heated to 650 oC, it already conducts
electricity; with a resistivity on the order of 100 mΩ cm. Beyond this temperature mostly
hydrogen is lost and the gains in conductivity begin to diminish.22 At 1000 oC the reduction in
mass becomes almost insignificant and the resistivity is around 10 mΩ cm. Upon heating to
3000 oC, small defects are annealed and the resistivity peaks at around 5 mΩ cm.37
Figure 44|[Data taken from Bhatia35] Linear shrinkage (■) and variation of electrical resistivity (▲) of phenol formaldehyde resin with increasing pyrolysis temperature.
Due the volume reduction during pyrolysis, the sample can crack or form an inhomogeneous
surface. This means that a very specific sample preparation and heating cycle are often
required. Below is an example of a typical heating sequence:38
1. Heat to 200 oC
2. Hold for 3 hours to ensure sample is fully cured and to evaporate off any volatile
species
3. Heat to 600 oC (1 oC per minute)
4. Hold for 24 hours to slowly remove hydrogen and oxygen
5. Heat to 1000 oC
6. Hold for 3 hours to improve conductivity

Ultra-Flat Surfaces
104
3.4 Ultra-flat carbon surfaces
3.4.1 Experimental
3.4.1.1 Phenol formaldehyde synthesis
All chemical were used as received from Sigma-Aldrich. 15.1 g phenol (161 mmol), 49 ml
37 % formaldehyde solution (53.4 g, 658 mmol formaldehyde) and 9 ml 28 % ammonia
solution were mixed together. The solution was heated at 80 oC until opaque with a white
suspension.38 The mixture was allowed to settle and the top surface layer decanted off. The
remaining solid was then dried under vacuum. Once dry, a pale yellow/green solid was left,
which was very soft and could easily be easily shaped. This was placed onto circular quartz
coverslips (Agar Scientific, 10 mm diameter, 1 mm thickness) and heated to 90 oC under
vacuum for 1 h, forming semi-transparent amber domes on top of the coverslips ready for
pyrolysis.
3.4.1.2 9,10-bis(phenylethynyl)anthracene preparation
Approximately 30 μg 9,10-bis(phenylethynyl)anthracene (Alfa-Aesar) was deposited onto a
circular quartz coverslip (Agar Scientific, 10 mm diameter, 1 mm thickness). This was heated
from 150 oC to 250 oC over 2 h. It was then held at 250 oC for 1h, before being cooled to
room temperature over 2 h. This produced hard shiny black domes of polymerised
9,10-bis(phenylethynyl)anthracene on top of the quartz coverslip ready for pyrolysis.

Ultra-Flat Surfaces
105
3.4.1.3 Pyrolysis procedure
The carbon precursors were placed in an atmosphere of 5% hydrogen in nitrogen and
subjected to the following heat ramp:
1. 25 oC to 600 oC
2. 600 oC for 12 h
3. 600 oC to target temperature
4. Target temperature for 12 h
5. Target temperature to 25 oC
The target temperature was 600, 700, 800, 900 or 1000 oC. The heating/cooling rate was 1 oC
min–1.
3.4.1.4 Conductivity measurements
Conductivity was measured using a homemade four point conductivity probe (2 mm probe
spacing) and a Gamry Reference 600 potentiostat. In a four point probe measurement, current
flows between the outer probes and the potential drop across the inner probes is measured. It
assumes a semi-infinite, continuous film. (Equation 16 or (Equation 17 was used to calculate
the resistivity:39
(
)
(Equation 16)
(
)
(
)
(Equation 17)
where ρ is the resistivity, t is the sample thickness, s is the probe spacing, U is the potential
drop across the inner probes and I the current between the outer probes. (Equation 16 applies
when the sample thickness is less than half the probe spacing (t < s/2), otherwise (Equation
17 was used.

Ultra-Flat Surfaces
106
3.4.2 Results and discussion
3.4.2.1 Preparation and pyrolysis
The photographs in Figure 45 and Figure 46 show the three stages of glassy carbon
preparation for the two precursor materials used. Template stripped surfaces could only be
produced using quartz substrates. When mica substrates were used, the precursor materials
would wet and spread over the entire surface and not form bulk glassy carbon. As can be seen
from the images below, the surface in contact with the template formed islands roughly 1 mm2
in area during pyrolysis. While the surfaces appears rough and distorted, the islands
themselves are in fact very smooth as will be seen below.
Figure 45|(Left) Phenol formaldehyde precursor on quartz disk. (Middle) After heating to 90 oC, the precursor melts and mates with the surface of the flat template. It then begins to cross link forming a hard solid. (Right) After pyrolysis glassy carbon forms.
1 cm
90 oC pyrolysis

Ultra-Flat Surfaces
107
x
Figure 46|(Left) 9,10-bis(phenylethynyl)anthracene precursor material on quartz disk. (Middle) Upon heating to 250 oC the precursor melts and appears to polymerise, forming a hard, black and shiny solid. (Right) After pyrolysis glassy carbon forms.
3.4.2.2 Surface roughness
AFM images of the pyrolysed phenol formaldehyde and 9,10-bis(phenylethynyl)anthracene
indicate smooth but wavy surfaces. The waviness is most probably a consequence of the
shrinking of the glassy carbon during pyrolysis. However, the waviness is quite subtle: for the
phenol formaldehyde carbon the peak-to-peak amplitude is <20 nm and the peak separation is
20 μm. For the 9,10-bis(phenylethynyl)anthracene carbon these values are <70 nm and 80 μm
respectively. Therefore, this waviness is not considered as ‘roughness’ on the nanoscale.
If this waviness is removed from the image by the fitting of a third order polynomial, the
nanoscale roughness can be seen. Figure 47 below shows the phenol formaldehyde glassy
carbon surface. This is in fact incredibly smooth, with RMS roughness of 6.5 Ǻ which is close
to the roughness of template stripped gold (3.9 Å).
pyrolysis 250 oC
1 cm

Ultra-Flat Surfaces
108
Figure 47|AFM image of template stripped phenol formaldehyde derived glassy carbon. Area 5 μm × 5 μm; RMS roughness: 6.5 Å; Peak height: 10.8 nm.
The 9,10-bis(phenylethynyl)anthracene glassy carbon surface is shown in Figure 48. Much like
the phenol formaldehyde carbon surface, it too is very smooth, with an RMS roughness of
2.6 Å over 5 μm2. The surface also appears to have fewer features than the phenol
formaldehyde surface, which has regular pits on it.
Figure 48|AFM image of template stripped 9,10-bis(phenylethynyl)anthracene derived glassy carbon. Area 5 μm × 5 μm; RMS roughness: 2.6 Å; Peak height: 8.7 nm.

Ultra-Flat Surfaces
109
Furthermore, these surfaces did not roughen over a period of several months and were also
unaffected by water or acetone, which was not the case for conventional template stripped
metal surfaces. This is because glassy carbon is a very stable material, as discussed above,
which is clearly a huge benefit of using template stripped glassy carbon, allowing experiments
on very flat surfaces to be conducted in liquids over long periods of time. The glassy carbon
surfaces are also much smoother than commercially available glassy carbons. Diamond
polished glassy carbon from HTW GmbH, Germany had an RMS roughness of 56.5 Å with a
peak height of 54.3 nm over 10 μm2. It should be noted that basal planes of highly oriented
pyrolytic graphite (HOPG) are smoother, however, HOPG is not glassy carbon and has
different chemical and physical properties as well as different electrochemistry.40 It is also
difficult to cleave over large areas and will typically have many steps. HOPG is also a very
expensive material while the template stripped glassy carbon reported here can be prepared
relatively cheaply.
3.4.2.3 Conductivity
Conductivity is an important property of glassy carbon, particularly if it is to be used for
electrowetting. Phenol formaldehyde and 9,10-bis(phenylethynyl)anthracene glassy carbons
were pyrolysed at different temperatures and their conductivities measured (Table 4). As
expected, the conductivity increased with increasing pyrolysis temperature. The critical
temperature at which there was a dramatic increase in conductivity was 800 oC for the phenol
formaldehyde (five orders of magnitude increase) and 700 oC for 9,10-
bis(phenylethynyl)anthracene (three orders of magnitude increase). Therefore, these are the
temperatures at which cross linking between molecules must begin. Heating to higher
temperatures results is a much smaller but nonetheless significant increase in conductivity.
The final conductivity after a 1000 oC pyrolysis temperature for phenol formaldehyde derived
glassy carbon was 5.1 S cm–1, while the conductivity of 9,10-bis(phenylethynyl)anthracene
derived glassy carbon (1000 oC pyrolysis) was 36 S cm–1. The greater fraction of double and
triple bonds in the 9,10-bis(phenylethynyl)anthracene may account for this. These
conductivities are slightly lower than the average glassy carbon conductivities of approximately
100 S cm–1 reported in the literature.35,37 These results suggest that 9,10-

Ultra-Flat Surfaces
110
bis(phenylethynyl)anthracene is a superior template stripped glassy carbon precursor to phenol
formaldehyde as it produces a more conductive sample at lower pyrolysis temperatures.
Pyrolysis temperature
/ oC
Phenol formaldehyde
carbon conductivity
/ S cm–1
9,10-bis(phenylethynyl) anthracene carbon
conductivity / S cm–1
500 Insulator Insulator
600 1.5 × 10⁻⁵ 5.3 × 10⁻⁴
700 9.9 × 10⁻⁵ 0.38
800 3.2 12
900 5 34
1000 5.1 36
Table 4|Conductivity of phenol formaldehyde and 9,10-bis(phenylethynyl)anthracene derived glassy carbons based on final pyrolysis temperature. There is an error of ±20% due to the difficulty in measuring the sample thickness.
3.5 Conclusions
3.5.1 Metal surfaces
Ultra-flat template stripped metal surfaces were successfully prepared as previously seen in the
literature. However, it was shown that this could be achieved with much cheaper, more
common-place materials such as glass microscope slides rather than freshly cleaved mica.
Despite the increased roughness of such materials when compared to atomically smooth mica,
the resulting surfaces have an RMS roughness of less than 4 Å, close to ‘atomic roughness’.
The very low RMS roughness occurred over a macroscopic area, which has only previously
been reported for mica templates.11 These provide very convenient metal surfaces which can

Ultra-Flat Surfaces
111
be prepared in advance and freshly exposed prior to use, ensuring cleanliness of the surface.
As they are simple and cheap to prepare, they provide an attractive alternative to simple
sputtered or evaporated metal surfaces.
The stability of template stripped surfaces in water and air was also tested. It was shown that
they are not stable in water, especially over long periods of time. This is in disagreement with
what is commonly stated in the literature. Similarly, albeit more slowly, the surfaces seem to
degrade in air. Furthermore, it was shown that the epoxy which is used for the template
stripping is critical in creating a smooth and stable template stripped surface.
Future work in this area could further explore the origin of the instability of these surfaces and
search for other epoxies or adhesives which may improve the stability.
3.5.2 Carbon surfaces
Smooth glassy carbon surfaces were prepared with a modified template stripping process for
the first time. This involved mating the glassy carbon precursor with a flat quartz template.
The precursor was then pyrolysed while still in contact with the quartz, resulting in the
formation of a very smooth glassy carbon surface.
Two different glassy carbon precursors were used: phenol formaldehyde which has been used
previously and 9,10-bis(phenylethynyl)anthracene which has not. These produced surfaces
with nanoscale roughnesses of 6.5 Å and 2.6 Å respectively. However, the surfaces were wavy
on the microscale. Nonetheless the surfaces should still be suitable as substrates for studying
nanoscale assemblies for which ultra-flat surfaces are required, and thus provides a new
material (glassy carbon) for such experiments.8 Of particular merit was the surface stability in
water and organic solvents. The carbon itself had good conductivity, close to literature
conductivity values (36 S cm-1 after heating to 1000 oC for the 9,10-
bis(phenylethynyl)anthracene).The surfaces were also cheap and simple to prepare and may
provide a good alternative to HOPG.
Future research should focus on the development of other precursors which may yield higher
conductivities or pyrolyse at lower temperatures. The lower pyrolysis temperature may result
in a smaller degree of surface waviness.

Ultra-Flat Surfaces
112
3.6 References
1 Frumkin, A. N., Kabanow, B. & Nekrasow, M. Kapillarelektrische Erscheinungen und Benetzung von Metallen durch Elektrolytlösungen. I. Phys. Z. Sovijetunion 1, 255-284 (1932).
2 Cousens, N. E. A. Shape Changing Liquid Droplets, Imperial College London, (2009). 3 Marinescu, M., Urbakh, M., Barnea, T., Kucernak, A. R. & Kornyshev, A. A.
Electrowetting Dynamics Facilitated by Pulsing. The Journal of Physical Chemistry C 114, 22558-22565, doi:10.1021/jp1052634 (2010).
4 Grahame, D. C. Capacity of the Electrical Double Layer between Mercury and Aqueous Sodium Fluoride. II. Effect of Temperature and Concentration. Journal of the American Chemical Society 79, 2093-2098 (1957).
5 Bond, A. M. & Thomas, F. G. Studies of Adsorption Processes in the Absence of Added Electrolyte: Phase Changes in Coumarin Adsorbed at Conventional and Micro Mercury Electrodes. Langmuir 4, 341-345, doi:10.1021/la00080a016 (1988).
6 Conroy, J. F. T., Caldwell, K., Brucknerlea, C. & Janata, J. An Examination of Surface Waving on Mercury Film Electrodes Using Scanning-Tunnelling-Microscopy. Electrochimica Acta 40, 2927-2934 (1995).
7 Marinescu, M. Electrovariable Liquid Interfaces for Optical Applications: Structure and Dynamics, Imperial College London, (2012).
8 Vogel, N., Zieleniecki, J. & Koeper, I. As Flat as It Gets: Ultrasmooth Surfaces from Template-stripping Procedures. Nanoscale 4, 3820-3832 (2012).
9 Hegner, M., Wagner, P. & Semenza, G. Ultralarge Atomically Flat Template-Stripped Au Surfaces for Scanning Probe Microscopy. Surface science 291, 39-46 (1993).
10 Priest, C., Jacobs, K. & Ralston, J. Novel Approach to the Formation of Smooth Gold Surfaces. Langmuir 18, 2438-2440 (2002).
11 Chai, L. & Klein, J. Large Area, Molecularly Smooth (0.2 nm RMS) Gold Films for Surface Forces and Other Studies. Langmuir 23, 7777-7783 (2007).
12 Atmaja, B., Frommer, J. & Scott, J. Atomically Flat Gold on Elastomeric Substrate. Langmuir 22, 4734-4740 (2006).
13 Blackstock, J. J., Li, Z. & Jung, G.-Y. Template Stripping Using Cold Welding. Journal of Vacuum Science & Technology A: Vacuum, Surfaces, and Films 22, 602-605 (2004).
14 Woodard, N. & Lafyatis, G. Fabrication and Characterization of Extremely Smooth Large Area Gold Surfaces. Journal of vacuum science & technology. A. Vacuum, surfaces, and films 14, 332-335 (1996).
15 Pattier, B., Bardeau, J., Edely, M., Gibaud, A. & Delorme, N. Cheap and Robust Ultraflat Gold Surfaces Suitable for High-resolution Surface Modification. Langmuir 24, 821-825 (2008).
16 Adamson, A. W. Physical Chemistry of Surfaces. 5th edn, (John Wiley & Sons, Inc., 1990). 17 Bewig, K. W. & Zisman, W. A. The Wetting of Gold and Platinum by Water. The
Journal of Physical Chemistry 69, 4238-4242, doi:10.1021/j100782a029 (1965). 18 Masens, C., Schulte, J., Phillips, M. & Dligatch, S. Ultra Flat Gold Surfaces for Use in
Chemical Force Microscopy: Scanning Probe Microscopy Studies of the Effect of Preparation Regime on Surface Morphology. Microscopy and Microanalysis 6, 113-120 (2000).
19 Untiedt, C. et al. Calibration of the Length of a Chain of Single Gold Atoms. Phys. Rev. B 66, doi:10.1103/PhysRevB.66.085418 (2002).

Ultra-Flat Surfaces
113
20 Erb, R. A. Wettability of Gold. The Journal of Physical Chemistry 72, 2412-2417, doi:10.1021/j100853a023 (1968).
21 Wagner, P., Hegner, M., Guentherodt, H.-J. & Semenza, G. Formation and in Situ Modification of Monolayers Chemisorbed on Ultraflat Template-Stripped Gold Surfaces. Langmuir 11, 3867-3875, doi:10.1021/la00010a043 (1995).
22 Van der Linden, W. E. & Dieker, J. W. Glassy Carbon as Electrode Material in Electro-analytical Chemistry. Analytica Chimica Acta 119, 1-24, doi:10.1016/s0003-2670(00)00025-8 (1980).
23 Inagaki, M., Orikasa, H. & Morishita, T. Morphology and Pore Control in Carbon Materials via Templating. RSC Advances 1, 1620-1640 (2011).
24 Yamada, S. & Sato, H. Some Physical Properties of Glassy Carbon. Nature 193, 261-262 (1962).
25 Harris, P. J. F. New Perspectives on the Structure of Graphitic Carbons. Critical reviews in solid state and materials sciences 30, 235-253 (2005).
26 Smithsonian Physical Tables. 9th edn, (Smithsonian Institution, 1954). 27 Knovel Critical Tables. 2nd edn, (Knovel, 2008). 28 Chehimi, M. M., Hallais, G. r., Matrab, T., Pinson, J. & Podvorica, F. I. Electro- and
Photografting of Carbon or Metal Surfaces by Alkyl Groups. The Journal of Physical Chemistry C 112, 18559-18565, doi:10.1021/jp807044j (2008).
29 Hamelin, A. Cyclic Voltammetry at Gold Single-crystal Surfaces. Part 1. Behaviour at Low-index Faces. Journal of Electroanalytical Chemistry 407, 1-11, doi:10.1016/0022-0728(95)04499-x (1996).
30 Ji, C., Oskam, G. & Searson, P. in 201st ECS Meeting (Philadelphia, PA, 2002). 31 Kinoshita, K. Carbon: Electrochemical and Physicochemical Properties. (John Wiley & Sons,
Inc., 1987). 32 Gardziella, A., Pilato, L. A. & Knop, A. Phenolic Resins: Chemistry, Applications,
Standardization, Safety and Ecology. 2nd edn, (Springer-Verlag Berlin Heidelberg, 2000). 33 Pocard, N. L., Alsmeyer, D. C., McCreery, R. L., Neenan, T. X. & Callstrom, M. R.
Doped GlassyCarbon: A New Material for Electrocatalysis. Journal of Materials Chemistry 2, 771-784 (1992).
34 Callstrom, M. R., Neenan, T. X., McCreery, R. L. & Alsmeyer, D. C. Doped Glassy Carbon Materials (DGC):Low-temperature Synthesis, Structure, and Catalytic Behavior. Journal of the American Chemical Society 112, 4954-4956, doi:10.1021/ja00168a049 (1990).
35 Bhatia, G., Aggarwal, R. K., Malik, M. & Bahl, O. P. Conversion of Phenol Formaldehyde Resin to Glass-like Carbon. Journal of materials science 19, 1022-1028 (1984).
36 Jiang, D., Goddard, W. & Dai, S. Simulating the Initial Stage of Phenolic Resin Carbonization via the ReaxFF Reactive Force Field. The Journal of Physical Chemistry A 113, 6891-6894 (2009).
37 Soukup, L., Gregora, I., Jastrabik, L. & Koňáková, A. Raman Spectra and Electrical Conductivity of Glassy Carbon. Materials Science and Engineering: B 11, 355-357, doi:10.1016/0921-5107(92)90240-a (1992).
38 Oiye, É. N., de Andrade, J. F., Balbo, V. R., dos Santos, A. L. & de Oliveira, M. F. Development of an Alternative Route for Production of Glassy Polymeric Carbon Electrodes in Laboratorial Scale. Macromolecular symposia 299-300, 147-155, doi:10.1002/masy.200900127 (2011).

Ultra-Flat Surfaces
114
39 Schroder, D. K. Semiconductor Material and Device Characterisation. Third edn, (John Wiley & Sons, 2006).
40 Brownson, D. A. C., Kampouris, D. & Banks, C. Graphene Electrochemistry: Fundamental Concepts Through to Prominent Applications. Chemical Society Reviews 41, 6944-6976 (2012).

Chapter 4: Fluorinated Electrodes
115
Chapter 4: Fluorinate d Electrodes
Studies on EWOD systems have shown that hydrophobic dielectric materials are important
for reducing hysteresis.1 Furthermore, organic solvent droplets on hydrophobic surfaces have
low Young angles, thus lowering the minimum attainable electrowetting contact angle. For
these reasons, various methods for creating fluorinated electrodes were investigated.
A common method of increasing surface hydrophobicity is the inclusion of fluorine atoms.
This is because a fluorine atom bonded to an sp3 carbon greatly disrupts the hydrogen
bonding network in water increasing the surface energy.2 However, these fluorine containing
materials are usually insulating solids, such as PTFE. Any surface for electrowetting purposes
must be conductive and so this chapter concerns the production of fluorine containing
hydrophobic surfaces with a high degree of conductivity for use as electrowetting electrodes.
Three distinct methods are used: electrochemical functionalisation, plasma fluorination and
chemical fluorination of a conducting polymer.
4.1 Electrochemical functionalisation
Electrochemical functionalisation of surfaces, often known as electrografting, is a method of
attaching small organic molecules to solid conducting surfaces. The reaction generally
proceeds via a reactive intermediate generated by electrochemical oxidation or reduction
which then attacks the surface and forms a covalent bond.3 The strength of the bond is critical
as it is important to permanently adhere the fluoro species to the surface to ensure that the
surface cannot change in composition underneath the droplet (a source of hysteresis discussed
in Chapter 1, as happens with chemisorbed thiols for example).4

Fluorinated Electrodes
116
4.1.1 Electrografting
4.1.1.1 Overview
Many methods for electrochemical surface functionalisation have been developed, with the
generation of a radical intermediate common to all of them.3
The one electron oxidation of many functional groups—such as primary amines, phosphates,
alcohols and carboxylates—generates a free radical and a proton. These reactions occur at
moderate potentials, for example the oxidation of the amino group in
4-aminobenzylphosphonic acid is an irreversible process occurring at 0.75 V (versus the
normal hydrogen electrode) while the oxidation of the phosphate group occurs at 0.90 V
(Figure 49).5 The free radical species generated then proceeds to attack the electrode, forming
a covalent bond.
Figure 49|[Taken from Yang5] Illustration of the mechanism of surface functionalisation of a glassy carbon electrode (GCE) via amine or phosphate oxidation.

Fluorinated Electrodes
117
Similarly, other functional groups can be electrochemically reduced. These include alkyl
halides, which can also be photografted with electromagnetic radiation, and vinylic
compounds which subsequently undergo electropolymerisation at the double bond.6-8
Surfaces functionalised by the above methods have been successfully used as sensors for a
plethora of molecules—such as hydrogen peroxide, nitric oxide, dopamine and alanine—and
can also effectively measure pH.9-13 However, the surfaces are of highly variable quality and
examples are generally limited to solitary cases in the literature.
The precise nature of the film, including its structure and electrochemistry, is often not fully
characterised. Preliminary experiments that were performed as part of this project resulted in
macroscopically patchy surfaces (feature size greater than 0.1 mm). By far the most common
method of electrografting is via reduction of diazonium compounds. This is covered in the
next section and was the preferred method for surface functionalisation in this thesis.
4.1.1.2 Diazonium grafting
Following some preliminary experiments covering many of the above methods, diazonium
chemistry was found to be the most efficient and effective surface functionalisation method. It
involves the one electron reduction of an aromatic diazonium compound which creates an aryl
free radical and generates molecular nitrogen in the process (Figure 50).14

Fluorinated Electrodes
118
Figure 50|Mechanism of surface functionalisation by a generic diazonium compound. The one electron reduction of the diazonium species produces an aryl free radical and molecular nitrogen which diffuses away. The radical then attacks the surface forming a covalent bond.
Figure 51 shows the voltammetry of the electrochemical reduction of a typical diazonium
compound, 4-nitrobenzenediazonium. It shows how after the first reductive scan, the
electrochemical current disappears almost entirely. The organic layer that forms on the surface
blocks the diazonium compound from diffusing to the electrode, preventing more molecules
from being reduced. This layer, usually around 20 nm in thickness, cannot be removed by
ultrasonication, indicating that it is securely attached. It is also commonly reported (without
experimental justification) that the organic layer is a monolayer.3 This is almost certainly not
the case and, as will be seen below, special methods are required to generate a monolayer. It is
clear from the thickness of the layer that it is more than one molecule thick. In fact, after the
first layer has been deposited, radicals continue to be produced (the electrode surface is not
blocked). However, as the electrode surface is now completely covered, the radicals proceed
to attack the molecules already on the surface and a multilayer begins to grow. This process
continues until the multilayer blocks the electrochemical reduction and no more radicals are
formed.

Fluorinated Electrodes
119
Figure 51|[Taken and modified from Belanger3] Voltammetry of the electrochemical reduction of 4-nitrobenzenediazonium (5 mmol dm–3 in 0.1 mol dm–3 H2SO4, scan rate = 100 mV s–1). The first scan, scan a, shows a broad reduction peak centred on –60 mV. In the second scan, scan b, the peak has disappeared. This is explained by the formation of an organic layer which blocks access of the 4-nitrobenzenediazonium to the electrode.
The aryl group is essential to the stability of the radical and the ability of the molecule to
functionalise the surface. Alkyl radicals have much shorter lifetimes, to the extent that they
decompose or react with the solvent before being able to attack the electrode surface and very
few aliphatic salts have been successfully grafted.15 The functional groups attached to the aryl
ring seem to have little effect on the viability of the functionalisation. As a result, almost all
simple aryl diazonium species have been successfully adhered to a variety of substrates such as
gold, copper, iron and the various forms of carbon.3
4.1.1.3 Monolayer formation
For electrowetting purposes, the formation of a surface monolayer may be important because
a multilayer might be expected to be very rough while also reducing the capacitance of the
metal surface. In turn, this could reduce the electrowetting response. As mentioned above,
despite initial suppositions, diazonium grafting will ordinarily produce a multilayer. Therefore,
several methods, which will be described below, have been developed to overcome this.
The ‘formation-degradation’ procedure has been reported by the group of Daasbjerg.16,17 This
method involves the grafting of aromatic diazonium compounds containing either disulphide

Fluorinated Electrodes
120
or hydrazone functionalities, shown in Figure 52. Following grafting of the molecules by the
conventional method (resulting in multilayer formation), the first molecular layer itself is
cleaved in half. This is done either electrochemically in the case disulphide or by acid
hydrolysis in the case of hydrazone. The result is that the outer layers, which are attached to
the outer half of the first layer, are removed entirely from the surface and a monolayer is
formed.
Figure 52|Illustration of the ‘formation-degradation’ method for surface monolayer preparation. The disulphide functionality can be oxidised to a thiol, detaching all but the first aromatic ring from the electrode surface. Similarly, the hydrazone group can be chemically cleaved, leaving behind an aldehyde.
Leroux et al. have produced monolayers by depositing diazonium compounds with
triisopropylsilyl protecting groups.18 These are very large, bulky groups and prevent radicals
from attacking the aryl ring, thus preventing multilayer growth. The silyl group can then be
removed chemically leaving an alkyne functionality.
The problem with the methods presented thus far, is that they don’t leave molecules
containing the hydrophobic functional groups needed. This means that post functionalisation
is necessary. Whilst this is possible, it requires lengthy and expensive characterisation by XPS

Fluorinated Electrodes
121
and Raman spectroscopy to confirm the presence of the desired functional group.
Furthermore, the conversion of all surface molecules is unlikely to be complete.
Two methods of monolayer formation remain which don’t require any post functionalisation,
allowing a single layer of hydrophobic molecules to be attached to the surface in one step. The
first, oxidation of phenyl hydrazines (formed by chemical reduction of the relevant diazonium
compound), has been reported by Malmos et al.19,20 Surface physisorption of other molecules
(which must later be removed by sonication) is postulated to explain the termination of
growth at a monolayer. Nonetheless, it is still somewhat unclear as to why such thin layers
form as the same aryl free radical intermediates seen in multilayer growth are believed to be
created. The other method is similar in principle to the triisopropylsilyl protecting group
method described above: it uses sterics to prevent the phenyl ring being attacked by radicals.
Combellas et al. have used 3,5-di-tert-isobutylbenzenediazonium, to successfully produce
monolayers, as shown in Figure 53.21 The large tert-isobutyl groups prevent free radicals from
getting near the aromatic ring which is the part of the molecule most susceptible to attack.
Therefore, multilayer growth becomes very slow: after 300 seconds at a reducing potential, the
thickness of the surface layer grown on gold is reported to be only 1 nm, as measured by
ellipsometry. This thickness corresponds to a monolayer. Furthermore, this monolayer is
reported to raise the water contact angle of copper from 49o to 74o.

Fluorinated Electrodes
122
Figure 53|[Taken from Combellas et al.21] Illustration of how kinetically hindering the phenyl ring of the diazo compound prevents the growth of a multilayer.
Owing to the simplicity of the steric blocking method of Combellas et al., along with the fact
that no in situ functionalisation is needed afterwards, this was the method chosen to try to
create a surface monolayer. While 3,5-di-tert-butylaniline, as used by Combellas et al., is
commercially available, it is currently very expensive. Moreover, the hydrophobicity of the
monolayer could be further increased by swapping the tertiary butyl groups for their
fluorinated analogues. The diazonium salt 3,5-bis(2-ethoxyhexafluoroisopropyl)
benzenediazonium tetrafluoroborate (Figure 54) was synthesised to achieve exactly this.
Rather than having tert-butyl groups, this molecule has two trifluoromethyl groups and an
ethoxy group instead. This should help to make the molecule more hydrophobic. This is based
on Zisman’s finding that CF3 groups have a lower surface energy than CH3 groups (15 J cm–2
rather than 30 J cm–2, respectively).22
4.1.2 Experimental
1H NMR spectra were recorded with a Bruker 400 MHz spectrometer; δ values are given in
ppm relative to TMS. 1,3-Bis(2-hydroxyhexafluoroisopropyl)benzene (Fluorochem) and all

Fluorinated Electrodes
123
other materials (Sigma-Aldrich) were used as supplied. Contact angles were measured from
photographs taken with a CCD camera (Phillips SPC900NC webcam) through a video zoom
microscope (Edmund Optics Infinity K2/S Long Distance Video Lens) at 20× magnification.
Contact angles were subsequently measured using Fta32 2.0 contact angle software (First Ten
Ångstroms). All reported contact angles are advancing contact angles averaged over five
measurements.
4.1.2.1 Synthesis of sterically hindered, fluorinated diazonium salt
10g (24.4 mmol) 1,3-Bis(2-hydroxyhexafluoroisopropyl)benzene were dissolved in 50 ml
dimethylformamide. 7.9 g potassium carbonate (57 mmol) and 3 ml ethyl iodide (5.82 g, 37.3
mmol) were added. The mixture was stirred for 24 h under argon at room temperature and
then quenched with saturated ammonium chloride solution and extracted three times with
ethyl acetate. The combined organic extracts were washed with water and brine, dried with
magnesium sulphate and concentrated. The remaining residue was filtered through silica using
hexane. This gave 7.50 g of compound B, a yellow solid, yield 66 %.23 1H NMR (400 MHz, d6-
DMSO): δ=1.32 (m, CH3, 6H), 3.59 (m, CH2, 4H), 7.66-7.96 (m, 3H), 8.09 (s, 1H).
2 g compound B (4.28 mmol) were added to 50 ml 1:1 HNO3:H2SO4 at 80 oC. The mixture
was stirred for 1 h, quenched with saturated sodium bicarbonate solution and then extracted
with dichloromethane three times.24 The combined organic extracts were washed with water
and brine, dried with magnesium sulphate and concentrated. This gave 1.41 g of compound C,
a bright orange solid, yield 66 %. 1H NMR (400 MHz, CDCl3): δ=1.28 (m, CH3, 6H), 3.75 (m,
CH2, 4H), 8.1-8.3 (m, 3H).
1 g compound C (2.00 mmol) was dissolved in 20 ml ethanol with 1 g 10% Pd/C. The
mixture was stirred under a H2 atmosphere for 6 h and then filtered under gravity.24 The

Fluorinated Electrodes
124
ethanol was removed in vacuo to yield 0.91 g of compound D, a yellow oil, yield 97%. 1H NMR
(400 MHz, CDCl3): δ=1.28 (m, CH3, 6H), 3.75 (m, CH2, 4H), 7.6-7.9 (m, 3H).
A 100 ml flask in an acetonitrile/dry ice bath was charged with nitrosonium tetrafluoroborate
(0.23 g, 1.94 mmol) under argon. Dry acetonitrile (10 ml) was then added. After the solution
had cooled to –30 oC, compound D (0.97 g, 1.94 mmol) in acetonitrile (10 ml) was added over
30 min. The yellow reaction mixture was stirred for 1 h at –30oC, treated with dry
dichloromethane (50 ml) and filtered under vacuum. The white crystalline precipitate was
washed with dry dichloromethane, and recrystallised from dry acetonitrile/dichloromethane.
This gave 0.45 g of compound E, a white crystalline solid, yield 47%.25
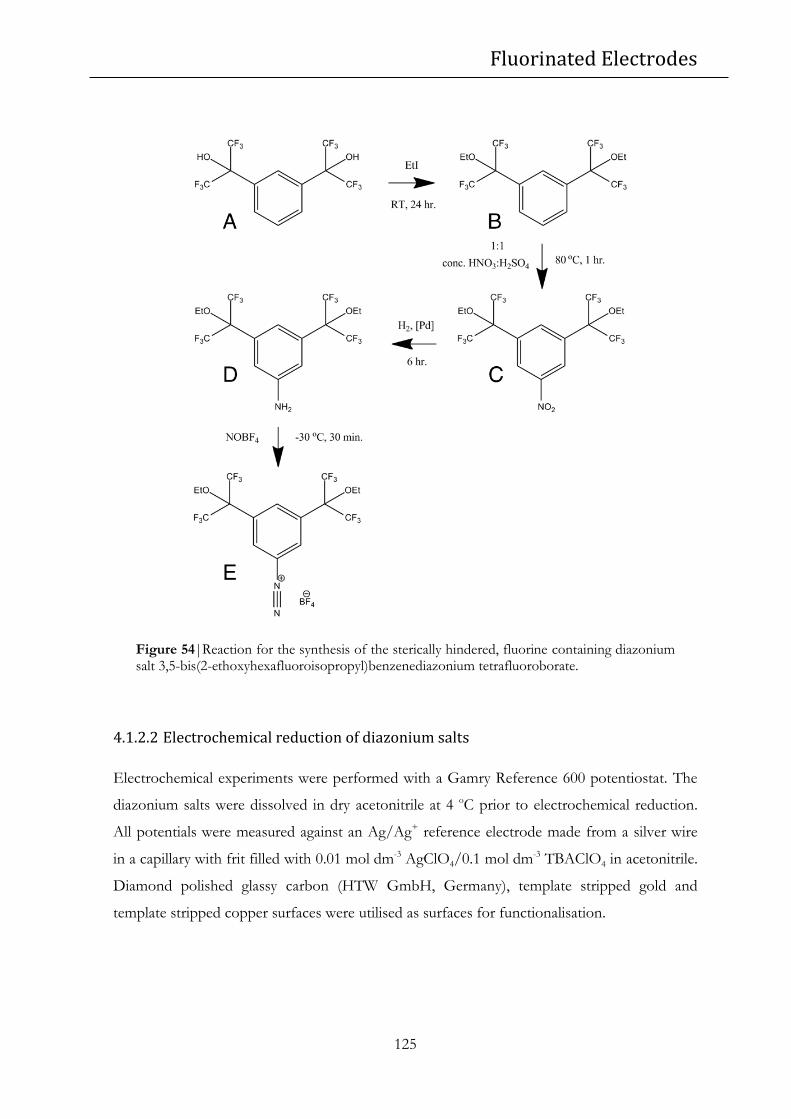
Fluorinated Electrodes
125
Figure 54|Reaction for the synthesis of the sterically hindered, fluorine containing diazonium salt 3,5-bis(2-ethoxyhexafluoroisopropyl)benzenediazonium tetrafluoroborate.
4.1.2.2 Electrochemical reduction of diazonium salts
Electrochemical experiments were performed with a Gamry Reference 600 potentiostat. The
diazonium salts were dissolved in dry acetonitrile at 4 oC prior to electrochemical reduction.
All potentials were measured against an Ag/Ag+ reference electrode made from a silver wire
in a capillary with frit filled with 0.01 mol dm-3 AgClO4/0.1 mol dm-3 TBAClO4 in acetonitrile.
Diamond polished glassy carbon (HTW GmbH, Germany), template stripped gold and
template stripped copper surfaces were utilised as surfaces for functionalisation.

Fluorinated Electrodes
126
4.1.3 Results
4.1.3.1 Electrochemical reduction
A broad irreversible reduction peak was seen at -800 mV versus Ag/Ag+ on all electrode
materials (copper, gold and glassy carbon). The peak disappeared after one scan, presumably
due to passivation of the surface due to film growth, as is commonly seen (see Figure 51).
4.1.3.2 Contact angle
The water surface contact angle was measured before and after surface functionalisation. On
glassy carbon (see Figure 55) and copper there was a substantial increase in contact angle
while on gold there was no increase beyond the statistical error in the contact angle
measurement. The largest contact angle increase was seen on copper, where the contact angle
increased to 74o (from 49o). A comparison of changes in contact angle can be seen in Table 5.
The copper contact angle is 1o larger than the contact angle reported by Combellas et al. after
functionalisation of copper with the similar molecule 3,5-di-tert-butylbenzene.21 This suggests
that the surface has been successfully functionalised. It also suggests that the substitution of
the tertiary methyl groups used by Combellas for trifluoromethyl groups only has a minor
effect on the hydrophobicity of the surface.
Figure 55|Contact angle of water on glassy carbon before and after 3,5-bis(2-ethoxyhexafluoroisopropyl)benzenediazonium tetrafluoroborate functionalisation.

Fluorinated Electrodes
127
The change in contact angle suggests that the surface has been functionalised with a
hydrophobic species. Initial AFM micrographs could not detect any change in the surface
structure although further characterisation with ellipsometry is still needed to confirm the
presence of a monolayer.26
Contact angle / degrees
Before
functionalisation After
functionalisation
Gold 66±5 67±4
Glassy carbon 85±3 103±3
Copper 49±3 74±3
Table 5|Contact angle of water on gold, glassy carbon and copper before and after functionalisation with 3,5-bis(2-ethoxyhexafluoroisopropyl)benzene. Errors indicate ±1 standard deviation.
The small change in contact angle on gold suggests that there is a much lower surface
coverage on gold, perhaps due to weaker bonding between the gold and phenyl ring. This
effect may not usually be so pronounced when multilayer growth is possible. This is because
the multilayer can branch out from a few molecules which have been attached to the surface,
eventually covering the whole surface. There may also be some mechanical ‘keying’ of the film
onto the surface. The contact angle on gold functionalised with 3,5-di-tert-butylbenzene is not
reported by Combellas et al. and so no comparison can be made with this work in order to
support this result.
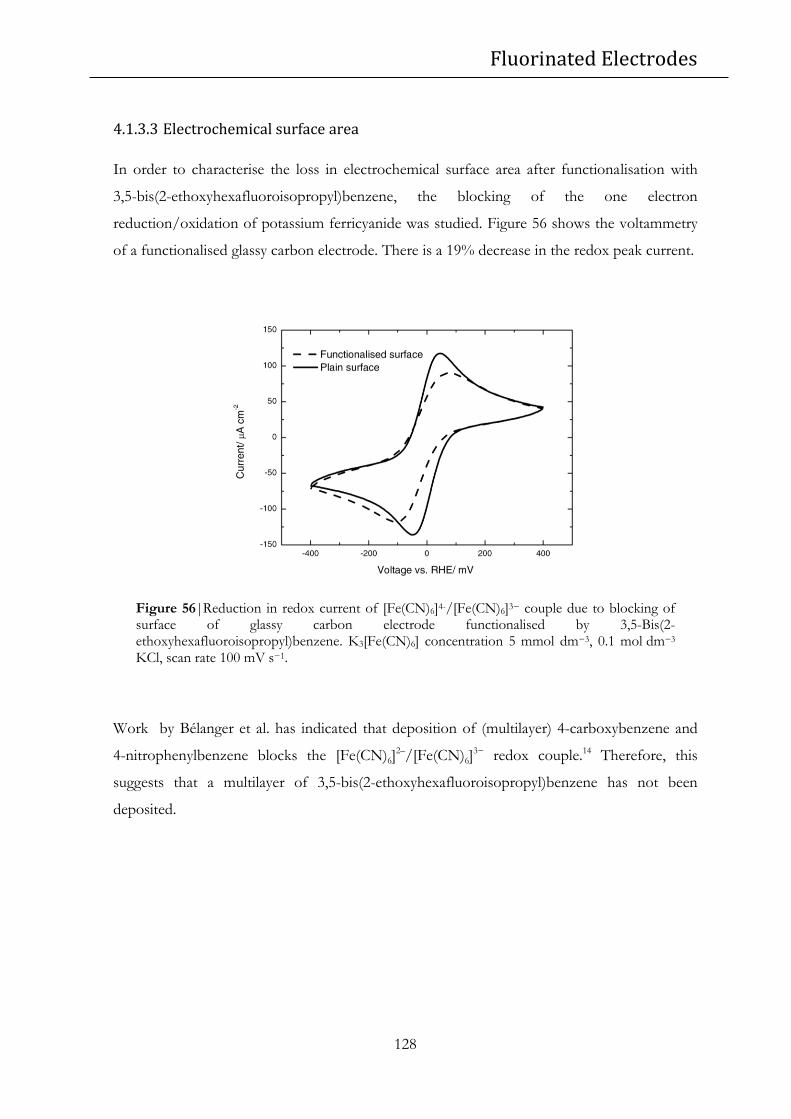
Fluorinated Electrodes
128
4.1.3.3 Electrochemical surface area
In order to characterise the loss in electrochemical surface area after functionalisation with
3,5-bis(2-ethoxyhexafluoroisopropyl)benzene, the blocking of the one electron
reduction/oxidation of potassium ferricyanide was studied. Figure 56 shows the voltammetry
of a functionalised glassy carbon electrode. There is a 19% decrease in the redox peak current.
Figure 56|Reduction in redox current of [Fe(CN)6]4-/[Fe(CN)6]3− couple due to blocking of surface of glassy carbon electrode functionalised by 3,5-Bis(2-ethoxyhexafluoroisopropyl)benzene. K3[Fe(CN)6] concentration 5 mmol dm−3, 0.1 mol dm−3 KCl, scan rate 100 mV s−1.
Work by Bélanger et al. has indicated that deposition of (multilayer) 4-carboxybenzene and
4-nitrophenylbenzene blocks the [Fe(CN)6]2–/[Fe(CN)6]
3− redox couple.14 Therefore, this
suggests that a multilayer of 3,5-bis(2-ethoxyhexafluoroisopropyl)benzene has not been
deposited.

Fluorinated Electrodes
129
4.2 Plasma fluorination
Many examples exist of the plasma mediated surface modification of polymer surfaces.27
Simple gases such as O2, N2, Br2 and SO2 are fragmented in an oscillating magnetic field,
creating a sea of electrons, ions and free radicals. The free radicals react with the polymer
surface leaving a variety of functional groups such as –OH, –NH2, –Br and –SO3H (example
shown in Figure 57). These functional groups are strongly adhered to the carbon backbone of
the organic polymer via covalent bonds. The surface can also be coated with a thin polymer
layer via free radical polymerisation of unsaturated precursors. This method can be used to
coat any material although there must be sufficient adhesion between polymer and substrate if
the coating is to remain attached.
Figure 57|The exposure of common organic polymers such as polyethylene to oxygen plasma adds a variety of oxygen containing functional groups to the surface. A similar result can be achieved via the free radical (plasma) induced polymerisation of an allyl-containing monomer with the desired functionality. In this instance allyl alcohol is polymerised to produce a thin surface layer which adheres strongly to the underlying surface through Van der Waals interactions.
It was proposed that exposure of a metal surface to a plasma may functionalise the surface of
the metal. Two different gases were tested: chlorodifluoromethane (ClCF3, commonly known
as CFC-22) and perfluoropropane (C3F8). CFC-22 plasma consists of fluorine, chlorine and
ClxCFy (x=0 or 1, y=0 to 3) free radicals. The perfluoropropane plasma consists of free
radicals with a broad range of carbon to fluorine ratios. The gold-fluorine bond is generally
Fluorinated Electrodes
130
very unstable and very few pure gold-fluorine compounds exist. For example the enthalpy of
formation of AuF3 is –363.3 kJ mol–1 compared to –933.5 kJ mol–1 for CF4.28 Furthermore, the
calculated enthalpy of reaction of AuF3 with water (to hydrogen fluoride and Au2O3) is –887.4
kJ mol–1.29 Therefore, a fluorine terminated gold surface would almost certainly be unstable
under ambient conditions. This is consistent with X-ray photoelectron spectroscopy studies
on gold surfaces exposed to CF4 plasma.30 On the other hand, gold-carbon bonds are more
common, and—as can be seen from the stability of diazonium functionalised surfaces
described in Section 4.1.1—they are more stable. It was envisaged that these plasmas may
therefore create Au-CF3 or similar terminated surfaces.
4.2.1 Experimental
4.2.1.1 Fluorination
A Diener Electronic PICO Plasma System was used to generate plasmas. Template stripped
gold surfaces (see 3.2.1 for preparation details) were stripped immediately prior to being
placed in the plasma system. The chamber was pumped down to a pressure of approximately
0.1 mbar and then flushed with argon to ensure there was no oxygen, nitrogen or water
vapour in the chamber, all to which would make hydrophilising plasmas. The power was set to
30 W which was found to be the minimum power at which a plasma could be sustained. A
lower power was desirable as it allowed a slower deposition rate resulting in more control over
the deposition. The optimum flow rate for a stable plasma for both gases was found to be 15
cm3 min–1. This resulted in a bright mauve plasma for CFC-22 and a slighter whiter plasma for
perfluoropropane. The freshly exposed gold was then exposed to plasma for 6, 12, 18, 30, 60
or 300 seconds (with only tenths of a minute possible).

Fluorinated Electrodes
131
4.2.1.2 Contact angle measurements
Photographs of water on the fluorinated surfaces were taken with a CCD camera (Phillips
SPC900NC webcam) through a video zoom microscope (Edmund Optics Infinity K2/S Long
Distance Video Lens) at 20× magnification. Contact angles were subsequently measured using
Fta32 2.0 contact angle software (First Ten Ångstroms). All reported contact angle are
advancing contact angles. Four droplets were measured on each of three separate electrodes.
4.2.1.3 Electrochemical characterisation
Electrochemical measurements were performed with a Gamry Reference 600 potentiostat.
Cyclic voltammetry and impedance measurements were performed in 0.1 mol dm–3 NaF
solution (NaF from Sigma-Aldrich, 99.5%) which is a non-specifically adsorbing electrolyte.
Impedance measurements were made at 400 mV versus SCE (where no Faradaic processes
occur). The frequency was scanned from 10 to 1000 Hz and the results fitted to a Randles
circuit in order to extract the interfacial capacitance.
Underpotential deposition of Pb was performed in 0.1 mol dm–3 HNO3 + 12 mmol dm–3
PbNO3 + 10 mmol dm–3 NaCl.31,32
The ferricyanide/ferrocyanide redox couple (0.1 mol dm–3 H2SO4 + 1 mmol dm–3 K3Fe(CN)6)
was used to study the blocking effect of the fluoro coating on electron transfer.

Fluorinated Electrodes
132
4.2.2 Contact angle
Contact angle measurements clearly show that that there is a large increase in hydrophobicity
of the gold surface following exposure to the fluoro compound plasma. In the case of
perfluoropropane, the contact angle increases from 66o on plain template stripped gold to 107o
after 300 seconds of exposure to the plasma. Furthermore, there is a strong trend of
increasing hydrophobicity with plasma exposure time as seen in Figure 58. Of the two gases
used, at long exposure times the perfluoropropane produces the most hydrophobic surfaces,
which is perhaps unsurprising as it has a higher fluorine content than CFC-22.
Figure 58|Contact angle of water on template stripped gold after exposure to CFC-22 and perfluoropropane plasmas. Exposure times varied from 6 s to 300 s. Contact angle measured 10 times on each of three separate gold surfaces. Error bars are ±1 standard deviation.
Rinsing the surfaces with water had no effect on the contact angles. Sonication in acetone for
60 seconds changed the contact angle of the 300 second perfluoropropane plasma surface
from 108o to 103o, suggesting that the surfaces are fairly robust and well bound to the surface.

Fluorinated Electrodes
133
4.2.3 AFM
AFM was used to study the gold surface after fluorination in order to discern if the surface
structure had changed, whether there was polymerisation of the plasma on the surface and
whether there was a substantial increase in the roughness of the surface. Figure 59 shows
CFC-22 coated surfaces after different plasma exposure times. Given the nanometre feature
size, it is clear that there was bulk growth of a polymer on the surface rather than monolayer
formation. There is a clear correlation between the thickness of the layer and the exposure
time.
The surfaces are actually very smooth, and the RMS roughness of the roughest surface is
1.7 nm over 500 nm2. This should be compared with the RMS roughness of a typical polymer
surface, which is in excess of 20 nm.33
Figure 59|AFM images of template stripped gold after various CFC-22 plasma exposure times. Surface area 500×500 nm2.

Fluorinated Electrodes
134
4.2.4 Electrochemistry
Cyclic voltammetry, electrochemical impedance spectroscopy and underpotential deposition
were used to characterise the resulting surfaces in order to find out whether the
electrochemical properties of gold were retained by the modified surfaces. These
measurements also help to indicate whether the surface film is chemically bonded to the gold
or if the film is simply coating the surface.
4.2.4.1 Cyclic voltammetry
The cyclic voltammetry of plasma fluorinated surfaces in 0.1 mol dm-3 NaF solution (Figure
60) showed no additional redox peaks when compared with plain template stripped gold
surfaces. Instead there was a slight reduction in the observed current at all potentials.
Nonetheless, below -0.9 V and above 1.4 V versus RHE, large currents resulting from the
reduction and oxidation of water were still seen on the fluorinated surfaces. This suggests that
the film does not completely block the gold surface and that the film itself shows no redox
activity between -0.9 V and 1.4 V versus RHE. The unfunctionalised gold voltammograms are
similar to those found in the literature.34,35
Figure 60Cyclic voltammograms of plain template stripped gold (...) and template stripped gold after 6 s exposure to PFP plasma (_) in 0.1 mol dm–3 NaF solution. Scan rate 100 mV s–1. Peak 1 is the result of reduction of oxygen in the solution and disappears as the solution is
1 2
3

Fluorinated Electrodes
135
degasssed. It should be noted that peak 2 increases while peak 3 decreases with subsequent scans. This is possibly due to a rearrangement of the template stripped surface.
However, if the electrode was polarised to either –0.9 V or 1.4 V, it began to lose its
hydrophobicity and its water contact angle eventually returned to that of plain gold. This
suggests that the hydrophobic layer had been removed by the physical agitation of the surface
polymer caused by the evolution of gas bubbles.
4.2.4.2 Capacitance
Interfacial capacitance is the fundamental driving force for shape change in electrowetting.
Therefore, it is crucial that any modified electrode used for electrowetting should have a large
interfacial capacitance. Except in the case of perfluoropropane after a 300 second plasma
exposure time, it was found that the capacitance of the gold surface was unaffected by the
presence of the fluoro-film, as shown below in Table 6.
Capacitance / μF cm–2
Fluorination time / s
CFC-22 Perfluoropropane
0 10.7 10.7 6 10.6 11.5 12 10.7 11.7 18 11.5 12.5 30 10.8 11.4 60 11.0 10.8 300 11.2 4.8
Fluorinated Electrodes
136
Table 6|Electrochemical capacitance as a function of gold exposure time to CFC-22 and perfluoropropane plasmas. The error in the measurements is approximately ±10% due to estimation of the surface area of the electrodes.
As the variation in the capacitance is less than the experimental error (except in one case), and
these is no trend in increase or decrease of capacitance for either plasma, this suggests that
there is no change in the surface capacitance. The only significant change is for 300 seconds of
exposure to perfluoropropane plasma, for which the capacitance is more than halved. It is
possible, therefore, that at very long plasma exposure times, a thick enough layer builds up
blocking the surface. As discussed above, this layer can be removed by polarising the surface
at large potentials, after which the capacitance returns to that of plain template stripped gold.
4.2.4.3 Underpotential deposition
Underpotential deposition is a common method for determination of the real surface area of a
metal. The underpotential deposition of lead on polycrystalline gold is well established for this
purpose.31,36 Therefore, this method was attempted in order to quantify the loss—if any—of
gold surface area as a result of the plasma fluorination process. However, as can be seen from
Figure 61, it was found that the first and third deposition peaks were very poorly defined, even
for freshly stripped gold surfaces (without any surface treatment). As the peaks were so small
in comparison to the double layer charging current, attempts to correlate peak area with gold
surface area produced radically variable results and it was not possible to use this technique to
reliably measure gold surface areas.
This result is surprising as freshly stripped gold surfaces should be very clean and hence be
excellent surfaces for under potential deposition. It is unclear as to why this is not the case.
The electrochemistry of template stripped surfaces have not been studied in detail. Unrelated
work conducted by other members of our group has indicated that the cyclic voltammetry of
template stripped platinum in sulphuric acid also has poorly defined peaks, which gradually
become sharper over subsequent cycles. These observations suggest that more work needs to
be done on the electrochemistry of template stripped surfaces.
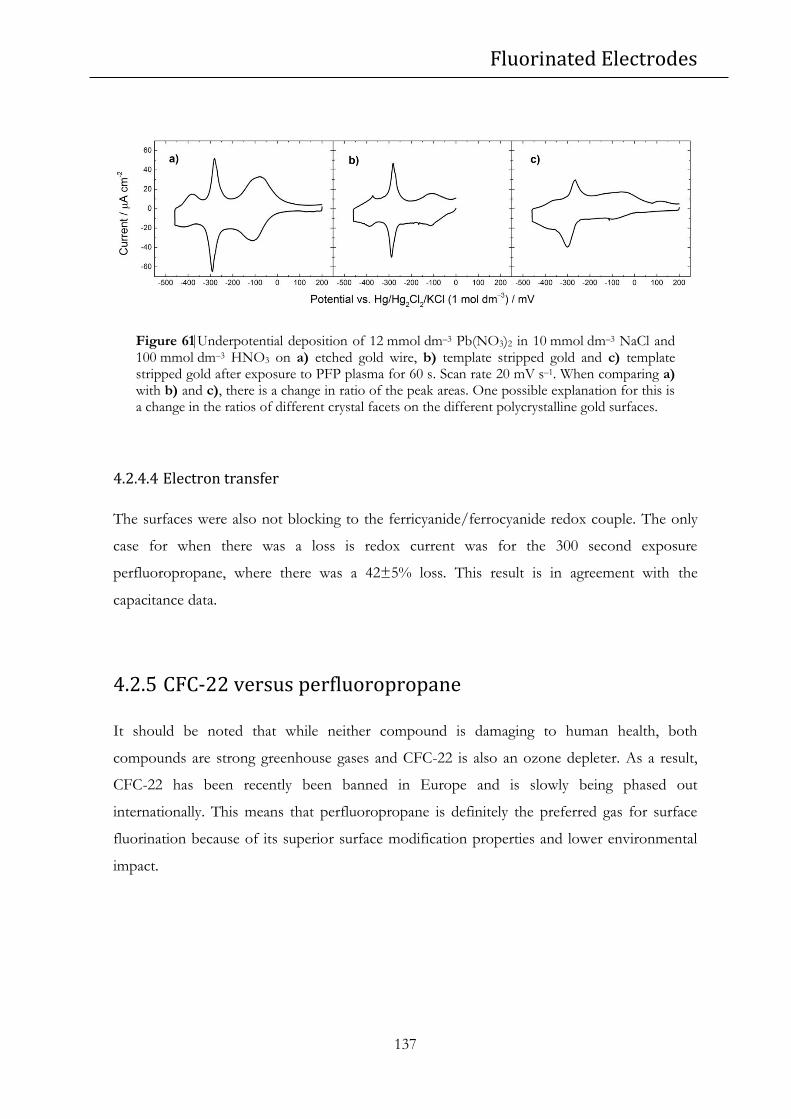
Fluorinated Electrodes
137
Figure 61Underpotential deposition of 12 mmol dm–3 Pb(NO3)2 in 10 mmol dm–3 NaCl and 100 mmol dm–3 HNO3 on a) etched gold wire, b) template stripped gold and c) template stripped gold after exposure to PFP plasma for 60 s. Scan rate 20 mV s–1. When comparing a) with b) and c), there is a change in ratio of the peak areas. One possible explanation for this is a change in the ratios of different crystal facets on the different polycrystalline gold surfaces.
4.2.4.4 Electron transfer
The surfaces were also not blocking to the ferricyanide/ferrocyanide redox couple. The only
case for when there was a loss is redox current was for the 300 second exposure
perfluoropropane, where there was a 42±5% loss. This result is in agreement with the
capacitance data.
4.2.5 CFC-22 versus perfluoropropane
It should be noted that while neither compound is damaging to human health, both
compounds are strong greenhouse gases and CFC-22 is also an ozone depleter. As a result,
CFC-22 has been recently been banned in Europe and is slowly being phased out
internationally. This means that perfluoropropane is definitely the preferred gas for surface
fluorination because of its superior surface modification properties and lower environmental
impact.

Fluorinated Electrodes
138
4.2.6 Discussion
These results clearly show that the exposure of gold to CFC-22 and perfluoropropane plasmas
increases the surface hydrophobicity. AFM micrographs indicate that this is as a result of the
build-up of a polymer layer, several nanometres thick, on the surface. Presumably this polymer
layer is rich in fluorine atoms making it hydrophobic.
Nonetheless, this layer does not substantially alter the electrochemical properties of the
underlying gold surface. The electrode maintains its electrochemical capacitance and does not
block the one electron reduction of the ferricyanide ion.
However, the layer is eventually removed when hydrogen is evolved at –0.9 V or an oxide
layer is grown on the surface at 1.4 V. This suggests that the polymer may be removed by
physical agitation. The surface cannot be rinsed off with water but sonication in acetone does
begin to reduce the hydrophobicity.
All of these observations seem to indicate that the polymer is not strongly adhered to the
surface suggesting that there are no chemical bonds between the surface and the polymer.
AFM images also suggest poor coverage of the surface by the polymer. Nonetheless, there is
no loss at all in the capacitance of the gold. Therefore, it might be that electrolyte solution can
wet underneath the polymer surface. It is only at very long plasma exposure times (300
seconds PFP plasma) that enough polymer forms and parts of the gold surface are no longer
in contact with the solution.
The question remains as to why the polymer has not bonded to the gold surface when phenyl
free radicals formed by the reduction of diazonium ions do bond to gold. One explanation is
that the aryl carbon-gold bond is between gold and an sp2 hybridised carbon rather than an sp3
hybridised carbon as would be the case for a trifluoromethyl group. The latter may be a less
stable bond. Another possible reason is the presence of fluorine radicals; these are incredibly
reactive and mobile making them liable to bond with any carbon atoms nearby, even if this
means breaking a gold-carbon bond first. Returning to the diazonium derived aryl free radical,
this species, when generated, will readily displace a hydrogen atom on a nearby phenyl ring.
This is the mechanism by which multilayer formation occurs during diazonium grafting
(Figure 53). Therefore, it is plausible that fluorine free radicals will ‘undo’ any carbon-gold
bonds which form.

Fluorinated Electrodes
139
4.3 Derivatised conducting polymer coatings
Conductive polymers are organic materials able to conduct electricity. Being carbon-based
materials, they can be designed to exhibit specific properties by the considered selection of
polymer backbone and side groups. Of particular interest to electrowetting substrates is
control of the surface wettability. It has been shown by Schwendeman et al. that the addition
of a perfluorinated carbon chain to the monomer precursor of poly(3,4-
ethylenedioxythiophene), or PEDOT, created a polymer with a water contact angle of 110o.37
This fluorinated version of PEDOT, shown in Figure 62 and referred to as PEDOT-F from
here on, had a conductivity of 65 S cm–1, which is similar to the conductivity of glassy carbon.
Figure 62|Pentadecafluoro-octanoic acid 2,3-dihydro-thieno(3,4-b)(1,4)dioxin-2-ylmethylester, or EDOT-F can be electropolymerised to form the conductive hydrophobic polymer PEDOT-F.37
4.3.1 Experimental
4.3.1.1 EDOT-F synthesis
The preparation of pentadecafluoro-octanoic acid 2,3-dihydro-thieno(3,4-b)(1,4)dioxin-2-
ylmethylester (EDOT-F) is described elsewhere.37 The yield was 67 %. 1H NMR (400 MHz,

Fluorinated Electrodes
140
CDCl3): δ=4.09 (dd, 1H), 4.25 (dd, 1H), 4.48 (m, 1H), 4.62 (m, 2H), 6.39 (s, 2H). NMR shifts
were in accordance with the literature.
4.3.1.2 Electropolymerisation
EDOT-F was coated onto both sputtered gold electrodes and template stripped gold
electrodes (see Sections 5.1.3 and 3.2.1 respectively). In order to make electrical contact to the
gold, a wire was attached to the electrode with conductive epoxy (Circuit Works) which was
itself covered with an insulating epoxy layer. The supporting electrolyte was 0.05 mol dm-3
tetrabutylammonium perchlorate (TBAP) and the EDOT-F concentration was 0.01 mol dm-3
in dry propylene carbonate (PC). Solutions were de-gassed with 99.9992% nitrogen (BOC
gases). The electropolymerisation potential was 0.7 V versus 0.01 mol dm–3 Ag/Ag+. A charge
of 0.1 or 1.5 C cm–2 was allowed to pass.
The choice of PC as a solvent was based on work by Poverenov et al. who showed that PC
produces much smoother PEDOT surfaces than acetonitrile.38
Afterwards the electrodes were rinsed in pure PC followed by de-ionised water and dried
under vacuum.
Annealing of the electrodes was performed in an inert nitrogen atmosphere at 230 oC for 1 h.
4.3.1.3 Template stripping
A detailed overview of template stripping is given in 3.1.1. This technique was used to try to
create flat PEDOT-F surface. After electropolymerisation of the PEDOT-F on a template
stripped gold slide followed by annealing, the deposited film was attached to glass with
Buehler Epo-Thin epoxy. After the epoxy had cured, the PEDOT-F film could be removed
from the gold surface. AFM was used to characterise the roughness of the resulting surface.

Fluorinated Electrodes
141
4.3.2 Contact angle
The water contact angle on the PEDOT-F surface varied dramatically depending on the
electrodeposition and whether the surface was annealed or not, as shown in Table 7.
Electropolymerisation charge passed
0.1 C cm-2
(not annealed) 0.1 C cm-2 (annealed)
1.5 C cm-2 (not annealed)
Contact angle/ degrees 75±5 94±2 146±9
Table 7|Contact angle of water on PEDOT-F surfaces of varying thicknesses. Films were deposited from 0.05 mol dm-3 TBAClO4 and 0.01 mol dm-3 EDOT-F in PC. The electropolymerisation potential was 0.7 V versus Ag/Ag+
reference. Errors indicate ±1 standard deviation.
The superhydrophobic surface (contact angle 146±9o) results from the high surface area due
to the extreme roughness of the electrode shown by the SEM image in Figure 63. This is
explained by the Cassie equation (Equation 2), page 27). The microscale feature size of the
polymer domains is typical of a superhydrophobic surface.39 Almost identical results have
recently been reported by Darmanin and Guittard.40

Fluorinated Electrodes
142
Figure 63|(Top) Photograph of a water droplet on a superhydrophobic PEDOT-F surface with a 156o contact angle. (Bottom) Scanning electron micrograph of the same surface. The high surface area and porosity of the surface dramatically increase the hydrophobicity.
4.3.3 Surface roughness
The RMS roughness of the thin (0.1 C cm–2) films was 31.1 nm after annealing, as measured
by AFM. Template stripping of the thicker (1.5 C cm–2) films was possible. The surface is
shown in Figure 64, and has an RMS roughness of 5.3 nm, suggesting that the polymer does
not mate well with the underlying template. Alternatively, it may deform after being removed
from the template or the surface may become damaged during the stripping, with some of the
polymer remaining on the gold.

Fluorinated Electrodes
143
Figure 64|Template stripped PEDOT-F. 5.3 nm RMS roughness. 17.6 nm peak height.
4.3.4 Conductivity
The bulk conductivity of PEDOT-F could not be reliably measured due to the gold layer
underneath the deposited film. However, the films were electrically conductive. Evidence for
this includes redox activity of the film, which became sky blue when oxidised; the fact that the
surface did not need to be coated with a conductive metal in order to take an SEM image and
also the fact that thick polymer films could be grown.
4.4 Conclusions
A variety of methods have been used to create hydrophobic conducting surfaces. The
compound 3,5-bis(2-ethoxyhexafluoroisopropyl)benzenediazonium tetrafluoroborate, which is
similar to the compound 3,5-di-tert-butylbenzenediazonium tetrafluoroborate made by
Combellas et al., was synthesised.21 It was deposited on gold, glassy carbon and copper
forming a hydrophobic monolayer. The properties of the functionalised surfaces were similar
to the 3,5-di-tert-butylbenzenediazonium surfaces of Combellas et al. despite the fact that they

Fluorinated Electrodes
144
contain hydrophobic trifluoromethyl groups. The surface layer increased the water contact
angle of glassy carbon by 18o and copper by 25o however the contact angle on gold was
unaffected. The functionalised surfaces were only slightly blocking to the one electron
reduction of the ferricyanide ion. Further measurements with AFM and ellipsometry are still
required to confirm that a monolayer has indeed been produced.
The plasma polymerisation of the gases CFC-22 and perfluoropropane was performed on
gold surfaces. The resulting surfaces were characterised with AFM; cyclic voltammetry;
electrochemical impedance measurements of the capacitance; and underpotential deposition
of lead. The plasma appears to form a thin polymer layer which is fairly weakly attracted to the
underlying surface. Nonetheless the surface is stable in water and electrolyte solutions but is
removed by the evolution of oxygen or hydrogen. The polymer layer substantially increases
the hydrophobicity of the gold surface, with 60 seconds of exposure to perfluoropropane gas
resulting in a water contact angle of 109o. Remarkably, at this exposure time the electrode
retains its capacitance and does not block the reduction of ferricyanide. Underpotential
deposition of lead could not accurately determine the surface coverage as the characteristic
lead deposition peaks could not be resolved on template stripped gold—a potential subject for
future investigation. At longer exposure times the surface becomes more hydrophobic but
begins to block electrochemical processes. The thin polymer layer is very smooth when
compared with typical polymer surfaces. The RMS roughness of the surfaces never exceeds
1.7 nm over 500 nm2.
The final method of hydrophobic electrode fabrication was synthesis of PEDOT-F as
originally performed by Schwendeman et al.37 This produces a very rough hydrophobic
surface. It was found that by varying the polymerisation conditions, a superhydrophobic
surface could be made. Depending on the intended application, this may be desirable. In order
to make a smooth surface, template stripping of the polymer was attempted. Whilst there was
a substantial reduction in the roughness of the resulting surface (RMS roughness of 5.3 nm), it
was not as smooth as typical template stripped surfaces.
These methods all have their respective benefits and disadvantages. Therefore, the individual
requirements of a given task should be considered when deciding which type of hydrophobic
conducting surface should be used.

Fluorinated Electrodes
145
4.5 References
1 Maillard, M., Legrand, J. & Berge, B. Two Liquids Wetting and Low Hysteresis Electrowetting on Dielectric Applications. Langmuir 25, 6162-6167, doi:10.1021/la804118y (2009).
2 Dalvi, V. & Rossky, P. Molecular Origins of Fluorocarbon Hydrophobicity. Proceedings of the National Academy of Sciences of the United States of America 107, 13603-13607 (2010).
3 Belanger, D. & Pinson, J. Electrografting: A Powerful Method for Surface Modification. Chemical Society Reviews 40, 3995-4048 (2011).
4 Gorman, C. B., Biebuyck, H. A. & Whitesides, G. M. Control of the Shape of Liquid Lenses on a Modified Gold Surface Using an Applied Electrical Potential across a Self-Assembled Monolayer. Langmuir 11, 2242-2246, doi:10.1021/la00006a063 (1995).
5 Yang, G., Liu, B. & Dong, S. Covalent Modification of Glassy Carbon Electrode during Electrochemical Oxidation Process of 4-aminobenzylphosphonic Acid in Aqueous Solution. Journal of Electroanalytical Chemistry 585, 301-305, doi:10.1016/j.jelechem.2005.09.017 (2005).
6 Andrieux, C. P., Gallardo, I., Saveant, J. M. & Su, K. B. Dissociative Electron-Transfer - Homogeneous and Heterogeneous Reductive Cleavage of the Carbon Halogen Bond in Simple Aliphatic Halides. Journal of the American Chemical Society 108, 638-647 (1986).
7 Chehimi, M., Hallais, G., Matrab, T., Pinson, J. & Podvorica, F. Electro- and Photografting of Carbon or Metal Surfaces by Alkyl Groups. The journal of physical chemistry. C 112, 18559-18565 (2008).
8 Palacin, S., Bureau, C., Charlier, J., Deniau, G. & Mouanda, B. Molecule-to-metal Bonds: Electrografting Polymers on Conducting Surfaces. ChemPhysChem 5, 1469-1481 (2004).
9 Gao, Q. A., Yang, F., Ma, Y. & Yang, X. R. The Modification of Screen-printed Carbon Electrodes with Amino Group and its Application to Construct a H2O2 Biosensor. Electroanalysis 16, 730-735 (2004).
10 Sivanesan, A. & John, S. Highly Sensitive Electrochemical Sensor for Nitric Oxide Using the Self-Assembled Monolayer of 1,8,15,22-Tetraaminophthalocyanatocobalt(II) on Glassy Carbon Electrode. Electroanalysis 22, 639-644 (2010).
11 Wang, L., Huang, P., Bai, J., Wang, H. & Zhang, L. Covalent Modification of a Glassy Carbon Electrode with Penicillamine for Simultaneous Determination of Hydroquinone and Catechol. Mikrochimica acta 158, 151-157 (2007).
12 Bustos, E., Godinez, L., Rangel Reyes, G. & Juaristi, E. Chiral Recognition of Alanine Across Modified Carbon Electrodes with 3,4-dihydroxyphenylalanine. Electrochimica Acta 54, 6445-6450 (2009).
13 Herlem, G., Lakard, B., Herlem, M. & Fahys, B. pH Sensing at Pt Electrode Surfaces Coated with Linear Polyethylenimine from Anodic Polymerization of Ethylenediamine. Journal of the Electrochemical Society 148, E435-E438 (2001).
14 Saby, C., Ortiz, B., Champagne, G. Y. & Bélanger, D. Electrochemical Modification of Glassy Carbon Electrode Using Aromatic Diazonium Salts. 1. Blocking Effect of 4-Nitrophenyl and 4-Carboxyphenyl Groups. Langmuir 13, 6805-6813, doi:10.1021/la961033o (1997).
15 Chehimi, M. M. Aryl Diazonium Salts. (Wiley, 2012).

Fluorinated Electrodes
146
16 Nielsen, L. T. et al. Electrochemical Approach for Constructing a Monolayer of Thiophenolates from Grafted Multilayers of Diaryl Disulfides. Journal of the American Chemical Society 129, 1888-1889, doi:10.1021/ja0682430 (2007).
17 Malmos, K. et al. Using a Hydrazone-Protected Benzenediazonium Salt to Introduce a Near-Monolayer of Benzaldehyde on Glassy Carbon Surfaces. Journal of the American Chemical Society 131, 4928-4936, doi:10.1021/ja809816x (2009).
18 Leroux, Y. R., Fei, H., Noe l, J.-M., Roux, C. m. & Hapiot, P. Efficient Covalent Modification of a Carbon Surface: Use of a Silyl Protecting Group to Form an Active Monolayer. Journal of the American Chemical Society 132, 14039-14041, doi:10.1021/ja106971x (2010).
19 Malmos, K., Iruthayaraj, J., Pedersen, S. U. & Daasbjerg, K. General Approach for Monolayer Formation of Covalently Attached Aryl Groups Through Electrografting of Arylhydrazines. Journal of the American Chemical Society 131, 13926-13927, doi:10.1021/ja905919u (2009).
20 Malmos, K. et al. Grafting of Thin Organic Films by Electrooxidation of Arylhydrazines. The Journal of Physical Chemistry C 115, 13343-13352, doi:10.1021/jp202911d (2011).
21 Combellas, C., Kanoufi, F., Pinson, J. & Podvorica, F. I. Sterically Hindered Diazonium Salts for the Grafting of a Monolayer on Metals. Journal of the American Chemical Society 130, 8576-8577, doi:10.1021/ja8018912 (2008).
22 Jarvis, N. L., Fox, R. B. & Zisman, W. A. in Contact Angle, Wettability, and Adhesion Vol. 43 Advances in Chemistry Ch. 23, 317-331 (AMERICAN CHEMICAL SOCIETY, 1964).
23 Conte-Mayweg, A. et al. Indole, Indazole and Indoline Derivatives as CETP Inhibitors. United States patent (2007).
24 Clayden, J., Greeves, N., Warren, S. & Wothers, P. Organic Chemistry. (Oxford University Press, 2001).
25 Kosynkin, D., Michael Bockman, T. & K. Kochi, J. Fluorinated Biphenyls from Aromatic Arylations with Pentafluorobenzenediazonium and Related Cations. Competition between Arylation and Azo Coupling. Journal of the Chemical Society, Perkin Transactions 2, 2003-2012 (1997).
26 Lyskawa, J. & Bélanger, D. Direct Modification of a Gold Electrode with Aminophenyl Groups by Electrochemical Reduction of in Situ Generated Aminophenyl Monodiazonium Cations. Chemistry of materials 18, 4755-4763, doi:10.1021/cm060752d (2006).
27 Friedrich, J. The Plasma Chemistry of Polymer Surfaces. (Wiley-VCH, 2012). 28 Yaws, C. L. Yaws' Handbook of Thermodynamic Properties for Hydrocarbons and Chemicals.
(Knovel, 2009). 29 Ashcroft, S. J. & Schwarzmann, E. Standard Enthalpy of Formation of Crystalline
Gold(III) Oxide. Journal of the Chemical Society, Faraday Transactions 1: Physical Chemistry in Condensed Phases 68, 1360-1361 (1972).
30 Linn, J. H. & Swartz, W. E. An XPS Study of the Effects of CF4 Plasmas on Gold Surfaces. Appl. Spectrosc. 39, 755-760 (1985).
31 Kirowa-Eisner, E., Bonfil, Y., Tzur, D. & Gileadi, E. Thermodynamics and Kinetics of UPD of Lead on Polycrystalline Silver and Gold. Journal of Electroanalytical Chemistry 552, 171-183, doi:10.1016/s0022-0728(03)00181-5 (2003).

Fluorinated Electrodes
147
32 Herrero, E., Abruna, H. D., Buller, L. J. & Abruña, H. D. Underpotential deposition at single crystal surfaces of Au, Pt, Ag and other materials. Chemical Reviews 101, 1897-1930 (2001).
33 Seo, E. D. Surface Modification Studies by Atomic Force Microscopy for Ar-plasma Treated Polyethylene. Macromolecular Research 10, 291-295 (2002).
34 Ikezawa, Y., Koda, Y., Shibuya, M. & Terashima, H. In Situ FTIR Study of Pyrazine Adsorbed on Au(111), Au(100) and Au(110) Electrodes. Electrochimica Acta 45, 2075-2082 (2000).
35 Lezna, R. O., De Tacconi, N. R., Centeno, S. A. & Arvia, A. J. Adsorption of Phenol on Gold as Studied by Capacitance and Reflectance Measurements. Langmuir 7, 1241-1246, doi:10.1021/la00054a037 (1991).
36 Herrero, E., Abruna, H. D., Buller, L. J. & Abruña, H. D. Underpotential Deposition at Single Crystal Surfaces of Au, Pt, Ag and Other Materials. Chemical Reviews 101, 1897-1930 (2001).
37 Schwendeman, I., Gaupp, C. L., Hancock, J. M., Groenendaal, L. & Reynolds, J. R. Perfluoroalkanoate-Substituted PEDOT for Electrochromic Device Applications. Advanced Functional Materials 13, 541-547, doi:10.1002/adfm.200304372 (2003).
38 Poverenov, E., Li, M., Bitler, A. & Bendikov, M. Major Effect of Electropolymerization Solvent on Morphology and Electrochromic Properties of PEDOT Films. Chemistry of materials 22, 4019-4025, doi:10.1021/cm100561d (2010).
39 Burkarter, E. et al. Superhydrophobic Electrosprayed PTFE. Surface and Coatings Technology 202, 194-198, doi:10.1016/j.surfcoat.2007.05.012 (2007).
40 Darmanin, T. & Guittard, F. Superhydrophobic Fiber Mats by Electrodeposition of Fluorinated Poly(3,4-ethyleneoxythiathiophene). Journal of the American Chemical Society 133, 15627-15634 (2011).

Chapter 5: Electrowetting
148
Chapter 5: Electrowetting
The previous chapters have covered various ideas related to the development of a specific
goal: a stable and reproducible low voltage electrowetting system. This chapter now assesses
these approaches for their electrowetting effectiveness. Furthermore, other variables such as
the liquids and electrolytes used in the electrowetting system are studied as these have not
been looked at in detail previously.
To begin with, the generic experimental setup used to study electrowetting is described in
detail. Then the effect of the different electrodes described in Chapter 3 and Chapter 4 is
covered, with ultra-flat electrodes proving to greatly reduce hysteresis. Next the effect of
changing electrolyte and electrolyte concentration is dealt with. This includes the effect of
using a bulkier electrolyte to stabilise the interface between two immiscible electrolyte
solutions (ITIES) as described in Chapter 2. Finally, different liquid compositions for the
droplet are explored. Somewhat unexpectedly, this was found to have a profound effect on
the electrowetting response.
5.1 Experimental
5.1.1 General experimental setup
The geometry of the cell used for all electrowetting experiments is shown in Figure 65. A
working electrode was mounted on a mobile PTFE stand designed to sit inside a 5 cm × 5 cm
× 5 cm glass cuvette. Also mounted in the stand was an Ag/AgCl wire used as the reference
electrode and a gold counter electrode. The cuvette was fitted with a PTFE lid to reduce
particulate contamination from the atmosphere. The lid contained access for a glass nitrogen
bubbler.
The cuvette was filled with an aqueous electrolyte solution and a droplet was placed on the
working electrode using a micropipette with plasticiser free Gilson tips. The droplet was
approximately 0.5 μL and 0.5-1 mm wide. As the potential of the working electrode was
varied, a photograph of the droplet (640 × 480 pixels) was automatically taken with a CCD
camera (from a Phillips SPC900NC webcam) through a video zoom microscope (Edmund
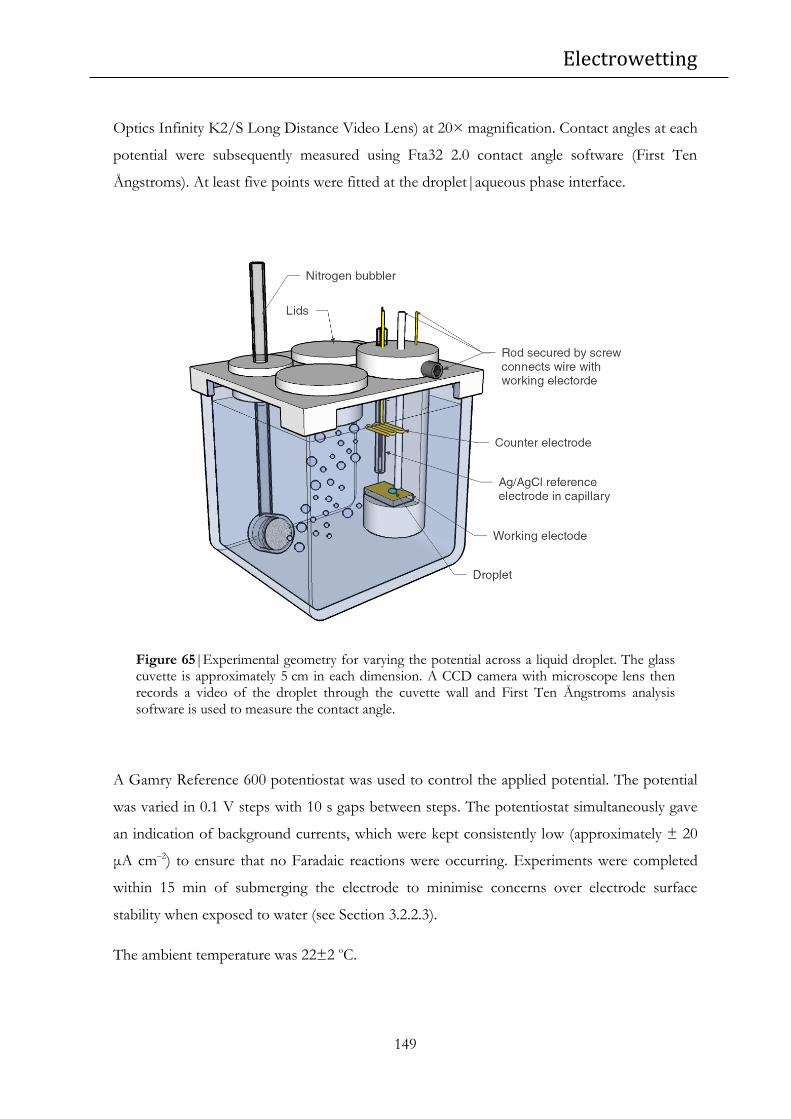
Electrowetting
149
Optics Infinity K2/S Long Distance Video Lens) at 20× magnification. Contact angles at each
potential were subsequently measured using Fta32 2.0 contact angle software (First Ten
Ångstroms). At least five points were fitted at the droplet|aqueous phase interface.
Figure 65|Experimental geometry for varying the potential across a liquid droplet. The glass cuvette is approximately 5 cm in each dimension. A CCD camera with microscope lens then records a video of the droplet through the cuvette wall and First Ten Ångstroms analysis software is used to measure the contact angle.
A Gamry Reference 600 potentiostat was used to control the applied potential. The potential
was varied in 0.1 V steps with 10 s gaps between steps. The potentiostat simultaneously gave
an indication of background currents, which were kept consistently low (approximately ± 20
μA cm–2) to ensure that no Faradaic reactions were occurring. Experiments were completed
within 15 min of submerging the electrode to minimise concerns over electrode surface
stability when exposed to water (see Section 3.2.2.3).
The ambient temperature was 22±2 oC.
Electrowetting
150
5.1.2 Chemicals and glassware
Ultrapure water (resistivity 18.2 MΩ cm) from a Millipore Elix 5 water purification system was
used for all aqueous electrolyte solutions and soaking solutions for glassware. All solutions
were only ever in contact with glass or PTFE, never other plastics, to prevent solution
contamination from surfactants and plasticisers. All electrochemical cells and glassware were
cleaned in the following manner:
1. Soaked in a solution of 0.1 mol dm–3 KMnO4 + 0.18 mol dm–3 H2SO4 for 24 h to
oxidise any organics
2. Rinsed with acidified hydrogen peroxide solution (0.36 mol dm–3 H2SO4 + 0.18
mol dm-3 H2O2) for 1 h
3. Rinsed 6 times with ultrapure water
All electrolytes and solvents were purchased from Sigma-Aldrich and used as received.
Electrolytes were of greater than 99% purity and solvents were of greater than 98% purity.
Purging of oxygen from aqueous solutions with nitrogen had no noticeable effect on
electrowetting and so this practice was considered unnecessary.
Even two ‘immiscible’ liquids have some mutual solubility. Therefore, all aqueous solutions
and organic solutions were equilibrated with one another to prevent the small organic droplet
from dissolving in the surrounding phase.
5.1.3 Sputtered electrodes
To make sputtered electrodes, a 100 nm layer of gold and a 20 nm titanium interlayer were
sputtered onto 1 cm × 2 cm glass rectangles cut from VWR International Super Premium
microscope slides. The titanium interlayer served to facilitate adhesion of gold to glass. The
cleaning procedure for the glass was as follows:
1. Soaked in a solution of 0.1 mol dm–3 potassium permanganate + 0.18 mol dm–3
sulphuric acid for 1-2 h to oxidise any organics
2. Rinsed with acidified hydrogen peroxide solution (0.36 mol dm–3 H2SO4 + 0.18
mol dm-3 H2O2)
3. Rinsed with ultrapure water six times
4. Dried under a stream of nitrogen

Electrowetting
151
5. Dried upright at 110 oC for 5 min
All sputtering was performed using an Emitech K575X sputterer; Emitech TK8859 gold
targets and Emitech TK8879 titanium targets.
5.1.4 Surface tension measurements
Liquid|liquid surface tension measurements were made using the pendant drop method.1
Fitting of the drop shapes was made with Fta32 2.0 contact angle software (First Ten
Ångstroms).
5.2 Ultra-flat surfaces
5.2.1 Metal surfaces
In order to understand the effect of electrode roughness on low voltage electrowetting, a
comparison was made between sputtered gold surfaces (similar to those used by Kornyshev et
al.) and specially prepared template stripped gold surfaces (Section 3.2).2 An ITIES
electrowetting system, again in the style of Kornyshev et al. was used. This consisted of a
droplet containing 0.1 mol dm–3 tetrabutylammonium tetraphenylborate (TBATPB) in
1,2-dichloroethane (DCE) surrounded by 0.01 mol dm–3 LiCl in water.
The potential was cycled from –1 V to 0 V versus an Ag/AgCl reference electrode and back
again with 0.1 V steps, and the contact angle after each step was measured. The results can be
seen in Figure 66. There are several interesting features. The Young contact angles of the two
template stripped and sputtered surfaces were substantially different. This is because one
surface was produced by template stripping and the other by sputtering and so they had very
different roughnesses and perhaps even different surface morphologies. Also, the freshly
exposed template stripped surface did not have the layer of organics on its surface which
adsorbs onto gold over a period of several hours.3,4 The consequence of this is that they had
different surface energies and, as expected, the organic-coated sputtered electrode was more
hydrophobic. However, the most important feature is the greatly reduced hysteresis. The

Electrowetting
152
separation between corresponding contact angles on the forward and reverse scans decreased
from roughly 500 mV on a sputtered surface to 200 mV on the template stripped surface. The
difference in contact angle at the start of the scan compared to at the end of the return scan is
also reduced on the template stripped surface. This difference in hysteresis was seen for all
electrodes tested, with the scans in Figure 66 representing the lowest hysteresis scans
measured for the two different surfaces. As noted above, there was a ten second pause
between steps. After this time period the droplet had stopped changing shape. This ensured
that the hysteresis was not affected by the ‘scan rate’ (although at much faster scan rates the
hysteresis would be different).
Figure 66|Typical electrowetting responses of a 0.1 µL droplet of 0.1 mol dm–3 TBATPB in DCE surrounded by 0.01 mol dm–3 LiCl solution. Comparison between sputtered (rough surface) and template stripped (smooth surface) electrodes illustrating the effect of surface roughness on hysteresis. The droplets started at –1 V and every 10 s the potential was reduced by 0.1 V until it reached 0 V, at which point the scan was reversed. The error on each point is ±2 degrees.
These results clearly suggest that hysteresis is very strongly affected by surface roughness.
What is not clear is whether this is ‘nanoscale roughness’ (template stripped surfaces have an
Electrowetting
153
RMS roughness of 4.5 Ǻ over 80 μm2 compared to 40.3 Ǻ for sputtered surfaces) or if it is in
fact due to ‘microscale roughness’, from dust contamination. Figure 38 on page 94 clearly
shows that the sputtered electrodes are covered in dust even after minimal exposure to the
ambient atmosphere. Most probably the primary contribution to the hysteresis on a sputtered
electrode is the dust, as this is at least two orders of magnitude larger than any inherent feature
of the uncontaminated sputtered electrode. The negative effect of dust on the electrowetting
response is also briefly noted by Beni and Hackwood.5
These results also support the idea that hysteresis is at least partly due to a physical effect and
is not purely the result of some kind of chemical adsorption/desorption of ions on the
electrode surface. This is important for ITIES electrowetting as a chemical effect is potentially
much more difficult to address than a roughness effect, which might require a complete
upheaval of the system. The results also suggest that the re-healing and atomically smooth
surface of mercury is, at least in part, responsible for its low hysteresis electrowetting
response.6-8
Despite this promising result, a perfectly flat or clean electrode is not expected to show zero
hysteresis as there will always be a resistance to change in droplet shape. Examples of such a
resistance include inertial effects, viscosity effects and various attractive forces between the
liquid and electrode. This means that complete elimination of hysteresis is not possible.
Nonetheless, template stripped surfaces were used for all subsequent electrowetting
experiments so as minimise the contribution of roughness or dust on hysteresis.
5.2.2 Carbon surfaces
As detailed in Section 3.4, ultra-flat glassy carbon surfaces were prepared. They were tested as
electrowetting substrates and compared against diamond polished glassy carbon from HTW
GmbH, Germany. The diamond polished glassy carbon was already very smooth, and was
measured by AFM to have an RMS roughness of 56.5 Å.
However, using the ITIES electrowetting system detailed above, as well as other electrolytes
and concentrations, no reversible electrowetting response was seen on either template stripped
carbon or the commercially prepared carbon. No Faradaic currents were seen at the potentials

Electrowetting
154
tested (0.2 V to –1.3 V vs. Ag/AgCl in 0.1 mol dm-3 LiCl). As the potential was made more
negative, the droplet would slowly contract, however, on the reverse scan the contact angle
would not change at all (as if the droplet were completely pinned).
This is the first indication that electrowetting is more complicated than initially expected. As
will be seen later, electrowetting is in fact very sensitive to changes in liquid|solid surface
energies. The theory behind electrowetting (see (Equation 6, page 32) suggests that any
combination of surface energies and surface capacitances will produce a reversible
electrowetting system. However, as was already known with gold and mercury, not all systems
work in this way. This work with carbon supports this result, as conditions which work for
gold surfaces do not work for a glassy carbon surface which has a similar roughness and
capacitance. This is an indication that, while roughness appears to be important, a low
hysteresis electrowetting response is dependent on others factors as well.
5.3 Fluorinated electrodes
Fluorinated, hydrophobic electrodes were prepared in the hope that they would reduce
hysteresis in low voltage electrowetting. This was inspired by work done by Maillard, Legrand
and Berge which indicated that a hydrophobic surface was conducive to a low hysteresis
EWOD system.9
5.3.1 Plasma fluorinated surfaces
The hydrophobicity of gold electrodes was successfully increased by exposure to plasmas of
CFC-22 and perfluoropropane. These surfaces retained their hydrophobicity within the
potentials at which an electrowetting response is seen on plain gold and also retained their
electrochemical capacitance. As can be seen from Figure 67, the contact angle of a DCE
droplet on the surface is lower than for a non-functionalised surface, as expected for a more
hydrophobic surface. As the potential becomes more negative, there is a very large variation in
the contact angle (76o). However, on the reverse scan, there is no return to the original angle.

Electrowetting
155
One possible explanation for this is that the surface is not stable underneath the DCE droplet.
While this may or may not be the case, this behaviour is also seen on unfunctionalised carbon
surfaces, as described previously. Furthermore, as will be seen later, at certain electrolyte
concentrations similar behaviour is seen even on unfunctionalised template stripped gold
surfaces. Therefore, this complete pinning may in fact be the result of a change in the balance
of surface energies; an idea which will be explored in more detail later.
Figure 67|Typical electrowetting response for fluoroplasma functionalised gold surface. A very large change in contact angle is seen initially, with a quick response time. However, the droplet is completely pinned on the return scan. This may be caused by an unstable surface which rearranges underneath the moving droplet.
5.3.2 PEDOT-F coated surfaces
None of the PEDOT-F conducting polymer coated surfaces (reported in Section 4.3) showed
any type of electrowetting behaviour. This may be because they are very rough (31.1 nm RMS

Electrowetting
156
roughness). The surfaces also appeared to be permeable to DCE and other organic solvents,
meaning that the droplet would only remain on the electrode surface for a short time.
Therefore, these surfaces are clearly not suitable for electrowetting.
5.3.3 Diazonium functionalised surfaces
Functionalisation of gold with bulky diazonium species did not have any effect on the surface
hydrophobicity. It is therefore unsurprising that these surfaces behaved similarly to normal
template stripped gold surfaces.
Functionalised carbon surfaces were not effective electrowetting substrates, much like un-
functionalised carbon while copper is not suitable for electrowetting as it is it not
electrochemically inert.
5.3.4 Summary
While it is disappointing that these fluorinated electrodes (and ultra-flat carbon electrodes) did
not reduce pinning as hoped, this in itself is an interesting result. It shows that some of the
principles which apply to EWOD do not apply to this type of electrowetting system.
Furthermore, as these surfaces have very similar capacitances, it suggests that there may be an
important chemical contribution to the surface energies of the electrodedroplet and
electrodeaqueous phase which is of fundamental importance to the electrowetting response.
This is not evident from a theoretical perspective and was therefore somewhat unexpected.

Electrowetting
157
5.4 Electrolyte effects
5.4.1 Organic electrolyte ions
Due to concerns regarding the stability of the ITIES during ITIES electrowetting, an ITIES
with a larger polarisation potential window was used. The tetrabutylammonium
tetraphenylborate (TBATPB) used by Kornyshev et al. was replaced with
bis(triphenylphosphoranylidene)ammonium tetrakis[3,5-bis(trifluoromethyl)phenyl]borate
(BTPPATFPB).2 The aqueous electrolyte, LiCl, was kept unchanged. The resulting
polarisation window was over 700 mV compared to approximately 200 mV for the TBATPB
system, as demonstrated in Section 2.1.
It was found that there was no significant effect in moving from one electrolyte to another.
Within the variation between experiments, there was no difference between the electrowetting
responses of the two systems. This indicates that if the ITIES is indeed unstable when
TBATPB is used, this does not affect the electrowetting response over the timescale of the
electrowetting experiment. Simultaneously, it also shows that the use of BTPPATFPB does
not hinder the electrowetting response. This makes it a good ITIES electrowetting electrolyte
as it reduces concerns over ITIES stability.
The most important conclusion of this result is that ion transfer across the ITIES is not
driving the electrowetting response, as this would be an unstable system over longer time
periods.
Instead, it was found that if the organic electrolyte was removed entirely, there was less
hysteresis than with electrolyte in the droplet. This means that electrowetting with an ITIES is
not essential to the electrowetting response (as suggested by the electrowetting experiments of
Frumkin with mercury surfaces outlined in Section 1.3.1). This was only found to be true on
template stripped surfaces and not on sputtered surfaces. The effect of organic electrolyte
concentration is covered in more detail in Section 5.5.1.

Electrowetting
158
5.4.2 Aqueous electrolyte ions
From a theoretical viewpoint based on the common Gouy-Chapman-Stern model, changing
the aqueous electrolyte is not expected to have significant impact on the electrowetting
response. For example, the capacitance of gold in a NaCl solution should have almost exactly
the same capacitance as an equally concentrated LiCl solution.10 However, this simple change
of electrolyte had an astonishing effect on the electrowetting response. In moving from
0.1 mol dm–3 LiCl with a pure DCE droplet (Figure 69) to 0.1 mol dm–3 NaCl with a pure
DCE droplet, there was a change from a very low hysteresis system to one which is
completely pinned on the return scan (qualitatively similar to that shown in Figure 67).
This was a common result and was seen with several other electrolytes including MgCl2, NaF
and NH4Cl. KCl was the only exception at this concentration; it showed very large hysteresis
but did return to its initial contact angle. If the concentration of these electrolytes was reduced
below 0.1 mol dm–3, the droplet would return to its original contact angle, albeit with a large
amount of hysteresis. As will be seen next, this is consistent with how LiCl concentration
affects the electrowetting response as a large LiCl concentration stops the droplet returning to
its initial contact angle.
There is growing evidence that electrolyte structure at interfaces can vary dramatically even
between apparently similar electrolytes (such as LiCl and NaCl).11-13 Even if different
electrolytes do not change the interfacial capacitance substantially, these varying interfacial
structures may introduce hysteresis; although at the moment there is no detailed explanation
as to why. An idea which is illustrated in Figure 68 and entertained further in Sections 5.5.2
and 5.6.1 is that a thin layer of water may be adsorbed onto the electrode at high potentials
such that when the potential is relaxed, this film remains trapped and the droplet cannot ‘re-
wet’ the surface. It is not unreasonable to think that the electrolyte ions, which have differing
hydration shells for example, could influence such a phenomenon.
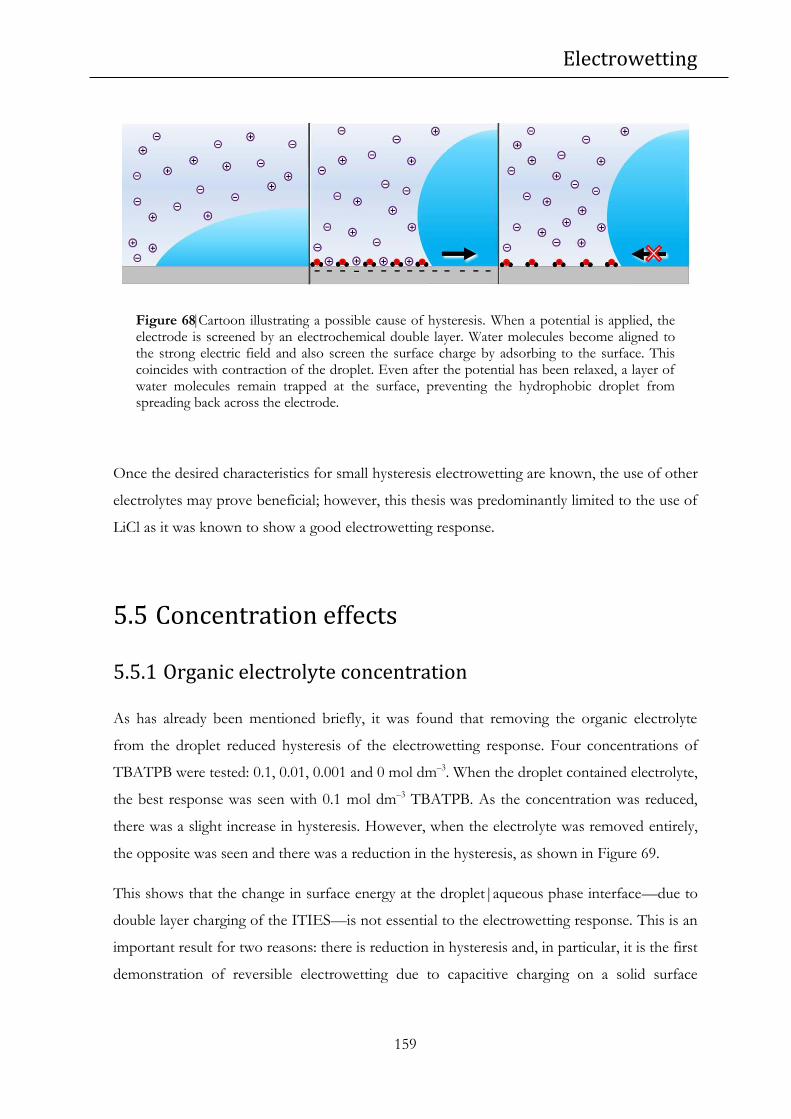
Electrowetting
159
Figure 68Cartoon illustrating a possible cause of hysteresis. When a potential is applied, the electrode is screened by an electrochemical double layer. Water molecules become aligned to the strong electric field and also screen the surface charge by adsorbing to the surface. This coincides with contraction of the droplet. Even after the potential has been relaxed, a layer of water molecules remain trapped at the surface, preventing the hydrophobic droplet from spreading back across the electrode.
Once the desired characteristics for small hysteresis electrowetting are known, the use of other
electrolytes may prove beneficial; however, this thesis was predominantly limited to the use of
LiCl as it was known to show a good electrowetting response.
5.5 Concentration effects
5.5.1 Organic electrolyte concentration
As has already been mentioned briefly, it was found that removing the organic electrolyte
from the droplet reduced hysteresis of the electrowetting response. Four concentrations of
TBATPB were tested: 0.1, 0.01, 0.001 and 0 mol dm–3. When the droplet contained electrolyte,
the best response was seen with 0.1 mol dm–3 TBATPB. As the concentration was reduced,
there was a slight increase in hysteresis. However, when the electrolyte was removed entirely,
the opposite was seen and there was a reduction in the hysteresis, as shown in Figure 69.
This shows that the change in surface energy at the droplet|aqueous phase interface—due to
double layer charging of the ITIES—is not essential to the electrowetting response. This is an
important result for two reasons: there is reduction in hysteresis and, in particular, it is the first
demonstration of reversible electrowetting due to capacitive charging on a solid surface

Electrowetting
160
without an ITIES (to the best of the author’s knowledge). This second result, in many ways, is
not surprising as electrowetting without an ITIES has been known since the time of
Lippmann and Frumkin and theoretically should also occur on solids.6,14 However, this has
always required a liquid metal (namely mercury, gallium or a liquid amalgam).5,7,15
Electrowetting systems on solids have had to employ a different mechanism such as the
oxidation of surface thiols or organic polymers.16-19 Furthermore, such methods must switch
between two extreme contact angles; intermediate contact angles cannot be accessed.
Perhaps the extension of this Frumkin-type electrowetting onto solid surfaces has not been
seen previously because of the sensitivity of the electrowetting response to electrode
composition and morphology. Furthermore, as will be seen in the remainder of the chapter,
electrowetting is even more dependent on the inorganic electrolyte and its concentration and
also on the droplet composition.
Figure 69|Electrowetting response for 0.1 mol dm–3 LiCl aqueous phase with DCE droplet. There is a reduction in hysteresis when TBATPB is removed from the droplet.

Electrowetting
161
5.5.2 Aqueous electrolyte concentration
When compared to the organic electrolyte, the aqueous electrolyte had a much more
substantial effect on the electrowetting response. It was found that the electrowetting
response was noticeably affected by small variations in concentration. Figure 70 shows how as
the LiCl concentration (with a pure DCE droplet) is varied in 0.01 mol dm–3 steps, there is a
clear minimum in hysteresis at 0.10 mol dm–3, with an extra 200 mV of hysteresis at 0.09 and
0.11 mol dm–3. This coincides with a maximum of 42o variation between the maximum and
minimum attainable contact angles. The points represent the smallest amount of hysteresis
and largest change in contact angle seen for each concentration over three repeats. This
representation was chosen because occasionally the system was heavily pinned, perhaps due to
dust contamination, dramatically affecting the average value. Instead it was assumed that the
least pinned response was a more representative measure of the system. Error bars represent
the error due to the finite 100 mV step size and error associated with measuring the contact
angle.
This behaviour is perhaps contrary to what would be expected. Interfacial capacitance
increases with electrolyte concentration, and as energy stored in the capacitor is the driving
force for electrowetting, surely increasing the capacitance should increase the electrowetting
response? To a certain degree this is what was seen: the maximum angle variation increases
from 10o at 0.05 mol dm–3 LiCl to 43o at 0.10 mol dm–3 LiCl. However, beyond this
concentration the angle variation drops off sharply as the hysteresis increases. Again, one
theory for why this happens is that the increasing electrolyte concentration may promote
adhesion of a thin layer of water to the electrode surface. This hydrophilic layer remains
trapped on the surface during the return scan, preventing the droplet from returning to its
original shape.

Electrowetting
162
Figure 70|Change in electrowetting response of a pure DCE droplet as aqueous electrolyte concentration is varied. Template stripped gold was used as the electrode. At 0.10 mol dm–3 LiCl there is a minimum in the hysteresis between forward and reverse scans. This coincides with a maximum in the difference between the lowest and highest attainable contact angles.
5.5.3 Jumping droplet
Using the optimum parameters for electrowetting discussed thus far (template stripped gold,
0.10 mol dm–3 LiCl, 0 mol dm–3 TBATPB, DCE droplet) a ‘jumping droplet’ was studied. As
shown in Figure 71, this involved stepping the potential between –0.1 V and –0.9 V versus
Ag/AgCl, allowing ten seconds between steps. Upon changing the potential from –0.1 V to
–0.9 V, the droplet changed shape much faster than when stepping from –0.9 V to –0.1 V. In
other words, the droplet was found to contract much faster than it would ‘relax’ to a lower
contact angle. The droplet jumped between a contact angle of 93o and 120o within the ±1o
error limit associated with measuring the contact angle. This lasted for over one hundred
pulses, which was the duration of the experiment.

Electrowetting
163
This demonstrates that a significant change in contact angle (27o), for only a 0.8 V change in
potential, is possible. It also shows the reversibility and stability of the system.
Figure 71Electrowetting response of a DCE droplet on template stripped gold surrounded by 0.10 mol dm–3 LiCl solution. As the potential is switched between –0.1 V and –0.9 V, the contact angle jumps between two different values. After over 100 potential pulses the same contact angle variation is seen. The ‘equilibration period’ represents the first cycle before the droplet begins to reproducibly cycle between two values.
5.6 Solvent effects
5.6.1 Different solvents
Inspection of the modified Young equation for electrowetting (Equation 6) shows that there
are two potential independent terms which define the equilibrium contact angle. These are the
Young angle at the PZC and the droplet|aqueous phase surface energy.

Electrowetting
164
((Equation 6)
The Young angle at PZC defines the minimum achievable contact angle while the
droplet|aqueous phase surface energy defines how dramatically the droplet will respond to a
change in potential. That is to say that a low γdw means the droplet responds more to changes
in potential and vice-versa for high γdw. The former case is desirable so that large changes in
contact angle are achievable with small applied potentials. Nonetheless, (Equation 6 gives no
hard and fast indication that certain surface energies will stop the electrowetting response
altogether. Therefore, it was very surprising to find that the choice of solvent for the droplet,
which affects the Young angle and droplet|aqueous phase surface energy, had a dramatic
effect on the electrowetting response.
Using 0.10 mol dm–3 LiCl as the aqueous phase with template stripped gold—the optimised
system for a pure DCE droplet—the effect of droplet composition was tested. In all cases
there was no organic electrolyte in the droplet. It was found that very hydrophobic liquids,
which were highly immiscible with water, were very strongly pinned. These included
cyclohexane and the perfluorinated solvent FC40. Partially water miscible solvents such as
butyl acetate (water solubility: 10 g dm–3) and nitrobenzene (1.9 g dm–3) were less pinned while
n-butanol (73 g dm–3) had a response close to that of DCE, which itself has a water solubility
of 8.7 g dm–3.20 There is clearly a loose trend here that as solvents become more water
miscible, they show less pinning. The trend is not perfect as the most water miscible solvent,
n-butanol, does not exhibit the least pinning; but it must be noted that these systems were not
optimised for the LiCl concentration, something which was shown to have a dramatic effect
on hysteresis. Furthermore, n-butanol is less dense than water and its buoyancy may
exacerbate pinning as there is an additional force pulling the droplet off the surface.
More specifically, the pinning seen with the very hydrophobic droplets was not pinning in the
forward direction (from small to large contact angle) but rather pinning on the return scan,
showing that the droplet was reluctant to spread back across the surface which it had just
previously wetted. This, along with the electrolyte and concentration dependence on
hysteresis, further supports the suggestion that the increased pinning may in fact result from a

Electrowetting
165
thin hydrophilic layer of water which remains adsorbed to the electrode surface even after the
potential has been relaxed.
Alternatively, it is reasonable to assume that the more water miscible solvents have lower
droplet|aqueous phase surface energies owing to more favourable interactions between the
component molecules and this may affect the electrowetting response. However, if we assume
that the change in capacitive energy for a given potential step is independent of droplet
composition, changes in droplet|aqueous phase surface energy should only serve to increase
the change in contact angle between given steps (based on (Equation 6). This in itself would
not reduce the hysteresis seen between forward and reverse scans. Even for the heavily pinned
droplets, there was always a substantial change in contact angle on the forward scan.
These observations initiated the search for a solvent which might reduce pinning. The desired
solvent characteristics were high water miscibility (although, of course, not complete
miscibility), a density greater than that of water and a low viscosity. Density is important for
two reasons. Firstly, although low density solvent droplets are able to adhere to the electrode
surface—as surface tension forces can overcome the buoyancy—it was often found to be
problematic to do this. Secondly, as has already been mentioned, the buoyancy pushes the
droplet upwards which may increase hysteresis. This is because a decrease in the droplet
contact angle coincides with a lowering of the droplet’s centre of mass which must work
against gravity. Similarly, viscosity is also believed to increase hysteresis as a result of inertial
resistance to shape change.21
One of the first solvents tested was 3-chloro-1-propanol. It showed a remarkable
electrowetting response, with no hysteresis within the error of the contact angle measurement.
However, this came with one very significant problem: the response was not within the
potential window imposed by the onset of Faradaic reactions. The electrowetting of
3-chloro-1-propanol is discussed in detail in the next section.

Electrowetting
166
5.6.2 Electrowetting of 3-chloro-1-propanol
A search of the literature suggests that 3-chloro-1-propanol is mainly used as a reactant in
organic synthesis: almost one thousand different reactions of 3-chloro-1-propanol can be
found on the chemical search engine Reaxys. Conversely, there is very little reliable data on its
physical properties beyond its density and boiling point. In fact, 3-chloro-1-propanol was
chosen based in its predicted water solubility of 147 g L–1.22 In reality, it was found that it was
completely miscible with water in all proportions. However, these mixtures exhibited fairly
unusual salting-out behaviour. The addition of 0.10 mol dm–3 LiCl (or NaCl) would cause >20
volume per cent mixtures to separate into two phases. This behaviour is reported for some
other solvents such as isopropyl alcohol, 1,4-dioxane and glycerol.23,24 However, for these
solvents this phase separation only occurs at very high salt concentrations (>1 mol dm–3).
Figure 72 shows the electrowetting response of a water:3-chloro-1-propanol 70:30 volume per
cent system. The aqueous phase contains 0.16 mol dm–3 LiCl which was the optimum
concentration for this system.
It is worth noting that even for this system, which shows no hysteresis with 0.16 mol dm–3
LiCl, the response is very sensitive to the electrolyte concentration as is the case for a DCE
droplet. Remarkably, this is true to the extent that at 0.12 mol dm–3 LiCl and at 0.20 mol dm–3
LiCl there is a gap of over 700 mV between forward and reverse scans (Figure 72).

Electrowetting
167
Figure 72|Electrowetting response of 3-chloro-1-propanol with an aqueous phase of LiCl of varying concentrations. At 0.12 mol dm–3 and 0.20 mol dm–3 LiCl the system is heavily pinned. Remarkably, however, at 0.16 mol dm–3 LiCl the pinning disappears. The contact angles at low values can only be read to an accuracy of ±2 degrees. Therefore, at 0.16 mol dm–3 LiCl there is almost no hysteresis within the error of the contact angle measurements.
However, as has been mentioned, there is a very significant problem with this system, which is
the onset of a Faradaic reaction at -600 mV. This is the result of hydrogen evolution, which
has been shifted to higher potentials. This is because the 3-chloro-1-propanol solution was
mildly acidic, something which is not immediately apparent from its molecular structure. In
fact, the electronegativity of the chlorine atom significantly increases the dissociation constant
of the hydroxyl group in water. This is confirmed by the nuclear magnetic resonance study of
various alcohols by Lee and Demchuck.25 The pH of the solution was measured to be between
3 and 4 (pKa of 3-chloro-1-propanol between 3.45 and 4.45). As shown in Figure 73, this
reaction was stopped by the addition of 0.05 mol dm–3 NaOH, resulting in a shift to pH >11.
This suggested that the reaction was indeed proton reduction and not reduction of the
3-chloro-1-propanol itself.

Electrowetting
168
Figure 73|Cyclic voltammetry of 0.1 mol dm–3 LiCl saturated with 3-chloro-1-propanol. The addition of 0.05 mol dm–3 NaOH delays the onset of a Faradaic reaction, suggesting that the current is due to the high proton concentration in solution brought about by the Brønsted acidity of 3-chloro-1-propanol.
This provokes the obvious question of whether the low hysteresis is a result of the Faradaic
processes, perhaps though agitation of the surface or through some additional pseudo-
capacitance. The first attempt to try to answer this was to use LiOH or NaOH together with
LiCl as the aqueous phase electrolyte. Figure 74 shows the electrowetting response for the
3-chloro-1-propanol system with an aqueous phase of 0.05 mol dm–3 NaOH and 0.10 mol
dm–3 LiCl. The response is comparable with that for DCE with 0.10 mol dm–3 LiCl in that
there is a 200 mV gap between forward and reverse scans. Similar or worse results are seen
with LiOH. Of course, this is much more pinned than the system with no NaOH. While this
is a disappointing result—ideally there would be no hysteresis—it still doesn’t show that the
low hysteresis is a result of the Faradaic reaction. This is because in adding the NaOH we
have radically changed the system. The clearest indication of this is that the Young contact
angle has changed from 20o to 67o and so a fair comparison between the two experiments
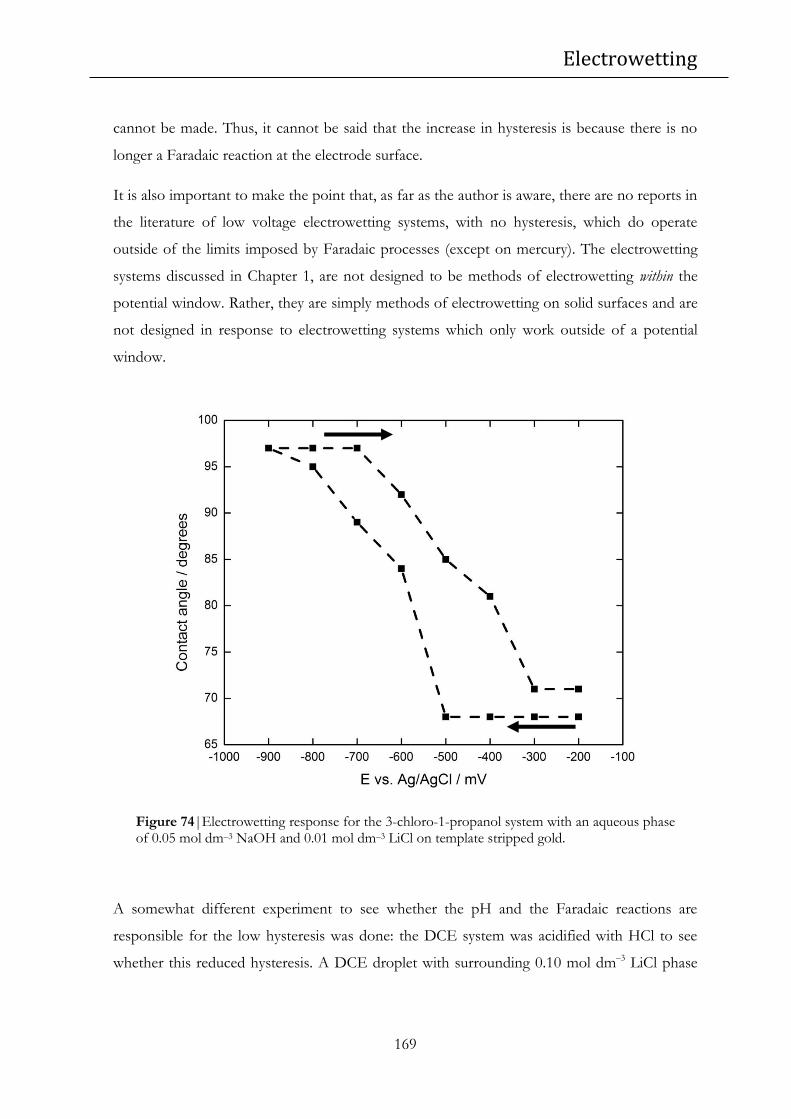
Electrowetting
169
cannot be made. Thus, it cannot be said that the increase in hysteresis is because there is no
longer a Faradaic reaction at the electrode surface.
It is also important to make the point that, as far as the author is aware, there are no reports in
the literature of low voltage electrowetting systems, with no hysteresis, which do operate
outside of the limits imposed by Faradaic processes (except on mercury). The electrowetting
systems discussed in Chapter 1, are not designed to be methods of electrowetting within the
potential window. Rather, they are simply methods of electrowetting on solid surfaces and are
not designed in response to electrowetting systems which only work outside of a potential
window.
Figure 74|Electrowetting response for the 3-chloro-1-propanol system with an aqueous phase of 0.05 mol dm–3 NaOH and 0.01 mol dm–3 LiCl on template stripped gold.
A somewhat different experiment to see whether the pH and the Faradaic reactions are
responsible for the low hysteresis was done: the DCE system was acidified with HCl to see
whether this reduced hysteresis. A DCE droplet with surrounding 0.10 mol dm–3 LiCl phase

Electrowetting
170
was used. At pH 4 to 2 the droplet was completely pinned and showed no electrowetting
response whatsoever, despite the presence of a background Faradaic current. This would
suggest that Faradaic processes do not necessarily promote electrowetting.
Finally, another noteworthy result involving 3-chloro-1-propanol is shown in Figure 75. It
shows the electrowetting response when the droplet is composed of a mixture of DCE and
3-chloro-1-propanol. It is noteworthy because it is the only example of electrowetting on a
solid surface at potentials positive of the PZC. Usually there is no electrowetting seen in this
region, despite the fact that the electrowetting equation suggests that there should be. This is
perhaps a further indication that there is something special about the interfacial properties of
3-chloro-1-propanol. As nothing is usually seen at these potentials, the electrowetting
response must therefore be weaker; however, properties of 3-chloro-1-propanol/DCE are so
conducive to electrowetting that a response is still seen in this instance. This would also
support the idea that the low hysteresis response of 3-chloro-1-propanol is not due to
Faradaic processes, which only occur below –600 mV. Another interesting observation is that
at low 3-chloro-1-propanol concentrations, with a DCE droplet, the electrowetting response is
very poor even though there is a background Faradaic current, which also suggests the
Faradaic current is not a driving force for electrowetting.
Figure 75|Electrowetting response of a mixed DCE:3-chloro-1-propanol 1:3 droplet, with 0.15 dm–3 LiCl in the aqueous phase. This is the only known example of low voltage electrowetting at positive potentials on a solid (rather than mercury) surface.

Electrowetting
171
The next sections attempt to create a system with similar properties to the 3-chloro-1-
propanol system. Namely, similar Young contact angle, water miscibility and droplet|aqueous
phase surface energy but without the acidity of 3-chloro-1-propanol.
5.6.3 Salting out with other solvents
As discussed above, 3-chloro-1-propanol mixed with water requires the addition of a salt to
cause phase separation. This indicates that there is a strong enthalpic interaction between the
two liquids. This, in turn, may help the droplet spread across the water-coated electrode.
However, it was not possible to find another solvent which salted out at similar salt
concentrations. For instance, isopropyl alcohol salted out only when the aqueous phase was
close to saturation with NaCl.23,24
An electrowetting system with isopropyl alcohol and NaCl saturated water was tested. The
normal electrowetting geometry had to be inverted due to the buoyancy of the isopropyl
alcohol, which constituted the surrounding phase while the droplet consisted of NaCl
saturated water. It was found that upon equilibrating the system, enough NaCl dissolved in the
isopropyl alcohol to enable it to conduct a small current. However, the system showed a large
amount of pinning as expected for such high salt concentrations. On gold the droplet Young
angle was 33o and would completely wet the surface at -1 V. On carbon the droplet angle
decreased from 55o to 27o.
5.6.4 Mixed solvents
It was not possible to find another pure solvent which salted out at low salt concentrations,
the way 3-chloro-1-propanol does. Density is an essential parameter for the solvent and pure
hydrocarbons are all less dense than water. To be denser than water, they must contain
different atoms, such as a halide or oxygen. However, the physical properties of these halide
containing molecules are generally poorly classified because, excluding a select few, they are
not used as solvents. This also makes them expensive to use in the quantities needed for
electrowetting (10-100 ml per experiment). Therefore, mixtures of dense solvents with

Electrowetting
172
hydrophilic solvents were prepared in the hope that they would mimic the properties of 3-
chloro-1-propanol.
The three solvent combinations tested were 1:1 mixtures of DCE/propanol, 1-butanol/
1,3-butanediol and 1-butanol/propylene carbonate. These were all equilibrated with an
aqueous solution of 0.10 mol dm–3 LiCl. DCE/propanol had a very large Young contact angle
of 116o and was heavily pinned. It had a very low liquid|liquid surface energy of 11±2 mJ m–2.
This is much lower than the liquid|liquid surface energy of pure DCE with water (28.7
mJ m-2) indicating that the presence of 1-propanol did reduce the liquid|liquid surface energy
as intended.26 Although this is still not as low as the liquid|liquid surface energy of the 3-
chloro-1-propanol system (measured to be 6.0±0.5 mJ m-2) this suggests that low liquid|liquid
surface energy is not the sole reason for the remarkable electrowetting properties of 3-chloro-
1-propanol. The next solvent mixture, 1-butanol/1,3-butanediol had a very low Young contact
angle. In fact, it completely wet the gold electrode surface. After the initial scan, it cycled
between a contact angle of 30o and 88o with a lot of hysteresis. This seems to suggest that a
low Young angle is also not the sole reason for the low hysteresis seen with 3-chloro-1-
propanol. Finally, 1-butanol/propylene carbonate had a Young angle of 70o and was also
heavily pinned.
These mixtures were unable to capture the electrowetting performance of 3-chloro-1-propanol
despite sharing some of its properties such as its low Young contact angle or low liquid|liquid
surface energy. Nonetheless, this seems to be a sensible method for trying to mimic 3-chloro-
1-propanol more closely in the future, perhaps resulting in the discovery of a low hysteresis
electrowetting system. It is also important to note that these systems were not necessarily
optimised for LiCl concentration, which may have greatly affected the electrowetting.
5.7 Conclusions
The first part of this chapter covered the effects of using specially designed electrodes for
electrowetting. These electrodes were ultra-flat template stripped gold, ultra-flat glassy carbon,
fluoro-plasma treated gold, diazonium functionalised gold and PEDOT-F. Of these methods,
only template stripped gold was found to reduce hysteresis in electrowetting, while the other

Electrowetting
173
surfaces increased it. This suggests that a low surface energy electrode will not necessarily
reduce pinning, as has been found for EWOD. Nonetheless, the unexpected finding that
concentration and droplet composition have a dramatic effect on pinning means that each
electrowetting system must be optimised for electrolyte concentration. When a deeper
understanding of concentration and surface energy effects has been developed, these methods
for tuning the hydrophobicity of a conducting surface may yet prove to be useful.
On the other hand, template stripped electrodes proved to be a valuable development. They
clearly reduce the pinning of a DCE droplet when compared with sputtered gold electrodes as
used previously by Kornyshev et al.2 This is a simple and convenient method for electrode
preparation which reduces concern over electrode cleanliness and roughness, allowing the
effect of other variables to be studied more independently.
Of these other variables, the nature of the electrolytes used for electrowetting proved to have
an unpredictable effect. The use of a more bulky electrolyte in the droplet, to stabilise the
aqueous phase|droplet interface, had no effect on the electrowetting response; making it a
good choice of organic electrolyte as it ensures that there is no ion transfer from the droplet
to the surrounding solution. In contrast, changing the inorganic electrolyte was found to
significantly increase pinning. There is currently no explanation for this, making it an
interesting avenue for future investigation.
Also of significance was the concentration of the electrolytes used. This proved to be very
important in reducing pinning and increasing the maximum achievable contact angle change.
It was shown that the electrolyte could be made both too dilute and too concentrated, with
the ideal concentration for LiCl with DCE being 0.10 mol dm–3. Furthermore, it was shown
that if a hydrophobic solvent was used as the droplet, the contact angle would not decrease on
the return scan, while more water miscible solvents did return. These results led to speculation
that one origin of hysteresis is the adsorption of a film of water at the electrode surface as the
droplet contracts. As it tries to spread on the return scan, it cannot as this hydrophilic layer
does not want to come off the surface even when the potential scan is reversed. This would
explain why more hydrophobic droplets are reluctant to return to their original configurations.
It is also feasible that with certain electrolytes, and in particular at high electrolyte
concentrations, this layer of water is more strongly adhered to the surface, explaining the

Electrowetting
174
concentration and electrolyte dependence. At this stage this is pure speculation and might
form the basis of future investigations.
Given the hypothesis which has just been outlined, it was proposed that less hydrophobic
solvents would not be so strongly repelled by this water film. As a result the highly water
miscible solvent 3-chloro-1-propanol was used. This was found to be immiscible with water
only in the presence of an electrolyte. It also showed no hysteresis when used in the droplet.
Unfortunately, it is mildly acidic meaning that the Faradaic reduction of protons in the
solution was shifted to higher potentials such that the potential of the reaction coincided with
the potential of electrowetting. This means the system was unsustainable over long time
periods. Other solvents or solvent mixtures were unable to recreate the electrowetting
response of 3-chloro-1-propanol. This means that there is still a question as to whether the
low hysteresis response of the 3-chloro-1-propanol is due to the Faradaic reactions or not,
although acidification of DCE systems to a similar pH did not reduce hysteresis.
The one thing that is clear is that electrowetting is far more complicated than the relatively
simple Young-Laplace equation suggests. Although some ambiguity remains, it seems that the
relative surface energies of the three interfaces in an electrowetting system play a role in the
hysteresis and reproducibility of an electrowetting system. On top of this there are additional
factors influencing droplet relaxation which have not been previously reported or considered.
Despite these complications, substantial progress has been made both in establishing which
parameters are important for an electrowetting system and in finding a system with such
parameters. The most effective electrowetting system, using the solvent 3-chloro-1-propanol
offered fantastic performance; however, it is not a viable solution due to Faradaic processes.
Whether the Faradaic processes and excellent performance are in fact related could not be
determined; nevertheless, this result justifies further investigation into low voltage
electrowetting, providing hope that a low voltage, hysteresis-free system is possible.

Electrowetting
175
5.8 References
1 Adamson, A. W. & Gast, A. P. Physical Chemistry of Surfaces. 6th edn, (John Wiley & Sons, Inc., 1997).
2 Kornyshev, A. A. et al. Ultra-low-voltage Electrowetting. The Journal of Physical Chemistry C 114, 14885-14890, doi:10.1021/jp101051e (2010).
3 Chai, L. & Klein, J. Large Area, Molecularly Smooth (0.2 nm RMS) Gold Films for Surface Forces and Other Studies. Langmuir 23, 7777-7783 (2007).
4 Zisman, W. A. in Contact Angle, Wettability, and Adhesion Vol. 43 Advances in Chemistry Ch. 1, 1-51 (American Chemical Society, 1964).
5 Beni, G. & Hackwood, S. Electro-wetting Displays. Applied physics letters 38, 207-209 (1980).
6 Frumkin, A. N., Kabanow, B. & Nekrasow, M. Kapillarelektrische Erscheinungen und Benetzung von Metallen durch Elektrolytlösungen. I. Phys. Z. Sovijetunion 1, 255-284 (1932).
7 Ivošević, N. & Žutić, V. Spreading and Detachment of Organic Droplets at an Electrified Interface. Langmuir 14, 231-234, doi:10.1021/la970986z (1998).
8 Cousens, N. E. A. Shape Changing Liquid Droplets, Imperial College London, (2009). 9 Maillard, M., Legrand, J. & Berge, B. Two Liquids Wetting and Low Hysteresis
Electrowetting on Dielectric Applications. Langmuir 25, 6162-6167, doi:10.1021/la804118y (2009).
10 Israelachvili, J. N. Intermolecular and Surface Forces. 2nd edn, (Academic Press). 11 Bostrom, M., Kunz, W. & Ninham, B. W. Hofmeister Effects in Surface Tension of
Aqueous Electrolyte Solution. Langmuir 21, 2619-2623 (2005). 12 Horinek, D., Herz, A., Vrbka, L., Sedlmeier, F. & Mamatkulov, S. Specific Ion
Adsorption at the Air/water Interface: The Role of Hydrophobic Solvation. Chemical Physics Letters 479, 173-183 (2009).
13 Bresme, F., Chacon, E., Tarazona, P. & Wynveen, A. The Structure of Ionic Aqueous Solutions at Interfaces: An Intrinsic Structure Analysis. The Journal of chemical physics 137 (2012).
14 Lippmann, G. Relation entre les Phénomènes Électriques et Capillaires. Ann. Chim. Phys. 5, 494-549 (1875).
15 Beni, G., Hackwood, S. & Jackel, J. L. Continuos Electro-wetting Effect. Applied physics letters 40, 912-914 (1982).
16 Sondag-Huethorst, J. A. M. & Fokkink, L. G. J. Potential-dependent Wetting of Octadecanethiol-modified Polycrystalline Gold Electrodes. Langmuir 8, 2560-2566, doi:10.1021/la00046a033 (1992).
17 Sondag-Huethorst, J. A. M. & Fokkink, L. G. J. Potential-Dependent Wetting of Electroactive Ferrocene-Terminated Alkanethiolate Monolayers on Gold. Langmuir 10, 4380-4387, doi:10.1021/la00023a074 (1994).
18 Gorman, C. B., Biebuyck, H. A. & Whitesides, G. M. Control of the Shape of Liquid Lenses on a Modified Gold Surface Using an Applied Electrical Potential across a Self-Assembled Monolayer. Langmuir 11, 2242-2246, doi:10.1021/la00006a063 (1995).
19 Xu, L., Chen, W., Mulchandani, A. & Yan, Y. Reversible Conversion of Conducting Polymer Films from Superhydrophobic to Superhydrophilic. Angewandte Chemie (International ed.) 44, 6009-6012 (2005).
20 Knovel Critical Tables. 2nd edn, (Knovel, 2008).

Electrowetting
176
21 Marinescu, M., Urbakh, M., Barnea, T., Kucernak, A. R. & Kornyshev, A. A. Electrowetting Dynamics Facilitated by Pulsing. The Journal of Physical Chemistry C 114, 22558-22565, doi:10.1021/jp1052634 (2010).
22 Estimation Programs Interface SuiteTM for Microsoft Windows v. 4.10 (United States Environmental Protection Agency, Washington, DC, USA, 2011).
23 Raridon, R. J. & Kraus, K. A. Properties of Organic-Water Mixtures .4. Effect of Various Salts on Miscibility Gap of Glycerol Triacetate-Water System. Journal of colloid science 20, 1000-& (1965).
24 Tabata, M., Kumamoto, M. & Nishimoto, J. Chemical-properties of Water-miscible Solvents Separated by Salting-Out and their Application to Solvent-Extraction. Analytical Sciences 10, 383-388 (1994).
25 Lee, D. G. & Demchuk, K. J. A C-13 Nuclear-Magnetic-Resonance Study of the Basicities of Aliphatic-Alcohols. Canadian journal of chemistry 65, 1769-1774 (1987).
26 Trojánek, A. n., Lhotský, A., Mareček, V. r. & Samec, Z. Limited Agreement between the Interfacial Tension and Differential Capacity Data for the Polarised Water|1,2-dichloroethane Interface. Journal of Electroanalytical Chemistry 565, 243-250, doi:10.1016/j.jelechem.2003.10.018 (2004).

Chapter 6: Conclusions
177
Chapter 6: Conclusions
6.1 General conclusions
This thesis has shown that one of the difficulties in studying low voltage electrowetting
systems is the systematic isolation of individual variables. In trying to change just the electrode
material, the capacitance, surface tensions and morphology all change at the same time. In
changing the electrolyte again the capacitance and surface energies change together. In
changing the composition of the droplet, three surface energies change at once while the
density also changes and so on and so forth. This makes it exceedingly difficult, if not
impossible, to systematically isolate individual variables—one of the tenets of good scientific
practice. On top of this there is the unpredictability of studying pinned systems, which
inherently introduce substantial variation between experiments. Even so, now that there is a
better understanding of the important factors in low voltage electrowetting, coupled with an
appreciation of its previously unexpected complexity, future work should attempt a more
vigorous analysis of the effect of factors such as liquid|liquid surface energy which were only
touched upon in the final stages of this thesis. This way, it will be possible to elucidate which
properties of a system are responsible for both a good and not-so-good electrowetting
response.
6.2 Electrowetting devices
A hysteresis-free electrowetting system using 3-chloro-1-propanol was shown. This had the
performance required for a low voltage electrowetting lens. However, this did not operate
within the potential limits imposed by the onset of Faradaic reactions, meaning that the
system cannot be stable in the long term. Nonetheless, this suggests that a low voltage
electrowetting system, suitable for an electrowetting lens, may still be possible.
However, a hysteresis free system is not essential to other devices such as certain displays and
switches. These only require an on/off response corresponding to two extreme contact angles.
Such a system was demonstrated in Section 5.5.3, where the contact angle was cycled between
93o and 120o continuously. Nonetheless, a similar system would need to be shown on a greater
variety of electrode surfaces as template stripped gold is both impractical for a device and not

Conclusions
178
stable in water for long periods. Therefore, an improved understanding of why materials such
as glassy carbon do not show an electrowetting response would be an important step in the
development of a stable electrowetting device.
6.3 Future work
While almost every topic covered in this thesis has potential for expansion and more detailed
investigation, one area is clearly the most interesting and important with regard to
electrowetting—droplet composition. Future work would almost certainly continue the search
for a solvent with similar properties to 3-chloro-1-propanol, such as density and surface
energy, but which is not electrochemically active above –1 V versus Ag/AgCl. This would
answer the question as to whether the effectiveness of 3-chloro-1-propanol is a result of
Faradaic processes. If this is not the case, then a hysteresis free electrowetting system would
have been found.
No attempt was made in this thesis to fit electrowetting results to the predictions of the
electrowetting model of Monroe, Urbakh and Kornyshev. This is because this model does not
accommodate for the effects of pinning and dynamics. As pinning and dynamics currently
dominate, the theory is not applicable, however, if a non-pinning system were found, then the
model could be applied. Alternatively, the model could be applied to a mercury system or the
3-chloro-1-propanol system although this is not at equilibrium due to Faradaic processes.
Investigation of mercury electrowetting systems may also be interesting as the absolute values
of the surface energies may provide clues as to why mercury is hysteresis-free. It would also be
interesting to see whether pinning could be induced on mercury with certain solvent and
electrolyte combinations, thus showing that effects of concentration, electrolyte and droplet
solvent are a general result not limited to gold surfaces. This in turn could help explain the
origin of these effects.


