ULTIMATE STRENGTH OF BEAMS VQTH
REINFORCED RECTANGULAR OPENInGS
by
Judith Gloede Congdon BA BSc
A thesis submitted to the Faculty of Graduate Studies and Research in partial fulfillment of the requirements for the degree of Master of Engineering
Department of Civil Engineering and Applied Mechanics McGill University Montreal PQ July 1969
Judith G10ede Congdon 1970
ii
SUMMARY
Results are presented for tests to destruction performed
as part of this study on one IOWF21 and ten 14WF38 beams
each containing a single rectangular opening in the web The
openings in all but one of the beams were reinforced with
straight horizontal reinforcing plates welded above and below
the opening on each side of the web The variables investishy
gated include moment to shear ratiO opening depth to beam
depth ratiO opening length to depth ratio and reinforcing
size
An ultimate strength analysis is offered based on failure
by development of a four hinge mechanism the hinges occurring
at cross-sections at the edges of the opening A simple to
use approximate method of solution is also offered and a proshy
cedure for design is suggested
The experimental results show the theory to be reasonably
accurate at high moment to shear ratios but conservative at
high values of shear The approximate method is less conshy
servative in this region
iii
ACKNOVlLEDGEMENTS
The writer wishes to express her appreciation to those
who provided assistance during the course of this study In
particular thanks are due to
Dr RGRedwood who acted as research director and
provided constant guidance and encouragement during the
course of this investigation
Messrs B Cockayne and G Matsell and the remainder of
the technical staff who helped in the fabrication and testing
of the test beams and in the preparation of tensile coupons
The staff of the Department of Metallurgical Engineershy
ing who generously offered access to the 20k Instron Testing
Machine for the testing of tensile coupons
The writer t s husband Vayne who provided considerable
help and encouragement and who also typed this manuscript
This investigation was made possible by the financial
assistro1ce of the National Research Council of Canada and
by the Canadian Steel Industries Construction Council
iv
NOTATION
a half length of opening
Af area of flange
Ar area of reinforcing
Aw area of web
b width of flange
c width of one pair of reinforcing bars (including web)
d depth of beam
E modulus of elasticity
Est strain hardening modulus
f subscript denoting stress or strain after load increment
FI stress resultant at high moment edge of opening
F2 stress resultant at low moment edge of opening
G shear modulus
h half depth of opening
i subscript denoting stress or strain before load increment
k I location of stress reversal at high moment edgeof opening
location of stress reversal at low moment edgeof opening
L length of moment arm to center of opening
M applied bending moment
Mp plastic bending moment
M p reduced plastic moment
x
v
p applied load
q thickness of reinforcing
R corner radius of opening
s half remaining clear web at opening
t thickness of flange
u length of web stub
shear force
plastic shear force
w thickness of web
extension of reinforcing past edge of opening
distance from the boundary of the opening to the stress resultant at the high moment edge of opening
distance from the boundary of the opening to the stress resultant at the low moment edge of opening
z plastic section modulus
proportionality factor 1= i(~2(2~ - 1)21 ~ proportionality factor f= kl + k2 - 1 - ~J pound45 strain at 45 0 to the longitudinal direction
pound-45 strain at -45 0 to the longitudinal direction
pound x strain in the longitudinal direction
6 xp plastic component of ~x
pound y strain corresponding to yielding
~yy strain in the direction of the beam depth
euro yp plastic component of euroyy
vi
~z strain in the transverse direction
plastic component of poundz
strain corresponding to hardening
the initiation of strain
~p equivalent strain
~pr reference value of ~p
~ xy shearing strain
~ normal stress
yield stress
yield stress for flange
yield stress for reinforcing
yield stress for web
shear stress
AISC American Institute of Steel Construction
ASTM American SOCiety of Testing Materials
CISC Canadian Institute of Steel Construction
ASCE American Society of Civil Engineers
vii
LIST OF FIGURES
Page
1 Types of Reinforcing 93
2 Stress Distribution at Opening 94
3 Idealized Stress-Strain Curve for Structural Steel 94
4 Interaction Curve - Unperforated Beam 95
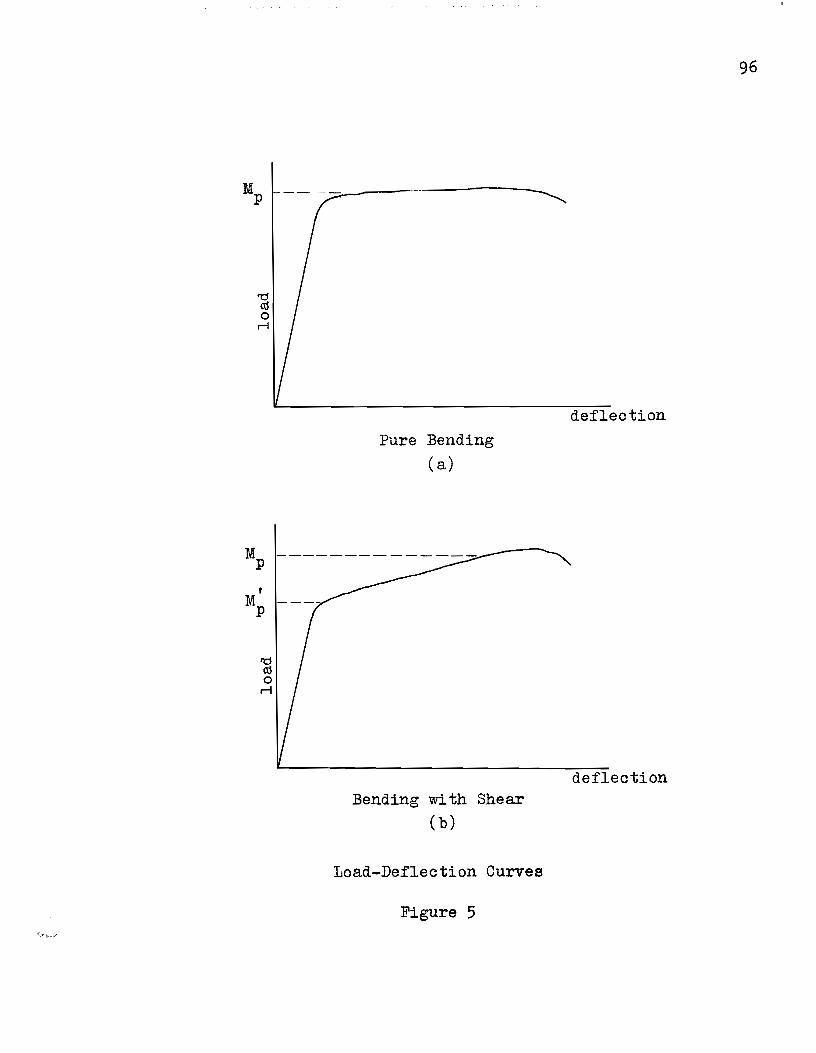
5 Load - Deflection Curves 96
6 Interaction Curve - Perforated Beam 97
7 Hinge Locations and Cross-Section of Member 98
8 Stress Distributions and Resultant Forces 99
9 Interaction Curve Showing Low and High Shear Regions 100
10 Interaction Curve - 14WF38 Nominal 7 x lOin Opening Itn X iReinforcing 101
11 Interaction Curve - 14WF3~ Nominal 7f1 X lot Opening 213 x t Reinforcing 102
12 Interaction Curve - 14WF38 Nominal 7 xlot Opening No Reinforcing 103
13 Interaction Curve - 14WF38 Nominal 7 x 14 Opening It x lIt Reinforcing 104
14 Interaction Curve - 14WF38 Nominal 9 x 13t Opening li x -n Reinforcing 105
15 Interaction Curve - 10WF21 Nominal 5~ n x Bi Opening li x i lt Reinforcing 106J
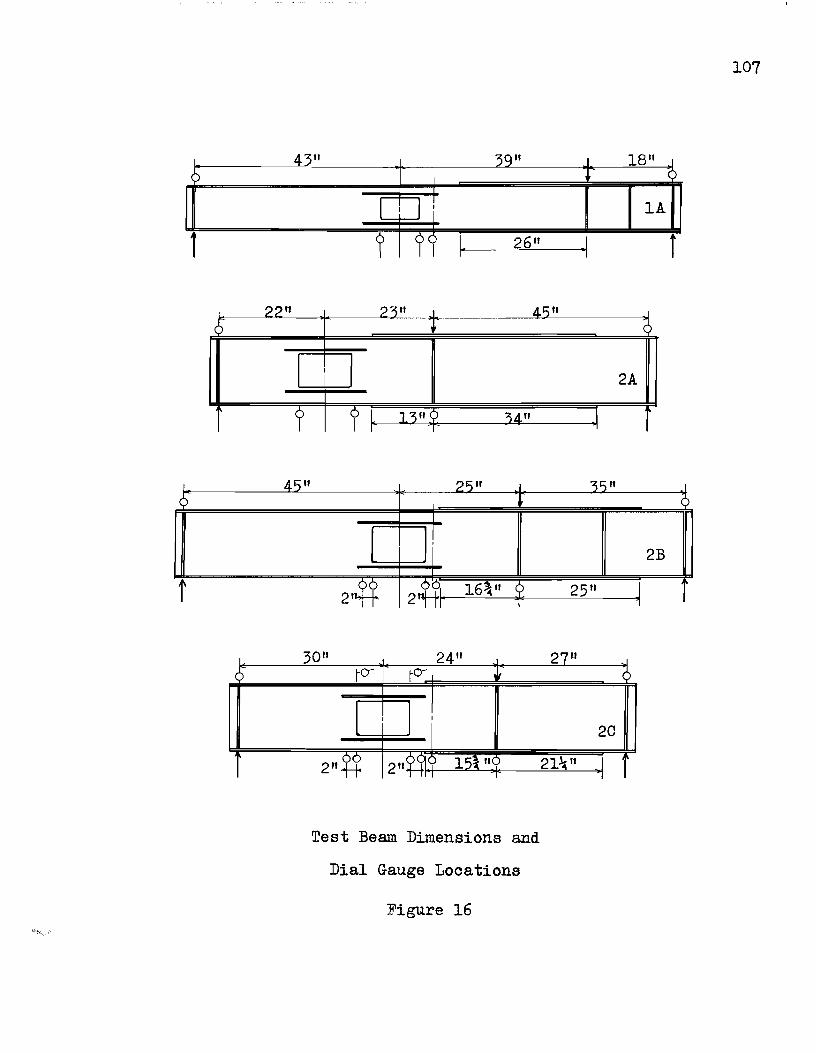
16 Test Beam Dimensions and Dial Gauge Locations 107
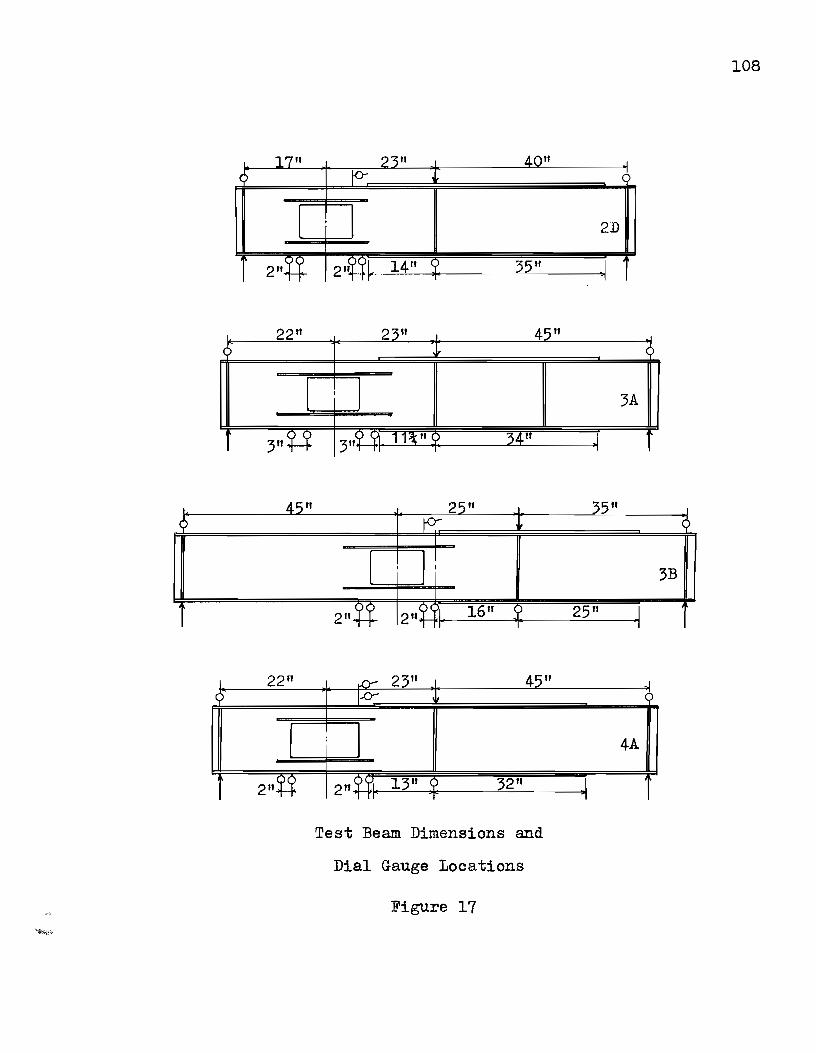
17 Test Beam Dimensions and Dial Gauge Locations 108
18 Test Beam Dimensions and Dial Gauge Locations 109
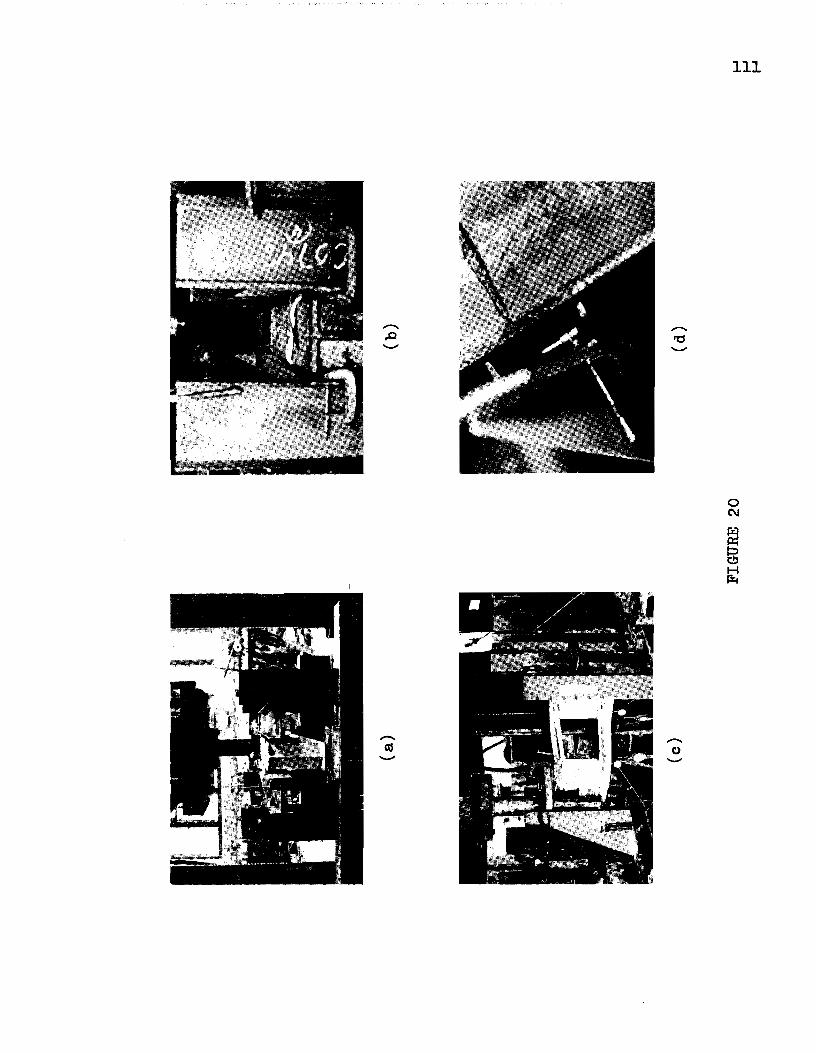
19 Lateral Bracing System 110
viii
Page
20 Photographs of Lateral Bracing System III
21 Strain Gauge Locations 112
22 Tensile Coupons 113
23 Stress-Strain Curve from Instron Testing Machine 113
24 Photographs of Test Beams after Collapse 114
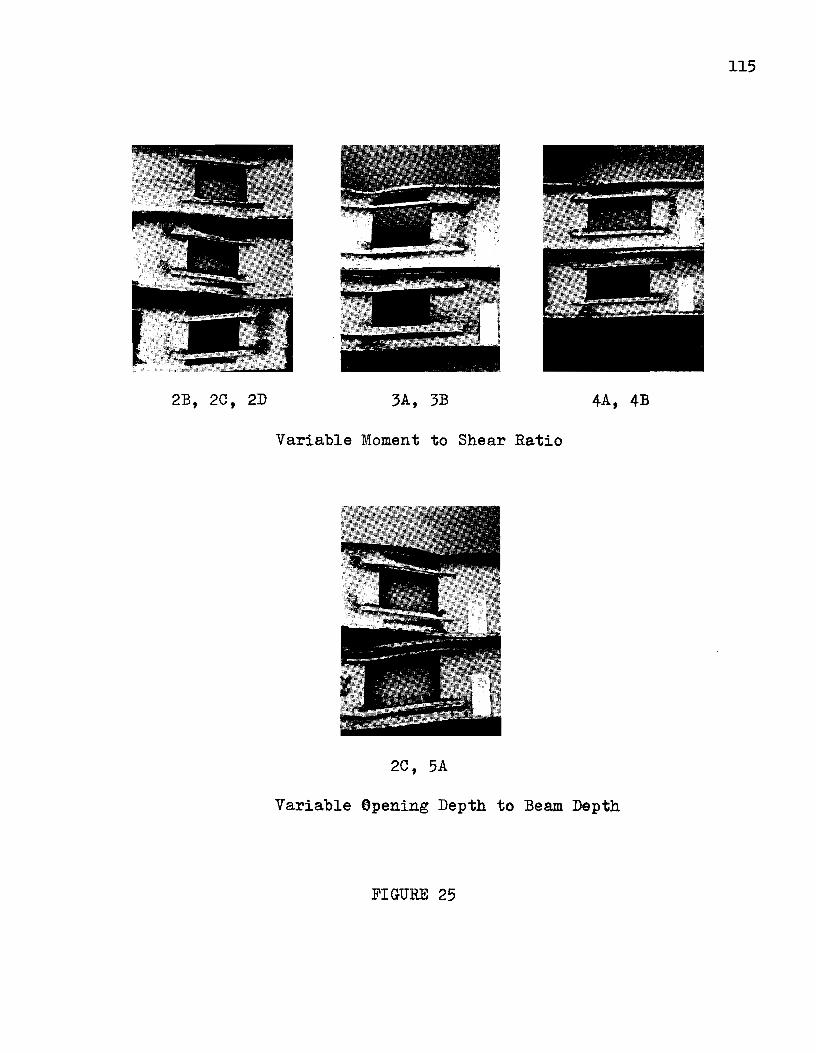
25 Comparison Photographs of Test Beams 115
26 Comparison Photographs of Test Beams 116
27a Stress Distribution at High Moment Edge of OpeningBeam 2C 117
27b Stress Distribution at Low Moment Edge of OpeningBeam 2C 117
28a Stress Distribution at Centerline of OpeningBeam 2C 118
28b Bending Stress Distribution Across Flange at High Moment Edge of Opening - Beam 2C 118
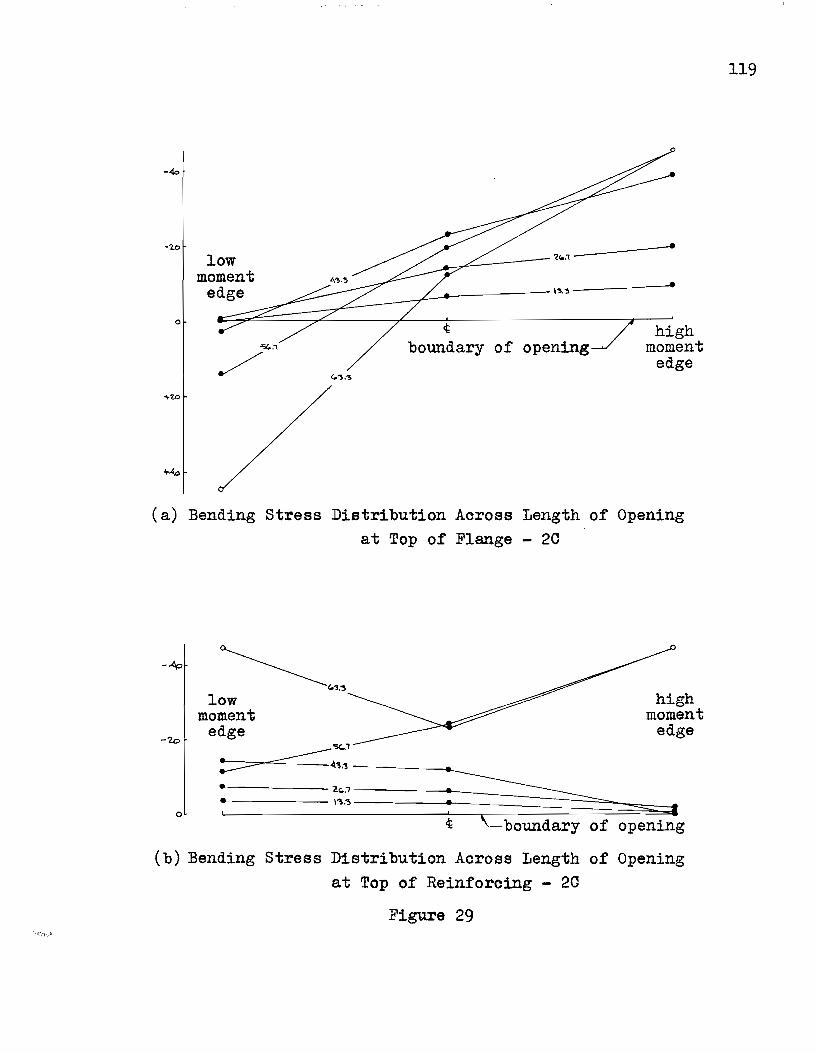
29a Bending Stress Distribution Across Length of Opening at Top of Flange Beam 2C 119
29b Bending Stress Distribution Across Length of Opening at Top of Reinforcing - Beam 2C 119
30a Stress Distribution at High MOment Edge of Opening - Beam 3B 120
30b Stress Distribution at Low Moment Edge of Opening - Beam 3B 120
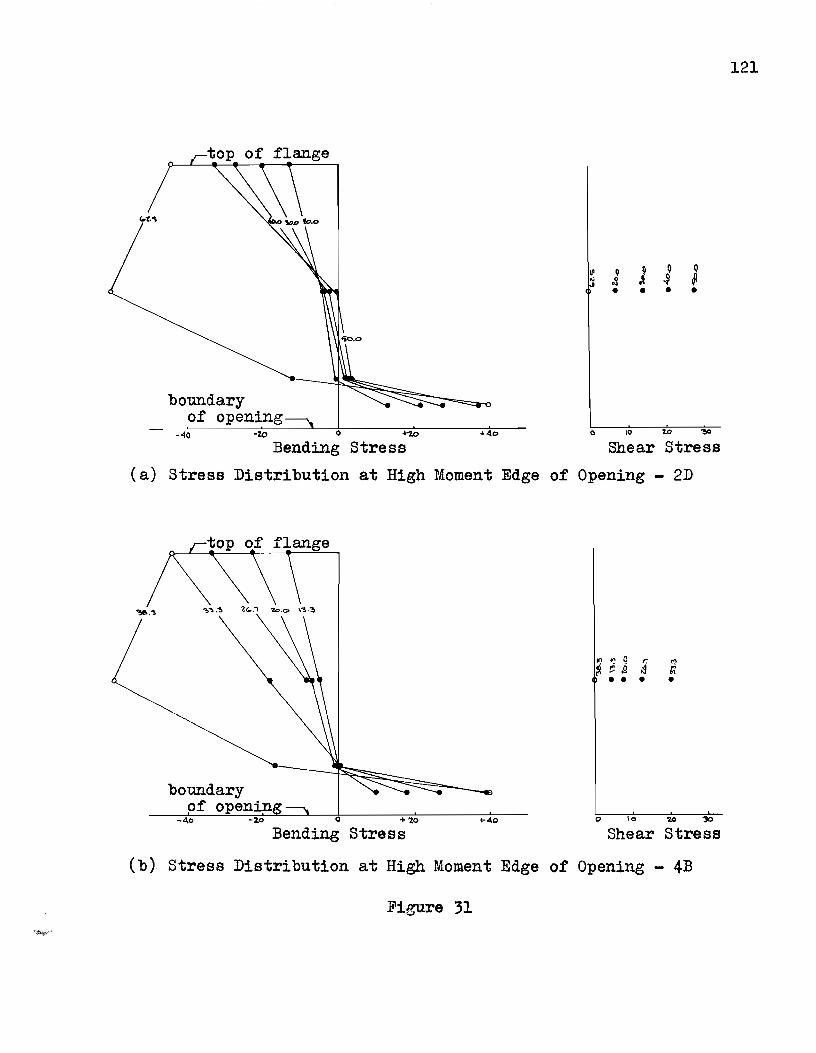
31a Stress Distribution at High Moment Edge of Opening - Beam 2D 121
31b stress Distribution at High Moment Edge of Opening - Beam 4B 121
32 Load-Relative Deflection Curve - Beam lA 122
33 Load-Relative Deflection Curve - Beam 2A 122
ix
Page
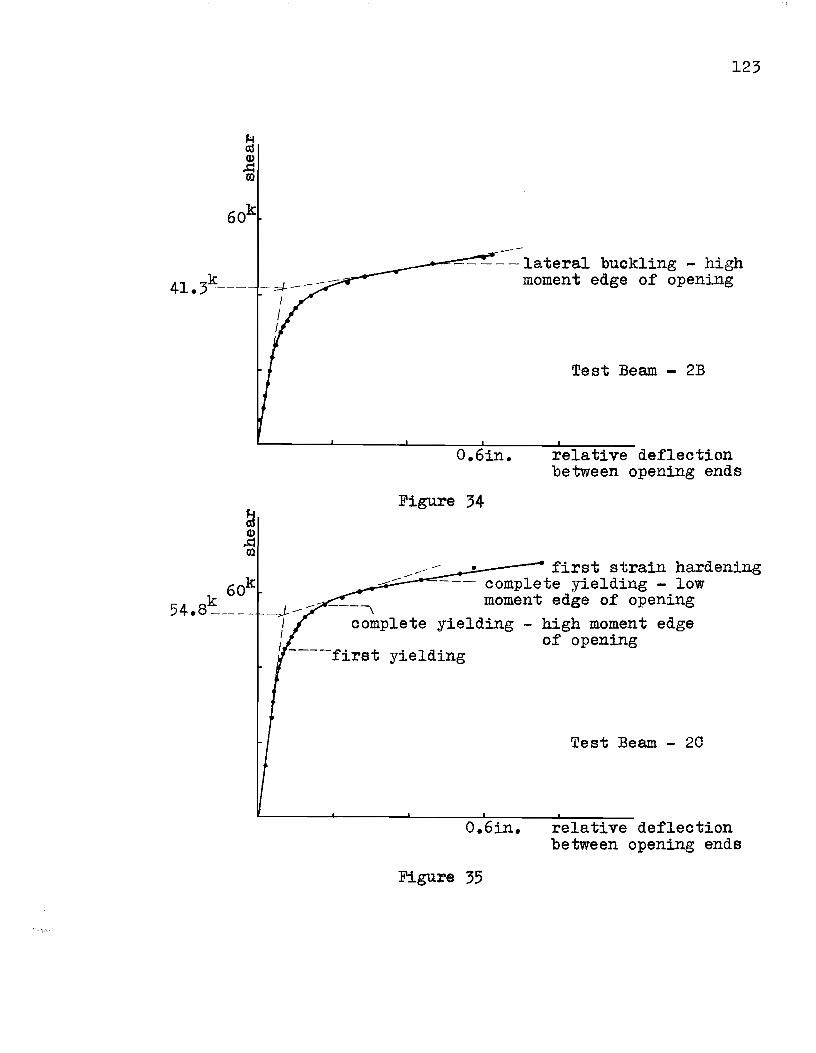
34 Load-Relative Deflection Curve - Beam 2B 123
35 Load-Relative Deflection Curve - Beam 2C 123
36 Load-Relative Deflection Curve - Beam 2D 124
37 Load-Relative Deflection Curve - Beam 3A 124
38 Load-Relative Deflection Curve - Beam 3B 125
39 Load-Relative Deflection Curve - Beam 4A 125
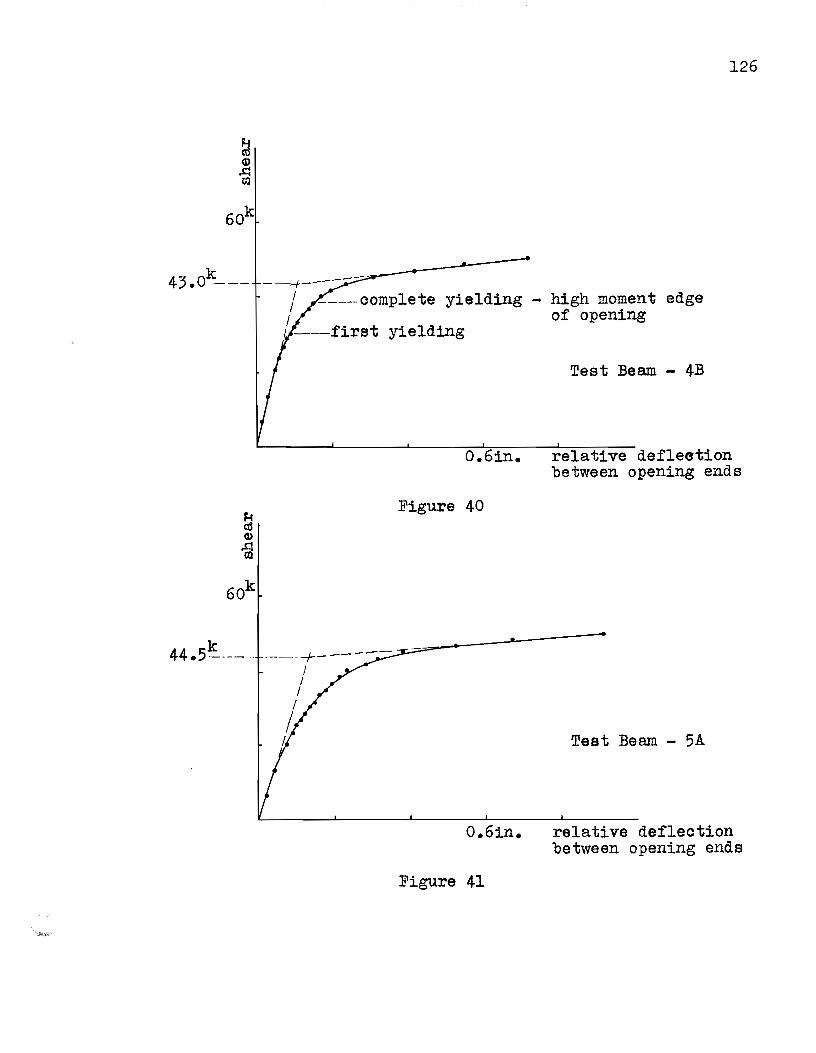
40 Load-Relative Deflection Curve - Beam 4B 126
41 Load-Relative Deflection Curve - Beam 5A 126
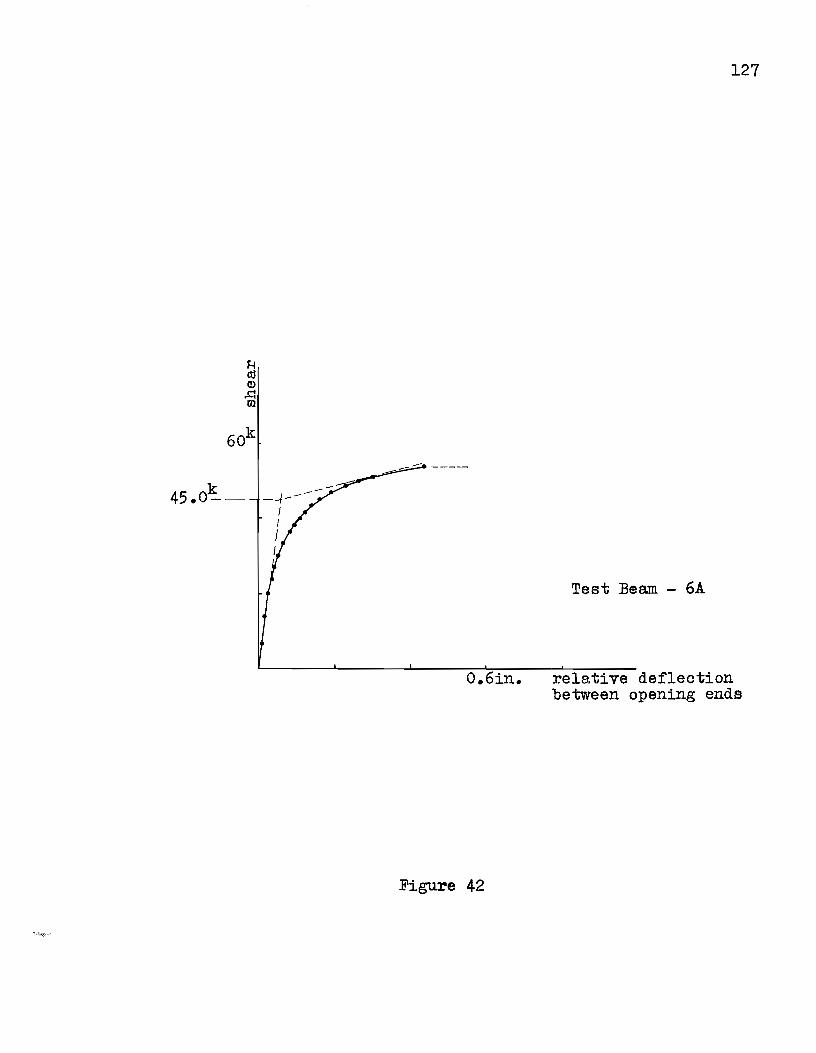
42 Load-Relative Deflection Curve - Beam 6A 127
43 Interaction Curves - Test Beam lA 128
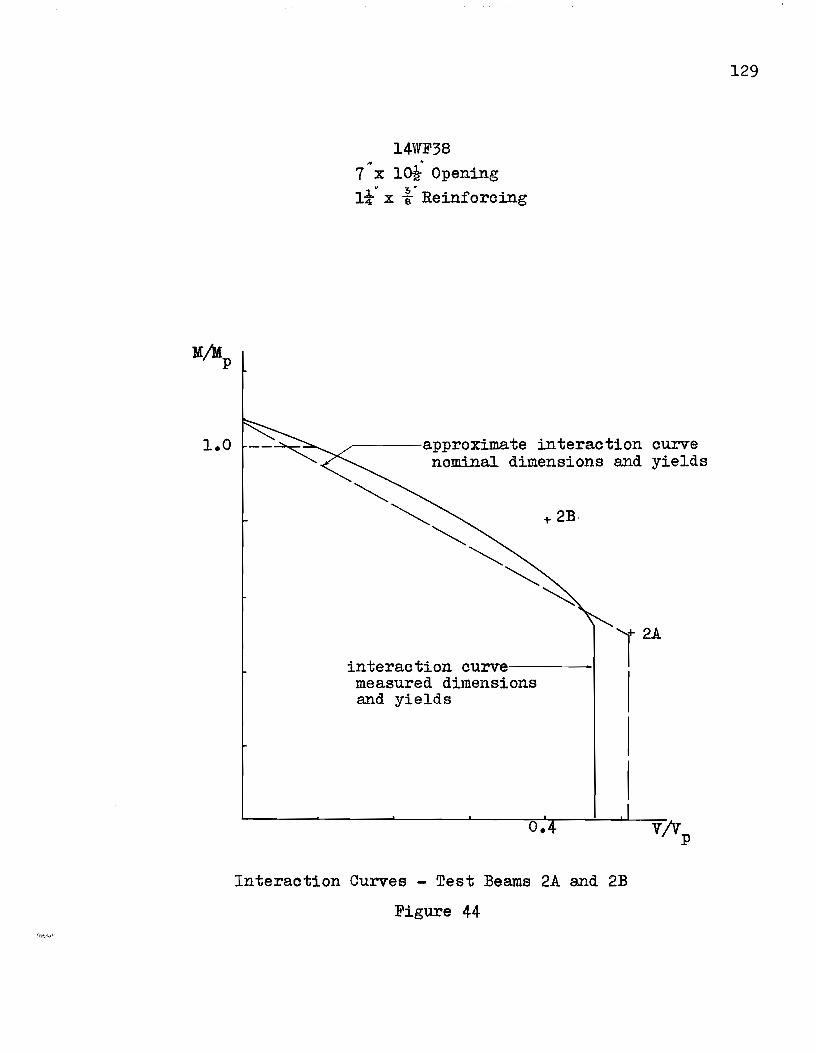
44 Interaction Curves - Test Beams 2A and 2B 129
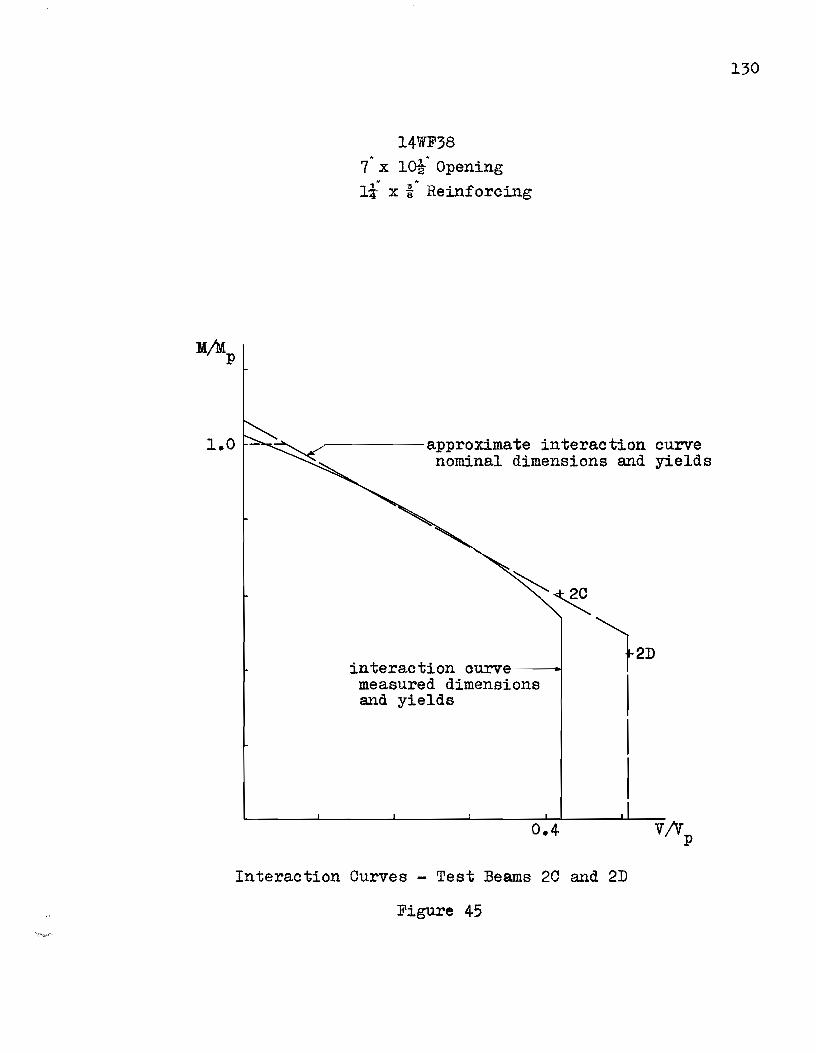
45 Interaction Curves - Test Beams 2C and 2D 130
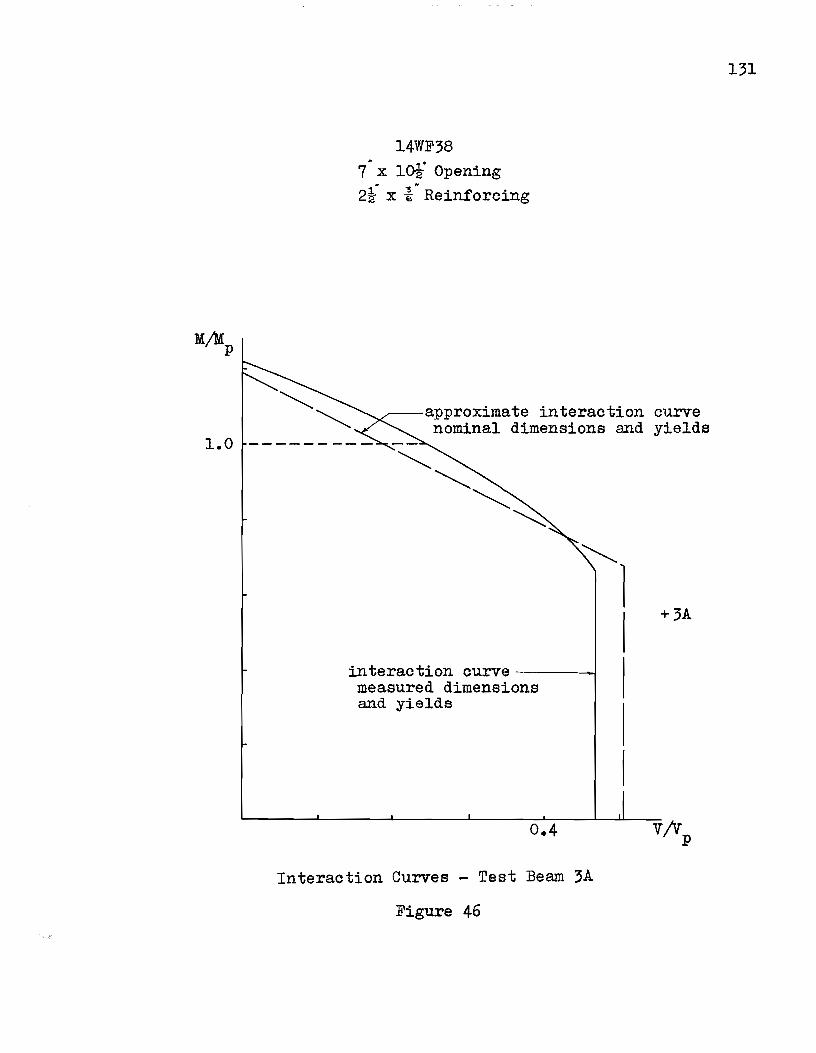
46 Interaction Curves - Test Beam 3A 131
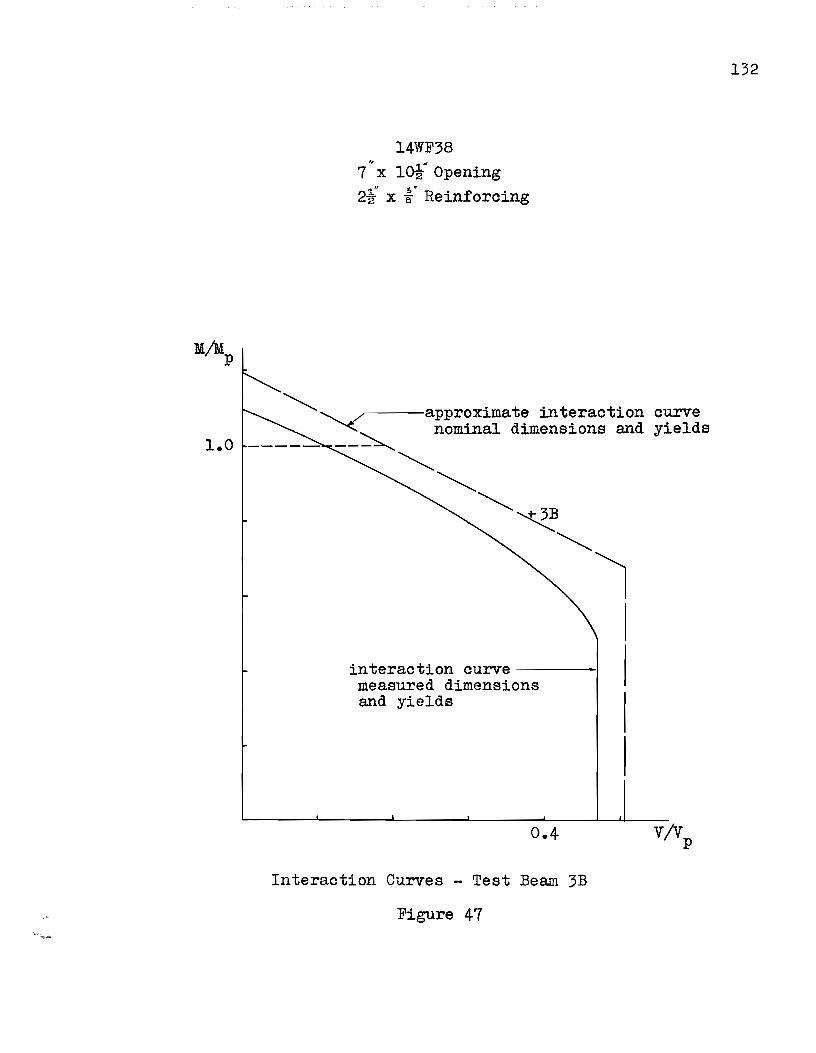
47 Interaction Curves - Test Beam 3B 132
48 Interaction Curves - Test Beams 4A and 4B 133
49 Interaction Curves - Test Beam 5A 134
50 Interaction Curves - Test Beam 6A 135
51 Lateral Deflection at High Moment Edge of OpeningBeam 2C 136
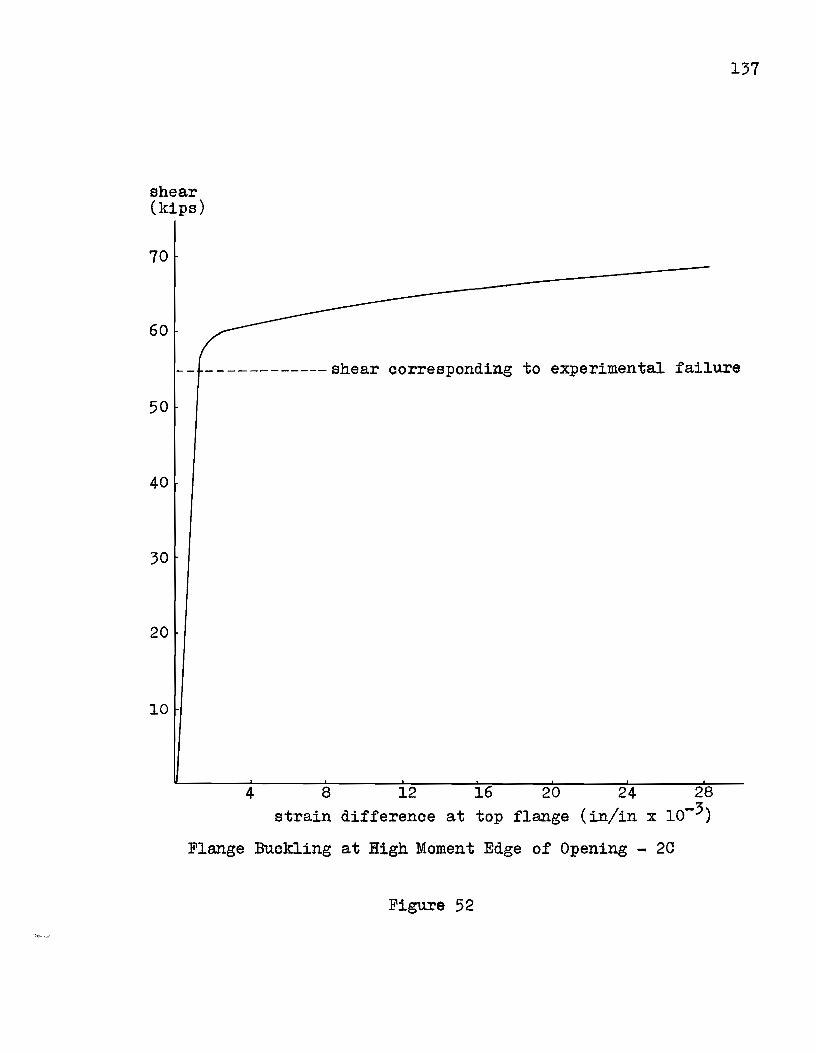
52 Flange Buckling at High Moment Edge of OpeningBeam 2C 137
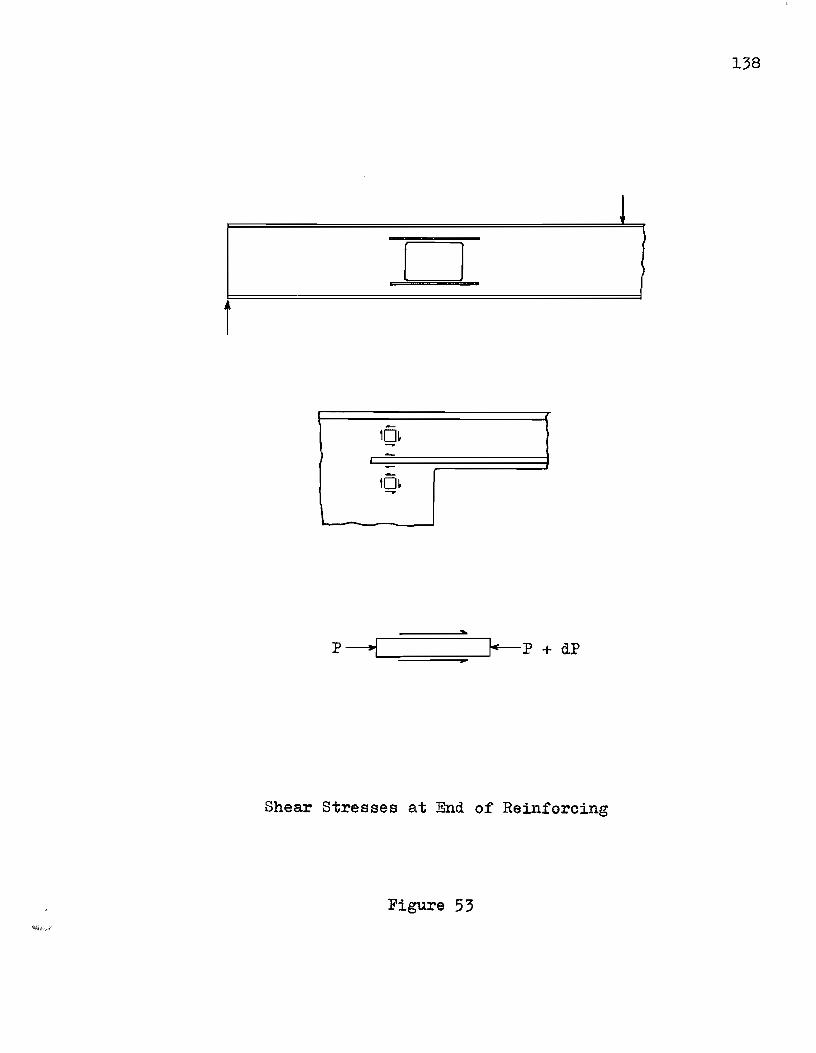
53 Shear Stresses at End of Reinforcing 138
54 Variable Reinforcing Size 139
55 Variable Moment to Shear Ratio 140
56 Variable Moment to Shear Ratio 141
x
Page
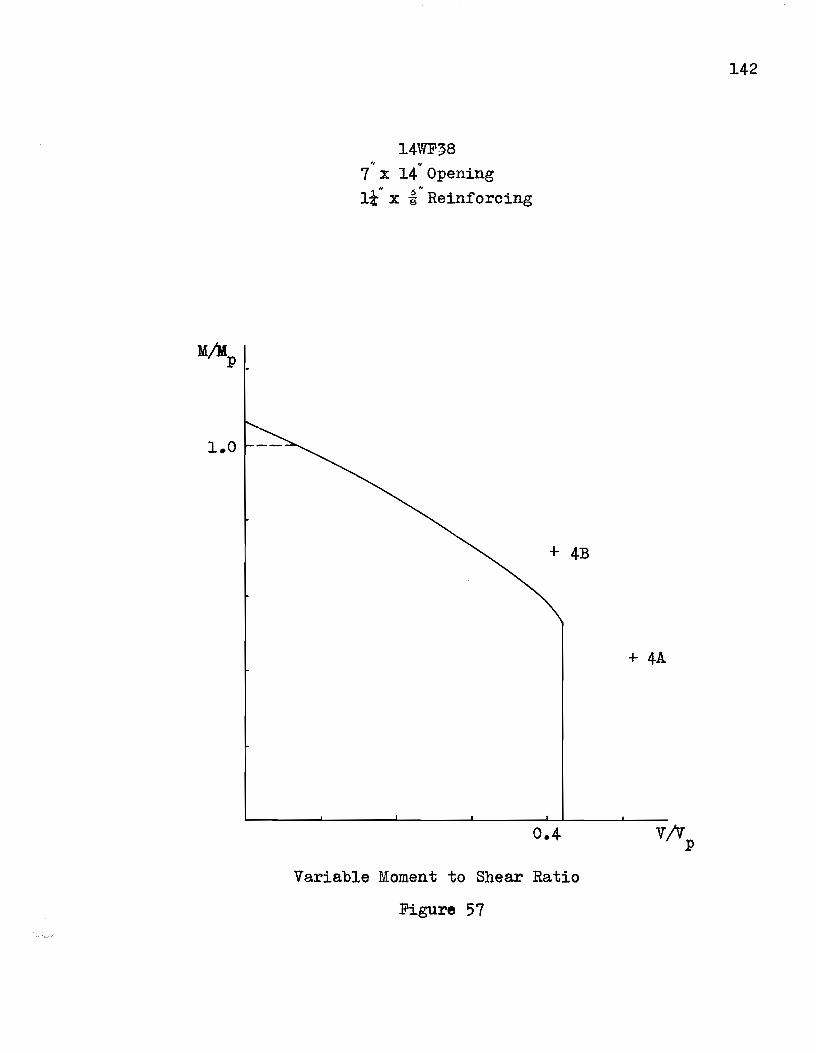
57 Variable Moment to Shear Ratio 142
58 Variable Aspect Ratio 143
59 Variable Opening Depth to Beam Depth M4
xi
LIST OF TABLES
Page
1 Beam Properties 145
2 Tensile Test Results 146
3a Shear Values Corresponding to Yielding 147
3b Shear Values Corresponding to Strain Hardening 147
4 Shear Values Corresponding to Whitewash Flaking 148
5 Correlation Between Experiment and Theory 149
6 Correlation Between Experiment and Approximate Theory 149
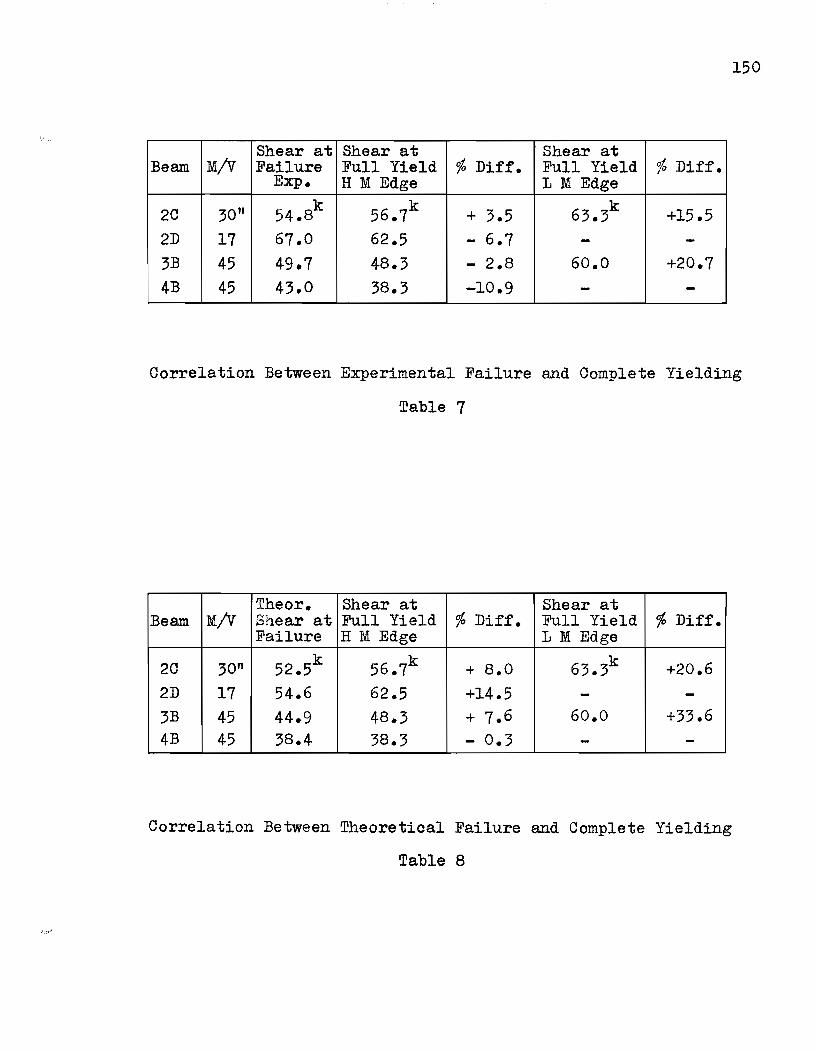
7 Correlation Between Experimental Failure and Complete Yielding 150
8 Correlation Between Theoretical Failure and Complete Yielding 150
SUJn1[ARY
ACKNOWLEDGEMENTS
NOTATION
LIST OF FIGURES
LIST OF TABLES
TABLE OF CONTENTS
Page
ii
iii
iv
vii
xi
CHAPTER I INTRODUCTION
11 General Background 1
12 Types of Reinforcing 2
13 Elastic and Ultimate Strength Analysis 4
CHAPTER 11 ULTINfATE STHEUGTH BEHAVIOR
21 Behavior of Unperforated Beams 8
22 Behavior of Beams with Web Openings 12
23 Previous Ultimate Strength Investigations 17
24 Scope of the Investigation 25
CHAPTER III ULTIMATE STRENGTH ANALYSIS
31 Assumptions 27
32 Low Shear Solution - Case I 29
33 High Shear Solution - Case 11 35
34 Limits of Interaction Curves 36
CHAPTER IV APPROXIMATE METHOD
41 General Remarks 41
42 Development of the Method 42
43 Limitations on the Approximate Method 46
44 Summary and Discussion 50
Page CHAPTER V EXPERIMENTAL INVESTIGATION
51 Selection of Test Beams 56
52 Experimental Setup 59
53 Testing Procedure 62
54 Determination of Yield Stresses 63
CHAPTER VI EXPERIMENTAL RESULTS
61 Behavior of Beams during Testing 66
62 Stress Distributions and Failure Loads 71
63 other Factors 72
CHAPTER VII ANALYSIS OF RESULTS
71 Order of Onset of Yielding 77
72 Stress Distributions 78
73 Failure Loads 80
74 Influence of Reinforcing and Other Variables 82
CHAPTER VIII CONCLUSIONS AND RECO~Th1ENDATIONS
81 Conclusions 85
82 Recommendations for Design 88
83 Recommendations for Future Work 91
FIGURES 93
TABLES 145
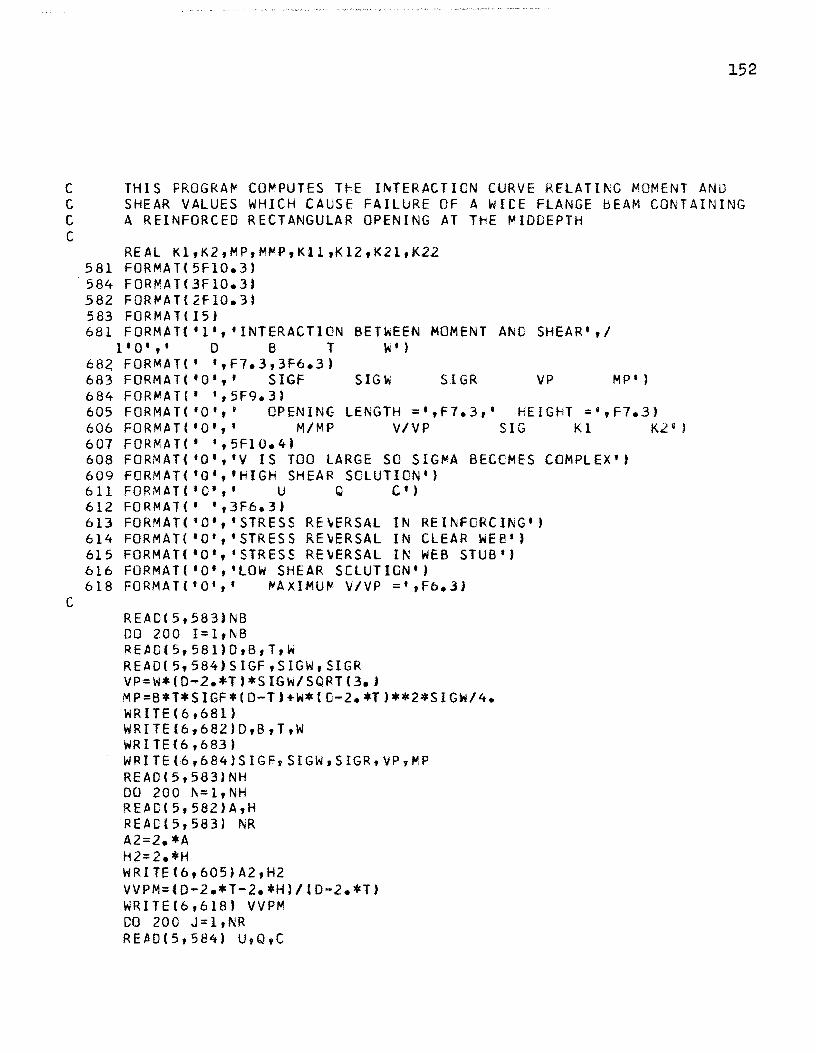
APPENDIX A Computer Program for Interaction Curve 151
APPENDIX B Plasticity Relationships 158
BIBLIOGRAPHY 161
1
CHAPTER I
INTRODUCTION
11 General Background
It has become common practice to cut openings in the
webs of beams to permit the passage of utility ducts By
passing these utilities through rather than under the beams
the height of each floor in a building can be reduced thereshy
by effecting a considerable saving in cost particularly in
the case of multistorey structures However cutting an
opening in the web of a beam may considerably reduce the
strength of the beam in the vicinity of the opening If
the opening is located at some position in the beam where
stresses are low this may cause no special problems but
if it is located in a high stress region the designer is
faced with the problem of finding an economioal way to inshy
crease the strength of the beam so that failure will not
result at the opening under working loads
Two alternate approaches are possible in this case
The size of the entire member in question may be increased
on the basis of providing sufficient strength at the openshy
ing so that failure will not ocour The other approach is
to reinforce the original member in the vicinity of the
opening so that the loads can be carried without inducing
2
high stresses The size of the member itself then need not
be increased
Just as the decision whether to pass utilities through
rather than under floor beams must be based primarily on
economic considerations the decision whether to reinforce
an opening or increase the size of the entire member when
the opening is located in a high stress region must also be
based on economics Since many methods of reinforcing an
opening are possible the relative costs and effects of each
type of reinforcing deserve consideration
12 Types of Reinforcing
Reinforcing for an opening in the web of a beam may be
of three basic types
1 reinforcing to resist high bending stresses and low shear
stresses
2 reinforcing to resist low bending stresses and high shear
stresses
3 reinforcing to resist both high bending and shear stresses
Two examples of the first type are illustrated in Figures
la and lb By increasing the areas of the sections above
and below the centroid they provide additional moment
resisting capacity to the section However since shear
stresses are considered to be carried only by the web of
the section this type of reinforcing cannot increase the
3
shear capacity above that given by the shear capacity of
the uncut section times the ratio of the net web area at
the opening to the initial web area of the beam Reinforcshy
ing types to resist high shear stresses are those that
increase the web area so that more web is available to
resist these stresses Web doubler plates as shovm in
Figure lc are typical of this type of reinforcing although
their use is usually very limited due to welding difficulties
This type of reinforcing also increases moment capacity by
increasing the area above and below the opening Another
type of shear reinforcing uses vertical or inclined web
stiffeners to carry the shear forces past the opening A
typical arrangement of inclined web stiffeners is shown in
Figure Id The third type of reinforcing is essentially a
combination of the first two examples of which can be seen
in Figures le and If The area above and below the opening
is increased to give added moment capaCity and the effective
web area is increased by the addition of vertical or inclined
shear plates to provide added shear capacity to the section
A combination of the reinforcing arrangements in Figures la
and Id would be another example of this type Many other
arrangements of web opening reinforcing are pOSSible but
those shown in Figure 1 and mentioned above are typical of
the three main types
Since the problem of cutting and reinforcing an opening
4
in a section is basically one of economics the cost of the
process of reinforcing an opening must be considered This
cost may be divided into three parts the cost of supplying
and cutting the material to be used in reinforcing the openshy
ing that of bending and fitting this material and welding
this material into place Since the cost of welding is
paramount among the several expenses it is advantageous to
keep the welding to a minimum in the selection of a reinforcshy
ing type This tends to make the high shear type of reinforcshy
ing uneconomical and essentially limits the more practical
opening reinforcings to those of the type considered in
Figures la and lb The present investigation is devoted to
this type of reinforcing and specifically to that arrangement
given in Figure lb
13 Elastic and Ultimate Strength Analysis
BaSically two types of analysis were available for this
study - elastic and ultimate strength The elastic analysiS
of the stresses in a beam containing an opening in its web
consists of the superposition of the stresses occurring in
an unperforated beam and the stresses resulting from forces
applied to the boundary of the opening in such a way as to
satisfy certain boundary conditions at the opening This
approach finds its basis in an important work presented by
NIMuskhelishvili(l) in the 1930s and was used by SR
5
Heller Jr et al(2) in 1962 and by JEBower(3) in 1966 to
investigate the elastic stresses around openings in wideshy
flange beams Bowers work also outlined the widely used
approximate Vierendeel analysis based on the assumption that
the beam behaves like a Vierendeel truss in the vicinity of
the opening The shear force carried by the section causes
secondary bending moments to occur within the tee sections
formed by the flange and the remaining part of the web above
and below the opening A point of contraflexure for the
secondary bending stresses is assumed to occur at the midshy
length of the opening The forces acting at the opening and
the resultant stress distributions are shown in Figure 2 It~
is assumed that the shear is carried equally by the tee secshy
tions above and below the opening and that the secondary and
primary bending stresses are additive
Bower also performed an experimental study(4) in 1966
to verify the results of his analysis A series of 16WF36
beams each containing one opening either circular or
rectangular with corner radii of 14 inch were tested at
varying moment to shear ratios The beams were implemented
with electrical resistance strain gauges in the vicinity of
the openings so that strains could be measured and compared
to those predicted by theory The results of Bowers tests
showed that very high stress concentrations occur at the
corners of rectangular openings while smaller stress concenshy
6
trations occur above and below circular openings where the
tee section is the smallest The findings for circular
openings confirm those given by So(5) in 1963 while those
for rectangular openings were confirmed by Chen(6) in 1967
Bower showed that for both types of openings investigated
the elastic analysis predicts all stresses and stress concenshy
trations with reasonable accuracy except for the octahedral
shear stresses away from the boundary of the opening The
elastic analYSiS however is complicated and requirea the
use of a computer and is incapable of dealing with the presshy
ence of notches or other irregularities at the opening The
approximate Vierendeel method was found to predict bending
stresses and octahedral shear stresses with acceptable
accuracy while failing to predict the stress concentrations
in both cases However the approximate method is relatively
simple and lends itself easily to hand calculations Since
the elastic analysis is not practical particularly for
design purposes because of the length of the calculations
involved it has been suggested by Bower and others(7) that
the Vierendeel analysis be used in its place with stress
concentrations neglected when an elastic analysis is desired
A design based on this method would result in a beam whose
response is not purely elastic under working loads
An analysis based on complete yielding of the sections
where high stress concentrations exist under elastic condishy
7
--~~
~ tions would eliminate this problem Such a plastic or
ultimate strength analysis would take advantage of the
additional strength of the perforated beam between the onset
of yielding and the complete plastification of the section
or sections that would cause failure or uncontrolled deformshy
ations of the beam Besides eliminating the problem of stress
concentrations in the elastic range a plastic analysis also
has the advantage of being simpler to use than the complete
elastic analysis and of not being rendered unusuable when
notches or irregularities are present at the opening since
the method depends only on the reasonably accurate prediction
of the sections where complete yielding or plastic hinges
will occur These regions can generally be determined withshy
out difficulty particularly in the case of rectangular
openings Consideration of these factors suggest an ultishy
mate strength analysis as the most rational approach to
the problem
8
CHAPTER 11
ULTIMATE STRENGTH BEHAVIOR
21 Behavior of Unperforated Beams
Ultimate strength analysis truces advantage of the ducshy
tility of structural steel This ductility mruces it possible
for the steel to undergo large deformations beyond the elastic
limit before failure occurs As can be seen from the idealized
stress-strain curve in Figure 3 the material is elastic up
to the yield level but after this level is reached the strain
increases extensively without any further increase in stress
Beoause of this attainment of the yield stress at the outershy
most fiber of a beam in bending does not cause the failure of
the member Rather the member has reserve strength that
permits increase of load up to the point where the entire
cross-section has reaohed the yield stress ie when a plastio
hinge has fonned at the yielded section Since rotation is
free to occur at plastic hinge locations when sufficient
hinges have formed so that the structure forms a mechanism
and is unstable under the applied loads collapse will occur
For a simply supported beam of uniform cross-section
formation of only one plastio hinge is suffioient to cause
collapse If no shear or axial forces are acting the plastic
moment or maximum moment capacity of the section is easily
9
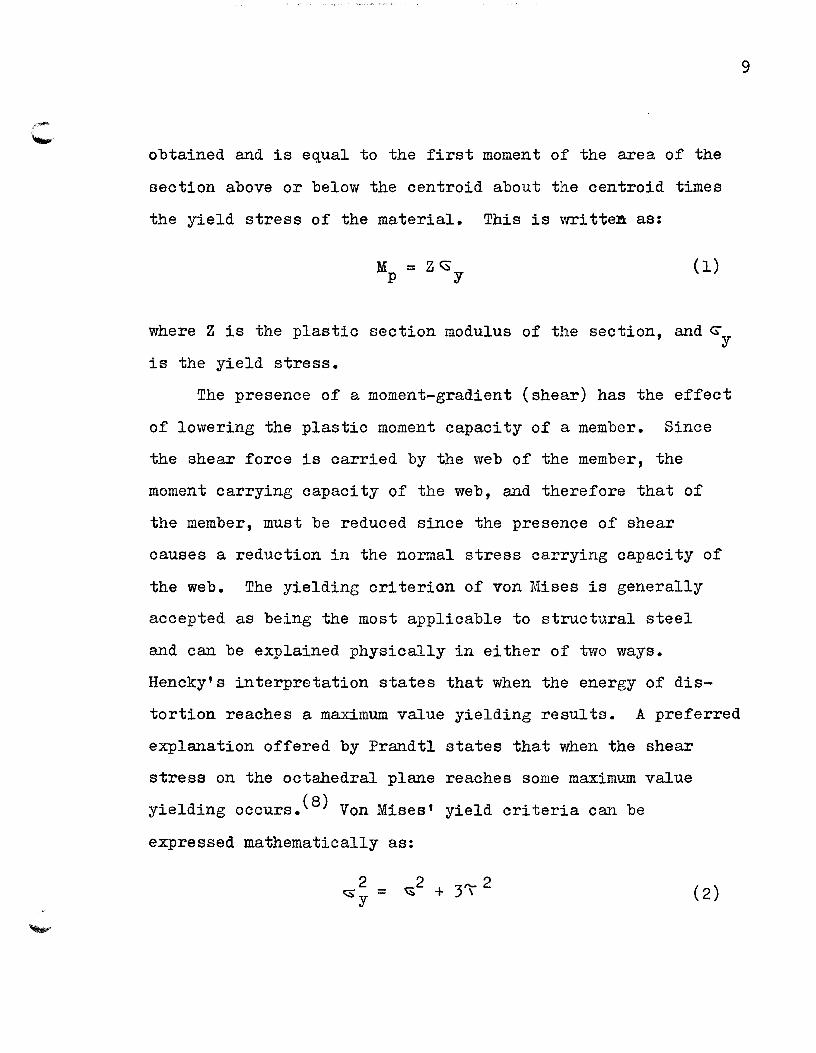
obtained and is equal to the first moment of the area of the
section above or below the centroid about the centroid times
the yield stress of the material This is writte~ as
where Z is the plastic section modulus of the section and ~y
is the yield stress
The presence of a moment-gradient (shear) has the effect
of lowering the plastic moment capacity of a member Since
the shear force is carried by the web of the member the
moment carrying capacity of the web and therefore that of
the member must be reduced since the presence of shear
causes a reduction in the normal stress carrying capacity of
the web The yielding criterion of von Mises is generally
accepted as being the most applicable to structural steel
and can be explained physically in either of two ways
Henckys interpretation states that when the energy of disshy
tortion reaches a maximum value yielding results A preferred
explanation offered by Prandtl states that when the shear
stress on the octahedral plane reaches some maximum value
yielding occurs(8) Von Mises t yield criteria can be
expressed mathematically as
10
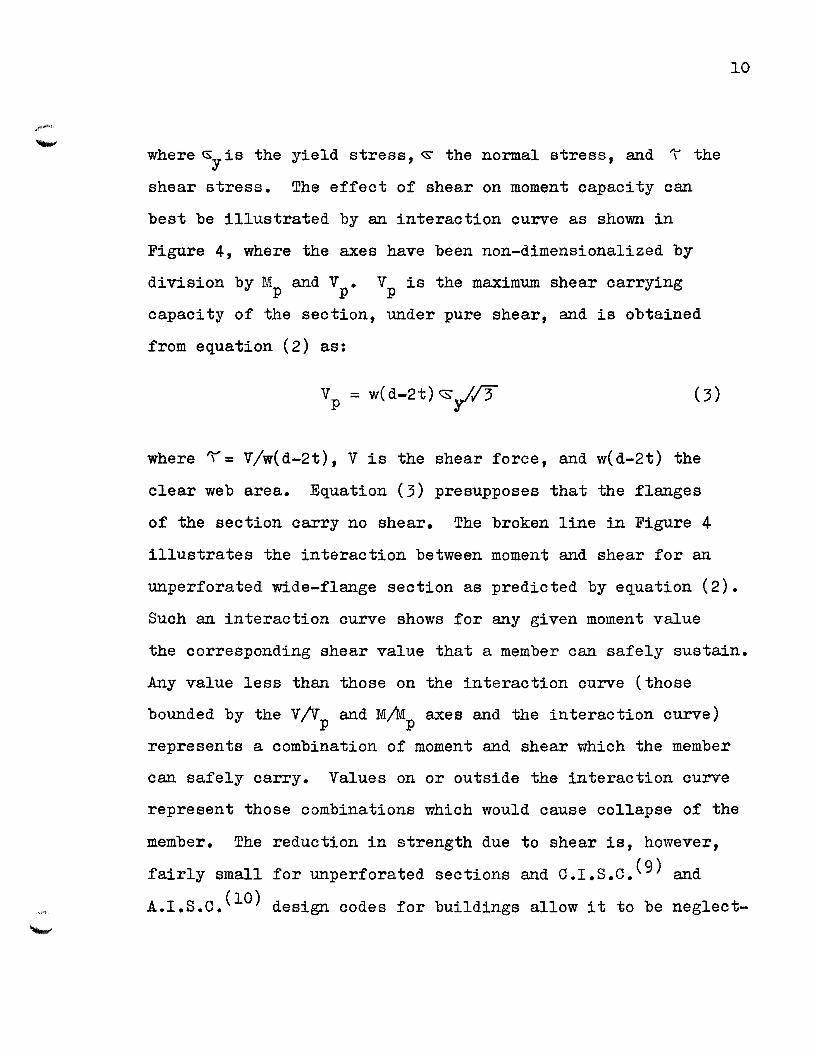
where ltSyiS the yield stress ltS the normal stress and the
shear stress The effect of shear on moment capacity can
best be illustrated by an interaction curve as shown in
Figure 4 where the axes have been non-dimensionalized by
diVision by Mp and Vp Vp is the maximum shear carrying
capacity of the section under pure shear and is obtained
from equation (2) as
where = Vw( d-2t) V is the shear force and w( d-2t) the
clear web area Equation (3) presupposes that the flanges
of the section carry no shear The broken line in Figure 4
illustrates the interaction between moment and shear for an
unperforated wide-flange section as predicted by equation (2)
Such an interaction curve shows for any given moment value
the corresponding shear value that a member can safely sustain
Any value less than those on the interaction curve (those
bounded by the VV and MM axes and the interaction curve)p p represents a combination of moment and shear which the member
can safely carry Values on or outside the interaction curve
represent those combinations which would cause collapse of the
member The reduction in strength due to shear is however (9)fairly small for unperforated sections and OISC and
AISc(lO) design codes for buildings allow it to be neglectshy
11
ed for design purposes since the ooouranoe of strain hardenshy
ing makes possible the attainment of moments greater than Mp
in the presence of shear The allowable moment and shear
values thus permitted are those bounded by the solid line in
Figure 4
The inorease in strength due to strain hardening oan best
be illustrated by considering the load-defleotion curves in
Figure 5 The load-defleotion ourve for a beam in pure bendshy
ing is given in Figure 5a When the plastio moment of the
seotion is reaohed the defleotions beoome exoessive and
increase with no further inorease in load This ooours
beoause the member forms a meohanism with the formation of
a plastio hinge at the attainment of Mp However when shear
is present the load-defleotion ourve does not beoome horishy
zontal when the reduoed Mp Mp as predioted by equation (2)
and given by the interaction curve in Figure 4 is reached
but rather oontinues to climb at a lesser slope reaching
values equal to or greater than the full Mp given by equation
(1) This oan be seen in Figure 5b The increase in strength
above Mp under moment gradient is due to strain hardening
and is usually neglected in simple plastiC theory although
it can be predicted but the procedure is complicated for
all but very simple cases Strain hardening occurs in the
presence of shear because yielding occurs in localized areas
or slip bands so that the material within these bands strain
12
hardens before adjacent areas reach the point of yield Alshy
though simple plastic theory neglects strain hardening the
significance of this phenomenon should not be underestimated
since all rolled sections are proportioned such that the limit
of shear carrying capacity of the web lies within the strain
hardening range(ll)
22 Behavior of Beams with Web Openings
The introduction of an opening into the web of a wideshy
flange section has two effects on the interaction curve The
first and more immediately apparent of these effects is the
reduction of shear and moment capacity by the reduction of the
area available to resist these forces The moment capacity
is reduced to
(4)
where w is the web thickness and h is the half depth of the
opening The shear capacity is reduced to
v = w( d-2t-2h) $-3
This change in the interaction curve is shown by the broken
line in Figure 6 The second effect caused by the presence
of an opening is the strong interaction between moment and
shear due to the member behaving like a Vierendeel truss in
13
the vicinity of the opening This is the same type of
behavior described in Section 13 except that the member
is analyzed in the plastic rather than the elastic range
The secondary bending moments caused by the shear force are
added to the primary bending moments thus causing the critical
sections to yield completely at lower loads than would be exshy
pected were this interaction effect ignored This is shown
by the line in Figure 6 where the effects of shear as given
by equation (2) have also been included
The addition of horizontal bar reinforcing above and
below an opening in a wide-flange beam increases the maxishy
mum moment capacity of the section (no shear acting) above
that of an unreinforced opening by increasing the area of
the section capable of resisting moment The effects of
interaction between moment and shear are also reduced by the
addition of reinforcing since the reinforcing is of such a
type as to be particularly well suited to resist secondary
bending moments due to Vierendeel action The maximum shear
carrying capacity of a reinforced opening may reach
(Vv) = d-2t-2h (6)P max d-2t
which is the maximum shear carrying capacity of the section
assuming no interaction and is derived from equation (5) by
division by equation (3) This can represent a considerable
14
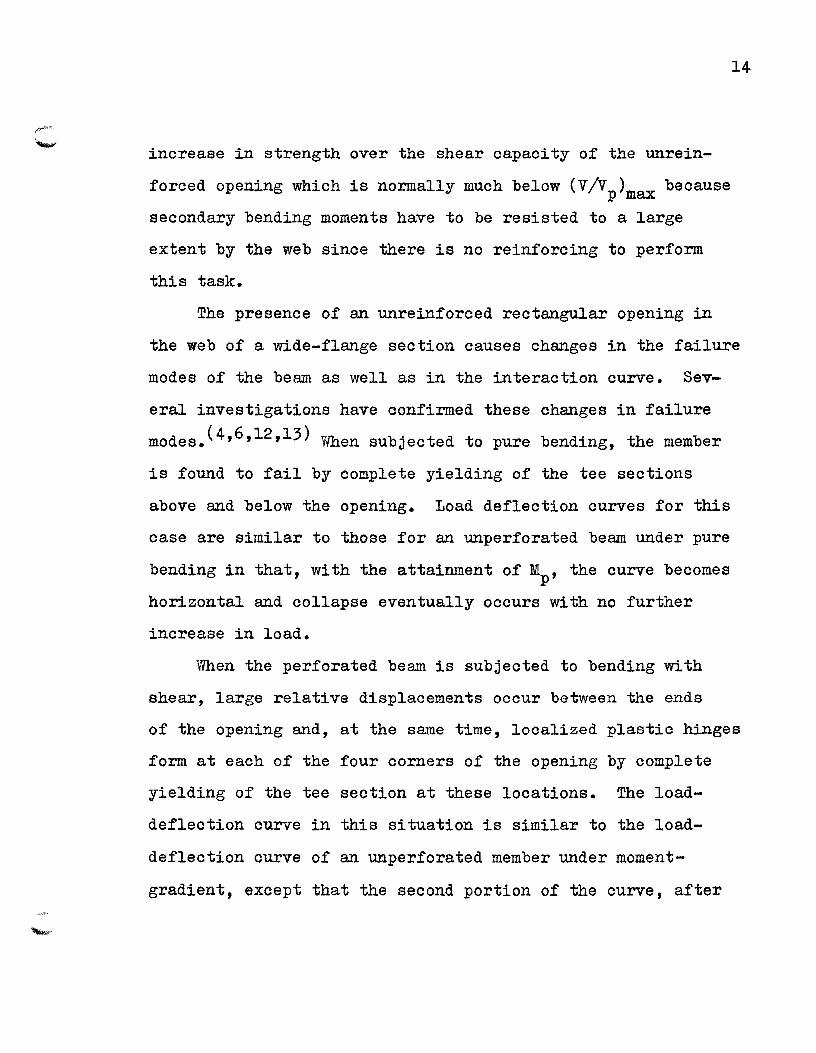
increase in strength over the shear capacity of the unreinshy
forced opening which is normally much below (VVp)max because
secondary bending moments have to be resisted to a large
extent by the web since there is no reinforcing to perform
this task
The presence of an unreinforced rectangular opening in
the web of a wide-flange section oauses ohanges in the failure
modes of the beam as well as in the interaction ourve Sevshy
eral investigations have confirmed these ohanges in failure
modes(461213) Vllien subjected to pure bending the member
is found to fail by oomplete yielding of the tee sections
above and below the opening Load defleotion curves for this
case are similar to those for an unperforated beam under pure
bending in that with the attainment of Mp the curve becomes
horizontal and collapse eventually occurs with no further
increase in load
Vhen the perforated beam is subjected to bending with
shear large relative displacements occur between the ends
of the opening and at the same time localized plastiC binges
form at each of the four corners of the opening by complete
yielding of the tee section at these locations The load-
deflection curve in this situation is similar to the load-
deflection curve of an unperforated member under moment-
gradient except that the second portion of the curve after
15
the bend is not always as straight as that for the unpershy
forated beam and in fact may possess considerable
curvature in some cases(13) The value of the moment at the
opening at which the load-relative deflection curve bends
is not that of the unperforated section but instead is a
reduced value obtained by considering both reduced area and
moment-shear interaction as described previously_ Again
the increase in load above the value corresponding to the
predicted moment is due to strain hardening for the same
reasons as cited previously_ This strain hardening effect
makes it exceedingly difficult to ascertain at what value of
shear or moment an experimental test beam should be considershy
ed to have failed so that this failure load can be compared
to one predicted by theory It can be said with certainty
that this value should lie somewhere between the load at
which the load-relative deflection curve starts to bend from
its initial slope and the ultimate load at which the beam
suffers total collapse This total collapse will be either
by web buokling at the opening or by oraoking of one or more
of the corners of the opening after which deflections become
uncontrolled and the load carrying capacity of the beam
decreases
The use of the collapse load as the failure load would
however not be justified unless the effects of strain hardenshy
ing and the possibility ot tearing and buokling are incorporatshy
16
ed into the analysis Also the deflections become so exshy
cessive as to make the beam unserviceable before this load
is reached Indeed a rational definition would have to be
such as to have the failure load fall within the region
where the load-relative deflection curve bends from its
initial slope to some new slope One possible means of
defining failure in this type of situation is suggested in
ASCE tlOommentary on Plastic Design in Steel(14) and
is perhaps the most rational approach to the problem The
initial slope of the load-relative deflection curve is
multiplied by some constant factor to obtain a new slope
A line having this new elope is then drawn tangent to the
upper portion of the load-relative deflection curve and the
load at which this new slope intersects the initial slope is
taken to be the failure load This is analogous to considershy
ing strain hardening in some simple case where the slope of
the theoretical load-deflection curve in the strain hardening
range is equal to a constant times the initial slope of the
curve when the beam is still elastic If this method is to
be used a method of determining a suitable constant must
be chosen possibly from experiment
The modes of failure of a beam containing a reinforced
opening are expected to be the same as those with an unreinshy
forced opening under both pure bending and bending with shear()
Similarly the load-deflection curves or the load-relative
17
deflection curves would be the same in both cases Thus for
cases of moment gradient the same situation exists for both
reinforced and unreinforced openings where the load continues
to increase past the attainment of the predicted moment
capacity of the section due to strain hardening and the same
difficulty exists for determining failure loads for beams
with reinforced openings as for the unreinforced case
The method suggested in ASCE and described previousshy
ly for determining failure load was adopted for the purposes
of correlating experimental and theoretioal values of failure
load in this study Since the load-relative defleotion curves
for some of the test beams approached a fairly constant slope
in the strain hardening range it was decided to determine
the slopes and constant multiplication factors for these
cases and apply the same factor to all of the test beams
since all were similar It was thus decided to use a value
of thirty times the initial slope for the final slope in
determining experimental failure loads
23 Previous Ultimate Strength Investigations
While considerable theoretical and experimental work
has been done in the determination of elastic stresses around
openings in plates and beams relatively little has been done
ooncerning ultimate strength behavior In 1958 wJworley(12)
18
carried out an investigation of the ultimate strength of
aluminum alloy I-beams containing web openings of various
shapes Rectangular elliptical and triangular openings
were studied with the main objects of the research being
to determine which shape of opening resulted in the smallest
loss of strength and to verify the validity of an upper
bound theorem in predicting the fully plastiC load carrying
capaCity of the test beams The upper bound plastiC theorem
states that of all the possible mechanisms or combinations
of plastic hinges sufficient to cause collapse the one that
ensures collapse at the lowest load is the correct mechanism
under which the member will actually fail Worleys experishy
mental results were in fairly good agreement with the ultimate
loads predicted by the upper bound theorem and were the most
accurate for the case of rectangular openings where hinge
locations were more easily predicted than for the other openshy
ing types Of the various opening shapes tested it was found
that the elliptical opening was the strongest on a maximum
area removed baSiS while the triangular was stronger on a
maximum depth basiS The practical need for these two shapes
especially the triangular is however questionable Worley
excluded the effects of shear and axial force in his analysis
and for rectangular openings assumed a four hinge mechanism
with hinges considered at the corners of the opening
19
In 1963 W-CSo(5) presented a study of large circular
openings in wide-flange beams including an ultimate strength
analysis based on the assumption of a plastic hinge over the
center of the opening Sots analysis however neglected
secondary bending effects due to Vierendeel action in the
vioinity of the opening and also ignored shear yielding
effects in the web The experimental investigation performshy
ed in the ultimate strength range consisted of the testing
of two l4WF30 beams to collapse The first beam was tested
in pure bending so that shear and Vierendeel action were not
present and the ultimate strength predioted by Sos analysis
would be expeoted to be oorreot since the same strength would
be predicted in this case whether or not these effects were
considered Deviation between experiment and theory was 3
The second beam was tested under moment gradient but due to
the relative location of opening and maximum moment (the
beam was simply supported and subjected to a single concenshy
trated load) the beam was expected to and did fail under
the load and not at the opening
S-y Cheng(15) in 1966 considered bending shear and
axial forces in his investigation of the ultimate strength
of extended circular openings in wide-flange beams At high
values of shear a four hinge mechanism was assumed while at
low shears hinges were assumed above and below the opening
20
where the tee section was smallest - similar to the failure
mode in pure bending Stress distributions were assumed at
hinge locations for each case Two l4WF30 beams were tested
to destruction one in pure bending and the other with a
moment to shear ratio of 24 inches which is a high value of
shear for the size beam used While reasonable agreement
between theory and experiment was obtained for both beams
tested an inherent fault in Chengs work lies in its inshy
ability to predict a continuous variation of failure loads
as the shear varies from a low to a high value It is
impossible for the change from a one to a four hinge mechanism
to occur suddenly with only a slight increase in shear
Experiments in the ultimate strength region were performshy
ed by I-C Chen(6) in 1967 on two 14WF30 beams each containing
two large openings in their webs One simply supported beam
containing two 8 inch diameter circular openings spaced 8
inches apart was found to fail in the manner of a be~u conshy
taining only one opening failure being associated with the
opening subjected to the largest moment both being under
the same shear force In the second beam containing two
8x12 inch reotangular openings spaced 4 inches apart the two
openings failed as a unit with four hinges forming at the
outer oorners opoundthe openings and the web between them evenshy
tually buckling No theoretioal ultimate strength analysis
was offered by Chen
21
In 1968 JEBower(16) proposed an ultimate strength
theory for beams containing a single rectangular opening in
their webs A point of contraflexure for Vierendeel stresses
was assumed to occur at the midlength of the opening and
three alternate stress distributions were proposed for
complete yielding of the low moment edge of opening The
first of these stress distributions assumed no Vierendeel
action and was quickly discounted as giving unrealistically
high predictions of strength The two remaining stress
distributions both took into account secondary bending moments
due to shear the first assuming localized web yielding in
shear and the second assuming uniform shear distribution
over part of the web with this area yielding in combined
bending and shear The first of these lower bound solutions
was based on an unrealistic stress distribution and proved
to give unrealistically low predictions of the beam strength
The second lower bound solution which was finally adopted
by Bower was based on a more realistic stress distribution
but was restricted in that the point of contraflexure was
assumed at the midlength of the opening which is not always
the case
Experiments were performed on four 16WF36 beams each
oontaining one rectangular opening as part of this work
Collapse loads are oited for each of the test beams and are
22
compared with predictions from the second lower bound analysis
However since all of the beams were tested at relatively high
ratios of shear to moment considerable strain hardening
would have occurred before collapse and experimental results
which take advantage of the reserved strength due to this
strain hardening (even though accompanied by large deformashy
tions) cannot justifiably be compared to a theory that ignores
this effect
A more general ultimate strength analysis for beams with
rectangular openings was offered by RGRedwood(17) also in
1968 A point of contraflexure was assumed to occur someshy
where within the tee section above and below the opening but
its location was not dictated as in Bowers analysis A
four hinge mechanism was assumed on the basis of previous
tests(13) with stress distributions assumed at both high
and low moment edges of the opening Shear stresses were
assumed carried by the entire web of the section with web
yielding occurring in combined bending and shear
Redwoods analysis was correlated with his previous
experimental investigations and found to be conservative
when shears were large But again the effects of strain
hardening were included in the experimental collapse loads
and not in the theory If the experimental failure loads
could be related to the occurrence of full yielding at the
23
critical sections a more valid comparison with the theory
would result Such a comparison was taken into account by
Redwood in a later paper(la) In this paper failure is defined
in a way similar to that suggested in the previous section
Another recent paper by Redwood(19) deals with beams
containing multiple unreinforced openings in their webs A
method is offered for determining the minimum spacing required
between openings to prevent their interaction and failure
as a unit An analysis is also given for determining the
strength of a member when failure is associated with more
than one opening and this is combined with Redwoods analysis
offered previously(17) for failure associated with only one
opening The theory is compared to the experimental work
performed by Chen(6) in 1967 (7)In 1964 EPSegner Jr conducted an investigation
of several types of reinforcing for rectangular openings
testing six wide-flange beams in four different sizes each
containing two or more openings The openings in five of
the six beams were reinforced each With one of five main
types of reinforcing The openings were positioned at
several different moment to shear ratios and each of the
beams was tested to destruction Unfortunately little can
be said about the performance of the different types of
reinforcing under varying moment-shear conditions because
24
of the large number of variables included in each of the tests
Perhaps Segners most significant contribution is to be
found in his cost comparison of the various types of reinshy
forcing for rectangular openings Estimates cited for six
different fabricators clearly indicate that shear-type reinshy
forCing or reinforcing designed to carry high shear forces
around the opening is economically non-feasible except in
unusual circumstances The most economical type of reinshy
forcing included in this study consisted of two flat plates
bent to fit the shape of the opening and welded inside the
opening with a small gap between them occurring at the midshy
depth of the opening This is the same type as shown in
Figure la Another type of reinforcing included in Segnerts
experimental work but unfortunately omitted from his eco~
nomic comparison consisted of straight horizontal reinforcshy
ing plates welded above and below the opening at the openingis
boundary The plates extended past the vertical edges of the
opening to allow for anchorage of the plate Considerable
welding problems were said to have been encountered by placing
the reinforcing flush with the upper and lower edges of the
opening since the fillet was likely to overrun into the radii
of the re-entrant corners but this could easily be overcome
by leaving a small web stub between the plate and the opening
to allow for welding This type including the modification
25
for welding purposes is that given in Figure lb
Although this reinforcing type was not included in the
economic comparison presented by Segner it would seem to be
of only slightly greater cost than that in Figure la
Approximately the same amount of reinforcing material is
needed for these two types and while the straight bar reinshy
forcing requires more welding it does not require bending
of the plates and eliminates the worry of fit between the
plate bends and the opening radii After giving careful
consideration to the economics and fabrication problems of
reinforcing a rectangular opening in the web of a beam it
was decided to devote the present investigation to reinforcshy
ing of the horizontal straight bar type
24 Scope of the Investigation
An ultimate strength analysis is presented for wideshy
flange beams containing large rectangular openings in their
webs and reinforced with straight bar reinforcing above and
below the openings The investigation includes the effect
on beam strength of variable opening depth to beam depth
opening length to depth reinforcing Size and moment to
shear ratio One lOWF21 and ten l4WF38 beams were tested to
collapse Each of the test beams contained one rectangular
opening centered at the middepth of the beam and ten of the
26
eleven openings were reinforced Deflections were measured
at several pOints for all of the test beams and each beam
was painted with a brittle coating of whitewash in the region
of the opening to obtain an indication of the order of onset
of yielding Four of the test beams were also equipped with
electrical resistance strain gauges at critical sections The
experimental investigation encompassed each of the variables
of the theoretical work
27
CHAPTER III
ULTI1iATE STRENGTH ANALYSIS
31 Assumptions
Based on the discussions in the previous chapters the
following assumptions are made in this analysis of reinforcshy
ed rectangular openings with horizontal reinforcing bars
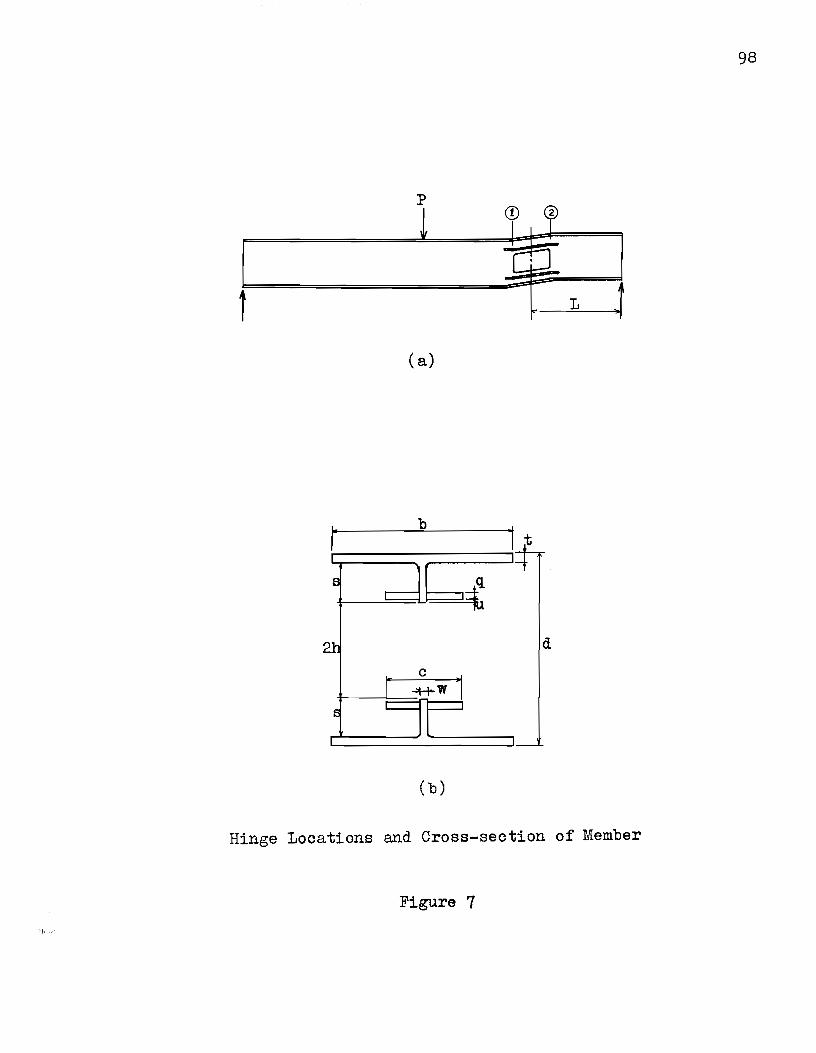
1 Failure of the member takes place by formation of a four
hinge mechanism with hinge locations being at the corners
of the opening These locations are shown in Figure 7a
a cross-section through the opening being given in Figure
7b
2 A point of contraflexure occurs somewhere within the
length of the tee section Its location is the same
above and below the opening but this location is not
dictated
3 Stress distributions at high and low moment edges of the
opening are those shown in Figure 8b Since the stresses
are antisymmetric with respect to the vertical axis of
the beam only the stresses for the tee-section above
the opening are indicated The resultant forces acting
on the tee-section are shown in Figure 8a
4 Shear stresses are carried only by the web of the teeshy
section and are uniformly distributed across this web at
28
hinge locations when hinges are fully formed While
the shear stress at the boundary of the opening must be
zero this assumption introduces only very slight error
into the theory since these stresses can increase from
zero to their maximum value at a very small distance from
the opening 1 s boundary_ Due to the presence of the reinshy
forcing bar it is likely that most of the shear will be
carried by the region of web between the reinforcing bar
and the flange particularly when the secondary bending
stresses are very high This is further discussed in
Section 34 and introduces no significant error in the
development of this method
5 Yielding in the web occurs lliLder combined bending and
shear according to the von Mises criterion stated in
equation (2) Yielding in the flange and reinforcing is
in direct tension or compression
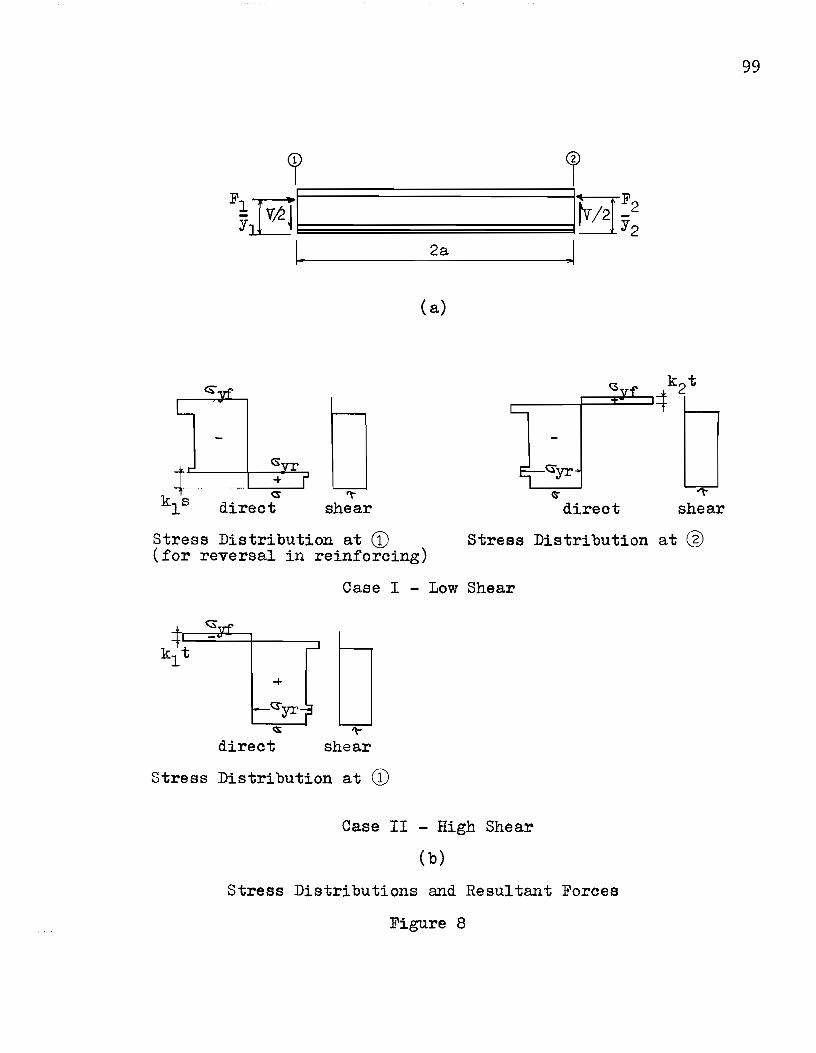
On the basis of the assumed stress distributions equishy
librium equations can be obtained for the tee-section at
values of the shear force which may vary in some cases
from zero up to the maximum as given by equation (5) At
the high moment edge of the opening section (1) in Figure
Bb stress reversal will occur within the web when the shear
force is relatively low (case I) but will occur within the
flange when the shear force is high (case II) These two
29
cases will be repounderred to as low and high shear conditions
respectively_ Three different locations of stress reversal
are possible under the low stress conditions
1 Reversal in the web stub below the reinforcing This
occurs at very low values of shear
2 Reversal in that portion of the web to which the reinshy
forcing is attached
3 Reversal in the clear web between reinforcing and flange
The range of shear values corresponding to reversal in
this region is very small
At section (2) the low moment edge of the opening for
practical situations reversal will occur only in the flange
32 Low Shear Solution - Case I
Consider equilibrium of the portion of the beam to the
right of Section (2) in Figure 7a Taking moments about
section (2) gives
where V denotes shear force as before F2 is the resultant
force at section (2) and Y2 is the distance from the edge of
the opening to the resultant normal F2bull All other symbols
used in this section and not specifically defined here are
defined in Figures 7 and 8 Taking moments about section (1)
30
for that portion of the beam to the right of this section
yields
(8)
where Fl and Yl are comparable to F2 and Y2 respectively
Equilibrium of the tee-section in Figure 8a requires that
(9)
Oonsideration of the assumed stress distribution at section (1)
for stress reversal occurring in the web stub below the reinshy
forcing ie for 0 =klS ~ u gives on integrating the
stresses
Fl = Af ~yf + SW(1-2~)G + Ar ~yr (10)
FIYl = Af ~ Yf(s~) + ~S2WG(1-2ki) + ArJ yr(u1) (11)
where Af = bt the area of one flange and Ar = q(c-w) the
area of one pair of reinforcing bars Separate yield stress
values are used for flange web and reinforcing because of
the large variation possible in these in a single beam A
discussion of the determination of these stresses is included
in Chapter 5 Yield stresses are designated as ~ yf for the
flange G yw for the web and ~ yr for the reinforcing
31
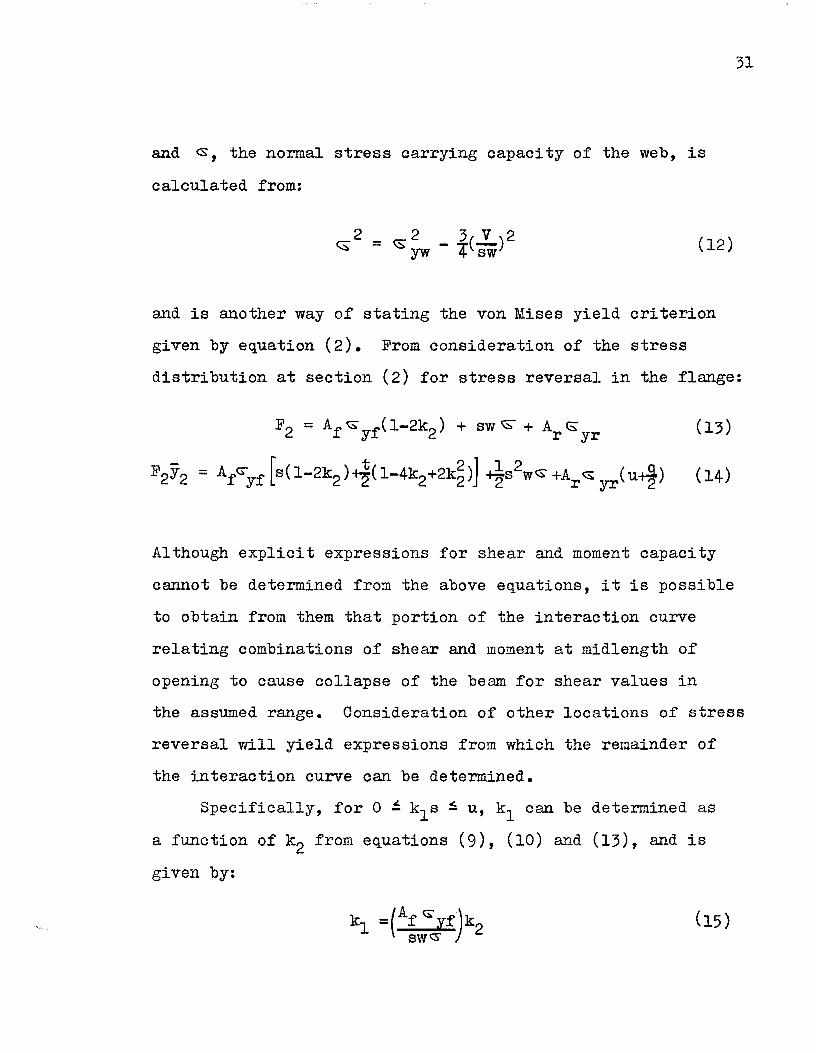
and ~ the normal stress carrying capacity of the web is
calculated from
t2 _ r- 2 3(V)2 ~ - yw-4sw (12)
and is another way of stating the von Mises yield criterion
given by equation (2) From consideration of the stress
distribution at section (2) for stress reversal in the flange
F2 = Af ltS yf(1-2k2) + sw ~ + Ar c yr (13)
F2Y2 = Al~Yf [S(1-2k2)~(1-4k2+2k~)J -1-s2Wlti +Ar~ yr(u~) (14)
Although explicit expressions for shear and moment capacity
cannot be determined from the above equations it is possible
to obtain from them that portion of the interaction curve
relating combinations of shear and moment at midlength of
opening to cause collapse of the beam for shear values in
the assumed range Consideration of other locations of stress
reversal will yield expressions from which the remainder of
the interaction curve can be determined
Specifically for 0 ~ kls ~ u kl can be determined as
a function of k2 from equations (9) (10) and (13) and is
given by
32
From equations (7) (8) (11) and (14) a quadratic expression
is obtained for k2 in terms of known quantities and V
Z [AfCSyf ] Vak2 (sw cs ) s + t + k2 ( -d+2h) + A G = 0 (16 )
f yf
For a given value of V equations (12) (15) and (16) can be
used to determine the corresponding values of kl and k2bull Fl
can then be calculated from equation (10) and FIYl from equashy
tion (11) The moment at mid1ength of opening is then detershy
mined from
(17)
Thus for a given value of V a corresponding value for M can
be obtained The values of kl and k2 must be checked when
calculated to determine whether initial assumptions of
o ~ k1s ~ u and 0 ~ k2 ~ 10 have been met Only one solution
to the quadratic equation in k2 will fulfill these requireshy
ments unless both solutions are equal The above equations
will yield a value for M for a given value of V starting at
V = 0 and continuing for increments in V until the location
of stress reversal at section (1) moves into the region where
the reinforcing is attached ie for kls gt u When this
occurs neither solution to equation (16) will yield values
of k1 and k2 that satisfy the initial assumptions and the
33
initial equations for stress resultants at section (1) must
be replaced by new equations reflecting this change Quite
simply equations (10) and (11) are replaced by
respectively for u ~ kls ~ (u+q) Equations (13) and (14)
remain unchanged for section (2) since reversal will occur
only in the flange at this section Thus for u ~ klS ~ (u+q)
ie for reversal within the reinforcing equations (9)
(13) and (18) yield
Similarly from equations (7) (8) (14) and (19)
- (d-2h)]
va u 2( c-w) Go s ( c-w) G
+ + [ _----oiOioV] [ yr IJ = 0 (21)AfGyf Af csyf sw cs- + s c-w) csyr shy
The same procedure is followed as in the previous case
first V being assumed ~ being obtained from equation (12)
34
k2 from equation (21) kl from (20) Fl from (18) FIJl from
(19) and finally from equation (17) the value of M correshy
sponding to the assumed value of V Again the values
obtained for kl and k2 must be checked to assure that the
initial conditions of u ~ kls ~ (u+q) and 0 ~ k2 ~ 10 are
met These equations will yield admissible values of kl
and k2 for values of V increasing from the last admissible
value obtained by solution of the previous set of equations
and continuing to where kls reaches the value (u+q) ie
for stress reversal in the clear web at section (1) ~nen
(u+q) ~ kls ~ s equations (18) and (19) are replaced by
(22)
and equations (9) (13) and (22) give
(24)
While from equations (7) (8) (14) and (23)
(25)
35
For a given value of V a corresponding value for M is
determined in the same manner as for the two previous cases
Acceptable solutions will be obtainable as long as the stress
reversal at section (1) falls within the clear web However
when this reversal occurs in the flange the so-called high
shear solution is indicated
33 High Shear Solution -Case 11
When the shear force is high stress reversal at section
(1) occurs in the flange and the equations for resultant
normal force and moment arm from the edge of the opening
become
Fl = Af ltS f(2k -1) - sw~ - A C (26)Y 1 r yr
The stress reversal at section (2) will still occur in the
flange and equations (13) and (14) are used with the above
equations and equations (7) (8) and (9) to obtain
(28)
(29)
36
For a given value of V a corresponding M is obtained from
the above equations and equations (12) and (17)
By starting with a value of V = 0 and increasing this
by a small increment with each successive iteration correshy
sponding values of M can be found for the full range of V
values by use of the equations in this and the previous
section An interaction curve can then be plotted relating
V and M over their full range of values A typical intershy
action curve is shown in Figure 9 for a beam containing a
reinforced opening where the curve has been nondimensionalized
by division of V and M by Vp and Mp respectively Also
indicated in this curve are the four regions corresponding
to the different locations of stress reversal at the high
moment edge of the opening
34 Limits of Interaction Curves
It is quite possible for the MM values for a certainp range of VV values on the interaction curve to be greaterp than 10 as can be seen in Figure 9 This simply means
that the reinforced opening can be stronger than the unperfoshy
rated beam for pure bending and for bending with very low
shear However values of MM greater than 10 have no realp practical significance because in such cases failure of the
beam would occur not at the opening but at some unperforated
37
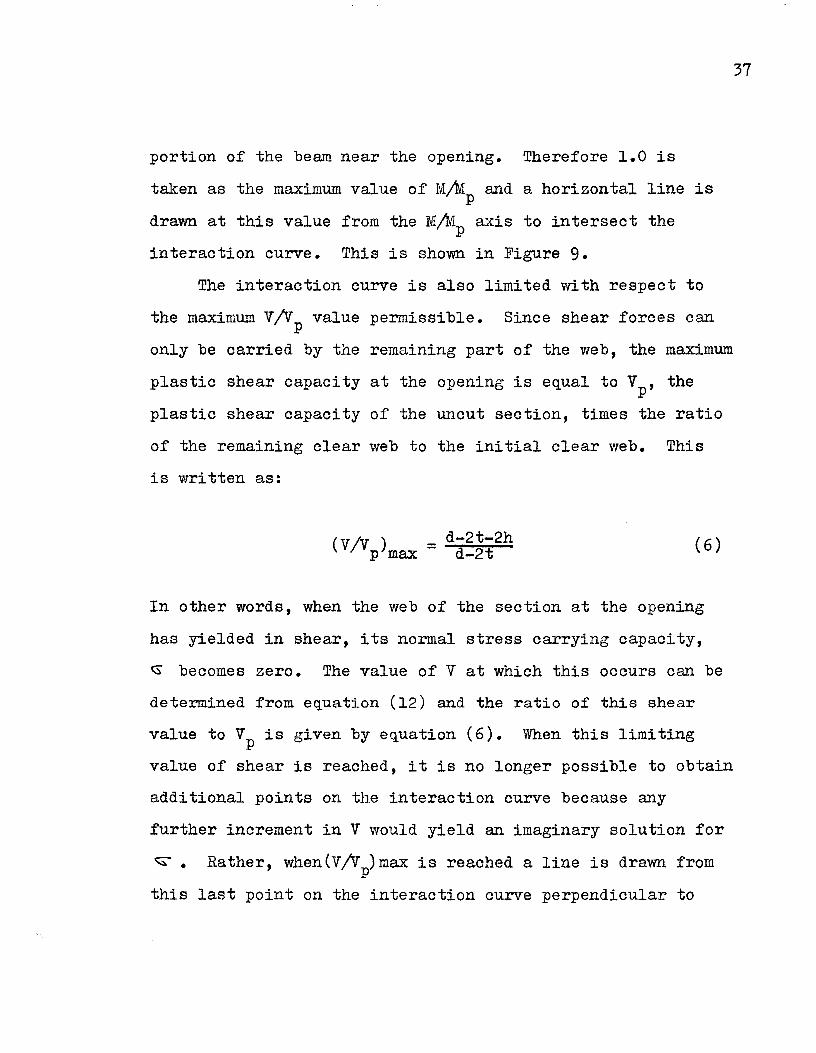
portion of the beam near the opening Therefore 10 is
taken as the maximum value of MM and a horizontal line isp drawn at this value from the MM axis to intersect thep interaction curve This is shown in Figure 9
The interaction curve is also limited with respect to
the maximum VV value permissible Since shear forces canp only be carried by the remaining part of the web the maximum
plastic shear capacity at the opening is equal to V thep plastic shear capacity of the uncut section times the ratio
of the remaining clear web to the initial clear web This
is written as
d-2t-2h (6)= d-2t
In other words when the web of the section at the opening
has yielded in shear its normal stress carrying capacity
~ becomes zero The value of V at which this occurs can be
determined from equation (12) and the ratio of this shear
value to Vp is given by equation (6) Vmen this limiting
value of shear is reached it is no longer possible to obtain
additional points on the interaction curve because any
further increment in V would yield an imaginary solution for
~ Rather when(VVp)max is reached a line is drawn from
this last point on the interaction curve perpendicular to
38
the vVp axis This line is the final portion of the intershy
action curve and represents the actual limiting value of
This limiting value of VVp is however not always
reached for all practical sizes of beam opening and reinshy
forcing It is possible for the equations in the previous
two sections to yield values of kl and k2 that no longer
conform to initial assumptions (for any position of stress
reversal) at a shear value less than the maximum predicted
by equation (6) This occurred in some of the cases tested
to confirm the consistency of these equations and was found
to be caused by an imaginary solution to the quadratic in k2
occurring while stress reversal at section (1) was still in
the clear web of the section Stress reversal at section (2)
was as assumed in the flange Consideration of other
locations of stress reversal did not give real answers This
condition was then investigated and it was found that because
of an interdependence of opening length and reinforcing area
either the opening length must be less than a given value or
the reinforcing area greater than another value in order
for the interaction curve to be able to pass this region
The limiting half length of opening a is given by
(30)
39
and is obtained by combining equations (7) (8) (14) (23)
and (24) with ~ equal to zero By eliminating small terms
this may be simplified to
(31)
Alternatively the minimum area of reinforcing required is
given by
A =2 ( 32) r 13
If this requirement is met it will be assured that the
maximum shear capacity of the section will be reached
Physically the interdependence of reinforcing area and length
of opening can be interpreted to mean that as opening length
is increased the secondary bending stresses which are a
function of shear and opening length increase at sections
(1) and (2) to such an extent that unless the reinforcing
area is increased so that it can carry these high stresses
the lower portion of the web is forced to carry such high
bending stresses that little or no shear can be carried by
this portion of the web The shear stress can then no longshy
er be considered to be uniform across the entire web of the
tee section but instead is restricted to the clear web
between flange and reinforcing or to a portion of this area
40
Reaching the maximum value of vVas given by equationp
(6) is not a necessity either for the interaction curve or
for the performance of a given beam and opening A given
interaction curve is still correct if it terminates before
reaching this value of vVp This occurs when the MMp value
decreases rapidly for very small increments in vvp and
becomes zero In this case the last portion of the intershy
action curve is very nearly a vertical line This line then
represents the actual maximum shear capacity for the given
beam opening and reinforcing dimensions Only when a beam
is to perform under high shear conditions and it is desired
to develop its maximum shear capacity is it necessary to
ensure that Ar is large enough so that this value can be
reached
41
CHAPTER IV
APPROXIMATE METHOD
41 General Remarks
If a particular beam and opening size is being investishy
gated over a very limited range of shear values it is a
fairly straightforward matter to calculate the moment capacity
of the beam corresponding to the given shear values using
the equations presented in the previous chapter hven if the
location of stress reversal were consistently assumed in the
wrong region the calculations would have to be repeated at
most four times for a particular shear value However it is
quickly realized that for a large range of shear values or
for a complete interaction curve it would be extremely
laborious to perform these calculations by hand and recourse
to automatic computation would seem almost essential A
computer program has been developed to perform the necessary
calculations for a complete interaction curve for a specified
beam opening and reinforcing size and is given in Appendix A
Since the practical development of a complete interaction
curve is seriously limited by the length of calculations
involved a simple to use approximate method is suggested for
determining the strength of a perforated beam at various
moment to shear ratios In the development of this approxishy
42
mate method the high shear region only is considered for
reasons which will become evident
42 DeveloEment of the Method
Combination of equations (3) (12) and (28) result in
the following expression
(33)
where for simplici ty ~I~- - ~Y= ~~ t the specified minimum
yield stress of the material Similarly equations (1) (17)
(26) (28) and (29) can be combined to give
M d(kl -k2) + t(k~-ki) (34) ~ = a-i) + wtf2t)~
Xf
and from equations (12) (28) and (29) kl and k2 are related
by
(35 )
If it is now assumed that the flange thickness is significantshy
ly less than half of the remaining clear web tlaquo s the
above expressions can be readily simplified Since (u+~) is
43
of the same order of magnitude as t it is also assumed that
(u+~) laquo By eliminating small terms and substituting for
kl+k -l-x = ~ equation (35) can be simplified to2 f
(36)
This simple quadratic can readily be evaluated for~ In
general both solutions will be real although for a wide
range of beam and opening sizes investigated the solution
corresponding to a minus in the quadratic formula was found
to fall within the region of low shear on the interaction
curve (as defined in the previous chapter) while the solution
corresponding to a plus consistently fell in the medium to
high shear region thus satisfying the initial assumptions
This latter solution was therefore considered to be the
correct one and the corresponding value for ~is given by A 2as [ 2 ] 12_2s2( r) + w2(s2~) _ 4A2
IS = If f)Af 3 r ( 37 ) - (s2 + 4a2 )
T
which may be rewritten as
_2~(Ar + l(Aw) ( 2h)2 1 ( r 2 ~ C = 1+01 If) 2 If l-er ~ - 16 X)(l+o)~ (38)
where Aw = wd and 0lt = i(~)2(k - 1)2
Equation (34) can also be simplified by eliminating small
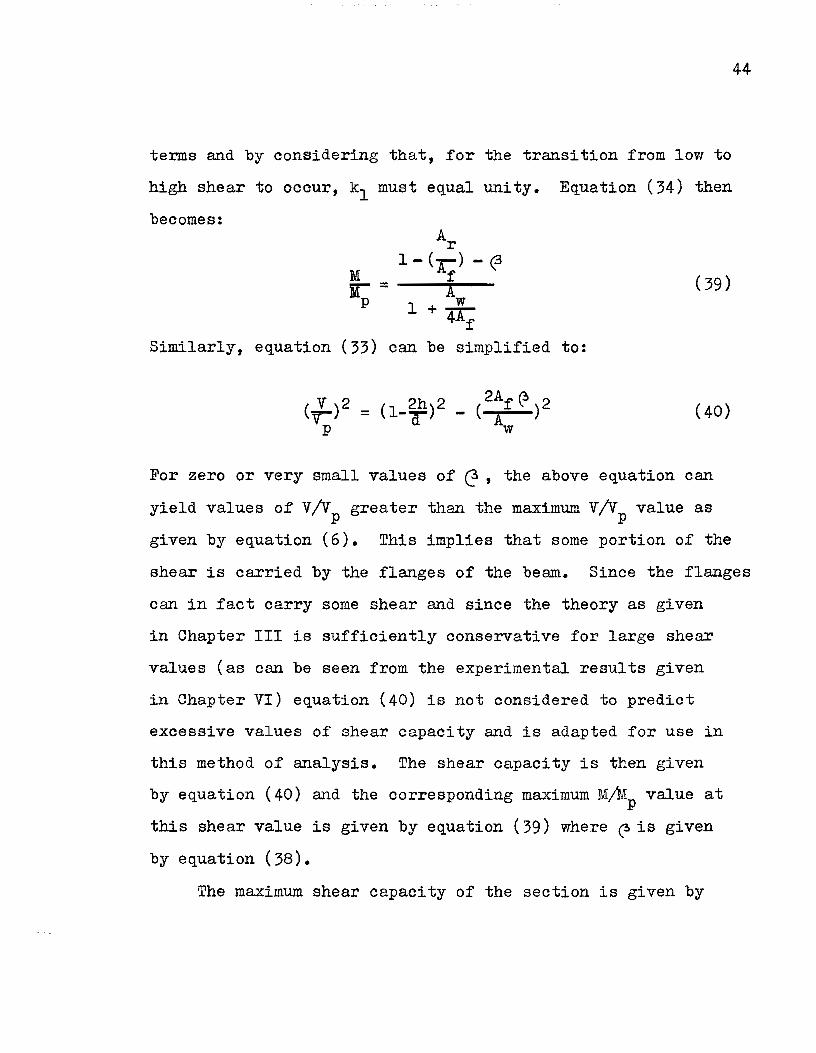
44
terms and by considering that for the transition from low to
high shear to occur kl must equal unity Equation (34) then
becomes
M (39 )M= p AW
1 + 4A f
Similarly equation (33) can be simplified to
(40)
For zero or very small values of ~ the above equation can
yield values of VV greater than the maximum VVp value as p
given by equation (6) This implies that some portion of the
shear is carried by the flanges of the beam Since the flanges
can in fact carry some shear and since the theory as given
in Chapter III is sufficiently conservative for large shear
values (as can be seen from the experimental results given
in Chapter VI) equation (40) is not considered to predict
excessive values of shear capacity and is adapted for use in
this method of analysis The shear capacity is then given
by equation (40) and the corresponding maximum M~Ap value at
this shear value is given by equation (39) where ~ is given
by equation (38)
The maximum shear capacity of the section is given by
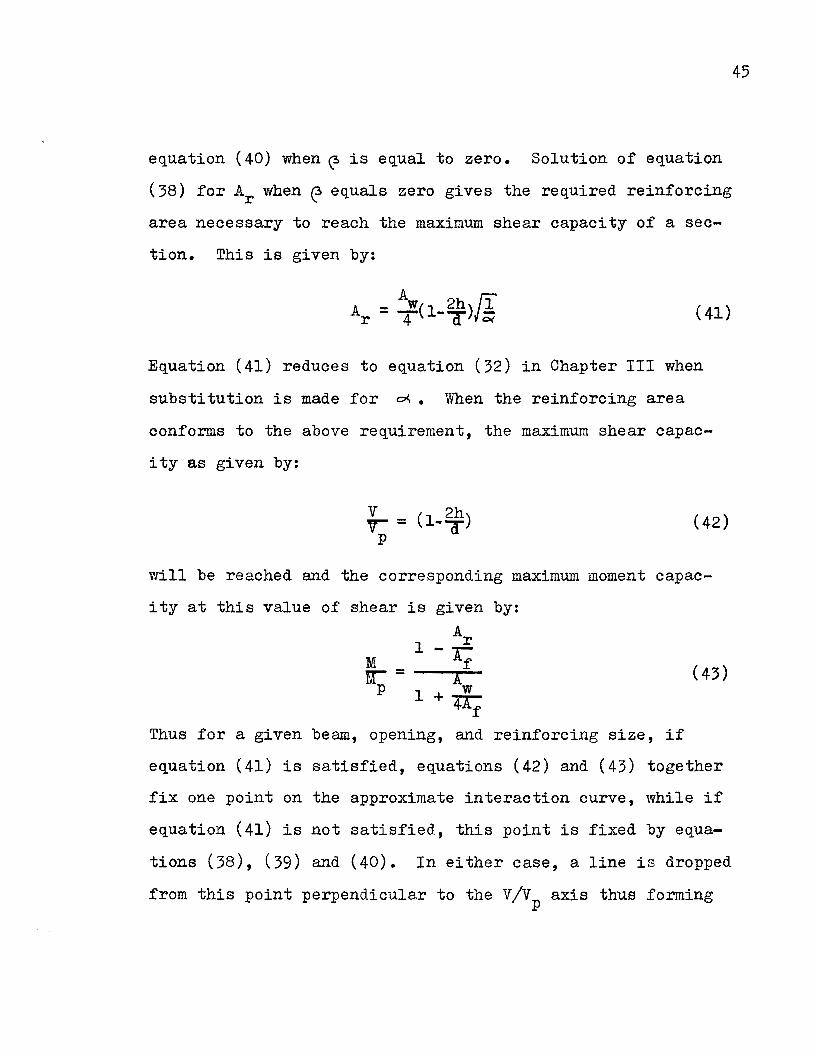
45
equation (40) when ~ is equal to zero Solution of equation
(38) for Ar when ~ equals zero gives the required reinforcing
area necessary to reach the maximum shear capacity of a secshy
tion This is given by
- AW(l 2h) flA (41)r - T -a-~
Equation (41) reduoes to equation (32) in Chapter III when
substitution is made for ~ When the reinforcing area
conforms to the above requirement the maximum shear capacshy
ityas given by
V 2hr = (I-a-) (42) p
will be reached and the corresponding maximum moment capacshy
ity at this value of shear is given by
Ar 1 - A
M fr= A p 1 + w
4Af Thus for a given beam opening and reinforcing size if
equation (41) is satisfied equations (42) and (43) together
fix one point on the approximate interaction curve while if
equation (41) is not satisfied this point is fixed by equashy
tions (38) (39) and (40) In either case a line is dropped
from this point perpendicular to the vvp axis thus forming
46
part of the approximate interaction curve The remainder of
the curve is obtained by connecting the point given by equashy
tion (42) and (43) or by equations (38) (39) and (40) with
a point on the M~Ip axis corresponding to the maximum moment
capacity of the section This maximum value of blfvl isp simply the plastic moment of the reinforced perforated secshy
tion divided by the plastic moment of the unperforated secshy
tion and is identical to the same point obtained in the
previous chapter with no shear force acting The maximum
value of Mi1p is given by
Z - wh2 + Arlt 2h+2u+q) = ---------w----------shyZ
or using a consistent approximation for Z this can be
rewri tten as
M A (45 ) M=
p 1 + w4Af
An approximate interaotion curve is given in Figure 9 for
comparison with the interaction ourve obtained by the method
desoribed in Chapter Ill
43 Limitations of the AEproximate Method
The maximum praotical M~lp value for the approximate
47
interaction curve is limited to 10 for the same reasons that
the more exact curve is so limited and a horizontal line
drawn from the MA~p axis at 10 and intersecting the approxshy
imate curve forms its upper portion The maximum value of
VVp for the approximate curve is limited to VVp max given
by equation (42) This limitation has been discussed in the
previous section
Equation (41) specifies the minimum size of reinforcing
necessary to reach the maximum shear capacity of the section
as given by equation (42) yVhen the reinforcing area conforms
to this minimum requirement equation (43) is used to predict
the moment capacity of the section corresponding to the shear
value of equation (42) Examination of equation (43) reveals
that as the reinforcing area is increased past the minimum
given by equation (41) the moment capacity decreases rather
than increases as would be expected from physical considershy
ations or from examination of interaction curves obtained
by the methods of Chapter Ill For sizes of reinforcing
only slightly greater than that given by equation (41)
equation (43) will be sufficiently accurate and will not
significantly underestimate the moment capacity of the secshy
tion although it may be deSirable to replace Ar in equation
(43) with the minimum Ar given by equation (41) Equation
(43) then becomes
48
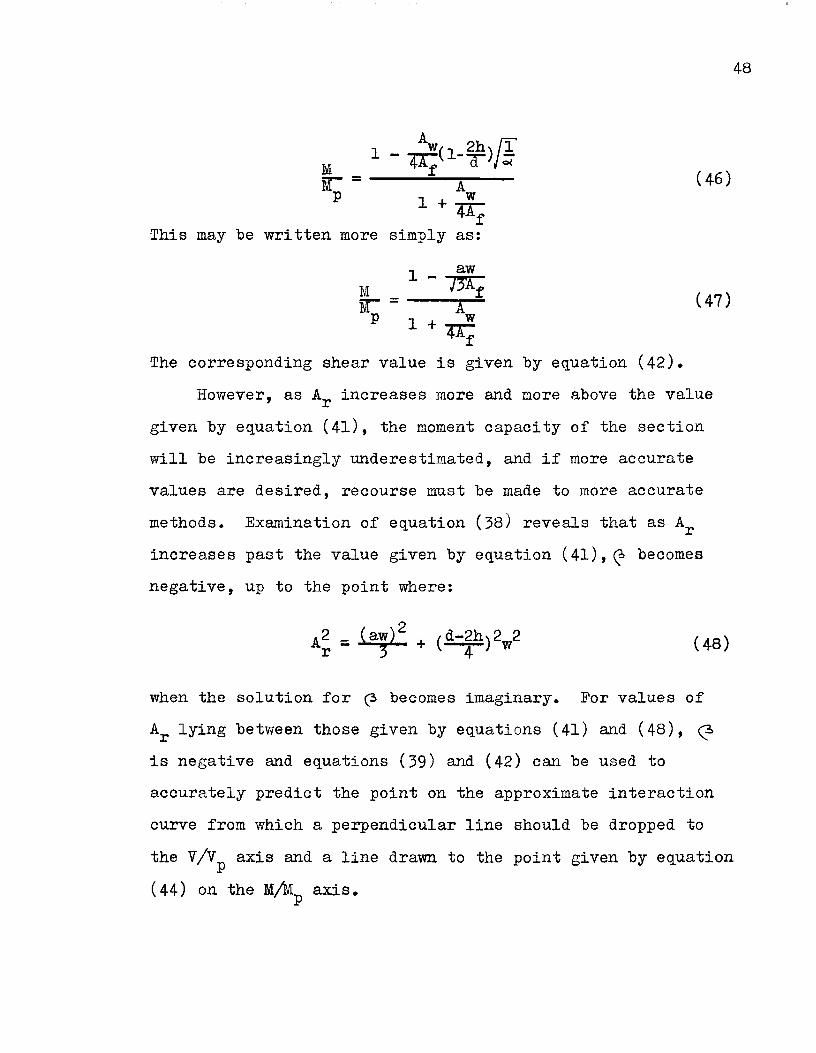
A 2h l1 - ~(l-a)J~
M ( 46)~= A 1 + W
4Af This may be written more simply as
aw 1 - 73Af
= ---1-shyA 1 + w
4Af The corresponding shear value is given by equation (42)
However as Ar increases more and more above the value
given by equation (41) the moment capacity of the section
will be increasingly underestimated and if more accurate
values are desired recourse must be made to more accurate
methods Examination of equation (38) reveals that as Ar
increases past the value given by equation (41) 0 becomes
negative up to the point where
when the solution for cgt becomes imaginary For values of
Ar lying between those given by equations (41) and (48) ~
is negative and equations (39) and (42) can be used to
accurately predict the point on the approximate interaction
curve from which a perpendicular line should be dropped to
the VVp axis and a line drawn to the point given by equation
(44) on the MM axisp
49
Al though for this case a value exists for (gt equation
(42) rather than (40) is used to determine the shear capacshy
ity of the section This is the only logical approach beshy
cause Ar is greater than that required to reach the maximum
shear capacity and increasing the reinforcing area although
it cannot increase the shear capacity of the section past
that given by equation (42) also should not serve to decrease
this capacity
When Ar is greater than the value given by equation (48)
equation (39) cannot be used to obtain a more accurate preshy
diction of moment capacity because 0 as given by equation (38)
will not be real Consideration of the equations used in
deriving the approximate method leads to the conclusion that
will be imaginary only when the maximum shear capacity of
the section is reached while klslaquou+q) Equation (48) shows
the relation between reinforcing area and size of opening for
this to occur It can be seen that small opening size or
large reinforcing size will eause the maximum shear capacity
to be reached while kls (u+q) When this occurs equation
(42) predicts the shear capacity of the section since Ar is
greater than that required by equation (41) to reach this
maximum shear value At this value of shear ~ equals zero
and equations (17) (20) and (21) in Chapter III reduce to
(49a)
(50)
50
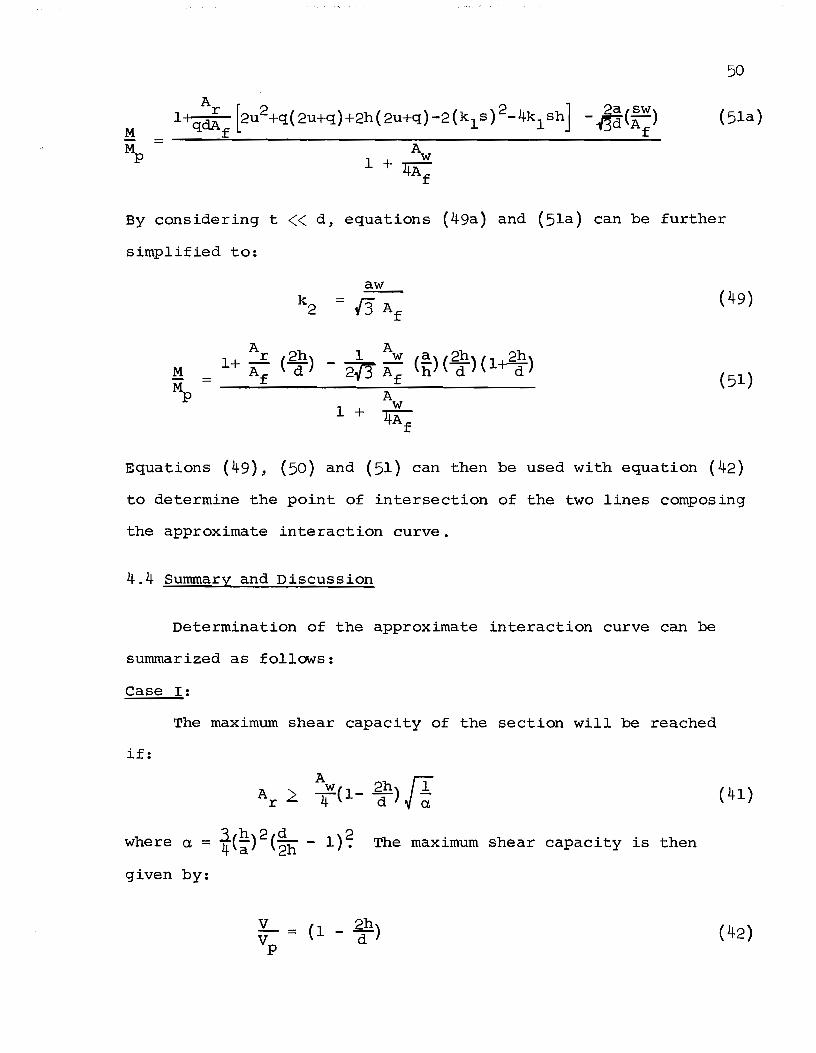
A q (5la )
M = _l_l_qdA_rf=--[2_U_2_+__(2_U_+_q_)_+_2_h_(_2U_+_q_)_-_2_(_k_l_S_)2_-_4_k_l_S_h_J_-_~_~_(_~~)
Mp Aw 1 + 1iA
f
By considering t laquo d equations (49a) and (5la) can be further
simplified to
(49)
(51)
Equations (49) (50) and (51) can then be used with equation (42)
to determine the pOint of intersection of the two lines composing
the approximate interaction curve
44 Summary and Discussion
Determination of the approximate interaction curve can be
summarized as follows
Case I
The maximum shear capacity of the section will be reached
if
A 2 AW(l_ 2h) fT (41)r 4 d 4a where a = ~(h)2(~ _ 1)2 The maximum shear capacity is then4 a 2h bull
given by
V (1 _ ~h) (42)Vp =
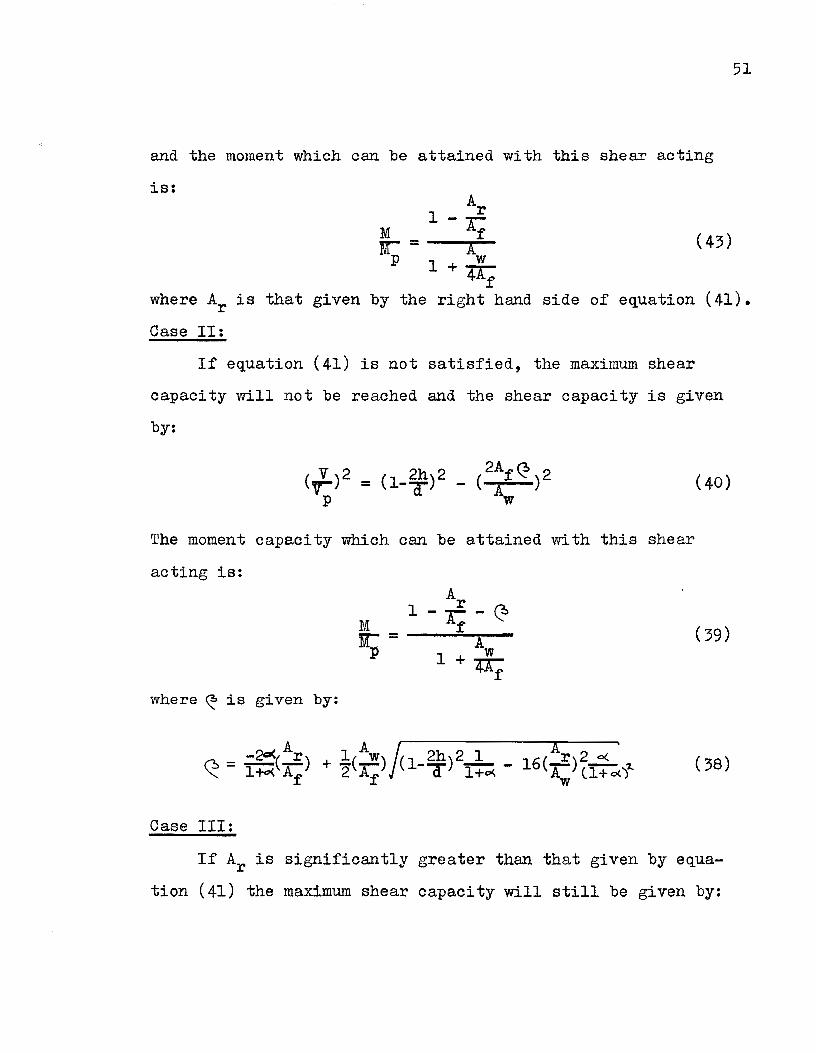
51
and the moment which can be attained with this shear acting
is Ar
1- ri- = Af (43)
p 1 + w 41f
where Ar is that given by the right hand side of equation (41)
Case 11
If equation (41) is not satisfied the maximum shear
capacity will not be reached and the shear capacity is given
by
(40)
The moment capacity which can be attained with this shear
acting is
1 1 + w
4Af where ~ is given by
A A _ ~( r) + l( w) ( 2h)2 1 ( r)2 0 ( )~ - 1+ltgtlt Af 2 If l-T 1+CgtI - 16 -x (l+olt)l 38
Case Ill
If Ar is significantly greater than that given by equashy
tion (41) the maximum shear capacity will still be given by
52
but if desired a more accurate estimate of the moment which
can be attained with this shear acting can be obtained as
follows
Case IlIA
For (48)
MMp at maximum VVp is given by
Ar 1 - I - ~
~ = __f_~_ ill A
P 1+ w4If
where r will be negative and is given by
(38)
Case IIIB
For A2 gt (aw) 2
+ (~)2w2 (48)r 3 ~
at maximum VV is given byp A A
1+-f(2h)__1_ JL (ha) (2dh ) (1+ 2dh )Af d 2[j Af (51)
A1 + w
4Af
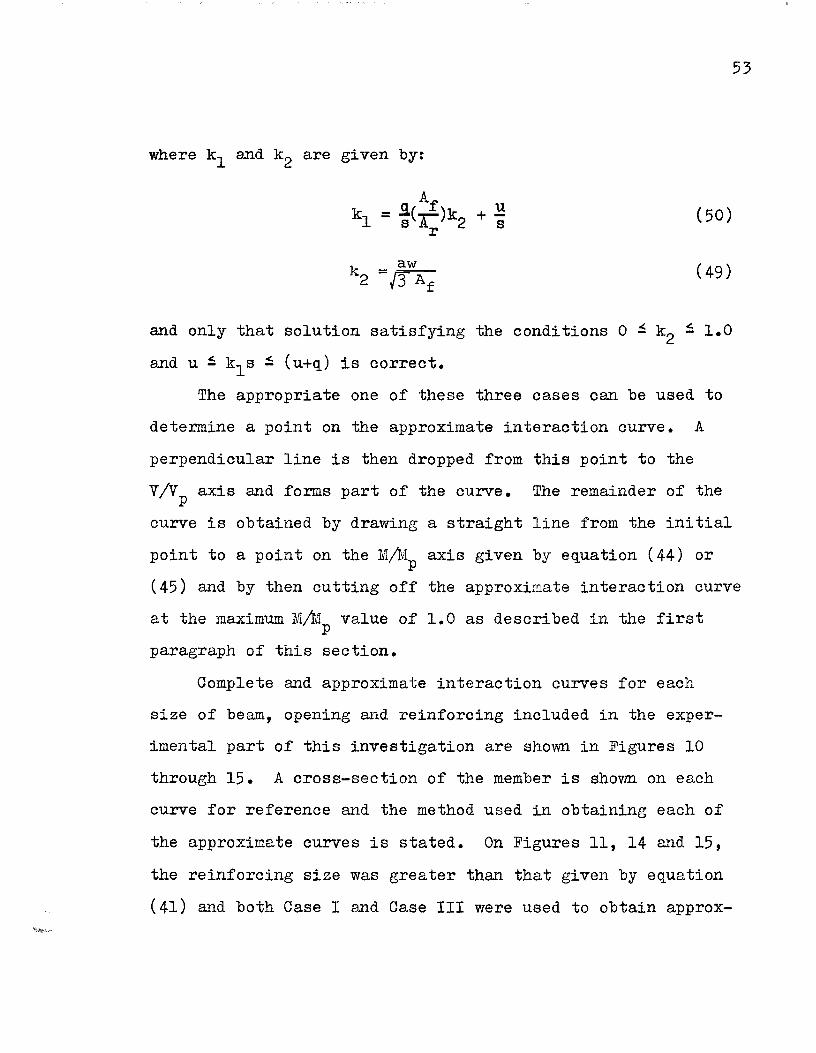
53
where kl and k2 are given by
+l (50)s
(49)
and only that solution satisfying the conditions 0 ~ k2 ~ 10
and u ~ kls ~ (u+q) is correct
The appropriate one of these three cases can be used to
determine a point on the approximate interaction curve A
perpendicular line is then dropped from this point to the
vVp axis and forms part of the curve The remainder of the
curve is obtained by drawing a straight line from the initial
point to a point on the MMp axis given by equation (44) or
(45) and by then cutting off the approximate interaction curve
at the maximum Mlyenip value of 10 as described in the first
paragraph of this section
Complete and approximate interaction curves for each
size of beam opening wld reinforcing included in the expershy
imental part of this investigation are shown in Figures 10
through 15 A cross-section of the member is shovm on each
curve for reference and the method used in obtaining each of
the approximate curves is stated On Figures 11 14 and 15
the reinforcing size was greater than that given by equation
(41) and both Case I and Case III were used to obtain approxshy
54
imate curves for comparison It can be seen that only when
the reinforcing area was significantly greater than that
given by equation (41) (Figure 11) was there a large difshy
ference in the Case I and Case III values
For the partioular case of unreinforced openings by
substituting for Ar equal to zero in equations (39) and (40)
these reduoe to
M AW 2h 1
1 - 2If(l-or~ r= A (52)
p 1 + w4If
v (2h)JTr = I-d~ p
where ~= i(~)2(~ - 1)2 as before These equations are
identioal to those given by R_GRedwood(17) for unreinforced
openings Again a perpendioular is dropped from the point
defined by these two equations to the vVp axis and another
line is dravln from this point to a point on the MMp axis
given by
111 Z - wh2 (54)r = z
p
thus oompleting the approximate interaction curve for the
case of an unreinforoed opening Using the same approxishy
mations as used previously equation (54) oan be written
55
MM = 1 (55) p
which agrees with Redwoods work and gives a slightly highshy
er value for the maximum MM value A complete and approxshyp imate interaction curve for a section containing an unreinshy
forced opening is given in Figure 12 where the equations
given by Redwood(17) were used for the complete curve
56
CHAPTER V
EXPERIMENTAL INVESTIGATION
51 Selection of Test Beams
As discussed in Chapter I it was decided to limit this
investigation to rectangular openings reinforced with straight
horizontal strips welded above and below the opening It
was also decided to use a standard wide-flange beam rather
than a welded section because of the usual use of these in
building structures where openings are most oommonly requirshy
ed ASTM A 36 structural steel was used throughout all
of the experimental work because this material was used in
most of the previous investigations related to this work
The size of the test beams was chosen on the basis of
economy ease of handling and ease with which reinforcing
bars could be welded in place It was decided to use a secshy
tion that was compact at the specified yield stress and
also at the higher yield stresses expected in the test
beams In the selection of test beams only sections with
low depth to thickness ratios were conSidered in order to
avoid the problem of web instability The flange width to
thickness ratio was also kept as low as possible in order to
avoid premature compression flange buckling On the basis
of these considerations and after a preliminary test pershy
57
formed on a 10VF21 section it was decided to carry out the
remainder of the experimental investigation using a 14WF38
section of A 36 steel The properties of the test beams
used are listed in Table 1 A nominal opening depth to beam
depth ratio of 05 was chosen because of the practical need
for openings of approximately this depth in larger beams and
also because investigations of unreinforced openings were in
this range One test beam included in this work had a nominal
opening depth to beam depth ratio of 0643 A basic opening
length to depth ratiO or aspect ratiO of 15 was chosen
again from practical considerations Two beams were includshy
ed with aspect ratios of 20
The corner radii of the opening had to be large enough
to avoid excessive stress concentrations that might cause
premature cracking of the corners and yet small enough to
not appreciably decrease the effective area of the opening
In previous investigations corner radii ranged from 14 to
one inch A 58 inch radius was used in this study for the
14WF38 beams and a 316 inch radius for the 10WF21 beam
The area of reinforcing for each opening was chosen so
that the moment capacity of the unperforated member would be
equalled or exceeded and the full shear capacity of the net
section could be utilized The moment capacity condition
requires that
58
wh2 gt- (56)2h + 2u + q
This follows from equation (44) The reinforcing area reshy
quired to meet the shear condition is given by equation (32)
in Ohapter 111 It was found that for the 14WF38 beam used
in this investigation with 2hd equal to 05 ~~d ah equal
to 15 the area of reinforcing required to meet these condishy
tions was approximately ~vice that given by the right hand
side of equation (56) One beam was tested in the high shear
range with reinforcing such that the interaction curve fell
short of VVp msx Again it should be mentioned that the
length u is that required for welding the reinforcing in
place and should be as small as possible The width of the
reinforcing bars q was chosen so that the width to thickshy
ness ratio did not exceed 85 as specified by the design
code(910) for ultimate strength design The anchorage
length of the reinforcing bars was also designed by use of
the AISC and OISO design codes on the basis of develshy
oping the full strength of the reinforcing bars at the edges
of the opening The ultimate strength loads were taken as
167 times those for elastic design as recommended by the
codes
The openings in all of the test beams were flame cut
the 10WF2l beam number lA having the corners drilled before
59
cutting and then having the rough edges ground to the proper
size Beams numbered 2A 2B and 3A were entirely poundlame cut
including corners and were not poundinished poundurther The remainshy
ing beams had drilled corners with the rest of the opening
being poundlame cut They were not finished poundUrther
All test beams were simply supported and were loaded with
a single concentrated load The openings were positioned so
as to achieve the desired moment to shear ratios and all
openings were centered at the middepth opound the beam All beams
were locally reinpoundorced with cover plates so as to ensure
poundailure at the openings and web stipoundfeners were added under
the load and at reaction points Local reinpoundorcing was deshy
signed on the basis opound resisting the loads predicted by the
interaction curves plus the expected increase in loads above
this due to strain hardening Beam Sizes opening locations
and local reinpoundorcing are shown in Figures 16 17 and 18 poundor
each opound the test beams
52 Experimental SetuE
All beams were tested in a Baldwin-Tate-Emery 400k
Universal Testing Machine which is a mechanically operated
hydraulic testing machine opound 400k capacity The ends opound the
beam were supported by a specially reinpoundorced 14 inch wideshy
poundlange section that also poundormed part of the lateral bracing
60
system This is shown in Figures 19a and 20a Lateral bracshy
ing consisted of support against horizontal displacement and
rotation at pOints of load and at end reactions Bracing
for the beams numbered lA 2A and 3A was achieved by the
attachment of horizontal 8 inch wide-flange beams to the
vertical portion of the end supports with the 8 inch secshy
tions running the entire length of the test beams on each
side and positioned so that pins could be inserted at bracshy
ing points between the 8 inch sections and the top flange of
the test beam to allow for only vertical displacements of the
test beam The pins were given a heavy coating of grease to
minimize friction This type of bracing proved satisfactory
but made it very difficult to see parts of the test beam durshy
ing the test To alleviate this visual problem beam 2B was
tested with the lateral bracing described above on only one
side of the beam while for the other side vertical bars
attached rigidly to the 8 inch sections and bent to pass
over the test beam were held tightly against the upper flange
of the test beam at bracing points This arrangement proved
unsatisfactory and was not used for subsequent tests
For testing the remaining beams short 8 inch wide-flange
sections were attached vertically to the vertical portion of
the end supports and greased pins were used to provide latershy
al bracing at these locations (Figures 19b and 20b) Lateral
61
bracing at the point of load was provided by roller bearings
- two on each side of the test beam spaced 6 inches apart
vertically and bearing against the web stiffener of the beam
The roller bearings were attached to triangular sections
which in turn were attached to a wide-flange section held
rigidly to the laboratory floor See Figures 19c 20c
and 20d This type of lateral bracing provided nearly
frictionless vertical displacement of the beam while preshy
venting rotation and horizontal displacements and proved
to be very effective Access to the beam during testing
was not at all limited by this bracing system
Deflection dial gauges with a least reading of 0001
inch were used to determine deflections at points of load
end supports edges of openings 2 inches outside each openshy
ing edge and at centerline of beam when possible All dial
gauges were rigidly fixed to non-yielding supports Their
positions are indicated in Figures 16 17 and 18 Four of
the test beams were equipped with electrical resistance strain
gauges in the vicinity of the opening The locations of
these gauges are shown in Figure 21 Each test beam was
painted with an opaque brittle coating of whitewash - a
mixture of lime and water of the consistency of light cream
applied in the vicinity of the opening at least one day before
testing During testing this coating of whitewash flaked
62
off in minute pieces in areas undergoing plastic strains thus
indicating visually which sections of the beam had yielded
The flaking occurred at loads higher than those correspondshy
ing to yielding of each section and did not give an accurate
measure of the onset of yielding but instead gave an estishy
mate of the order in which each of the sections yielded
53 Testing Procedure
Essentially the same procedure was followed in testing
each of the beams The beam was first placed in position on
its end supports a fixed roller under one end and a free
roller under the other The bema was made level and centershy
ed with respect to its loading point and end supports
Lateral bracing was then fixed in place and the head of the
machine brought into contact with the specially hardened
roller through vhich the load was applied to the beam Dial
gauges were then put in position and strain gauge leads
connected to the Budd Automatic Strain Indicator A small
initial load was then applied to the beam and zero readings
were taken for all strain and dial gauges
At least four load increments of either lOk or 20k were
applied within the elastic range with all gauge readings beshy
ing recorded for each load increment When the first inshy
elastic response of the beam was noted either from strain
63
gauge readings on the beams that were so equipped or by
deflection vdth time of any of the dial gauges the load
increment was reduced to 5k and after each load increment was
applied all plastic flow was allowed to take place before
readings were taken To determine whether plastic flow had
ceased at each load increment dial gauge readings were plotshy
ted against time When the S-shaped curve reached its upper
portion and levelled out plastic flow had ceased and readshy
ings were taken During this time required for plastic flow
as much as 30 minutes for higher loads it was important to
hold the load on the beam constant Loading continued in
this manner until the ultinlate collapse of the test beam
either by web buckling at the opening or by tearing of one
or more of the openings corners When this occurred the
beam was no longer able to maintain the applied load The
load was then removed and the beam was taken out of the test
frame
54 Determination of Yield Stresses
In order to accurately access the expected strength of
each of the test beams it was necessary to determine their
actual yield stresses This was accomplished by the testing
of tensile coupons cut from the flange ana web of the beams
and from the reinforcing strip used at the openings The
64
dimensions of a typical tensile coupon are given in Figure 22a
and the locations from which such coupons were taken are shown
in Figure 22b The beams from which coupons were to be taken
were ordered an extra 12 inches long so that this section could
be cut off and tensile coupons made and tested before the testshy
ing of the actual beam Reinforcing strip was ordered an extra
36 inches long for the same purpose Test beams 2A 2B and
3A were all cut from the same beam and were all reinforced
from the same reinforcing strip Test beams 2C 2D 3B 4A
4B 5A and 6A were all cut from the same beam Reinforcing
for beams 2C 2D 4A and 4B was all cut from the same strip
Each of the tensile coupons was tested in either a 20k Riehle
or a 20k Instron Testing Machine Coupons tested in the
Riehle machine were tested under nearly constant load rate
An extensometer was attached to the coupons to automatically
record the stress-strain curves Since the crosshead
position could not be fixed on this particular machine
a static yield stress could not be obtained and therepoundore
only the lower yield stress is given in Table 2 Tensile
coupons tested in the Instron machine were loaded at a
constant cross head speed of 002 inches per minute When
the plastiC plateau was reached the crosshead position was
fixed and the load was allowed to drop off After about five
minutes the static yield stress had been reached and no
65
further change in load could be seen on the automatically
recorded stress-strain curve Straining was then allowed to
continue into the strain hardening range A typical stressshy
strain curve for a coupon tested in this machine is given in
Figure 23 Lower yield and static yield stresses are given
for coupons tested in the Instron machine in Table 2
Either the static yield or the lower yield stresses can
be used in determinimg the expected strength of a test beam
depending on which more closely approaches the actual test
conditions of the beam In this investigation the beams
were tested under loading increments with the loads being
held constant until plastic flow had ceased Since it was
thought that the method of obtaining the lower yield stresses
more closely paralleled the actual testing procedure these
stresses were used in evaluating the expected strength of
the test beams
66
CHAPTER VI
EXPERIMENTAL RESULTS
61 Behavior of Beams during Testing
Since the behavior of all the beams during testing was
quite similar a complete description of only one such typshy
ical beam number 20 is given here Deviations from this
typical behavior are discussed at the end of this section
Beam 20 was first tested elastically to a load of 80k
in lOk increments and was then unloaded Strain gauge and
dial gauge readings were taken at each load increment and
were analyzed After it was determined from these readings
that strain gauges and automatic recording equipment were
in good working order the beam was reloaded this time to
be tested to destruction This check was run for only this
one test beam all others being tested continuously through
elastic and plastic ranges
An initial load of 5k was again applied to the beam and
strain and dial gauge readings taken The load was then inshy
creased to 80k in 40k increments (lOk or 20k increments were
used in all other tests because separate elastic tests were
not performed on these) and then to 120k in lOk increments
With the load held stationary a slight increase of deflecshy
tion with time was noted on the dial gauges at this load so
67
increments were decreased to 5k bull
At l30k slight lateral deflection of the beam at the
opening was noted although this deflection never became exshy
cessive throughout the remainder of the test Strain gauge
readings first indicated yielding at both the bottom edge of
the upper reinforcing bar at the low moment edge of the openshy
ing (Figure 21 gauge 25) and at the top edge of the top
flange at the high moment edge of the opening (gauge 17) at
a l35k load When the load was increased to 140k yielding
occurred at the other top edge of the top flange at the high
moment edge of the opening (gauge 19) At a load of 145k
yielding had occurred at the center of the top flange at the
high moment edge of the opening (gauge 18) and also in the
web at the centerline of the opening (rosette gauge 10 11
12) At 155k the web at the high moment edge of the openshy
ing had yielded (rosette gauge 13 14 15) as had the web at
the low moment edge of the upper reinforcing bar (rosette
gauge 4 5 6) Slight displacement between the ends of the
opening could be seen at a load of l60k and at l65k the
lower edge of the upper reinforcing bar at the high moment
edge of the opening (gauge 20) had yielded
At l70k the upper edge of the upper reinforcing bar at
the high moment edge of the opening had yielded (gauge 21)
thus making the yielding at the high moment edge of the openshy
68
ing complete (based on average strain values for the flange
and reinforcing) While at this load the first flaking of
the whitewash was noted at both the upper low moment and
the lower high moment corners of the opening The web at the
middepth of the beam between the low moment ends of the reinshy
forcing yielded at 175k (rosette gauge 1 2 3) and whiteshy
wash flaking was detected on the underside of the top flange
at the high moment edge of the opening At lSOk the web at
the low moment edge of the opening (rosette gauge 7 S 9)
yielded and whitewash flaking occurred along the web immedishy
ately beneath the upper reinforcing bar from the low moment
corner of the opening to beyond the low moment end of the
reinforcing bar and also in the web above and below the
opening At 185k whitewash flaking occurred at the lower
low moment corner of the opening and in the web immediately
above the lower reinforcing bar from the corner of the openshy
ing to the low moment end of the reinforcing bar Yielding
occurred at the center of the top flange at the low moment
edge of the opening (gauge 23) at 190k and also at the top
edge of the upper reinforcing bar at the low moment edge of
the opening (gauge 26) This made yielding at the low moment
edge of the opening complete (based on average strain values
for the flange and reinforcing) At this same load whiteshy
wash flaking occurred in the web above and below the low
69
moment end of the upper reinforcing bar
The first strain hardening was also indicated from
strain gauge readings at the load of 190k and occurred in
the web at the centerline of the opening (rosette gauge 10
11 12) At 195k whitewash flaking occurred in the web
between the low moment ends of the upper and lower reinforcshy
ing bars Yielding occurred at the lower edge of the top
flange at the high moment edge of the opening (gauge 16) at
200k and strain hardening occurred at the upper edge of the
top flange at the high moment edge of the opening (gauge 17)
and at the lower edge of the upper reinforcing bar at the
high moment edge of the opening (gauge 20)
At 211k a crack developed in the lower low moment corshy
ner of the opening and it was no longer possible to maintain
the applied load The beam was then unloaded and removed
from the test frame The crack which occurred at the corner
radius was one half inch long and was inclined toward the low
moment end of the lower reinforcing bar A photograph of this
beam after completion of the test can be seen in Figure 24
Of the remaining beams in the test series only 2D 3B
and 4B were implemented with strain gauges the others having
only the brittle coating of whitewash to indicate the order
of onset of yielding The first of these beams to be tested
lA was given too thick a coating of whitewash and the flaking
70
of this whitewash during testing was not as satisfactory as
on other tests Similar problems were encountered with 2A
which had to be given a second coating of whitewash because
most of the first coat was rubbed off due to improper handshy
ling of the beam before testing The flaking off of the whiteshy
wash on beam 2B during testing was also not as good as was
expected although the whitewash had not been applied too
thickly This beam was tested on an extremely humid day
and it is thought that the problem with the whitewash flaking
was due to this excessive humidity
The order of onset of yielding as indicated by strain
gauge readings is given for each of the strain gauged beams
(20 2D 3B 4B) in Table 3a while the order of onset of
strain hardening is given for these beams in Table 3b Loads
corresponding to complete yielding of the cross-sections are
also given The order of whitewash flaking for each of the
beams is given in Table 4 Ultimate loads are also given
along with the mode of collapse of the beam
Of the eleven beams tested all but one were tested to
collapse The test of beam lA was terminated when deflecshy
tions became excessive although no web buckling or tearing
of corners had occurred and the beam was still able to mainshy
tain the applied load Only one of the beams tested to
collapse ultimately failed by web buckling This was the
beam with the unreinforced opening 6A All of the other
71
beams suffered ultimate collapse by the tearing of one or two
of the corners of the opening Beams 2A 2B 2C 3A 4A 4B
and 5A developed cracks at the lower low moment corners of the
openings Beam 3B cracked at the upper high moment corner of
the opening and beam 2D developed cracks at both the lower low
moment and the upper high moment corners of the opening simulshy
taneously Photographs of each of the test beams after collapse
are shovm in Figure 24 Comparison photographs of the beams for
variable moment to shear ratio reinforcing size aspect ratio
and opening depth to beam depth are given in Figures 25 and 26
62 Stress Distributions and Failure Loads
Based on measured strains stresses were calculated for
beams 2C 2D 3B and 4B Elastic stresses were determined
from the usual elastic theory while plastiC stresses were
determined from plasticity theory presented by Hill(8) and
reduced to the form given by Bower(l6) Initiation of strain
hardening was also determined from this method which is
summarized in Appendix B
Stress distributions at the high and low moment edges
of the opening of beam 2C are shown in Figure 27 while those
at the centerline of the opening and across the flange at the
high moment edge of the opening are given in Figure 28 The
variations in bending stress across the length of the opening
72
at the center of the top flange and at the top of the upper
reinforcing bar are shown in Figure 29 Figure 30 shows the
stress distribution at the high and low moment edges of the
opening for beam 3B and the stress distributions at the high
moment edge of the opening of beams 2D a~d 4B are given in
Figure 31
Experimental failure loads for each of the test beams
were determined from the load-deflection curves for each
test as described in Chapter 11 These curves and their
corresponding failure loads are given in Figures 32 through
42 Interaction curves based on the analysis presented in
Chapter III were dravn for each of the test beams using the
actual measured dimensions and yield stresses for each beam
The experimentally deterrQined failure loads were plotted on
these curves which are given in Figures 43 through 50
Approximate interaction curves for nominal dimensions and
yield stresses are also included in these figures
63 Other Factors
Of the eleven beams tested only one underwent signifshy
icant lateral buckling during testing Beam 2B buckled
laterally at the high moment edge of the opening due to the
inadequate lateral support provided as described in Chapter
V However final collapse of this beam was due to the tearshy
73
ing of one of the corners of the opening and not to the
lateral buckling Also the lateral buckling was not
significant until after the very high loads associated with
strain hardening were reached The modified lateral support
system shown in Figures 19b and c and 20bc and d and discussshy
ed in the previous chapter effectively prevented lateral
buckling of the remaining test beams and no further diffishy
oulties were encountered due to this factor
For each of the test beams lateral deflections were
largest at the high moment edge of the opening although they
never became significant except in the case of beam 2B A
curve showing lateral deflection at the high moment edge of
the opening versus shear force at the opening is given for a
typical test beam 20 in Figure 51 The shear corresponding
to the experimental failure load is indicated on the curve
and the laterally unsupported length of the beam is given
The laterally unsupported length of the test beams did not in
any case exceed the lengths specified by the design codes(9 10)
Local buckling of the top flange occurred at the high
moment edge of the opening for several of the beams tested
although this buckling always occurred at very high loads
after considerable strain hardening had taken place Figure
52 shows the difference in strain readings between the upper
and lower edges of the flange at the high moment edge of the
74
opening versus the shear force at the opening for a typical
test beam 20 The distribution of stresses across the width
of the flange at the high moment edge of the opening (Figure
28b) show a relatively uniform distribution up to yielding
at this location However the effects of local flangebull
buckling can be seen by the considerably higher compression
stresses at the edges of the flange at very high values of
shear
The nine beams containing reinforced openings which were
tested to destruction all exhibited an effect which was preshy
viously unexpected The strain gauge readings for rosette
gauges 1 2 3 and 4 5 6 on beam 20 (Figure 21) as well as
the whitewash flruring on all nine of these beams indicated
widespread yielding of the web between the low moment ends of
the reinforcing bars This effect occurred at loads near the
experimental failure loads of the beams but did not interact
with the development of hinges at the corners of the openings
because of the extension of the reinforcing bars well past
the edges of the openings In addition to the shear yielding
in the web between the low moment ends of the reinforcing
bars the whitewash flaking on beams 2D and 4A also indicated
the same type of yielding occurring at slightly higher loads
in the web between the high moment ends of the reinforcing
bars The whitewash flaking in these areas was sufficient
so that it can be seen in some of the photos in Figure 24
75
The shear yielding that occurs in the web between the
ends of the reinforcing bars may be due at least in part to
the development of the strength of the reinforcing bar withshy
in a short part of its anchorage length Considering the
reinforcing bar in compression above the opening it can be
seen that since its strength must increase from zero at the
ends the unbalanced compression force in the beam causes a
shearing force to occur in the web which at the low moment
end of the reinforcing is additive to the existing shears
(due to the vertical shear force on the beam) below the reinshy
forcing and subtracted from those above This is illustrated
in Figure 53 In the same manner the shears resulting from
the tension in the lower reinforcing bar act in the same
direction as and are added to those in the web between the
reinforcing bars while being subtracted from those in the web
between reinforcing and flange At the high moment ends of
the reinforcing bars the same effect can occur since the top
reinforcing bar is usually in tension while the lower bar is
in compression Again the shears between the reinforcing bars
are increased while those between reinforcing bar and flange
are decreased This would account for the yielding in the web
between the low moment ends of the reinforcing bars for all
of the reinforced beams tested to collapse as well as explaining
76
the yielding in the web between the high moment ends of the
reinforcing bars for beams 2D and 4A
77
CHAPTER VII
ANALYSIS OF RESULTS
71 Order of Onset of Yielding
Comparison of the order of onset of yielding as detershy
mined by strain gauge readings and whitewash flaking in
Tables 3 and 4 indicates that the whitewash flaking is a
reliable method of estimating the order of onset of yieldshy
ing Actually since the strain gauges were only at scattershy
ed locations while the whitewash covered the entire area
around the opening the whitewash flaking is a considerably
more complete guide to the order of onset of yielding It
can also be said that yielding begins first at the corners of
the opening as indicated by the whitewash consistently
flaking first at these locations even though it was impossishy
ble to confirm this by strain gauge readings since gauges
could not be fitted in these locations
The yielding patterns clearly indicate that failure of
the beams occurred by complete yielding of the cross-sections
at the edges of the openings ie at the assumed hinge
locations The formation of hinges at these locations was
accompanied or followed by the shear yielding of all or part
of the web along the length of the opening and by the shear
yielding of the web between the low moment ends of the reinshy
78
forcing bars and in two cases also between the high moment
ends of the reinforcing bars The increase in load past the
formation of the first hinge is accompanied by localized
strain hardening Since the corners of the opening yield
considerably before other locations strain hardening probshy
ably begins at these corners well before the first hinge is
completely formed Yielding in the web above and below the
opening does not seem to become complete until considerable
rotation has occurred at the hinge locations The complete
yielding of the web in these areas would indicate that the
full shear capacity of the member is utilized
72 Stress Distributions
Experimental bending and shear stresses are shown for
each of the strain gauged beams (20 2D 3B 4B) in Figures
27 through 31 Straight lines have been drawn through pOints
representing measured stresses although this does not mean
that the variation is necessarily linear Examination of
each of these stress distributions shows that stresses inshy
creased in proportion to increasing loads while the stresses
were still elastic While in the elastic range the neutral
axis remained in approximately the same pOSition but startshy
ed to move after the first yielding had occurred at each
cross-section This is as would be expected
79
Since strain gauge readings were not available for the
edges of the opening it is impossible to follow the complete
progression of yielding for the various cross-sections from
strain gauge readings However since it is lcnown from the
whitewash flaking on the test beams that yielding occurs
first at the corners of the opening where stress concentrashy
tions are high it can be said that at the low moment edges
of the openings (beams 2C and 3B) yielding began first at the
corners of the opening and then progressed to the reinforcshy
ing bars and web before the flange yielded At the high
moment edges of the openings yielding in the flange occurrshy
ed at lower shear values This would be expected from conshy
siderations of the total stresses (primary bending stresses
plus secondary bending stresses due to Vierendeel action) at
the cross-section in question At the flange the secondary
bending stresses are added to the primary bending stresses
at the high moment edge of the opening but subtract from the
primary bending stresses at the low moment edge of the openshy
ing The experimentally determined stress distributions at
the high and low moment edges of the openings are completely
compatible with those assumed in the development of the
theory in Chapter III (Figure 8) Bending stress distribushy
tions along the length of the opening at the top of the upper
reinforcing bar and at the centerline of the top flange show
80
the expected high stresses at the edges of the opening due
to the secondary bending stresses (Figure 29)
Comparison of stress distributions with those presented
by Bower(16) for beams with unreinforced rectangular openings
shows that the addition of horizontal reinforcing bars above
and below the opening changes the position of the neutral
aXiS but does not alter the location where the highest
stresses occur and plastic hinges consequently form The
order of the onset of yielding is also similar to that
found by Bower as was expected
73 Failure Loads
In Table 5 experimentally determined failure loads are
compared to those predicted by the theory presented in
Chapter III for each of the test be~~s Examination of this
table shows that although the theory may be considered someshy
what conservative in high shear for low shear the correlashy
tion between theory and experimental is good and in no case
did the theory overestimate the actual strength of the beam
Table 6 shows the comparison between experimental failure
loads and those predicted by the approximate analysis for
nominal beam dimensions and yield stresses It can be seen
from this table that the approximate method is less conservshy
ative in the high shear region while still not overestimating
81
the strength of the beam An added margin of safety also
exists because the additional strength of the beam due to
strain hardening has not been taken into account This extra
strength is an added safeguard against total collapse even
though it is accompanied by excessive deformations and finalshy
ly involves tearing or pOSSibly buckling
Experimentally determined failure loads are compared
with loads corresponding to complete yielding of cross-secshy
tions for the strain gauged beams (20 2D 3B 4B) in Table
7 It can be seen from this comparison that experimentally
determined failure loads are close to those corresponding to
the complete yielding of the cross-section at the high moment
edge of the opening while loads corresponding to the complete
yielding of the cross-section at the low moment edge of the
opening are considerably higher This can be accounted for
by the considerable amount of strain hardening that is
suspected of occurring at the corners of the opening before
complete yielding of the low moment edge and possibly also
the high moment edge of the opening occurs Complete yieldshy
ing of cross-sections at the high and low moment edges of
the openings are also compared with the theoretical loads
predicted by the analysis of Chapter III in Table 8 Again
the correlation is reasonably good
The performance of each of the test beams was as expectshy
82
ed With the exception of the shear yielding which occurred in
the web at the ends of the reinforcing bars as discussed in
Section 63 The method used in determining experimental
failure loads has been shown to be justifiable on the basis
of the good correlation between these loads and those correshy
sponding to complete yielding of cross-sections at high and
low moment edges of the opening (considering that strain
hardening has not been taken into account) On the basis of
comparison with experimental failure loads the theory develshy
oped in Chapter III has been shown to adequately predict the
performance of a given beam under varying moment to shear
ratios (although conservatively at high shear) The approxshy
imate method as developed in Chapter IV has been shown to
predict beam strength with accuracy adequate for design
purposes (assuming a suitable factor of safety is used)
14 Influence of Reinforcing and Other Variables
As can be seen from comparison of the experimental
results from test beams 2A 3A and 6A and those for beams 2B
and 3B there is a definite increase in beam strength with
the addition of horizontal reinforcing bars As predicted by
the theoretical analysis of Chapter Ill the maximum shear
capacity of a perforated section as given by equation (6)
can be reached by the addition of a certain minimum amount
83
of reinforcing as given by equation (32) If no reinforcing
or an amount less than that required by equation (32) is used
the maximum shear capacity cannot be reached This is conshy
firmed by the result of the tests on beams 2A 3A and 6A
For higher moment to shear ratios the increase in strength
with increased reinforcing size is adequately predicted by
the analysis in Chapter 111 (and also by the approximate
method of Chapter IV) This is confirmed by the tests on
beams 2B and 3B The increase in strength with the addition
of reinforcing bars and with the further increase in the
size of this reinforcing cen be seen by superimposing the
interaction curves of Figures 10 11 and 12 as has been done
in Figure 54
The influence of the magnitude of moment to shear ratio
on the strength of a beam of given size opening and reinforcshy
ing dimenSions is adequately predicted by interaction curves
generated by the method of Chapter 111 and by the approximate
interaction curves as in Chapter IV This is confirmed by
test series 2A 2B 20 2D series 3A 3B and by series 4A
4B See Figures 55 56 and 57
An increase in aspect ratio everything else being held
constant results in a decrease in strength of the beam This
is predicted by the interaction curves in Figures 10 and 13
which are superimposed in Figure 58 for easy reference and
84
is confirmed by the tests on beams in series 2A 4A and
series 2B 4B An increase in hole depth also has the effect
of lowering the strength of the member all other variables
being held constant This is predicted by the interaction
curves in Figures 10 and 14 which are superimposed in Figure
59 and is confirmed by the tests on beams 20 and 5A
The test results have also been plotted in Figures 54
through 59 but because of the variation in the sizes and
yield stresses of the actual test beams these results have
been plotted on the curves (which are based on nominal
dimensions and yields) on the basis of percent difference
be~veen the experimental failure loads of the test beams
and the values predicted by the exact interaction curves
(from measured beam dimensions and yield stresses)
85
CHAPTER VIII
CONCLUSIONS AND RECOMMENDATIONS
81 Conclusions
On the basis of the results and discussion presented in
the previous chapters the following conclusions can be
drawn
1 The flaking off of the brittle coating of whitewash on
the beams during testing is an accurate indication of
the order of onset of yielding although it does not inshy
dicate at what loads yielding actually occurs
2 High stress concentrations exist at the corners of
rectangular openings even when horizontal reinforcing
bars have been added above and below the opening
3 Failure of a beam under moment gradient containing a
single rectangular opening reinforced with horizontal
reinforcing bars above and below the opening occurs by
the formation of a four hinge mechanism the hinges
occurring at cross-sections at the edges of the opening
Ultimate collapse of such a beam occurs by the tearing
of one or more of the corners of the opening provided
the beam has sufficient lateral support to prevent
lateral buckling
4 With the development of the four hinge mechanism large
86
relative displacements take place between the ends of the
opening accompanied by full or partial shear yielding in
the web above and below the opening This yielding when
it occurs over the entire web area is an indication that
the full shear capacity of the section is utilized
5 Because of the shear yielding that occurs in the web beshy
tween the ends of the reinforcing bars the extension of
these reinforcing bars past the ends of the opening (while
designed on the oasis of developing the weld strength)
should not be less than a certain length (as yet undetershy
mined but probably about three inches for the size beam
and openings tested) due to the possible interaction of
the web yielding with the yielding at the corners of the
opening
6 The stress distributions assumed in the analysis in Chapshy
ter III are completely compatible with those found at the
high and low moment edges of the strain gauged test beams
The large influence of the secondary bending moments (due
to Vierendeel action) is confirmed by these stress
distributions
7 The interaction curve resulting from the analysis in
Chapter III predicts with reasonable accuracy the strength
of a beam with given opening and reinforcing size at any
combination of moment and shear This method is however
87
conservative at high shear values
8 The approximate method developed in Chapter IV also preshy
dicts with reasonable accuracy the strength of a beam
with given opening and reinforcing size for the full
range of moment and shear values and is less conservshy
ative at high values of shear
9 Due to the fact that the theory neglects the effects of
strain hardening there is a built in margin of safety
against complete collapse of the member although an
increase in load past the predicted failure load is
accompanied by excessive deformations
10 The correlation obtained between experimentally detershy
mined failure loads and loads corresponding to complete
yielding of cross-sections at the high moment edge of
the opening for the strain gauged beams suggests that
the method used in determining the experimental failure
loads is justifiable Comparison of experimental failure
loads with loads corresponding to complete yielding of
the cross-section at the low moment edge of the opening
would not be expected to be as good because of the strain
hardening that is assumed to occur at the corners of the
opening before this section is completely yielded
11 The addition of horizontal reinforcing bars above and
below a rectangular opening in a beam definitely increases
88
the strength of the beam If greater than a predictshy
able minimum area this reinforcing will make it possible
to achieve the full shear strength of the section as
given by equation (6) Any further increase in reinforcshy
ing size results in a further increase in the moment
capacity of the member for a given value of the shear
force
12 For a given size beam an increase in aspect ratio (openshy
ing length to depth) results in a decrease in the strength
of the beam over the full range of moment to shear ratios
if all other factors are held constant An increase in
the opening depth to beam depth ratio also has the same
effect all other variables being constant
13 The test performed on beam 6A containing the unreinshy
forced rectangular opening further confirmed the analysis
presented by Redwood(17 18) for beams containing single
unreinforced rectangular openings in their webs
82 Recommendations for Design
Based on the good agreement between experimental results
and failure loads predicted by the approximate interaction
curve it is recommended that the approximate method as
described in Chapter IV be used for design purposes assuming
that a suitable factor of safety is used The ease with
89
which the necessary calculations can be carried out makes
this method extremely practical The use of this method can
be outlined as follows When it is decided to cut an openshy
ing in the web of a beam for the passage of utilities the
necessary size of opening should first be determined and an
approximate interaction curve constructed for the beam conshy
taining an unreinforced opening by using e~uations (52) (53)
and (55) Mp and Vp should be calculated from equations (1)
and (3) respectively A line should then be drawn from the
origin at the particular moment to shear ratio which repshy
resents the actual position of the proposed opening in the
beam and extended to intersect the approximate interaction
curve The intersection of this line with the interaction
curve then represents the capacity of the beam if the openshy
ing is not to be reinforced If this capacity is less than
that required it is necessary to reinforce the opening
and reinforcing should be chosen on the basis of satisfying
the inequality of equation (41) The reinforcing should be
chosen so that the right hand side of equation (41) is not
greatly exceeded An approximate interaction curve for a
beam containing an opening with this size reinforcing can
then be constructed by using equations (42) (43) and (45)
where Ar is given by the right hand side of equation (41)
The intersection of the MV line with this approximate intershy
go
action curve then gives the capacity of the beam with this
size reinforcing If this exceeds the required capacity of
the section this size reinforcing should be adopted
However if the required capacity of the beam is greater
than that given by the approximate interaction curve two
possibilities may exist If the required shear is greater
than the maximum shear capacity of the section as given by
the vertical line on the approximate interaction curve or
by equation (42) then either shear reinforcing must be
added or the depth of the section increased in order to
provide the required strength If however the required
shear capacity is not greater than that given by equation
(42) but the point representing the required capacity of the
beam on the MV line lies outside the apprOximate intershy
action curve the area of reinforcing should be increased
above the value given by equation (48) and a new approximate
interaction curve constructed using equations (42) (45)
(49) (50) and (51) If the required capacity is still
greater than that given by this new approximate interaction
curve the reinforcing size would have to be further increased
until the reinforcing is such that the required strength is
provided The reinforcing size that meets this requirement
should then be adopted for use
91
83 Reoommendations for Future Work
With the completion of this study on the ultimate
strength of beams containing single rectangular openings
reinforced with straight reinforcing bars above and below
the openings it is logical that attention would turn to
similar studies for other commonly used opening shapes in
particular circular and extended circular openings with
horizontal reinforcing bars Also of interest would be an
ultimate strength investigation of reinforced closely spaced
multiple openings of rectangular or circular shape
Since the decision to cut and reinforce an opening in
the web of a beam is based primarily on economic considershy
ations an investigation into reducing the cost of reinshy
forced openings would be very much justified As the cost
of welding is paramount among the other factors involved in
reinforcing an opening reducing the e~mount of welding is
desirable If the horizontal reinforcing bars used in the
present study were doubled in size and welded to only one
side of the web above and below the opening the cost of
reinforcing would be almost halved while the same area of
reinforcing would be available for resisting the shear and
moment forces on the section However other factors such
as twisting moments would have to be taken into conSideration
due to the asymmetry of the section about its vertical axis
92
that would result from this type of reinforcing arrangement
An investigation of the ultimate strength of wide poundlange
sections containing large rectangular openings reinforced
with one-sided straight horizontal bar reinforcing has
already been initiated at McGill University
More information is also needed on the anchorage of the
reinforcing bars It would be desirable to determine at
what length such reinforcing is capable opound assuming its full
load An investigation of the required extension of reinshy
forcing bars past the ends of the opening to prevent preshy
mature poundailure due to interaction between hinge formation
and web yielding at reinforcing ends is also necessary
93
1)
) )J + 1 +1 I I
I
( a) (b)
I + --+--~+ -f--- -shy
I (c) (d)
II I I
I I j+shy
) 1)I l J I
(e) ( f)
Types of Reinforcing
Figure 1
94
primary bending stresses
secondary bending stresses
Stress Distribution at Opening
Figure 2
Ql ID Q)
Jt p ID
er
I I I I I I I
E I I I poundy Ipoundst strain
Idealized Stress-Strain Curve for structural Steel
Figure 3
---------- -----
95
MM unperforated beam no interaction
10~----~==~==~L---------------------~
~
unperforated beam including interaction
10 vVp
Interaction Curve - Unperforated Beam
Figure 4
-- -----------
96
deflection Pure Bending
(a)
~ o
r-I
deflection Bending with Shear
(b)
Load-Deflection Curves
Figure 5
97
1O~------------------------------------------~
l I
unperforated beamshy
shy
I r perforated beam
no interaction
----------- perforated beam l including interaction I I I I I I I I I
I I
Interaction Curve - Perforated Beam
Figure 6
i
98
1 CD (2) TIT
L
( a)
b
d2
(b)
Hinge Locations and Cross-section of Member
Figure 7
99
( a)
(S r CSyr+
tltS ltl direct shear direct shear
Stress Distribution at CD Stress Distribution at CD (for reversal in reinforcing)
Case I - Low Shear
+
CSyr ltS shy
direct shear
Stress Distribution at CD
Case 11 - High Shear
(b)
Stress Distributions and Resultant Forces
Figure 8
100
low highshear shear
I Ml4p k--~_____U_k-----LS_~_(_U_+-=q-)_____-L (u+q)kl s~s
I I r I I
I I I 1 I10
~-int eraction II curve 11
11
11 I I 11 I I
- I - I Iapproximate ~
interaction curve------ - 1
11~I11
i I I
I (d-2h-2t)I_~ I
d-2t 11
(1 -~) q
Interaction Curve Showing Low and High Shear Regions
Figure 9
101
14D38 7 x lof Opening
6 bull77611 x ~middotReinforcing 1 0513
03~
CH 125 1412700
0313 =--9F 0375 =Jb
approximate method ---l------ Case 11
04 vVp
Interaction Curve - 14WF38 Nominal
Figure 10
102
14WF38 7 x 10r Opening 6776 05132tbull
x e 3middot
Reinforcing
1412 11
10
approximate method Case I
04
Interaction Curve - 14WF38 Nominal
Figure 11
103
14WF38 7 x 10f Opening
0513No Reinforcing
MMp
10
-----approximate method for unreinforoed opening
04 VVp
Interaction Curve - 14WF38 Nominal
Figure 12
104
l4WF38 7 x l4~ Opening1pound x tReinforcing
Iapproximate method Case 11
I I I
04
Interaction Curve - l4WF38 Nominal
Figure 13
105
14WF38 9X 13- Opening lmiddotfx p Reinforcing
0513
1412
~-approximate method ~ Case IIIB
approximate method Case I
04
Interaction Curve - l4WF38 Nominal
Figure 14
106
10WF2l
5 x sf Opening 034(iIf x iWReinforcing t~l0240
CH h
55Q 125 990 025Q 0250~
approximate method ~ Case IlIA
approximate method I Case I
I I I
04
Interaction Curve - lOWF2l Nominal
Figure 15
107
43 11 39 18 0 (
I
I I i lA
26
I
111 99 I- middot1 t
22 2-S 45 J
) C
r I
2A
13 ) lA I ~
I)II45 35 ( ()
I
I
I If 2B
f 16~ 9 25 I2t~ 21-+1 1 1 i
30 11 24 27 0- 10- ro- )
I ~ I I
20
2119YlO 151( 21~fI211~ - rr I I
Test Beam Dimensions and
Dial Gauge Looations
Figure 16
108
tI
2D
22tl 231 45 tlI
( l (
I
3A
3119 Yt 11~ 34ft J3n~
45 25 J 35 ) (~ i-
I
I 1 3B
H 25 ft2ft5 cI 16 J2++ I I1 I
t 0- 23 45 J0- 0- (
I 4A
~5 ( 32 J211~ 2 YYt -IIII
Test Beam Dimensions and
Dial Gauge Locations
Figure 17
log
45 ~ 25 5S ) ~ (
4B
2 crYI 15 25 J-I2++ Irr
L J30 24 27 ~lt) (P-L
I 5A
2tYY 13 26211 1 I
22 6
6A
i
Test Beam Dimensions and
Dial Gauge Locations
Figure 18
--
110
If JL
a (1) p 02 ~
Cfl
tlOO ~ r-I 0 0 Q)
m ~ ~
Q SoOM
r-I Xl m ~ (1) p cD H
r-shy
~ ishy fO I- It
111
o N
-()
112
~ --- ~
~
~~ ~~
II I of
rf
A tshyshy I
1
ID I ~ I 0I middotrt
a1 +gt
- -l~ 0 ()
-t I H CJ
4gt 4gt bO ~
~ ~ Cl -rt
fiI
~ a1 ~
+gt CJI
~ amp ~ ~ ~ --- ~ I
II s I
~CJ~ 4t ~
I~ i ~
o
i-~ ~ - l
II I +1 I Ij
~I r
I tf~ft N
- shy
stress 8 1
lower Yield-lt ~i == 11 static yield-shyI l- 2 1 2 ~
( a)
F F-CL F-E [(4 ~
W-H- - shy
strain ( b)
Tensile Coupons Stress-Strain Curve from Instron Testing Machine
Figure 22 Figure 23 I- I- vJ
I
114
lA 2A 2B
20 2D 3A
3B 4A 4B
5A 6A
FIGURE 24
115
2B 20 2D 3A 3B 4At 4B
Variable Moment to Shear Ratio
20 5A
Variable Opening Depth to Beam Depth
FIGURE 25
116
2A 4A 2B 4B
Variable Opening Length to Depth
2B 3B
Variable Reinforoing Size
FIGURE 26
bullbull
117
Notes Shear force shown in kipsbott of flange bull Elastic o Yielded
r ~ 3
o
top of reinf
boundaryof opening bott of reinf~ ioiiIo ~_ 10 o 10 ~ ~ - Dending Stress Shear Stress
Ca) Stress Distribution at High Moment Edge of Opening - 20
~ bull
~ ~ boundary ~ of opening~
-0 I) 10 40 o to lO ~ Sending Stress Shear stress
(b) Stress Distribution at Low Moment Edge of Opening - 20
Figure 27
118
boundaryof opening
-70 0 __ tQ
Bending Stress Shear Stress
Ca) Stress Distribution at Oenterline of Opening - 20
-1iCgt
~I--=-shyoo---~-=-~ogt---- ---0 - ____ A~Sshy-
middot------------e----- ~~~ ~_______~-----Lr---t-o~p~of flangeo
oE
Cb) Bending Stress Distribution Across Flange at High Moment Edge of Opening - 20
Figure 28
119
-40
-lt0 lt----- shylow
moment edge gtgt bull
lt 0
high54 boundary of opening moment
edge ltgtgt
to
Ca) Bending Stress Distribution Across Length of Opening at Top of Flange - 20
high moment
edge
o
Cb) Bending Stress Distribution Across Length of Opening at Top of Reinforcing - 20
Figure 29
120
boundary---~~~~~~~~___ of Opening
o10 D
Bending Stress Shear Stress
(a) Stress Distribution at High Moment Edge of Opening - 3B
ibull
boundaryof opening
10 Igt lO
Bending Stress Shear Stress
(b) Stress Distribution at Low Moment Edge of Opening - 3B
Figure 30
bull bull bull bull
121
11 9 ~ oS j j ~
boundaryof opening
-lt10 -20 lt) -I-Lo Q lO 10
Bending Stress Shear Stress
(a) stress Distribution at High Moment Edge of Opening - 2D
boundaryof openin
-40 -20 0 ZO o 10 ZQ 30
Bending Stress Shear Stress
(b) Stress Distribution at High Moment Edge of Opening - 4B
Figure 31
122
Test Beam - lA
O6in relative defleotion between opening ends
Figure 32
Test Beam - 2A
O6in relative deflection between opening ends
Figure 33
123
lateral buckling - highmoment edge of opening413k-- shy
Test Beam - 2B
O6in relative deflection between opening ends
Figure 34
bull first strain hardening --~ complete yielding - low
moment edge of opening-J- -- --shy
J complete yielding - high moment edge I of opening I ----first yielding
Test Beam - 20
O6in relative deflection between opening ends
Figure 35
124
---- complete yielding - high moment edgeof opening
first yielding
Test Beam - 2D
O6in relative deflection between opening ends
Figure 36
Test Beam - 3A
O6in relative deflection between opening ends
Figure 37
125
k ---shy497 ---~ --1shy complete yieldingI J
---- first yielding
O6in
Figure 38
O6in
Figure 39
- high moment edge of opening
Test Beam - 3B
relative deflection between opening ends
Test Beam - 4A
relative deflection between opening ends
126
430k--shy
k445--shy
---f-----shy ----complete yielding shy
I ----first yielding
06in
Figure 40
O6in
Figure 41
high moment edgeof opening
Test Beam - 4B
relative defleetion between opening ends
Test Beam - 5A
relative deflection between opening ends
127
k45 o-~--
Test Beam - 6A
O6in relative deflection between opening ends
Figure 42
128
10 shy
10WF21
5t x ampf Opening If x t Reinforcing
~~approximate interaction ~ nominal dimensions and
~ ~
+~ ~ ~
I interaction curve ---I Imeasured dimensions and yields I
I I
04
Interaction Curves - Test Beam lA
Figure 43
curve yields
129
14WF38 7 x lot Opening
bull SIt x a Reinforcing
~-----approximate interaction curve nominal dimensions and yields
interaction curve-------- I
measured dimensions and yields
bull
Interaction Curves - Test Beams 2A and 2B
Figure 44
130
l4WF38 f x 10i Opening 11 x middotf Reinforcing
10 - ~approximate interaction curve nominal dimensions and yields
interaction curve----~ measured dimensions and yields
04
Interaction Curves - Test Beams 2C and 2D
Figure 45
10
131
l4WF38 7middotx lof Opening 2f x ~uReinforoing
approximate interaction curve nominal dimensions and yields
~
1 +3A
I interaction curve -------J
measured dimensions and yields
04
Interaction Curves - Test Beam 3A
Figure 46
10
132
14WF38 7 x lOi~ Opening2f x ~ Reinforcing
~ ~approximate interaction curve ~~ nominal dimensions and yields
~ ~ ~ ~ ~
I I
interaction curve ------I measured dimensions and yields
04
Interaction Ourves - Test Beam 3B
Figure 47
10
133
14WF38 H
7 x 14 Opening 1t x Reinforcing
-~
~~approximate interaction curve ~ nominal dimensions and yields
~ ~ +4B
~ ~ ~
~ interaction curve-----l measured dimensions and yields I
I I
04
Interaction Curves - Test Beams 4A and 4B
Figure 48
134
14WF38 9 x 13t~ Opening lix ~uReinforcing
10 --~ ~~approximate interaction curve
nominal dimensions and yields
~ ~
SAl
interaction curve measured dimensions and yields
04 vVp
Interaction Curves - Test Beam 5A
Figure 49
10
135
14WF38 7 x lof Opening No Reinforcing
r----approximate interaction curve nominal dimensions and yields
+ 6A
----interaction curve measured dimensions and yields
04
Interaction Curves - Test Beam 6A
Figure 50
136
shear (kips)
70
60
---- shear corresponding to experimental failure
50
40
30
20
laterally unsupported length = 54 inohes10
40 80 120 160 200 240
lateral deflection (in x 10-3 )
Lateral Deflection at High Moment Edge of Opening - 20
Figure 51
137
shear (kips)
70
60
------------shear oorresponding to experimental failure
50
40
30
20
10
4 8 12 16 20 24 28
strain differenoe at top flange (inin x 10-3)
Flange Buokling at High Moment Edge of Opening - 20
Figure 52
138
D f
P --IL-=====bull--Jf--P + dP
Shear Stresses at End of Reinforcing
Figure 53
139
l4WF38 7 x lot
Opening
3shy10 f ~--2f x e
Reinforcing
If x ~ Reinforcing
+3A +2A
No Reinforcing + 6A
04
Variable Reinforcing Size
Figure 54
140
14WF38 7 x lof Opening If xl-Reinforcing
+ 2B
+20
+2A
+2D
04 vVp
Variable Moment to Shear Ratio
Figure 55
141
14WF38 7x 10f Opening2i x iReinforcing
10 ---------- shy
+3B
+3A
04 vVp
Variable Moment to Shear Ratio
Figure 56
142
14WF38 7x 14~Opening 1f x f Reinforcing
+ 4B
+ 4A
04 vVp
Variable Moment to Shear Ratio
Figure 57
143
14WF38 1thx imiddotReinforCing
7 x lot Opening
7 x 14 Opening---
04
Variable Aspect Ratio
Figure 58
144shy
14WF38
------7middot x 10i Openinglift x ~~Reinforeing
9 x 13f Opening +20 Ii x i Reinforoing
+5A
04
Variable Opening Depth to Beam Depth
Figure 59
--
r b --1 t l=Ii= W
d
u q
Beam Size ~ d b t w 2a 2h u q c x R bull lA 10WF21 43 989 578 0324
11
0244 875 550 N
0260 0253 2720 N
400 316
2A 14WF38 22 1413 677 0496 0326 1046 700 0383 0381 2813 300 58
tI tI If If If tI tf tI It n tI It2B 45
ff 11 It2C 30 1422 668 0490 0305 1045 0267 0368 2720 n tI n tt tI tI n n tI2D 17 If tI n3A 22 1413 677 0496 0326 1046 0383 0381 5313 600
It 11 It If3B 45 1422 668 0490 0305 1045 0329 0361 5230
tf tI 11 tI fI tI tI4A 22 0340 0368 2720 300 If It tI ff If tI If It n4B 45 n n tI tt f1 tI5A 30 1344 901 0305 0371 3770 425
11If fI6A 22 1045 700 shy - - shy Table 1 -I
foo J1
146
Ave Test Coupon Desig- Testing Lower Static Lower Beam
Beam Location nation Machine Yield Yield Yield Series lA web W Riehle 573 - 573 lA
nflange F 362 - 431 nF 435 shy
F-E It 462 shyItreinf R 370 370
2B web W Instron 417 405 413 2A2B W 11 3A412 398
flange F Riehle 374 - 388 F-CL Instron 382 371 F-E It 397 395
reinf Rl Riehle 434 - 437 2D web W Instron 567 550 558 2C2D
rtW 540 527 3B4A 4B5Aflange F 490 474 446 6AItF-CL 418 406
F-E 478 shyIt 2C2Dreinf R6 398 384 398 4A4B
3A web W 11 411 shyfIflange F 398 379
reinf R2 Riehle 440 shyfI3B reinf R4 330 - 331 3B
R4 11 332 shyR4 Instron 332 shy
4A web W 565 549 flange F 11 487 476
F-CL 406 398 nF-E 429 415 5A reinf R5 tI 437 429 444 5A
R5 450 422 It6A web W 559 545 Itflange F 463 450 fIF-CL 408 402
F-E ff 438 425
Tensile Test Results
Table 2
147
Beam 20 2D 3B 4BLocation Top edge upper fl - BM edge 450K 575K 433lC 300
Bott upper reinf - LIvI edge 450 500 400 317 ~ top upper fl - BM edge 483 600 367 317 Web - ~ open 483 500 517 450 Web - BM edge 517 550 400 350 Web - LM end of upper reinf 517 - - -Bott upper reinf - BM edge 550 550 500 350 Top upper reinf - BM edge 567 800 467 433 ~ web - between LM ends reinf 583 - - shyWeb - LM edge 600 - 583 shy~ top upper fl - LM edge 633 - 600 shyTop upper reinf - LM edge 633 - 467 500 Bott edge upper fl - BM edge 667 - 517 383 Complete yield - BM edge - 567 625 483 383 Complete yield - LM edge 633 - 600 shy
(a) Shear Values Corresponding to Yielding
Location Beam 2C 2D 3B 4B
Top edge upper fl - BM edge 667k 775
k 567k 483k
Bott upper reinf - LM edge - 800 583 -~ top upper fl - BM edge - 775 533 -Web - ~ open 633 700 583 -Web - EM edge - 750 - -Bott upper reinf - BM edge 667 775 - -
(b) Shear Values Corresponding to Strain Hardening
Table 3
- - - - - - -
- - - - - - - - -
- -
BeamLocation Upper fl - BM edge Lower fl - BM edge Lower LM corner open Upper LM corner open Lower BM corner open Upper ID~ corner open Web above open Web below open Low Uif corner to end reinf Up n~ corner to end reinf Low IDH corner to end reinf Up rIM corner to end reinf Between ends reinf LM end Between ends reinf HM end Upper reinf - BM edge open Lower reinf - BM edge open Upper reinf - ilA edge open Lower reinf - LM edge open Lateral buckling - BM edge Web buckling at open Tearing - lower LM corner Tearing - upper BM corner
lA 2A 2B 20 2D 3A 3B ~ lI Ilt v 162 500 400 583 700 525 433
180 - - - 725 - 517 191 550 417 617 600 550 567 191 575 442 567 575 600 433
- 575 467 567 575 600 433
- 575 - - 600 600 shy202 625 475 600 600 700 533
- 625 475 600 625 700 583
- - - 617 700 - 550
- - - 600 675 675 550
- - - - - 675 shy
- 600 458 650 675 650 583
- - - - 725 - -- - - - - 725 -- - - - - 675 -- - - - - - -- - - - - 675 shy- - 483 - - - shy
- 700 517 703 825 775 shy- - - - 825 - 600
4A 4B Ilt Ilt
450 333 500 417 450 367 450 366 500 383 450 417 550 483 600 483 550 400 550 433 625 shy625 shy575 467 575 shy500 shy550 417
- 450 500 383
--675 513
5A le
350 500 400 400 433 483 433 467 500 417
--
500
--
467 500
---
517
-
6A
400 533
-367 367 383 433 533
-----------
550
--
Shear Values Corresponding to Whitewash Flaking
J-ITable 4 ~ 00
149
~hear a1 Beam Size MV [Failure Vp Exp VVp Theor VV_ Diff
lA 10WF21 43 180K 746K 0241 0235 + 26 2A 14WF38 22 532 1L021 0520 0466 +116 2B 11 45 413 0404 0363 +113 2C If 30 548 1301 0421 0403 + 45
u n2D 17 670 0515 0420 +226 n3A 22 575 1021 0562 0466 +206 tt3B 45 497 1301 0382 0345 +107 11 n4A 22 572 0440 0360 +222 n4B 45 430 0330 0295 +119 If It5A 30 445 0342 0296 +155 116A 22 450 0346 0271 +277
Correlation Between Experiment and Theory
Table 5
~hear at Approximate Beam Size MV Failure Exp VV Theor VV DiffVp p p
lA 10WF21 43 180K 746 K
0241 0254 - 51 2A 14VlF38 22 532 1021 0520 0503 + 34
It2B 45 413 0404 0344 +175 If2C 30 548 1301 0421 0414 + 17
It2D 17 670 0515 0505 + 20 3A 22 575 1021 0562 0505 +103
n3B 45 497 1301 0382 0377 + 13 4A tI 22 572 n 0440 0463 - 50
It It 03094B 45 430 0330 + 68 5A 30 445 tr 0342 0353 - 31 6A 22 450 tt 0346 0257 +346
Correlation Between Experiment and Approximate Theory
Table 6
150
Shear at Shear at Shear at Beam MV Failure Full Yield Dif Full Yield Dif
Exp H M Edge L M Edge k k k2C 30 548 567 + 35 633 +155
2D 17 670 625 - 67 - shy3B 45 497 483 - 28 600 +207 4B 45 430 383 -109 - shy
Correlation Between Experimental Failure and Complete Yielding
Table 7
Theor Shear at Shear at Beam MV Shear at Full Yield Dif Full Yield Diff
Failure H M Edge L M Edge
2C 30n 525k 567k + 80 633k +206 2D 17 546 625 +145 - shy3B 45 449 483 + 76 600 +336 4B 45 384 383 - 03 - shy
Correlation Between Theoretical Failure and Complete Yielding
Table 8
151
APPENDIX A
Computer Program for Interaction Curve
A computer program was developed to generate an intershy
action curve for a specified beam opening and reinforcing
size according to the method described in Chapter Ill The
program was wri tten in Fortran IV and can be used on any
standard digital computer that makes use of this language
The input for the program should be of the form given in
the following table
Data Number Items on of Cards Data Cards
Number of beams 1 NB
Dimensions of beams NB dbtw
Yield Stresses NB CS111 S~ lts
Number of openings per beam NB NE
Sizes of openings NH ah
Number of reinforcing sizes per opening NH NR
Sizes of reinforcing NR uqc
A listing of the computer program is given on the following
pages
152
C THIS PROGRA~ CO~PUTES ThE INTERACTION CURVE RELATING MOMENT AND C SHEAR VALUES WHICH CAUSE FAILURE OF A WICE FLANGE bEAM CONTAINING C A REINFORCED RECTANGULAR OPENING AT ThE MIDOEPTH C
REAL KlK2MPMMPKllK12K21 t K22 581 FORMAT(5FIO3) 584 FORMAT(3FIO3) 582 FOR~AT(2FIO3) 583 FORMA1(I5 681 FORMAT(lINTERACTION
lOt 0 B T 682 FORMAT( F133F63 683 FORMAT(O SIGF 684 FORMAT( 5F93
BETwEEN MOMENT AND SHEARtw)
SIGw SIGR VP Mpt)
605 FORMAT(O OPENING LENGTH middotF73middot HEIGHT =F73) 606 FORMAT(O MMP VVP SIG 601 FORMAT( middot5FI04 608 FORMATOV IS TOO LARGE SO SIGMA BECCMES 609 FORMATtOHIGH SHEAR SOLUTION) 611 FORMAT(O U QC) 612 FORMATe 3F63) 613 FORMAT(O STRESS REVERSAL IN REINFORCING 614 FORMATOSTRESS REVERSAL IN CLEAR WEe 615 FORMAT(O STRESS REVERSAL IN WEB STUB) b16 FORMAT(OLOW SHEAR SClUTIONt) 618 FORMATtO MAxIMU~ VVP Fb3)
c READ(S583)NB 00 200 I=lNB RE~D(5581tOBTW
READ(5584)SIGFSIGWSIGR VP=W(0~2T)SIGWSQRT(3) MP=BTSIGF(D-T bullbullW(D-2Tl2SIGW4 WRITE(6681) WRITEI6682)DtB t TW WRITE(6683) WRITE(~684)SIGFSIGWSlGRVPtMP
REAO(SS83)NH DO 200 ~=lNH
RE~D(5582JAH
REAC5583) NR A2=2A H2=2H WRITE(6605)A2H2 VVPM=(O-2T-2H)0-2T) WRITEt6618) VVPM CO 200 J=lNR READ(5584) UQC
Kl K2~)
COMPLEXJ
153
WRITE(661U WRITE(661Z) UQC WRITE(6606) VINCR=OO V=OO S=OZ-H-T AW=SW Af=BT AR=(C-WjQ R=U+Q
C C LOW SHEAR SOLUTION C C STRESS REVERSAL IN WEB STUB C
WRITE(66161 WRITE(661S)
101 V=V+VINCR XX=$IGWZ-O7SV2AW2 IF(XX) 201]00300
300 SIG=SQRT(XX) ALPHA=ARSIGR(AFSIGf BETA=AWSIGCAfSIGf) Cl=T+SBETA C2=-(D-2HJ C3=VAAFSIGF) C4=C22-40ClC3 IF(C4408399399
399 K21=(-C2+$QRT(C4)(2Cl K22=(-C2-SQRTCC4raquo)(2Clt Kll=K21BETA KI2=K22BETA IF(K21)330301301
301 IFK21-10)30230233C 302 IFCKll1330304304 304 IFKllS-U)320320330 330 IF(K22)408)31331 331 IF(K22-10)33233Z40a 332 IF(KIZ)408333333 333 IF(K12S-UJ32132140S 320 K2=K21
Kl=Kl1 GO TO 322
321 K2K22 Kl=K12
322 FY=AFSIGF(S+T2)+AWSIGSS(1-2Kl2)+ARSIGR(U+Q2) F=AFSIGF+AWSIG(1-2Kl+ARSIGR M=2FY+20HF-VA
154
MMP=MMP VVP=VVP WRITE(6607)MMPVVPSIGKlKZ VINCR=VP500 GO TO 101
C C STRESS REVERSAL IN REINFORCING C
408 WRITE(6613 GO TO 409
902 V=Vl 701 V=V+VINCR
XX=SIGW2-015V2AW2 IF(XX9011CQ100
100 SIG=SQRTXX) 409 Rl=(C-W)SIGR
R2=AWSIG+SRl Cl=T+SAFSIGFRZ C2=2SURIR2-(D-2HJ C3=VA(AFSIGF)+U2Rl(AFSIGFraquo)(SR1RZ-1) C4=C22-40C1C3 IF(C4)418403403
403 K21=(-C2+SQRT(C4)(Z0Cl KZ2=-C2-SQRT(C4)(Z0Cl) Kll=AFSIGFK21R2+URlR2 K12=AFSIGFK22R2+URIR2 IF(K21)430401401
401 IF(K21-10)4C240243C 402 IF(K11S-U)430404404 404 IF(Kl1S-R)42042043C 430 IFK22)418431431 431 IF(K22-10)432432418 432 IF(K12S-U418433433 433 [FtK12S-R)421421418 420 K2=K21
K l=K 11 GO TO 422
421 K2=K22 Kl=K12
422 FY=AFSIGFtS+T2)+AWSIGSS(1-2Kl2) 1 +(C-W)SIGR(U2+UC+SQ2-(KlS)2)
F=AFSIGF+AWSIG(I-2Kl)+(C-WJSIGR(2U+Q-2KlS) M=20FY+20HF-VA ~MP=MMP
VVP=VVP IF(MMP 418423423
423 WRITE(6601)MMPVVPSIGKlK2 VINCR=VP500
155
GO TO 701 C C STRESS REVERSAL IN CLEAR WEB C
418 WRITE(6614) GO TO 419
922 V=Vl 801 V=V+VINCR
XX=SIGW2-075V2AW2 IF(XX)921800800
800 SIG=SQRT XX) 419 Cl=AFSIGFS(AWSIG)+T
CZ=-O+2H-2SARSIGR(AWSIG) C3=VACAFSIGF)+2U+Q2)ARSIGR(AFSIGF)
1 +S(ARSIGR2fAFSIGFAWSIG C4= C224 ClC3 IF(C4)428410410
410 KZl=(-C2+SQRTCC4)(ZCl K22=(-C2-SQRTCC4)ZC1) Kll=AFSIGFK21(AWSIG)-ARSIGR(A~SIG)
K12~AFSIGFK22(AWSIG)-ARSIGRAWSIG)
IF(K21)S30501501 501 IFK21-10)502502530 50Z IF(KllS-RS30504504 S04 IF(Kll-l0S20520510 530 IFtKZ2)428531531 531IF(K22-10)532532428 532 IF(K12S-R428533533 533 IF(K12-10)521S21428 520 1lt2=K21
Kl=Kl1 GO TO 522
521 1lt2=K2Z Kl=K12
522 FY=AFSIGF($+T5+AWSIGS(i-2bullbullKl212-ARSIGR(U+Q2) F=AFSIGF+AWSIG(1-2Kl-ARSIGR M=2FY+2HF-VA MMP=MMP VVP=VVP IF (MM P) 428523523
523 WRITE(6601)MMPVVPSIGKlK2 VINCR=VP 500 GO TO 801
c C HIGH SHEAR SOLUTION C
428 WRITE(oo09) GO TO 352
156
2 V=Vl 4 V=V+V INCR
XX=SIGW2-015V2AW2 IF(XXJI0235D350
350 SIG=SQRHXX) 352 AlPHA=ARSIGR(AfSIGf
BETA=AWSIG(AfSIGf) 429 02=-10-BETA-AlPHA
03=05VA(AFSlGFT)+AlPHA+8ETA+O5(AlPHA+8ETA)2+OS8ETAST 1 +AlPHA(U+Q2IT-CD-2H(AlPHA+8ETA)O5T
04=D22-403 IFCD4)102351351
351 K21=(-D2+SQRTID4raquo2 K22=(-D2-SQRT(04112 Kll=1O+8ETA+AlPHA-K21 K12=10+BETA+AlPHA-K22 IFCK21630601601
601 IF(K21-10602~0263C
602 IF(Kll)630604604 604 IFIKll-10)62062D63C 630IFCK22)102631o31 631 IFIK22-10)632632102 632 IF(K12)102633633 633 IF(K12-10)621621lC2 620 K K21
Kl=Kll GO TO 622
621 K2=K22 Kl=K12
622 FYPT=Kl(D-2H)-TKl2-(S+ST) FY=AFSIGFFYPT-AWSIGS2-ARSIGRlU+Q2bullbull F=AFSIGfC2KI-l-AWSIG-ARSIGR M=20FY+20HF-VA MMP=MMP VVP=VVP IF(MMP) 102623623
623 WRITE(6607)MMPVVPSIGKlK2 VINCR=VPIOO GO TO 4
102 V I=V-VINCR VINCR=VINCRIOO VIMIN=VPI00DOO IF(VINCR-VIMIN) 19922
901 Vl=V-VINCR VINCR=VINCR200 VIMIN=VPIOOOO IF(VINCR-VIMIN)199902902
c
C
157
921 V1=V-VINCR VINCR=VINCRI200 VIMIN=VPI10000 IF(VINCR-VIMIN)199922922
199 CONTINUE GO TO 200
201 CONTINUE WRITE(b608)
200 CONTINUE RETURN END
158
APPENDIX B
Plasticity Relationships
In the elastic range stresses were computed from measured
strains by the usual elastic theory The values used for the
modulus of elasticity E and the shear modulus Gtwere 29OOOksi
and 11200ksi respectively When local yielding had occurred
according to the von Mises criterionas stated by equation (2)
Chapter 11 stresses were then computed by the plasticity
relations given by Hill(8) and reduced to the form given by
Bower(16) These relations are stated here for easy reference
Plasticity relations for a Prandtl-Reuss solid yield
dE = des _ ~(d)+ 2G dt (a)xT3Gt~xy
where E x is strain in the longitudinal direction and l$ xy
is the shearing strain Eliminating ~ by use of the von
Mises criteria gives
(b)
Since explicit integration of equation (b) would be
extremely difficult the equation is diVided by dE-x and the
derivatives d tSd E and d 6 yld poundx are replaced byx x
159
(c)
( d)
where~i and ~XYi are the bending and shearing stresses
respectively corresponding to ~ and ~f and ~xYf are
these stresses corresponding to poundx + 6 (x
Substituting equations (c) and (d) into equation (b)
gives
A~x - B6~ + AtS cs = AY l (e)
f
where (f)
and ( g)
The shear stress corresponding to a change in strain is given
by
2 2 ~ =Jcsy - CS f (h)
f [3
In order to determine whether strain hardening had occurred
an equivalent strain Xp was computed from
160
where lIE Xl ~yp Ezp and xyp are the plastic components of
strain and are given by
~ xp = poundx-t ( j)
Eyp = E yy (S
- i (k)
E (1)poundzp = z -~ (m)xyp = 6xy -
~
~
The constant volume condition was used to calculate ~ zp
(n)
The equivalent strain was compared to a reference strain
~ pr computed from the value for ~p for the onset of strain
hardening for a tensile test The strain hardening strain
was taken as euro x and it was assumed that E = poundoz For yy
A36 steel the strain hardening strain was taken as 115 ~yIE
and ~y was determined from a tensile test of a coupon from
the web of the test beam Strain hardening was considered
resent J f 6 gt or J P degpr-
The above relationships were included in a paper
presented by Bower(16) in 1968
161
BIBLIOGRAPHY
1 Muskhelishvili NISome Basic Problems of the Mathematical Theory of ElasticityU 2nd Edition P Noordhoff Itd 1963
2 HelIer SR Jr Brock JS and Bart R The itresses Around a Rectangular Opening with Rounded Corners in a Beam Subjected to Bending with Shear Proceedings Vol 1 Fourth U National Congress on Applied Mechanics Berkeley Calif 1962
3 Bower JE ItElastic Stresses Around Holes in WideshyFlange Beams Journal of the Structural Division ASCE Vol 92 No ST2 Proc Paper 4773April 1966
4 BowerJE Experimental Stresses in Wide-Flange Beams with Holes tl Journal of the Structural Division ASCE Vol 92 No ST5 Proc Paper 4945October 1966
5 So WC The Stresses Around Large Circular Openingsin the Webs of Wide-Flange Beams MEng Thesis McGill University Aug 1963
6 Chen IC tiThe Stresses Around Two Large Openings in the Webs of Wide-Flange Beams MEng Thesis McGill University Aug 1967
7 Segner EP Jr Reinforcement Requirements for Girder Web Openings Journal of the Structural Division ASCE Vol 90 No ST3 Proc Paper3919 June 1964
8 HillR The Mathematical Theory of PlastiCityClarendon Press Oxford University Press London 1950
9 Handbook of Steel Construction Canadian Institute of Steel Construction OntariO 1967
10 ltSpecifications for the DeSign Fabrication and Erection of Structural Steel for Buildings AISC 1963
11 Basler K Strength of Plate Girders in Shear Journal of the Structural Division ASCE Vol 87 No ST7 Proc Paper 2967 October 1961
162
12 Worley WJ Inelastic Behavior of Aluminum AlloyI-Beams With Web Cutouts University of Illinois Engineering Experimental Station Bulletin No 448 April 1958
13 Redwood RG and McCutcheon J 0 Beam Tests with Unreinforced Web Openings Journal of the Structural Division ASCE Vol 94 No ST1 Proc Paper5706 Jan 1968
14 nCommentary of Plastic DeSign in Steel ASCE Manual of Engineering Practice No 41 1961
15 Cheng SY flAn Investigation of Large Extended Openingsin the Webs of Wide-Flange Beams MBng Thesis McGill University Aug 1966
16 Bower JE Ultimate Strength of Beams with RectangularHoles Journal of the Structural Division ASCE Vol 94 No ST6 Proc Paper 5982 June 1968
17 Redwood RG Plastic Behavior and Design of Beams with Web Openings ff Proceedings of the Canadian Structural Engineering Conference Canadian Institute of Steel Construction Toronto Feb 1968
18 Redwood RG The Strength of Steel Beams with Unreinshyforced Web Holes Civil Engineering and PubliC Works Review Vol 64 No 755 London June 1969
19 Redwood RG Ultimate Strength Design of Beams with Multiple Openings Proceedings of the Structural Engineering Conference American Society of Civil Engineers Pittsburgh October 1968

ii
SUMMARY
Results are presented for tests to destruction performed
as part of this study on one IOWF21 and ten 14WF38 beams
each containing a single rectangular opening in the web The
openings in all but one of the beams were reinforced with
straight horizontal reinforcing plates welded above and below
the opening on each side of the web The variables investishy
gated include moment to shear ratiO opening depth to beam
depth ratiO opening length to depth ratio and reinforcing
size
An ultimate strength analysis is offered based on failure
by development of a four hinge mechanism the hinges occurring
at cross-sections at the edges of the opening A simple to
use approximate method of solution is also offered and a proshy
cedure for design is suggested
The experimental results show the theory to be reasonably
accurate at high moment to shear ratios but conservative at
high values of shear The approximate method is less conshy
servative in this region
iii
ACKNOVlLEDGEMENTS
The writer wishes to express her appreciation to those
who provided assistance during the course of this study In
particular thanks are due to
Dr RGRedwood who acted as research director and
provided constant guidance and encouragement during the
course of this investigation
Messrs B Cockayne and G Matsell and the remainder of
the technical staff who helped in the fabrication and testing
of the test beams and in the preparation of tensile coupons
The staff of the Department of Metallurgical Engineershy
ing who generously offered access to the 20k Instron Testing
Machine for the testing of tensile coupons
The writer t s husband Vayne who provided considerable
help and encouragement and who also typed this manuscript
This investigation was made possible by the financial
assistro1ce of the National Research Council of Canada and
by the Canadian Steel Industries Construction Council
iv
NOTATION
a half length of opening
Af area of flange
Ar area of reinforcing
Aw area of web
b width of flange
c width of one pair of reinforcing bars (including web)
d depth of beam
E modulus of elasticity
Est strain hardening modulus
f subscript denoting stress or strain after load increment
FI stress resultant at high moment edge of opening
F2 stress resultant at low moment edge of opening
G shear modulus
h half depth of opening
i subscript denoting stress or strain before load increment
k I location of stress reversal at high moment edgeof opening
location of stress reversal at low moment edgeof opening
L length of moment arm to center of opening
M applied bending moment
Mp plastic bending moment
M p reduced plastic moment
x
v
p applied load
q thickness of reinforcing
R corner radius of opening
s half remaining clear web at opening
t thickness of flange
u length of web stub
shear force
plastic shear force
w thickness of web
extension of reinforcing past edge of opening
distance from the boundary of the opening to the stress resultant at the high moment edge of opening
distance from the boundary of the opening to the stress resultant at the low moment edge of opening
z plastic section modulus
proportionality factor 1= i(~2(2~ - 1)21 ~ proportionality factor f= kl + k2 - 1 - ~J pound45 strain at 45 0 to the longitudinal direction
pound-45 strain at -45 0 to the longitudinal direction
pound x strain in the longitudinal direction
6 xp plastic component of ~x
pound y strain corresponding to yielding
~yy strain in the direction of the beam depth
euro yp plastic component of euroyy
vi
~z strain in the transverse direction
plastic component of poundz
strain corresponding to hardening
the initiation of strain
~p equivalent strain
~pr reference value of ~p
~ xy shearing strain
~ normal stress
yield stress
yield stress for flange
yield stress for reinforcing
yield stress for web
shear stress
AISC American Institute of Steel Construction
ASTM American SOCiety of Testing Materials
CISC Canadian Institute of Steel Construction
ASCE American Society of Civil Engineers
vii
LIST OF FIGURES
Page
1 Types of Reinforcing 93
2 Stress Distribution at Opening 94
3 Idealized Stress-Strain Curve for Structural Steel 94
4 Interaction Curve - Unperforated Beam 95
5 Load - Deflection Curves 96
6 Interaction Curve - Perforated Beam 97
7 Hinge Locations and Cross-Section of Member 98
8 Stress Distributions and Resultant Forces 99
9 Interaction Curve Showing Low and High Shear Regions 100
10 Interaction Curve - 14WF38 Nominal 7 x lOin Opening Itn X iReinforcing 101
11 Interaction Curve - 14WF3~ Nominal 7f1 X lot Opening 213 x t Reinforcing 102
12 Interaction Curve - 14WF38 Nominal 7 xlot Opening No Reinforcing 103
13 Interaction Curve - 14WF38 Nominal 7 x 14 Opening It x lIt Reinforcing 104
14 Interaction Curve - 14WF38 Nominal 9 x 13t Opening li x -n Reinforcing 105
15 Interaction Curve - 10WF21 Nominal 5~ n x Bi Opening li x i lt Reinforcing 106J
16 Test Beam Dimensions and Dial Gauge Locations 107
17 Test Beam Dimensions and Dial Gauge Locations 108
18 Test Beam Dimensions and Dial Gauge Locations 109
19 Lateral Bracing System 110
viii
Page
20 Photographs of Lateral Bracing System III
21 Strain Gauge Locations 112
22 Tensile Coupons 113
23 Stress-Strain Curve from Instron Testing Machine 113
24 Photographs of Test Beams after Collapse 114
25 Comparison Photographs of Test Beams 115
26 Comparison Photographs of Test Beams 116
27a Stress Distribution at High Moment Edge of OpeningBeam 2C 117
27b Stress Distribution at Low Moment Edge of OpeningBeam 2C 117
28a Stress Distribution at Centerline of OpeningBeam 2C 118
28b Bending Stress Distribution Across Flange at High Moment Edge of Opening - Beam 2C 118
29a Bending Stress Distribution Across Length of Opening at Top of Flange Beam 2C 119
29b Bending Stress Distribution Across Length of Opening at Top of Reinforcing - Beam 2C 119
30a Stress Distribution at High MOment Edge of Opening - Beam 3B 120
30b Stress Distribution at Low Moment Edge of Opening - Beam 3B 120
31a Stress Distribution at High Moment Edge of Opening - Beam 2D 121
31b stress Distribution at High Moment Edge of Opening - Beam 4B 121
32 Load-Relative Deflection Curve - Beam lA 122
33 Load-Relative Deflection Curve - Beam 2A 122
ix
Page
34 Load-Relative Deflection Curve - Beam 2B 123
35 Load-Relative Deflection Curve - Beam 2C 123
36 Load-Relative Deflection Curve - Beam 2D 124
37 Load-Relative Deflection Curve - Beam 3A 124
38 Load-Relative Deflection Curve - Beam 3B 125
39 Load-Relative Deflection Curve - Beam 4A 125
40 Load-Relative Deflection Curve - Beam 4B 126
41 Load-Relative Deflection Curve - Beam 5A 126
42 Load-Relative Deflection Curve - Beam 6A 127
43 Interaction Curves - Test Beam lA 128
44 Interaction Curves - Test Beams 2A and 2B 129
45 Interaction Curves - Test Beams 2C and 2D 130
46 Interaction Curves - Test Beam 3A 131
47 Interaction Curves - Test Beam 3B 132
48 Interaction Curves - Test Beams 4A and 4B 133
49 Interaction Curves - Test Beam 5A 134
50 Interaction Curves - Test Beam 6A 135
51 Lateral Deflection at High Moment Edge of OpeningBeam 2C 136
52 Flange Buckling at High Moment Edge of OpeningBeam 2C 137
53 Shear Stresses at End of Reinforcing 138
54 Variable Reinforcing Size 139
55 Variable Moment to Shear Ratio 140
56 Variable Moment to Shear Ratio 141
x
Page
57 Variable Moment to Shear Ratio 142
58 Variable Aspect Ratio 143
59 Variable Opening Depth to Beam Depth M4
xi
LIST OF TABLES
Page
1 Beam Properties 145
2 Tensile Test Results 146
3a Shear Values Corresponding to Yielding 147
3b Shear Values Corresponding to Strain Hardening 147
4 Shear Values Corresponding to Whitewash Flaking 148
5 Correlation Between Experiment and Theory 149
6 Correlation Between Experiment and Approximate Theory 149
7 Correlation Between Experimental Failure and Complete Yielding 150
8 Correlation Between Theoretical Failure and Complete Yielding 150
SUJn1[ARY
ACKNOWLEDGEMENTS
NOTATION
LIST OF FIGURES
LIST OF TABLES
TABLE OF CONTENTS
Page
ii
iii
iv
vii
xi
CHAPTER I INTRODUCTION
11 General Background 1
12 Types of Reinforcing 2
13 Elastic and Ultimate Strength Analysis 4
CHAPTER 11 ULTINfATE STHEUGTH BEHAVIOR
21 Behavior of Unperforated Beams 8
22 Behavior of Beams with Web Openings 12
23 Previous Ultimate Strength Investigations 17
24 Scope of the Investigation 25
CHAPTER III ULTIMATE STRENGTH ANALYSIS
31 Assumptions 27
32 Low Shear Solution - Case I 29
33 High Shear Solution - Case 11 35
34 Limits of Interaction Curves 36
CHAPTER IV APPROXIMATE METHOD
41 General Remarks 41
42 Development of the Method 42
43 Limitations on the Approximate Method 46
44 Summary and Discussion 50
Page CHAPTER V EXPERIMENTAL INVESTIGATION
51 Selection of Test Beams 56
52 Experimental Setup 59
53 Testing Procedure 62
54 Determination of Yield Stresses 63
CHAPTER VI EXPERIMENTAL RESULTS
61 Behavior of Beams during Testing 66
62 Stress Distributions and Failure Loads 71
63 other Factors 72
CHAPTER VII ANALYSIS OF RESULTS
71 Order of Onset of Yielding 77
72 Stress Distributions 78
73 Failure Loads 80
74 Influence of Reinforcing and Other Variables 82
CHAPTER VIII CONCLUSIONS AND RECO~Th1ENDATIONS
81 Conclusions 85
82 Recommendations for Design 88
83 Recommendations for Future Work 91
FIGURES 93
TABLES 145
APPENDIX A Computer Program for Interaction Curve 151
APPENDIX B Plasticity Relationships 158
BIBLIOGRAPHY 161
1
CHAPTER I
INTRODUCTION
11 General Background
It has become common practice to cut openings in the
webs of beams to permit the passage of utility ducts By
passing these utilities through rather than under the beams
the height of each floor in a building can be reduced thereshy
by effecting a considerable saving in cost particularly in
the case of multistorey structures However cutting an
opening in the web of a beam may considerably reduce the
strength of the beam in the vicinity of the opening If
the opening is located at some position in the beam where
stresses are low this may cause no special problems but
if it is located in a high stress region the designer is
faced with the problem of finding an economioal way to inshy
crease the strength of the beam so that failure will not
result at the opening under working loads
Two alternate approaches are possible in this case
The size of the entire member in question may be increased
on the basis of providing sufficient strength at the openshy
ing so that failure will not ocour The other approach is
to reinforce the original member in the vicinity of the
opening so that the loads can be carried without inducing
2
high stresses The size of the member itself then need not
be increased
Just as the decision whether to pass utilities through
rather than under floor beams must be based primarily on
economic considerations the decision whether to reinforce
an opening or increase the size of the entire member when
the opening is located in a high stress region must also be
based on economics Since many methods of reinforcing an
opening are possible the relative costs and effects of each
type of reinforcing deserve consideration
12 Types of Reinforcing
Reinforcing for an opening in the web of a beam may be
of three basic types
1 reinforcing to resist high bending stresses and low shear
stresses
2 reinforcing to resist low bending stresses and high shear
stresses
3 reinforcing to resist both high bending and shear stresses
Two examples of the first type are illustrated in Figures
la and lb By increasing the areas of the sections above
and below the centroid they provide additional moment
resisting capacity to the section However since shear
stresses are considered to be carried only by the web of
the section this type of reinforcing cannot increase the
3
shear capacity above that given by the shear capacity of
the uncut section times the ratio of the net web area at
the opening to the initial web area of the beam Reinforcshy
ing types to resist high shear stresses are those that
increase the web area so that more web is available to
resist these stresses Web doubler plates as shovm in
Figure lc are typical of this type of reinforcing although
their use is usually very limited due to welding difficulties
This type of reinforcing also increases moment capacity by
increasing the area above and below the opening Another
type of shear reinforcing uses vertical or inclined web
stiffeners to carry the shear forces past the opening A
typical arrangement of inclined web stiffeners is shown in
Figure Id The third type of reinforcing is essentially a
combination of the first two examples of which can be seen
in Figures le and If The area above and below the opening
is increased to give added moment capaCity and the effective
web area is increased by the addition of vertical or inclined
shear plates to provide added shear capacity to the section
A combination of the reinforcing arrangements in Figures la
and Id would be another example of this type Many other
arrangements of web opening reinforcing are pOSSible but
those shown in Figure 1 and mentioned above are typical of
the three main types
Since the problem of cutting and reinforcing an opening
4
in a section is basically one of economics the cost of the
process of reinforcing an opening must be considered This
cost may be divided into three parts the cost of supplying
and cutting the material to be used in reinforcing the openshy
ing that of bending and fitting this material and welding
this material into place Since the cost of welding is
paramount among the several expenses it is advantageous to
keep the welding to a minimum in the selection of a reinforcshy
ing type This tends to make the high shear type of reinforcshy
ing uneconomical and essentially limits the more practical
opening reinforcings to those of the type considered in
Figures la and lb The present investigation is devoted to
this type of reinforcing and specifically to that arrangement
given in Figure lb
13 Elastic and Ultimate Strength Analysis
BaSically two types of analysis were available for this
study - elastic and ultimate strength The elastic analysiS
of the stresses in a beam containing an opening in its web
consists of the superposition of the stresses occurring in
an unperforated beam and the stresses resulting from forces
applied to the boundary of the opening in such a way as to
satisfy certain boundary conditions at the opening This
approach finds its basis in an important work presented by
NIMuskhelishvili(l) in the 1930s and was used by SR
5
Heller Jr et al(2) in 1962 and by JEBower(3) in 1966 to
investigate the elastic stresses around openings in wideshy
flange beams Bowers work also outlined the widely used
approximate Vierendeel analysis based on the assumption that
the beam behaves like a Vierendeel truss in the vicinity of
the opening The shear force carried by the section causes
secondary bending moments to occur within the tee sections
formed by the flange and the remaining part of the web above
and below the opening A point of contraflexure for the
secondary bending stresses is assumed to occur at the midshy
length of the opening The forces acting at the opening and
the resultant stress distributions are shown in Figure 2 It~
is assumed that the shear is carried equally by the tee secshy
tions above and below the opening and that the secondary and
primary bending stresses are additive
Bower also performed an experimental study(4) in 1966
to verify the results of his analysis A series of 16WF36
beams each containing one opening either circular or
rectangular with corner radii of 14 inch were tested at
varying moment to shear ratios The beams were implemented
with electrical resistance strain gauges in the vicinity of
the openings so that strains could be measured and compared
to those predicted by theory The results of Bowers tests
showed that very high stress concentrations occur at the
corners of rectangular openings while smaller stress concenshy
6
trations occur above and below circular openings where the
tee section is the smallest The findings for circular
openings confirm those given by So(5) in 1963 while those
for rectangular openings were confirmed by Chen(6) in 1967
Bower showed that for both types of openings investigated
the elastic analysis predicts all stresses and stress concenshy
trations with reasonable accuracy except for the octahedral
shear stresses away from the boundary of the opening The
elastic analYSiS however is complicated and requirea the
use of a computer and is incapable of dealing with the presshy
ence of notches or other irregularities at the opening The
approximate Vierendeel method was found to predict bending
stresses and octahedral shear stresses with acceptable
accuracy while failing to predict the stress concentrations
in both cases However the approximate method is relatively
simple and lends itself easily to hand calculations Since
the elastic analysis is not practical particularly for
design purposes because of the length of the calculations
involved it has been suggested by Bower and others(7) that
the Vierendeel analysis be used in its place with stress
concentrations neglected when an elastic analysis is desired
A design based on this method would result in a beam whose
response is not purely elastic under working loads
An analysis based on complete yielding of the sections
where high stress concentrations exist under elastic condishy
7
--~~
~ tions would eliminate this problem Such a plastic or
ultimate strength analysis would take advantage of the
additional strength of the perforated beam between the onset
of yielding and the complete plastification of the section
or sections that would cause failure or uncontrolled deformshy
ations of the beam Besides eliminating the problem of stress
concentrations in the elastic range a plastic analysis also
has the advantage of being simpler to use than the complete
elastic analysis and of not being rendered unusuable when
notches or irregularities are present at the opening since
the method depends only on the reasonably accurate prediction
of the sections where complete yielding or plastic hinges
will occur These regions can generally be determined withshy
out difficulty particularly in the case of rectangular
openings Consideration of these factors suggest an ultishy
mate strength analysis as the most rational approach to
the problem
8
CHAPTER 11
ULTIMATE STRENGTH BEHAVIOR
21 Behavior of Unperforated Beams
Ultimate strength analysis truces advantage of the ducshy
tility of structural steel This ductility mruces it possible
for the steel to undergo large deformations beyond the elastic
limit before failure occurs As can be seen from the idealized
stress-strain curve in Figure 3 the material is elastic up
to the yield level but after this level is reached the strain
increases extensively without any further increase in stress
Beoause of this attainment of the yield stress at the outershy
most fiber of a beam in bending does not cause the failure of
the member Rather the member has reserve strength that
permits increase of load up to the point where the entire
cross-section has reaohed the yield stress ie when a plastio
hinge has fonned at the yielded section Since rotation is
free to occur at plastic hinge locations when sufficient
hinges have formed so that the structure forms a mechanism
and is unstable under the applied loads collapse will occur
For a simply supported beam of uniform cross-section
formation of only one plastio hinge is suffioient to cause
collapse If no shear or axial forces are acting the plastic
moment or maximum moment capacity of the section is easily
9
obtained and is equal to the first moment of the area of the
section above or below the centroid about the centroid times
the yield stress of the material This is writte~ as
where Z is the plastic section modulus of the section and ~y
is the yield stress
The presence of a moment-gradient (shear) has the effect
of lowering the plastic moment capacity of a member Since
the shear force is carried by the web of the member the
moment carrying capacity of the web and therefore that of
the member must be reduced since the presence of shear
causes a reduction in the normal stress carrying capacity of
the web The yielding criterion of von Mises is generally
accepted as being the most applicable to structural steel
and can be explained physically in either of two ways
Henckys interpretation states that when the energy of disshy
tortion reaches a maximum value yielding results A preferred
explanation offered by Prandtl states that when the shear
stress on the octahedral plane reaches some maximum value
yielding occurs(8) Von Mises t yield criteria can be
expressed mathematically as
10
where ltSyiS the yield stress ltS the normal stress and the
shear stress The effect of shear on moment capacity can
best be illustrated by an interaction curve as shown in
Figure 4 where the axes have been non-dimensionalized by
diVision by Mp and Vp Vp is the maximum shear carrying
capacity of the section under pure shear and is obtained
from equation (2) as
where = Vw( d-2t) V is the shear force and w( d-2t) the
clear web area Equation (3) presupposes that the flanges
of the section carry no shear The broken line in Figure 4
illustrates the interaction between moment and shear for an
unperforated wide-flange section as predicted by equation (2)
Such an interaction curve shows for any given moment value
the corresponding shear value that a member can safely sustain
Any value less than those on the interaction curve (those
bounded by the VV and MM axes and the interaction curve)p p represents a combination of moment and shear which the member
can safely carry Values on or outside the interaction curve
represent those combinations which would cause collapse of the
member The reduction in strength due to shear is however (9)fairly small for unperforated sections and OISC and
AISc(lO) design codes for buildings allow it to be neglectshy
11
ed for design purposes since the ooouranoe of strain hardenshy
ing makes possible the attainment of moments greater than Mp
in the presence of shear The allowable moment and shear
values thus permitted are those bounded by the solid line in
Figure 4
The inorease in strength due to strain hardening oan best
be illustrated by considering the load-defleotion curves in
Figure 5 The load-defleotion ourve for a beam in pure bendshy
ing is given in Figure 5a When the plastio moment of the
seotion is reaohed the defleotions beoome exoessive and
increase with no further inorease in load This ooours
beoause the member forms a meohanism with the formation of
a plastio hinge at the attainment of Mp However when shear
is present the load-defleotion ourve does not beoome horishy
zontal when the reduoed Mp Mp as predioted by equation (2)
and given by the interaction curve in Figure 4 is reached
but rather oontinues to climb at a lesser slope reaching
values equal to or greater than the full Mp given by equation
(1) This oan be seen in Figure 5b The increase in strength
above Mp under moment gradient is due to strain hardening
and is usually neglected in simple plastiC theory although
it can be predicted but the procedure is complicated for
all but very simple cases Strain hardening occurs in the
presence of shear because yielding occurs in localized areas
or slip bands so that the material within these bands strain
12
hardens before adjacent areas reach the point of yield Alshy
though simple plastic theory neglects strain hardening the
significance of this phenomenon should not be underestimated
since all rolled sections are proportioned such that the limit
of shear carrying capacity of the web lies within the strain
hardening range(ll)
22 Behavior of Beams with Web Openings
The introduction of an opening into the web of a wideshy
flange section has two effects on the interaction curve The
first and more immediately apparent of these effects is the
reduction of shear and moment capacity by the reduction of the
area available to resist these forces The moment capacity
is reduced to
(4)
where w is the web thickness and h is the half depth of the
opening The shear capacity is reduced to
v = w( d-2t-2h) $-3
This change in the interaction curve is shown by the broken
line in Figure 6 The second effect caused by the presence
of an opening is the strong interaction between moment and
shear due to the member behaving like a Vierendeel truss in
13
the vicinity of the opening This is the same type of
behavior described in Section 13 except that the member
is analyzed in the plastic rather than the elastic range
The secondary bending moments caused by the shear force are
added to the primary bending moments thus causing the critical
sections to yield completely at lower loads than would be exshy
pected were this interaction effect ignored This is shown
by the line in Figure 6 where the effects of shear as given
by equation (2) have also been included
The addition of horizontal bar reinforcing above and
below an opening in a wide-flange beam increases the maxishy
mum moment capacity of the section (no shear acting) above
that of an unreinforced opening by increasing the area of
the section capable of resisting moment The effects of
interaction between moment and shear are also reduced by the
addition of reinforcing since the reinforcing is of such a
type as to be particularly well suited to resist secondary
bending moments due to Vierendeel action The maximum shear
carrying capacity of a reinforced opening may reach
(Vv) = d-2t-2h (6)P max d-2t
which is the maximum shear carrying capacity of the section
assuming no interaction and is derived from equation (5) by
division by equation (3) This can represent a considerable
14
increase in strength over the shear capacity of the unreinshy
forced opening which is normally much below (VVp)max because
secondary bending moments have to be resisted to a large
extent by the web since there is no reinforcing to perform
this task
The presence of an unreinforced rectangular opening in
the web of a wide-flange section oauses ohanges in the failure
modes of the beam as well as in the interaction ourve Sevshy
eral investigations have confirmed these ohanges in failure
modes(461213) Vllien subjected to pure bending the member
is found to fail by oomplete yielding of the tee sections
above and below the opening Load defleotion curves for this
case are similar to those for an unperforated beam under pure
bending in that with the attainment of Mp the curve becomes
horizontal and collapse eventually occurs with no further
increase in load
Vhen the perforated beam is subjected to bending with
shear large relative displacements occur between the ends
of the opening and at the same time localized plastiC binges
form at each of the four corners of the opening by complete
yielding of the tee section at these locations The load-
deflection curve in this situation is similar to the load-
deflection curve of an unperforated member under moment-
gradient except that the second portion of the curve after
15
the bend is not always as straight as that for the unpershy
forated beam and in fact may possess considerable
curvature in some cases(13) The value of the moment at the
opening at which the load-relative deflection curve bends
is not that of the unperforated section but instead is a
reduced value obtained by considering both reduced area and
moment-shear interaction as described previously_ Again
the increase in load above the value corresponding to the
predicted moment is due to strain hardening for the same
reasons as cited previously_ This strain hardening effect
makes it exceedingly difficult to ascertain at what value of
shear or moment an experimental test beam should be considershy
ed to have failed so that this failure load can be compared
to one predicted by theory It can be said with certainty
that this value should lie somewhere between the load at
which the load-relative deflection curve starts to bend from
its initial slope and the ultimate load at which the beam
suffers total collapse This total collapse will be either
by web buokling at the opening or by oraoking of one or more
of the corners of the opening after which deflections become
uncontrolled and the load carrying capacity of the beam
decreases
The use of the collapse load as the failure load would
however not be justified unless the effects of strain hardenshy
ing and the possibility ot tearing and buokling are incorporatshy
16
ed into the analysis Also the deflections become so exshy
cessive as to make the beam unserviceable before this load
is reached Indeed a rational definition would have to be
such as to have the failure load fall within the region
where the load-relative deflection curve bends from its
initial slope to some new slope One possible means of
defining failure in this type of situation is suggested in
ASCE tlOommentary on Plastic Design in Steel(14) and
is perhaps the most rational approach to the problem The
initial slope of the load-relative deflection curve is
multiplied by some constant factor to obtain a new slope
A line having this new elope is then drawn tangent to the
upper portion of the load-relative deflection curve and the
load at which this new slope intersects the initial slope is
taken to be the failure load This is analogous to considershy
ing strain hardening in some simple case where the slope of
the theoretical load-deflection curve in the strain hardening
range is equal to a constant times the initial slope of the
curve when the beam is still elastic If this method is to
be used a method of determining a suitable constant must
be chosen possibly from experiment
The modes of failure of a beam containing a reinforced
opening are expected to be the same as those with an unreinshy
forced opening under both pure bending and bending with shear()
Similarly the load-deflection curves or the load-relative
17
deflection curves would be the same in both cases Thus for
cases of moment gradient the same situation exists for both
reinforced and unreinforced openings where the load continues
to increase past the attainment of the predicted moment
capacity of the section due to strain hardening and the same
difficulty exists for determining failure loads for beams
with reinforced openings as for the unreinforced case
The method suggested in ASCE and described previousshy
ly for determining failure load was adopted for the purposes
of correlating experimental and theoretioal values of failure
load in this study Since the load-relative defleotion curves
for some of the test beams approached a fairly constant slope
in the strain hardening range it was decided to determine
the slopes and constant multiplication factors for these
cases and apply the same factor to all of the test beams
since all were similar It was thus decided to use a value
of thirty times the initial slope for the final slope in
determining experimental failure loads
23 Previous Ultimate Strength Investigations
While considerable theoretical and experimental work
has been done in the determination of elastic stresses around
openings in plates and beams relatively little has been done
ooncerning ultimate strength behavior In 1958 wJworley(12)
18
carried out an investigation of the ultimate strength of
aluminum alloy I-beams containing web openings of various
shapes Rectangular elliptical and triangular openings
were studied with the main objects of the research being
to determine which shape of opening resulted in the smallest
loss of strength and to verify the validity of an upper
bound theorem in predicting the fully plastiC load carrying
capaCity of the test beams The upper bound plastiC theorem
states that of all the possible mechanisms or combinations
of plastic hinges sufficient to cause collapse the one that
ensures collapse at the lowest load is the correct mechanism
under which the member will actually fail Worleys experishy
mental results were in fairly good agreement with the ultimate
loads predicted by the upper bound theorem and were the most
accurate for the case of rectangular openings where hinge
locations were more easily predicted than for the other openshy
ing types Of the various opening shapes tested it was found
that the elliptical opening was the strongest on a maximum
area removed baSiS while the triangular was stronger on a
maximum depth basiS The practical need for these two shapes
especially the triangular is however questionable Worley
excluded the effects of shear and axial force in his analysis
and for rectangular openings assumed a four hinge mechanism
with hinges considered at the corners of the opening
19
In 1963 W-CSo(5) presented a study of large circular
openings in wide-flange beams including an ultimate strength
analysis based on the assumption of a plastic hinge over the
center of the opening Sots analysis however neglected
secondary bending effects due to Vierendeel action in the
vioinity of the opening and also ignored shear yielding
effects in the web The experimental investigation performshy
ed in the ultimate strength range consisted of the testing
of two l4WF30 beams to collapse The first beam was tested
in pure bending so that shear and Vierendeel action were not
present and the ultimate strength predioted by Sos analysis
would be expeoted to be oorreot since the same strength would
be predicted in this case whether or not these effects were
considered Deviation between experiment and theory was 3
The second beam was tested under moment gradient but due to
the relative location of opening and maximum moment (the
beam was simply supported and subjected to a single concenshy
trated load) the beam was expected to and did fail under
the load and not at the opening
S-y Cheng(15) in 1966 considered bending shear and
axial forces in his investigation of the ultimate strength
of extended circular openings in wide-flange beams At high
values of shear a four hinge mechanism was assumed while at
low shears hinges were assumed above and below the opening
20
where the tee section was smallest - similar to the failure
mode in pure bending Stress distributions were assumed at
hinge locations for each case Two l4WF30 beams were tested
to destruction one in pure bending and the other with a
moment to shear ratio of 24 inches which is a high value of
shear for the size beam used While reasonable agreement
between theory and experiment was obtained for both beams
tested an inherent fault in Chengs work lies in its inshy
ability to predict a continuous variation of failure loads
as the shear varies from a low to a high value It is
impossible for the change from a one to a four hinge mechanism
to occur suddenly with only a slight increase in shear
Experiments in the ultimate strength region were performshy
ed by I-C Chen(6) in 1967 on two 14WF30 beams each containing
two large openings in their webs One simply supported beam
containing two 8 inch diameter circular openings spaced 8
inches apart was found to fail in the manner of a be~u conshy
taining only one opening failure being associated with the
opening subjected to the largest moment both being under
the same shear force In the second beam containing two
8x12 inch reotangular openings spaced 4 inches apart the two
openings failed as a unit with four hinges forming at the
outer oorners opoundthe openings and the web between them evenshy
tually buckling No theoretioal ultimate strength analysis
was offered by Chen
21
In 1968 JEBower(16) proposed an ultimate strength
theory for beams containing a single rectangular opening in
their webs A point of contraflexure for Vierendeel stresses
was assumed to occur at the midlength of the opening and
three alternate stress distributions were proposed for
complete yielding of the low moment edge of opening The
first of these stress distributions assumed no Vierendeel
action and was quickly discounted as giving unrealistically
high predictions of strength The two remaining stress
distributions both took into account secondary bending moments
due to shear the first assuming localized web yielding in
shear and the second assuming uniform shear distribution
over part of the web with this area yielding in combined
bending and shear The first of these lower bound solutions
was based on an unrealistic stress distribution and proved
to give unrealistically low predictions of the beam strength
The second lower bound solution which was finally adopted
by Bower was based on a more realistic stress distribution
but was restricted in that the point of contraflexure was
assumed at the midlength of the opening which is not always
the case
Experiments were performed on four 16WF36 beams each
oontaining one rectangular opening as part of this work
Collapse loads are oited for each of the test beams and are
22
compared with predictions from the second lower bound analysis
However since all of the beams were tested at relatively high
ratios of shear to moment considerable strain hardening
would have occurred before collapse and experimental results
which take advantage of the reserved strength due to this
strain hardening (even though accompanied by large deformashy
tions) cannot justifiably be compared to a theory that ignores
this effect
A more general ultimate strength analysis for beams with
rectangular openings was offered by RGRedwood(17) also in
1968 A point of contraflexure was assumed to occur someshy
where within the tee section above and below the opening but
its location was not dictated as in Bowers analysis A
four hinge mechanism was assumed on the basis of previous
tests(13) with stress distributions assumed at both high
and low moment edges of the opening Shear stresses were
assumed carried by the entire web of the section with web
yielding occurring in combined bending and shear
Redwoods analysis was correlated with his previous
experimental investigations and found to be conservative
when shears were large But again the effects of strain
hardening were included in the experimental collapse loads
and not in the theory If the experimental failure loads
could be related to the occurrence of full yielding at the
23
critical sections a more valid comparison with the theory
would result Such a comparison was taken into account by
Redwood in a later paper(la) In this paper failure is defined
in a way similar to that suggested in the previous section
Another recent paper by Redwood(19) deals with beams
containing multiple unreinforced openings in their webs A
method is offered for determining the minimum spacing required
between openings to prevent their interaction and failure
as a unit An analysis is also given for determining the
strength of a member when failure is associated with more
than one opening and this is combined with Redwoods analysis
offered previously(17) for failure associated with only one
opening The theory is compared to the experimental work
performed by Chen(6) in 1967 (7)In 1964 EPSegner Jr conducted an investigation
of several types of reinforcing for rectangular openings
testing six wide-flange beams in four different sizes each
containing two or more openings The openings in five of
the six beams were reinforced each With one of five main
types of reinforcing The openings were positioned at
several different moment to shear ratios and each of the
beams was tested to destruction Unfortunately little can
be said about the performance of the different types of
reinforcing under varying moment-shear conditions because
24
of the large number of variables included in each of the tests
Perhaps Segners most significant contribution is to be
found in his cost comparison of the various types of reinshy
forcing for rectangular openings Estimates cited for six
different fabricators clearly indicate that shear-type reinshy
forCing or reinforcing designed to carry high shear forces
around the opening is economically non-feasible except in
unusual circumstances The most economical type of reinshy
forcing included in this study consisted of two flat plates
bent to fit the shape of the opening and welded inside the
opening with a small gap between them occurring at the midshy
depth of the opening This is the same type as shown in
Figure la Another type of reinforcing included in Segnerts
experimental work but unfortunately omitted from his eco~
nomic comparison consisted of straight horizontal reinforcshy
ing plates welded above and below the opening at the openingis
boundary The plates extended past the vertical edges of the
opening to allow for anchorage of the plate Considerable
welding problems were said to have been encountered by placing
the reinforcing flush with the upper and lower edges of the
opening since the fillet was likely to overrun into the radii
of the re-entrant corners but this could easily be overcome
by leaving a small web stub between the plate and the opening
to allow for welding This type including the modification
25
for welding purposes is that given in Figure lb
Although this reinforcing type was not included in the
economic comparison presented by Segner it would seem to be
of only slightly greater cost than that in Figure la
Approximately the same amount of reinforcing material is
needed for these two types and while the straight bar reinshy
forcing requires more welding it does not require bending
of the plates and eliminates the worry of fit between the
plate bends and the opening radii After giving careful
consideration to the economics and fabrication problems of
reinforcing a rectangular opening in the web of a beam it
was decided to devote the present investigation to reinforcshy
ing of the horizontal straight bar type
24 Scope of the Investigation
An ultimate strength analysis is presented for wideshy
flange beams containing large rectangular openings in their
webs and reinforced with straight bar reinforcing above and
below the openings The investigation includes the effect
on beam strength of variable opening depth to beam depth
opening length to depth reinforcing Size and moment to
shear ratio One lOWF21 and ten l4WF38 beams were tested to
collapse Each of the test beams contained one rectangular
opening centered at the middepth of the beam and ten of the
26
eleven openings were reinforced Deflections were measured
at several pOints for all of the test beams and each beam
was painted with a brittle coating of whitewash in the region
of the opening to obtain an indication of the order of onset
of yielding Four of the test beams were also equipped with
electrical resistance strain gauges at critical sections The
experimental investigation encompassed each of the variables
of the theoretical work
27
CHAPTER III
ULTI1iATE STRENGTH ANALYSIS
31 Assumptions
Based on the discussions in the previous chapters the
following assumptions are made in this analysis of reinforcshy
ed rectangular openings with horizontal reinforcing bars
1 Failure of the member takes place by formation of a four
hinge mechanism with hinge locations being at the corners
of the opening These locations are shown in Figure 7a
a cross-section through the opening being given in Figure
7b
2 A point of contraflexure occurs somewhere within the
length of the tee section Its location is the same
above and below the opening but this location is not
dictated
3 Stress distributions at high and low moment edges of the
opening are those shown in Figure 8b Since the stresses
are antisymmetric with respect to the vertical axis of
the beam only the stresses for the tee-section above
the opening are indicated The resultant forces acting
on the tee-section are shown in Figure 8a
4 Shear stresses are carried only by the web of the teeshy
section and are uniformly distributed across this web at
28
hinge locations when hinges are fully formed While
the shear stress at the boundary of the opening must be
zero this assumption introduces only very slight error
into the theory since these stresses can increase from
zero to their maximum value at a very small distance from
the opening 1 s boundary_ Due to the presence of the reinshy
forcing bar it is likely that most of the shear will be
carried by the region of web between the reinforcing bar
and the flange particularly when the secondary bending
stresses are very high This is further discussed in
Section 34 and introduces no significant error in the
development of this method
5 Yielding in the web occurs lliLder combined bending and
shear according to the von Mises criterion stated in
equation (2) Yielding in the flange and reinforcing is
in direct tension or compression
On the basis of the assumed stress distributions equishy
librium equations can be obtained for the tee-section at
values of the shear force which may vary in some cases
from zero up to the maximum as given by equation (5) At
the high moment edge of the opening section (1) in Figure
Bb stress reversal will occur within the web when the shear
force is relatively low (case I) but will occur within the
flange when the shear force is high (case II) These two
29
cases will be repounderred to as low and high shear conditions
respectively_ Three different locations of stress reversal
are possible under the low stress conditions
1 Reversal in the web stub below the reinforcing This
occurs at very low values of shear
2 Reversal in that portion of the web to which the reinshy
forcing is attached
3 Reversal in the clear web between reinforcing and flange
The range of shear values corresponding to reversal in
this region is very small
At section (2) the low moment edge of the opening for
practical situations reversal will occur only in the flange
32 Low Shear Solution - Case I
Consider equilibrium of the portion of the beam to the
right of Section (2) in Figure 7a Taking moments about
section (2) gives
where V denotes shear force as before F2 is the resultant
force at section (2) and Y2 is the distance from the edge of
the opening to the resultant normal F2bull All other symbols
used in this section and not specifically defined here are
defined in Figures 7 and 8 Taking moments about section (1)
30
for that portion of the beam to the right of this section
yields
(8)
where Fl and Yl are comparable to F2 and Y2 respectively
Equilibrium of the tee-section in Figure 8a requires that
(9)
Oonsideration of the assumed stress distribution at section (1)
for stress reversal occurring in the web stub below the reinshy
forcing ie for 0 =klS ~ u gives on integrating the
stresses
Fl = Af ~yf + SW(1-2~)G + Ar ~yr (10)
FIYl = Af ~ Yf(s~) + ~S2WG(1-2ki) + ArJ yr(u1) (11)
where Af = bt the area of one flange and Ar = q(c-w) the
area of one pair of reinforcing bars Separate yield stress
values are used for flange web and reinforcing because of
the large variation possible in these in a single beam A
discussion of the determination of these stresses is included
in Chapter 5 Yield stresses are designated as ~ yf for the
flange G yw for the web and ~ yr for the reinforcing
31
and ~ the normal stress carrying capacity of the web is
calculated from
t2 _ r- 2 3(V)2 ~ - yw-4sw (12)
and is another way of stating the von Mises yield criterion
given by equation (2) From consideration of the stress
distribution at section (2) for stress reversal in the flange
F2 = Af ltS yf(1-2k2) + sw ~ + Ar c yr (13)
F2Y2 = Al~Yf [S(1-2k2)~(1-4k2+2k~)J -1-s2Wlti +Ar~ yr(u~) (14)
Although explicit expressions for shear and moment capacity
cannot be determined from the above equations it is possible
to obtain from them that portion of the interaction curve
relating combinations of shear and moment at midlength of
opening to cause collapse of the beam for shear values in
the assumed range Consideration of other locations of stress
reversal will yield expressions from which the remainder of
the interaction curve can be determined
Specifically for 0 ~ kls ~ u kl can be determined as
a function of k2 from equations (9) (10) and (13) and is
given by
32
From equations (7) (8) (11) and (14) a quadratic expression
is obtained for k2 in terms of known quantities and V
Z [AfCSyf ] Vak2 (sw cs ) s + t + k2 ( -d+2h) + A G = 0 (16 )
f yf
For a given value of V equations (12) (15) and (16) can be
used to determine the corresponding values of kl and k2bull Fl
can then be calculated from equation (10) and FIYl from equashy
tion (11) The moment at mid1ength of opening is then detershy
mined from
(17)
Thus for a given value of V a corresponding value for M can
be obtained The values of kl and k2 must be checked when
calculated to determine whether initial assumptions of
o ~ k1s ~ u and 0 ~ k2 ~ 10 have been met Only one solution
to the quadratic equation in k2 will fulfill these requireshy
ments unless both solutions are equal The above equations
will yield a value for M for a given value of V starting at
V = 0 and continuing for increments in V until the location
of stress reversal at section (1) moves into the region where
the reinforcing is attached ie for kls gt u When this
occurs neither solution to equation (16) will yield values
of k1 and k2 that satisfy the initial assumptions and the
33
initial equations for stress resultants at section (1) must
be replaced by new equations reflecting this change Quite
simply equations (10) and (11) are replaced by
respectively for u ~ kls ~ (u+q) Equations (13) and (14)
remain unchanged for section (2) since reversal will occur
only in the flange at this section Thus for u ~ klS ~ (u+q)
ie for reversal within the reinforcing equations (9)
(13) and (18) yield
Similarly from equations (7) (8) (14) and (19)
- (d-2h)]
va u 2( c-w) Go s ( c-w) G
+ + [ _----oiOioV] [ yr IJ = 0 (21)AfGyf Af csyf sw cs- + s c-w) csyr shy
The same procedure is followed as in the previous case
first V being assumed ~ being obtained from equation (12)
34
k2 from equation (21) kl from (20) Fl from (18) FIJl from
(19) and finally from equation (17) the value of M correshy
sponding to the assumed value of V Again the values
obtained for kl and k2 must be checked to assure that the
initial conditions of u ~ kls ~ (u+q) and 0 ~ k2 ~ 10 are
met These equations will yield admissible values of kl
and k2 for values of V increasing from the last admissible
value obtained by solution of the previous set of equations
and continuing to where kls reaches the value (u+q) ie
for stress reversal in the clear web at section (1) ~nen
(u+q) ~ kls ~ s equations (18) and (19) are replaced by
(22)
and equations (9) (13) and (22) give
(24)
While from equations (7) (8) (14) and (23)
(25)
35
For a given value of V a corresponding value for M is
determined in the same manner as for the two previous cases
Acceptable solutions will be obtainable as long as the stress
reversal at section (1) falls within the clear web However
when this reversal occurs in the flange the so-called high
shear solution is indicated
33 High Shear Solution -Case 11
When the shear force is high stress reversal at section
(1) occurs in the flange and the equations for resultant
normal force and moment arm from the edge of the opening
become
Fl = Af ltS f(2k -1) - sw~ - A C (26)Y 1 r yr
The stress reversal at section (2) will still occur in the
flange and equations (13) and (14) are used with the above
equations and equations (7) (8) and (9) to obtain
(28)
(29)
36
For a given value of V a corresponding M is obtained from
the above equations and equations (12) and (17)
By starting with a value of V = 0 and increasing this
by a small increment with each successive iteration correshy
sponding values of M can be found for the full range of V
values by use of the equations in this and the previous
section An interaction curve can then be plotted relating
V and M over their full range of values A typical intershy
action curve is shown in Figure 9 for a beam containing a
reinforced opening where the curve has been nondimensionalized
by division of V and M by Vp and Mp respectively Also
indicated in this curve are the four regions corresponding
to the different locations of stress reversal at the high
moment edge of the opening
34 Limits of Interaction Curves
It is quite possible for the MM values for a certainp range of VV values on the interaction curve to be greaterp than 10 as can be seen in Figure 9 This simply means
that the reinforced opening can be stronger than the unperfoshy
rated beam for pure bending and for bending with very low
shear However values of MM greater than 10 have no realp practical significance because in such cases failure of the
beam would occur not at the opening but at some unperforated
37
portion of the beam near the opening Therefore 10 is
taken as the maximum value of MM and a horizontal line isp drawn at this value from the MM axis to intersect thep interaction curve This is shown in Figure 9
The interaction curve is also limited with respect to
the maximum VV value permissible Since shear forces canp only be carried by the remaining part of the web the maximum
plastic shear capacity at the opening is equal to V thep plastic shear capacity of the uncut section times the ratio
of the remaining clear web to the initial clear web This
is written as
d-2t-2h (6)= d-2t
In other words when the web of the section at the opening
has yielded in shear its normal stress carrying capacity
~ becomes zero The value of V at which this occurs can be
determined from equation (12) and the ratio of this shear
value to Vp is given by equation (6) Vmen this limiting
value of shear is reached it is no longer possible to obtain
additional points on the interaction curve because any
further increment in V would yield an imaginary solution for
~ Rather when(VVp)max is reached a line is drawn from
this last point on the interaction curve perpendicular to
38
the vVp axis This line is the final portion of the intershy
action curve and represents the actual limiting value of
This limiting value of VVp is however not always
reached for all practical sizes of beam opening and reinshy
forcing It is possible for the equations in the previous
two sections to yield values of kl and k2 that no longer
conform to initial assumptions (for any position of stress
reversal) at a shear value less than the maximum predicted
by equation (6) This occurred in some of the cases tested
to confirm the consistency of these equations and was found
to be caused by an imaginary solution to the quadratic in k2
occurring while stress reversal at section (1) was still in
the clear web of the section Stress reversal at section (2)
was as assumed in the flange Consideration of other
locations of stress reversal did not give real answers This
condition was then investigated and it was found that because
of an interdependence of opening length and reinforcing area
either the opening length must be less than a given value or
the reinforcing area greater than another value in order
for the interaction curve to be able to pass this region
The limiting half length of opening a is given by
(30)
39
and is obtained by combining equations (7) (8) (14) (23)
and (24) with ~ equal to zero By eliminating small terms
this may be simplified to
(31)
Alternatively the minimum area of reinforcing required is
given by
A =2 ( 32) r 13
If this requirement is met it will be assured that the
maximum shear capacity of the section will be reached
Physically the interdependence of reinforcing area and length
of opening can be interpreted to mean that as opening length
is increased the secondary bending stresses which are a
function of shear and opening length increase at sections
(1) and (2) to such an extent that unless the reinforcing
area is increased so that it can carry these high stresses
the lower portion of the web is forced to carry such high
bending stresses that little or no shear can be carried by
this portion of the web The shear stress can then no longshy
er be considered to be uniform across the entire web of the
tee section but instead is restricted to the clear web
between flange and reinforcing or to a portion of this area
40
Reaching the maximum value of vVas given by equationp
(6) is not a necessity either for the interaction curve or
for the performance of a given beam and opening A given
interaction curve is still correct if it terminates before
reaching this value of vVp This occurs when the MMp value
decreases rapidly for very small increments in vvp and
becomes zero In this case the last portion of the intershy
action curve is very nearly a vertical line This line then
represents the actual maximum shear capacity for the given
beam opening and reinforcing dimensions Only when a beam
is to perform under high shear conditions and it is desired
to develop its maximum shear capacity is it necessary to
ensure that Ar is large enough so that this value can be
reached
41
CHAPTER IV
APPROXIMATE METHOD
41 General Remarks
If a particular beam and opening size is being investishy
gated over a very limited range of shear values it is a
fairly straightforward matter to calculate the moment capacity
of the beam corresponding to the given shear values using
the equations presented in the previous chapter hven if the
location of stress reversal were consistently assumed in the
wrong region the calculations would have to be repeated at
most four times for a particular shear value However it is
quickly realized that for a large range of shear values or
for a complete interaction curve it would be extremely
laborious to perform these calculations by hand and recourse
to automatic computation would seem almost essential A
computer program has been developed to perform the necessary
calculations for a complete interaction curve for a specified
beam opening and reinforcing size and is given in Appendix A
Since the practical development of a complete interaction
curve is seriously limited by the length of calculations
involved a simple to use approximate method is suggested for
determining the strength of a perforated beam at various
moment to shear ratios In the development of this approxishy
42
mate method the high shear region only is considered for
reasons which will become evident
42 DeveloEment of the Method
Combination of equations (3) (12) and (28) result in
the following expression
(33)
where for simplici ty ~I~- - ~Y= ~~ t the specified minimum
yield stress of the material Similarly equations (1) (17)
(26) (28) and (29) can be combined to give
M d(kl -k2) + t(k~-ki) (34) ~ = a-i) + wtf2t)~
Xf
and from equations (12) (28) and (29) kl and k2 are related
by
(35 )
If it is now assumed that the flange thickness is significantshy
ly less than half of the remaining clear web tlaquo s the
above expressions can be readily simplified Since (u+~) is
43
of the same order of magnitude as t it is also assumed that
(u+~) laquo By eliminating small terms and substituting for
kl+k -l-x = ~ equation (35) can be simplified to2 f
(36)
This simple quadratic can readily be evaluated for~ In
general both solutions will be real although for a wide
range of beam and opening sizes investigated the solution
corresponding to a minus in the quadratic formula was found
to fall within the region of low shear on the interaction
curve (as defined in the previous chapter) while the solution
corresponding to a plus consistently fell in the medium to
high shear region thus satisfying the initial assumptions
This latter solution was therefore considered to be the
correct one and the corresponding value for ~is given by A 2as [ 2 ] 12_2s2( r) + w2(s2~) _ 4A2
IS = If f)Af 3 r ( 37 ) - (s2 + 4a2 )
T
which may be rewritten as
_2~(Ar + l(Aw) ( 2h)2 1 ( r 2 ~ C = 1+01 If) 2 If l-er ~ - 16 X)(l+o)~ (38)
where Aw = wd and 0lt = i(~)2(k - 1)2
Equation (34) can also be simplified by eliminating small
44
terms and by considering that for the transition from low to
high shear to occur kl must equal unity Equation (34) then
becomes
M (39 )M= p AW
1 + 4A f
Similarly equation (33) can be simplified to
(40)
For zero or very small values of ~ the above equation can
yield values of VV greater than the maximum VVp value as p
given by equation (6) This implies that some portion of the
shear is carried by the flanges of the beam Since the flanges
can in fact carry some shear and since the theory as given
in Chapter III is sufficiently conservative for large shear
values (as can be seen from the experimental results given
in Chapter VI) equation (40) is not considered to predict
excessive values of shear capacity and is adapted for use in
this method of analysis The shear capacity is then given
by equation (40) and the corresponding maximum M~Ap value at
this shear value is given by equation (39) where ~ is given
by equation (38)
The maximum shear capacity of the section is given by
45
equation (40) when ~ is equal to zero Solution of equation
(38) for Ar when ~ equals zero gives the required reinforcing
area necessary to reach the maximum shear capacity of a secshy
tion This is given by
- AW(l 2h) flA (41)r - T -a-~
Equation (41) reduoes to equation (32) in Chapter III when
substitution is made for ~ When the reinforcing area
conforms to the above requirement the maximum shear capacshy
ityas given by
V 2hr = (I-a-) (42) p
will be reached and the corresponding maximum moment capacshy
ity at this value of shear is given by
Ar 1 - A
M fr= A p 1 + w
4Af Thus for a given beam opening and reinforcing size if
equation (41) is satisfied equations (42) and (43) together
fix one point on the approximate interaction curve while if
equation (41) is not satisfied this point is fixed by equashy
tions (38) (39) and (40) In either case a line is dropped
from this point perpendicular to the vvp axis thus forming
46
part of the approximate interaction curve The remainder of
the curve is obtained by connecting the point given by equashy
tion (42) and (43) or by equations (38) (39) and (40) with
a point on the M~Ip axis corresponding to the maximum moment
capacity of the section This maximum value of blfvl isp simply the plastic moment of the reinforced perforated secshy
tion divided by the plastic moment of the unperforated secshy
tion and is identical to the same point obtained in the
previous chapter with no shear force acting The maximum
value of Mi1p is given by
Z - wh2 + Arlt 2h+2u+q) = ---------w----------shyZ
or using a consistent approximation for Z this can be
rewri tten as
M A (45 ) M=
p 1 + w4Af
An approximate interaotion curve is given in Figure 9 for
comparison with the interaction ourve obtained by the method
desoribed in Chapter Ill
43 Limitations of the AEproximate Method
The maximum praotical M~lp value for the approximate
47
interaction curve is limited to 10 for the same reasons that
the more exact curve is so limited and a horizontal line
drawn from the MA~p axis at 10 and intersecting the approxshy
imate curve forms its upper portion The maximum value of
VVp for the approximate curve is limited to VVp max given
by equation (42) This limitation has been discussed in the
previous section
Equation (41) specifies the minimum size of reinforcing
necessary to reach the maximum shear capacity of the section
as given by equation (42) yVhen the reinforcing area conforms
to this minimum requirement equation (43) is used to predict
the moment capacity of the section corresponding to the shear
value of equation (42) Examination of equation (43) reveals
that as the reinforcing area is increased past the minimum
given by equation (41) the moment capacity decreases rather
than increases as would be expected from physical considershy
ations or from examination of interaction curves obtained
by the methods of Chapter Ill For sizes of reinforcing
only slightly greater than that given by equation (41)
equation (43) will be sufficiently accurate and will not
significantly underestimate the moment capacity of the secshy
tion although it may be deSirable to replace Ar in equation
(43) with the minimum Ar given by equation (41) Equation
(43) then becomes
48
A 2h l1 - ~(l-a)J~
M ( 46)~= A 1 + W
4Af This may be written more simply as
aw 1 - 73Af
= ---1-shyA 1 + w
4Af The corresponding shear value is given by equation (42)
However as Ar increases more and more above the value
given by equation (41) the moment capacity of the section
will be increasingly underestimated and if more accurate
values are desired recourse must be made to more accurate
methods Examination of equation (38) reveals that as Ar
increases past the value given by equation (41) 0 becomes
negative up to the point where
when the solution for cgt becomes imaginary For values of
Ar lying between those given by equations (41) and (48) ~
is negative and equations (39) and (42) can be used to
accurately predict the point on the approximate interaction
curve from which a perpendicular line should be dropped to
the VVp axis and a line drawn to the point given by equation
(44) on the MM axisp
49
Al though for this case a value exists for (gt equation
(42) rather than (40) is used to determine the shear capacshy
ity of the section This is the only logical approach beshy
cause Ar is greater than that required to reach the maximum
shear capacity and increasing the reinforcing area although
it cannot increase the shear capacity of the section past
that given by equation (42) also should not serve to decrease
this capacity
When Ar is greater than the value given by equation (48)
equation (39) cannot be used to obtain a more accurate preshy
diction of moment capacity because 0 as given by equation (38)
will not be real Consideration of the equations used in
deriving the approximate method leads to the conclusion that
will be imaginary only when the maximum shear capacity of
the section is reached while klslaquou+q) Equation (48) shows
the relation between reinforcing area and size of opening for
this to occur It can be seen that small opening size or
large reinforcing size will eause the maximum shear capacity
to be reached while kls (u+q) When this occurs equation
(42) predicts the shear capacity of the section since Ar is
greater than that required by equation (41) to reach this
maximum shear value At this value of shear ~ equals zero
and equations (17) (20) and (21) in Chapter III reduce to
(49a)
(50)
50
A q (5la )
M = _l_l_qdA_rf=--[2_U_2_+__(2_U_+_q_)_+_2_h_(_2U_+_q_)_-_2_(_k_l_S_)2_-_4_k_l_S_h_J_-_~_~_(_~~)
Mp Aw 1 + 1iA
f
By considering t laquo d equations (49a) and (5la) can be further
simplified to
(49)
(51)
Equations (49) (50) and (51) can then be used with equation (42)
to determine the pOint of intersection of the two lines composing
the approximate interaction curve
44 Summary and Discussion
Determination of the approximate interaction curve can be
summarized as follows
Case I
The maximum shear capacity of the section will be reached
if
A 2 AW(l_ 2h) fT (41)r 4 d 4a where a = ~(h)2(~ _ 1)2 The maximum shear capacity is then4 a 2h bull
given by
V (1 _ ~h) (42)Vp =
51
and the moment which can be attained with this shear acting
is Ar
1- ri- = Af (43)
p 1 + w 41f
where Ar is that given by the right hand side of equation (41)
Case 11
If equation (41) is not satisfied the maximum shear
capacity will not be reached and the shear capacity is given
by
(40)
The moment capacity which can be attained with this shear
acting is
1 1 + w
4Af where ~ is given by
A A _ ~( r) + l( w) ( 2h)2 1 ( r)2 0 ( )~ - 1+ltgtlt Af 2 If l-T 1+CgtI - 16 -x (l+olt)l 38
Case Ill
If Ar is significantly greater than that given by equashy
tion (41) the maximum shear capacity will still be given by
52
but if desired a more accurate estimate of the moment which
can be attained with this shear acting can be obtained as
follows
Case IlIA
For (48)
MMp at maximum VVp is given by
Ar 1 - I - ~
~ = __f_~_ ill A
P 1+ w4If
where r will be negative and is given by
(38)
Case IIIB
For A2 gt (aw) 2
+ (~)2w2 (48)r 3 ~
at maximum VV is given byp A A
1+-f(2h)__1_ JL (ha) (2dh ) (1+ 2dh )Af d 2[j Af (51)
A1 + w
4Af
53
where kl and k2 are given by
+l (50)s
(49)
and only that solution satisfying the conditions 0 ~ k2 ~ 10
and u ~ kls ~ (u+q) is correct
The appropriate one of these three cases can be used to
determine a point on the approximate interaction curve A
perpendicular line is then dropped from this point to the
vVp axis and forms part of the curve The remainder of the
curve is obtained by drawing a straight line from the initial
point to a point on the MMp axis given by equation (44) or
(45) and by then cutting off the approximate interaction curve
at the maximum Mlyenip value of 10 as described in the first
paragraph of this section
Complete and approximate interaction curves for each
size of beam opening wld reinforcing included in the expershy
imental part of this investigation are shown in Figures 10
through 15 A cross-section of the member is shovm on each
curve for reference and the method used in obtaining each of
the approximate curves is stated On Figures 11 14 and 15
the reinforcing size was greater than that given by equation
(41) and both Case I and Case III were used to obtain approxshy
54
imate curves for comparison It can be seen that only when
the reinforcing area was significantly greater than that
given by equation (41) (Figure 11) was there a large difshy
ference in the Case I and Case III values
For the partioular case of unreinforced openings by
substituting for Ar equal to zero in equations (39) and (40)
these reduoe to
M AW 2h 1
1 - 2If(l-or~ r= A (52)
p 1 + w4If
v (2h)JTr = I-d~ p
where ~= i(~)2(~ - 1)2 as before These equations are
identioal to those given by R_GRedwood(17) for unreinforced
openings Again a perpendioular is dropped from the point
defined by these two equations to the vVp axis and another
line is dravln from this point to a point on the MMp axis
given by
111 Z - wh2 (54)r = z
p
thus oompleting the approximate interaction curve for the
case of an unreinforoed opening Using the same approxishy
mations as used previously equation (54) oan be written
55
MM = 1 (55) p
which agrees with Redwoods work and gives a slightly highshy
er value for the maximum MM value A complete and approxshyp imate interaction curve for a section containing an unreinshy
forced opening is given in Figure 12 where the equations
given by Redwood(17) were used for the complete curve
56
CHAPTER V
EXPERIMENTAL INVESTIGATION
51 Selection of Test Beams
As discussed in Chapter I it was decided to limit this
investigation to rectangular openings reinforced with straight
horizontal strips welded above and below the opening It
was also decided to use a standard wide-flange beam rather
than a welded section because of the usual use of these in
building structures where openings are most oommonly requirshy
ed ASTM A 36 structural steel was used throughout all
of the experimental work because this material was used in
most of the previous investigations related to this work
The size of the test beams was chosen on the basis of
economy ease of handling and ease with which reinforcing
bars could be welded in place It was decided to use a secshy
tion that was compact at the specified yield stress and
also at the higher yield stresses expected in the test
beams In the selection of test beams only sections with
low depth to thickness ratios were conSidered in order to
avoid the problem of web instability The flange width to
thickness ratio was also kept as low as possible in order to
avoid premature compression flange buckling On the basis
of these considerations and after a preliminary test pershy
57
formed on a 10VF21 section it was decided to carry out the
remainder of the experimental investigation using a 14WF38
section of A 36 steel The properties of the test beams
used are listed in Table 1 A nominal opening depth to beam
depth ratio of 05 was chosen because of the practical need
for openings of approximately this depth in larger beams and
also because investigations of unreinforced openings were in
this range One test beam included in this work had a nominal
opening depth to beam depth ratio of 0643 A basic opening
length to depth ratiO or aspect ratiO of 15 was chosen
again from practical considerations Two beams were includshy
ed with aspect ratios of 20
The corner radii of the opening had to be large enough
to avoid excessive stress concentrations that might cause
premature cracking of the corners and yet small enough to
not appreciably decrease the effective area of the opening
In previous investigations corner radii ranged from 14 to
one inch A 58 inch radius was used in this study for the
14WF38 beams and a 316 inch radius for the 10WF21 beam
The area of reinforcing for each opening was chosen so
that the moment capacity of the unperforated member would be
equalled or exceeded and the full shear capacity of the net
section could be utilized The moment capacity condition
requires that
58
wh2 gt- (56)2h + 2u + q
This follows from equation (44) The reinforcing area reshy
quired to meet the shear condition is given by equation (32)
in Ohapter 111 It was found that for the 14WF38 beam used
in this investigation with 2hd equal to 05 ~~d ah equal
to 15 the area of reinforcing required to meet these condishy
tions was approximately ~vice that given by the right hand
side of equation (56) One beam was tested in the high shear
range with reinforcing such that the interaction curve fell
short of VVp msx Again it should be mentioned that the
length u is that required for welding the reinforcing in
place and should be as small as possible The width of the
reinforcing bars q was chosen so that the width to thickshy
ness ratio did not exceed 85 as specified by the design
code(910) for ultimate strength design The anchorage
length of the reinforcing bars was also designed by use of
the AISC and OISO design codes on the basis of develshy
oping the full strength of the reinforcing bars at the edges
of the opening The ultimate strength loads were taken as
167 times those for elastic design as recommended by the
codes
The openings in all of the test beams were flame cut
the 10WF2l beam number lA having the corners drilled before
59
cutting and then having the rough edges ground to the proper
size Beams numbered 2A 2B and 3A were entirely poundlame cut
including corners and were not poundinished poundurther The remainshy
ing beams had drilled corners with the rest of the opening
being poundlame cut They were not finished poundUrther
All test beams were simply supported and were loaded with
a single concentrated load The openings were positioned so
as to achieve the desired moment to shear ratios and all
openings were centered at the middepth opound the beam All beams
were locally reinpoundorced with cover plates so as to ensure
poundailure at the openings and web stipoundfeners were added under
the load and at reaction points Local reinpoundorcing was deshy
signed on the basis opound resisting the loads predicted by the
interaction curves plus the expected increase in loads above
this due to strain hardening Beam Sizes opening locations
and local reinpoundorcing are shown in Figures 16 17 and 18 poundor
each opound the test beams
52 Experimental SetuE
All beams were tested in a Baldwin-Tate-Emery 400k
Universal Testing Machine which is a mechanically operated
hydraulic testing machine opound 400k capacity The ends opound the
beam were supported by a specially reinpoundorced 14 inch wideshy
poundlange section that also poundormed part of the lateral bracing
60
system This is shown in Figures 19a and 20a Lateral bracshy
ing consisted of support against horizontal displacement and
rotation at pOints of load and at end reactions Bracing
for the beams numbered lA 2A and 3A was achieved by the
attachment of horizontal 8 inch wide-flange beams to the
vertical portion of the end supports with the 8 inch secshy
tions running the entire length of the test beams on each
side and positioned so that pins could be inserted at bracshy
ing points between the 8 inch sections and the top flange of
the test beam to allow for only vertical displacements of the
test beam The pins were given a heavy coating of grease to
minimize friction This type of bracing proved satisfactory
but made it very difficult to see parts of the test beam durshy
ing the test To alleviate this visual problem beam 2B was
tested with the lateral bracing described above on only one
side of the beam while for the other side vertical bars
attached rigidly to the 8 inch sections and bent to pass
over the test beam were held tightly against the upper flange
of the test beam at bracing points This arrangement proved
unsatisfactory and was not used for subsequent tests
For testing the remaining beams short 8 inch wide-flange
sections were attached vertically to the vertical portion of
the end supports and greased pins were used to provide latershy
al bracing at these locations (Figures 19b and 20b) Lateral
61
bracing at the point of load was provided by roller bearings
- two on each side of the test beam spaced 6 inches apart
vertically and bearing against the web stiffener of the beam
The roller bearings were attached to triangular sections
which in turn were attached to a wide-flange section held
rigidly to the laboratory floor See Figures 19c 20c
and 20d This type of lateral bracing provided nearly
frictionless vertical displacement of the beam while preshy
venting rotation and horizontal displacements and proved
to be very effective Access to the beam during testing
was not at all limited by this bracing system
Deflection dial gauges with a least reading of 0001
inch were used to determine deflections at points of load
end supports edges of openings 2 inches outside each openshy
ing edge and at centerline of beam when possible All dial
gauges were rigidly fixed to non-yielding supports Their
positions are indicated in Figures 16 17 and 18 Four of
the test beams were equipped with electrical resistance strain
gauges in the vicinity of the opening The locations of
these gauges are shown in Figure 21 Each test beam was
painted with an opaque brittle coating of whitewash - a
mixture of lime and water of the consistency of light cream
applied in the vicinity of the opening at least one day before
testing During testing this coating of whitewash flaked
62
off in minute pieces in areas undergoing plastic strains thus
indicating visually which sections of the beam had yielded
The flaking occurred at loads higher than those correspondshy
ing to yielding of each section and did not give an accurate
measure of the onset of yielding but instead gave an estishy
mate of the order in which each of the sections yielded
53 Testing Procedure
Essentially the same procedure was followed in testing
each of the beams The beam was first placed in position on
its end supports a fixed roller under one end and a free
roller under the other The bema was made level and centershy
ed with respect to its loading point and end supports
Lateral bracing was then fixed in place and the head of the
machine brought into contact with the specially hardened
roller through vhich the load was applied to the beam Dial
gauges were then put in position and strain gauge leads
connected to the Budd Automatic Strain Indicator A small
initial load was then applied to the beam and zero readings
were taken for all strain and dial gauges
At least four load increments of either lOk or 20k were
applied within the elastic range with all gauge readings beshy
ing recorded for each load increment When the first inshy
elastic response of the beam was noted either from strain
63
gauge readings on the beams that were so equipped or by
deflection vdth time of any of the dial gauges the load
increment was reduced to 5k and after each load increment was
applied all plastic flow was allowed to take place before
readings were taken To determine whether plastic flow had
ceased at each load increment dial gauge readings were plotshy
ted against time When the S-shaped curve reached its upper
portion and levelled out plastic flow had ceased and readshy
ings were taken During this time required for plastic flow
as much as 30 minutes for higher loads it was important to
hold the load on the beam constant Loading continued in
this manner until the ultinlate collapse of the test beam
either by web buckling at the opening or by tearing of one
or more of the openings corners When this occurred the
beam was no longer able to maintain the applied load The
load was then removed and the beam was taken out of the test
frame
54 Determination of Yield Stresses
In order to accurately access the expected strength of
each of the test beams it was necessary to determine their
actual yield stresses This was accomplished by the testing
of tensile coupons cut from the flange ana web of the beams
and from the reinforcing strip used at the openings The
64
dimensions of a typical tensile coupon are given in Figure 22a
and the locations from which such coupons were taken are shown
in Figure 22b The beams from which coupons were to be taken
were ordered an extra 12 inches long so that this section could
be cut off and tensile coupons made and tested before the testshy
ing of the actual beam Reinforcing strip was ordered an extra
36 inches long for the same purpose Test beams 2A 2B and
3A were all cut from the same beam and were all reinforced
from the same reinforcing strip Test beams 2C 2D 3B 4A
4B 5A and 6A were all cut from the same beam Reinforcing
for beams 2C 2D 4A and 4B was all cut from the same strip
Each of the tensile coupons was tested in either a 20k Riehle
or a 20k Instron Testing Machine Coupons tested in the
Riehle machine were tested under nearly constant load rate
An extensometer was attached to the coupons to automatically
record the stress-strain curves Since the crosshead
position could not be fixed on this particular machine
a static yield stress could not be obtained and therepoundore
only the lower yield stress is given in Table 2 Tensile
coupons tested in the Instron machine were loaded at a
constant cross head speed of 002 inches per minute When
the plastiC plateau was reached the crosshead position was
fixed and the load was allowed to drop off After about five
minutes the static yield stress had been reached and no
65
further change in load could be seen on the automatically
recorded stress-strain curve Straining was then allowed to
continue into the strain hardening range A typical stressshy
strain curve for a coupon tested in this machine is given in
Figure 23 Lower yield and static yield stresses are given
for coupons tested in the Instron machine in Table 2
Either the static yield or the lower yield stresses can
be used in determinimg the expected strength of a test beam
depending on which more closely approaches the actual test
conditions of the beam In this investigation the beams
were tested under loading increments with the loads being
held constant until plastic flow had ceased Since it was
thought that the method of obtaining the lower yield stresses
more closely paralleled the actual testing procedure these
stresses were used in evaluating the expected strength of
the test beams
66
CHAPTER VI
EXPERIMENTAL RESULTS
61 Behavior of Beams during Testing
Since the behavior of all the beams during testing was
quite similar a complete description of only one such typshy
ical beam number 20 is given here Deviations from this
typical behavior are discussed at the end of this section
Beam 20 was first tested elastically to a load of 80k
in lOk increments and was then unloaded Strain gauge and
dial gauge readings were taken at each load increment and
were analyzed After it was determined from these readings
that strain gauges and automatic recording equipment were
in good working order the beam was reloaded this time to
be tested to destruction This check was run for only this
one test beam all others being tested continuously through
elastic and plastic ranges
An initial load of 5k was again applied to the beam and
strain and dial gauge readings taken The load was then inshy
creased to 80k in 40k increments (lOk or 20k increments were
used in all other tests because separate elastic tests were
not performed on these) and then to 120k in lOk increments
With the load held stationary a slight increase of deflecshy
tion with time was noted on the dial gauges at this load so
67
increments were decreased to 5k bull
At l30k slight lateral deflection of the beam at the
opening was noted although this deflection never became exshy
cessive throughout the remainder of the test Strain gauge
readings first indicated yielding at both the bottom edge of
the upper reinforcing bar at the low moment edge of the openshy
ing (Figure 21 gauge 25) and at the top edge of the top
flange at the high moment edge of the opening (gauge 17) at
a l35k load When the load was increased to 140k yielding
occurred at the other top edge of the top flange at the high
moment edge of the opening (gauge 19) At a load of 145k
yielding had occurred at the center of the top flange at the
high moment edge of the opening (gauge 18) and also in the
web at the centerline of the opening (rosette gauge 10 11
12) At 155k the web at the high moment edge of the openshy
ing had yielded (rosette gauge 13 14 15) as had the web at
the low moment edge of the upper reinforcing bar (rosette
gauge 4 5 6) Slight displacement between the ends of the
opening could be seen at a load of l60k and at l65k the
lower edge of the upper reinforcing bar at the high moment
edge of the opening (gauge 20) had yielded
At l70k the upper edge of the upper reinforcing bar at
the high moment edge of the opening had yielded (gauge 21)
thus making the yielding at the high moment edge of the openshy
68
ing complete (based on average strain values for the flange
and reinforcing) While at this load the first flaking of
the whitewash was noted at both the upper low moment and
the lower high moment corners of the opening The web at the
middepth of the beam between the low moment ends of the reinshy
forcing yielded at 175k (rosette gauge 1 2 3) and whiteshy
wash flaking was detected on the underside of the top flange
at the high moment edge of the opening At lSOk the web at
the low moment edge of the opening (rosette gauge 7 S 9)
yielded and whitewash flaking occurred along the web immedishy
ately beneath the upper reinforcing bar from the low moment
corner of the opening to beyond the low moment end of the
reinforcing bar and also in the web above and below the
opening At 185k whitewash flaking occurred at the lower
low moment corner of the opening and in the web immediately
above the lower reinforcing bar from the corner of the openshy
ing to the low moment end of the reinforcing bar Yielding
occurred at the center of the top flange at the low moment
edge of the opening (gauge 23) at 190k and also at the top
edge of the upper reinforcing bar at the low moment edge of
the opening (gauge 26) This made yielding at the low moment
edge of the opening complete (based on average strain values
for the flange and reinforcing) At this same load whiteshy
wash flaking occurred in the web above and below the low
69
moment end of the upper reinforcing bar
The first strain hardening was also indicated from
strain gauge readings at the load of 190k and occurred in
the web at the centerline of the opening (rosette gauge 10
11 12) At 195k whitewash flaking occurred in the web
between the low moment ends of the upper and lower reinforcshy
ing bars Yielding occurred at the lower edge of the top
flange at the high moment edge of the opening (gauge 16) at
200k and strain hardening occurred at the upper edge of the
top flange at the high moment edge of the opening (gauge 17)
and at the lower edge of the upper reinforcing bar at the
high moment edge of the opening (gauge 20)
At 211k a crack developed in the lower low moment corshy
ner of the opening and it was no longer possible to maintain
the applied load The beam was then unloaded and removed
from the test frame The crack which occurred at the corner
radius was one half inch long and was inclined toward the low
moment end of the lower reinforcing bar A photograph of this
beam after completion of the test can be seen in Figure 24
Of the remaining beams in the test series only 2D 3B
and 4B were implemented with strain gauges the others having
only the brittle coating of whitewash to indicate the order
of onset of yielding The first of these beams to be tested
lA was given too thick a coating of whitewash and the flaking
70
of this whitewash during testing was not as satisfactory as
on other tests Similar problems were encountered with 2A
which had to be given a second coating of whitewash because
most of the first coat was rubbed off due to improper handshy
ling of the beam before testing The flaking off of the whiteshy
wash on beam 2B during testing was also not as good as was
expected although the whitewash had not been applied too
thickly This beam was tested on an extremely humid day
and it is thought that the problem with the whitewash flaking
was due to this excessive humidity
The order of onset of yielding as indicated by strain
gauge readings is given for each of the strain gauged beams
(20 2D 3B 4B) in Table 3a while the order of onset of
strain hardening is given for these beams in Table 3b Loads
corresponding to complete yielding of the cross-sections are
also given The order of whitewash flaking for each of the
beams is given in Table 4 Ultimate loads are also given
along with the mode of collapse of the beam
Of the eleven beams tested all but one were tested to
collapse The test of beam lA was terminated when deflecshy
tions became excessive although no web buckling or tearing
of corners had occurred and the beam was still able to mainshy
tain the applied load Only one of the beams tested to
collapse ultimately failed by web buckling This was the
beam with the unreinforced opening 6A All of the other
71
beams suffered ultimate collapse by the tearing of one or two
of the corners of the opening Beams 2A 2B 2C 3A 4A 4B
and 5A developed cracks at the lower low moment corners of the
openings Beam 3B cracked at the upper high moment corner of
the opening and beam 2D developed cracks at both the lower low
moment and the upper high moment corners of the opening simulshy
taneously Photographs of each of the test beams after collapse
are shovm in Figure 24 Comparison photographs of the beams for
variable moment to shear ratio reinforcing size aspect ratio
and opening depth to beam depth are given in Figures 25 and 26
62 Stress Distributions and Failure Loads
Based on measured strains stresses were calculated for
beams 2C 2D 3B and 4B Elastic stresses were determined
from the usual elastic theory while plastiC stresses were
determined from plasticity theory presented by Hill(8) and
reduced to the form given by Bower(l6) Initiation of strain
hardening was also determined from this method which is
summarized in Appendix B
Stress distributions at the high and low moment edges
of the opening of beam 2C are shown in Figure 27 while those
at the centerline of the opening and across the flange at the
high moment edge of the opening are given in Figure 28 The
variations in bending stress across the length of the opening
72
at the center of the top flange and at the top of the upper
reinforcing bar are shown in Figure 29 Figure 30 shows the
stress distribution at the high and low moment edges of the
opening for beam 3B and the stress distributions at the high
moment edge of the opening of beams 2D a~d 4B are given in
Figure 31
Experimental failure loads for each of the test beams
were determined from the load-deflection curves for each
test as described in Chapter 11 These curves and their
corresponding failure loads are given in Figures 32 through
42 Interaction curves based on the analysis presented in
Chapter III were dravn for each of the test beams using the
actual measured dimensions and yield stresses for each beam
The experimentally deterrQined failure loads were plotted on
these curves which are given in Figures 43 through 50
Approximate interaction curves for nominal dimensions and
yield stresses are also included in these figures
63 Other Factors
Of the eleven beams tested only one underwent signifshy
icant lateral buckling during testing Beam 2B buckled
laterally at the high moment edge of the opening due to the
inadequate lateral support provided as described in Chapter
V However final collapse of this beam was due to the tearshy
73
ing of one of the corners of the opening and not to the
lateral buckling Also the lateral buckling was not
significant until after the very high loads associated with
strain hardening were reached The modified lateral support
system shown in Figures 19b and c and 20bc and d and discussshy
ed in the previous chapter effectively prevented lateral
buckling of the remaining test beams and no further diffishy
oulties were encountered due to this factor
For each of the test beams lateral deflections were
largest at the high moment edge of the opening although they
never became significant except in the case of beam 2B A
curve showing lateral deflection at the high moment edge of
the opening versus shear force at the opening is given for a
typical test beam 20 in Figure 51 The shear corresponding
to the experimental failure load is indicated on the curve
and the laterally unsupported length of the beam is given
The laterally unsupported length of the test beams did not in
any case exceed the lengths specified by the design codes(9 10)
Local buckling of the top flange occurred at the high
moment edge of the opening for several of the beams tested
although this buckling always occurred at very high loads
after considerable strain hardening had taken place Figure
52 shows the difference in strain readings between the upper
and lower edges of the flange at the high moment edge of the
74
opening versus the shear force at the opening for a typical
test beam 20 The distribution of stresses across the width
of the flange at the high moment edge of the opening (Figure
28b) show a relatively uniform distribution up to yielding
at this location However the effects of local flangebull
buckling can be seen by the considerably higher compression
stresses at the edges of the flange at very high values of
shear
The nine beams containing reinforced openings which were
tested to destruction all exhibited an effect which was preshy
viously unexpected The strain gauge readings for rosette
gauges 1 2 3 and 4 5 6 on beam 20 (Figure 21) as well as
the whitewash flruring on all nine of these beams indicated
widespread yielding of the web between the low moment ends of
the reinforcing bars This effect occurred at loads near the
experimental failure loads of the beams but did not interact
with the development of hinges at the corners of the openings
because of the extension of the reinforcing bars well past
the edges of the openings In addition to the shear yielding
in the web between the low moment ends of the reinforcing
bars the whitewash flaking on beams 2D and 4A also indicated
the same type of yielding occurring at slightly higher loads
in the web between the high moment ends of the reinforcing
bars The whitewash flaking in these areas was sufficient
so that it can be seen in some of the photos in Figure 24
75
The shear yielding that occurs in the web between the
ends of the reinforcing bars may be due at least in part to
the development of the strength of the reinforcing bar withshy
in a short part of its anchorage length Considering the
reinforcing bar in compression above the opening it can be
seen that since its strength must increase from zero at the
ends the unbalanced compression force in the beam causes a
shearing force to occur in the web which at the low moment
end of the reinforcing is additive to the existing shears
(due to the vertical shear force on the beam) below the reinshy
forcing and subtracted from those above This is illustrated
in Figure 53 In the same manner the shears resulting from
the tension in the lower reinforcing bar act in the same
direction as and are added to those in the web between the
reinforcing bars while being subtracted from those in the web
between reinforcing and flange At the high moment ends of
the reinforcing bars the same effect can occur since the top
reinforcing bar is usually in tension while the lower bar is
in compression Again the shears between the reinforcing bars
are increased while those between reinforcing bar and flange
are decreased This would account for the yielding in the web
between the low moment ends of the reinforcing bars for all
of the reinforced beams tested to collapse as well as explaining
76
the yielding in the web between the high moment ends of the
reinforcing bars for beams 2D and 4A
77
CHAPTER VII
ANALYSIS OF RESULTS
71 Order of Onset of Yielding
Comparison of the order of onset of yielding as detershy
mined by strain gauge readings and whitewash flaking in
Tables 3 and 4 indicates that the whitewash flaking is a
reliable method of estimating the order of onset of yieldshy
ing Actually since the strain gauges were only at scattershy
ed locations while the whitewash covered the entire area
around the opening the whitewash flaking is a considerably
more complete guide to the order of onset of yielding It
can also be said that yielding begins first at the corners of
the opening as indicated by the whitewash consistently
flaking first at these locations even though it was impossishy
ble to confirm this by strain gauge readings since gauges
could not be fitted in these locations
The yielding patterns clearly indicate that failure of
the beams occurred by complete yielding of the cross-sections
at the edges of the openings ie at the assumed hinge
locations The formation of hinges at these locations was
accompanied or followed by the shear yielding of all or part
of the web along the length of the opening and by the shear
yielding of the web between the low moment ends of the reinshy
78
forcing bars and in two cases also between the high moment
ends of the reinforcing bars The increase in load past the
formation of the first hinge is accompanied by localized
strain hardening Since the corners of the opening yield
considerably before other locations strain hardening probshy
ably begins at these corners well before the first hinge is
completely formed Yielding in the web above and below the
opening does not seem to become complete until considerable
rotation has occurred at the hinge locations The complete
yielding of the web in these areas would indicate that the
full shear capacity of the member is utilized
72 Stress Distributions
Experimental bending and shear stresses are shown for
each of the strain gauged beams (20 2D 3B 4B) in Figures
27 through 31 Straight lines have been drawn through pOints
representing measured stresses although this does not mean
that the variation is necessarily linear Examination of
each of these stress distributions shows that stresses inshy
creased in proportion to increasing loads while the stresses
were still elastic While in the elastic range the neutral
axis remained in approximately the same pOSition but startshy
ed to move after the first yielding had occurred at each
cross-section This is as would be expected
79
Since strain gauge readings were not available for the
edges of the opening it is impossible to follow the complete
progression of yielding for the various cross-sections from
strain gauge readings However since it is lcnown from the
whitewash flaking on the test beams that yielding occurs
first at the corners of the opening where stress concentrashy
tions are high it can be said that at the low moment edges
of the openings (beams 2C and 3B) yielding began first at the
corners of the opening and then progressed to the reinforcshy
ing bars and web before the flange yielded At the high
moment edges of the openings yielding in the flange occurrshy
ed at lower shear values This would be expected from conshy
siderations of the total stresses (primary bending stresses
plus secondary bending stresses due to Vierendeel action) at
the cross-section in question At the flange the secondary
bending stresses are added to the primary bending stresses
at the high moment edge of the opening but subtract from the
primary bending stresses at the low moment edge of the openshy
ing The experimentally determined stress distributions at
the high and low moment edges of the openings are completely
compatible with those assumed in the development of the
theory in Chapter III (Figure 8) Bending stress distribushy
tions along the length of the opening at the top of the upper
reinforcing bar and at the centerline of the top flange show
80
the expected high stresses at the edges of the opening due
to the secondary bending stresses (Figure 29)
Comparison of stress distributions with those presented
by Bower(16) for beams with unreinforced rectangular openings
shows that the addition of horizontal reinforcing bars above
and below the opening changes the position of the neutral
aXiS but does not alter the location where the highest
stresses occur and plastic hinges consequently form The
order of the onset of yielding is also similar to that
found by Bower as was expected
73 Failure Loads
In Table 5 experimentally determined failure loads are
compared to those predicted by the theory presented in
Chapter III for each of the test be~~s Examination of this
table shows that although the theory may be considered someshy
what conservative in high shear for low shear the correlashy
tion between theory and experimental is good and in no case
did the theory overestimate the actual strength of the beam
Table 6 shows the comparison between experimental failure
loads and those predicted by the approximate analysis for
nominal beam dimensions and yield stresses It can be seen
from this table that the approximate method is less conservshy
ative in the high shear region while still not overestimating
81
the strength of the beam An added margin of safety also
exists because the additional strength of the beam due to
strain hardening has not been taken into account This extra
strength is an added safeguard against total collapse even
though it is accompanied by excessive deformations and finalshy
ly involves tearing or pOSSibly buckling
Experimentally determined failure loads are compared
with loads corresponding to complete yielding of cross-secshy
tions for the strain gauged beams (20 2D 3B 4B) in Table
7 It can be seen from this comparison that experimentally
determined failure loads are close to those corresponding to
the complete yielding of the cross-section at the high moment
edge of the opening while loads corresponding to the complete
yielding of the cross-section at the low moment edge of the
opening are considerably higher This can be accounted for
by the considerable amount of strain hardening that is
suspected of occurring at the corners of the opening before
complete yielding of the low moment edge and possibly also
the high moment edge of the opening occurs Complete yieldshy
ing of cross-sections at the high and low moment edges of
the openings are also compared with the theoretical loads
predicted by the analysis of Chapter III in Table 8 Again
the correlation is reasonably good
The performance of each of the test beams was as expectshy
82
ed With the exception of the shear yielding which occurred in
the web at the ends of the reinforcing bars as discussed in
Section 63 The method used in determining experimental
failure loads has been shown to be justifiable on the basis
of the good correlation between these loads and those correshy
sponding to complete yielding of cross-sections at high and
low moment edges of the opening (considering that strain
hardening has not been taken into account) On the basis of
comparison with experimental failure loads the theory develshy
oped in Chapter III has been shown to adequately predict the
performance of a given beam under varying moment to shear
ratios (although conservatively at high shear) The approxshy
imate method as developed in Chapter IV has been shown to
predict beam strength with accuracy adequate for design
purposes (assuming a suitable factor of safety is used)
14 Influence of Reinforcing and Other Variables
As can be seen from comparison of the experimental
results from test beams 2A 3A and 6A and those for beams 2B
and 3B there is a definite increase in beam strength with
the addition of horizontal reinforcing bars As predicted by
the theoretical analysis of Chapter Ill the maximum shear
capacity of a perforated section as given by equation (6)
can be reached by the addition of a certain minimum amount
83
of reinforcing as given by equation (32) If no reinforcing
or an amount less than that required by equation (32) is used
the maximum shear capacity cannot be reached This is conshy
firmed by the result of the tests on beams 2A 3A and 6A
For higher moment to shear ratios the increase in strength
with increased reinforcing size is adequately predicted by
the analysis in Chapter 111 (and also by the approximate
method of Chapter IV) This is confirmed by the tests on
beams 2B and 3B The increase in strength with the addition
of reinforcing bars and with the further increase in the
size of this reinforcing cen be seen by superimposing the
interaction curves of Figures 10 11 and 12 as has been done
in Figure 54
The influence of the magnitude of moment to shear ratio
on the strength of a beam of given size opening and reinforcshy
ing dimenSions is adequately predicted by interaction curves
generated by the method of Chapter 111 and by the approximate
interaction curves as in Chapter IV This is confirmed by
test series 2A 2B 20 2D series 3A 3B and by series 4A
4B See Figures 55 56 and 57
An increase in aspect ratio everything else being held
constant results in a decrease in strength of the beam This
is predicted by the interaction curves in Figures 10 and 13
which are superimposed in Figure 58 for easy reference and
84
is confirmed by the tests on beams in series 2A 4A and
series 2B 4B An increase in hole depth also has the effect
of lowering the strength of the member all other variables
being held constant This is predicted by the interaction
curves in Figures 10 and 14 which are superimposed in Figure
59 and is confirmed by the tests on beams 20 and 5A
The test results have also been plotted in Figures 54
through 59 but because of the variation in the sizes and
yield stresses of the actual test beams these results have
been plotted on the curves (which are based on nominal
dimensions and yields) on the basis of percent difference
be~veen the experimental failure loads of the test beams
and the values predicted by the exact interaction curves
(from measured beam dimensions and yield stresses)
85
CHAPTER VIII
CONCLUSIONS AND RECOMMENDATIONS
81 Conclusions
On the basis of the results and discussion presented in
the previous chapters the following conclusions can be
drawn
1 The flaking off of the brittle coating of whitewash on
the beams during testing is an accurate indication of
the order of onset of yielding although it does not inshy
dicate at what loads yielding actually occurs
2 High stress concentrations exist at the corners of
rectangular openings even when horizontal reinforcing
bars have been added above and below the opening
3 Failure of a beam under moment gradient containing a
single rectangular opening reinforced with horizontal
reinforcing bars above and below the opening occurs by
the formation of a four hinge mechanism the hinges
occurring at cross-sections at the edges of the opening
Ultimate collapse of such a beam occurs by the tearing
of one or more of the corners of the opening provided
the beam has sufficient lateral support to prevent
lateral buckling
4 With the development of the four hinge mechanism large
86
relative displacements take place between the ends of the
opening accompanied by full or partial shear yielding in
the web above and below the opening This yielding when
it occurs over the entire web area is an indication that
the full shear capacity of the section is utilized
5 Because of the shear yielding that occurs in the web beshy
tween the ends of the reinforcing bars the extension of
these reinforcing bars past the ends of the opening (while
designed on the oasis of developing the weld strength)
should not be less than a certain length (as yet undetershy
mined but probably about three inches for the size beam
and openings tested) due to the possible interaction of
the web yielding with the yielding at the corners of the
opening
6 The stress distributions assumed in the analysis in Chapshy
ter III are completely compatible with those found at the
high and low moment edges of the strain gauged test beams
The large influence of the secondary bending moments (due
to Vierendeel action) is confirmed by these stress
distributions
7 The interaction curve resulting from the analysis in
Chapter III predicts with reasonable accuracy the strength
of a beam with given opening and reinforcing size at any
combination of moment and shear This method is however
87
conservative at high shear values
8 The approximate method developed in Chapter IV also preshy
dicts with reasonable accuracy the strength of a beam
with given opening and reinforcing size for the full
range of moment and shear values and is less conservshy
ative at high values of shear
9 Due to the fact that the theory neglects the effects of
strain hardening there is a built in margin of safety
against complete collapse of the member although an
increase in load past the predicted failure load is
accompanied by excessive deformations
10 The correlation obtained between experimentally detershy
mined failure loads and loads corresponding to complete
yielding of cross-sections at the high moment edge of
the opening for the strain gauged beams suggests that
the method used in determining the experimental failure
loads is justifiable Comparison of experimental failure
loads with loads corresponding to complete yielding of
the cross-section at the low moment edge of the opening
would not be expected to be as good because of the strain
hardening that is assumed to occur at the corners of the
opening before this section is completely yielded
11 The addition of horizontal reinforcing bars above and
below a rectangular opening in a beam definitely increases
88
the strength of the beam If greater than a predictshy
able minimum area this reinforcing will make it possible
to achieve the full shear strength of the section as
given by equation (6) Any further increase in reinforcshy
ing size results in a further increase in the moment
capacity of the member for a given value of the shear
force
12 For a given size beam an increase in aspect ratio (openshy
ing length to depth) results in a decrease in the strength
of the beam over the full range of moment to shear ratios
if all other factors are held constant An increase in
the opening depth to beam depth ratio also has the same
effect all other variables being constant
13 The test performed on beam 6A containing the unreinshy
forced rectangular opening further confirmed the analysis
presented by Redwood(17 18) for beams containing single
unreinforced rectangular openings in their webs
82 Recommendations for Design
Based on the good agreement between experimental results
and failure loads predicted by the approximate interaction
curve it is recommended that the approximate method as
described in Chapter IV be used for design purposes assuming
that a suitable factor of safety is used The ease with
89
which the necessary calculations can be carried out makes
this method extremely practical The use of this method can
be outlined as follows When it is decided to cut an openshy
ing in the web of a beam for the passage of utilities the
necessary size of opening should first be determined and an
approximate interaction curve constructed for the beam conshy
taining an unreinforced opening by using e~uations (52) (53)
and (55) Mp and Vp should be calculated from equations (1)
and (3) respectively A line should then be drawn from the
origin at the particular moment to shear ratio which repshy
resents the actual position of the proposed opening in the
beam and extended to intersect the approximate interaction
curve The intersection of this line with the interaction
curve then represents the capacity of the beam if the openshy
ing is not to be reinforced If this capacity is less than
that required it is necessary to reinforce the opening
and reinforcing should be chosen on the basis of satisfying
the inequality of equation (41) The reinforcing should be
chosen so that the right hand side of equation (41) is not
greatly exceeded An approximate interaction curve for a
beam containing an opening with this size reinforcing can
then be constructed by using equations (42) (43) and (45)
where Ar is given by the right hand side of equation (41)
The intersection of the MV line with this approximate intershy
go
action curve then gives the capacity of the beam with this
size reinforcing If this exceeds the required capacity of
the section this size reinforcing should be adopted
However if the required capacity of the beam is greater
than that given by the approximate interaction curve two
possibilities may exist If the required shear is greater
than the maximum shear capacity of the section as given by
the vertical line on the approximate interaction curve or
by equation (42) then either shear reinforcing must be
added or the depth of the section increased in order to
provide the required strength If however the required
shear capacity is not greater than that given by equation
(42) but the point representing the required capacity of the
beam on the MV line lies outside the apprOximate intershy
action curve the area of reinforcing should be increased
above the value given by equation (48) and a new approximate
interaction curve constructed using equations (42) (45)
(49) (50) and (51) If the required capacity is still
greater than that given by this new approximate interaction
curve the reinforcing size would have to be further increased
until the reinforcing is such that the required strength is
provided The reinforcing size that meets this requirement
should then be adopted for use
91
83 Reoommendations for Future Work
With the completion of this study on the ultimate
strength of beams containing single rectangular openings
reinforced with straight reinforcing bars above and below
the openings it is logical that attention would turn to
similar studies for other commonly used opening shapes in
particular circular and extended circular openings with
horizontal reinforcing bars Also of interest would be an
ultimate strength investigation of reinforced closely spaced
multiple openings of rectangular or circular shape
Since the decision to cut and reinforce an opening in
the web of a beam is based primarily on economic considershy
ations an investigation into reducing the cost of reinshy
forced openings would be very much justified As the cost
of welding is paramount among the other factors involved in
reinforcing an opening reducing the e~mount of welding is
desirable If the horizontal reinforcing bars used in the
present study were doubled in size and welded to only one
side of the web above and below the opening the cost of
reinforcing would be almost halved while the same area of
reinforcing would be available for resisting the shear and
moment forces on the section However other factors such
as twisting moments would have to be taken into conSideration
due to the asymmetry of the section about its vertical axis
92
that would result from this type of reinforcing arrangement
An investigation of the ultimate strength of wide poundlange
sections containing large rectangular openings reinforced
with one-sided straight horizontal bar reinforcing has
already been initiated at McGill University
More information is also needed on the anchorage of the
reinforcing bars It would be desirable to determine at
what length such reinforcing is capable opound assuming its full
load An investigation of the required extension of reinshy
forcing bars past the ends of the opening to prevent preshy
mature poundailure due to interaction between hinge formation
and web yielding at reinforcing ends is also necessary
93
1)
) )J + 1 +1 I I
I
( a) (b)
I + --+--~+ -f--- -shy
I (c) (d)
II I I
I I j+shy
) 1)I l J I
(e) ( f)
Types of Reinforcing
Figure 1
94
primary bending stresses
secondary bending stresses
Stress Distribution at Opening
Figure 2
Ql ID Q)
Jt p ID
er
I I I I I I I
E I I I poundy Ipoundst strain
Idealized Stress-Strain Curve for structural Steel
Figure 3
---------- -----
95
MM unperforated beam no interaction
10~----~==~==~L---------------------~
~
unperforated beam including interaction
10 vVp
Interaction Curve - Unperforated Beam
Figure 4
-- -----------
96
deflection Pure Bending
(a)
~ o
r-I
deflection Bending with Shear
(b)
Load-Deflection Curves
Figure 5
97
1O~------------------------------------------~
l I
unperforated beamshy
shy
I r perforated beam
no interaction
----------- perforated beam l including interaction I I I I I I I I I
I I
Interaction Curve - Perforated Beam
Figure 6
i
98
1 CD (2) TIT
L
( a)
b
d2
(b)
Hinge Locations and Cross-section of Member
Figure 7
99
( a)
(S r CSyr+
tltS ltl direct shear direct shear
Stress Distribution at CD Stress Distribution at CD (for reversal in reinforcing)
Case I - Low Shear
+
CSyr ltS shy
direct shear
Stress Distribution at CD
Case 11 - High Shear
(b)
Stress Distributions and Resultant Forces
Figure 8
100
low highshear shear
I Ml4p k--~_____U_k-----LS_~_(_U_+-=q-)_____-L (u+q)kl s~s
I I r I I
I I I 1 I10
~-int eraction II curve 11
11
11 I I 11 I I
- I - I Iapproximate ~
interaction curve------ - 1
11~I11
i I I
I (d-2h-2t)I_~ I
d-2t 11
(1 -~) q
Interaction Curve Showing Low and High Shear Regions
Figure 9
101
14D38 7 x lof Opening
6 bull77611 x ~middotReinforcing 1 0513
03~
CH 125 1412700
0313 =--9F 0375 =Jb
approximate method ---l------ Case 11
04 vVp
Interaction Curve - 14WF38 Nominal
Figure 10
102
14WF38 7 x 10r Opening 6776 05132tbull
x e 3middot
Reinforcing
1412 11
10
approximate method Case I
04
Interaction Curve - 14WF38 Nominal
Figure 11
103
14WF38 7 x 10f Opening
0513No Reinforcing
MMp
10
-----approximate method for unreinforoed opening
04 VVp
Interaction Curve - 14WF38 Nominal
Figure 12
104
l4WF38 7 x l4~ Opening1pound x tReinforcing
Iapproximate method Case 11
I I I
04
Interaction Curve - l4WF38 Nominal
Figure 13
105
14WF38 9X 13- Opening lmiddotfx p Reinforcing
0513
1412
~-approximate method ~ Case IIIB
approximate method Case I
04
Interaction Curve - l4WF38 Nominal
Figure 14
106
10WF2l
5 x sf Opening 034(iIf x iWReinforcing t~l0240
CH h
55Q 125 990 025Q 0250~
approximate method ~ Case IlIA
approximate method I Case I
I I I
04
Interaction Curve - lOWF2l Nominal
Figure 15
107
43 11 39 18 0 (
I
I I i lA
26
I
111 99 I- middot1 t
22 2-S 45 J
) C
r I
2A
13 ) lA I ~
I)II45 35 ( ()
I
I
I If 2B
f 16~ 9 25 I2t~ 21-+1 1 1 i
30 11 24 27 0- 10- ro- )
I ~ I I
20
2119YlO 151( 21~fI211~ - rr I I
Test Beam Dimensions and
Dial Gauge Looations
Figure 16
108
tI
2D
22tl 231 45 tlI
( l (
I
3A
3119 Yt 11~ 34ft J3n~
45 25 J 35 ) (~ i-
I
I 1 3B
H 25 ft2ft5 cI 16 J2++ I I1 I
t 0- 23 45 J0- 0- (
I 4A
~5 ( 32 J211~ 2 YYt -IIII
Test Beam Dimensions and
Dial Gauge Locations
Figure 17
log
45 ~ 25 5S ) ~ (
4B
2 crYI 15 25 J-I2++ Irr
L J30 24 27 ~lt) (P-L
I 5A
2tYY 13 26211 1 I
22 6
6A
i
Test Beam Dimensions and
Dial Gauge Locations
Figure 18
--
110
If JL
a (1) p 02 ~
Cfl
tlOO ~ r-I 0 0 Q)
m ~ ~
Q SoOM
r-I Xl m ~ (1) p cD H
r-shy
~ ishy fO I- It
111
o N
-()
112
~ --- ~
~
~~ ~~
II I of
rf
A tshyshy I
1
ID I ~ I 0I middotrt
a1 +gt
- -l~ 0 ()
-t I H CJ
4gt 4gt bO ~
~ ~ Cl -rt
fiI
~ a1 ~
+gt CJI
~ amp ~ ~ ~ --- ~ I
II s I
~CJ~ 4t ~
I~ i ~
o
i-~ ~ - l
II I +1 I Ij
~I r
I tf~ft N
- shy
stress 8 1
lower Yield-lt ~i == 11 static yield-shyI l- 2 1 2 ~
( a)
F F-CL F-E [(4 ~
W-H- - shy
strain ( b)
Tensile Coupons Stress-Strain Curve from Instron Testing Machine
Figure 22 Figure 23 I- I- vJ
I
114
lA 2A 2B
20 2D 3A
3B 4A 4B
5A 6A
FIGURE 24
115
2B 20 2D 3A 3B 4At 4B
Variable Moment to Shear Ratio
20 5A
Variable Opening Depth to Beam Depth
FIGURE 25
116
2A 4A 2B 4B
Variable Opening Length to Depth
2B 3B
Variable Reinforoing Size
FIGURE 26
bullbull
117
Notes Shear force shown in kipsbott of flange bull Elastic o Yielded
r ~ 3
o
top of reinf
boundaryof opening bott of reinf~ ioiiIo ~_ 10 o 10 ~ ~ - Dending Stress Shear Stress
Ca) Stress Distribution at High Moment Edge of Opening - 20
~ bull
~ ~ boundary ~ of opening~
-0 I) 10 40 o to lO ~ Sending Stress Shear stress
(b) Stress Distribution at Low Moment Edge of Opening - 20
Figure 27
118
boundaryof opening
-70 0 __ tQ
Bending Stress Shear Stress
Ca) Stress Distribution at Oenterline of Opening - 20
-1iCgt
~I--=-shyoo---~-=-~ogt---- ---0 - ____ A~Sshy-
middot------------e----- ~~~ ~_______~-----Lr---t-o~p~of flangeo
oE
Cb) Bending Stress Distribution Across Flange at High Moment Edge of Opening - 20
Figure 28
119
-40
-lt0 lt----- shylow
moment edge gtgt bull
lt 0
high54 boundary of opening moment
edge ltgtgt
to
Ca) Bending Stress Distribution Across Length of Opening at Top of Flange - 20
high moment
edge
o
Cb) Bending Stress Distribution Across Length of Opening at Top of Reinforcing - 20
Figure 29
120
boundary---~~~~~~~~___ of Opening
o10 D
Bending Stress Shear Stress
(a) Stress Distribution at High Moment Edge of Opening - 3B
ibull
boundaryof opening
10 Igt lO
Bending Stress Shear Stress
(b) Stress Distribution at Low Moment Edge of Opening - 3B
Figure 30
bull bull bull bull
121
11 9 ~ oS j j ~
boundaryof opening
-lt10 -20 lt) -I-Lo Q lO 10
Bending Stress Shear Stress
(a) stress Distribution at High Moment Edge of Opening - 2D
boundaryof openin
-40 -20 0 ZO o 10 ZQ 30
Bending Stress Shear Stress
(b) Stress Distribution at High Moment Edge of Opening - 4B
Figure 31
122
Test Beam - lA
O6in relative defleotion between opening ends
Figure 32
Test Beam - 2A
O6in relative deflection between opening ends
Figure 33
123
lateral buckling - highmoment edge of opening413k-- shy
Test Beam - 2B
O6in relative deflection between opening ends
Figure 34
bull first strain hardening --~ complete yielding - low
moment edge of opening-J- -- --shy
J complete yielding - high moment edge I of opening I ----first yielding
Test Beam - 20
O6in relative deflection between opening ends
Figure 35
124
---- complete yielding - high moment edgeof opening
first yielding
Test Beam - 2D
O6in relative deflection between opening ends
Figure 36
Test Beam - 3A
O6in relative deflection between opening ends
Figure 37
125
k ---shy497 ---~ --1shy complete yieldingI J
---- first yielding
O6in
Figure 38
O6in
Figure 39
- high moment edge of opening
Test Beam - 3B
relative deflection between opening ends
Test Beam - 4A
relative deflection between opening ends
126
430k--shy
k445--shy
---f-----shy ----complete yielding shy
I ----first yielding
06in
Figure 40
O6in
Figure 41
high moment edgeof opening
Test Beam - 4B
relative defleetion between opening ends
Test Beam - 5A
relative deflection between opening ends
127
k45 o-~--
Test Beam - 6A
O6in relative deflection between opening ends
Figure 42
128
10 shy
10WF21
5t x ampf Opening If x t Reinforcing
~~approximate interaction ~ nominal dimensions and
~ ~
+~ ~ ~
I interaction curve ---I Imeasured dimensions and yields I
I I
04
Interaction Curves - Test Beam lA
Figure 43
curve yields
129
14WF38 7 x lot Opening
bull SIt x a Reinforcing
~-----approximate interaction curve nominal dimensions and yields
interaction curve-------- I
measured dimensions and yields
bull
Interaction Curves - Test Beams 2A and 2B
Figure 44
130
l4WF38 f x 10i Opening 11 x middotf Reinforcing
10 - ~approximate interaction curve nominal dimensions and yields
interaction curve----~ measured dimensions and yields
04
Interaction Curves - Test Beams 2C and 2D
Figure 45
10
131
l4WF38 7middotx lof Opening 2f x ~uReinforoing
approximate interaction curve nominal dimensions and yields
~
1 +3A
I interaction curve -------J
measured dimensions and yields
04
Interaction Curves - Test Beam 3A
Figure 46
10
132
14WF38 7 x lOi~ Opening2f x ~ Reinforcing
~ ~approximate interaction curve ~~ nominal dimensions and yields
~ ~ ~ ~ ~
I I
interaction curve ------I measured dimensions and yields
04
Interaction Ourves - Test Beam 3B
Figure 47
10
133
14WF38 H
7 x 14 Opening 1t x Reinforcing
-~
~~approximate interaction curve ~ nominal dimensions and yields
~ ~ +4B
~ ~ ~
~ interaction curve-----l measured dimensions and yields I
I I
04
Interaction Curves - Test Beams 4A and 4B
Figure 48
134
14WF38 9 x 13t~ Opening lix ~uReinforcing
10 --~ ~~approximate interaction curve
nominal dimensions and yields
~ ~
SAl
interaction curve measured dimensions and yields
04 vVp
Interaction Curves - Test Beam 5A
Figure 49
10
135
14WF38 7 x lof Opening No Reinforcing
r----approximate interaction curve nominal dimensions and yields
+ 6A
----interaction curve measured dimensions and yields
04
Interaction Curves - Test Beam 6A
Figure 50
136
shear (kips)
70
60
---- shear corresponding to experimental failure
50
40
30
20
laterally unsupported length = 54 inohes10
40 80 120 160 200 240
lateral deflection (in x 10-3 )
Lateral Deflection at High Moment Edge of Opening - 20
Figure 51
137
shear (kips)
70
60
------------shear oorresponding to experimental failure
50
40
30
20
10
4 8 12 16 20 24 28
strain differenoe at top flange (inin x 10-3)
Flange Buokling at High Moment Edge of Opening - 20
Figure 52
138
D f
P --IL-=====bull--Jf--P + dP
Shear Stresses at End of Reinforcing
Figure 53
139
l4WF38 7 x lot
Opening
3shy10 f ~--2f x e
Reinforcing
If x ~ Reinforcing
+3A +2A
No Reinforcing + 6A
04
Variable Reinforcing Size
Figure 54
140
14WF38 7 x lof Opening If xl-Reinforcing
+ 2B
+20
+2A
+2D
04 vVp
Variable Moment to Shear Ratio
Figure 55
141
14WF38 7x 10f Opening2i x iReinforcing
10 ---------- shy
+3B
+3A
04 vVp
Variable Moment to Shear Ratio
Figure 56
142
14WF38 7x 14~Opening 1f x f Reinforcing
+ 4B
+ 4A
04 vVp
Variable Moment to Shear Ratio
Figure 57
143
14WF38 1thx imiddotReinforCing
7 x lot Opening
7 x 14 Opening---
04
Variable Aspect Ratio
Figure 58
144shy
14WF38
------7middot x 10i Openinglift x ~~Reinforeing
9 x 13f Opening +20 Ii x i Reinforoing
+5A
04
Variable Opening Depth to Beam Depth
Figure 59
--
r b --1 t l=Ii= W
d
u q
Beam Size ~ d b t w 2a 2h u q c x R bull lA 10WF21 43 989 578 0324
11
0244 875 550 N
0260 0253 2720 N
400 316
2A 14WF38 22 1413 677 0496 0326 1046 700 0383 0381 2813 300 58
tI tI If If If tI tf tI It n tI It2B 45
ff 11 It2C 30 1422 668 0490 0305 1045 0267 0368 2720 n tI n tt tI tI n n tI2D 17 If tI n3A 22 1413 677 0496 0326 1046 0383 0381 5313 600
It 11 It If3B 45 1422 668 0490 0305 1045 0329 0361 5230
tf tI 11 tI fI tI tI4A 22 0340 0368 2720 300 If It tI ff If tI If It n4B 45 n n tI tt f1 tI5A 30 1344 901 0305 0371 3770 425
11If fI6A 22 1045 700 shy - - shy Table 1 -I
foo J1
146
Ave Test Coupon Desig- Testing Lower Static Lower Beam
Beam Location nation Machine Yield Yield Yield Series lA web W Riehle 573 - 573 lA
nflange F 362 - 431 nF 435 shy
F-E It 462 shyItreinf R 370 370
2B web W Instron 417 405 413 2A2B W 11 3A412 398
flange F Riehle 374 - 388 F-CL Instron 382 371 F-E It 397 395
reinf Rl Riehle 434 - 437 2D web W Instron 567 550 558 2C2D
rtW 540 527 3B4A 4B5Aflange F 490 474 446 6AItF-CL 418 406
F-E 478 shyIt 2C2Dreinf R6 398 384 398 4A4B
3A web W 11 411 shyfIflange F 398 379
reinf R2 Riehle 440 shyfI3B reinf R4 330 - 331 3B
R4 11 332 shyR4 Instron 332 shy
4A web W 565 549 flange F 11 487 476
F-CL 406 398 nF-E 429 415 5A reinf R5 tI 437 429 444 5A
R5 450 422 It6A web W 559 545 Itflange F 463 450 fIF-CL 408 402
F-E ff 438 425
Tensile Test Results
Table 2
147
Beam 20 2D 3B 4BLocation Top edge upper fl - BM edge 450K 575K 433lC 300
Bott upper reinf - LIvI edge 450 500 400 317 ~ top upper fl - BM edge 483 600 367 317 Web - ~ open 483 500 517 450 Web - BM edge 517 550 400 350 Web - LM end of upper reinf 517 - - -Bott upper reinf - BM edge 550 550 500 350 Top upper reinf - BM edge 567 800 467 433 ~ web - between LM ends reinf 583 - - shyWeb - LM edge 600 - 583 shy~ top upper fl - LM edge 633 - 600 shyTop upper reinf - LM edge 633 - 467 500 Bott edge upper fl - BM edge 667 - 517 383 Complete yield - BM edge - 567 625 483 383 Complete yield - LM edge 633 - 600 shy
(a) Shear Values Corresponding to Yielding
Location Beam 2C 2D 3B 4B
Top edge upper fl - BM edge 667k 775
k 567k 483k
Bott upper reinf - LM edge - 800 583 -~ top upper fl - BM edge - 775 533 -Web - ~ open 633 700 583 -Web - EM edge - 750 - -Bott upper reinf - BM edge 667 775 - -
(b) Shear Values Corresponding to Strain Hardening
Table 3
- - - - - - -
- - - - - - - - -
- -
BeamLocation Upper fl - BM edge Lower fl - BM edge Lower LM corner open Upper LM corner open Lower BM corner open Upper ID~ corner open Web above open Web below open Low Uif corner to end reinf Up n~ corner to end reinf Low IDH corner to end reinf Up rIM corner to end reinf Between ends reinf LM end Between ends reinf HM end Upper reinf - BM edge open Lower reinf - BM edge open Upper reinf - ilA edge open Lower reinf - LM edge open Lateral buckling - BM edge Web buckling at open Tearing - lower LM corner Tearing - upper BM corner
lA 2A 2B 20 2D 3A 3B ~ lI Ilt v 162 500 400 583 700 525 433
180 - - - 725 - 517 191 550 417 617 600 550 567 191 575 442 567 575 600 433
- 575 467 567 575 600 433
- 575 - - 600 600 shy202 625 475 600 600 700 533
- 625 475 600 625 700 583
- - - 617 700 - 550
- - - 600 675 675 550
- - - - - 675 shy
- 600 458 650 675 650 583
- - - - 725 - -- - - - - 725 -- - - - - 675 -- - - - - - -- - - - - 675 shy- - 483 - - - shy
- 700 517 703 825 775 shy- - - - 825 - 600
4A 4B Ilt Ilt
450 333 500 417 450 367 450 366 500 383 450 417 550 483 600 483 550 400 550 433 625 shy625 shy575 467 575 shy500 shy550 417
- 450 500 383
--675 513
5A le
350 500 400 400 433 483 433 467 500 417
--
500
--
467 500
---
517
-
6A
400 533
-367 367 383 433 533
-----------
550
--
Shear Values Corresponding to Whitewash Flaking
J-ITable 4 ~ 00
149
~hear a1 Beam Size MV [Failure Vp Exp VVp Theor VV_ Diff
lA 10WF21 43 180K 746K 0241 0235 + 26 2A 14WF38 22 532 1L021 0520 0466 +116 2B 11 45 413 0404 0363 +113 2C If 30 548 1301 0421 0403 + 45
u n2D 17 670 0515 0420 +226 n3A 22 575 1021 0562 0466 +206 tt3B 45 497 1301 0382 0345 +107 11 n4A 22 572 0440 0360 +222 n4B 45 430 0330 0295 +119 If It5A 30 445 0342 0296 +155 116A 22 450 0346 0271 +277
Correlation Between Experiment and Theory
Table 5
~hear at Approximate Beam Size MV Failure Exp VV Theor VV DiffVp p p
lA 10WF21 43 180K 746 K
0241 0254 - 51 2A 14VlF38 22 532 1021 0520 0503 + 34
It2B 45 413 0404 0344 +175 If2C 30 548 1301 0421 0414 + 17
It2D 17 670 0515 0505 + 20 3A 22 575 1021 0562 0505 +103
n3B 45 497 1301 0382 0377 + 13 4A tI 22 572 n 0440 0463 - 50
It It 03094B 45 430 0330 + 68 5A 30 445 tr 0342 0353 - 31 6A 22 450 tt 0346 0257 +346
Correlation Between Experiment and Approximate Theory
Table 6
150
Shear at Shear at Shear at Beam MV Failure Full Yield Dif Full Yield Dif
Exp H M Edge L M Edge k k k2C 30 548 567 + 35 633 +155
2D 17 670 625 - 67 - shy3B 45 497 483 - 28 600 +207 4B 45 430 383 -109 - shy
Correlation Between Experimental Failure and Complete Yielding
Table 7
Theor Shear at Shear at Beam MV Shear at Full Yield Dif Full Yield Diff
Failure H M Edge L M Edge
2C 30n 525k 567k + 80 633k +206 2D 17 546 625 +145 - shy3B 45 449 483 + 76 600 +336 4B 45 384 383 - 03 - shy
Correlation Between Theoretical Failure and Complete Yielding
Table 8
151
APPENDIX A
Computer Program for Interaction Curve
A computer program was developed to generate an intershy
action curve for a specified beam opening and reinforcing
size according to the method described in Chapter Ill The
program was wri tten in Fortran IV and can be used on any
standard digital computer that makes use of this language
The input for the program should be of the form given in
the following table
Data Number Items on of Cards Data Cards
Number of beams 1 NB
Dimensions of beams NB dbtw
Yield Stresses NB CS111 S~ lts
Number of openings per beam NB NE
Sizes of openings NH ah
Number of reinforcing sizes per opening NH NR
Sizes of reinforcing NR uqc
A listing of the computer program is given on the following
pages
152
C THIS PROGRA~ CO~PUTES ThE INTERACTION CURVE RELATING MOMENT AND C SHEAR VALUES WHICH CAUSE FAILURE OF A WICE FLANGE bEAM CONTAINING C A REINFORCED RECTANGULAR OPENING AT ThE MIDOEPTH C
REAL KlK2MPMMPKllK12K21 t K22 581 FORMAT(5FIO3) 584 FORMAT(3FIO3) 582 FOR~AT(2FIO3) 583 FORMA1(I5 681 FORMAT(lINTERACTION
lOt 0 B T 682 FORMAT( F133F63 683 FORMAT(O SIGF 684 FORMAT( 5F93
BETwEEN MOMENT AND SHEARtw)
SIGw SIGR VP Mpt)
605 FORMAT(O OPENING LENGTH middotF73middot HEIGHT =F73) 606 FORMAT(O MMP VVP SIG 601 FORMAT( middot5FI04 608 FORMATOV IS TOO LARGE SO SIGMA BECCMES 609 FORMATtOHIGH SHEAR SOLUTION) 611 FORMAT(O U QC) 612 FORMATe 3F63) 613 FORMAT(O STRESS REVERSAL IN REINFORCING 614 FORMATOSTRESS REVERSAL IN CLEAR WEe 615 FORMAT(O STRESS REVERSAL IN WEB STUB) b16 FORMAT(OLOW SHEAR SClUTIONt) 618 FORMATtO MAxIMU~ VVP Fb3)
c READ(S583)NB 00 200 I=lNB RE~D(5581tOBTW
READ(5584)SIGFSIGWSIGR VP=W(0~2T)SIGWSQRT(3) MP=BTSIGF(D-T bullbullW(D-2Tl2SIGW4 WRITE(6681) WRITEI6682)DtB t TW WRITE(6683) WRITE(~684)SIGFSIGWSlGRVPtMP
REAO(SS83)NH DO 200 ~=lNH
RE~D(5582JAH
REAC5583) NR A2=2A H2=2H WRITE(6605)A2H2 VVPM=(O-2T-2H)0-2T) WRITEt6618) VVPM CO 200 J=lNR READ(5584) UQC
Kl K2~)
COMPLEXJ
153
WRITE(661U WRITE(661Z) UQC WRITE(6606) VINCR=OO V=OO S=OZ-H-T AW=SW Af=BT AR=(C-WjQ R=U+Q
C C LOW SHEAR SOLUTION C C STRESS REVERSAL IN WEB STUB C
WRITE(66161 WRITE(661S)
101 V=V+VINCR XX=$IGWZ-O7SV2AW2 IF(XX) 201]00300
300 SIG=SQRT(XX) ALPHA=ARSIGR(AFSIGf BETA=AWSIGCAfSIGf) Cl=T+SBETA C2=-(D-2HJ C3=VAAFSIGF) C4=C22-40ClC3 IF(C4408399399
399 K21=(-C2+$QRT(C4)(2Cl K22=(-C2-SQRTCC4raquo)(2Clt Kll=K21BETA KI2=K22BETA IF(K21)330301301
301 IFK21-10)30230233C 302 IFCKll1330304304 304 IFKllS-U)320320330 330 IF(K22)408)31331 331 IF(K22-10)33233Z40a 332 IF(KIZ)408333333 333 IF(K12S-UJ32132140S 320 K2=K21
Kl=Kl1 GO TO 322
321 K2K22 Kl=K12
322 FY=AFSIGF(S+T2)+AWSIGSS(1-2Kl2)+ARSIGR(U+Q2) F=AFSIGF+AWSIG(1-2Kl+ARSIGR M=2FY+20HF-VA
154
MMP=MMP VVP=VVP WRITE(6607)MMPVVPSIGKlKZ VINCR=VP500 GO TO 101
C C STRESS REVERSAL IN REINFORCING C
408 WRITE(6613 GO TO 409
902 V=Vl 701 V=V+VINCR
XX=SIGW2-015V2AW2 IF(XX9011CQ100
100 SIG=SQRTXX) 409 Rl=(C-W)SIGR
R2=AWSIG+SRl Cl=T+SAFSIGFRZ C2=2SURIR2-(D-2HJ C3=VA(AFSIGF)+U2Rl(AFSIGFraquo)(SR1RZ-1) C4=C22-40C1C3 IF(C4)418403403
403 K21=(-C2+SQRT(C4)(Z0Cl KZ2=-C2-SQRT(C4)(Z0Cl) Kll=AFSIGFK21R2+URlR2 K12=AFSIGFK22R2+URIR2 IF(K21)430401401
401 IF(K21-10)4C240243C 402 IF(K11S-U)430404404 404 IF(Kl1S-R)42042043C 430 IFK22)418431431 431 IF(K22-10)432432418 432 IF(K12S-U418433433 433 [FtK12S-R)421421418 420 K2=K21
K l=K 11 GO TO 422
421 K2=K22 Kl=K12
422 FY=AFSIGFtS+T2)+AWSIGSS(1-2Kl2) 1 +(C-W)SIGR(U2+UC+SQ2-(KlS)2)
F=AFSIGF+AWSIG(I-2Kl)+(C-WJSIGR(2U+Q-2KlS) M=20FY+20HF-VA ~MP=MMP
VVP=VVP IF(MMP 418423423
423 WRITE(6601)MMPVVPSIGKlK2 VINCR=VP500
155
GO TO 701 C C STRESS REVERSAL IN CLEAR WEB C
418 WRITE(6614) GO TO 419
922 V=Vl 801 V=V+VINCR
XX=SIGW2-075V2AW2 IF(XX)921800800
800 SIG=SQRT XX) 419 Cl=AFSIGFS(AWSIG)+T
CZ=-O+2H-2SARSIGR(AWSIG) C3=VACAFSIGF)+2U+Q2)ARSIGR(AFSIGF)
1 +S(ARSIGR2fAFSIGFAWSIG C4= C224 ClC3 IF(C4)428410410
410 KZl=(-C2+SQRTCC4)(ZCl K22=(-C2-SQRTCC4)ZC1) Kll=AFSIGFK21(AWSIG)-ARSIGR(A~SIG)
K12~AFSIGFK22(AWSIG)-ARSIGRAWSIG)
IF(K21)S30501501 501 IFK21-10)502502530 50Z IF(KllS-RS30504504 S04 IF(Kll-l0S20520510 530 IFtKZ2)428531531 531IF(K22-10)532532428 532 IF(K12S-R428533533 533 IF(K12-10)521S21428 520 1lt2=K21
Kl=Kl1 GO TO 522
521 1lt2=K2Z Kl=K12
522 FY=AFSIGF($+T5+AWSIGS(i-2bullbullKl212-ARSIGR(U+Q2) F=AFSIGF+AWSIG(1-2Kl-ARSIGR M=2FY+2HF-VA MMP=MMP VVP=VVP IF (MM P) 428523523
523 WRITE(6601)MMPVVPSIGKlK2 VINCR=VP 500 GO TO 801
c C HIGH SHEAR SOLUTION C
428 WRITE(oo09) GO TO 352
156
2 V=Vl 4 V=V+V INCR
XX=SIGW2-015V2AW2 IF(XXJI0235D350
350 SIG=SQRHXX) 352 AlPHA=ARSIGR(AfSIGf
BETA=AWSIG(AfSIGf) 429 02=-10-BETA-AlPHA
03=05VA(AFSlGFT)+AlPHA+8ETA+O5(AlPHA+8ETA)2+OS8ETAST 1 +AlPHA(U+Q2IT-CD-2H(AlPHA+8ETA)O5T
04=D22-403 IFCD4)102351351
351 K21=(-D2+SQRTID4raquo2 K22=(-D2-SQRT(04112 Kll=1O+8ETA+AlPHA-K21 K12=10+BETA+AlPHA-K22 IFCK21630601601
601 IF(K21-10602~0263C
602 IF(Kll)630604604 604 IFIKll-10)62062D63C 630IFCK22)102631o31 631 IFIK22-10)632632102 632 IF(K12)102633633 633 IF(K12-10)621621lC2 620 K K21
Kl=Kll GO TO 622
621 K2=K22 Kl=K12
622 FYPT=Kl(D-2H)-TKl2-(S+ST) FY=AFSIGFFYPT-AWSIGS2-ARSIGRlU+Q2bullbull F=AFSIGfC2KI-l-AWSIG-ARSIGR M=20FY+20HF-VA MMP=MMP VVP=VVP IF(MMP) 102623623
623 WRITE(6607)MMPVVPSIGKlK2 VINCR=VPIOO GO TO 4
102 V I=V-VINCR VINCR=VINCRIOO VIMIN=VPI00DOO IF(VINCR-VIMIN) 19922
901 Vl=V-VINCR VINCR=VINCR200 VIMIN=VPIOOOO IF(VINCR-VIMIN)199902902
c
C
157
921 V1=V-VINCR VINCR=VINCRI200 VIMIN=VPI10000 IF(VINCR-VIMIN)199922922
199 CONTINUE GO TO 200
201 CONTINUE WRITE(b608)
200 CONTINUE RETURN END
158
APPENDIX B
Plasticity Relationships
In the elastic range stresses were computed from measured
strains by the usual elastic theory The values used for the
modulus of elasticity E and the shear modulus Gtwere 29OOOksi
and 11200ksi respectively When local yielding had occurred
according to the von Mises criterionas stated by equation (2)
Chapter 11 stresses were then computed by the plasticity
relations given by Hill(8) and reduced to the form given by
Bower(16) These relations are stated here for easy reference
Plasticity relations for a Prandtl-Reuss solid yield
dE = des _ ~(d)+ 2G dt (a)xT3Gt~xy
where E x is strain in the longitudinal direction and l$ xy
is the shearing strain Eliminating ~ by use of the von
Mises criteria gives
(b)
Since explicit integration of equation (b) would be
extremely difficult the equation is diVided by dE-x and the
derivatives d tSd E and d 6 yld poundx are replaced byx x
159
(c)
( d)
where~i and ~XYi are the bending and shearing stresses
respectively corresponding to ~ and ~f and ~xYf are
these stresses corresponding to poundx + 6 (x
Substituting equations (c) and (d) into equation (b)
gives
A~x - B6~ + AtS cs = AY l (e)
f
where (f)
and ( g)
The shear stress corresponding to a change in strain is given
by
2 2 ~ =Jcsy - CS f (h)
f [3
In order to determine whether strain hardening had occurred
an equivalent strain Xp was computed from
160
where lIE Xl ~yp Ezp and xyp are the plastic components of
strain and are given by
~ xp = poundx-t ( j)
Eyp = E yy (S
- i (k)
E (1)poundzp = z -~ (m)xyp = 6xy -
~
~
The constant volume condition was used to calculate ~ zp
(n)
The equivalent strain was compared to a reference strain
~ pr computed from the value for ~p for the onset of strain
hardening for a tensile test The strain hardening strain
was taken as euro x and it was assumed that E = poundoz For yy
A36 steel the strain hardening strain was taken as 115 ~yIE
and ~y was determined from a tensile test of a coupon from
the web of the test beam Strain hardening was considered
resent J f 6 gt or J P degpr-
The above relationships were included in a paper
presented by Bower(16) in 1968
161
BIBLIOGRAPHY
1 Muskhelishvili NISome Basic Problems of the Mathematical Theory of ElasticityU 2nd Edition P Noordhoff Itd 1963
2 HelIer SR Jr Brock JS and Bart R The itresses Around a Rectangular Opening with Rounded Corners in a Beam Subjected to Bending with Shear Proceedings Vol 1 Fourth U National Congress on Applied Mechanics Berkeley Calif 1962
3 Bower JE ItElastic Stresses Around Holes in WideshyFlange Beams Journal of the Structural Division ASCE Vol 92 No ST2 Proc Paper 4773April 1966
4 BowerJE Experimental Stresses in Wide-Flange Beams with Holes tl Journal of the Structural Division ASCE Vol 92 No ST5 Proc Paper 4945October 1966
5 So WC The Stresses Around Large Circular Openingsin the Webs of Wide-Flange Beams MEng Thesis McGill University Aug 1963
6 Chen IC tiThe Stresses Around Two Large Openings in the Webs of Wide-Flange Beams MEng Thesis McGill University Aug 1967
7 Segner EP Jr Reinforcement Requirements for Girder Web Openings Journal of the Structural Division ASCE Vol 90 No ST3 Proc Paper3919 June 1964
8 HillR The Mathematical Theory of PlastiCityClarendon Press Oxford University Press London 1950
9 Handbook of Steel Construction Canadian Institute of Steel Construction OntariO 1967
10 ltSpecifications for the DeSign Fabrication and Erection of Structural Steel for Buildings AISC 1963
11 Basler K Strength of Plate Girders in Shear Journal of the Structural Division ASCE Vol 87 No ST7 Proc Paper 2967 October 1961
162
12 Worley WJ Inelastic Behavior of Aluminum AlloyI-Beams With Web Cutouts University of Illinois Engineering Experimental Station Bulletin No 448 April 1958
13 Redwood RG and McCutcheon J 0 Beam Tests with Unreinforced Web Openings Journal of the Structural Division ASCE Vol 94 No ST1 Proc Paper5706 Jan 1968
14 nCommentary of Plastic DeSign in Steel ASCE Manual of Engineering Practice No 41 1961
15 Cheng SY flAn Investigation of Large Extended Openingsin the Webs of Wide-Flange Beams MBng Thesis McGill University Aug 1966
16 Bower JE Ultimate Strength of Beams with RectangularHoles Journal of the Structural Division ASCE Vol 94 No ST6 Proc Paper 5982 June 1968
17 Redwood RG Plastic Behavior and Design of Beams with Web Openings ff Proceedings of the Canadian Structural Engineering Conference Canadian Institute of Steel Construction Toronto Feb 1968
18 Redwood RG The Strength of Steel Beams with Unreinshyforced Web Holes Civil Engineering and PubliC Works Review Vol 64 No 755 London June 1969
19 Redwood RG Ultimate Strength Design of Beams with Multiple Openings Proceedings of the Structural Engineering Conference American Society of Civil Engineers Pittsburgh October 1968
iii
ACKNOVlLEDGEMENTS
The writer wishes to express her appreciation to those
who provided assistance during the course of this study In
particular thanks are due to
Dr RGRedwood who acted as research director and
provided constant guidance and encouragement during the
course of this investigation
Messrs B Cockayne and G Matsell and the remainder of
the technical staff who helped in the fabrication and testing
of the test beams and in the preparation of tensile coupons
The staff of the Department of Metallurgical Engineershy
ing who generously offered access to the 20k Instron Testing
Machine for the testing of tensile coupons
The writer t s husband Vayne who provided considerable
help and encouragement and who also typed this manuscript
This investigation was made possible by the financial
assistro1ce of the National Research Council of Canada and
by the Canadian Steel Industries Construction Council
iv
NOTATION
a half length of opening
Af area of flange
Ar area of reinforcing
Aw area of web
b width of flange
c width of one pair of reinforcing bars (including web)
d depth of beam
E modulus of elasticity
Est strain hardening modulus
f subscript denoting stress or strain after load increment
FI stress resultant at high moment edge of opening
F2 stress resultant at low moment edge of opening
G shear modulus
h half depth of opening
i subscript denoting stress or strain before load increment
k I location of stress reversal at high moment edgeof opening
location of stress reversal at low moment edgeof opening
L length of moment arm to center of opening
M applied bending moment
Mp plastic bending moment
M p reduced plastic moment
x
v
p applied load
q thickness of reinforcing
R corner radius of opening
s half remaining clear web at opening
t thickness of flange
u length of web stub
shear force
plastic shear force
w thickness of web
extension of reinforcing past edge of opening
distance from the boundary of the opening to the stress resultant at the high moment edge of opening
distance from the boundary of the opening to the stress resultant at the low moment edge of opening
z plastic section modulus
proportionality factor 1= i(~2(2~ - 1)21 ~ proportionality factor f= kl + k2 - 1 - ~J pound45 strain at 45 0 to the longitudinal direction
pound-45 strain at -45 0 to the longitudinal direction
pound x strain in the longitudinal direction
6 xp plastic component of ~x
pound y strain corresponding to yielding
~yy strain in the direction of the beam depth
euro yp plastic component of euroyy
vi
~z strain in the transverse direction
plastic component of poundz
strain corresponding to hardening
the initiation of strain
~p equivalent strain
~pr reference value of ~p
~ xy shearing strain
~ normal stress
yield stress
yield stress for flange
yield stress for reinforcing
yield stress for web
shear stress
AISC American Institute of Steel Construction
ASTM American SOCiety of Testing Materials
CISC Canadian Institute of Steel Construction
ASCE American Society of Civil Engineers
vii
LIST OF FIGURES
Page
1 Types of Reinforcing 93
2 Stress Distribution at Opening 94
3 Idealized Stress-Strain Curve for Structural Steel 94
4 Interaction Curve - Unperforated Beam 95
5 Load - Deflection Curves 96
6 Interaction Curve - Perforated Beam 97
7 Hinge Locations and Cross-Section of Member 98
8 Stress Distributions and Resultant Forces 99
9 Interaction Curve Showing Low and High Shear Regions 100
10 Interaction Curve - 14WF38 Nominal 7 x lOin Opening Itn X iReinforcing 101
11 Interaction Curve - 14WF3~ Nominal 7f1 X lot Opening 213 x t Reinforcing 102
12 Interaction Curve - 14WF38 Nominal 7 xlot Opening No Reinforcing 103
13 Interaction Curve - 14WF38 Nominal 7 x 14 Opening It x lIt Reinforcing 104
14 Interaction Curve - 14WF38 Nominal 9 x 13t Opening li x -n Reinforcing 105
15 Interaction Curve - 10WF21 Nominal 5~ n x Bi Opening li x i lt Reinforcing 106J
16 Test Beam Dimensions and Dial Gauge Locations 107
17 Test Beam Dimensions and Dial Gauge Locations 108
18 Test Beam Dimensions and Dial Gauge Locations 109
19 Lateral Bracing System 110
viii
Page
20 Photographs of Lateral Bracing System III
21 Strain Gauge Locations 112
22 Tensile Coupons 113
23 Stress-Strain Curve from Instron Testing Machine 113
24 Photographs of Test Beams after Collapse 114
25 Comparison Photographs of Test Beams 115
26 Comparison Photographs of Test Beams 116
27a Stress Distribution at High Moment Edge of OpeningBeam 2C 117
27b Stress Distribution at Low Moment Edge of OpeningBeam 2C 117
28a Stress Distribution at Centerline of OpeningBeam 2C 118
28b Bending Stress Distribution Across Flange at High Moment Edge of Opening - Beam 2C 118
29a Bending Stress Distribution Across Length of Opening at Top of Flange Beam 2C 119
29b Bending Stress Distribution Across Length of Opening at Top of Reinforcing - Beam 2C 119
30a Stress Distribution at High MOment Edge of Opening - Beam 3B 120
30b Stress Distribution at Low Moment Edge of Opening - Beam 3B 120
31a Stress Distribution at High Moment Edge of Opening - Beam 2D 121
31b stress Distribution at High Moment Edge of Opening - Beam 4B 121
32 Load-Relative Deflection Curve - Beam lA 122
33 Load-Relative Deflection Curve - Beam 2A 122
ix
Page
34 Load-Relative Deflection Curve - Beam 2B 123
35 Load-Relative Deflection Curve - Beam 2C 123
36 Load-Relative Deflection Curve - Beam 2D 124
37 Load-Relative Deflection Curve - Beam 3A 124
38 Load-Relative Deflection Curve - Beam 3B 125
39 Load-Relative Deflection Curve - Beam 4A 125
40 Load-Relative Deflection Curve - Beam 4B 126
41 Load-Relative Deflection Curve - Beam 5A 126
42 Load-Relative Deflection Curve - Beam 6A 127
43 Interaction Curves - Test Beam lA 128
44 Interaction Curves - Test Beams 2A and 2B 129
45 Interaction Curves - Test Beams 2C and 2D 130
46 Interaction Curves - Test Beam 3A 131
47 Interaction Curves - Test Beam 3B 132
48 Interaction Curves - Test Beams 4A and 4B 133
49 Interaction Curves - Test Beam 5A 134
50 Interaction Curves - Test Beam 6A 135
51 Lateral Deflection at High Moment Edge of OpeningBeam 2C 136
52 Flange Buckling at High Moment Edge of OpeningBeam 2C 137
53 Shear Stresses at End of Reinforcing 138
54 Variable Reinforcing Size 139
55 Variable Moment to Shear Ratio 140
56 Variable Moment to Shear Ratio 141
x
Page
57 Variable Moment to Shear Ratio 142
58 Variable Aspect Ratio 143
59 Variable Opening Depth to Beam Depth M4
xi
LIST OF TABLES
Page
1 Beam Properties 145
2 Tensile Test Results 146
3a Shear Values Corresponding to Yielding 147
3b Shear Values Corresponding to Strain Hardening 147
4 Shear Values Corresponding to Whitewash Flaking 148
5 Correlation Between Experiment and Theory 149
6 Correlation Between Experiment and Approximate Theory 149
7 Correlation Between Experimental Failure and Complete Yielding 150
8 Correlation Between Theoretical Failure and Complete Yielding 150
SUJn1[ARY
ACKNOWLEDGEMENTS
NOTATION
LIST OF FIGURES
LIST OF TABLES
TABLE OF CONTENTS
Page
ii
iii
iv
vii
xi
CHAPTER I INTRODUCTION
11 General Background 1
12 Types of Reinforcing 2
13 Elastic and Ultimate Strength Analysis 4
CHAPTER 11 ULTINfATE STHEUGTH BEHAVIOR
21 Behavior of Unperforated Beams 8
22 Behavior of Beams with Web Openings 12
23 Previous Ultimate Strength Investigations 17
24 Scope of the Investigation 25
CHAPTER III ULTIMATE STRENGTH ANALYSIS
31 Assumptions 27
32 Low Shear Solution - Case I 29
33 High Shear Solution - Case 11 35
34 Limits of Interaction Curves 36
CHAPTER IV APPROXIMATE METHOD
41 General Remarks 41
42 Development of the Method 42
43 Limitations on the Approximate Method 46
44 Summary and Discussion 50
Page CHAPTER V EXPERIMENTAL INVESTIGATION
51 Selection of Test Beams 56
52 Experimental Setup 59
53 Testing Procedure 62
54 Determination of Yield Stresses 63
CHAPTER VI EXPERIMENTAL RESULTS
61 Behavior of Beams during Testing 66
62 Stress Distributions and Failure Loads 71
63 other Factors 72
CHAPTER VII ANALYSIS OF RESULTS
71 Order of Onset of Yielding 77
72 Stress Distributions 78
73 Failure Loads 80
74 Influence of Reinforcing and Other Variables 82
CHAPTER VIII CONCLUSIONS AND RECO~Th1ENDATIONS
81 Conclusions 85
82 Recommendations for Design 88
83 Recommendations for Future Work 91
FIGURES 93
TABLES 145
APPENDIX A Computer Program for Interaction Curve 151
APPENDIX B Plasticity Relationships 158
BIBLIOGRAPHY 161
1
CHAPTER I
INTRODUCTION
11 General Background
It has become common practice to cut openings in the
webs of beams to permit the passage of utility ducts By
passing these utilities through rather than under the beams
the height of each floor in a building can be reduced thereshy
by effecting a considerable saving in cost particularly in
the case of multistorey structures However cutting an
opening in the web of a beam may considerably reduce the
strength of the beam in the vicinity of the opening If
the opening is located at some position in the beam where
stresses are low this may cause no special problems but
if it is located in a high stress region the designer is
faced with the problem of finding an economioal way to inshy
crease the strength of the beam so that failure will not
result at the opening under working loads
Two alternate approaches are possible in this case
The size of the entire member in question may be increased
on the basis of providing sufficient strength at the openshy
ing so that failure will not ocour The other approach is
to reinforce the original member in the vicinity of the
opening so that the loads can be carried without inducing
2
high stresses The size of the member itself then need not
be increased
Just as the decision whether to pass utilities through
rather than under floor beams must be based primarily on
economic considerations the decision whether to reinforce
an opening or increase the size of the entire member when
the opening is located in a high stress region must also be
based on economics Since many methods of reinforcing an
opening are possible the relative costs and effects of each
type of reinforcing deserve consideration
12 Types of Reinforcing
Reinforcing for an opening in the web of a beam may be
of three basic types
1 reinforcing to resist high bending stresses and low shear
stresses
2 reinforcing to resist low bending stresses and high shear
stresses
3 reinforcing to resist both high bending and shear stresses
Two examples of the first type are illustrated in Figures
la and lb By increasing the areas of the sections above
and below the centroid they provide additional moment
resisting capacity to the section However since shear
stresses are considered to be carried only by the web of
the section this type of reinforcing cannot increase the
3
shear capacity above that given by the shear capacity of
the uncut section times the ratio of the net web area at
the opening to the initial web area of the beam Reinforcshy
ing types to resist high shear stresses are those that
increase the web area so that more web is available to
resist these stresses Web doubler plates as shovm in
Figure lc are typical of this type of reinforcing although
their use is usually very limited due to welding difficulties
This type of reinforcing also increases moment capacity by
increasing the area above and below the opening Another
type of shear reinforcing uses vertical or inclined web
stiffeners to carry the shear forces past the opening A
typical arrangement of inclined web stiffeners is shown in
Figure Id The third type of reinforcing is essentially a
combination of the first two examples of which can be seen
in Figures le and If The area above and below the opening
is increased to give added moment capaCity and the effective
web area is increased by the addition of vertical or inclined
shear plates to provide added shear capacity to the section
A combination of the reinforcing arrangements in Figures la
and Id would be another example of this type Many other
arrangements of web opening reinforcing are pOSSible but
those shown in Figure 1 and mentioned above are typical of
the three main types
Since the problem of cutting and reinforcing an opening
4
in a section is basically one of economics the cost of the
process of reinforcing an opening must be considered This
cost may be divided into three parts the cost of supplying
and cutting the material to be used in reinforcing the openshy
ing that of bending and fitting this material and welding
this material into place Since the cost of welding is
paramount among the several expenses it is advantageous to
keep the welding to a minimum in the selection of a reinforcshy
ing type This tends to make the high shear type of reinforcshy
ing uneconomical and essentially limits the more practical
opening reinforcings to those of the type considered in
Figures la and lb The present investigation is devoted to
this type of reinforcing and specifically to that arrangement
given in Figure lb
13 Elastic and Ultimate Strength Analysis
BaSically two types of analysis were available for this
study - elastic and ultimate strength The elastic analysiS
of the stresses in a beam containing an opening in its web
consists of the superposition of the stresses occurring in
an unperforated beam and the stresses resulting from forces
applied to the boundary of the opening in such a way as to
satisfy certain boundary conditions at the opening This
approach finds its basis in an important work presented by
NIMuskhelishvili(l) in the 1930s and was used by SR
5
Heller Jr et al(2) in 1962 and by JEBower(3) in 1966 to
investigate the elastic stresses around openings in wideshy
flange beams Bowers work also outlined the widely used
approximate Vierendeel analysis based on the assumption that
the beam behaves like a Vierendeel truss in the vicinity of
the opening The shear force carried by the section causes
secondary bending moments to occur within the tee sections
formed by the flange and the remaining part of the web above
and below the opening A point of contraflexure for the
secondary bending stresses is assumed to occur at the midshy
length of the opening The forces acting at the opening and
the resultant stress distributions are shown in Figure 2 It~
is assumed that the shear is carried equally by the tee secshy
tions above and below the opening and that the secondary and
primary bending stresses are additive
Bower also performed an experimental study(4) in 1966
to verify the results of his analysis A series of 16WF36
beams each containing one opening either circular or
rectangular with corner radii of 14 inch were tested at
varying moment to shear ratios The beams were implemented
with electrical resistance strain gauges in the vicinity of
the openings so that strains could be measured and compared
to those predicted by theory The results of Bowers tests
showed that very high stress concentrations occur at the
corners of rectangular openings while smaller stress concenshy
6
trations occur above and below circular openings where the
tee section is the smallest The findings for circular
openings confirm those given by So(5) in 1963 while those
for rectangular openings were confirmed by Chen(6) in 1967
Bower showed that for both types of openings investigated
the elastic analysis predicts all stresses and stress concenshy
trations with reasonable accuracy except for the octahedral
shear stresses away from the boundary of the opening The
elastic analYSiS however is complicated and requirea the
use of a computer and is incapable of dealing with the presshy
ence of notches or other irregularities at the opening The
approximate Vierendeel method was found to predict bending
stresses and octahedral shear stresses with acceptable
accuracy while failing to predict the stress concentrations
in both cases However the approximate method is relatively
simple and lends itself easily to hand calculations Since
the elastic analysis is not practical particularly for
design purposes because of the length of the calculations
involved it has been suggested by Bower and others(7) that
the Vierendeel analysis be used in its place with stress
concentrations neglected when an elastic analysis is desired
A design based on this method would result in a beam whose
response is not purely elastic under working loads
An analysis based on complete yielding of the sections
where high stress concentrations exist under elastic condishy
7
--~~
~ tions would eliminate this problem Such a plastic or
ultimate strength analysis would take advantage of the
additional strength of the perforated beam between the onset
of yielding and the complete plastification of the section
or sections that would cause failure or uncontrolled deformshy
ations of the beam Besides eliminating the problem of stress
concentrations in the elastic range a plastic analysis also
has the advantage of being simpler to use than the complete
elastic analysis and of not being rendered unusuable when
notches or irregularities are present at the opening since
the method depends only on the reasonably accurate prediction
of the sections where complete yielding or plastic hinges
will occur These regions can generally be determined withshy
out difficulty particularly in the case of rectangular
openings Consideration of these factors suggest an ultishy
mate strength analysis as the most rational approach to
the problem
8
CHAPTER 11
ULTIMATE STRENGTH BEHAVIOR
21 Behavior of Unperforated Beams
Ultimate strength analysis truces advantage of the ducshy
tility of structural steel This ductility mruces it possible
for the steel to undergo large deformations beyond the elastic
limit before failure occurs As can be seen from the idealized
stress-strain curve in Figure 3 the material is elastic up
to the yield level but after this level is reached the strain
increases extensively without any further increase in stress
Beoause of this attainment of the yield stress at the outershy
most fiber of a beam in bending does not cause the failure of
the member Rather the member has reserve strength that
permits increase of load up to the point where the entire
cross-section has reaohed the yield stress ie when a plastio
hinge has fonned at the yielded section Since rotation is
free to occur at plastic hinge locations when sufficient
hinges have formed so that the structure forms a mechanism
and is unstable under the applied loads collapse will occur
For a simply supported beam of uniform cross-section
formation of only one plastio hinge is suffioient to cause
collapse If no shear or axial forces are acting the plastic
moment or maximum moment capacity of the section is easily
9
obtained and is equal to the first moment of the area of the
section above or below the centroid about the centroid times
the yield stress of the material This is writte~ as
where Z is the plastic section modulus of the section and ~y
is the yield stress
The presence of a moment-gradient (shear) has the effect
of lowering the plastic moment capacity of a member Since
the shear force is carried by the web of the member the
moment carrying capacity of the web and therefore that of
the member must be reduced since the presence of shear
causes a reduction in the normal stress carrying capacity of
the web The yielding criterion of von Mises is generally
accepted as being the most applicable to structural steel
and can be explained physically in either of two ways
Henckys interpretation states that when the energy of disshy
tortion reaches a maximum value yielding results A preferred
explanation offered by Prandtl states that when the shear
stress on the octahedral plane reaches some maximum value
yielding occurs(8) Von Mises t yield criteria can be
expressed mathematically as
10
where ltSyiS the yield stress ltS the normal stress and the
shear stress The effect of shear on moment capacity can
best be illustrated by an interaction curve as shown in
Figure 4 where the axes have been non-dimensionalized by
diVision by Mp and Vp Vp is the maximum shear carrying
capacity of the section under pure shear and is obtained
from equation (2) as
where = Vw( d-2t) V is the shear force and w( d-2t) the
clear web area Equation (3) presupposes that the flanges
of the section carry no shear The broken line in Figure 4
illustrates the interaction between moment and shear for an
unperforated wide-flange section as predicted by equation (2)
Such an interaction curve shows for any given moment value
the corresponding shear value that a member can safely sustain
Any value less than those on the interaction curve (those
bounded by the VV and MM axes and the interaction curve)p p represents a combination of moment and shear which the member
can safely carry Values on or outside the interaction curve
represent those combinations which would cause collapse of the
member The reduction in strength due to shear is however (9)fairly small for unperforated sections and OISC and
AISc(lO) design codes for buildings allow it to be neglectshy
11
ed for design purposes since the ooouranoe of strain hardenshy
ing makes possible the attainment of moments greater than Mp
in the presence of shear The allowable moment and shear
values thus permitted are those bounded by the solid line in
Figure 4
The inorease in strength due to strain hardening oan best
be illustrated by considering the load-defleotion curves in
Figure 5 The load-defleotion ourve for a beam in pure bendshy
ing is given in Figure 5a When the plastio moment of the
seotion is reaohed the defleotions beoome exoessive and
increase with no further inorease in load This ooours
beoause the member forms a meohanism with the formation of
a plastio hinge at the attainment of Mp However when shear
is present the load-defleotion ourve does not beoome horishy
zontal when the reduoed Mp Mp as predioted by equation (2)
and given by the interaction curve in Figure 4 is reached
but rather oontinues to climb at a lesser slope reaching
values equal to or greater than the full Mp given by equation
(1) This oan be seen in Figure 5b The increase in strength
above Mp under moment gradient is due to strain hardening
and is usually neglected in simple plastiC theory although
it can be predicted but the procedure is complicated for
all but very simple cases Strain hardening occurs in the
presence of shear because yielding occurs in localized areas
or slip bands so that the material within these bands strain
12
hardens before adjacent areas reach the point of yield Alshy
though simple plastic theory neglects strain hardening the
significance of this phenomenon should not be underestimated
since all rolled sections are proportioned such that the limit
of shear carrying capacity of the web lies within the strain
hardening range(ll)
22 Behavior of Beams with Web Openings
The introduction of an opening into the web of a wideshy
flange section has two effects on the interaction curve The
first and more immediately apparent of these effects is the
reduction of shear and moment capacity by the reduction of the
area available to resist these forces The moment capacity
is reduced to
(4)
where w is the web thickness and h is the half depth of the
opening The shear capacity is reduced to
v = w( d-2t-2h) $-3
This change in the interaction curve is shown by the broken
line in Figure 6 The second effect caused by the presence
of an opening is the strong interaction between moment and
shear due to the member behaving like a Vierendeel truss in
13
the vicinity of the opening This is the same type of
behavior described in Section 13 except that the member
is analyzed in the plastic rather than the elastic range
The secondary bending moments caused by the shear force are
added to the primary bending moments thus causing the critical
sections to yield completely at lower loads than would be exshy
pected were this interaction effect ignored This is shown
by the line in Figure 6 where the effects of shear as given
by equation (2) have also been included
The addition of horizontal bar reinforcing above and
below an opening in a wide-flange beam increases the maxishy
mum moment capacity of the section (no shear acting) above
that of an unreinforced opening by increasing the area of
the section capable of resisting moment The effects of
interaction between moment and shear are also reduced by the
addition of reinforcing since the reinforcing is of such a
type as to be particularly well suited to resist secondary
bending moments due to Vierendeel action The maximum shear
carrying capacity of a reinforced opening may reach
(Vv) = d-2t-2h (6)P max d-2t
which is the maximum shear carrying capacity of the section
assuming no interaction and is derived from equation (5) by
division by equation (3) This can represent a considerable
14
increase in strength over the shear capacity of the unreinshy
forced opening which is normally much below (VVp)max because
secondary bending moments have to be resisted to a large
extent by the web since there is no reinforcing to perform
this task
The presence of an unreinforced rectangular opening in
the web of a wide-flange section oauses ohanges in the failure
modes of the beam as well as in the interaction ourve Sevshy
eral investigations have confirmed these ohanges in failure
modes(461213) Vllien subjected to pure bending the member
is found to fail by oomplete yielding of the tee sections
above and below the opening Load defleotion curves for this
case are similar to those for an unperforated beam under pure
bending in that with the attainment of Mp the curve becomes
horizontal and collapse eventually occurs with no further
increase in load
Vhen the perforated beam is subjected to bending with
shear large relative displacements occur between the ends
of the opening and at the same time localized plastiC binges
form at each of the four corners of the opening by complete
yielding of the tee section at these locations The load-
deflection curve in this situation is similar to the load-
deflection curve of an unperforated member under moment-
gradient except that the second portion of the curve after
15
the bend is not always as straight as that for the unpershy
forated beam and in fact may possess considerable
curvature in some cases(13) The value of the moment at the
opening at which the load-relative deflection curve bends
is not that of the unperforated section but instead is a
reduced value obtained by considering both reduced area and
moment-shear interaction as described previously_ Again
the increase in load above the value corresponding to the
predicted moment is due to strain hardening for the same
reasons as cited previously_ This strain hardening effect
makes it exceedingly difficult to ascertain at what value of
shear or moment an experimental test beam should be considershy
ed to have failed so that this failure load can be compared
to one predicted by theory It can be said with certainty
that this value should lie somewhere between the load at
which the load-relative deflection curve starts to bend from
its initial slope and the ultimate load at which the beam
suffers total collapse This total collapse will be either
by web buokling at the opening or by oraoking of one or more
of the corners of the opening after which deflections become
uncontrolled and the load carrying capacity of the beam
decreases
The use of the collapse load as the failure load would
however not be justified unless the effects of strain hardenshy
ing and the possibility ot tearing and buokling are incorporatshy
16
ed into the analysis Also the deflections become so exshy
cessive as to make the beam unserviceable before this load
is reached Indeed a rational definition would have to be
such as to have the failure load fall within the region
where the load-relative deflection curve bends from its
initial slope to some new slope One possible means of
defining failure in this type of situation is suggested in
ASCE tlOommentary on Plastic Design in Steel(14) and
is perhaps the most rational approach to the problem The
initial slope of the load-relative deflection curve is
multiplied by some constant factor to obtain a new slope
A line having this new elope is then drawn tangent to the
upper portion of the load-relative deflection curve and the
load at which this new slope intersects the initial slope is
taken to be the failure load This is analogous to considershy
ing strain hardening in some simple case where the slope of
the theoretical load-deflection curve in the strain hardening
range is equal to a constant times the initial slope of the
curve when the beam is still elastic If this method is to
be used a method of determining a suitable constant must
be chosen possibly from experiment
The modes of failure of a beam containing a reinforced
opening are expected to be the same as those with an unreinshy
forced opening under both pure bending and bending with shear()
Similarly the load-deflection curves or the load-relative
17
deflection curves would be the same in both cases Thus for
cases of moment gradient the same situation exists for both
reinforced and unreinforced openings where the load continues
to increase past the attainment of the predicted moment
capacity of the section due to strain hardening and the same
difficulty exists for determining failure loads for beams
with reinforced openings as for the unreinforced case
The method suggested in ASCE and described previousshy
ly for determining failure load was adopted for the purposes
of correlating experimental and theoretioal values of failure
load in this study Since the load-relative defleotion curves
for some of the test beams approached a fairly constant slope
in the strain hardening range it was decided to determine
the slopes and constant multiplication factors for these
cases and apply the same factor to all of the test beams
since all were similar It was thus decided to use a value
of thirty times the initial slope for the final slope in
determining experimental failure loads
23 Previous Ultimate Strength Investigations
While considerable theoretical and experimental work
has been done in the determination of elastic stresses around
openings in plates and beams relatively little has been done
ooncerning ultimate strength behavior In 1958 wJworley(12)
18
carried out an investigation of the ultimate strength of
aluminum alloy I-beams containing web openings of various
shapes Rectangular elliptical and triangular openings
were studied with the main objects of the research being
to determine which shape of opening resulted in the smallest
loss of strength and to verify the validity of an upper
bound theorem in predicting the fully plastiC load carrying
capaCity of the test beams The upper bound plastiC theorem
states that of all the possible mechanisms or combinations
of plastic hinges sufficient to cause collapse the one that
ensures collapse at the lowest load is the correct mechanism
under which the member will actually fail Worleys experishy
mental results were in fairly good agreement with the ultimate
loads predicted by the upper bound theorem and were the most
accurate for the case of rectangular openings where hinge
locations were more easily predicted than for the other openshy
ing types Of the various opening shapes tested it was found
that the elliptical opening was the strongest on a maximum
area removed baSiS while the triangular was stronger on a
maximum depth basiS The practical need for these two shapes
especially the triangular is however questionable Worley
excluded the effects of shear and axial force in his analysis
and for rectangular openings assumed a four hinge mechanism
with hinges considered at the corners of the opening
19
In 1963 W-CSo(5) presented a study of large circular
openings in wide-flange beams including an ultimate strength
analysis based on the assumption of a plastic hinge over the
center of the opening Sots analysis however neglected
secondary bending effects due to Vierendeel action in the
vioinity of the opening and also ignored shear yielding
effects in the web The experimental investigation performshy
ed in the ultimate strength range consisted of the testing
of two l4WF30 beams to collapse The first beam was tested
in pure bending so that shear and Vierendeel action were not
present and the ultimate strength predioted by Sos analysis
would be expeoted to be oorreot since the same strength would
be predicted in this case whether or not these effects were
considered Deviation between experiment and theory was 3
The second beam was tested under moment gradient but due to
the relative location of opening and maximum moment (the
beam was simply supported and subjected to a single concenshy
trated load) the beam was expected to and did fail under
the load and not at the opening
S-y Cheng(15) in 1966 considered bending shear and
axial forces in his investigation of the ultimate strength
of extended circular openings in wide-flange beams At high
values of shear a four hinge mechanism was assumed while at
low shears hinges were assumed above and below the opening
20
where the tee section was smallest - similar to the failure
mode in pure bending Stress distributions were assumed at
hinge locations for each case Two l4WF30 beams were tested
to destruction one in pure bending and the other with a
moment to shear ratio of 24 inches which is a high value of
shear for the size beam used While reasonable agreement
between theory and experiment was obtained for both beams
tested an inherent fault in Chengs work lies in its inshy
ability to predict a continuous variation of failure loads
as the shear varies from a low to a high value It is
impossible for the change from a one to a four hinge mechanism
to occur suddenly with only a slight increase in shear
Experiments in the ultimate strength region were performshy
ed by I-C Chen(6) in 1967 on two 14WF30 beams each containing
two large openings in their webs One simply supported beam
containing two 8 inch diameter circular openings spaced 8
inches apart was found to fail in the manner of a be~u conshy
taining only one opening failure being associated with the
opening subjected to the largest moment both being under
the same shear force In the second beam containing two
8x12 inch reotangular openings spaced 4 inches apart the two
openings failed as a unit with four hinges forming at the
outer oorners opoundthe openings and the web between them evenshy
tually buckling No theoretioal ultimate strength analysis
was offered by Chen
21
In 1968 JEBower(16) proposed an ultimate strength
theory for beams containing a single rectangular opening in
their webs A point of contraflexure for Vierendeel stresses
was assumed to occur at the midlength of the opening and
three alternate stress distributions were proposed for
complete yielding of the low moment edge of opening The
first of these stress distributions assumed no Vierendeel
action and was quickly discounted as giving unrealistically
high predictions of strength The two remaining stress
distributions both took into account secondary bending moments
due to shear the first assuming localized web yielding in
shear and the second assuming uniform shear distribution
over part of the web with this area yielding in combined
bending and shear The first of these lower bound solutions
was based on an unrealistic stress distribution and proved
to give unrealistically low predictions of the beam strength
The second lower bound solution which was finally adopted
by Bower was based on a more realistic stress distribution
but was restricted in that the point of contraflexure was
assumed at the midlength of the opening which is not always
the case
Experiments were performed on four 16WF36 beams each
oontaining one rectangular opening as part of this work
Collapse loads are oited for each of the test beams and are
22
compared with predictions from the second lower bound analysis
However since all of the beams were tested at relatively high
ratios of shear to moment considerable strain hardening
would have occurred before collapse and experimental results
which take advantage of the reserved strength due to this
strain hardening (even though accompanied by large deformashy
tions) cannot justifiably be compared to a theory that ignores
this effect
A more general ultimate strength analysis for beams with
rectangular openings was offered by RGRedwood(17) also in
1968 A point of contraflexure was assumed to occur someshy
where within the tee section above and below the opening but
its location was not dictated as in Bowers analysis A
four hinge mechanism was assumed on the basis of previous
tests(13) with stress distributions assumed at both high
and low moment edges of the opening Shear stresses were
assumed carried by the entire web of the section with web
yielding occurring in combined bending and shear
Redwoods analysis was correlated with his previous
experimental investigations and found to be conservative
when shears were large But again the effects of strain
hardening were included in the experimental collapse loads
and not in the theory If the experimental failure loads
could be related to the occurrence of full yielding at the
23
critical sections a more valid comparison with the theory
would result Such a comparison was taken into account by
Redwood in a later paper(la) In this paper failure is defined
in a way similar to that suggested in the previous section
Another recent paper by Redwood(19) deals with beams
containing multiple unreinforced openings in their webs A
method is offered for determining the minimum spacing required
between openings to prevent their interaction and failure
as a unit An analysis is also given for determining the
strength of a member when failure is associated with more
than one opening and this is combined with Redwoods analysis
offered previously(17) for failure associated with only one
opening The theory is compared to the experimental work
performed by Chen(6) in 1967 (7)In 1964 EPSegner Jr conducted an investigation
of several types of reinforcing for rectangular openings
testing six wide-flange beams in four different sizes each
containing two or more openings The openings in five of
the six beams were reinforced each With one of five main
types of reinforcing The openings were positioned at
several different moment to shear ratios and each of the
beams was tested to destruction Unfortunately little can
be said about the performance of the different types of
reinforcing under varying moment-shear conditions because
24
of the large number of variables included in each of the tests
Perhaps Segners most significant contribution is to be
found in his cost comparison of the various types of reinshy
forcing for rectangular openings Estimates cited for six
different fabricators clearly indicate that shear-type reinshy
forCing or reinforcing designed to carry high shear forces
around the opening is economically non-feasible except in
unusual circumstances The most economical type of reinshy
forcing included in this study consisted of two flat plates
bent to fit the shape of the opening and welded inside the
opening with a small gap between them occurring at the midshy
depth of the opening This is the same type as shown in
Figure la Another type of reinforcing included in Segnerts
experimental work but unfortunately omitted from his eco~
nomic comparison consisted of straight horizontal reinforcshy
ing plates welded above and below the opening at the openingis
boundary The plates extended past the vertical edges of the
opening to allow for anchorage of the plate Considerable
welding problems were said to have been encountered by placing
the reinforcing flush with the upper and lower edges of the
opening since the fillet was likely to overrun into the radii
of the re-entrant corners but this could easily be overcome
by leaving a small web stub between the plate and the opening
to allow for welding This type including the modification
25
for welding purposes is that given in Figure lb
Although this reinforcing type was not included in the
economic comparison presented by Segner it would seem to be
of only slightly greater cost than that in Figure la
Approximately the same amount of reinforcing material is
needed for these two types and while the straight bar reinshy
forcing requires more welding it does not require bending
of the plates and eliminates the worry of fit between the
plate bends and the opening radii After giving careful
consideration to the economics and fabrication problems of
reinforcing a rectangular opening in the web of a beam it
was decided to devote the present investigation to reinforcshy
ing of the horizontal straight bar type
24 Scope of the Investigation
An ultimate strength analysis is presented for wideshy
flange beams containing large rectangular openings in their
webs and reinforced with straight bar reinforcing above and
below the openings The investigation includes the effect
on beam strength of variable opening depth to beam depth
opening length to depth reinforcing Size and moment to
shear ratio One lOWF21 and ten l4WF38 beams were tested to
collapse Each of the test beams contained one rectangular
opening centered at the middepth of the beam and ten of the
26
eleven openings were reinforced Deflections were measured
at several pOints for all of the test beams and each beam
was painted with a brittle coating of whitewash in the region
of the opening to obtain an indication of the order of onset
of yielding Four of the test beams were also equipped with
electrical resistance strain gauges at critical sections The
experimental investigation encompassed each of the variables
of the theoretical work
27
CHAPTER III
ULTI1iATE STRENGTH ANALYSIS
31 Assumptions
Based on the discussions in the previous chapters the
following assumptions are made in this analysis of reinforcshy
ed rectangular openings with horizontal reinforcing bars
1 Failure of the member takes place by formation of a four
hinge mechanism with hinge locations being at the corners
of the opening These locations are shown in Figure 7a
a cross-section through the opening being given in Figure
7b
2 A point of contraflexure occurs somewhere within the
length of the tee section Its location is the same
above and below the opening but this location is not
dictated
3 Stress distributions at high and low moment edges of the
opening are those shown in Figure 8b Since the stresses
are antisymmetric with respect to the vertical axis of
the beam only the stresses for the tee-section above
the opening are indicated The resultant forces acting
on the tee-section are shown in Figure 8a
4 Shear stresses are carried only by the web of the teeshy
section and are uniformly distributed across this web at
28
hinge locations when hinges are fully formed While
the shear stress at the boundary of the opening must be
zero this assumption introduces only very slight error
into the theory since these stresses can increase from
zero to their maximum value at a very small distance from
the opening 1 s boundary_ Due to the presence of the reinshy
forcing bar it is likely that most of the shear will be
carried by the region of web between the reinforcing bar
and the flange particularly when the secondary bending
stresses are very high This is further discussed in
Section 34 and introduces no significant error in the
development of this method
5 Yielding in the web occurs lliLder combined bending and
shear according to the von Mises criterion stated in
equation (2) Yielding in the flange and reinforcing is
in direct tension or compression
On the basis of the assumed stress distributions equishy
librium equations can be obtained for the tee-section at
values of the shear force which may vary in some cases
from zero up to the maximum as given by equation (5) At
the high moment edge of the opening section (1) in Figure
Bb stress reversal will occur within the web when the shear
force is relatively low (case I) but will occur within the
flange when the shear force is high (case II) These two
29
cases will be repounderred to as low and high shear conditions
respectively_ Three different locations of stress reversal
are possible under the low stress conditions
1 Reversal in the web stub below the reinforcing This
occurs at very low values of shear
2 Reversal in that portion of the web to which the reinshy
forcing is attached
3 Reversal in the clear web between reinforcing and flange
The range of shear values corresponding to reversal in
this region is very small
At section (2) the low moment edge of the opening for
practical situations reversal will occur only in the flange
32 Low Shear Solution - Case I
Consider equilibrium of the portion of the beam to the
right of Section (2) in Figure 7a Taking moments about
section (2) gives
where V denotes shear force as before F2 is the resultant
force at section (2) and Y2 is the distance from the edge of
the opening to the resultant normal F2bull All other symbols
used in this section and not specifically defined here are
defined in Figures 7 and 8 Taking moments about section (1)
30
for that portion of the beam to the right of this section
yields
(8)
where Fl and Yl are comparable to F2 and Y2 respectively
Equilibrium of the tee-section in Figure 8a requires that
(9)
Oonsideration of the assumed stress distribution at section (1)
for stress reversal occurring in the web stub below the reinshy
forcing ie for 0 =klS ~ u gives on integrating the
stresses
Fl = Af ~yf + SW(1-2~)G + Ar ~yr (10)
FIYl = Af ~ Yf(s~) + ~S2WG(1-2ki) + ArJ yr(u1) (11)
where Af = bt the area of one flange and Ar = q(c-w) the
area of one pair of reinforcing bars Separate yield stress
values are used for flange web and reinforcing because of
the large variation possible in these in a single beam A
discussion of the determination of these stresses is included
in Chapter 5 Yield stresses are designated as ~ yf for the
flange G yw for the web and ~ yr for the reinforcing
31
and ~ the normal stress carrying capacity of the web is
calculated from
t2 _ r- 2 3(V)2 ~ - yw-4sw (12)
and is another way of stating the von Mises yield criterion
given by equation (2) From consideration of the stress
distribution at section (2) for stress reversal in the flange
F2 = Af ltS yf(1-2k2) + sw ~ + Ar c yr (13)
F2Y2 = Al~Yf [S(1-2k2)~(1-4k2+2k~)J -1-s2Wlti +Ar~ yr(u~) (14)
Although explicit expressions for shear and moment capacity
cannot be determined from the above equations it is possible
to obtain from them that portion of the interaction curve
relating combinations of shear and moment at midlength of
opening to cause collapse of the beam for shear values in
the assumed range Consideration of other locations of stress
reversal will yield expressions from which the remainder of
the interaction curve can be determined
Specifically for 0 ~ kls ~ u kl can be determined as
a function of k2 from equations (9) (10) and (13) and is
given by
32
From equations (7) (8) (11) and (14) a quadratic expression
is obtained for k2 in terms of known quantities and V
Z [AfCSyf ] Vak2 (sw cs ) s + t + k2 ( -d+2h) + A G = 0 (16 )
f yf
For a given value of V equations (12) (15) and (16) can be
used to determine the corresponding values of kl and k2bull Fl
can then be calculated from equation (10) and FIYl from equashy
tion (11) The moment at mid1ength of opening is then detershy
mined from
(17)
Thus for a given value of V a corresponding value for M can
be obtained The values of kl and k2 must be checked when
calculated to determine whether initial assumptions of
o ~ k1s ~ u and 0 ~ k2 ~ 10 have been met Only one solution
to the quadratic equation in k2 will fulfill these requireshy
ments unless both solutions are equal The above equations
will yield a value for M for a given value of V starting at
V = 0 and continuing for increments in V until the location
of stress reversal at section (1) moves into the region where
the reinforcing is attached ie for kls gt u When this
occurs neither solution to equation (16) will yield values
of k1 and k2 that satisfy the initial assumptions and the
33
initial equations for stress resultants at section (1) must
be replaced by new equations reflecting this change Quite
simply equations (10) and (11) are replaced by
respectively for u ~ kls ~ (u+q) Equations (13) and (14)
remain unchanged for section (2) since reversal will occur
only in the flange at this section Thus for u ~ klS ~ (u+q)
ie for reversal within the reinforcing equations (9)
(13) and (18) yield
Similarly from equations (7) (8) (14) and (19)
- (d-2h)]
va u 2( c-w) Go s ( c-w) G
+ + [ _----oiOioV] [ yr IJ = 0 (21)AfGyf Af csyf sw cs- + s c-w) csyr shy
The same procedure is followed as in the previous case
first V being assumed ~ being obtained from equation (12)
34
k2 from equation (21) kl from (20) Fl from (18) FIJl from
(19) and finally from equation (17) the value of M correshy
sponding to the assumed value of V Again the values
obtained for kl and k2 must be checked to assure that the
initial conditions of u ~ kls ~ (u+q) and 0 ~ k2 ~ 10 are
met These equations will yield admissible values of kl
and k2 for values of V increasing from the last admissible
value obtained by solution of the previous set of equations
and continuing to where kls reaches the value (u+q) ie
for stress reversal in the clear web at section (1) ~nen
(u+q) ~ kls ~ s equations (18) and (19) are replaced by
(22)
and equations (9) (13) and (22) give
(24)
While from equations (7) (8) (14) and (23)
(25)
35
For a given value of V a corresponding value for M is
determined in the same manner as for the two previous cases
Acceptable solutions will be obtainable as long as the stress
reversal at section (1) falls within the clear web However
when this reversal occurs in the flange the so-called high
shear solution is indicated
33 High Shear Solution -Case 11
When the shear force is high stress reversal at section
(1) occurs in the flange and the equations for resultant
normal force and moment arm from the edge of the opening
become
Fl = Af ltS f(2k -1) - sw~ - A C (26)Y 1 r yr
The stress reversal at section (2) will still occur in the
flange and equations (13) and (14) are used with the above
equations and equations (7) (8) and (9) to obtain
(28)
(29)
36
For a given value of V a corresponding M is obtained from
the above equations and equations (12) and (17)
By starting with a value of V = 0 and increasing this
by a small increment with each successive iteration correshy
sponding values of M can be found for the full range of V
values by use of the equations in this and the previous
section An interaction curve can then be plotted relating
V and M over their full range of values A typical intershy
action curve is shown in Figure 9 for a beam containing a
reinforced opening where the curve has been nondimensionalized
by division of V and M by Vp and Mp respectively Also
indicated in this curve are the four regions corresponding
to the different locations of stress reversal at the high
moment edge of the opening
34 Limits of Interaction Curves
It is quite possible for the MM values for a certainp range of VV values on the interaction curve to be greaterp than 10 as can be seen in Figure 9 This simply means
that the reinforced opening can be stronger than the unperfoshy
rated beam for pure bending and for bending with very low
shear However values of MM greater than 10 have no realp practical significance because in such cases failure of the
beam would occur not at the opening but at some unperforated
37
portion of the beam near the opening Therefore 10 is
taken as the maximum value of MM and a horizontal line isp drawn at this value from the MM axis to intersect thep interaction curve This is shown in Figure 9
The interaction curve is also limited with respect to
the maximum VV value permissible Since shear forces canp only be carried by the remaining part of the web the maximum
plastic shear capacity at the opening is equal to V thep plastic shear capacity of the uncut section times the ratio
of the remaining clear web to the initial clear web This
is written as
d-2t-2h (6)= d-2t
In other words when the web of the section at the opening
has yielded in shear its normal stress carrying capacity
~ becomes zero The value of V at which this occurs can be
determined from equation (12) and the ratio of this shear
value to Vp is given by equation (6) Vmen this limiting
value of shear is reached it is no longer possible to obtain
additional points on the interaction curve because any
further increment in V would yield an imaginary solution for
~ Rather when(VVp)max is reached a line is drawn from
this last point on the interaction curve perpendicular to
38
the vVp axis This line is the final portion of the intershy
action curve and represents the actual limiting value of
This limiting value of VVp is however not always
reached for all practical sizes of beam opening and reinshy
forcing It is possible for the equations in the previous
two sections to yield values of kl and k2 that no longer
conform to initial assumptions (for any position of stress
reversal) at a shear value less than the maximum predicted
by equation (6) This occurred in some of the cases tested
to confirm the consistency of these equations and was found
to be caused by an imaginary solution to the quadratic in k2
occurring while stress reversal at section (1) was still in
the clear web of the section Stress reversal at section (2)
was as assumed in the flange Consideration of other
locations of stress reversal did not give real answers This
condition was then investigated and it was found that because
of an interdependence of opening length and reinforcing area
either the opening length must be less than a given value or
the reinforcing area greater than another value in order
for the interaction curve to be able to pass this region
The limiting half length of opening a is given by
(30)
39
and is obtained by combining equations (7) (8) (14) (23)
and (24) with ~ equal to zero By eliminating small terms
this may be simplified to
(31)
Alternatively the minimum area of reinforcing required is
given by
A =2 ( 32) r 13
If this requirement is met it will be assured that the
maximum shear capacity of the section will be reached
Physically the interdependence of reinforcing area and length
of opening can be interpreted to mean that as opening length
is increased the secondary bending stresses which are a
function of shear and opening length increase at sections
(1) and (2) to such an extent that unless the reinforcing
area is increased so that it can carry these high stresses
the lower portion of the web is forced to carry such high
bending stresses that little or no shear can be carried by
this portion of the web The shear stress can then no longshy
er be considered to be uniform across the entire web of the
tee section but instead is restricted to the clear web
between flange and reinforcing or to a portion of this area
40
Reaching the maximum value of vVas given by equationp
(6) is not a necessity either for the interaction curve or
for the performance of a given beam and opening A given
interaction curve is still correct if it terminates before
reaching this value of vVp This occurs when the MMp value
decreases rapidly for very small increments in vvp and
becomes zero In this case the last portion of the intershy
action curve is very nearly a vertical line This line then
represents the actual maximum shear capacity for the given
beam opening and reinforcing dimensions Only when a beam
is to perform under high shear conditions and it is desired
to develop its maximum shear capacity is it necessary to
ensure that Ar is large enough so that this value can be
reached
41
CHAPTER IV
APPROXIMATE METHOD
41 General Remarks
If a particular beam and opening size is being investishy
gated over a very limited range of shear values it is a
fairly straightforward matter to calculate the moment capacity
of the beam corresponding to the given shear values using
the equations presented in the previous chapter hven if the
location of stress reversal were consistently assumed in the
wrong region the calculations would have to be repeated at
most four times for a particular shear value However it is
quickly realized that for a large range of shear values or
for a complete interaction curve it would be extremely
laborious to perform these calculations by hand and recourse
to automatic computation would seem almost essential A
computer program has been developed to perform the necessary
calculations for a complete interaction curve for a specified
beam opening and reinforcing size and is given in Appendix A
Since the practical development of a complete interaction
curve is seriously limited by the length of calculations
involved a simple to use approximate method is suggested for
determining the strength of a perforated beam at various
moment to shear ratios In the development of this approxishy
42
mate method the high shear region only is considered for
reasons which will become evident
42 DeveloEment of the Method
Combination of equations (3) (12) and (28) result in
the following expression
(33)
where for simplici ty ~I~- - ~Y= ~~ t the specified minimum
yield stress of the material Similarly equations (1) (17)
(26) (28) and (29) can be combined to give
M d(kl -k2) + t(k~-ki) (34) ~ = a-i) + wtf2t)~
Xf
and from equations (12) (28) and (29) kl and k2 are related
by
(35 )
If it is now assumed that the flange thickness is significantshy
ly less than half of the remaining clear web tlaquo s the
above expressions can be readily simplified Since (u+~) is
43
of the same order of magnitude as t it is also assumed that
(u+~) laquo By eliminating small terms and substituting for
kl+k -l-x = ~ equation (35) can be simplified to2 f
(36)
This simple quadratic can readily be evaluated for~ In
general both solutions will be real although for a wide
range of beam and opening sizes investigated the solution
corresponding to a minus in the quadratic formula was found
to fall within the region of low shear on the interaction
curve (as defined in the previous chapter) while the solution
corresponding to a plus consistently fell in the medium to
high shear region thus satisfying the initial assumptions
This latter solution was therefore considered to be the
correct one and the corresponding value for ~is given by A 2as [ 2 ] 12_2s2( r) + w2(s2~) _ 4A2
IS = If f)Af 3 r ( 37 ) - (s2 + 4a2 )
T
which may be rewritten as
_2~(Ar + l(Aw) ( 2h)2 1 ( r 2 ~ C = 1+01 If) 2 If l-er ~ - 16 X)(l+o)~ (38)
where Aw = wd and 0lt = i(~)2(k - 1)2
Equation (34) can also be simplified by eliminating small
44
terms and by considering that for the transition from low to
high shear to occur kl must equal unity Equation (34) then
becomes
M (39 )M= p AW
1 + 4A f
Similarly equation (33) can be simplified to
(40)
For zero or very small values of ~ the above equation can
yield values of VV greater than the maximum VVp value as p
given by equation (6) This implies that some portion of the
shear is carried by the flanges of the beam Since the flanges
can in fact carry some shear and since the theory as given
in Chapter III is sufficiently conservative for large shear
values (as can be seen from the experimental results given
in Chapter VI) equation (40) is not considered to predict
excessive values of shear capacity and is adapted for use in
this method of analysis The shear capacity is then given
by equation (40) and the corresponding maximum M~Ap value at
this shear value is given by equation (39) where ~ is given
by equation (38)
The maximum shear capacity of the section is given by
45
equation (40) when ~ is equal to zero Solution of equation
(38) for Ar when ~ equals zero gives the required reinforcing
area necessary to reach the maximum shear capacity of a secshy
tion This is given by
- AW(l 2h) flA (41)r - T -a-~
Equation (41) reduoes to equation (32) in Chapter III when
substitution is made for ~ When the reinforcing area
conforms to the above requirement the maximum shear capacshy
ityas given by
V 2hr = (I-a-) (42) p
will be reached and the corresponding maximum moment capacshy
ity at this value of shear is given by
Ar 1 - A
M fr= A p 1 + w
4Af Thus for a given beam opening and reinforcing size if
equation (41) is satisfied equations (42) and (43) together
fix one point on the approximate interaction curve while if
equation (41) is not satisfied this point is fixed by equashy
tions (38) (39) and (40) In either case a line is dropped
from this point perpendicular to the vvp axis thus forming
46
part of the approximate interaction curve The remainder of
the curve is obtained by connecting the point given by equashy
tion (42) and (43) or by equations (38) (39) and (40) with
a point on the M~Ip axis corresponding to the maximum moment
capacity of the section This maximum value of blfvl isp simply the plastic moment of the reinforced perforated secshy
tion divided by the plastic moment of the unperforated secshy
tion and is identical to the same point obtained in the
previous chapter with no shear force acting The maximum
value of Mi1p is given by
Z - wh2 + Arlt 2h+2u+q) = ---------w----------shyZ
or using a consistent approximation for Z this can be
rewri tten as
M A (45 ) M=
p 1 + w4Af
An approximate interaotion curve is given in Figure 9 for
comparison with the interaction ourve obtained by the method
desoribed in Chapter Ill
43 Limitations of the AEproximate Method
The maximum praotical M~lp value for the approximate
47
interaction curve is limited to 10 for the same reasons that
the more exact curve is so limited and a horizontal line
drawn from the MA~p axis at 10 and intersecting the approxshy
imate curve forms its upper portion The maximum value of
VVp for the approximate curve is limited to VVp max given
by equation (42) This limitation has been discussed in the
previous section
Equation (41) specifies the minimum size of reinforcing
necessary to reach the maximum shear capacity of the section
as given by equation (42) yVhen the reinforcing area conforms
to this minimum requirement equation (43) is used to predict
the moment capacity of the section corresponding to the shear
value of equation (42) Examination of equation (43) reveals
that as the reinforcing area is increased past the minimum
given by equation (41) the moment capacity decreases rather
than increases as would be expected from physical considershy
ations or from examination of interaction curves obtained
by the methods of Chapter Ill For sizes of reinforcing
only slightly greater than that given by equation (41)
equation (43) will be sufficiently accurate and will not
significantly underestimate the moment capacity of the secshy
tion although it may be deSirable to replace Ar in equation
(43) with the minimum Ar given by equation (41) Equation
(43) then becomes
48
A 2h l1 - ~(l-a)J~
M ( 46)~= A 1 + W
4Af This may be written more simply as
aw 1 - 73Af
= ---1-shyA 1 + w
4Af The corresponding shear value is given by equation (42)
However as Ar increases more and more above the value
given by equation (41) the moment capacity of the section
will be increasingly underestimated and if more accurate
values are desired recourse must be made to more accurate
methods Examination of equation (38) reveals that as Ar
increases past the value given by equation (41) 0 becomes
negative up to the point where
when the solution for cgt becomes imaginary For values of
Ar lying between those given by equations (41) and (48) ~
is negative and equations (39) and (42) can be used to
accurately predict the point on the approximate interaction
curve from which a perpendicular line should be dropped to
the VVp axis and a line drawn to the point given by equation
(44) on the MM axisp
49
Al though for this case a value exists for (gt equation
(42) rather than (40) is used to determine the shear capacshy
ity of the section This is the only logical approach beshy
cause Ar is greater than that required to reach the maximum
shear capacity and increasing the reinforcing area although
it cannot increase the shear capacity of the section past
that given by equation (42) also should not serve to decrease
this capacity
When Ar is greater than the value given by equation (48)
equation (39) cannot be used to obtain a more accurate preshy
diction of moment capacity because 0 as given by equation (38)
will not be real Consideration of the equations used in
deriving the approximate method leads to the conclusion that
will be imaginary only when the maximum shear capacity of
the section is reached while klslaquou+q) Equation (48) shows
the relation between reinforcing area and size of opening for
this to occur It can be seen that small opening size or
large reinforcing size will eause the maximum shear capacity
to be reached while kls (u+q) When this occurs equation
(42) predicts the shear capacity of the section since Ar is
greater than that required by equation (41) to reach this
maximum shear value At this value of shear ~ equals zero
and equations (17) (20) and (21) in Chapter III reduce to
(49a)
(50)
50
A q (5la )
M = _l_l_qdA_rf=--[2_U_2_+__(2_U_+_q_)_+_2_h_(_2U_+_q_)_-_2_(_k_l_S_)2_-_4_k_l_S_h_J_-_~_~_(_~~)
Mp Aw 1 + 1iA
f
By considering t laquo d equations (49a) and (5la) can be further
simplified to
(49)
(51)
Equations (49) (50) and (51) can then be used with equation (42)
to determine the pOint of intersection of the two lines composing
the approximate interaction curve
44 Summary and Discussion
Determination of the approximate interaction curve can be
summarized as follows
Case I
The maximum shear capacity of the section will be reached
if
A 2 AW(l_ 2h) fT (41)r 4 d 4a where a = ~(h)2(~ _ 1)2 The maximum shear capacity is then4 a 2h bull
given by
V (1 _ ~h) (42)Vp =
51
and the moment which can be attained with this shear acting
is Ar
1- ri- = Af (43)
p 1 + w 41f
where Ar is that given by the right hand side of equation (41)
Case 11
If equation (41) is not satisfied the maximum shear
capacity will not be reached and the shear capacity is given
by
(40)
The moment capacity which can be attained with this shear
acting is
1 1 + w
4Af where ~ is given by
A A _ ~( r) + l( w) ( 2h)2 1 ( r)2 0 ( )~ - 1+ltgtlt Af 2 If l-T 1+CgtI - 16 -x (l+olt)l 38
Case Ill
If Ar is significantly greater than that given by equashy
tion (41) the maximum shear capacity will still be given by
52
but if desired a more accurate estimate of the moment which
can be attained with this shear acting can be obtained as
follows
Case IlIA
For (48)
MMp at maximum VVp is given by
Ar 1 - I - ~
~ = __f_~_ ill A
P 1+ w4If
where r will be negative and is given by
(38)
Case IIIB
For A2 gt (aw) 2
+ (~)2w2 (48)r 3 ~
at maximum VV is given byp A A
1+-f(2h)__1_ JL (ha) (2dh ) (1+ 2dh )Af d 2[j Af (51)
A1 + w
4Af
53
where kl and k2 are given by
+l (50)s
(49)
and only that solution satisfying the conditions 0 ~ k2 ~ 10
and u ~ kls ~ (u+q) is correct
The appropriate one of these three cases can be used to
determine a point on the approximate interaction curve A
perpendicular line is then dropped from this point to the
vVp axis and forms part of the curve The remainder of the
curve is obtained by drawing a straight line from the initial
point to a point on the MMp axis given by equation (44) or
(45) and by then cutting off the approximate interaction curve
at the maximum Mlyenip value of 10 as described in the first
paragraph of this section
Complete and approximate interaction curves for each
size of beam opening wld reinforcing included in the expershy
imental part of this investigation are shown in Figures 10
through 15 A cross-section of the member is shovm on each
curve for reference and the method used in obtaining each of
the approximate curves is stated On Figures 11 14 and 15
the reinforcing size was greater than that given by equation
(41) and both Case I and Case III were used to obtain approxshy
54
imate curves for comparison It can be seen that only when
the reinforcing area was significantly greater than that
given by equation (41) (Figure 11) was there a large difshy
ference in the Case I and Case III values
For the partioular case of unreinforced openings by
substituting for Ar equal to zero in equations (39) and (40)
these reduoe to
M AW 2h 1
1 - 2If(l-or~ r= A (52)
p 1 + w4If
v (2h)JTr = I-d~ p
where ~= i(~)2(~ - 1)2 as before These equations are
identioal to those given by R_GRedwood(17) for unreinforced
openings Again a perpendioular is dropped from the point
defined by these two equations to the vVp axis and another
line is dravln from this point to a point on the MMp axis
given by
111 Z - wh2 (54)r = z
p
thus oompleting the approximate interaction curve for the
case of an unreinforoed opening Using the same approxishy
mations as used previously equation (54) oan be written
55
MM = 1 (55) p
which agrees with Redwoods work and gives a slightly highshy
er value for the maximum MM value A complete and approxshyp imate interaction curve for a section containing an unreinshy
forced opening is given in Figure 12 where the equations
given by Redwood(17) were used for the complete curve
56
CHAPTER V
EXPERIMENTAL INVESTIGATION
51 Selection of Test Beams
As discussed in Chapter I it was decided to limit this
investigation to rectangular openings reinforced with straight
horizontal strips welded above and below the opening It
was also decided to use a standard wide-flange beam rather
than a welded section because of the usual use of these in
building structures where openings are most oommonly requirshy
ed ASTM A 36 structural steel was used throughout all
of the experimental work because this material was used in
most of the previous investigations related to this work
The size of the test beams was chosen on the basis of
economy ease of handling and ease with which reinforcing
bars could be welded in place It was decided to use a secshy
tion that was compact at the specified yield stress and
also at the higher yield stresses expected in the test
beams In the selection of test beams only sections with
low depth to thickness ratios were conSidered in order to
avoid the problem of web instability The flange width to
thickness ratio was also kept as low as possible in order to
avoid premature compression flange buckling On the basis
of these considerations and after a preliminary test pershy
57
formed on a 10VF21 section it was decided to carry out the
remainder of the experimental investigation using a 14WF38
section of A 36 steel The properties of the test beams
used are listed in Table 1 A nominal opening depth to beam
depth ratio of 05 was chosen because of the practical need
for openings of approximately this depth in larger beams and
also because investigations of unreinforced openings were in
this range One test beam included in this work had a nominal
opening depth to beam depth ratio of 0643 A basic opening
length to depth ratiO or aspect ratiO of 15 was chosen
again from practical considerations Two beams were includshy
ed with aspect ratios of 20
The corner radii of the opening had to be large enough
to avoid excessive stress concentrations that might cause
premature cracking of the corners and yet small enough to
not appreciably decrease the effective area of the opening
In previous investigations corner radii ranged from 14 to
one inch A 58 inch radius was used in this study for the
14WF38 beams and a 316 inch radius for the 10WF21 beam
The area of reinforcing for each opening was chosen so
that the moment capacity of the unperforated member would be
equalled or exceeded and the full shear capacity of the net
section could be utilized The moment capacity condition
requires that
58
wh2 gt- (56)2h + 2u + q
This follows from equation (44) The reinforcing area reshy
quired to meet the shear condition is given by equation (32)
in Ohapter 111 It was found that for the 14WF38 beam used
in this investigation with 2hd equal to 05 ~~d ah equal
to 15 the area of reinforcing required to meet these condishy
tions was approximately ~vice that given by the right hand
side of equation (56) One beam was tested in the high shear
range with reinforcing such that the interaction curve fell
short of VVp msx Again it should be mentioned that the
length u is that required for welding the reinforcing in
place and should be as small as possible The width of the
reinforcing bars q was chosen so that the width to thickshy
ness ratio did not exceed 85 as specified by the design
code(910) for ultimate strength design The anchorage
length of the reinforcing bars was also designed by use of
the AISC and OISO design codes on the basis of develshy
oping the full strength of the reinforcing bars at the edges
of the opening The ultimate strength loads were taken as
167 times those for elastic design as recommended by the
codes
The openings in all of the test beams were flame cut
the 10WF2l beam number lA having the corners drilled before
59
cutting and then having the rough edges ground to the proper
size Beams numbered 2A 2B and 3A were entirely poundlame cut
including corners and were not poundinished poundurther The remainshy
ing beams had drilled corners with the rest of the opening
being poundlame cut They were not finished poundUrther
All test beams were simply supported and were loaded with
a single concentrated load The openings were positioned so
as to achieve the desired moment to shear ratios and all
openings were centered at the middepth opound the beam All beams
were locally reinpoundorced with cover plates so as to ensure
poundailure at the openings and web stipoundfeners were added under
the load and at reaction points Local reinpoundorcing was deshy
signed on the basis opound resisting the loads predicted by the
interaction curves plus the expected increase in loads above
this due to strain hardening Beam Sizes opening locations
and local reinpoundorcing are shown in Figures 16 17 and 18 poundor
each opound the test beams
52 Experimental SetuE
All beams were tested in a Baldwin-Tate-Emery 400k
Universal Testing Machine which is a mechanically operated
hydraulic testing machine opound 400k capacity The ends opound the
beam were supported by a specially reinpoundorced 14 inch wideshy
poundlange section that also poundormed part of the lateral bracing
60
system This is shown in Figures 19a and 20a Lateral bracshy
ing consisted of support against horizontal displacement and
rotation at pOints of load and at end reactions Bracing
for the beams numbered lA 2A and 3A was achieved by the
attachment of horizontal 8 inch wide-flange beams to the
vertical portion of the end supports with the 8 inch secshy
tions running the entire length of the test beams on each
side and positioned so that pins could be inserted at bracshy
ing points between the 8 inch sections and the top flange of
the test beam to allow for only vertical displacements of the
test beam The pins were given a heavy coating of grease to
minimize friction This type of bracing proved satisfactory
but made it very difficult to see parts of the test beam durshy
ing the test To alleviate this visual problem beam 2B was
tested with the lateral bracing described above on only one
side of the beam while for the other side vertical bars
attached rigidly to the 8 inch sections and bent to pass
over the test beam were held tightly against the upper flange
of the test beam at bracing points This arrangement proved
unsatisfactory and was not used for subsequent tests
For testing the remaining beams short 8 inch wide-flange
sections were attached vertically to the vertical portion of
the end supports and greased pins were used to provide latershy
al bracing at these locations (Figures 19b and 20b) Lateral
61
bracing at the point of load was provided by roller bearings
- two on each side of the test beam spaced 6 inches apart
vertically and bearing against the web stiffener of the beam
The roller bearings were attached to triangular sections
which in turn were attached to a wide-flange section held
rigidly to the laboratory floor See Figures 19c 20c
and 20d This type of lateral bracing provided nearly
frictionless vertical displacement of the beam while preshy
venting rotation and horizontal displacements and proved
to be very effective Access to the beam during testing
was not at all limited by this bracing system
Deflection dial gauges with a least reading of 0001
inch were used to determine deflections at points of load
end supports edges of openings 2 inches outside each openshy
ing edge and at centerline of beam when possible All dial
gauges were rigidly fixed to non-yielding supports Their
positions are indicated in Figures 16 17 and 18 Four of
the test beams were equipped with electrical resistance strain
gauges in the vicinity of the opening The locations of
these gauges are shown in Figure 21 Each test beam was
painted with an opaque brittle coating of whitewash - a
mixture of lime and water of the consistency of light cream
applied in the vicinity of the opening at least one day before
testing During testing this coating of whitewash flaked
62
off in minute pieces in areas undergoing plastic strains thus
indicating visually which sections of the beam had yielded
The flaking occurred at loads higher than those correspondshy
ing to yielding of each section and did not give an accurate
measure of the onset of yielding but instead gave an estishy
mate of the order in which each of the sections yielded
53 Testing Procedure
Essentially the same procedure was followed in testing
each of the beams The beam was first placed in position on
its end supports a fixed roller under one end and a free
roller under the other The bema was made level and centershy
ed with respect to its loading point and end supports
Lateral bracing was then fixed in place and the head of the
machine brought into contact with the specially hardened
roller through vhich the load was applied to the beam Dial
gauges were then put in position and strain gauge leads
connected to the Budd Automatic Strain Indicator A small
initial load was then applied to the beam and zero readings
were taken for all strain and dial gauges
At least four load increments of either lOk or 20k were
applied within the elastic range with all gauge readings beshy
ing recorded for each load increment When the first inshy
elastic response of the beam was noted either from strain
63
gauge readings on the beams that were so equipped or by
deflection vdth time of any of the dial gauges the load
increment was reduced to 5k and after each load increment was
applied all plastic flow was allowed to take place before
readings were taken To determine whether plastic flow had
ceased at each load increment dial gauge readings were plotshy
ted against time When the S-shaped curve reached its upper
portion and levelled out plastic flow had ceased and readshy
ings were taken During this time required for plastic flow
as much as 30 minutes for higher loads it was important to
hold the load on the beam constant Loading continued in
this manner until the ultinlate collapse of the test beam
either by web buckling at the opening or by tearing of one
or more of the openings corners When this occurred the
beam was no longer able to maintain the applied load The
load was then removed and the beam was taken out of the test
frame
54 Determination of Yield Stresses
In order to accurately access the expected strength of
each of the test beams it was necessary to determine their
actual yield stresses This was accomplished by the testing
of tensile coupons cut from the flange ana web of the beams
and from the reinforcing strip used at the openings The
64
dimensions of a typical tensile coupon are given in Figure 22a
and the locations from which such coupons were taken are shown
in Figure 22b The beams from which coupons were to be taken
were ordered an extra 12 inches long so that this section could
be cut off and tensile coupons made and tested before the testshy
ing of the actual beam Reinforcing strip was ordered an extra
36 inches long for the same purpose Test beams 2A 2B and
3A were all cut from the same beam and were all reinforced
from the same reinforcing strip Test beams 2C 2D 3B 4A
4B 5A and 6A were all cut from the same beam Reinforcing
for beams 2C 2D 4A and 4B was all cut from the same strip
Each of the tensile coupons was tested in either a 20k Riehle
or a 20k Instron Testing Machine Coupons tested in the
Riehle machine were tested under nearly constant load rate
An extensometer was attached to the coupons to automatically
record the stress-strain curves Since the crosshead
position could not be fixed on this particular machine
a static yield stress could not be obtained and therepoundore
only the lower yield stress is given in Table 2 Tensile
coupons tested in the Instron machine were loaded at a
constant cross head speed of 002 inches per minute When
the plastiC plateau was reached the crosshead position was
fixed and the load was allowed to drop off After about five
minutes the static yield stress had been reached and no
65
further change in load could be seen on the automatically
recorded stress-strain curve Straining was then allowed to
continue into the strain hardening range A typical stressshy
strain curve for a coupon tested in this machine is given in
Figure 23 Lower yield and static yield stresses are given
for coupons tested in the Instron machine in Table 2
Either the static yield or the lower yield stresses can
be used in determinimg the expected strength of a test beam
depending on which more closely approaches the actual test
conditions of the beam In this investigation the beams
were tested under loading increments with the loads being
held constant until plastic flow had ceased Since it was
thought that the method of obtaining the lower yield stresses
more closely paralleled the actual testing procedure these
stresses were used in evaluating the expected strength of
the test beams
66
CHAPTER VI
EXPERIMENTAL RESULTS
61 Behavior of Beams during Testing
Since the behavior of all the beams during testing was
quite similar a complete description of only one such typshy
ical beam number 20 is given here Deviations from this
typical behavior are discussed at the end of this section
Beam 20 was first tested elastically to a load of 80k
in lOk increments and was then unloaded Strain gauge and
dial gauge readings were taken at each load increment and
were analyzed After it was determined from these readings
that strain gauges and automatic recording equipment were
in good working order the beam was reloaded this time to
be tested to destruction This check was run for only this
one test beam all others being tested continuously through
elastic and plastic ranges
An initial load of 5k was again applied to the beam and
strain and dial gauge readings taken The load was then inshy
creased to 80k in 40k increments (lOk or 20k increments were
used in all other tests because separate elastic tests were
not performed on these) and then to 120k in lOk increments
With the load held stationary a slight increase of deflecshy
tion with time was noted on the dial gauges at this load so
67
increments were decreased to 5k bull
At l30k slight lateral deflection of the beam at the
opening was noted although this deflection never became exshy
cessive throughout the remainder of the test Strain gauge
readings first indicated yielding at both the bottom edge of
the upper reinforcing bar at the low moment edge of the openshy
ing (Figure 21 gauge 25) and at the top edge of the top
flange at the high moment edge of the opening (gauge 17) at
a l35k load When the load was increased to 140k yielding
occurred at the other top edge of the top flange at the high
moment edge of the opening (gauge 19) At a load of 145k
yielding had occurred at the center of the top flange at the
high moment edge of the opening (gauge 18) and also in the
web at the centerline of the opening (rosette gauge 10 11
12) At 155k the web at the high moment edge of the openshy
ing had yielded (rosette gauge 13 14 15) as had the web at
the low moment edge of the upper reinforcing bar (rosette
gauge 4 5 6) Slight displacement between the ends of the
opening could be seen at a load of l60k and at l65k the
lower edge of the upper reinforcing bar at the high moment
edge of the opening (gauge 20) had yielded
At l70k the upper edge of the upper reinforcing bar at
the high moment edge of the opening had yielded (gauge 21)
thus making the yielding at the high moment edge of the openshy
68
ing complete (based on average strain values for the flange
and reinforcing) While at this load the first flaking of
the whitewash was noted at both the upper low moment and
the lower high moment corners of the opening The web at the
middepth of the beam between the low moment ends of the reinshy
forcing yielded at 175k (rosette gauge 1 2 3) and whiteshy
wash flaking was detected on the underside of the top flange
at the high moment edge of the opening At lSOk the web at
the low moment edge of the opening (rosette gauge 7 S 9)
yielded and whitewash flaking occurred along the web immedishy
ately beneath the upper reinforcing bar from the low moment
corner of the opening to beyond the low moment end of the
reinforcing bar and also in the web above and below the
opening At 185k whitewash flaking occurred at the lower
low moment corner of the opening and in the web immediately
above the lower reinforcing bar from the corner of the openshy
ing to the low moment end of the reinforcing bar Yielding
occurred at the center of the top flange at the low moment
edge of the opening (gauge 23) at 190k and also at the top
edge of the upper reinforcing bar at the low moment edge of
the opening (gauge 26) This made yielding at the low moment
edge of the opening complete (based on average strain values
for the flange and reinforcing) At this same load whiteshy
wash flaking occurred in the web above and below the low
69
moment end of the upper reinforcing bar
The first strain hardening was also indicated from
strain gauge readings at the load of 190k and occurred in
the web at the centerline of the opening (rosette gauge 10
11 12) At 195k whitewash flaking occurred in the web
between the low moment ends of the upper and lower reinforcshy
ing bars Yielding occurred at the lower edge of the top
flange at the high moment edge of the opening (gauge 16) at
200k and strain hardening occurred at the upper edge of the
top flange at the high moment edge of the opening (gauge 17)
and at the lower edge of the upper reinforcing bar at the
high moment edge of the opening (gauge 20)
At 211k a crack developed in the lower low moment corshy
ner of the opening and it was no longer possible to maintain
the applied load The beam was then unloaded and removed
from the test frame The crack which occurred at the corner
radius was one half inch long and was inclined toward the low
moment end of the lower reinforcing bar A photograph of this
beam after completion of the test can be seen in Figure 24
Of the remaining beams in the test series only 2D 3B
and 4B were implemented with strain gauges the others having
only the brittle coating of whitewash to indicate the order
of onset of yielding The first of these beams to be tested
lA was given too thick a coating of whitewash and the flaking
70
of this whitewash during testing was not as satisfactory as
on other tests Similar problems were encountered with 2A
which had to be given a second coating of whitewash because
most of the first coat was rubbed off due to improper handshy
ling of the beam before testing The flaking off of the whiteshy
wash on beam 2B during testing was also not as good as was
expected although the whitewash had not been applied too
thickly This beam was tested on an extremely humid day
and it is thought that the problem with the whitewash flaking
was due to this excessive humidity
The order of onset of yielding as indicated by strain
gauge readings is given for each of the strain gauged beams
(20 2D 3B 4B) in Table 3a while the order of onset of
strain hardening is given for these beams in Table 3b Loads
corresponding to complete yielding of the cross-sections are
also given The order of whitewash flaking for each of the
beams is given in Table 4 Ultimate loads are also given
along with the mode of collapse of the beam
Of the eleven beams tested all but one were tested to
collapse The test of beam lA was terminated when deflecshy
tions became excessive although no web buckling or tearing
of corners had occurred and the beam was still able to mainshy
tain the applied load Only one of the beams tested to
collapse ultimately failed by web buckling This was the
beam with the unreinforced opening 6A All of the other
71
beams suffered ultimate collapse by the tearing of one or two
of the corners of the opening Beams 2A 2B 2C 3A 4A 4B
and 5A developed cracks at the lower low moment corners of the
openings Beam 3B cracked at the upper high moment corner of
the opening and beam 2D developed cracks at both the lower low
moment and the upper high moment corners of the opening simulshy
taneously Photographs of each of the test beams after collapse
are shovm in Figure 24 Comparison photographs of the beams for
variable moment to shear ratio reinforcing size aspect ratio
and opening depth to beam depth are given in Figures 25 and 26
62 Stress Distributions and Failure Loads
Based on measured strains stresses were calculated for
beams 2C 2D 3B and 4B Elastic stresses were determined
from the usual elastic theory while plastiC stresses were
determined from plasticity theory presented by Hill(8) and
reduced to the form given by Bower(l6) Initiation of strain
hardening was also determined from this method which is
summarized in Appendix B
Stress distributions at the high and low moment edges
of the opening of beam 2C are shown in Figure 27 while those
at the centerline of the opening and across the flange at the
high moment edge of the opening are given in Figure 28 The
variations in bending stress across the length of the opening
72
at the center of the top flange and at the top of the upper
reinforcing bar are shown in Figure 29 Figure 30 shows the
stress distribution at the high and low moment edges of the
opening for beam 3B and the stress distributions at the high
moment edge of the opening of beams 2D a~d 4B are given in
Figure 31
Experimental failure loads for each of the test beams
were determined from the load-deflection curves for each
test as described in Chapter 11 These curves and their
corresponding failure loads are given in Figures 32 through
42 Interaction curves based on the analysis presented in
Chapter III were dravn for each of the test beams using the
actual measured dimensions and yield stresses for each beam
The experimentally deterrQined failure loads were plotted on
these curves which are given in Figures 43 through 50
Approximate interaction curves for nominal dimensions and
yield stresses are also included in these figures
63 Other Factors
Of the eleven beams tested only one underwent signifshy
icant lateral buckling during testing Beam 2B buckled
laterally at the high moment edge of the opening due to the
inadequate lateral support provided as described in Chapter
V However final collapse of this beam was due to the tearshy
73
ing of one of the corners of the opening and not to the
lateral buckling Also the lateral buckling was not
significant until after the very high loads associated with
strain hardening were reached The modified lateral support
system shown in Figures 19b and c and 20bc and d and discussshy
ed in the previous chapter effectively prevented lateral
buckling of the remaining test beams and no further diffishy
oulties were encountered due to this factor
For each of the test beams lateral deflections were
largest at the high moment edge of the opening although they
never became significant except in the case of beam 2B A
curve showing lateral deflection at the high moment edge of
the opening versus shear force at the opening is given for a
typical test beam 20 in Figure 51 The shear corresponding
to the experimental failure load is indicated on the curve
and the laterally unsupported length of the beam is given
The laterally unsupported length of the test beams did not in
any case exceed the lengths specified by the design codes(9 10)
Local buckling of the top flange occurred at the high
moment edge of the opening for several of the beams tested
although this buckling always occurred at very high loads
after considerable strain hardening had taken place Figure
52 shows the difference in strain readings between the upper
and lower edges of the flange at the high moment edge of the
74
opening versus the shear force at the opening for a typical
test beam 20 The distribution of stresses across the width
of the flange at the high moment edge of the opening (Figure
28b) show a relatively uniform distribution up to yielding
at this location However the effects of local flangebull
buckling can be seen by the considerably higher compression
stresses at the edges of the flange at very high values of
shear
The nine beams containing reinforced openings which were
tested to destruction all exhibited an effect which was preshy
viously unexpected The strain gauge readings for rosette
gauges 1 2 3 and 4 5 6 on beam 20 (Figure 21) as well as
the whitewash flruring on all nine of these beams indicated
widespread yielding of the web between the low moment ends of
the reinforcing bars This effect occurred at loads near the
experimental failure loads of the beams but did not interact
with the development of hinges at the corners of the openings
because of the extension of the reinforcing bars well past
the edges of the openings In addition to the shear yielding
in the web between the low moment ends of the reinforcing
bars the whitewash flaking on beams 2D and 4A also indicated
the same type of yielding occurring at slightly higher loads
in the web between the high moment ends of the reinforcing
bars The whitewash flaking in these areas was sufficient
so that it can be seen in some of the photos in Figure 24
75
The shear yielding that occurs in the web between the
ends of the reinforcing bars may be due at least in part to
the development of the strength of the reinforcing bar withshy
in a short part of its anchorage length Considering the
reinforcing bar in compression above the opening it can be
seen that since its strength must increase from zero at the
ends the unbalanced compression force in the beam causes a
shearing force to occur in the web which at the low moment
end of the reinforcing is additive to the existing shears
(due to the vertical shear force on the beam) below the reinshy
forcing and subtracted from those above This is illustrated
in Figure 53 In the same manner the shears resulting from
the tension in the lower reinforcing bar act in the same
direction as and are added to those in the web between the
reinforcing bars while being subtracted from those in the web
between reinforcing and flange At the high moment ends of
the reinforcing bars the same effect can occur since the top
reinforcing bar is usually in tension while the lower bar is
in compression Again the shears between the reinforcing bars
are increased while those between reinforcing bar and flange
are decreased This would account for the yielding in the web
between the low moment ends of the reinforcing bars for all
of the reinforced beams tested to collapse as well as explaining
76
the yielding in the web between the high moment ends of the
reinforcing bars for beams 2D and 4A
77
CHAPTER VII
ANALYSIS OF RESULTS
71 Order of Onset of Yielding
Comparison of the order of onset of yielding as detershy
mined by strain gauge readings and whitewash flaking in
Tables 3 and 4 indicates that the whitewash flaking is a
reliable method of estimating the order of onset of yieldshy
ing Actually since the strain gauges were only at scattershy
ed locations while the whitewash covered the entire area
around the opening the whitewash flaking is a considerably
more complete guide to the order of onset of yielding It
can also be said that yielding begins first at the corners of
the opening as indicated by the whitewash consistently
flaking first at these locations even though it was impossishy
ble to confirm this by strain gauge readings since gauges
could not be fitted in these locations
The yielding patterns clearly indicate that failure of
the beams occurred by complete yielding of the cross-sections
at the edges of the openings ie at the assumed hinge
locations The formation of hinges at these locations was
accompanied or followed by the shear yielding of all or part
of the web along the length of the opening and by the shear
yielding of the web between the low moment ends of the reinshy
78
forcing bars and in two cases also between the high moment
ends of the reinforcing bars The increase in load past the
formation of the first hinge is accompanied by localized
strain hardening Since the corners of the opening yield
considerably before other locations strain hardening probshy
ably begins at these corners well before the first hinge is
completely formed Yielding in the web above and below the
opening does not seem to become complete until considerable
rotation has occurred at the hinge locations The complete
yielding of the web in these areas would indicate that the
full shear capacity of the member is utilized
72 Stress Distributions
Experimental bending and shear stresses are shown for
each of the strain gauged beams (20 2D 3B 4B) in Figures
27 through 31 Straight lines have been drawn through pOints
representing measured stresses although this does not mean
that the variation is necessarily linear Examination of
each of these stress distributions shows that stresses inshy
creased in proportion to increasing loads while the stresses
were still elastic While in the elastic range the neutral
axis remained in approximately the same pOSition but startshy
ed to move after the first yielding had occurred at each
cross-section This is as would be expected
79
Since strain gauge readings were not available for the
edges of the opening it is impossible to follow the complete
progression of yielding for the various cross-sections from
strain gauge readings However since it is lcnown from the
whitewash flaking on the test beams that yielding occurs
first at the corners of the opening where stress concentrashy
tions are high it can be said that at the low moment edges
of the openings (beams 2C and 3B) yielding began first at the
corners of the opening and then progressed to the reinforcshy
ing bars and web before the flange yielded At the high
moment edges of the openings yielding in the flange occurrshy
ed at lower shear values This would be expected from conshy
siderations of the total stresses (primary bending stresses
plus secondary bending stresses due to Vierendeel action) at
the cross-section in question At the flange the secondary
bending stresses are added to the primary bending stresses
at the high moment edge of the opening but subtract from the
primary bending stresses at the low moment edge of the openshy
ing The experimentally determined stress distributions at
the high and low moment edges of the openings are completely
compatible with those assumed in the development of the
theory in Chapter III (Figure 8) Bending stress distribushy
tions along the length of the opening at the top of the upper
reinforcing bar and at the centerline of the top flange show
80
the expected high stresses at the edges of the opening due
to the secondary bending stresses (Figure 29)
Comparison of stress distributions with those presented
by Bower(16) for beams with unreinforced rectangular openings
shows that the addition of horizontal reinforcing bars above
and below the opening changes the position of the neutral
aXiS but does not alter the location where the highest
stresses occur and plastic hinges consequently form The
order of the onset of yielding is also similar to that
found by Bower as was expected
73 Failure Loads
In Table 5 experimentally determined failure loads are
compared to those predicted by the theory presented in
Chapter III for each of the test be~~s Examination of this
table shows that although the theory may be considered someshy
what conservative in high shear for low shear the correlashy
tion between theory and experimental is good and in no case
did the theory overestimate the actual strength of the beam
Table 6 shows the comparison between experimental failure
loads and those predicted by the approximate analysis for
nominal beam dimensions and yield stresses It can be seen
from this table that the approximate method is less conservshy
ative in the high shear region while still not overestimating
81
the strength of the beam An added margin of safety also
exists because the additional strength of the beam due to
strain hardening has not been taken into account This extra
strength is an added safeguard against total collapse even
though it is accompanied by excessive deformations and finalshy
ly involves tearing or pOSSibly buckling
Experimentally determined failure loads are compared
with loads corresponding to complete yielding of cross-secshy
tions for the strain gauged beams (20 2D 3B 4B) in Table
7 It can be seen from this comparison that experimentally
determined failure loads are close to those corresponding to
the complete yielding of the cross-section at the high moment
edge of the opening while loads corresponding to the complete
yielding of the cross-section at the low moment edge of the
opening are considerably higher This can be accounted for
by the considerable amount of strain hardening that is
suspected of occurring at the corners of the opening before
complete yielding of the low moment edge and possibly also
the high moment edge of the opening occurs Complete yieldshy
ing of cross-sections at the high and low moment edges of
the openings are also compared with the theoretical loads
predicted by the analysis of Chapter III in Table 8 Again
the correlation is reasonably good
The performance of each of the test beams was as expectshy
82
ed With the exception of the shear yielding which occurred in
the web at the ends of the reinforcing bars as discussed in
Section 63 The method used in determining experimental
failure loads has been shown to be justifiable on the basis
of the good correlation between these loads and those correshy
sponding to complete yielding of cross-sections at high and
low moment edges of the opening (considering that strain
hardening has not been taken into account) On the basis of
comparison with experimental failure loads the theory develshy
oped in Chapter III has been shown to adequately predict the
performance of a given beam under varying moment to shear
ratios (although conservatively at high shear) The approxshy
imate method as developed in Chapter IV has been shown to
predict beam strength with accuracy adequate for design
purposes (assuming a suitable factor of safety is used)
14 Influence of Reinforcing and Other Variables
As can be seen from comparison of the experimental
results from test beams 2A 3A and 6A and those for beams 2B
and 3B there is a definite increase in beam strength with
the addition of horizontal reinforcing bars As predicted by
the theoretical analysis of Chapter Ill the maximum shear
capacity of a perforated section as given by equation (6)
can be reached by the addition of a certain minimum amount
83
of reinforcing as given by equation (32) If no reinforcing
or an amount less than that required by equation (32) is used
the maximum shear capacity cannot be reached This is conshy
firmed by the result of the tests on beams 2A 3A and 6A
For higher moment to shear ratios the increase in strength
with increased reinforcing size is adequately predicted by
the analysis in Chapter 111 (and also by the approximate
method of Chapter IV) This is confirmed by the tests on
beams 2B and 3B The increase in strength with the addition
of reinforcing bars and with the further increase in the
size of this reinforcing cen be seen by superimposing the
interaction curves of Figures 10 11 and 12 as has been done
in Figure 54
The influence of the magnitude of moment to shear ratio
on the strength of a beam of given size opening and reinforcshy
ing dimenSions is adequately predicted by interaction curves
generated by the method of Chapter 111 and by the approximate
interaction curves as in Chapter IV This is confirmed by
test series 2A 2B 20 2D series 3A 3B and by series 4A
4B See Figures 55 56 and 57
An increase in aspect ratio everything else being held
constant results in a decrease in strength of the beam This
is predicted by the interaction curves in Figures 10 and 13
which are superimposed in Figure 58 for easy reference and
84
is confirmed by the tests on beams in series 2A 4A and
series 2B 4B An increase in hole depth also has the effect
of lowering the strength of the member all other variables
being held constant This is predicted by the interaction
curves in Figures 10 and 14 which are superimposed in Figure
59 and is confirmed by the tests on beams 20 and 5A
The test results have also been plotted in Figures 54
through 59 but because of the variation in the sizes and
yield stresses of the actual test beams these results have
been plotted on the curves (which are based on nominal
dimensions and yields) on the basis of percent difference
be~veen the experimental failure loads of the test beams
and the values predicted by the exact interaction curves
(from measured beam dimensions and yield stresses)
85
CHAPTER VIII
CONCLUSIONS AND RECOMMENDATIONS
81 Conclusions
On the basis of the results and discussion presented in
the previous chapters the following conclusions can be
drawn
1 The flaking off of the brittle coating of whitewash on
the beams during testing is an accurate indication of
the order of onset of yielding although it does not inshy
dicate at what loads yielding actually occurs
2 High stress concentrations exist at the corners of
rectangular openings even when horizontal reinforcing
bars have been added above and below the opening
3 Failure of a beam under moment gradient containing a
single rectangular opening reinforced with horizontal
reinforcing bars above and below the opening occurs by
the formation of a four hinge mechanism the hinges
occurring at cross-sections at the edges of the opening
Ultimate collapse of such a beam occurs by the tearing
of one or more of the corners of the opening provided
the beam has sufficient lateral support to prevent
lateral buckling
4 With the development of the four hinge mechanism large
86
relative displacements take place between the ends of the
opening accompanied by full or partial shear yielding in
the web above and below the opening This yielding when
it occurs over the entire web area is an indication that
the full shear capacity of the section is utilized
5 Because of the shear yielding that occurs in the web beshy
tween the ends of the reinforcing bars the extension of
these reinforcing bars past the ends of the opening (while
designed on the oasis of developing the weld strength)
should not be less than a certain length (as yet undetershy
mined but probably about three inches for the size beam
and openings tested) due to the possible interaction of
the web yielding with the yielding at the corners of the
opening
6 The stress distributions assumed in the analysis in Chapshy
ter III are completely compatible with those found at the
high and low moment edges of the strain gauged test beams
The large influence of the secondary bending moments (due
to Vierendeel action) is confirmed by these stress
distributions
7 The interaction curve resulting from the analysis in
Chapter III predicts with reasonable accuracy the strength
of a beam with given opening and reinforcing size at any
combination of moment and shear This method is however
87
conservative at high shear values
8 The approximate method developed in Chapter IV also preshy
dicts with reasonable accuracy the strength of a beam
with given opening and reinforcing size for the full
range of moment and shear values and is less conservshy
ative at high values of shear
9 Due to the fact that the theory neglects the effects of
strain hardening there is a built in margin of safety
against complete collapse of the member although an
increase in load past the predicted failure load is
accompanied by excessive deformations
10 The correlation obtained between experimentally detershy
mined failure loads and loads corresponding to complete
yielding of cross-sections at the high moment edge of
the opening for the strain gauged beams suggests that
the method used in determining the experimental failure
loads is justifiable Comparison of experimental failure
loads with loads corresponding to complete yielding of
the cross-section at the low moment edge of the opening
would not be expected to be as good because of the strain
hardening that is assumed to occur at the corners of the
opening before this section is completely yielded
11 The addition of horizontal reinforcing bars above and
below a rectangular opening in a beam definitely increases
88
the strength of the beam If greater than a predictshy
able minimum area this reinforcing will make it possible
to achieve the full shear strength of the section as
given by equation (6) Any further increase in reinforcshy
ing size results in a further increase in the moment
capacity of the member for a given value of the shear
force
12 For a given size beam an increase in aspect ratio (openshy
ing length to depth) results in a decrease in the strength
of the beam over the full range of moment to shear ratios
if all other factors are held constant An increase in
the opening depth to beam depth ratio also has the same
effect all other variables being constant
13 The test performed on beam 6A containing the unreinshy
forced rectangular opening further confirmed the analysis
presented by Redwood(17 18) for beams containing single
unreinforced rectangular openings in their webs
82 Recommendations for Design
Based on the good agreement between experimental results
and failure loads predicted by the approximate interaction
curve it is recommended that the approximate method as
described in Chapter IV be used for design purposes assuming
that a suitable factor of safety is used The ease with
89
which the necessary calculations can be carried out makes
this method extremely practical The use of this method can
be outlined as follows When it is decided to cut an openshy
ing in the web of a beam for the passage of utilities the
necessary size of opening should first be determined and an
approximate interaction curve constructed for the beam conshy
taining an unreinforced opening by using e~uations (52) (53)
and (55) Mp and Vp should be calculated from equations (1)
and (3) respectively A line should then be drawn from the
origin at the particular moment to shear ratio which repshy
resents the actual position of the proposed opening in the
beam and extended to intersect the approximate interaction
curve The intersection of this line with the interaction
curve then represents the capacity of the beam if the openshy
ing is not to be reinforced If this capacity is less than
that required it is necessary to reinforce the opening
and reinforcing should be chosen on the basis of satisfying
the inequality of equation (41) The reinforcing should be
chosen so that the right hand side of equation (41) is not
greatly exceeded An approximate interaction curve for a
beam containing an opening with this size reinforcing can
then be constructed by using equations (42) (43) and (45)
where Ar is given by the right hand side of equation (41)
The intersection of the MV line with this approximate intershy
go
action curve then gives the capacity of the beam with this
size reinforcing If this exceeds the required capacity of
the section this size reinforcing should be adopted
However if the required capacity of the beam is greater
than that given by the approximate interaction curve two
possibilities may exist If the required shear is greater
than the maximum shear capacity of the section as given by
the vertical line on the approximate interaction curve or
by equation (42) then either shear reinforcing must be
added or the depth of the section increased in order to
provide the required strength If however the required
shear capacity is not greater than that given by equation
(42) but the point representing the required capacity of the
beam on the MV line lies outside the apprOximate intershy
action curve the area of reinforcing should be increased
above the value given by equation (48) and a new approximate
interaction curve constructed using equations (42) (45)
(49) (50) and (51) If the required capacity is still
greater than that given by this new approximate interaction
curve the reinforcing size would have to be further increased
until the reinforcing is such that the required strength is
provided The reinforcing size that meets this requirement
should then be adopted for use
91
83 Reoommendations for Future Work
With the completion of this study on the ultimate
strength of beams containing single rectangular openings
reinforced with straight reinforcing bars above and below
the openings it is logical that attention would turn to
similar studies for other commonly used opening shapes in
particular circular and extended circular openings with
horizontal reinforcing bars Also of interest would be an
ultimate strength investigation of reinforced closely spaced
multiple openings of rectangular or circular shape
Since the decision to cut and reinforce an opening in
the web of a beam is based primarily on economic considershy
ations an investigation into reducing the cost of reinshy
forced openings would be very much justified As the cost
of welding is paramount among the other factors involved in
reinforcing an opening reducing the e~mount of welding is
desirable If the horizontal reinforcing bars used in the
present study were doubled in size and welded to only one
side of the web above and below the opening the cost of
reinforcing would be almost halved while the same area of
reinforcing would be available for resisting the shear and
moment forces on the section However other factors such
as twisting moments would have to be taken into conSideration
due to the asymmetry of the section about its vertical axis
92
that would result from this type of reinforcing arrangement
An investigation of the ultimate strength of wide poundlange
sections containing large rectangular openings reinforced
with one-sided straight horizontal bar reinforcing has
already been initiated at McGill University
More information is also needed on the anchorage of the
reinforcing bars It would be desirable to determine at
what length such reinforcing is capable opound assuming its full
load An investigation of the required extension of reinshy
forcing bars past the ends of the opening to prevent preshy
mature poundailure due to interaction between hinge formation
and web yielding at reinforcing ends is also necessary
93
1)
) )J + 1 +1 I I
I
( a) (b)
I + --+--~+ -f--- -shy
I (c) (d)
II I I
I I j+shy
) 1)I l J I
(e) ( f)
Types of Reinforcing
Figure 1
94
primary bending stresses
secondary bending stresses
Stress Distribution at Opening
Figure 2
Ql ID Q)
Jt p ID
er
I I I I I I I
E I I I poundy Ipoundst strain
Idealized Stress-Strain Curve for structural Steel
Figure 3
---------- -----
95
MM unperforated beam no interaction
10~----~==~==~L---------------------~
~
unperforated beam including interaction
10 vVp
Interaction Curve - Unperforated Beam
Figure 4
-- -----------
96
deflection Pure Bending
(a)
~ o
r-I
deflection Bending with Shear
(b)
Load-Deflection Curves
Figure 5
97
1O~------------------------------------------~
l I
unperforated beamshy
shy
I r perforated beam
no interaction
----------- perforated beam l including interaction I I I I I I I I I
I I
Interaction Curve - Perforated Beam
Figure 6
i
98
1 CD (2) TIT
L
( a)
b
d2
(b)
Hinge Locations and Cross-section of Member
Figure 7
99
( a)
(S r CSyr+
tltS ltl direct shear direct shear
Stress Distribution at CD Stress Distribution at CD (for reversal in reinforcing)
Case I - Low Shear
+
CSyr ltS shy
direct shear
Stress Distribution at CD
Case 11 - High Shear
(b)
Stress Distributions and Resultant Forces
Figure 8
100
low highshear shear
I Ml4p k--~_____U_k-----LS_~_(_U_+-=q-)_____-L (u+q)kl s~s
I I r I I
I I I 1 I10
~-int eraction II curve 11
11
11 I I 11 I I
- I - I Iapproximate ~
interaction curve------ - 1
11~I11
i I I
I (d-2h-2t)I_~ I
d-2t 11
(1 -~) q
Interaction Curve Showing Low and High Shear Regions
Figure 9
101
14D38 7 x lof Opening
6 bull77611 x ~middotReinforcing 1 0513
03~
CH 125 1412700
0313 =--9F 0375 =Jb
approximate method ---l------ Case 11
04 vVp
Interaction Curve - 14WF38 Nominal
Figure 10
102
14WF38 7 x 10r Opening 6776 05132tbull
x e 3middot
Reinforcing
1412 11
10
approximate method Case I
04
Interaction Curve - 14WF38 Nominal
Figure 11
103
14WF38 7 x 10f Opening
0513No Reinforcing
MMp
10
-----approximate method for unreinforoed opening
04 VVp
Interaction Curve - 14WF38 Nominal
Figure 12
104
l4WF38 7 x l4~ Opening1pound x tReinforcing
Iapproximate method Case 11
I I I
04
Interaction Curve - l4WF38 Nominal
Figure 13
105
14WF38 9X 13- Opening lmiddotfx p Reinforcing
0513
1412
~-approximate method ~ Case IIIB
approximate method Case I
04
Interaction Curve - l4WF38 Nominal
Figure 14
106
10WF2l
5 x sf Opening 034(iIf x iWReinforcing t~l0240
CH h
55Q 125 990 025Q 0250~
approximate method ~ Case IlIA
approximate method I Case I
I I I
04
Interaction Curve - lOWF2l Nominal
Figure 15
107
43 11 39 18 0 (
I
I I i lA
26
I
111 99 I- middot1 t
22 2-S 45 J
) C
r I
2A
13 ) lA I ~
I)II45 35 ( ()
I
I
I If 2B
f 16~ 9 25 I2t~ 21-+1 1 1 i
30 11 24 27 0- 10- ro- )
I ~ I I
20
2119YlO 151( 21~fI211~ - rr I I
Test Beam Dimensions and
Dial Gauge Looations
Figure 16
108
tI
2D
22tl 231 45 tlI
( l (
I
3A
3119 Yt 11~ 34ft J3n~
45 25 J 35 ) (~ i-
I
I 1 3B
H 25 ft2ft5 cI 16 J2++ I I1 I
t 0- 23 45 J0- 0- (
I 4A
~5 ( 32 J211~ 2 YYt -IIII
Test Beam Dimensions and
Dial Gauge Locations
Figure 17
log
45 ~ 25 5S ) ~ (
4B
2 crYI 15 25 J-I2++ Irr
L J30 24 27 ~lt) (P-L
I 5A
2tYY 13 26211 1 I
22 6
6A
i
Test Beam Dimensions and
Dial Gauge Locations
Figure 18
--
110
If JL
a (1) p 02 ~
Cfl
tlOO ~ r-I 0 0 Q)
m ~ ~
Q SoOM
r-I Xl m ~ (1) p cD H
r-shy
~ ishy fO I- It
111
o N
-()
112
~ --- ~
~
~~ ~~
II I of
rf
A tshyshy I
1
ID I ~ I 0I middotrt
a1 +gt
- -l~ 0 ()
-t I H CJ
4gt 4gt bO ~
~ ~ Cl -rt
fiI
~ a1 ~
+gt CJI
~ amp ~ ~ ~ --- ~ I
II s I
~CJ~ 4t ~
I~ i ~
o
i-~ ~ - l
II I +1 I Ij
~I r
I tf~ft N
- shy
stress 8 1
lower Yield-lt ~i == 11 static yield-shyI l- 2 1 2 ~
( a)
F F-CL F-E [(4 ~
W-H- - shy
strain ( b)
Tensile Coupons Stress-Strain Curve from Instron Testing Machine
Figure 22 Figure 23 I- I- vJ
I
114
lA 2A 2B
20 2D 3A
3B 4A 4B
5A 6A
FIGURE 24
115
2B 20 2D 3A 3B 4At 4B
Variable Moment to Shear Ratio
20 5A
Variable Opening Depth to Beam Depth
FIGURE 25
116
2A 4A 2B 4B
Variable Opening Length to Depth
2B 3B
Variable Reinforoing Size
FIGURE 26
bullbull
117
Notes Shear force shown in kipsbott of flange bull Elastic o Yielded
r ~ 3
o
top of reinf
boundaryof opening bott of reinf~ ioiiIo ~_ 10 o 10 ~ ~ - Dending Stress Shear Stress
Ca) Stress Distribution at High Moment Edge of Opening - 20
~ bull
~ ~ boundary ~ of opening~
-0 I) 10 40 o to lO ~ Sending Stress Shear stress
(b) Stress Distribution at Low Moment Edge of Opening - 20
Figure 27
118
boundaryof opening
-70 0 __ tQ
Bending Stress Shear Stress
Ca) Stress Distribution at Oenterline of Opening - 20
-1iCgt
~I--=-shyoo---~-=-~ogt---- ---0 - ____ A~Sshy-
middot------------e----- ~~~ ~_______~-----Lr---t-o~p~of flangeo
oE
Cb) Bending Stress Distribution Across Flange at High Moment Edge of Opening - 20
Figure 28
119
-40
-lt0 lt----- shylow
moment edge gtgt bull
lt 0
high54 boundary of opening moment
edge ltgtgt
to
Ca) Bending Stress Distribution Across Length of Opening at Top of Flange - 20
high moment
edge
o
Cb) Bending Stress Distribution Across Length of Opening at Top of Reinforcing - 20
Figure 29
120
boundary---~~~~~~~~___ of Opening
o10 D
Bending Stress Shear Stress
(a) Stress Distribution at High Moment Edge of Opening - 3B
ibull
boundaryof opening
10 Igt lO
Bending Stress Shear Stress
(b) Stress Distribution at Low Moment Edge of Opening - 3B
Figure 30
bull bull bull bull
121
11 9 ~ oS j j ~
boundaryof opening
-lt10 -20 lt) -I-Lo Q lO 10
Bending Stress Shear Stress
(a) stress Distribution at High Moment Edge of Opening - 2D
boundaryof openin
-40 -20 0 ZO o 10 ZQ 30
Bending Stress Shear Stress
(b) Stress Distribution at High Moment Edge of Opening - 4B
Figure 31
122
Test Beam - lA
O6in relative defleotion between opening ends
Figure 32
Test Beam - 2A
O6in relative deflection between opening ends
Figure 33
123
lateral buckling - highmoment edge of opening413k-- shy
Test Beam - 2B
O6in relative deflection between opening ends
Figure 34
bull first strain hardening --~ complete yielding - low
moment edge of opening-J- -- --shy
J complete yielding - high moment edge I of opening I ----first yielding
Test Beam - 20
O6in relative deflection between opening ends
Figure 35
124
---- complete yielding - high moment edgeof opening
first yielding
Test Beam - 2D
O6in relative deflection between opening ends
Figure 36
Test Beam - 3A
O6in relative deflection between opening ends
Figure 37
125
k ---shy497 ---~ --1shy complete yieldingI J
---- first yielding
O6in
Figure 38
O6in
Figure 39
- high moment edge of opening
Test Beam - 3B
relative deflection between opening ends
Test Beam - 4A
relative deflection between opening ends
126
430k--shy
k445--shy
---f-----shy ----complete yielding shy
I ----first yielding
06in
Figure 40
O6in
Figure 41
high moment edgeof opening
Test Beam - 4B
relative defleetion between opening ends
Test Beam - 5A
relative deflection between opening ends
127
k45 o-~--
Test Beam - 6A
O6in relative deflection between opening ends
Figure 42
128
10 shy
10WF21
5t x ampf Opening If x t Reinforcing
~~approximate interaction ~ nominal dimensions and
~ ~
+~ ~ ~
I interaction curve ---I Imeasured dimensions and yields I
I I
04
Interaction Curves - Test Beam lA
Figure 43
curve yields
129
14WF38 7 x lot Opening
bull SIt x a Reinforcing
~-----approximate interaction curve nominal dimensions and yields
interaction curve-------- I
measured dimensions and yields
bull
Interaction Curves - Test Beams 2A and 2B
Figure 44
130
l4WF38 f x 10i Opening 11 x middotf Reinforcing
10 - ~approximate interaction curve nominal dimensions and yields
interaction curve----~ measured dimensions and yields
04
Interaction Curves - Test Beams 2C and 2D
Figure 45
10
131
l4WF38 7middotx lof Opening 2f x ~uReinforoing
approximate interaction curve nominal dimensions and yields
~
1 +3A
I interaction curve -------J
measured dimensions and yields
04
Interaction Curves - Test Beam 3A
Figure 46
10
132
14WF38 7 x lOi~ Opening2f x ~ Reinforcing
~ ~approximate interaction curve ~~ nominal dimensions and yields
~ ~ ~ ~ ~
I I
interaction curve ------I measured dimensions and yields
04
Interaction Ourves - Test Beam 3B
Figure 47
10
133
14WF38 H
7 x 14 Opening 1t x Reinforcing
-~
~~approximate interaction curve ~ nominal dimensions and yields
~ ~ +4B
~ ~ ~
~ interaction curve-----l measured dimensions and yields I
I I
04
Interaction Curves - Test Beams 4A and 4B
Figure 48
134
14WF38 9 x 13t~ Opening lix ~uReinforcing
10 --~ ~~approximate interaction curve
nominal dimensions and yields
~ ~
SAl
interaction curve measured dimensions and yields
04 vVp
Interaction Curves - Test Beam 5A
Figure 49
10
135
14WF38 7 x lof Opening No Reinforcing
r----approximate interaction curve nominal dimensions and yields
+ 6A
----interaction curve measured dimensions and yields
04
Interaction Curves - Test Beam 6A
Figure 50
136
shear (kips)
70
60
---- shear corresponding to experimental failure
50
40
30
20
laterally unsupported length = 54 inohes10
40 80 120 160 200 240
lateral deflection (in x 10-3 )
Lateral Deflection at High Moment Edge of Opening - 20
Figure 51
137
shear (kips)
70
60
------------shear oorresponding to experimental failure
50
40
30
20
10
4 8 12 16 20 24 28
strain differenoe at top flange (inin x 10-3)
Flange Buokling at High Moment Edge of Opening - 20
Figure 52
138
D f
P --IL-=====bull--Jf--P + dP
Shear Stresses at End of Reinforcing
Figure 53
139
l4WF38 7 x lot
Opening
3shy10 f ~--2f x e
Reinforcing
If x ~ Reinforcing
+3A +2A
No Reinforcing + 6A
04
Variable Reinforcing Size
Figure 54
140
14WF38 7 x lof Opening If xl-Reinforcing
+ 2B
+20
+2A
+2D
04 vVp
Variable Moment to Shear Ratio
Figure 55
141
14WF38 7x 10f Opening2i x iReinforcing
10 ---------- shy
+3B
+3A
04 vVp
Variable Moment to Shear Ratio
Figure 56
142
14WF38 7x 14~Opening 1f x f Reinforcing
+ 4B
+ 4A
04 vVp
Variable Moment to Shear Ratio
Figure 57
143
14WF38 1thx imiddotReinforCing
7 x lot Opening
7 x 14 Opening---
04
Variable Aspect Ratio
Figure 58
144shy
14WF38
------7middot x 10i Openinglift x ~~Reinforeing
9 x 13f Opening +20 Ii x i Reinforoing
+5A
04
Variable Opening Depth to Beam Depth
Figure 59
--
r b --1 t l=Ii= W
d
u q
Beam Size ~ d b t w 2a 2h u q c x R bull lA 10WF21 43 989 578 0324
11
0244 875 550 N
0260 0253 2720 N
400 316
2A 14WF38 22 1413 677 0496 0326 1046 700 0383 0381 2813 300 58
tI tI If If If tI tf tI It n tI It2B 45
ff 11 It2C 30 1422 668 0490 0305 1045 0267 0368 2720 n tI n tt tI tI n n tI2D 17 If tI n3A 22 1413 677 0496 0326 1046 0383 0381 5313 600
It 11 It If3B 45 1422 668 0490 0305 1045 0329 0361 5230
tf tI 11 tI fI tI tI4A 22 0340 0368 2720 300 If It tI ff If tI If It n4B 45 n n tI tt f1 tI5A 30 1344 901 0305 0371 3770 425
11If fI6A 22 1045 700 shy - - shy Table 1 -I
foo J1
146
Ave Test Coupon Desig- Testing Lower Static Lower Beam
Beam Location nation Machine Yield Yield Yield Series lA web W Riehle 573 - 573 lA
nflange F 362 - 431 nF 435 shy
F-E It 462 shyItreinf R 370 370
2B web W Instron 417 405 413 2A2B W 11 3A412 398
flange F Riehle 374 - 388 F-CL Instron 382 371 F-E It 397 395
reinf Rl Riehle 434 - 437 2D web W Instron 567 550 558 2C2D
rtW 540 527 3B4A 4B5Aflange F 490 474 446 6AItF-CL 418 406
F-E 478 shyIt 2C2Dreinf R6 398 384 398 4A4B
3A web W 11 411 shyfIflange F 398 379
reinf R2 Riehle 440 shyfI3B reinf R4 330 - 331 3B
R4 11 332 shyR4 Instron 332 shy
4A web W 565 549 flange F 11 487 476
F-CL 406 398 nF-E 429 415 5A reinf R5 tI 437 429 444 5A
R5 450 422 It6A web W 559 545 Itflange F 463 450 fIF-CL 408 402
F-E ff 438 425
Tensile Test Results
Table 2
147
Beam 20 2D 3B 4BLocation Top edge upper fl - BM edge 450K 575K 433lC 300
Bott upper reinf - LIvI edge 450 500 400 317 ~ top upper fl - BM edge 483 600 367 317 Web - ~ open 483 500 517 450 Web - BM edge 517 550 400 350 Web - LM end of upper reinf 517 - - -Bott upper reinf - BM edge 550 550 500 350 Top upper reinf - BM edge 567 800 467 433 ~ web - between LM ends reinf 583 - - shyWeb - LM edge 600 - 583 shy~ top upper fl - LM edge 633 - 600 shyTop upper reinf - LM edge 633 - 467 500 Bott edge upper fl - BM edge 667 - 517 383 Complete yield - BM edge - 567 625 483 383 Complete yield - LM edge 633 - 600 shy
(a) Shear Values Corresponding to Yielding
Location Beam 2C 2D 3B 4B
Top edge upper fl - BM edge 667k 775
k 567k 483k
Bott upper reinf - LM edge - 800 583 -~ top upper fl - BM edge - 775 533 -Web - ~ open 633 700 583 -Web - EM edge - 750 - -Bott upper reinf - BM edge 667 775 - -
(b) Shear Values Corresponding to Strain Hardening
Table 3
- - - - - - -
- - - - - - - - -
- -
BeamLocation Upper fl - BM edge Lower fl - BM edge Lower LM corner open Upper LM corner open Lower BM corner open Upper ID~ corner open Web above open Web below open Low Uif corner to end reinf Up n~ corner to end reinf Low IDH corner to end reinf Up rIM corner to end reinf Between ends reinf LM end Between ends reinf HM end Upper reinf - BM edge open Lower reinf - BM edge open Upper reinf - ilA edge open Lower reinf - LM edge open Lateral buckling - BM edge Web buckling at open Tearing - lower LM corner Tearing - upper BM corner
lA 2A 2B 20 2D 3A 3B ~ lI Ilt v 162 500 400 583 700 525 433
180 - - - 725 - 517 191 550 417 617 600 550 567 191 575 442 567 575 600 433
- 575 467 567 575 600 433
- 575 - - 600 600 shy202 625 475 600 600 700 533
- 625 475 600 625 700 583
- - - 617 700 - 550
- - - 600 675 675 550
- - - - - 675 shy
- 600 458 650 675 650 583
- - - - 725 - -- - - - - 725 -- - - - - 675 -- - - - - - -- - - - - 675 shy- - 483 - - - shy
- 700 517 703 825 775 shy- - - - 825 - 600
4A 4B Ilt Ilt
450 333 500 417 450 367 450 366 500 383 450 417 550 483 600 483 550 400 550 433 625 shy625 shy575 467 575 shy500 shy550 417
- 450 500 383
--675 513
5A le
350 500 400 400 433 483 433 467 500 417
--
500
--
467 500
---
517
-
6A
400 533
-367 367 383 433 533
-----------
550
--
Shear Values Corresponding to Whitewash Flaking
J-ITable 4 ~ 00
149
~hear a1 Beam Size MV [Failure Vp Exp VVp Theor VV_ Diff
lA 10WF21 43 180K 746K 0241 0235 + 26 2A 14WF38 22 532 1L021 0520 0466 +116 2B 11 45 413 0404 0363 +113 2C If 30 548 1301 0421 0403 + 45
u n2D 17 670 0515 0420 +226 n3A 22 575 1021 0562 0466 +206 tt3B 45 497 1301 0382 0345 +107 11 n4A 22 572 0440 0360 +222 n4B 45 430 0330 0295 +119 If It5A 30 445 0342 0296 +155 116A 22 450 0346 0271 +277
Correlation Between Experiment and Theory
Table 5
~hear at Approximate Beam Size MV Failure Exp VV Theor VV DiffVp p p
lA 10WF21 43 180K 746 K
0241 0254 - 51 2A 14VlF38 22 532 1021 0520 0503 + 34
It2B 45 413 0404 0344 +175 If2C 30 548 1301 0421 0414 + 17
It2D 17 670 0515 0505 + 20 3A 22 575 1021 0562 0505 +103
n3B 45 497 1301 0382 0377 + 13 4A tI 22 572 n 0440 0463 - 50
It It 03094B 45 430 0330 + 68 5A 30 445 tr 0342 0353 - 31 6A 22 450 tt 0346 0257 +346
Correlation Between Experiment and Approximate Theory
Table 6
150
Shear at Shear at Shear at Beam MV Failure Full Yield Dif Full Yield Dif
Exp H M Edge L M Edge k k k2C 30 548 567 + 35 633 +155
2D 17 670 625 - 67 - shy3B 45 497 483 - 28 600 +207 4B 45 430 383 -109 - shy
Correlation Between Experimental Failure and Complete Yielding
Table 7
Theor Shear at Shear at Beam MV Shear at Full Yield Dif Full Yield Diff
Failure H M Edge L M Edge
2C 30n 525k 567k + 80 633k +206 2D 17 546 625 +145 - shy3B 45 449 483 + 76 600 +336 4B 45 384 383 - 03 - shy
Correlation Between Theoretical Failure and Complete Yielding
Table 8
151
APPENDIX A
Computer Program for Interaction Curve
A computer program was developed to generate an intershy
action curve for a specified beam opening and reinforcing
size according to the method described in Chapter Ill The
program was wri tten in Fortran IV and can be used on any
standard digital computer that makes use of this language
The input for the program should be of the form given in
the following table
Data Number Items on of Cards Data Cards
Number of beams 1 NB
Dimensions of beams NB dbtw
Yield Stresses NB CS111 S~ lts
Number of openings per beam NB NE
Sizes of openings NH ah
Number of reinforcing sizes per opening NH NR
Sizes of reinforcing NR uqc
A listing of the computer program is given on the following
pages
152
C THIS PROGRA~ CO~PUTES ThE INTERACTION CURVE RELATING MOMENT AND C SHEAR VALUES WHICH CAUSE FAILURE OF A WICE FLANGE bEAM CONTAINING C A REINFORCED RECTANGULAR OPENING AT ThE MIDOEPTH C
REAL KlK2MPMMPKllK12K21 t K22 581 FORMAT(5FIO3) 584 FORMAT(3FIO3) 582 FOR~AT(2FIO3) 583 FORMA1(I5 681 FORMAT(lINTERACTION
lOt 0 B T 682 FORMAT( F133F63 683 FORMAT(O SIGF 684 FORMAT( 5F93
BETwEEN MOMENT AND SHEARtw)
SIGw SIGR VP Mpt)
605 FORMAT(O OPENING LENGTH middotF73middot HEIGHT =F73) 606 FORMAT(O MMP VVP SIG 601 FORMAT( middot5FI04 608 FORMATOV IS TOO LARGE SO SIGMA BECCMES 609 FORMATtOHIGH SHEAR SOLUTION) 611 FORMAT(O U QC) 612 FORMATe 3F63) 613 FORMAT(O STRESS REVERSAL IN REINFORCING 614 FORMATOSTRESS REVERSAL IN CLEAR WEe 615 FORMAT(O STRESS REVERSAL IN WEB STUB) b16 FORMAT(OLOW SHEAR SClUTIONt) 618 FORMATtO MAxIMU~ VVP Fb3)
c READ(S583)NB 00 200 I=lNB RE~D(5581tOBTW
READ(5584)SIGFSIGWSIGR VP=W(0~2T)SIGWSQRT(3) MP=BTSIGF(D-T bullbullW(D-2Tl2SIGW4 WRITE(6681) WRITEI6682)DtB t TW WRITE(6683) WRITE(~684)SIGFSIGWSlGRVPtMP
REAO(SS83)NH DO 200 ~=lNH
RE~D(5582JAH
REAC5583) NR A2=2A H2=2H WRITE(6605)A2H2 VVPM=(O-2T-2H)0-2T) WRITEt6618) VVPM CO 200 J=lNR READ(5584) UQC
Kl K2~)
COMPLEXJ
153
WRITE(661U WRITE(661Z) UQC WRITE(6606) VINCR=OO V=OO S=OZ-H-T AW=SW Af=BT AR=(C-WjQ R=U+Q
C C LOW SHEAR SOLUTION C C STRESS REVERSAL IN WEB STUB C
WRITE(66161 WRITE(661S)
101 V=V+VINCR XX=$IGWZ-O7SV2AW2 IF(XX) 201]00300
300 SIG=SQRT(XX) ALPHA=ARSIGR(AFSIGf BETA=AWSIGCAfSIGf) Cl=T+SBETA C2=-(D-2HJ C3=VAAFSIGF) C4=C22-40ClC3 IF(C4408399399
399 K21=(-C2+$QRT(C4)(2Cl K22=(-C2-SQRTCC4raquo)(2Clt Kll=K21BETA KI2=K22BETA IF(K21)330301301
301 IFK21-10)30230233C 302 IFCKll1330304304 304 IFKllS-U)320320330 330 IF(K22)408)31331 331 IF(K22-10)33233Z40a 332 IF(KIZ)408333333 333 IF(K12S-UJ32132140S 320 K2=K21
Kl=Kl1 GO TO 322
321 K2K22 Kl=K12
322 FY=AFSIGF(S+T2)+AWSIGSS(1-2Kl2)+ARSIGR(U+Q2) F=AFSIGF+AWSIG(1-2Kl+ARSIGR M=2FY+20HF-VA
154
MMP=MMP VVP=VVP WRITE(6607)MMPVVPSIGKlKZ VINCR=VP500 GO TO 101
C C STRESS REVERSAL IN REINFORCING C
408 WRITE(6613 GO TO 409
902 V=Vl 701 V=V+VINCR
XX=SIGW2-015V2AW2 IF(XX9011CQ100
100 SIG=SQRTXX) 409 Rl=(C-W)SIGR
R2=AWSIG+SRl Cl=T+SAFSIGFRZ C2=2SURIR2-(D-2HJ C3=VA(AFSIGF)+U2Rl(AFSIGFraquo)(SR1RZ-1) C4=C22-40C1C3 IF(C4)418403403
403 K21=(-C2+SQRT(C4)(Z0Cl KZ2=-C2-SQRT(C4)(Z0Cl) Kll=AFSIGFK21R2+URlR2 K12=AFSIGFK22R2+URIR2 IF(K21)430401401
401 IF(K21-10)4C240243C 402 IF(K11S-U)430404404 404 IF(Kl1S-R)42042043C 430 IFK22)418431431 431 IF(K22-10)432432418 432 IF(K12S-U418433433 433 [FtK12S-R)421421418 420 K2=K21
K l=K 11 GO TO 422
421 K2=K22 Kl=K12
422 FY=AFSIGFtS+T2)+AWSIGSS(1-2Kl2) 1 +(C-W)SIGR(U2+UC+SQ2-(KlS)2)
F=AFSIGF+AWSIG(I-2Kl)+(C-WJSIGR(2U+Q-2KlS) M=20FY+20HF-VA ~MP=MMP
VVP=VVP IF(MMP 418423423
423 WRITE(6601)MMPVVPSIGKlK2 VINCR=VP500
155
GO TO 701 C C STRESS REVERSAL IN CLEAR WEB C
418 WRITE(6614) GO TO 419
922 V=Vl 801 V=V+VINCR
XX=SIGW2-075V2AW2 IF(XX)921800800
800 SIG=SQRT XX) 419 Cl=AFSIGFS(AWSIG)+T
CZ=-O+2H-2SARSIGR(AWSIG) C3=VACAFSIGF)+2U+Q2)ARSIGR(AFSIGF)
1 +S(ARSIGR2fAFSIGFAWSIG C4= C224 ClC3 IF(C4)428410410
410 KZl=(-C2+SQRTCC4)(ZCl K22=(-C2-SQRTCC4)ZC1) Kll=AFSIGFK21(AWSIG)-ARSIGR(A~SIG)
K12~AFSIGFK22(AWSIG)-ARSIGRAWSIG)
IF(K21)S30501501 501 IFK21-10)502502530 50Z IF(KllS-RS30504504 S04 IF(Kll-l0S20520510 530 IFtKZ2)428531531 531IF(K22-10)532532428 532 IF(K12S-R428533533 533 IF(K12-10)521S21428 520 1lt2=K21
Kl=Kl1 GO TO 522
521 1lt2=K2Z Kl=K12
522 FY=AFSIGF($+T5+AWSIGS(i-2bullbullKl212-ARSIGR(U+Q2) F=AFSIGF+AWSIG(1-2Kl-ARSIGR M=2FY+2HF-VA MMP=MMP VVP=VVP IF (MM P) 428523523
523 WRITE(6601)MMPVVPSIGKlK2 VINCR=VP 500 GO TO 801
c C HIGH SHEAR SOLUTION C
428 WRITE(oo09) GO TO 352
156
2 V=Vl 4 V=V+V INCR
XX=SIGW2-015V2AW2 IF(XXJI0235D350
350 SIG=SQRHXX) 352 AlPHA=ARSIGR(AfSIGf
BETA=AWSIG(AfSIGf) 429 02=-10-BETA-AlPHA
03=05VA(AFSlGFT)+AlPHA+8ETA+O5(AlPHA+8ETA)2+OS8ETAST 1 +AlPHA(U+Q2IT-CD-2H(AlPHA+8ETA)O5T
04=D22-403 IFCD4)102351351
351 K21=(-D2+SQRTID4raquo2 K22=(-D2-SQRT(04112 Kll=1O+8ETA+AlPHA-K21 K12=10+BETA+AlPHA-K22 IFCK21630601601
601 IF(K21-10602~0263C
602 IF(Kll)630604604 604 IFIKll-10)62062D63C 630IFCK22)102631o31 631 IFIK22-10)632632102 632 IF(K12)102633633 633 IF(K12-10)621621lC2 620 K K21
Kl=Kll GO TO 622
621 K2=K22 Kl=K12
622 FYPT=Kl(D-2H)-TKl2-(S+ST) FY=AFSIGFFYPT-AWSIGS2-ARSIGRlU+Q2bullbull F=AFSIGfC2KI-l-AWSIG-ARSIGR M=20FY+20HF-VA MMP=MMP VVP=VVP IF(MMP) 102623623
623 WRITE(6607)MMPVVPSIGKlK2 VINCR=VPIOO GO TO 4
102 V I=V-VINCR VINCR=VINCRIOO VIMIN=VPI00DOO IF(VINCR-VIMIN) 19922
901 Vl=V-VINCR VINCR=VINCR200 VIMIN=VPIOOOO IF(VINCR-VIMIN)199902902
c
C
157
921 V1=V-VINCR VINCR=VINCRI200 VIMIN=VPI10000 IF(VINCR-VIMIN)199922922
199 CONTINUE GO TO 200
201 CONTINUE WRITE(b608)
200 CONTINUE RETURN END
158
APPENDIX B
Plasticity Relationships
In the elastic range stresses were computed from measured
strains by the usual elastic theory The values used for the
modulus of elasticity E and the shear modulus Gtwere 29OOOksi
and 11200ksi respectively When local yielding had occurred
according to the von Mises criterionas stated by equation (2)
Chapter 11 stresses were then computed by the plasticity
relations given by Hill(8) and reduced to the form given by
Bower(16) These relations are stated here for easy reference
Plasticity relations for a Prandtl-Reuss solid yield
dE = des _ ~(d)+ 2G dt (a)xT3Gt~xy
where E x is strain in the longitudinal direction and l$ xy
is the shearing strain Eliminating ~ by use of the von
Mises criteria gives
(b)
Since explicit integration of equation (b) would be
extremely difficult the equation is diVided by dE-x and the
derivatives d tSd E and d 6 yld poundx are replaced byx x
159
(c)
( d)
where~i and ~XYi are the bending and shearing stresses
respectively corresponding to ~ and ~f and ~xYf are
these stresses corresponding to poundx + 6 (x
Substituting equations (c) and (d) into equation (b)
gives
A~x - B6~ + AtS cs = AY l (e)
f
where (f)
and ( g)
The shear stress corresponding to a change in strain is given
by
2 2 ~ =Jcsy - CS f (h)
f [3
In order to determine whether strain hardening had occurred
an equivalent strain Xp was computed from
160
where lIE Xl ~yp Ezp and xyp are the plastic components of
strain and are given by
~ xp = poundx-t ( j)
Eyp = E yy (S
- i (k)
E (1)poundzp = z -~ (m)xyp = 6xy -
~
~
The constant volume condition was used to calculate ~ zp
(n)
The equivalent strain was compared to a reference strain
~ pr computed from the value for ~p for the onset of strain
hardening for a tensile test The strain hardening strain
was taken as euro x and it was assumed that E = poundoz For yy
A36 steel the strain hardening strain was taken as 115 ~yIE
and ~y was determined from a tensile test of a coupon from
the web of the test beam Strain hardening was considered
resent J f 6 gt or J P degpr-
The above relationships were included in a paper
presented by Bower(16) in 1968
161
BIBLIOGRAPHY
1 Muskhelishvili NISome Basic Problems of the Mathematical Theory of ElasticityU 2nd Edition P Noordhoff Itd 1963
2 HelIer SR Jr Brock JS and Bart R The itresses Around a Rectangular Opening with Rounded Corners in a Beam Subjected to Bending with Shear Proceedings Vol 1 Fourth U National Congress on Applied Mechanics Berkeley Calif 1962
3 Bower JE ItElastic Stresses Around Holes in WideshyFlange Beams Journal of the Structural Division ASCE Vol 92 No ST2 Proc Paper 4773April 1966
4 BowerJE Experimental Stresses in Wide-Flange Beams with Holes tl Journal of the Structural Division ASCE Vol 92 No ST5 Proc Paper 4945October 1966
5 So WC The Stresses Around Large Circular Openingsin the Webs of Wide-Flange Beams MEng Thesis McGill University Aug 1963
6 Chen IC tiThe Stresses Around Two Large Openings in the Webs of Wide-Flange Beams MEng Thesis McGill University Aug 1967
7 Segner EP Jr Reinforcement Requirements for Girder Web Openings Journal of the Structural Division ASCE Vol 90 No ST3 Proc Paper3919 June 1964
8 HillR The Mathematical Theory of PlastiCityClarendon Press Oxford University Press London 1950
9 Handbook of Steel Construction Canadian Institute of Steel Construction OntariO 1967
10 ltSpecifications for the DeSign Fabrication and Erection of Structural Steel for Buildings AISC 1963
11 Basler K Strength of Plate Girders in Shear Journal of the Structural Division ASCE Vol 87 No ST7 Proc Paper 2967 October 1961
162
12 Worley WJ Inelastic Behavior of Aluminum AlloyI-Beams With Web Cutouts University of Illinois Engineering Experimental Station Bulletin No 448 April 1958
13 Redwood RG and McCutcheon J 0 Beam Tests with Unreinforced Web Openings Journal of the Structural Division ASCE Vol 94 No ST1 Proc Paper5706 Jan 1968
14 nCommentary of Plastic DeSign in Steel ASCE Manual of Engineering Practice No 41 1961
15 Cheng SY flAn Investigation of Large Extended Openingsin the Webs of Wide-Flange Beams MBng Thesis McGill University Aug 1966
16 Bower JE Ultimate Strength of Beams with RectangularHoles Journal of the Structural Division ASCE Vol 94 No ST6 Proc Paper 5982 June 1968
17 Redwood RG Plastic Behavior and Design of Beams with Web Openings ff Proceedings of the Canadian Structural Engineering Conference Canadian Institute of Steel Construction Toronto Feb 1968
18 Redwood RG The Strength of Steel Beams with Unreinshyforced Web Holes Civil Engineering and PubliC Works Review Vol 64 No 755 London June 1969
19 Redwood RG Ultimate Strength Design of Beams with Multiple Openings Proceedings of the Structural Engineering Conference American Society of Civil Engineers Pittsburgh October 1968

iv
NOTATION
a half length of opening
Af area of flange
Ar area of reinforcing
Aw area of web
b width of flange
c width of one pair of reinforcing bars (including web)
d depth of beam
E modulus of elasticity
Est strain hardening modulus
f subscript denoting stress or strain after load increment
FI stress resultant at high moment edge of opening
F2 stress resultant at low moment edge of opening
G shear modulus
h half depth of opening
i subscript denoting stress or strain before load increment
k I location of stress reversal at high moment edgeof opening
location of stress reversal at low moment edgeof opening
L length of moment arm to center of opening
M applied bending moment
Mp plastic bending moment
M p reduced plastic moment
x
v
p applied load
q thickness of reinforcing
R corner radius of opening
s half remaining clear web at opening
t thickness of flange
u length of web stub
shear force
plastic shear force
w thickness of web
extension of reinforcing past edge of opening
distance from the boundary of the opening to the stress resultant at the high moment edge of opening
distance from the boundary of the opening to the stress resultant at the low moment edge of opening
z plastic section modulus
proportionality factor 1= i(~2(2~ - 1)21 ~ proportionality factor f= kl + k2 - 1 - ~J pound45 strain at 45 0 to the longitudinal direction
pound-45 strain at -45 0 to the longitudinal direction
pound x strain in the longitudinal direction
6 xp plastic component of ~x
pound y strain corresponding to yielding
~yy strain in the direction of the beam depth
euro yp plastic component of euroyy
vi
~z strain in the transverse direction
plastic component of poundz
strain corresponding to hardening
the initiation of strain
~p equivalent strain
~pr reference value of ~p
~ xy shearing strain
~ normal stress
yield stress
yield stress for flange
yield stress for reinforcing
yield stress for web
shear stress
AISC American Institute of Steel Construction
ASTM American SOCiety of Testing Materials
CISC Canadian Institute of Steel Construction
ASCE American Society of Civil Engineers
vii
LIST OF FIGURES
Page
1 Types of Reinforcing 93
2 Stress Distribution at Opening 94
3 Idealized Stress-Strain Curve for Structural Steel 94
4 Interaction Curve - Unperforated Beam 95
5 Load - Deflection Curves 96
6 Interaction Curve - Perforated Beam 97
7 Hinge Locations and Cross-Section of Member 98
8 Stress Distributions and Resultant Forces 99
9 Interaction Curve Showing Low and High Shear Regions 100
10 Interaction Curve - 14WF38 Nominal 7 x lOin Opening Itn X iReinforcing 101
11 Interaction Curve - 14WF3~ Nominal 7f1 X lot Opening 213 x t Reinforcing 102
12 Interaction Curve - 14WF38 Nominal 7 xlot Opening No Reinforcing 103
13 Interaction Curve - 14WF38 Nominal 7 x 14 Opening It x lIt Reinforcing 104
14 Interaction Curve - 14WF38 Nominal 9 x 13t Opening li x -n Reinforcing 105
15 Interaction Curve - 10WF21 Nominal 5~ n x Bi Opening li x i lt Reinforcing 106J
16 Test Beam Dimensions and Dial Gauge Locations 107
17 Test Beam Dimensions and Dial Gauge Locations 108
18 Test Beam Dimensions and Dial Gauge Locations 109
19 Lateral Bracing System 110
viii
Page
20 Photographs of Lateral Bracing System III
21 Strain Gauge Locations 112
22 Tensile Coupons 113
23 Stress-Strain Curve from Instron Testing Machine 113
24 Photographs of Test Beams after Collapse 114
25 Comparison Photographs of Test Beams 115
26 Comparison Photographs of Test Beams 116
27a Stress Distribution at High Moment Edge of OpeningBeam 2C 117
27b Stress Distribution at Low Moment Edge of OpeningBeam 2C 117
28a Stress Distribution at Centerline of OpeningBeam 2C 118
28b Bending Stress Distribution Across Flange at High Moment Edge of Opening - Beam 2C 118
29a Bending Stress Distribution Across Length of Opening at Top of Flange Beam 2C 119
29b Bending Stress Distribution Across Length of Opening at Top of Reinforcing - Beam 2C 119
30a Stress Distribution at High MOment Edge of Opening - Beam 3B 120
30b Stress Distribution at Low Moment Edge of Opening - Beam 3B 120
31a Stress Distribution at High Moment Edge of Opening - Beam 2D 121
31b stress Distribution at High Moment Edge of Opening - Beam 4B 121
32 Load-Relative Deflection Curve - Beam lA 122
33 Load-Relative Deflection Curve - Beam 2A 122
ix
Page
34 Load-Relative Deflection Curve - Beam 2B 123
35 Load-Relative Deflection Curve - Beam 2C 123
36 Load-Relative Deflection Curve - Beam 2D 124
37 Load-Relative Deflection Curve - Beam 3A 124
38 Load-Relative Deflection Curve - Beam 3B 125
39 Load-Relative Deflection Curve - Beam 4A 125
40 Load-Relative Deflection Curve - Beam 4B 126
41 Load-Relative Deflection Curve - Beam 5A 126
42 Load-Relative Deflection Curve - Beam 6A 127
43 Interaction Curves - Test Beam lA 128
44 Interaction Curves - Test Beams 2A and 2B 129
45 Interaction Curves - Test Beams 2C and 2D 130
46 Interaction Curves - Test Beam 3A 131
47 Interaction Curves - Test Beam 3B 132
48 Interaction Curves - Test Beams 4A and 4B 133
49 Interaction Curves - Test Beam 5A 134
50 Interaction Curves - Test Beam 6A 135
51 Lateral Deflection at High Moment Edge of OpeningBeam 2C 136
52 Flange Buckling at High Moment Edge of OpeningBeam 2C 137
53 Shear Stresses at End of Reinforcing 138
54 Variable Reinforcing Size 139
55 Variable Moment to Shear Ratio 140
56 Variable Moment to Shear Ratio 141
x
Page
57 Variable Moment to Shear Ratio 142
58 Variable Aspect Ratio 143
59 Variable Opening Depth to Beam Depth M4
xi
LIST OF TABLES
Page
1 Beam Properties 145
2 Tensile Test Results 146
3a Shear Values Corresponding to Yielding 147
3b Shear Values Corresponding to Strain Hardening 147
4 Shear Values Corresponding to Whitewash Flaking 148
5 Correlation Between Experiment and Theory 149
6 Correlation Between Experiment and Approximate Theory 149
7 Correlation Between Experimental Failure and Complete Yielding 150
8 Correlation Between Theoretical Failure and Complete Yielding 150
SUJn1[ARY
ACKNOWLEDGEMENTS
NOTATION
LIST OF FIGURES
LIST OF TABLES
TABLE OF CONTENTS
Page
ii
iii
iv
vii
xi
CHAPTER I INTRODUCTION
11 General Background 1
12 Types of Reinforcing 2
13 Elastic and Ultimate Strength Analysis 4
CHAPTER 11 ULTINfATE STHEUGTH BEHAVIOR
21 Behavior of Unperforated Beams 8
22 Behavior of Beams with Web Openings 12
23 Previous Ultimate Strength Investigations 17
24 Scope of the Investigation 25
CHAPTER III ULTIMATE STRENGTH ANALYSIS
31 Assumptions 27
32 Low Shear Solution - Case I 29
33 High Shear Solution - Case 11 35
34 Limits of Interaction Curves 36
CHAPTER IV APPROXIMATE METHOD
41 General Remarks 41
42 Development of the Method 42
43 Limitations on the Approximate Method 46
44 Summary and Discussion 50
Page CHAPTER V EXPERIMENTAL INVESTIGATION
51 Selection of Test Beams 56
52 Experimental Setup 59
53 Testing Procedure 62
54 Determination of Yield Stresses 63
CHAPTER VI EXPERIMENTAL RESULTS
61 Behavior of Beams during Testing 66
62 Stress Distributions and Failure Loads 71
63 other Factors 72
CHAPTER VII ANALYSIS OF RESULTS
71 Order of Onset of Yielding 77
72 Stress Distributions 78
73 Failure Loads 80
74 Influence of Reinforcing and Other Variables 82
CHAPTER VIII CONCLUSIONS AND RECO~Th1ENDATIONS
81 Conclusions 85
82 Recommendations for Design 88
83 Recommendations for Future Work 91
FIGURES 93
TABLES 145
APPENDIX A Computer Program for Interaction Curve 151
APPENDIX B Plasticity Relationships 158
BIBLIOGRAPHY 161
1
CHAPTER I
INTRODUCTION
11 General Background
It has become common practice to cut openings in the
webs of beams to permit the passage of utility ducts By
passing these utilities through rather than under the beams
the height of each floor in a building can be reduced thereshy
by effecting a considerable saving in cost particularly in
the case of multistorey structures However cutting an
opening in the web of a beam may considerably reduce the
strength of the beam in the vicinity of the opening If
the opening is located at some position in the beam where
stresses are low this may cause no special problems but
if it is located in a high stress region the designer is
faced with the problem of finding an economioal way to inshy
crease the strength of the beam so that failure will not
result at the opening under working loads
Two alternate approaches are possible in this case
The size of the entire member in question may be increased
on the basis of providing sufficient strength at the openshy
ing so that failure will not ocour The other approach is
to reinforce the original member in the vicinity of the
opening so that the loads can be carried without inducing
2
high stresses The size of the member itself then need not
be increased
Just as the decision whether to pass utilities through
rather than under floor beams must be based primarily on
economic considerations the decision whether to reinforce
an opening or increase the size of the entire member when
the opening is located in a high stress region must also be
based on economics Since many methods of reinforcing an
opening are possible the relative costs and effects of each
type of reinforcing deserve consideration
12 Types of Reinforcing
Reinforcing for an opening in the web of a beam may be
of three basic types
1 reinforcing to resist high bending stresses and low shear
stresses
2 reinforcing to resist low bending stresses and high shear
stresses
3 reinforcing to resist both high bending and shear stresses
Two examples of the first type are illustrated in Figures
la and lb By increasing the areas of the sections above
and below the centroid they provide additional moment
resisting capacity to the section However since shear
stresses are considered to be carried only by the web of
the section this type of reinforcing cannot increase the
3
shear capacity above that given by the shear capacity of
the uncut section times the ratio of the net web area at
the opening to the initial web area of the beam Reinforcshy
ing types to resist high shear stresses are those that
increase the web area so that more web is available to
resist these stresses Web doubler plates as shovm in
Figure lc are typical of this type of reinforcing although
their use is usually very limited due to welding difficulties
This type of reinforcing also increases moment capacity by
increasing the area above and below the opening Another
type of shear reinforcing uses vertical or inclined web
stiffeners to carry the shear forces past the opening A
typical arrangement of inclined web stiffeners is shown in
Figure Id The third type of reinforcing is essentially a
combination of the first two examples of which can be seen
in Figures le and If The area above and below the opening
is increased to give added moment capaCity and the effective
web area is increased by the addition of vertical or inclined
shear plates to provide added shear capacity to the section
A combination of the reinforcing arrangements in Figures la
and Id would be another example of this type Many other
arrangements of web opening reinforcing are pOSSible but
those shown in Figure 1 and mentioned above are typical of
the three main types
Since the problem of cutting and reinforcing an opening
4
in a section is basically one of economics the cost of the
process of reinforcing an opening must be considered This
cost may be divided into three parts the cost of supplying
and cutting the material to be used in reinforcing the openshy
ing that of bending and fitting this material and welding
this material into place Since the cost of welding is
paramount among the several expenses it is advantageous to
keep the welding to a minimum in the selection of a reinforcshy
ing type This tends to make the high shear type of reinforcshy
ing uneconomical and essentially limits the more practical
opening reinforcings to those of the type considered in
Figures la and lb The present investigation is devoted to
this type of reinforcing and specifically to that arrangement
given in Figure lb
13 Elastic and Ultimate Strength Analysis
BaSically two types of analysis were available for this
study - elastic and ultimate strength The elastic analysiS
of the stresses in a beam containing an opening in its web
consists of the superposition of the stresses occurring in
an unperforated beam and the stresses resulting from forces
applied to the boundary of the opening in such a way as to
satisfy certain boundary conditions at the opening This
approach finds its basis in an important work presented by
NIMuskhelishvili(l) in the 1930s and was used by SR
5
Heller Jr et al(2) in 1962 and by JEBower(3) in 1966 to
investigate the elastic stresses around openings in wideshy
flange beams Bowers work also outlined the widely used
approximate Vierendeel analysis based on the assumption that
the beam behaves like a Vierendeel truss in the vicinity of
the opening The shear force carried by the section causes
secondary bending moments to occur within the tee sections
formed by the flange and the remaining part of the web above
and below the opening A point of contraflexure for the
secondary bending stresses is assumed to occur at the midshy
length of the opening The forces acting at the opening and
the resultant stress distributions are shown in Figure 2 It~
is assumed that the shear is carried equally by the tee secshy
tions above and below the opening and that the secondary and
primary bending stresses are additive
Bower also performed an experimental study(4) in 1966
to verify the results of his analysis A series of 16WF36
beams each containing one opening either circular or
rectangular with corner radii of 14 inch were tested at
varying moment to shear ratios The beams were implemented
with electrical resistance strain gauges in the vicinity of
the openings so that strains could be measured and compared
to those predicted by theory The results of Bowers tests
showed that very high stress concentrations occur at the
corners of rectangular openings while smaller stress concenshy
6
trations occur above and below circular openings where the
tee section is the smallest The findings for circular
openings confirm those given by So(5) in 1963 while those
for rectangular openings were confirmed by Chen(6) in 1967
Bower showed that for both types of openings investigated
the elastic analysis predicts all stresses and stress concenshy
trations with reasonable accuracy except for the octahedral
shear stresses away from the boundary of the opening The
elastic analYSiS however is complicated and requirea the
use of a computer and is incapable of dealing with the presshy
ence of notches or other irregularities at the opening The
approximate Vierendeel method was found to predict bending
stresses and octahedral shear stresses with acceptable
accuracy while failing to predict the stress concentrations
in both cases However the approximate method is relatively
simple and lends itself easily to hand calculations Since
the elastic analysis is not practical particularly for
design purposes because of the length of the calculations
involved it has been suggested by Bower and others(7) that
the Vierendeel analysis be used in its place with stress
concentrations neglected when an elastic analysis is desired
A design based on this method would result in a beam whose
response is not purely elastic under working loads
An analysis based on complete yielding of the sections
where high stress concentrations exist under elastic condishy
7
--~~
~ tions would eliminate this problem Such a plastic or
ultimate strength analysis would take advantage of the
additional strength of the perforated beam between the onset
of yielding and the complete plastification of the section
or sections that would cause failure or uncontrolled deformshy
ations of the beam Besides eliminating the problem of stress
concentrations in the elastic range a plastic analysis also
has the advantage of being simpler to use than the complete
elastic analysis and of not being rendered unusuable when
notches or irregularities are present at the opening since
the method depends only on the reasonably accurate prediction
of the sections where complete yielding or plastic hinges
will occur These regions can generally be determined withshy
out difficulty particularly in the case of rectangular
openings Consideration of these factors suggest an ultishy
mate strength analysis as the most rational approach to
the problem
8
CHAPTER 11
ULTIMATE STRENGTH BEHAVIOR
21 Behavior of Unperforated Beams
Ultimate strength analysis truces advantage of the ducshy
tility of structural steel This ductility mruces it possible
for the steel to undergo large deformations beyond the elastic
limit before failure occurs As can be seen from the idealized
stress-strain curve in Figure 3 the material is elastic up
to the yield level but after this level is reached the strain
increases extensively without any further increase in stress
Beoause of this attainment of the yield stress at the outershy
most fiber of a beam in bending does not cause the failure of
the member Rather the member has reserve strength that
permits increase of load up to the point where the entire
cross-section has reaohed the yield stress ie when a plastio
hinge has fonned at the yielded section Since rotation is
free to occur at plastic hinge locations when sufficient
hinges have formed so that the structure forms a mechanism
and is unstable under the applied loads collapse will occur
For a simply supported beam of uniform cross-section
formation of only one plastio hinge is suffioient to cause
collapse If no shear or axial forces are acting the plastic
moment or maximum moment capacity of the section is easily
9
obtained and is equal to the first moment of the area of the
section above or below the centroid about the centroid times
the yield stress of the material This is writte~ as
where Z is the plastic section modulus of the section and ~y
is the yield stress
The presence of a moment-gradient (shear) has the effect
of lowering the plastic moment capacity of a member Since
the shear force is carried by the web of the member the
moment carrying capacity of the web and therefore that of
the member must be reduced since the presence of shear
causes a reduction in the normal stress carrying capacity of
the web The yielding criterion of von Mises is generally
accepted as being the most applicable to structural steel
and can be explained physically in either of two ways
Henckys interpretation states that when the energy of disshy
tortion reaches a maximum value yielding results A preferred
explanation offered by Prandtl states that when the shear
stress on the octahedral plane reaches some maximum value
yielding occurs(8) Von Mises t yield criteria can be
expressed mathematically as
10
where ltSyiS the yield stress ltS the normal stress and the
shear stress The effect of shear on moment capacity can
best be illustrated by an interaction curve as shown in
Figure 4 where the axes have been non-dimensionalized by
diVision by Mp and Vp Vp is the maximum shear carrying
capacity of the section under pure shear and is obtained
from equation (2) as
where = Vw( d-2t) V is the shear force and w( d-2t) the
clear web area Equation (3) presupposes that the flanges
of the section carry no shear The broken line in Figure 4
illustrates the interaction between moment and shear for an
unperforated wide-flange section as predicted by equation (2)
Such an interaction curve shows for any given moment value
the corresponding shear value that a member can safely sustain
Any value less than those on the interaction curve (those
bounded by the VV and MM axes and the interaction curve)p p represents a combination of moment and shear which the member
can safely carry Values on or outside the interaction curve
represent those combinations which would cause collapse of the
member The reduction in strength due to shear is however (9)fairly small for unperforated sections and OISC and
AISc(lO) design codes for buildings allow it to be neglectshy
11
ed for design purposes since the ooouranoe of strain hardenshy
ing makes possible the attainment of moments greater than Mp
in the presence of shear The allowable moment and shear
values thus permitted are those bounded by the solid line in
Figure 4
The inorease in strength due to strain hardening oan best
be illustrated by considering the load-defleotion curves in
Figure 5 The load-defleotion ourve for a beam in pure bendshy
ing is given in Figure 5a When the plastio moment of the
seotion is reaohed the defleotions beoome exoessive and
increase with no further inorease in load This ooours
beoause the member forms a meohanism with the formation of
a plastio hinge at the attainment of Mp However when shear
is present the load-defleotion ourve does not beoome horishy
zontal when the reduoed Mp Mp as predioted by equation (2)
and given by the interaction curve in Figure 4 is reached
but rather oontinues to climb at a lesser slope reaching
values equal to or greater than the full Mp given by equation
(1) This oan be seen in Figure 5b The increase in strength
above Mp under moment gradient is due to strain hardening
and is usually neglected in simple plastiC theory although
it can be predicted but the procedure is complicated for
all but very simple cases Strain hardening occurs in the
presence of shear because yielding occurs in localized areas
or slip bands so that the material within these bands strain
12
hardens before adjacent areas reach the point of yield Alshy
though simple plastic theory neglects strain hardening the
significance of this phenomenon should not be underestimated
since all rolled sections are proportioned such that the limit
of shear carrying capacity of the web lies within the strain
hardening range(ll)
22 Behavior of Beams with Web Openings
The introduction of an opening into the web of a wideshy
flange section has two effects on the interaction curve The
first and more immediately apparent of these effects is the
reduction of shear and moment capacity by the reduction of the
area available to resist these forces The moment capacity
is reduced to
(4)
where w is the web thickness and h is the half depth of the
opening The shear capacity is reduced to
v = w( d-2t-2h) $-3
This change in the interaction curve is shown by the broken
line in Figure 6 The second effect caused by the presence
of an opening is the strong interaction between moment and
shear due to the member behaving like a Vierendeel truss in
13
the vicinity of the opening This is the same type of
behavior described in Section 13 except that the member
is analyzed in the plastic rather than the elastic range
The secondary bending moments caused by the shear force are
added to the primary bending moments thus causing the critical
sections to yield completely at lower loads than would be exshy
pected were this interaction effect ignored This is shown
by the line in Figure 6 where the effects of shear as given
by equation (2) have also been included
The addition of horizontal bar reinforcing above and
below an opening in a wide-flange beam increases the maxishy
mum moment capacity of the section (no shear acting) above
that of an unreinforced opening by increasing the area of
the section capable of resisting moment The effects of
interaction between moment and shear are also reduced by the
addition of reinforcing since the reinforcing is of such a
type as to be particularly well suited to resist secondary
bending moments due to Vierendeel action The maximum shear
carrying capacity of a reinforced opening may reach
(Vv) = d-2t-2h (6)P max d-2t
which is the maximum shear carrying capacity of the section
assuming no interaction and is derived from equation (5) by
division by equation (3) This can represent a considerable
14
increase in strength over the shear capacity of the unreinshy
forced opening which is normally much below (VVp)max because
secondary bending moments have to be resisted to a large
extent by the web since there is no reinforcing to perform
this task
The presence of an unreinforced rectangular opening in
the web of a wide-flange section oauses ohanges in the failure
modes of the beam as well as in the interaction ourve Sevshy
eral investigations have confirmed these ohanges in failure
modes(461213) Vllien subjected to pure bending the member
is found to fail by oomplete yielding of the tee sections
above and below the opening Load defleotion curves for this
case are similar to those for an unperforated beam under pure
bending in that with the attainment of Mp the curve becomes
horizontal and collapse eventually occurs with no further
increase in load
Vhen the perforated beam is subjected to bending with
shear large relative displacements occur between the ends
of the opening and at the same time localized plastiC binges
form at each of the four corners of the opening by complete
yielding of the tee section at these locations The load-
deflection curve in this situation is similar to the load-
deflection curve of an unperforated member under moment-
gradient except that the second portion of the curve after
15
the bend is not always as straight as that for the unpershy
forated beam and in fact may possess considerable
curvature in some cases(13) The value of the moment at the
opening at which the load-relative deflection curve bends
is not that of the unperforated section but instead is a
reduced value obtained by considering both reduced area and
moment-shear interaction as described previously_ Again
the increase in load above the value corresponding to the
predicted moment is due to strain hardening for the same
reasons as cited previously_ This strain hardening effect
makes it exceedingly difficult to ascertain at what value of
shear or moment an experimental test beam should be considershy
ed to have failed so that this failure load can be compared
to one predicted by theory It can be said with certainty
that this value should lie somewhere between the load at
which the load-relative deflection curve starts to bend from
its initial slope and the ultimate load at which the beam
suffers total collapse This total collapse will be either
by web buokling at the opening or by oraoking of one or more
of the corners of the opening after which deflections become
uncontrolled and the load carrying capacity of the beam
decreases
The use of the collapse load as the failure load would
however not be justified unless the effects of strain hardenshy
ing and the possibility ot tearing and buokling are incorporatshy
16
ed into the analysis Also the deflections become so exshy
cessive as to make the beam unserviceable before this load
is reached Indeed a rational definition would have to be
such as to have the failure load fall within the region
where the load-relative deflection curve bends from its
initial slope to some new slope One possible means of
defining failure in this type of situation is suggested in
ASCE tlOommentary on Plastic Design in Steel(14) and
is perhaps the most rational approach to the problem The
initial slope of the load-relative deflection curve is
multiplied by some constant factor to obtain a new slope
A line having this new elope is then drawn tangent to the
upper portion of the load-relative deflection curve and the
load at which this new slope intersects the initial slope is
taken to be the failure load This is analogous to considershy
ing strain hardening in some simple case where the slope of
the theoretical load-deflection curve in the strain hardening
range is equal to a constant times the initial slope of the
curve when the beam is still elastic If this method is to
be used a method of determining a suitable constant must
be chosen possibly from experiment
The modes of failure of a beam containing a reinforced
opening are expected to be the same as those with an unreinshy
forced opening under both pure bending and bending with shear()
Similarly the load-deflection curves or the load-relative
17
deflection curves would be the same in both cases Thus for
cases of moment gradient the same situation exists for both
reinforced and unreinforced openings where the load continues
to increase past the attainment of the predicted moment
capacity of the section due to strain hardening and the same
difficulty exists for determining failure loads for beams
with reinforced openings as for the unreinforced case
The method suggested in ASCE and described previousshy
ly for determining failure load was adopted for the purposes
of correlating experimental and theoretioal values of failure
load in this study Since the load-relative defleotion curves
for some of the test beams approached a fairly constant slope
in the strain hardening range it was decided to determine
the slopes and constant multiplication factors for these
cases and apply the same factor to all of the test beams
since all were similar It was thus decided to use a value
of thirty times the initial slope for the final slope in
determining experimental failure loads
23 Previous Ultimate Strength Investigations
While considerable theoretical and experimental work
has been done in the determination of elastic stresses around
openings in plates and beams relatively little has been done
ooncerning ultimate strength behavior In 1958 wJworley(12)
18
carried out an investigation of the ultimate strength of
aluminum alloy I-beams containing web openings of various
shapes Rectangular elliptical and triangular openings
were studied with the main objects of the research being
to determine which shape of opening resulted in the smallest
loss of strength and to verify the validity of an upper
bound theorem in predicting the fully plastiC load carrying
capaCity of the test beams The upper bound plastiC theorem
states that of all the possible mechanisms or combinations
of plastic hinges sufficient to cause collapse the one that
ensures collapse at the lowest load is the correct mechanism
under which the member will actually fail Worleys experishy
mental results were in fairly good agreement with the ultimate
loads predicted by the upper bound theorem and were the most
accurate for the case of rectangular openings where hinge
locations were more easily predicted than for the other openshy
ing types Of the various opening shapes tested it was found
that the elliptical opening was the strongest on a maximum
area removed baSiS while the triangular was stronger on a
maximum depth basiS The practical need for these two shapes
especially the triangular is however questionable Worley
excluded the effects of shear and axial force in his analysis
and for rectangular openings assumed a four hinge mechanism
with hinges considered at the corners of the opening
19
In 1963 W-CSo(5) presented a study of large circular
openings in wide-flange beams including an ultimate strength
analysis based on the assumption of a plastic hinge over the
center of the opening Sots analysis however neglected
secondary bending effects due to Vierendeel action in the
vioinity of the opening and also ignored shear yielding
effects in the web The experimental investigation performshy
ed in the ultimate strength range consisted of the testing
of two l4WF30 beams to collapse The first beam was tested
in pure bending so that shear and Vierendeel action were not
present and the ultimate strength predioted by Sos analysis
would be expeoted to be oorreot since the same strength would
be predicted in this case whether or not these effects were
considered Deviation between experiment and theory was 3
The second beam was tested under moment gradient but due to
the relative location of opening and maximum moment (the
beam was simply supported and subjected to a single concenshy
trated load) the beam was expected to and did fail under
the load and not at the opening
S-y Cheng(15) in 1966 considered bending shear and
axial forces in his investigation of the ultimate strength
of extended circular openings in wide-flange beams At high
values of shear a four hinge mechanism was assumed while at
low shears hinges were assumed above and below the opening
20
where the tee section was smallest - similar to the failure
mode in pure bending Stress distributions were assumed at
hinge locations for each case Two l4WF30 beams were tested
to destruction one in pure bending and the other with a
moment to shear ratio of 24 inches which is a high value of
shear for the size beam used While reasonable agreement
between theory and experiment was obtained for both beams
tested an inherent fault in Chengs work lies in its inshy
ability to predict a continuous variation of failure loads
as the shear varies from a low to a high value It is
impossible for the change from a one to a four hinge mechanism
to occur suddenly with only a slight increase in shear
Experiments in the ultimate strength region were performshy
ed by I-C Chen(6) in 1967 on two 14WF30 beams each containing
two large openings in their webs One simply supported beam
containing two 8 inch diameter circular openings spaced 8
inches apart was found to fail in the manner of a be~u conshy
taining only one opening failure being associated with the
opening subjected to the largest moment both being under
the same shear force In the second beam containing two
8x12 inch reotangular openings spaced 4 inches apart the two
openings failed as a unit with four hinges forming at the
outer oorners opoundthe openings and the web between them evenshy
tually buckling No theoretioal ultimate strength analysis
was offered by Chen
21
In 1968 JEBower(16) proposed an ultimate strength
theory for beams containing a single rectangular opening in
their webs A point of contraflexure for Vierendeel stresses
was assumed to occur at the midlength of the opening and
three alternate stress distributions were proposed for
complete yielding of the low moment edge of opening The
first of these stress distributions assumed no Vierendeel
action and was quickly discounted as giving unrealistically
high predictions of strength The two remaining stress
distributions both took into account secondary bending moments
due to shear the first assuming localized web yielding in
shear and the second assuming uniform shear distribution
over part of the web with this area yielding in combined
bending and shear The first of these lower bound solutions
was based on an unrealistic stress distribution and proved
to give unrealistically low predictions of the beam strength
The second lower bound solution which was finally adopted
by Bower was based on a more realistic stress distribution
but was restricted in that the point of contraflexure was
assumed at the midlength of the opening which is not always
the case
Experiments were performed on four 16WF36 beams each
oontaining one rectangular opening as part of this work
Collapse loads are oited for each of the test beams and are
22
compared with predictions from the second lower bound analysis
However since all of the beams were tested at relatively high
ratios of shear to moment considerable strain hardening
would have occurred before collapse and experimental results
which take advantage of the reserved strength due to this
strain hardening (even though accompanied by large deformashy
tions) cannot justifiably be compared to a theory that ignores
this effect
A more general ultimate strength analysis for beams with
rectangular openings was offered by RGRedwood(17) also in
1968 A point of contraflexure was assumed to occur someshy
where within the tee section above and below the opening but
its location was not dictated as in Bowers analysis A
four hinge mechanism was assumed on the basis of previous
tests(13) with stress distributions assumed at both high
and low moment edges of the opening Shear stresses were
assumed carried by the entire web of the section with web
yielding occurring in combined bending and shear
Redwoods analysis was correlated with his previous
experimental investigations and found to be conservative
when shears were large But again the effects of strain
hardening were included in the experimental collapse loads
and not in the theory If the experimental failure loads
could be related to the occurrence of full yielding at the
23
critical sections a more valid comparison with the theory
would result Such a comparison was taken into account by
Redwood in a later paper(la) In this paper failure is defined
in a way similar to that suggested in the previous section
Another recent paper by Redwood(19) deals with beams
containing multiple unreinforced openings in their webs A
method is offered for determining the minimum spacing required
between openings to prevent their interaction and failure
as a unit An analysis is also given for determining the
strength of a member when failure is associated with more
than one opening and this is combined with Redwoods analysis
offered previously(17) for failure associated with only one
opening The theory is compared to the experimental work
performed by Chen(6) in 1967 (7)In 1964 EPSegner Jr conducted an investigation
of several types of reinforcing for rectangular openings
testing six wide-flange beams in four different sizes each
containing two or more openings The openings in five of
the six beams were reinforced each With one of five main
types of reinforcing The openings were positioned at
several different moment to shear ratios and each of the
beams was tested to destruction Unfortunately little can
be said about the performance of the different types of
reinforcing under varying moment-shear conditions because
24
of the large number of variables included in each of the tests
Perhaps Segners most significant contribution is to be
found in his cost comparison of the various types of reinshy
forcing for rectangular openings Estimates cited for six
different fabricators clearly indicate that shear-type reinshy
forCing or reinforcing designed to carry high shear forces
around the opening is economically non-feasible except in
unusual circumstances The most economical type of reinshy
forcing included in this study consisted of two flat plates
bent to fit the shape of the opening and welded inside the
opening with a small gap between them occurring at the midshy
depth of the opening This is the same type as shown in
Figure la Another type of reinforcing included in Segnerts
experimental work but unfortunately omitted from his eco~
nomic comparison consisted of straight horizontal reinforcshy
ing plates welded above and below the opening at the openingis
boundary The plates extended past the vertical edges of the
opening to allow for anchorage of the plate Considerable
welding problems were said to have been encountered by placing
the reinforcing flush with the upper and lower edges of the
opening since the fillet was likely to overrun into the radii
of the re-entrant corners but this could easily be overcome
by leaving a small web stub between the plate and the opening
to allow for welding This type including the modification
25
for welding purposes is that given in Figure lb
Although this reinforcing type was not included in the
economic comparison presented by Segner it would seem to be
of only slightly greater cost than that in Figure la
Approximately the same amount of reinforcing material is
needed for these two types and while the straight bar reinshy
forcing requires more welding it does not require bending
of the plates and eliminates the worry of fit between the
plate bends and the opening radii After giving careful
consideration to the economics and fabrication problems of
reinforcing a rectangular opening in the web of a beam it
was decided to devote the present investigation to reinforcshy
ing of the horizontal straight bar type
24 Scope of the Investigation
An ultimate strength analysis is presented for wideshy
flange beams containing large rectangular openings in their
webs and reinforced with straight bar reinforcing above and
below the openings The investigation includes the effect
on beam strength of variable opening depth to beam depth
opening length to depth reinforcing Size and moment to
shear ratio One lOWF21 and ten l4WF38 beams were tested to
collapse Each of the test beams contained one rectangular
opening centered at the middepth of the beam and ten of the
26
eleven openings were reinforced Deflections were measured
at several pOints for all of the test beams and each beam
was painted with a brittle coating of whitewash in the region
of the opening to obtain an indication of the order of onset
of yielding Four of the test beams were also equipped with
electrical resistance strain gauges at critical sections The
experimental investigation encompassed each of the variables
of the theoretical work
27
CHAPTER III
ULTI1iATE STRENGTH ANALYSIS
31 Assumptions
Based on the discussions in the previous chapters the
following assumptions are made in this analysis of reinforcshy
ed rectangular openings with horizontal reinforcing bars
1 Failure of the member takes place by formation of a four
hinge mechanism with hinge locations being at the corners
of the opening These locations are shown in Figure 7a
a cross-section through the opening being given in Figure
7b
2 A point of contraflexure occurs somewhere within the
length of the tee section Its location is the same
above and below the opening but this location is not
dictated
3 Stress distributions at high and low moment edges of the
opening are those shown in Figure 8b Since the stresses
are antisymmetric with respect to the vertical axis of
the beam only the stresses for the tee-section above
the opening are indicated The resultant forces acting
on the tee-section are shown in Figure 8a
4 Shear stresses are carried only by the web of the teeshy
section and are uniformly distributed across this web at
28
hinge locations when hinges are fully formed While
the shear stress at the boundary of the opening must be
zero this assumption introduces only very slight error
into the theory since these stresses can increase from
zero to their maximum value at a very small distance from
the opening 1 s boundary_ Due to the presence of the reinshy
forcing bar it is likely that most of the shear will be
carried by the region of web between the reinforcing bar
and the flange particularly when the secondary bending
stresses are very high This is further discussed in
Section 34 and introduces no significant error in the
development of this method
5 Yielding in the web occurs lliLder combined bending and
shear according to the von Mises criterion stated in
equation (2) Yielding in the flange and reinforcing is
in direct tension or compression
On the basis of the assumed stress distributions equishy
librium equations can be obtained for the tee-section at
values of the shear force which may vary in some cases
from zero up to the maximum as given by equation (5) At
the high moment edge of the opening section (1) in Figure
Bb stress reversal will occur within the web when the shear
force is relatively low (case I) but will occur within the
flange when the shear force is high (case II) These two
29
cases will be repounderred to as low and high shear conditions
respectively_ Three different locations of stress reversal
are possible under the low stress conditions
1 Reversal in the web stub below the reinforcing This
occurs at very low values of shear
2 Reversal in that portion of the web to which the reinshy
forcing is attached
3 Reversal in the clear web between reinforcing and flange
The range of shear values corresponding to reversal in
this region is very small
At section (2) the low moment edge of the opening for
practical situations reversal will occur only in the flange
32 Low Shear Solution - Case I
Consider equilibrium of the portion of the beam to the
right of Section (2) in Figure 7a Taking moments about
section (2) gives
where V denotes shear force as before F2 is the resultant
force at section (2) and Y2 is the distance from the edge of
the opening to the resultant normal F2bull All other symbols
used in this section and not specifically defined here are
defined in Figures 7 and 8 Taking moments about section (1)
30
for that portion of the beam to the right of this section
yields
(8)
where Fl and Yl are comparable to F2 and Y2 respectively
Equilibrium of the tee-section in Figure 8a requires that
(9)
Oonsideration of the assumed stress distribution at section (1)
for stress reversal occurring in the web stub below the reinshy
forcing ie for 0 =klS ~ u gives on integrating the
stresses
Fl = Af ~yf + SW(1-2~)G + Ar ~yr (10)
FIYl = Af ~ Yf(s~) + ~S2WG(1-2ki) + ArJ yr(u1) (11)
where Af = bt the area of one flange and Ar = q(c-w) the
area of one pair of reinforcing bars Separate yield stress
values are used for flange web and reinforcing because of
the large variation possible in these in a single beam A
discussion of the determination of these stresses is included
in Chapter 5 Yield stresses are designated as ~ yf for the
flange G yw for the web and ~ yr for the reinforcing
31
and ~ the normal stress carrying capacity of the web is
calculated from
t2 _ r- 2 3(V)2 ~ - yw-4sw (12)
and is another way of stating the von Mises yield criterion
given by equation (2) From consideration of the stress
distribution at section (2) for stress reversal in the flange
F2 = Af ltS yf(1-2k2) + sw ~ + Ar c yr (13)
F2Y2 = Al~Yf [S(1-2k2)~(1-4k2+2k~)J -1-s2Wlti +Ar~ yr(u~) (14)
Although explicit expressions for shear and moment capacity
cannot be determined from the above equations it is possible
to obtain from them that portion of the interaction curve
relating combinations of shear and moment at midlength of
opening to cause collapse of the beam for shear values in
the assumed range Consideration of other locations of stress
reversal will yield expressions from which the remainder of
the interaction curve can be determined
Specifically for 0 ~ kls ~ u kl can be determined as
a function of k2 from equations (9) (10) and (13) and is
given by
32
From equations (7) (8) (11) and (14) a quadratic expression
is obtained for k2 in terms of known quantities and V
Z [AfCSyf ] Vak2 (sw cs ) s + t + k2 ( -d+2h) + A G = 0 (16 )
f yf
For a given value of V equations (12) (15) and (16) can be
used to determine the corresponding values of kl and k2bull Fl
can then be calculated from equation (10) and FIYl from equashy
tion (11) The moment at mid1ength of opening is then detershy
mined from
(17)
Thus for a given value of V a corresponding value for M can
be obtained The values of kl and k2 must be checked when
calculated to determine whether initial assumptions of
o ~ k1s ~ u and 0 ~ k2 ~ 10 have been met Only one solution
to the quadratic equation in k2 will fulfill these requireshy
ments unless both solutions are equal The above equations
will yield a value for M for a given value of V starting at
V = 0 and continuing for increments in V until the location
of stress reversal at section (1) moves into the region where
the reinforcing is attached ie for kls gt u When this
occurs neither solution to equation (16) will yield values
of k1 and k2 that satisfy the initial assumptions and the
33
initial equations for stress resultants at section (1) must
be replaced by new equations reflecting this change Quite
simply equations (10) and (11) are replaced by
respectively for u ~ kls ~ (u+q) Equations (13) and (14)
remain unchanged for section (2) since reversal will occur
only in the flange at this section Thus for u ~ klS ~ (u+q)
ie for reversal within the reinforcing equations (9)
(13) and (18) yield
Similarly from equations (7) (8) (14) and (19)
- (d-2h)]
va u 2( c-w) Go s ( c-w) G
+ + [ _----oiOioV] [ yr IJ = 0 (21)AfGyf Af csyf sw cs- + s c-w) csyr shy
The same procedure is followed as in the previous case
first V being assumed ~ being obtained from equation (12)
34
k2 from equation (21) kl from (20) Fl from (18) FIJl from
(19) and finally from equation (17) the value of M correshy
sponding to the assumed value of V Again the values
obtained for kl and k2 must be checked to assure that the
initial conditions of u ~ kls ~ (u+q) and 0 ~ k2 ~ 10 are
met These equations will yield admissible values of kl
and k2 for values of V increasing from the last admissible
value obtained by solution of the previous set of equations
and continuing to where kls reaches the value (u+q) ie
for stress reversal in the clear web at section (1) ~nen
(u+q) ~ kls ~ s equations (18) and (19) are replaced by
(22)
and equations (9) (13) and (22) give
(24)
While from equations (7) (8) (14) and (23)
(25)
35
For a given value of V a corresponding value for M is
determined in the same manner as for the two previous cases
Acceptable solutions will be obtainable as long as the stress
reversal at section (1) falls within the clear web However
when this reversal occurs in the flange the so-called high
shear solution is indicated
33 High Shear Solution -Case 11
When the shear force is high stress reversal at section
(1) occurs in the flange and the equations for resultant
normal force and moment arm from the edge of the opening
become
Fl = Af ltS f(2k -1) - sw~ - A C (26)Y 1 r yr
The stress reversal at section (2) will still occur in the
flange and equations (13) and (14) are used with the above
equations and equations (7) (8) and (9) to obtain
(28)
(29)
36
For a given value of V a corresponding M is obtained from
the above equations and equations (12) and (17)
By starting with a value of V = 0 and increasing this
by a small increment with each successive iteration correshy
sponding values of M can be found for the full range of V
values by use of the equations in this and the previous
section An interaction curve can then be plotted relating
V and M over their full range of values A typical intershy
action curve is shown in Figure 9 for a beam containing a
reinforced opening where the curve has been nondimensionalized
by division of V and M by Vp and Mp respectively Also
indicated in this curve are the four regions corresponding
to the different locations of stress reversal at the high
moment edge of the opening
34 Limits of Interaction Curves
It is quite possible for the MM values for a certainp range of VV values on the interaction curve to be greaterp than 10 as can be seen in Figure 9 This simply means
that the reinforced opening can be stronger than the unperfoshy
rated beam for pure bending and for bending with very low
shear However values of MM greater than 10 have no realp practical significance because in such cases failure of the
beam would occur not at the opening but at some unperforated
37
portion of the beam near the opening Therefore 10 is
taken as the maximum value of MM and a horizontal line isp drawn at this value from the MM axis to intersect thep interaction curve This is shown in Figure 9
The interaction curve is also limited with respect to
the maximum VV value permissible Since shear forces canp only be carried by the remaining part of the web the maximum
plastic shear capacity at the opening is equal to V thep plastic shear capacity of the uncut section times the ratio
of the remaining clear web to the initial clear web This
is written as
d-2t-2h (6)= d-2t
In other words when the web of the section at the opening
has yielded in shear its normal stress carrying capacity
~ becomes zero The value of V at which this occurs can be
determined from equation (12) and the ratio of this shear
value to Vp is given by equation (6) Vmen this limiting
value of shear is reached it is no longer possible to obtain
additional points on the interaction curve because any
further increment in V would yield an imaginary solution for
~ Rather when(VVp)max is reached a line is drawn from
this last point on the interaction curve perpendicular to
38
the vVp axis This line is the final portion of the intershy
action curve and represents the actual limiting value of
This limiting value of VVp is however not always
reached for all practical sizes of beam opening and reinshy
forcing It is possible for the equations in the previous
two sections to yield values of kl and k2 that no longer
conform to initial assumptions (for any position of stress
reversal) at a shear value less than the maximum predicted
by equation (6) This occurred in some of the cases tested
to confirm the consistency of these equations and was found
to be caused by an imaginary solution to the quadratic in k2
occurring while stress reversal at section (1) was still in
the clear web of the section Stress reversal at section (2)
was as assumed in the flange Consideration of other
locations of stress reversal did not give real answers This
condition was then investigated and it was found that because
of an interdependence of opening length and reinforcing area
either the opening length must be less than a given value or
the reinforcing area greater than another value in order
for the interaction curve to be able to pass this region
The limiting half length of opening a is given by
(30)
39
and is obtained by combining equations (7) (8) (14) (23)
and (24) with ~ equal to zero By eliminating small terms
this may be simplified to
(31)
Alternatively the minimum area of reinforcing required is
given by
A =2 ( 32) r 13
If this requirement is met it will be assured that the
maximum shear capacity of the section will be reached
Physically the interdependence of reinforcing area and length
of opening can be interpreted to mean that as opening length
is increased the secondary bending stresses which are a
function of shear and opening length increase at sections
(1) and (2) to such an extent that unless the reinforcing
area is increased so that it can carry these high stresses
the lower portion of the web is forced to carry such high
bending stresses that little or no shear can be carried by
this portion of the web The shear stress can then no longshy
er be considered to be uniform across the entire web of the
tee section but instead is restricted to the clear web
between flange and reinforcing or to a portion of this area
40
Reaching the maximum value of vVas given by equationp
(6) is not a necessity either for the interaction curve or
for the performance of a given beam and opening A given
interaction curve is still correct if it terminates before
reaching this value of vVp This occurs when the MMp value
decreases rapidly for very small increments in vvp and
becomes zero In this case the last portion of the intershy
action curve is very nearly a vertical line This line then
represents the actual maximum shear capacity for the given
beam opening and reinforcing dimensions Only when a beam
is to perform under high shear conditions and it is desired
to develop its maximum shear capacity is it necessary to
ensure that Ar is large enough so that this value can be
reached
41
CHAPTER IV
APPROXIMATE METHOD
41 General Remarks
If a particular beam and opening size is being investishy
gated over a very limited range of shear values it is a
fairly straightforward matter to calculate the moment capacity
of the beam corresponding to the given shear values using
the equations presented in the previous chapter hven if the
location of stress reversal were consistently assumed in the
wrong region the calculations would have to be repeated at
most four times for a particular shear value However it is
quickly realized that for a large range of shear values or
for a complete interaction curve it would be extremely
laborious to perform these calculations by hand and recourse
to automatic computation would seem almost essential A
computer program has been developed to perform the necessary
calculations for a complete interaction curve for a specified
beam opening and reinforcing size and is given in Appendix A
Since the practical development of a complete interaction
curve is seriously limited by the length of calculations
involved a simple to use approximate method is suggested for
determining the strength of a perforated beam at various
moment to shear ratios In the development of this approxishy
42
mate method the high shear region only is considered for
reasons which will become evident
42 DeveloEment of the Method
Combination of equations (3) (12) and (28) result in
the following expression
(33)
where for simplici ty ~I~- - ~Y= ~~ t the specified minimum
yield stress of the material Similarly equations (1) (17)
(26) (28) and (29) can be combined to give
M d(kl -k2) + t(k~-ki) (34) ~ = a-i) + wtf2t)~
Xf
and from equations (12) (28) and (29) kl and k2 are related
by
(35 )
If it is now assumed that the flange thickness is significantshy
ly less than half of the remaining clear web tlaquo s the
above expressions can be readily simplified Since (u+~) is
43
of the same order of magnitude as t it is also assumed that
(u+~) laquo By eliminating small terms and substituting for
kl+k -l-x = ~ equation (35) can be simplified to2 f
(36)
This simple quadratic can readily be evaluated for~ In
general both solutions will be real although for a wide
range of beam and opening sizes investigated the solution
corresponding to a minus in the quadratic formula was found
to fall within the region of low shear on the interaction
curve (as defined in the previous chapter) while the solution
corresponding to a plus consistently fell in the medium to
high shear region thus satisfying the initial assumptions
This latter solution was therefore considered to be the
correct one and the corresponding value for ~is given by A 2as [ 2 ] 12_2s2( r) + w2(s2~) _ 4A2
IS = If f)Af 3 r ( 37 ) - (s2 + 4a2 )
T
which may be rewritten as
_2~(Ar + l(Aw) ( 2h)2 1 ( r 2 ~ C = 1+01 If) 2 If l-er ~ - 16 X)(l+o)~ (38)
where Aw = wd and 0lt = i(~)2(k - 1)2
Equation (34) can also be simplified by eliminating small
44
terms and by considering that for the transition from low to
high shear to occur kl must equal unity Equation (34) then
becomes
M (39 )M= p AW
1 + 4A f
Similarly equation (33) can be simplified to
(40)
For zero or very small values of ~ the above equation can
yield values of VV greater than the maximum VVp value as p
given by equation (6) This implies that some portion of the
shear is carried by the flanges of the beam Since the flanges
can in fact carry some shear and since the theory as given
in Chapter III is sufficiently conservative for large shear
values (as can be seen from the experimental results given
in Chapter VI) equation (40) is not considered to predict
excessive values of shear capacity and is adapted for use in
this method of analysis The shear capacity is then given
by equation (40) and the corresponding maximum M~Ap value at
this shear value is given by equation (39) where ~ is given
by equation (38)
The maximum shear capacity of the section is given by
45
equation (40) when ~ is equal to zero Solution of equation
(38) for Ar when ~ equals zero gives the required reinforcing
area necessary to reach the maximum shear capacity of a secshy
tion This is given by
- AW(l 2h) flA (41)r - T -a-~
Equation (41) reduoes to equation (32) in Chapter III when
substitution is made for ~ When the reinforcing area
conforms to the above requirement the maximum shear capacshy
ityas given by
V 2hr = (I-a-) (42) p
will be reached and the corresponding maximum moment capacshy
ity at this value of shear is given by
Ar 1 - A
M fr= A p 1 + w
4Af Thus for a given beam opening and reinforcing size if
equation (41) is satisfied equations (42) and (43) together
fix one point on the approximate interaction curve while if
equation (41) is not satisfied this point is fixed by equashy
tions (38) (39) and (40) In either case a line is dropped
from this point perpendicular to the vvp axis thus forming
46
part of the approximate interaction curve The remainder of
the curve is obtained by connecting the point given by equashy
tion (42) and (43) or by equations (38) (39) and (40) with
a point on the M~Ip axis corresponding to the maximum moment
capacity of the section This maximum value of blfvl isp simply the plastic moment of the reinforced perforated secshy
tion divided by the plastic moment of the unperforated secshy
tion and is identical to the same point obtained in the
previous chapter with no shear force acting The maximum
value of Mi1p is given by
Z - wh2 + Arlt 2h+2u+q) = ---------w----------shyZ
or using a consistent approximation for Z this can be
rewri tten as
M A (45 ) M=
p 1 + w4Af
An approximate interaotion curve is given in Figure 9 for
comparison with the interaction ourve obtained by the method
desoribed in Chapter Ill
43 Limitations of the AEproximate Method
The maximum praotical M~lp value for the approximate
47
interaction curve is limited to 10 for the same reasons that
the more exact curve is so limited and a horizontal line
drawn from the MA~p axis at 10 and intersecting the approxshy
imate curve forms its upper portion The maximum value of
VVp for the approximate curve is limited to VVp max given
by equation (42) This limitation has been discussed in the
previous section
Equation (41) specifies the minimum size of reinforcing
necessary to reach the maximum shear capacity of the section
as given by equation (42) yVhen the reinforcing area conforms
to this minimum requirement equation (43) is used to predict
the moment capacity of the section corresponding to the shear
value of equation (42) Examination of equation (43) reveals
that as the reinforcing area is increased past the minimum
given by equation (41) the moment capacity decreases rather
than increases as would be expected from physical considershy
ations or from examination of interaction curves obtained
by the methods of Chapter Ill For sizes of reinforcing
only slightly greater than that given by equation (41)
equation (43) will be sufficiently accurate and will not
significantly underestimate the moment capacity of the secshy
tion although it may be deSirable to replace Ar in equation
(43) with the minimum Ar given by equation (41) Equation
(43) then becomes
48
A 2h l1 - ~(l-a)J~
M ( 46)~= A 1 + W
4Af This may be written more simply as
aw 1 - 73Af
= ---1-shyA 1 + w
4Af The corresponding shear value is given by equation (42)
However as Ar increases more and more above the value
given by equation (41) the moment capacity of the section
will be increasingly underestimated and if more accurate
values are desired recourse must be made to more accurate
methods Examination of equation (38) reveals that as Ar
increases past the value given by equation (41) 0 becomes
negative up to the point where
when the solution for cgt becomes imaginary For values of
Ar lying between those given by equations (41) and (48) ~
is negative and equations (39) and (42) can be used to
accurately predict the point on the approximate interaction
curve from which a perpendicular line should be dropped to
the VVp axis and a line drawn to the point given by equation
(44) on the MM axisp
49
Al though for this case a value exists for (gt equation
(42) rather than (40) is used to determine the shear capacshy
ity of the section This is the only logical approach beshy
cause Ar is greater than that required to reach the maximum
shear capacity and increasing the reinforcing area although
it cannot increase the shear capacity of the section past
that given by equation (42) also should not serve to decrease
this capacity
When Ar is greater than the value given by equation (48)
equation (39) cannot be used to obtain a more accurate preshy
diction of moment capacity because 0 as given by equation (38)
will not be real Consideration of the equations used in
deriving the approximate method leads to the conclusion that
will be imaginary only when the maximum shear capacity of
the section is reached while klslaquou+q) Equation (48) shows
the relation between reinforcing area and size of opening for
this to occur It can be seen that small opening size or
large reinforcing size will eause the maximum shear capacity
to be reached while kls (u+q) When this occurs equation
(42) predicts the shear capacity of the section since Ar is
greater than that required by equation (41) to reach this
maximum shear value At this value of shear ~ equals zero
and equations (17) (20) and (21) in Chapter III reduce to
(49a)
(50)
50
A q (5la )
M = _l_l_qdA_rf=--[2_U_2_+__(2_U_+_q_)_+_2_h_(_2U_+_q_)_-_2_(_k_l_S_)2_-_4_k_l_S_h_J_-_~_~_(_~~)
Mp Aw 1 + 1iA
f
By considering t laquo d equations (49a) and (5la) can be further
simplified to
(49)
(51)
Equations (49) (50) and (51) can then be used with equation (42)
to determine the pOint of intersection of the two lines composing
the approximate interaction curve
44 Summary and Discussion
Determination of the approximate interaction curve can be
summarized as follows
Case I
The maximum shear capacity of the section will be reached
if
A 2 AW(l_ 2h) fT (41)r 4 d 4a where a = ~(h)2(~ _ 1)2 The maximum shear capacity is then4 a 2h bull
given by
V (1 _ ~h) (42)Vp =
51
and the moment which can be attained with this shear acting
is Ar
1- ri- = Af (43)
p 1 + w 41f
where Ar is that given by the right hand side of equation (41)
Case 11
If equation (41) is not satisfied the maximum shear
capacity will not be reached and the shear capacity is given
by
(40)
The moment capacity which can be attained with this shear
acting is
1 1 + w
4Af where ~ is given by
A A _ ~( r) + l( w) ( 2h)2 1 ( r)2 0 ( )~ - 1+ltgtlt Af 2 If l-T 1+CgtI - 16 -x (l+olt)l 38
Case Ill
If Ar is significantly greater than that given by equashy
tion (41) the maximum shear capacity will still be given by
52
but if desired a more accurate estimate of the moment which
can be attained with this shear acting can be obtained as
follows
Case IlIA
For (48)
MMp at maximum VVp is given by
Ar 1 - I - ~
~ = __f_~_ ill A
P 1+ w4If
where r will be negative and is given by
(38)
Case IIIB
For A2 gt (aw) 2
+ (~)2w2 (48)r 3 ~
at maximum VV is given byp A A
1+-f(2h)__1_ JL (ha) (2dh ) (1+ 2dh )Af d 2[j Af (51)
A1 + w
4Af
53
where kl and k2 are given by
+l (50)s
(49)
and only that solution satisfying the conditions 0 ~ k2 ~ 10
and u ~ kls ~ (u+q) is correct
The appropriate one of these three cases can be used to
determine a point on the approximate interaction curve A
perpendicular line is then dropped from this point to the
vVp axis and forms part of the curve The remainder of the
curve is obtained by drawing a straight line from the initial
point to a point on the MMp axis given by equation (44) or
(45) and by then cutting off the approximate interaction curve
at the maximum Mlyenip value of 10 as described in the first
paragraph of this section
Complete and approximate interaction curves for each
size of beam opening wld reinforcing included in the expershy
imental part of this investigation are shown in Figures 10
through 15 A cross-section of the member is shovm on each
curve for reference and the method used in obtaining each of
the approximate curves is stated On Figures 11 14 and 15
the reinforcing size was greater than that given by equation
(41) and both Case I and Case III were used to obtain approxshy
54
imate curves for comparison It can be seen that only when
the reinforcing area was significantly greater than that
given by equation (41) (Figure 11) was there a large difshy
ference in the Case I and Case III values
For the partioular case of unreinforced openings by
substituting for Ar equal to zero in equations (39) and (40)
these reduoe to
M AW 2h 1
1 - 2If(l-or~ r= A (52)
p 1 + w4If
v (2h)JTr = I-d~ p
where ~= i(~)2(~ - 1)2 as before These equations are
identioal to those given by R_GRedwood(17) for unreinforced
openings Again a perpendioular is dropped from the point
defined by these two equations to the vVp axis and another
line is dravln from this point to a point on the MMp axis
given by
111 Z - wh2 (54)r = z
p
thus oompleting the approximate interaction curve for the
case of an unreinforoed opening Using the same approxishy
mations as used previously equation (54) oan be written
55
MM = 1 (55) p
which agrees with Redwoods work and gives a slightly highshy
er value for the maximum MM value A complete and approxshyp imate interaction curve for a section containing an unreinshy
forced opening is given in Figure 12 where the equations
given by Redwood(17) were used for the complete curve
56
CHAPTER V
EXPERIMENTAL INVESTIGATION
51 Selection of Test Beams
As discussed in Chapter I it was decided to limit this
investigation to rectangular openings reinforced with straight
horizontal strips welded above and below the opening It
was also decided to use a standard wide-flange beam rather
than a welded section because of the usual use of these in
building structures where openings are most oommonly requirshy
ed ASTM A 36 structural steel was used throughout all
of the experimental work because this material was used in
most of the previous investigations related to this work
The size of the test beams was chosen on the basis of
economy ease of handling and ease with which reinforcing
bars could be welded in place It was decided to use a secshy
tion that was compact at the specified yield stress and
also at the higher yield stresses expected in the test
beams In the selection of test beams only sections with
low depth to thickness ratios were conSidered in order to
avoid the problem of web instability The flange width to
thickness ratio was also kept as low as possible in order to
avoid premature compression flange buckling On the basis
of these considerations and after a preliminary test pershy
57
formed on a 10VF21 section it was decided to carry out the
remainder of the experimental investigation using a 14WF38
section of A 36 steel The properties of the test beams
used are listed in Table 1 A nominal opening depth to beam
depth ratio of 05 was chosen because of the practical need
for openings of approximately this depth in larger beams and
also because investigations of unreinforced openings were in
this range One test beam included in this work had a nominal
opening depth to beam depth ratio of 0643 A basic opening
length to depth ratiO or aspect ratiO of 15 was chosen
again from practical considerations Two beams were includshy
ed with aspect ratios of 20
The corner radii of the opening had to be large enough
to avoid excessive stress concentrations that might cause
premature cracking of the corners and yet small enough to
not appreciably decrease the effective area of the opening
In previous investigations corner radii ranged from 14 to
one inch A 58 inch radius was used in this study for the
14WF38 beams and a 316 inch radius for the 10WF21 beam
The area of reinforcing for each opening was chosen so
that the moment capacity of the unperforated member would be
equalled or exceeded and the full shear capacity of the net
section could be utilized The moment capacity condition
requires that
58
wh2 gt- (56)2h + 2u + q
This follows from equation (44) The reinforcing area reshy
quired to meet the shear condition is given by equation (32)
in Ohapter 111 It was found that for the 14WF38 beam used
in this investigation with 2hd equal to 05 ~~d ah equal
to 15 the area of reinforcing required to meet these condishy
tions was approximately ~vice that given by the right hand
side of equation (56) One beam was tested in the high shear
range with reinforcing such that the interaction curve fell
short of VVp msx Again it should be mentioned that the
length u is that required for welding the reinforcing in
place and should be as small as possible The width of the
reinforcing bars q was chosen so that the width to thickshy
ness ratio did not exceed 85 as specified by the design
code(910) for ultimate strength design The anchorage
length of the reinforcing bars was also designed by use of
the AISC and OISO design codes on the basis of develshy
oping the full strength of the reinforcing bars at the edges
of the opening The ultimate strength loads were taken as
167 times those for elastic design as recommended by the
codes
The openings in all of the test beams were flame cut
the 10WF2l beam number lA having the corners drilled before
59
cutting and then having the rough edges ground to the proper
size Beams numbered 2A 2B and 3A were entirely poundlame cut
including corners and were not poundinished poundurther The remainshy
ing beams had drilled corners with the rest of the opening
being poundlame cut They were not finished poundUrther
All test beams were simply supported and were loaded with
a single concentrated load The openings were positioned so
as to achieve the desired moment to shear ratios and all
openings were centered at the middepth opound the beam All beams
were locally reinpoundorced with cover plates so as to ensure
poundailure at the openings and web stipoundfeners were added under
the load and at reaction points Local reinpoundorcing was deshy
signed on the basis opound resisting the loads predicted by the
interaction curves plus the expected increase in loads above
this due to strain hardening Beam Sizes opening locations
and local reinpoundorcing are shown in Figures 16 17 and 18 poundor
each opound the test beams
52 Experimental SetuE
All beams were tested in a Baldwin-Tate-Emery 400k
Universal Testing Machine which is a mechanically operated
hydraulic testing machine opound 400k capacity The ends opound the
beam were supported by a specially reinpoundorced 14 inch wideshy
poundlange section that also poundormed part of the lateral bracing
60
system This is shown in Figures 19a and 20a Lateral bracshy
ing consisted of support against horizontal displacement and
rotation at pOints of load and at end reactions Bracing
for the beams numbered lA 2A and 3A was achieved by the
attachment of horizontal 8 inch wide-flange beams to the
vertical portion of the end supports with the 8 inch secshy
tions running the entire length of the test beams on each
side and positioned so that pins could be inserted at bracshy
ing points between the 8 inch sections and the top flange of
the test beam to allow for only vertical displacements of the
test beam The pins were given a heavy coating of grease to
minimize friction This type of bracing proved satisfactory
but made it very difficult to see parts of the test beam durshy
ing the test To alleviate this visual problem beam 2B was
tested with the lateral bracing described above on only one
side of the beam while for the other side vertical bars
attached rigidly to the 8 inch sections and bent to pass
over the test beam were held tightly against the upper flange
of the test beam at bracing points This arrangement proved
unsatisfactory and was not used for subsequent tests
For testing the remaining beams short 8 inch wide-flange
sections were attached vertically to the vertical portion of
the end supports and greased pins were used to provide latershy
al bracing at these locations (Figures 19b and 20b) Lateral
61
bracing at the point of load was provided by roller bearings
- two on each side of the test beam spaced 6 inches apart
vertically and bearing against the web stiffener of the beam
The roller bearings were attached to triangular sections
which in turn were attached to a wide-flange section held
rigidly to the laboratory floor See Figures 19c 20c
and 20d This type of lateral bracing provided nearly
frictionless vertical displacement of the beam while preshy
venting rotation and horizontal displacements and proved
to be very effective Access to the beam during testing
was not at all limited by this bracing system
Deflection dial gauges with a least reading of 0001
inch were used to determine deflections at points of load
end supports edges of openings 2 inches outside each openshy
ing edge and at centerline of beam when possible All dial
gauges were rigidly fixed to non-yielding supports Their
positions are indicated in Figures 16 17 and 18 Four of
the test beams were equipped with electrical resistance strain
gauges in the vicinity of the opening The locations of
these gauges are shown in Figure 21 Each test beam was
painted with an opaque brittle coating of whitewash - a
mixture of lime and water of the consistency of light cream
applied in the vicinity of the opening at least one day before
testing During testing this coating of whitewash flaked
62
off in minute pieces in areas undergoing plastic strains thus
indicating visually which sections of the beam had yielded
The flaking occurred at loads higher than those correspondshy
ing to yielding of each section and did not give an accurate
measure of the onset of yielding but instead gave an estishy
mate of the order in which each of the sections yielded
53 Testing Procedure
Essentially the same procedure was followed in testing
each of the beams The beam was first placed in position on
its end supports a fixed roller under one end and a free
roller under the other The bema was made level and centershy
ed with respect to its loading point and end supports
Lateral bracing was then fixed in place and the head of the
machine brought into contact with the specially hardened
roller through vhich the load was applied to the beam Dial
gauges were then put in position and strain gauge leads
connected to the Budd Automatic Strain Indicator A small
initial load was then applied to the beam and zero readings
were taken for all strain and dial gauges
At least four load increments of either lOk or 20k were
applied within the elastic range with all gauge readings beshy
ing recorded for each load increment When the first inshy
elastic response of the beam was noted either from strain
63
gauge readings on the beams that were so equipped or by
deflection vdth time of any of the dial gauges the load
increment was reduced to 5k and after each load increment was
applied all plastic flow was allowed to take place before
readings were taken To determine whether plastic flow had
ceased at each load increment dial gauge readings were plotshy
ted against time When the S-shaped curve reached its upper
portion and levelled out plastic flow had ceased and readshy
ings were taken During this time required for plastic flow
as much as 30 minutes for higher loads it was important to
hold the load on the beam constant Loading continued in
this manner until the ultinlate collapse of the test beam
either by web buckling at the opening or by tearing of one
or more of the openings corners When this occurred the
beam was no longer able to maintain the applied load The
load was then removed and the beam was taken out of the test
frame
54 Determination of Yield Stresses
In order to accurately access the expected strength of
each of the test beams it was necessary to determine their
actual yield stresses This was accomplished by the testing
of tensile coupons cut from the flange ana web of the beams
and from the reinforcing strip used at the openings The
64
dimensions of a typical tensile coupon are given in Figure 22a
and the locations from which such coupons were taken are shown
in Figure 22b The beams from which coupons were to be taken
were ordered an extra 12 inches long so that this section could
be cut off and tensile coupons made and tested before the testshy
ing of the actual beam Reinforcing strip was ordered an extra
36 inches long for the same purpose Test beams 2A 2B and
3A were all cut from the same beam and were all reinforced
from the same reinforcing strip Test beams 2C 2D 3B 4A
4B 5A and 6A were all cut from the same beam Reinforcing
for beams 2C 2D 4A and 4B was all cut from the same strip
Each of the tensile coupons was tested in either a 20k Riehle
or a 20k Instron Testing Machine Coupons tested in the
Riehle machine were tested under nearly constant load rate
An extensometer was attached to the coupons to automatically
record the stress-strain curves Since the crosshead
position could not be fixed on this particular machine
a static yield stress could not be obtained and therepoundore
only the lower yield stress is given in Table 2 Tensile
coupons tested in the Instron machine were loaded at a
constant cross head speed of 002 inches per minute When
the plastiC plateau was reached the crosshead position was
fixed and the load was allowed to drop off After about five
minutes the static yield stress had been reached and no
65
further change in load could be seen on the automatically
recorded stress-strain curve Straining was then allowed to
continue into the strain hardening range A typical stressshy
strain curve for a coupon tested in this machine is given in
Figure 23 Lower yield and static yield stresses are given
for coupons tested in the Instron machine in Table 2
Either the static yield or the lower yield stresses can
be used in determinimg the expected strength of a test beam
depending on which more closely approaches the actual test
conditions of the beam In this investigation the beams
were tested under loading increments with the loads being
held constant until plastic flow had ceased Since it was
thought that the method of obtaining the lower yield stresses
more closely paralleled the actual testing procedure these
stresses were used in evaluating the expected strength of
the test beams
66
CHAPTER VI
EXPERIMENTAL RESULTS
61 Behavior of Beams during Testing
Since the behavior of all the beams during testing was
quite similar a complete description of only one such typshy
ical beam number 20 is given here Deviations from this
typical behavior are discussed at the end of this section
Beam 20 was first tested elastically to a load of 80k
in lOk increments and was then unloaded Strain gauge and
dial gauge readings were taken at each load increment and
were analyzed After it was determined from these readings
that strain gauges and automatic recording equipment were
in good working order the beam was reloaded this time to
be tested to destruction This check was run for only this
one test beam all others being tested continuously through
elastic and plastic ranges
An initial load of 5k was again applied to the beam and
strain and dial gauge readings taken The load was then inshy
creased to 80k in 40k increments (lOk or 20k increments were
used in all other tests because separate elastic tests were
not performed on these) and then to 120k in lOk increments
With the load held stationary a slight increase of deflecshy
tion with time was noted on the dial gauges at this load so
67
increments were decreased to 5k bull
At l30k slight lateral deflection of the beam at the
opening was noted although this deflection never became exshy
cessive throughout the remainder of the test Strain gauge
readings first indicated yielding at both the bottom edge of
the upper reinforcing bar at the low moment edge of the openshy
ing (Figure 21 gauge 25) and at the top edge of the top
flange at the high moment edge of the opening (gauge 17) at
a l35k load When the load was increased to 140k yielding
occurred at the other top edge of the top flange at the high
moment edge of the opening (gauge 19) At a load of 145k
yielding had occurred at the center of the top flange at the
high moment edge of the opening (gauge 18) and also in the
web at the centerline of the opening (rosette gauge 10 11
12) At 155k the web at the high moment edge of the openshy
ing had yielded (rosette gauge 13 14 15) as had the web at
the low moment edge of the upper reinforcing bar (rosette
gauge 4 5 6) Slight displacement between the ends of the
opening could be seen at a load of l60k and at l65k the
lower edge of the upper reinforcing bar at the high moment
edge of the opening (gauge 20) had yielded
At l70k the upper edge of the upper reinforcing bar at
the high moment edge of the opening had yielded (gauge 21)
thus making the yielding at the high moment edge of the openshy
68
ing complete (based on average strain values for the flange
and reinforcing) While at this load the first flaking of
the whitewash was noted at both the upper low moment and
the lower high moment corners of the opening The web at the
middepth of the beam between the low moment ends of the reinshy
forcing yielded at 175k (rosette gauge 1 2 3) and whiteshy
wash flaking was detected on the underside of the top flange
at the high moment edge of the opening At lSOk the web at
the low moment edge of the opening (rosette gauge 7 S 9)
yielded and whitewash flaking occurred along the web immedishy
ately beneath the upper reinforcing bar from the low moment
corner of the opening to beyond the low moment end of the
reinforcing bar and also in the web above and below the
opening At 185k whitewash flaking occurred at the lower
low moment corner of the opening and in the web immediately
above the lower reinforcing bar from the corner of the openshy
ing to the low moment end of the reinforcing bar Yielding
occurred at the center of the top flange at the low moment
edge of the opening (gauge 23) at 190k and also at the top
edge of the upper reinforcing bar at the low moment edge of
the opening (gauge 26) This made yielding at the low moment
edge of the opening complete (based on average strain values
for the flange and reinforcing) At this same load whiteshy
wash flaking occurred in the web above and below the low
69
moment end of the upper reinforcing bar
The first strain hardening was also indicated from
strain gauge readings at the load of 190k and occurred in
the web at the centerline of the opening (rosette gauge 10
11 12) At 195k whitewash flaking occurred in the web
between the low moment ends of the upper and lower reinforcshy
ing bars Yielding occurred at the lower edge of the top
flange at the high moment edge of the opening (gauge 16) at
200k and strain hardening occurred at the upper edge of the
top flange at the high moment edge of the opening (gauge 17)
and at the lower edge of the upper reinforcing bar at the
high moment edge of the opening (gauge 20)
At 211k a crack developed in the lower low moment corshy
ner of the opening and it was no longer possible to maintain
the applied load The beam was then unloaded and removed
from the test frame The crack which occurred at the corner
radius was one half inch long and was inclined toward the low
moment end of the lower reinforcing bar A photograph of this
beam after completion of the test can be seen in Figure 24
Of the remaining beams in the test series only 2D 3B
and 4B were implemented with strain gauges the others having
only the brittle coating of whitewash to indicate the order
of onset of yielding The first of these beams to be tested
lA was given too thick a coating of whitewash and the flaking
70
of this whitewash during testing was not as satisfactory as
on other tests Similar problems were encountered with 2A
which had to be given a second coating of whitewash because
most of the first coat was rubbed off due to improper handshy
ling of the beam before testing The flaking off of the whiteshy
wash on beam 2B during testing was also not as good as was
expected although the whitewash had not been applied too
thickly This beam was tested on an extremely humid day
and it is thought that the problem with the whitewash flaking
was due to this excessive humidity
The order of onset of yielding as indicated by strain
gauge readings is given for each of the strain gauged beams
(20 2D 3B 4B) in Table 3a while the order of onset of
strain hardening is given for these beams in Table 3b Loads
corresponding to complete yielding of the cross-sections are
also given The order of whitewash flaking for each of the
beams is given in Table 4 Ultimate loads are also given
along with the mode of collapse of the beam
Of the eleven beams tested all but one were tested to
collapse The test of beam lA was terminated when deflecshy
tions became excessive although no web buckling or tearing
of corners had occurred and the beam was still able to mainshy
tain the applied load Only one of the beams tested to
collapse ultimately failed by web buckling This was the
beam with the unreinforced opening 6A All of the other
71
beams suffered ultimate collapse by the tearing of one or two
of the corners of the opening Beams 2A 2B 2C 3A 4A 4B
and 5A developed cracks at the lower low moment corners of the
openings Beam 3B cracked at the upper high moment corner of
the opening and beam 2D developed cracks at both the lower low
moment and the upper high moment corners of the opening simulshy
taneously Photographs of each of the test beams after collapse
are shovm in Figure 24 Comparison photographs of the beams for
variable moment to shear ratio reinforcing size aspect ratio
and opening depth to beam depth are given in Figures 25 and 26
62 Stress Distributions and Failure Loads
Based on measured strains stresses were calculated for
beams 2C 2D 3B and 4B Elastic stresses were determined
from the usual elastic theory while plastiC stresses were
determined from plasticity theory presented by Hill(8) and
reduced to the form given by Bower(l6) Initiation of strain
hardening was also determined from this method which is
summarized in Appendix B
Stress distributions at the high and low moment edges
of the opening of beam 2C are shown in Figure 27 while those
at the centerline of the opening and across the flange at the
high moment edge of the opening are given in Figure 28 The
variations in bending stress across the length of the opening
72
at the center of the top flange and at the top of the upper
reinforcing bar are shown in Figure 29 Figure 30 shows the
stress distribution at the high and low moment edges of the
opening for beam 3B and the stress distributions at the high
moment edge of the opening of beams 2D a~d 4B are given in
Figure 31
Experimental failure loads for each of the test beams
were determined from the load-deflection curves for each
test as described in Chapter 11 These curves and their
corresponding failure loads are given in Figures 32 through
42 Interaction curves based on the analysis presented in
Chapter III were dravn for each of the test beams using the
actual measured dimensions and yield stresses for each beam
The experimentally deterrQined failure loads were plotted on
these curves which are given in Figures 43 through 50
Approximate interaction curves for nominal dimensions and
yield stresses are also included in these figures
63 Other Factors
Of the eleven beams tested only one underwent signifshy
icant lateral buckling during testing Beam 2B buckled
laterally at the high moment edge of the opening due to the
inadequate lateral support provided as described in Chapter
V However final collapse of this beam was due to the tearshy
73
ing of one of the corners of the opening and not to the
lateral buckling Also the lateral buckling was not
significant until after the very high loads associated with
strain hardening were reached The modified lateral support
system shown in Figures 19b and c and 20bc and d and discussshy
ed in the previous chapter effectively prevented lateral
buckling of the remaining test beams and no further diffishy
oulties were encountered due to this factor
For each of the test beams lateral deflections were
largest at the high moment edge of the opening although they
never became significant except in the case of beam 2B A
curve showing lateral deflection at the high moment edge of
the opening versus shear force at the opening is given for a
typical test beam 20 in Figure 51 The shear corresponding
to the experimental failure load is indicated on the curve
and the laterally unsupported length of the beam is given
The laterally unsupported length of the test beams did not in
any case exceed the lengths specified by the design codes(9 10)
Local buckling of the top flange occurred at the high
moment edge of the opening for several of the beams tested
although this buckling always occurred at very high loads
after considerable strain hardening had taken place Figure
52 shows the difference in strain readings between the upper
and lower edges of the flange at the high moment edge of the
74
opening versus the shear force at the opening for a typical
test beam 20 The distribution of stresses across the width
of the flange at the high moment edge of the opening (Figure
28b) show a relatively uniform distribution up to yielding
at this location However the effects of local flangebull
buckling can be seen by the considerably higher compression
stresses at the edges of the flange at very high values of
shear
The nine beams containing reinforced openings which were
tested to destruction all exhibited an effect which was preshy
viously unexpected The strain gauge readings for rosette
gauges 1 2 3 and 4 5 6 on beam 20 (Figure 21) as well as
the whitewash flruring on all nine of these beams indicated
widespread yielding of the web between the low moment ends of
the reinforcing bars This effect occurred at loads near the
experimental failure loads of the beams but did not interact
with the development of hinges at the corners of the openings
because of the extension of the reinforcing bars well past
the edges of the openings In addition to the shear yielding
in the web between the low moment ends of the reinforcing
bars the whitewash flaking on beams 2D and 4A also indicated
the same type of yielding occurring at slightly higher loads
in the web between the high moment ends of the reinforcing
bars The whitewash flaking in these areas was sufficient
so that it can be seen in some of the photos in Figure 24
75
The shear yielding that occurs in the web between the
ends of the reinforcing bars may be due at least in part to
the development of the strength of the reinforcing bar withshy
in a short part of its anchorage length Considering the
reinforcing bar in compression above the opening it can be
seen that since its strength must increase from zero at the
ends the unbalanced compression force in the beam causes a
shearing force to occur in the web which at the low moment
end of the reinforcing is additive to the existing shears
(due to the vertical shear force on the beam) below the reinshy
forcing and subtracted from those above This is illustrated
in Figure 53 In the same manner the shears resulting from
the tension in the lower reinforcing bar act in the same
direction as and are added to those in the web between the
reinforcing bars while being subtracted from those in the web
between reinforcing and flange At the high moment ends of
the reinforcing bars the same effect can occur since the top
reinforcing bar is usually in tension while the lower bar is
in compression Again the shears between the reinforcing bars
are increased while those between reinforcing bar and flange
are decreased This would account for the yielding in the web
between the low moment ends of the reinforcing bars for all
of the reinforced beams tested to collapse as well as explaining
76
the yielding in the web between the high moment ends of the
reinforcing bars for beams 2D and 4A
77
CHAPTER VII
ANALYSIS OF RESULTS
71 Order of Onset of Yielding
Comparison of the order of onset of yielding as detershy
mined by strain gauge readings and whitewash flaking in
Tables 3 and 4 indicates that the whitewash flaking is a
reliable method of estimating the order of onset of yieldshy
ing Actually since the strain gauges were only at scattershy
ed locations while the whitewash covered the entire area
around the opening the whitewash flaking is a considerably
more complete guide to the order of onset of yielding It
can also be said that yielding begins first at the corners of
the opening as indicated by the whitewash consistently
flaking first at these locations even though it was impossishy
ble to confirm this by strain gauge readings since gauges
could not be fitted in these locations
The yielding patterns clearly indicate that failure of
the beams occurred by complete yielding of the cross-sections
at the edges of the openings ie at the assumed hinge
locations The formation of hinges at these locations was
accompanied or followed by the shear yielding of all or part
of the web along the length of the opening and by the shear
yielding of the web between the low moment ends of the reinshy
78
forcing bars and in two cases also between the high moment
ends of the reinforcing bars The increase in load past the
formation of the first hinge is accompanied by localized
strain hardening Since the corners of the opening yield
considerably before other locations strain hardening probshy
ably begins at these corners well before the first hinge is
completely formed Yielding in the web above and below the
opening does not seem to become complete until considerable
rotation has occurred at the hinge locations The complete
yielding of the web in these areas would indicate that the
full shear capacity of the member is utilized
72 Stress Distributions
Experimental bending and shear stresses are shown for
each of the strain gauged beams (20 2D 3B 4B) in Figures
27 through 31 Straight lines have been drawn through pOints
representing measured stresses although this does not mean
that the variation is necessarily linear Examination of
each of these stress distributions shows that stresses inshy
creased in proportion to increasing loads while the stresses
were still elastic While in the elastic range the neutral
axis remained in approximately the same pOSition but startshy
ed to move after the first yielding had occurred at each
cross-section This is as would be expected
79
Since strain gauge readings were not available for the
edges of the opening it is impossible to follow the complete
progression of yielding for the various cross-sections from
strain gauge readings However since it is lcnown from the
whitewash flaking on the test beams that yielding occurs
first at the corners of the opening where stress concentrashy
tions are high it can be said that at the low moment edges
of the openings (beams 2C and 3B) yielding began first at the
corners of the opening and then progressed to the reinforcshy
ing bars and web before the flange yielded At the high
moment edges of the openings yielding in the flange occurrshy
ed at lower shear values This would be expected from conshy
siderations of the total stresses (primary bending stresses
plus secondary bending stresses due to Vierendeel action) at
the cross-section in question At the flange the secondary
bending stresses are added to the primary bending stresses
at the high moment edge of the opening but subtract from the
primary bending stresses at the low moment edge of the openshy
ing The experimentally determined stress distributions at
the high and low moment edges of the openings are completely
compatible with those assumed in the development of the
theory in Chapter III (Figure 8) Bending stress distribushy
tions along the length of the opening at the top of the upper
reinforcing bar and at the centerline of the top flange show
80
the expected high stresses at the edges of the opening due
to the secondary bending stresses (Figure 29)
Comparison of stress distributions with those presented
by Bower(16) for beams with unreinforced rectangular openings
shows that the addition of horizontal reinforcing bars above
and below the opening changes the position of the neutral
aXiS but does not alter the location where the highest
stresses occur and plastic hinges consequently form The
order of the onset of yielding is also similar to that
found by Bower as was expected
73 Failure Loads
In Table 5 experimentally determined failure loads are
compared to those predicted by the theory presented in
Chapter III for each of the test be~~s Examination of this
table shows that although the theory may be considered someshy
what conservative in high shear for low shear the correlashy
tion between theory and experimental is good and in no case
did the theory overestimate the actual strength of the beam
Table 6 shows the comparison between experimental failure
loads and those predicted by the approximate analysis for
nominal beam dimensions and yield stresses It can be seen
from this table that the approximate method is less conservshy
ative in the high shear region while still not overestimating
81
the strength of the beam An added margin of safety also
exists because the additional strength of the beam due to
strain hardening has not been taken into account This extra
strength is an added safeguard against total collapse even
though it is accompanied by excessive deformations and finalshy
ly involves tearing or pOSSibly buckling
Experimentally determined failure loads are compared
with loads corresponding to complete yielding of cross-secshy
tions for the strain gauged beams (20 2D 3B 4B) in Table
7 It can be seen from this comparison that experimentally
determined failure loads are close to those corresponding to
the complete yielding of the cross-section at the high moment
edge of the opening while loads corresponding to the complete
yielding of the cross-section at the low moment edge of the
opening are considerably higher This can be accounted for
by the considerable amount of strain hardening that is
suspected of occurring at the corners of the opening before
complete yielding of the low moment edge and possibly also
the high moment edge of the opening occurs Complete yieldshy
ing of cross-sections at the high and low moment edges of
the openings are also compared with the theoretical loads
predicted by the analysis of Chapter III in Table 8 Again
the correlation is reasonably good
The performance of each of the test beams was as expectshy
82
ed With the exception of the shear yielding which occurred in
the web at the ends of the reinforcing bars as discussed in
Section 63 The method used in determining experimental
failure loads has been shown to be justifiable on the basis
of the good correlation between these loads and those correshy
sponding to complete yielding of cross-sections at high and
low moment edges of the opening (considering that strain
hardening has not been taken into account) On the basis of
comparison with experimental failure loads the theory develshy
oped in Chapter III has been shown to adequately predict the
performance of a given beam under varying moment to shear
ratios (although conservatively at high shear) The approxshy
imate method as developed in Chapter IV has been shown to
predict beam strength with accuracy adequate for design
purposes (assuming a suitable factor of safety is used)
14 Influence of Reinforcing and Other Variables
As can be seen from comparison of the experimental
results from test beams 2A 3A and 6A and those for beams 2B
and 3B there is a definite increase in beam strength with
the addition of horizontal reinforcing bars As predicted by
the theoretical analysis of Chapter Ill the maximum shear
capacity of a perforated section as given by equation (6)
can be reached by the addition of a certain minimum amount
83
of reinforcing as given by equation (32) If no reinforcing
or an amount less than that required by equation (32) is used
the maximum shear capacity cannot be reached This is conshy
firmed by the result of the tests on beams 2A 3A and 6A
For higher moment to shear ratios the increase in strength
with increased reinforcing size is adequately predicted by
the analysis in Chapter 111 (and also by the approximate
method of Chapter IV) This is confirmed by the tests on
beams 2B and 3B The increase in strength with the addition
of reinforcing bars and with the further increase in the
size of this reinforcing cen be seen by superimposing the
interaction curves of Figures 10 11 and 12 as has been done
in Figure 54
The influence of the magnitude of moment to shear ratio
on the strength of a beam of given size opening and reinforcshy
ing dimenSions is adequately predicted by interaction curves
generated by the method of Chapter 111 and by the approximate
interaction curves as in Chapter IV This is confirmed by
test series 2A 2B 20 2D series 3A 3B and by series 4A
4B See Figures 55 56 and 57
An increase in aspect ratio everything else being held
constant results in a decrease in strength of the beam This
is predicted by the interaction curves in Figures 10 and 13
which are superimposed in Figure 58 for easy reference and
84
is confirmed by the tests on beams in series 2A 4A and
series 2B 4B An increase in hole depth also has the effect
of lowering the strength of the member all other variables
being held constant This is predicted by the interaction
curves in Figures 10 and 14 which are superimposed in Figure
59 and is confirmed by the tests on beams 20 and 5A
The test results have also been plotted in Figures 54
through 59 but because of the variation in the sizes and
yield stresses of the actual test beams these results have
been plotted on the curves (which are based on nominal
dimensions and yields) on the basis of percent difference
be~veen the experimental failure loads of the test beams
and the values predicted by the exact interaction curves
(from measured beam dimensions and yield stresses)
85
CHAPTER VIII
CONCLUSIONS AND RECOMMENDATIONS
81 Conclusions
On the basis of the results and discussion presented in
the previous chapters the following conclusions can be
drawn
1 The flaking off of the brittle coating of whitewash on
the beams during testing is an accurate indication of
the order of onset of yielding although it does not inshy
dicate at what loads yielding actually occurs
2 High stress concentrations exist at the corners of
rectangular openings even when horizontal reinforcing
bars have been added above and below the opening
3 Failure of a beam under moment gradient containing a
single rectangular opening reinforced with horizontal
reinforcing bars above and below the opening occurs by
the formation of a four hinge mechanism the hinges
occurring at cross-sections at the edges of the opening
Ultimate collapse of such a beam occurs by the tearing
of one or more of the corners of the opening provided
the beam has sufficient lateral support to prevent
lateral buckling
4 With the development of the four hinge mechanism large
86
relative displacements take place between the ends of the
opening accompanied by full or partial shear yielding in
the web above and below the opening This yielding when
it occurs over the entire web area is an indication that
the full shear capacity of the section is utilized
5 Because of the shear yielding that occurs in the web beshy
tween the ends of the reinforcing bars the extension of
these reinforcing bars past the ends of the opening (while
designed on the oasis of developing the weld strength)
should not be less than a certain length (as yet undetershy
mined but probably about three inches for the size beam
and openings tested) due to the possible interaction of
the web yielding with the yielding at the corners of the
opening
6 The stress distributions assumed in the analysis in Chapshy
ter III are completely compatible with those found at the
high and low moment edges of the strain gauged test beams
The large influence of the secondary bending moments (due
to Vierendeel action) is confirmed by these stress
distributions
7 The interaction curve resulting from the analysis in
Chapter III predicts with reasonable accuracy the strength
of a beam with given opening and reinforcing size at any
combination of moment and shear This method is however
87
conservative at high shear values
8 The approximate method developed in Chapter IV also preshy
dicts with reasonable accuracy the strength of a beam
with given opening and reinforcing size for the full
range of moment and shear values and is less conservshy
ative at high values of shear
9 Due to the fact that the theory neglects the effects of
strain hardening there is a built in margin of safety
against complete collapse of the member although an
increase in load past the predicted failure load is
accompanied by excessive deformations
10 The correlation obtained between experimentally detershy
mined failure loads and loads corresponding to complete
yielding of cross-sections at the high moment edge of
the opening for the strain gauged beams suggests that
the method used in determining the experimental failure
loads is justifiable Comparison of experimental failure
loads with loads corresponding to complete yielding of
the cross-section at the low moment edge of the opening
would not be expected to be as good because of the strain
hardening that is assumed to occur at the corners of the
opening before this section is completely yielded
11 The addition of horizontal reinforcing bars above and
below a rectangular opening in a beam definitely increases
88
the strength of the beam If greater than a predictshy
able minimum area this reinforcing will make it possible
to achieve the full shear strength of the section as
given by equation (6) Any further increase in reinforcshy
ing size results in a further increase in the moment
capacity of the member for a given value of the shear
force
12 For a given size beam an increase in aspect ratio (openshy
ing length to depth) results in a decrease in the strength
of the beam over the full range of moment to shear ratios
if all other factors are held constant An increase in
the opening depth to beam depth ratio also has the same
effect all other variables being constant
13 The test performed on beam 6A containing the unreinshy
forced rectangular opening further confirmed the analysis
presented by Redwood(17 18) for beams containing single
unreinforced rectangular openings in their webs
82 Recommendations for Design
Based on the good agreement between experimental results
and failure loads predicted by the approximate interaction
curve it is recommended that the approximate method as
described in Chapter IV be used for design purposes assuming
that a suitable factor of safety is used The ease with
89
which the necessary calculations can be carried out makes
this method extremely practical The use of this method can
be outlined as follows When it is decided to cut an openshy
ing in the web of a beam for the passage of utilities the
necessary size of opening should first be determined and an
approximate interaction curve constructed for the beam conshy
taining an unreinforced opening by using e~uations (52) (53)
and (55) Mp and Vp should be calculated from equations (1)
and (3) respectively A line should then be drawn from the
origin at the particular moment to shear ratio which repshy
resents the actual position of the proposed opening in the
beam and extended to intersect the approximate interaction
curve The intersection of this line with the interaction
curve then represents the capacity of the beam if the openshy
ing is not to be reinforced If this capacity is less than
that required it is necessary to reinforce the opening
and reinforcing should be chosen on the basis of satisfying
the inequality of equation (41) The reinforcing should be
chosen so that the right hand side of equation (41) is not
greatly exceeded An approximate interaction curve for a
beam containing an opening with this size reinforcing can
then be constructed by using equations (42) (43) and (45)
where Ar is given by the right hand side of equation (41)
The intersection of the MV line with this approximate intershy
go
action curve then gives the capacity of the beam with this
size reinforcing If this exceeds the required capacity of
the section this size reinforcing should be adopted
However if the required capacity of the beam is greater
than that given by the approximate interaction curve two
possibilities may exist If the required shear is greater
than the maximum shear capacity of the section as given by
the vertical line on the approximate interaction curve or
by equation (42) then either shear reinforcing must be
added or the depth of the section increased in order to
provide the required strength If however the required
shear capacity is not greater than that given by equation
(42) but the point representing the required capacity of the
beam on the MV line lies outside the apprOximate intershy
action curve the area of reinforcing should be increased
above the value given by equation (48) and a new approximate
interaction curve constructed using equations (42) (45)
(49) (50) and (51) If the required capacity is still
greater than that given by this new approximate interaction
curve the reinforcing size would have to be further increased
until the reinforcing is such that the required strength is
provided The reinforcing size that meets this requirement
should then be adopted for use
91
83 Reoommendations for Future Work
With the completion of this study on the ultimate
strength of beams containing single rectangular openings
reinforced with straight reinforcing bars above and below
the openings it is logical that attention would turn to
similar studies for other commonly used opening shapes in
particular circular and extended circular openings with
horizontal reinforcing bars Also of interest would be an
ultimate strength investigation of reinforced closely spaced
multiple openings of rectangular or circular shape
Since the decision to cut and reinforce an opening in
the web of a beam is based primarily on economic considershy
ations an investigation into reducing the cost of reinshy
forced openings would be very much justified As the cost
of welding is paramount among the other factors involved in
reinforcing an opening reducing the e~mount of welding is
desirable If the horizontal reinforcing bars used in the
present study were doubled in size and welded to only one
side of the web above and below the opening the cost of
reinforcing would be almost halved while the same area of
reinforcing would be available for resisting the shear and
moment forces on the section However other factors such
as twisting moments would have to be taken into conSideration
due to the asymmetry of the section about its vertical axis
92
that would result from this type of reinforcing arrangement
An investigation of the ultimate strength of wide poundlange
sections containing large rectangular openings reinforced
with one-sided straight horizontal bar reinforcing has
already been initiated at McGill University
More information is also needed on the anchorage of the
reinforcing bars It would be desirable to determine at
what length such reinforcing is capable opound assuming its full
load An investigation of the required extension of reinshy
forcing bars past the ends of the opening to prevent preshy
mature poundailure due to interaction between hinge formation
and web yielding at reinforcing ends is also necessary
93
1)
) )J + 1 +1 I I
I
( a) (b)
I + --+--~+ -f--- -shy
I (c) (d)
II I I
I I j+shy
) 1)I l J I
(e) ( f)
Types of Reinforcing
Figure 1
94
primary bending stresses
secondary bending stresses
Stress Distribution at Opening
Figure 2
Ql ID Q)
Jt p ID
er
I I I I I I I
E I I I poundy Ipoundst strain
Idealized Stress-Strain Curve for structural Steel
Figure 3
---------- -----
95
MM unperforated beam no interaction
10~----~==~==~L---------------------~
~
unperforated beam including interaction
10 vVp
Interaction Curve - Unperforated Beam
Figure 4
-- -----------
96
deflection Pure Bending
(a)
~ o
r-I
deflection Bending with Shear
(b)
Load-Deflection Curves
Figure 5
97
1O~------------------------------------------~
l I
unperforated beamshy
shy
I r perforated beam
no interaction
----------- perforated beam l including interaction I I I I I I I I I
I I
Interaction Curve - Perforated Beam
Figure 6
i
98
1 CD (2) TIT
L
( a)
b
d2
(b)
Hinge Locations and Cross-section of Member
Figure 7
99
( a)
(S r CSyr+
tltS ltl direct shear direct shear
Stress Distribution at CD Stress Distribution at CD (for reversal in reinforcing)
Case I - Low Shear
+
CSyr ltS shy
direct shear
Stress Distribution at CD
Case 11 - High Shear
(b)
Stress Distributions and Resultant Forces
Figure 8
100
low highshear shear
I Ml4p k--~_____U_k-----LS_~_(_U_+-=q-)_____-L (u+q)kl s~s
I I r I I
I I I 1 I10
~-int eraction II curve 11
11
11 I I 11 I I
- I - I Iapproximate ~
interaction curve------ - 1
11~I11
i I I
I (d-2h-2t)I_~ I
d-2t 11
(1 -~) q
Interaction Curve Showing Low and High Shear Regions
Figure 9
101
14D38 7 x lof Opening
6 bull77611 x ~middotReinforcing 1 0513
03~
CH 125 1412700
0313 =--9F 0375 =Jb
approximate method ---l------ Case 11
04 vVp
Interaction Curve - 14WF38 Nominal
Figure 10
102
14WF38 7 x 10r Opening 6776 05132tbull
x e 3middot
Reinforcing
1412 11
10
approximate method Case I
04
Interaction Curve - 14WF38 Nominal
Figure 11
103
14WF38 7 x 10f Opening
0513No Reinforcing
MMp
10
-----approximate method for unreinforoed opening
04 VVp
Interaction Curve - 14WF38 Nominal
Figure 12
104
l4WF38 7 x l4~ Opening1pound x tReinforcing
Iapproximate method Case 11
I I I
04
Interaction Curve - l4WF38 Nominal
Figure 13
105
14WF38 9X 13- Opening lmiddotfx p Reinforcing
0513
1412
~-approximate method ~ Case IIIB
approximate method Case I
04
Interaction Curve - l4WF38 Nominal
Figure 14
106
10WF2l
5 x sf Opening 034(iIf x iWReinforcing t~l0240
CH h
55Q 125 990 025Q 0250~
approximate method ~ Case IlIA
approximate method I Case I
I I I
04
Interaction Curve - lOWF2l Nominal
Figure 15
107
43 11 39 18 0 (
I
I I i lA
26
I
111 99 I- middot1 t
22 2-S 45 J
) C
r I
2A
13 ) lA I ~
I)II45 35 ( ()
I
I
I If 2B
f 16~ 9 25 I2t~ 21-+1 1 1 i
30 11 24 27 0- 10- ro- )
I ~ I I
20
2119YlO 151( 21~fI211~ - rr I I
Test Beam Dimensions and
Dial Gauge Looations
Figure 16
108
tI
2D
22tl 231 45 tlI
( l (
I
3A
3119 Yt 11~ 34ft J3n~
45 25 J 35 ) (~ i-
I
I 1 3B
H 25 ft2ft5 cI 16 J2++ I I1 I
t 0- 23 45 J0- 0- (
I 4A
~5 ( 32 J211~ 2 YYt -IIII
Test Beam Dimensions and
Dial Gauge Locations
Figure 17
log
45 ~ 25 5S ) ~ (
4B
2 crYI 15 25 J-I2++ Irr
L J30 24 27 ~lt) (P-L
I 5A
2tYY 13 26211 1 I
22 6
6A
i
Test Beam Dimensions and
Dial Gauge Locations
Figure 18
--
110
If JL
a (1) p 02 ~
Cfl
tlOO ~ r-I 0 0 Q)
m ~ ~
Q SoOM
r-I Xl m ~ (1) p cD H
r-shy
~ ishy fO I- It
111
o N
-()
112
~ --- ~
~
~~ ~~
II I of
rf
A tshyshy I
1
ID I ~ I 0I middotrt
a1 +gt
- -l~ 0 ()
-t I H CJ
4gt 4gt bO ~
~ ~ Cl -rt
fiI
~ a1 ~
+gt CJI
~ amp ~ ~ ~ --- ~ I
II s I
~CJ~ 4t ~
I~ i ~
o
i-~ ~ - l
II I +1 I Ij
~I r
I tf~ft N
- shy
stress 8 1
lower Yield-lt ~i == 11 static yield-shyI l- 2 1 2 ~
( a)
F F-CL F-E [(4 ~
W-H- - shy
strain ( b)
Tensile Coupons Stress-Strain Curve from Instron Testing Machine
Figure 22 Figure 23 I- I- vJ
I
114
lA 2A 2B
20 2D 3A
3B 4A 4B
5A 6A
FIGURE 24
115
2B 20 2D 3A 3B 4At 4B
Variable Moment to Shear Ratio
20 5A
Variable Opening Depth to Beam Depth
FIGURE 25
116
2A 4A 2B 4B
Variable Opening Length to Depth
2B 3B
Variable Reinforoing Size
FIGURE 26
bullbull
117
Notes Shear force shown in kipsbott of flange bull Elastic o Yielded
r ~ 3
o
top of reinf
boundaryof opening bott of reinf~ ioiiIo ~_ 10 o 10 ~ ~ - Dending Stress Shear Stress
Ca) Stress Distribution at High Moment Edge of Opening - 20
~ bull
~ ~ boundary ~ of opening~
-0 I) 10 40 o to lO ~ Sending Stress Shear stress
(b) Stress Distribution at Low Moment Edge of Opening - 20
Figure 27
118
boundaryof opening
-70 0 __ tQ
Bending Stress Shear Stress
Ca) Stress Distribution at Oenterline of Opening - 20
-1iCgt
~I--=-shyoo---~-=-~ogt---- ---0 - ____ A~Sshy-
middot------------e----- ~~~ ~_______~-----Lr---t-o~p~of flangeo
oE
Cb) Bending Stress Distribution Across Flange at High Moment Edge of Opening - 20
Figure 28
119
-40
-lt0 lt----- shylow
moment edge gtgt bull
lt 0
high54 boundary of opening moment
edge ltgtgt
to
Ca) Bending Stress Distribution Across Length of Opening at Top of Flange - 20
high moment
edge
o
Cb) Bending Stress Distribution Across Length of Opening at Top of Reinforcing - 20
Figure 29
120
boundary---~~~~~~~~___ of Opening
o10 D
Bending Stress Shear Stress
(a) Stress Distribution at High Moment Edge of Opening - 3B
ibull
boundaryof opening
10 Igt lO
Bending Stress Shear Stress
(b) Stress Distribution at Low Moment Edge of Opening - 3B
Figure 30
bull bull bull bull
121
11 9 ~ oS j j ~
boundaryof opening
-lt10 -20 lt) -I-Lo Q lO 10
Bending Stress Shear Stress
(a) stress Distribution at High Moment Edge of Opening - 2D
boundaryof openin
-40 -20 0 ZO o 10 ZQ 30
Bending Stress Shear Stress
(b) Stress Distribution at High Moment Edge of Opening - 4B
Figure 31
122
Test Beam - lA
O6in relative defleotion between opening ends
Figure 32
Test Beam - 2A
O6in relative deflection between opening ends
Figure 33
123
lateral buckling - highmoment edge of opening413k-- shy
Test Beam - 2B
O6in relative deflection between opening ends
Figure 34
bull first strain hardening --~ complete yielding - low
moment edge of opening-J- -- --shy
J complete yielding - high moment edge I of opening I ----first yielding
Test Beam - 20
O6in relative deflection between opening ends
Figure 35
124
---- complete yielding - high moment edgeof opening
first yielding
Test Beam - 2D
O6in relative deflection between opening ends
Figure 36
Test Beam - 3A
O6in relative deflection between opening ends
Figure 37
125
k ---shy497 ---~ --1shy complete yieldingI J
---- first yielding
O6in
Figure 38
O6in
Figure 39
- high moment edge of opening
Test Beam - 3B
relative deflection between opening ends
Test Beam - 4A
relative deflection between opening ends
126
430k--shy
k445--shy
---f-----shy ----complete yielding shy
I ----first yielding
06in
Figure 40
O6in
Figure 41
high moment edgeof opening
Test Beam - 4B
relative defleetion between opening ends
Test Beam - 5A
relative deflection between opening ends
127
k45 o-~--
Test Beam - 6A
O6in relative deflection between opening ends
Figure 42
128
10 shy
10WF21
5t x ampf Opening If x t Reinforcing
~~approximate interaction ~ nominal dimensions and
~ ~
+~ ~ ~
I interaction curve ---I Imeasured dimensions and yields I
I I
04
Interaction Curves - Test Beam lA
Figure 43
curve yields
129
14WF38 7 x lot Opening
bull SIt x a Reinforcing
~-----approximate interaction curve nominal dimensions and yields
interaction curve-------- I
measured dimensions and yields
bull
Interaction Curves - Test Beams 2A and 2B
Figure 44
130
l4WF38 f x 10i Opening 11 x middotf Reinforcing
10 - ~approximate interaction curve nominal dimensions and yields
interaction curve----~ measured dimensions and yields
04
Interaction Curves - Test Beams 2C and 2D
Figure 45
10
131
l4WF38 7middotx lof Opening 2f x ~uReinforoing
approximate interaction curve nominal dimensions and yields
~
1 +3A
I interaction curve -------J
measured dimensions and yields
04
Interaction Curves - Test Beam 3A
Figure 46
10
132
14WF38 7 x lOi~ Opening2f x ~ Reinforcing
~ ~approximate interaction curve ~~ nominal dimensions and yields
~ ~ ~ ~ ~
I I
interaction curve ------I measured dimensions and yields
04
Interaction Ourves - Test Beam 3B
Figure 47
10
133
14WF38 H
7 x 14 Opening 1t x Reinforcing
-~
~~approximate interaction curve ~ nominal dimensions and yields
~ ~ +4B
~ ~ ~
~ interaction curve-----l measured dimensions and yields I
I I
04
Interaction Curves - Test Beams 4A and 4B
Figure 48
134
14WF38 9 x 13t~ Opening lix ~uReinforcing
10 --~ ~~approximate interaction curve
nominal dimensions and yields
~ ~
SAl
interaction curve measured dimensions and yields
04 vVp
Interaction Curves - Test Beam 5A
Figure 49
10
135
14WF38 7 x lof Opening No Reinforcing
r----approximate interaction curve nominal dimensions and yields
+ 6A
----interaction curve measured dimensions and yields
04
Interaction Curves - Test Beam 6A
Figure 50
136
shear (kips)
70
60
---- shear corresponding to experimental failure
50
40
30
20
laterally unsupported length = 54 inohes10
40 80 120 160 200 240
lateral deflection (in x 10-3 )
Lateral Deflection at High Moment Edge of Opening - 20
Figure 51
137
shear (kips)
70
60
------------shear oorresponding to experimental failure
50
40
30
20
10
4 8 12 16 20 24 28
strain differenoe at top flange (inin x 10-3)
Flange Buokling at High Moment Edge of Opening - 20
Figure 52
138
D f
P --IL-=====bull--Jf--P + dP
Shear Stresses at End of Reinforcing
Figure 53
139
l4WF38 7 x lot
Opening
3shy10 f ~--2f x e
Reinforcing
If x ~ Reinforcing
+3A +2A
No Reinforcing + 6A
04
Variable Reinforcing Size
Figure 54
140
14WF38 7 x lof Opening If xl-Reinforcing
+ 2B
+20
+2A
+2D
04 vVp
Variable Moment to Shear Ratio
Figure 55
141
14WF38 7x 10f Opening2i x iReinforcing
10 ---------- shy
+3B
+3A
04 vVp
Variable Moment to Shear Ratio
Figure 56
142
14WF38 7x 14~Opening 1f x f Reinforcing
+ 4B
+ 4A
04 vVp
Variable Moment to Shear Ratio
Figure 57
143
14WF38 1thx imiddotReinforCing
7 x lot Opening
7 x 14 Opening---
04
Variable Aspect Ratio
Figure 58
144shy
14WF38
------7middot x 10i Openinglift x ~~Reinforeing
9 x 13f Opening +20 Ii x i Reinforoing
+5A
04
Variable Opening Depth to Beam Depth
Figure 59
--
r b --1 t l=Ii= W
d
u q
Beam Size ~ d b t w 2a 2h u q c x R bull lA 10WF21 43 989 578 0324
11
0244 875 550 N
0260 0253 2720 N
400 316
2A 14WF38 22 1413 677 0496 0326 1046 700 0383 0381 2813 300 58
tI tI If If If tI tf tI It n tI It2B 45
ff 11 It2C 30 1422 668 0490 0305 1045 0267 0368 2720 n tI n tt tI tI n n tI2D 17 If tI n3A 22 1413 677 0496 0326 1046 0383 0381 5313 600
It 11 It If3B 45 1422 668 0490 0305 1045 0329 0361 5230
tf tI 11 tI fI tI tI4A 22 0340 0368 2720 300 If It tI ff If tI If It n4B 45 n n tI tt f1 tI5A 30 1344 901 0305 0371 3770 425
11If fI6A 22 1045 700 shy - - shy Table 1 -I
foo J1
146
Ave Test Coupon Desig- Testing Lower Static Lower Beam
Beam Location nation Machine Yield Yield Yield Series lA web W Riehle 573 - 573 lA
nflange F 362 - 431 nF 435 shy
F-E It 462 shyItreinf R 370 370
2B web W Instron 417 405 413 2A2B W 11 3A412 398
flange F Riehle 374 - 388 F-CL Instron 382 371 F-E It 397 395
reinf Rl Riehle 434 - 437 2D web W Instron 567 550 558 2C2D
rtW 540 527 3B4A 4B5Aflange F 490 474 446 6AItF-CL 418 406
F-E 478 shyIt 2C2Dreinf R6 398 384 398 4A4B
3A web W 11 411 shyfIflange F 398 379
reinf R2 Riehle 440 shyfI3B reinf R4 330 - 331 3B
R4 11 332 shyR4 Instron 332 shy
4A web W 565 549 flange F 11 487 476
F-CL 406 398 nF-E 429 415 5A reinf R5 tI 437 429 444 5A
R5 450 422 It6A web W 559 545 Itflange F 463 450 fIF-CL 408 402
F-E ff 438 425
Tensile Test Results
Table 2
147
Beam 20 2D 3B 4BLocation Top edge upper fl - BM edge 450K 575K 433lC 300
Bott upper reinf - LIvI edge 450 500 400 317 ~ top upper fl - BM edge 483 600 367 317 Web - ~ open 483 500 517 450 Web - BM edge 517 550 400 350 Web - LM end of upper reinf 517 - - -Bott upper reinf - BM edge 550 550 500 350 Top upper reinf - BM edge 567 800 467 433 ~ web - between LM ends reinf 583 - - shyWeb - LM edge 600 - 583 shy~ top upper fl - LM edge 633 - 600 shyTop upper reinf - LM edge 633 - 467 500 Bott edge upper fl - BM edge 667 - 517 383 Complete yield - BM edge - 567 625 483 383 Complete yield - LM edge 633 - 600 shy
(a) Shear Values Corresponding to Yielding
Location Beam 2C 2D 3B 4B
Top edge upper fl - BM edge 667k 775
k 567k 483k
Bott upper reinf - LM edge - 800 583 -~ top upper fl - BM edge - 775 533 -Web - ~ open 633 700 583 -Web - EM edge - 750 - -Bott upper reinf - BM edge 667 775 - -
(b) Shear Values Corresponding to Strain Hardening
Table 3
- - - - - - -
- - - - - - - - -
- -
BeamLocation Upper fl - BM edge Lower fl - BM edge Lower LM corner open Upper LM corner open Lower BM corner open Upper ID~ corner open Web above open Web below open Low Uif corner to end reinf Up n~ corner to end reinf Low IDH corner to end reinf Up rIM corner to end reinf Between ends reinf LM end Between ends reinf HM end Upper reinf - BM edge open Lower reinf - BM edge open Upper reinf - ilA edge open Lower reinf - LM edge open Lateral buckling - BM edge Web buckling at open Tearing - lower LM corner Tearing - upper BM corner
lA 2A 2B 20 2D 3A 3B ~ lI Ilt v 162 500 400 583 700 525 433
180 - - - 725 - 517 191 550 417 617 600 550 567 191 575 442 567 575 600 433
- 575 467 567 575 600 433
- 575 - - 600 600 shy202 625 475 600 600 700 533
- 625 475 600 625 700 583
- - - 617 700 - 550
- - - 600 675 675 550
- - - - - 675 shy
- 600 458 650 675 650 583
- - - - 725 - -- - - - - 725 -- - - - - 675 -- - - - - - -- - - - - 675 shy- - 483 - - - shy
- 700 517 703 825 775 shy- - - - 825 - 600
4A 4B Ilt Ilt
450 333 500 417 450 367 450 366 500 383 450 417 550 483 600 483 550 400 550 433 625 shy625 shy575 467 575 shy500 shy550 417
- 450 500 383
--675 513
5A le
350 500 400 400 433 483 433 467 500 417
--
500
--
467 500
---
517
-
6A
400 533
-367 367 383 433 533
-----------
550
--
Shear Values Corresponding to Whitewash Flaking
J-ITable 4 ~ 00
149
~hear a1 Beam Size MV [Failure Vp Exp VVp Theor VV_ Diff
lA 10WF21 43 180K 746K 0241 0235 + 26 2A 14WF38 22 532 1L021 0520 0466 +116 2B 11 45 413 0404 0363 +113 2C If 30 548 1301 0421 0403 + 45
u n2D 17 670 0515 0420 +226 n3A 22 575 1021 0562 0466 +206 tt3B 45 497 1301 0382 0345 +107 11 n4A 22 572 0440 0360 +222 n4B 45 430 0330 0295 +119 If It5A 30 445 0342 0296 +155 116A 22 450 0346 0271 +277
Correlation Between Experiment and Theory
Table 5
~hear at Approximate Beam Size MV Failure Exp VV Theor VV DiffVp p p
lA 10WF21 43 180K 746 K
0241 0254 - 51 2A 14VlF38 22 532 1021 0520 0503 + 34
It2B 45 413 0404 0344 +175 If2C 30 548 1301 0421 0414 + 17
It2D 17 670 0515 0505 + 20 3A 22 575 1021 0562 0505 +103
n3B 45 497 1301 0382 0377 + 13 4A tI 22 572 n 0440 0463 - 50
It It 03094B 45 430 0330 + 68 5A 30 445 tr 0342 0353 - 31 6A 22 450 tt 0346 0257 +346
Correlation Between Experiment and Approximate Theory
Table 6
150
Shear at Shear at Shear at Beam MV Failure Full Yield Dif Full Yield Dif
Exp H M Edge L M Edge k k k2C 30 548 567 + 35 633 +155
2D 17 670 625 - 67 - shy3B 45 497 483 - 28 600 +207 4B 45 430 383 -109 - shy
Correlation Between Experimental Failure and Complete Yielding
Table 7
Theor Shear at Shear at Beam MV Shear at Full Yield Dif Full Yield Diff
Failure H M Edge L M Edge
2C 30n 525k 567k + 80 633k +206 2D 17 546 625 +145 - shy3B 45 449 483 + 76 600 +336 4B 45 384 383 - 03 - shy
Correlation Between Theoretical Failure and Complete Yielding
Table 8
151
APPENDIX A
Computer Program for Interaction Curve
A computer program was developed to generate an intershy
action curve for a specified beam opening and reinforcing
size according to the method described in Chapter Ill The
program was wri tten in Fortran IV and can be used on any
standard digital computer that makes use of this language
The input for the program should be of the form given in
the following table
Data Number Items on of Cards Data Cards
Number of beams 1 NB
Dimensions of beams NB dbtw
Yield Stresses NB CS111 S~ lts
Number of openings per beam NB NE
Sizes of openings NH ah
Number of reinforcing sizes per opening NH NR
Sizes of reinforcing NR uqc
A listing of the computer program is given on the following
pages
152
C THIS PROGRA~ CO~PUTES ThE INTERACTION CURVE RELATING MOMENT AND C SHEAR VALUES WHICH CAUSE FAILURE OF A WICE FLANGE bEAM CONTAINING C A REINFORCED RECTANGULAR OPENING AT ThE MIDOEPTH C
REAL KlK2MPMMPKllK12K21 t K22 581 FORMAT(5FIO3) 584 FORMAT(3FIO3) 582 FOR~AT(2FIO3) 583 FORMA1(I5 681 FORMAT(lINTERACTION
lOt 0 B T 682 FORMAT( F133F63 683 FORMAT(O SIGF 684 FORMAT( 5F93
BETwEEN MOMENT AND SHEARtw)
SIGw SIGR VP Mpt)
605 FORMAT(O OPENING LENGTH middotF73middot HEIGHT =F73) 606 FORMAT(O MMP VVP SIG 601 FORMAT( middot5FI04 608 FORMATOV IS TOO LARGE SO SIGMA BECCMES 609 FORMATtOHIGH SHEAR SOLUTION) 611 FORMAT(O U QC) 612 FORMATe 3F63) 613 FORMAT(O STRESS REVERSAL IN REINFORCING 614 FORMATOSTRESS REVERSAL IN CLEAR WEe 615 FORMAT(O STRESS REVERSAL IN WEB STUB) b16 FORMAT(OLOW SHEAR SClUTIONt) 618 FORMATtO MAxIMU~ VVP Fb3)
c READ(S583)NB 00 200 I=lNB RE~D(5581tOBTW
READ(5584)SIGFSIGWSIGR VP=W(0~2T)SIGWSQRT(3) MP=BTSIGF(D-T bullbullW(D-2Tl2SIGW4 WRITE(6681) WRITEI6682)DtB t TW WRITE(6683) WRITE(~684)SIGFSIGWSlGRVPtMP
REAO(SS83)NH DO 200 ~=lNH
RE~D(5582JAH
REAC5583) NR A2=2A H2=2H WRITE(6605)A2H2 VVPM=(O-2T-2H)0-2T) WRITEt6618) VVPM CO 200 J=lNR READ(5584) UQC
Kl K2~)
COMPLEXJ
153
WRITE(661U WRITE(661Z) UQC WRITE(6606) VINCR=OO V=OO S=OZ-H-T AW=SW Af=BT AR=(C-WjQ R=U+Q
C C LOW SHEAR SOLUTION C C STRESS REVERSAL IN WEB STUB C
WRITE(66161 WRITE(661S)
101 V=V+VINCR XX=$IGWZ-O7SV2AW2 IF(XX) 201]00300
300 SIG=SQRT(XX) ALPHA=ARSIGR(AFSIGf BETA=AWSIGCAfSIGf) Cl=T+SBETA C2=-(D-2HJ C3=VAAFSIGF) C4=C22-40ClC3 IF(C4408399399
399 K21=(-C2+$QRT(C4)(2Cl K22=(-C2-SQRTCC4raquo)(2Clt Kll=K21BETA KI2=K22BETA IF(K21)330301301
301 IFK21-10)30230233C 302 IFCKll1330304304 304 IFKllS-U)320320330 330 IF(K22)408)31331 331 IF(K22-10)33233Z40a 332 IF(KIZ)408333333 333 IF(K12S-UJ32132140S 320 K2=K21
Kl=Kl1 GO TO 322
321 K2K22 Kl=K12
322 FY=AFSIGF(S+T2)+AWSIGSS(1-2Kl2)+ARSIGR(U+Q2) F=AFSIGF+AWSIG(1-2Kl+ARSIGR M=2FY+20HF-VA
154
MMP=MMP VVP=VVP WRITE(6607)MMPVVPSIGKlKZ VINCR=VP500 GO TO 101
C C STRESS REVERSAL IN REINFORCING C
408 WRITE(6613 GO TO 409
902 V=Vl 701 V=V+VINCR
XX=SIGW2-015V2AW2 IF(XX9011CQ100
100 SIG=SQRTXX) 409 Rl=(C-W)SIGR
R2=AWSIG+SRl Cl=T+SAFSIGFRZ C2=2SURIR2-(D-2HJ C3=VA(AFSIGF)+U2Rl(AFSIGFraquo)(SR1RZ-1) C4=C22-40C1C3 IF(C4)418403403
403 K21=(-C2+SQRT(C4)(Z0Cl KZ2=-C2-SQRT(C4)(Z0Cl) Kll=AFSIGFK21R2+URlR2 K12=AFSIGFK22R2+URIR2 IF(K21)430401401
401 IF(K21-10)4C240243C 402 IF(K11S-U)430404404 404 IF(Kl1S-R)42042043C 430 IFK22)418431431 431 IF(K22-10)432432418 432 IF(K12S-U418433433 433 [FtK12S-R)421421418 420 K2=K21
K l=K 11 GO TO 422
421 K2=K22 Kl=K12
422 FY=AFSIGFtS+T2)+AWSIGSS(1-2Kl2) 1 +(C-W)SIGR(U2+UC+SQ2-(KlS)2)
F=AFSIGF+AWSIG(I-2Kl)+(C-WJSIGR(2U+Q-2KlS) M=20FY+20HF-VA ~MP=MMP
VVP=VVP IF(MMP 418423423
423 WRITE(6601)MMPVVPSIGKlK2 VINCR=VP500
155
GO TO 701 C C STRESS REVERSAL IN CLEAR WEB C
418 WRITE(6614) GO TO 419
922 V=Vl 801 V=V+VINCR
XX=SIGW2-075V2AW2 IF(XX)921800800
800 SIG=SQRT XX) 419 Cl=AFSIGFS(AWSIG)+T
CZ=-O+2H-2SARSIGR(AWSIG) C3=VACAFSIGF)+2U+Q2)ARSIGR(AFSIGF)
1 +S(ARSIGR2fAFSIGFAWSIG C4= C224 ClC3 IF(C4)428410410
410 KZl=(-C2+SQRTCC4)(ZCl K22=(-C2-SQRTCC4)ZC1) Kll=AFSIGFK21(AWSIG)-ARSIGR(A~SIG)
K12~AFSIGFK22(AWSIG)-ARSIGRAWSIG)
IF(K21)S30501501 501 IFK21-10)502502530 50Z IF(KllS-RS30504504 S04 IF(Kll-l0S20520510 530 IFtKZ2)428531531 531IF(K22-10)532532428 532 IF(K12S-R428533533 533 IF(K12-10)521S21428 520 1lt2=K21
Kl=Kl1 GO TO 522
521 1lt2=K2Z Kl=K12
522 FY=AFSIGF($+T5+AWSIGS(i-2bullbullKl212-ARSIGR(U+Q2) F=AFSIGF+AWSIG(1-2Kl-ARSIGR M=2FY+2HF-VA MMP=MMP VVP=VVP IF (MM P) 428523523
523 WRITE(6601)MMPVVPSIGKlK2 VINCR=VP 500 GO TO 801
c C HIGH SHEAR SOLUTION C
428 WRITE(oo09) GO TO 352
156
2 V=Vl 4 V=V+V INCR
XX=SIGW2-015V2AW2 IF(XXJI0235D350
350 SIG=SQRHXX) 352 AlPHA=ARSIGR(AfSIGf
BETA=AWSIG(AfSIGf) 429 02=-10-BETA-AlPHA
03=05VA(AFSlGFT)+AlPHA+8ETA+O5(AlPHA+8ETA)2+OS8ETAST 1 +AlPHA(U+Q2IT-CD-2H(AlPHA+8ETA)O5T
04=D22-403 IFCD4)102351351
351 K21=(-D2+SQRTID4raquo2 K22=(-D2-SQRT(04112 Kll=1O+8ETA+AlPHA-K21 K12=10+BETA+AlPHA-K22 IFCK21630601601
601 IF(K21-10602~0263C
602 IF(Kll)630604604 604 IFIKll-10)62062D63C 630IFCK22)102631o31 631 IFIK22-10)632632102 632 IF(K12)102633633 633 IF(K12-10)621621lC2 620 K K21
Kl=Kll GO TO 622
621 K2=K22 Kl=K12
622 FYPT=Kl(D-2H)-TKl2-(S+ST) FY=AFSIGFFYPT-AWSIGS2-ARSIGRlU+Q2bullbull F=AFSIGfC2KI-l-AWSIG-ARSIGR M=20FY+20HF-VA MMP=MMP VVP=VVP IF(MMP) 102623623
623 WRITE(6607)MMPVVPSIGKlK2 VINCR=VPIOO GO TO 4
102 V I=V-VINCR VINCR=VINCRIOO VIMIN=VPI00DOO IF(VINCR-VIMIN) 19922
901 Vl=V-VINCR VINCR=VINCR200 VIMIN=VPIOOOO IF(VINCR-VIMIN)199902902
c
C
157
921 V1=V-VINCR VINCR=VINCRI200 VIMIN=VPI10000 IF(VINCR-VIMIN)199922922
199 CONTINUE GO TO 200
201 CONTINUE WRITE(b608)
200 CONTINUE RETURN END
158
APPENDIX B
Plasticity Relationships
In the elastic range stresses were computed from measured
strains by the usual elastic theory The values used for the
modulus of elasticity E and the shear modulus Gtwere 29OOOksi
and 11200ksi respectively When local yielding had occurred
according to the von Mises criterionas stated by equation (2)
Chapter 11 stresses were then computed by the plasticity
relations given by Hill(8) and reduced to the form given by
Bower(16) These relations are stated here for easy reference
Plasticity relations for a Prandtl-Reuss solid yield
dE = des _ ~(d)+ 2G dt (a)xT3Gt~xy
where E x is strain in the longitudinal direction and l$ xy
is the shearing strain Eliminating ~ by use of the von
Mises criteria gives
(b)
Since explicit integration of equation (b) would be
extremely difficult the equation is diVided by dE-x and the
derivatives d tSd E and d 6 yld poundx are replaced byx x
159
(c)
( d)
where~i and ~XYi are the bending and shearing stresses
respectively corresponding to ~ and ~f and ~xYf are
these stresses corresponding to poundx + 6 (x
Substituting equations (c) and (d) into equation (b)
gives
A~x - B6~ + AtS cs = AY l (e)
f
where (f)
and ( g)
The shear stress corresponding to a change in strain is given
by
2 2 ~ =Jcsy - CS f (h)
f [3
In order to determine whether strain hardening had occurred
an equivalent strain Xp was computed from
160
where lIE Xl ~yp Ezp and xyp are the plastic components of
strain and are given by
~ xp = poundx-t ( j)
Eyp = E yy (S
- i (k)
E (1)poundzp = z -~ (m)xyp = 6xy -
~
~
The constant volume condition was used to calculate ~ zp
(n)
The equivalent strain was compared to a reference strain
~ pr computed from the value for ~p for the onset of strain
hardening for a tensile test The strain hardening strain
was taken as euro x and it was assumed that E = poundoz For yy
A36 steel the strain hardening strain was taken as 115 ~yIE
and ~y was determined from a tensile test of a coupon from
the web of the test beam Strain hardening was considered
resent J f 6 gt or J P degpr-
The above relationships were included in a paper
presented by Bower(16) in 1968
161
BIBLIOGRAPHY
1 Muskhelishvili NISome Basic Problems of the Mathematical Theory of ElasticityU 2nd Edition P Noordhoff Itd 1963
2 HelIer SR Jr Brock JS and Bart R The itresses Around a Rectangular Opening with Rounded Corners in a Beam Subjected to Bending with Shear Proceedings Vol 1 Fourth U National Congress on Applied Mechanics Berkeley Calif 1962
3 Bower JE ItElastic Stresses Around Holes in WideshyFlange Beams Journal of the Structural Division ASCE Vol 92 No ST2 Proc Paper 4773April 1966
4 BowerJE Experimental Stresses in Wide-Flange Beams with Holes tl Journal of the Structural Division ASCE Vol 92 No ST5 Proc Paper 4945October 1966
5 So WC The Stresses Around Large Circular Openingsin the Webs of Wide-Flange Beams MEng Thesis McGill University Aug 1963
6 Chen IC tiThe Stresses Around Two Large Openings in the Webs of Wide-Flange Beams MEng Thesis McGill University Aug 1967
7 Segner EP Jr Reinforcement Requirements for Girder Web Openings Journal of the Structural Division ASCE Vol 90 No ST3 Proc Paper3919 June 1964
8 HillR The Mathematical Theory of PlastiCityClarendon Press Oxford University Press London 1950
9 Handbook of Steel Construction Canadian Institute of Steel Construction OntariO 1967
10 ltSpecifications for the DeSign Fabrication and Erection of Structural Steel for Buildings AISC 1963
11 Basler K Strength of Plate Girders in Shear Journal of the Structural Division ASCE Vol 87 No ST7 Proc Paper 2967 October 1961
162
12 Worley WJ Inelastic Behavior of Aluminum AlloyI-Beams With Web Cutouts University of Illinois Engineering Experimental Station Bulletin No 448 April 1958
13 Redwood RG and McCutcheon J 0 Beam Tests with Unreinforced Web Openings Journal of the Structural Division ASCE Vol 94 No ST1 Proc Paper5706 Jan 1968
14 nCommentary of Plastic DeSign in Steel ASCE Manual of Engineering Practice No 41 1961
15 Cheng SY flAn Investigation of Large Extended Openingsin the Webs of Wide-Flange Beams MBng Thesis McGill University Aug 1966
16 Bower JE Ultimate Strength of Beams with RectangularHoles Journal of the Structural Division ASCE Vol 94 No ST6 Proc Paper 5982 June 1968
17 Redwood RG Plastic Behavior and Design of Beams with Web Openings ff Proceedings of the Canadian Structural Engineering Conference Canadian Institute of Steel Construction Toronto Feb 1968
18 Redwood RG The Strength of Steel Beams with Unreinshyforced Web Holes Civil Engineering and PubliC Works Review Vol 64 No 755 London June 1969
19 Redwood RG Ultimate Strength Design of Beams with Multiple Openings Proceedings of the Structural Engineering Conference American Society of Civil Engineers Pittsburgh October 1968
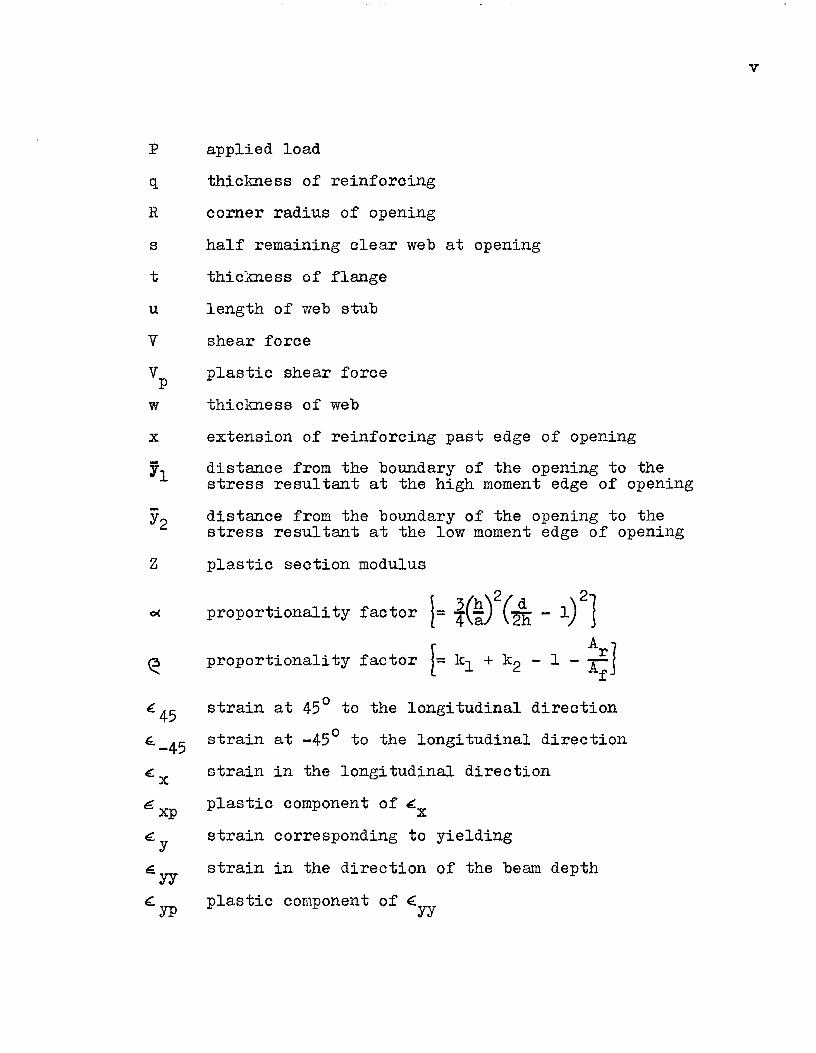
x
v
p applied load
q thickness of reinforcing
R corner radius of opening
s half remaining clear web at opening
t thickness of flange
u length of web stub
shear force
plastic shear force
w thickness of web
extension of reinforcing past edge of opening
distance from the boundary of the opening to the stress resultant at the high moment edge of opening
distance from the boundary of the opening to the stress resultant at the low moment edge of opening
z plastic section modulus
proportionality factor 1= i(~2(2~ - 1)21 ~ proportionality factor f= kl + k2 - 1 - ~J pound45 strain at 45 0 to the longitudinal direction
pound-45 strain at -45 0 to the longitudinal direction
pound x strain in the longitudinal direction
6 xp plastic component of ~x
pound y strain corresponding to yielding
~yy strain in the direction of the beam depth
euro yp plastic component of euroyy
vi
~z strain in the transverse direction
plastic component of poundz
strain corresponding to hardening
the initiation of strain
~p equivalent strain
~pr reference value of ~p
~ xy shearing strain
~ normal stress
yield stress
yield stress for flange
yield stress for reinforcing
yield stress for web
shear stress
AISC American Institute of Steel Construction
ASTM American SOCiety of Testing Materials
CISC Canadian Institute of Steel Construction
ASCE American Society of Civil Engineers
vii
LIST OF FIGURES
Page
1 Types of Reinforcing 93
2 Stress Distribution at Opening 94
3 Idealized Stress-Strain Curve for Structural Steel 94
4 Interaction Curve - Unperforated Beam 95
5 Load - Deflection Curves 96
6 Interaction Curve - Perforated Beam 97
7 Hinge Locations and Cross-Section of Member 98
8 Stress Distributions and Resultant Forces 99
9 Interaction Curve Showing Low and High Shear Regions 100
10 Interaction Curve - 14WF38 Nominal 7 x lOin Opening Itn X iReinforcing 101
11 Interaction Curve - 14WF3~ Nominal 7f1 X lot Opening 213 x t Reinforcing 102
12 Interaction Curve - 14WF38 Nominal 7 xlot Opening No Reinforcing 103
13 Interaction Curve - 14WF38 Nominal 7 x 14 Opening It x lIt Reinforcing 104
14 Interaction Curve - 14WF38 Nominal 9 x 13t Opening li x -n Reinforcing 105
15 Interaction Curve - 10WF21 Nominal 5~ n x Bi Opening li x i lt Reinforcing 106J
16 Test Beam Dimensions and Dial Gauge Locations 107
17 Test Beam Dimensions and Dial Gauge Locations 108
18 Test Beam Dimensions and Dial Gauge Locations 109
19 Lateral Bracing System 110
viii
Page
20 Photographs of Lateral Bracing System III
21 Strain Gauge Locations 112
22 Tensile Coupons 113
23 Stress-Strain Curve from Instron Testing Machine 113
24 Photographs of Test Beams after Collapse 114
25 Comparison Photographs of Test Beams 115
26 Comparison Photographs of Test Beams 116
27a Stress Distribution at High Moment Edge of OpeningBeam 2C 117
27b Stress Distribution at Low Moment Edge of OpeningBeam 2C 117
28a Stress Distribution at Centerline of OpeningBeam 2C 118
28b Bending Stress Distribution Across Flange at High Moment Edge of Opening - Beam 2C 118
29a Bending Stress Distribution Across Length of Opening at Top of Flange Beam 2C 119
29b Bending Stress Distribution Across Length of Opening at Top of Reinforcing - Beam 2C 119
30a Stress Distribution at High MOment Edge of Opening - Beam 3B 120
30b Stress Distribution at Low Moment Edge of Opening - Beam 3B 120
31a Stress Distribution at High Moment Edge of Opening - Beam 2D 121
31b stress Distribution at High Moment Edge of Opening - Beam 4B 121
32 Load-Relative Deflection Curve - Beam lA 122
33 Load-Relative Deflection Curve - Beam 2A 122
ix
Page
34 Load-Relative Deflection Curve - Beam 2B 123
35 Load-Relative Deflection Curve - Beam 2C 123
36 Load-Relative Deflection Curve - Beam 2D 124
37 Load-Relative Deflection Curve - Beam 3A 124
38 Load-Relative Deflection Curve - Beam 3B 125
39 Load-Relative Deflection Curve - Beam 4A 125
40 Load-Relative Deflection Curve - Beam 4B 126
41 Load-Relative Deflection Curve - Beam 5A 126
42 Load-Relative Deflection Curve - Beam 6A 127
43 Interaction Curves - Test Beam lA 128
44 Interaction Curves - Test Beams 2A and 2B 129
45 Interaction Curves - Test Beams 2C and 2D 130
46 Interaction Curves - Test Beam 3A 131
47 Interaction Curves - Test Beam 3B 132
48 Interaction Curves - Test Beams 4A and 4B 133
49 Interaction Curves - Test Beam 5A 134
50 Interaction Curves - Test Beam 6A 135
51 Lateral Deflection at High Moment Edge of OpeningBeam 2C 136
52 Flange Buckling at High Moment Edge of OpeningBeam 2C 137
53 Shear Stresses at End of Reinforcing 138
54 Variable Reinforcing Size 139
55 Variable Moment to Shear Ratio 140
56 Variable Moment to Shear Ratio 141
x
Page
57 Variable Moment to Shear Ratio 142
58 Variable Aspect Ratio 143
59 Variable Opening Depth to Beam Depth M4
xi
LIST OF TABLES
Page
1 Beam Properties 145
2 Tensile Test Results 146
3a Shear Values Corresponding to Yielding 147
3b Shear Values Corresponding to Strain Hardening 147
4 Shear Values Corresponding to Whitewash Flaking 148
5 Correlation Between Experiment and Theory 149
6 Correlation Between Experiment and Approximate Theory 149
7 Correlation Between Experimental Failure and Complete Yielding 150
8 Correlation Between Theoretical Failure and Complete Yielding 150
SUJn1[ARY
ACKNOWLEDGEMENTS
NOTATION
LIST OF FIGURES
LIST OF TABLES
TABLE OF CONTENTS
Page
ii
iii
iv
vii
xi
CHAPTER I INTRODUCTION
11 General Background 1
12 Types of Reinforcing 2
13 Elastic and Ultimate Strength Analysis 4
CHAPTER 11 ULTINfATE STHEUGTH BEHAVIOR
21 Behavior of Unperforated Beams 8
22 Behavior of Beams with Web Openings 12
23 Previous Ultimate Strength Investigations 17
24 Scope of the Investigation 25
CHAPTER III ULTIMATE STRENGTH ANALYSIS
31 Assumptions 27
32 Low Shear Solution - Case I 29
33 High Shear Solution - Case 11 35
34 Limits of Interaction Curves 36
CHAPTER IV APPROXIMATE METHOD
41 General Remarks 41
42 Development of the Method 42
43 Limitations on the Approximate Method 46
44 Summary and Discussion 50
Page CHAPTER V EXPERIMENTAL INVESTIGATION
51 Selection of Test Beams 56
52 Experimental Setup 59
53 Testing Procedure 62
54 Determination of Yield Stresses 63
CHAPTER VI EXPERIMENTAL RESULTS
61 Behavior of Beams during Testing 66
62 Stress Distributions and Failure Loads 71
63 other Factors 72
CHAPTER VII ANALYSIS OF RESULTS
71 Order of Onset of Yielding 77
72 Stress Distributions 78
73 Failure Loads 80
74 Influence of Reinforcing and Other Variables 82
CHAPTER VIII CONCLUSIONS AND RECO~Th1ENDATIONS
81 Conclusions 85
82 Recommendations for Design 88
83 Recommendations for Future Work 91
FIGURES 93
TABLES 145
APPENDIX A Computer Program for Interaction Curve 151
APPENDIX B Plasticity Relationships 158
BIBLIOGRAPHY 161
1
CHAPTER I
INTRODUCTION
11 General Background
It has become common practice to cut openings in the
webs of beams to permit the passage of utility ducts By
passing these utilities through rather than under the beams
the height of each floor in a building can be reduced thereshy
by effecting a considerable saving in cost particularly in
the case of multistorey structures However cutting an
opening in the web of a beam may considerably reduce the
strength of the beam in the vicinity of the opening If
the opening is located at some position in the beam where
stresses are low this may cause no special problems but
if it is located in a high stress region the designer is
faced with the problem of finding an economioal way to inshy
crease the strength of the beam so that failure will not
result at the opening under working loads
Two alternate approaches are possible in this case
The size of the entire member in question may be increased
on the basis of providing sufficient strength at the openshy
ing so that failure will not ocour The other approach is
to reinforce the original member in the vicinity of the
opening so that the loads can be carried without inducing
2
high stresses The size of the member itself then need not
be increased
Just as the decision whether to pass utilities through
rather than under floor beams must be based primarily on
economic considerations the decision whether to reinforce
an opening or increase the size of the entire member when
the opening is located in a high stress region must also be
based on economics Since many methods of reinforcing an
opening are possible the relative costs and effects of each
type of reinforcing deserve consideration
12 Types of Reinforcing
Reinforcing for an opening in the web of a beam may be
of three basic types
1 reinforcing to resist high bending stresses and low shear
stresses
2 reinforcing to resist low bending stresses and high shear
stresses
3 reinforcing to resist both high bending and shear stresses
Two examples of the first type are illustrated in Figures
la and lb By increasing the areas of the sections above
and below the centroid they provide additional moment
resisting capacity to the section However since shear
stresses are considered to be carried only by the web of
the section this type of reinforcing cannot increase the
3
shear capacity above that given by the shear capacity of
the uncut section times the ratio of the net web area at
the opening to the initial web area of the beam Reinforcshy
ing types to resist high shear stresses are those that
increase the web area so that more web is available to
resist these stresses Web doubler plates as shovm in
Figure lc are typical of this type of reinforcing although
their use is usually very limited due to welding difficulties
This type of reinforcing also increases moment capacity by
increasing the area above and below the opening Another
type of shear reinforcing uses vertical or inclined web
stiffeners to carry the shear forces past the opening A
typical arrangement of inclined web stiffeners is shown in
Figure Id The third type of reinforcing is essentially a
combination of the first two examples of which can be seen
in Figures le and If The area above and below the opening
is increased to give added moment capaCity and the effective
web area is increased by the addition of vertical or inclined
shear plates to provide added shear capacity to the section
A combination of the reinforcing arrangements in Figures la
and Id would be another example of this type Many other
arrangements of web opening reinforcing are pOSSible but
those shown in Figure 1 and mentioned above are typical of
the three main types
Since the problem of cutting and reinforcing an opening
4
in a section is basically one of economics the cost of the
process of reinforcing an opening must be considered This
cost may be divided into three parts the cost of supplying
and cutting the material to be used in reinforcing the openshy
ing that of bending and fitting this material and welding
this material into place Since the cost of welding is
paramount among the several expenses it is advantageous to
keep the welding to a minimum in the selection of a reinforcshy
ing type This tends to make the high shear type of reinforcshy
ing uneconomical and essentially limits the more practical
opening reinforcings to those of the type considered in
Figures la and lb The present investigation is devoted to
this type of reinforcing and specifically to that arrangement
given in Figure lb
13 Elastic and Ultimate Strength Analysis
BaSically two types of analysis were available for this
study - elastic and ultimate strength The elastic analysiS
of the stresses in a beam containing an opening in its web
consists of the superposition of the stresses occurring in
an unperforated beam and the stresses resulting from forces
applied to the boundary of the opening in such a way as to
satisfy certain boundary conditions at the opening This
approach finds its basis in an important work presented by
NIMuskhelishvili(l) in the 1930s and was used by SR
5
Heller Jr et al(2) in 1962 and by JEBower(3) in 1966 to
investigate the elastic stresses around openings in wideshy
flange beams Bowers work also outlined the widely used
approximate Vierendeel analysis based on the assumption that
the beam behaves like a Vierendeel truss in the vicinity of
the opening The shear force carried by the section causes
secondary bending moments to occur within the tee sections
formed by the flange and the remaining part of the web above
and below the opening A point of contraflexure for the
secondary bending stresses is assumed to occur at the midshy
length of the opening The forces acting at the opening and
the resultant stress distributions are shown in Figure 2 It~
is assumed that the shear is carried equally by the tee secshy
tions above and below the opening and that the secondary and
primary bending stresses are additive
Bower also performed an experimental study(4) in 1966
to verify the results of his analysis A series of 16WF36
beams each containing one opening either circular or
rectangular with corner radii of 14 inch were tested at
varying moment to shear ratios The beams were implemented
with electrical resistance strain gauges in the vicinity of
the openings so that strains could be measured and compared
to those predicted by theory The results of Bowers tests
showed that very high stress concentrations occur at the
corners of rectangular openings while smaller stress concenshy
6
trations occur above and below circular openings where the
tee section is the smallest The findings for circular
openings confirm those given by So(5) in 1963 while those
for rectangular openings were confirmed by Chen(6) in 1967
Bower showed that for both types of openings investigated
the elastic analysis predicts all stresses and stress concenshy
trations with reasonable accuracy except for the octahedral
shear stresses away from the boundary of the opening The
elastic analYSiS however is complicated and requirea the
use of a computer and is incapable of dealing with the presshy
ence of notches or other irregularities at the opening The
approximate Vierendeel method was found to predict bending
stresses and octahedral shear stresses with acceptable
accuracy while failing to predict the stress concentrations
in both cases However the approximate method is relatively
simple and lends itself easily to hand calculations Since
the elastic analysis is not practical particularly for
design purposes because of the length of the calculations
involved it has been suggested by Bower and others(7) that
the Vierendeel analysis be used in its place with stress
concentrations neglected when an elastic analysis is desired
A design based on this method would result in a beam whose
response is not purely elastic under working loads
An analysis based on complete yielding of the sections
where high stress concentrations exist under elastic condishy
7
--~~
~ tions would eliminate this problem Such a plastic or
ultimate strength analysis would take advantage of the
additional strength of the perforated beam between the onset
of yielding and the complete plastification of the section
or sections that would cause failure or uncontrolled deformshy
ations of the beam Besides eliminating the problem of stress
concentrations in the elastic range a plastic analysis also
has the advantage of being simpler to use than the complete
elastic analysis and of not being rendered unusuable when
notches or irregularities are present at the opening since
the method depends only on the reasonably accurate prediction
of the sections where complete yielding or plastic hinges
will occur These regions can generally be determined withshy
out difficulty particularly in the case of rectangular
openings Consideration of these factors suggest an ultishy
mate strength analysis as the most rational approach to
the problem
8
CHAPTER 11
ULTIMATE STRENGTH BEHAVIOR
21 Behavior of Unperforated Beams
Ultimate strength analysis truces advantage of the ducshy
tility of structural steel This ductility mruces it possible
for the steel to undergo large deformations beyond the elastic
limit before failure occurs As can be seen from the idealized
stress-strain curve in Figure 3 the material is elastic up
to the yield level but after this level is reached the strain
increases extensively without any further increase in stress
Beoause of this attainment of the yield stress at the outershy
most fiber of a beam in bending does not cause the failure of
the member Rather the member has reserve strength that
permits increase of load up to the point where the entire
cross-section has reaohed the yield stress ie when a plastio
hinge has fonned at the yielded section Since rotation is
free to occur at plastic hinge locations when sufficient
hinges have formed so that the structure forms a mechanism
and is unstable under the applied loads collapse will occur
For a simply supported beam of uniform cross-section
formation of only one plastio hinge is suffioient to cause
collapse If no shear or axial forces are acting the plastic
moment or maximum moment capacity of the section is easily
9
obtained and is equal to the first moment of the area of the
section above or below the centroid about the centroid times
the yield stress of the material This is writte~ as
where Z is the plastic section modulus of the section and ~y
is the yield stress
The presence of a moment-gradient (shear) has the effect
of lowering the plastic moment capacity of a member Since
the shear force is carried by the web of the member the
moment carrying capacity of the web and therefore that of
the member must be reduced since the presence of shear
causes a reduction in the normal stress carrying capacity of
the web The yielding criterion of von Mises is generally
accepted as being the most applicable to structural steel
and can be explained physically in either of two ways
Henckys interpretation states that when the energy of disshy
tortion reaches a maximum value yielding results A preferred
explanation offered by Prandtl states that when the shear
stress on the octahedral plane reaches some maximum value
yielding occurs(8) Von Mises t yield criteria can be
expressed mathematically as
10
where ltSyiS the yield stress ltS the normal stress and the
shear stress The effect of shear on moment capacity can
best be illustrated by an interaction curve as shown in
Figure 4 where the axes have been non-dimensionalized by
diVision by Mp and Vp Vp is the maximum shear carrying
capacity of the section under pure shear and is obtained
from equation (2) as
where = Vw( d-2t) V is the shear force and w( d-2t) the
clear web area Equation (3) presupposes that the flanges
of the section carry no shear The broken line in Figure 4
illustrates the interaction between moment and shear for an
unperforated wide-flange section as predicted by equation (2)
Such an interaction curve shows for any given moment value
the corresponding shear value that a member can safely sustain
Any value less than those on the interaction curve (those
bounded by the VV and MM axes and the interaction curve)p p represents a combination of moment and shear which the member
can safely carry Values on or outside the interaction curve
represent those combinations which would cause collapse of the
member The reduction in strength due to shear is however (9)fairly small for unperforated sections and OISC and
AISc(lO) design codes for buildings allow it to be neglectshy
11
ed for design purposes since the ooouranoe of strain hardenshy
ing makes possible the attainment of moments greater than Mp
in the presence of shear The allowable moment and shear
values thus permitted are those bounded by the solid line in
Figure 4
The inorease in strength due to strain hardening oan best
be illustrated by considering the load-defleotion curves in
Figure 5 The load-defleotion ourve for a beam in pure bendshy
ing is given in Figure 5a When the plastio moment of the
seotion is reaohed the defleotions beoome exoessive and
increase with no further inorease in load This ooours
beoause the member forms a meohanism with the formation of
a plastio hinge at the attainment of Mp However when shear
is present the load-defleotion ourve does not beoome horishy
zontal when the reduoed Mp Mp as predioted by equation (2)
and given by the interaction curve in Figure 4 is reached
but rather oontinues to climb at a lesser slope reaching
values equal to or greater than the full Mp given by equation
(1) This oan be seen in Figure 5b The increase in strength
above Mp under moment gradient is due to strain hardening
and is usually neglected in simple plastiC theory although
it can be predicted but the procedure is complicated for
all but very simple cases Strain hardening occurs in the
presence of shear because yielding occurs in localized areas
or slip bands so that the material within these bands strain
12
hardens before adjacent areas reach the point of yield Alshy
though simple plastic theory neglects strain hardening the
significance of this phenomenon should not be underestimated
since all rolled sections are proportioned such that the limit
of shear carrying capacity of the web lies within the strain
hardening range(ll)
22 Behavior of Beams with Web Openings
The introduction of an opening into the web of a wideshy
flange section has two effects on the interaction curve The
first and more immediately apparent of these effects is the
reduction of shear and moment capacity by the reduction of the
area available to resist these forces The moment capacity
is reduced to
(4)
where w is the web thickness and h is the half depth of the
opening The shear capacity is reduced to
v = w( d-2t-2h) $-3
This change in the interaction curve is shown by the broken
line in Figure 6 The second effect caused by the presence
of an opening is the strong interaction between moment and
shear due to the member behaving like a Vierendeel truss in
13
the vicinity of the opening This is the same type of
behavior described in Section 13 except that the member
is analyzed in the plastic rather than the elastic range
The secondary bending moments caused by the shear force are
added to the primary bending moments thus causing the critical
sections to yield completely at lower loads than would be exshy
pected were this interaction effect ignored This is shown
by the line in Figure 6 where the effects of shear as given
by equation (2) have also been included
The addition of horizontal bar reinforcing above and
below an opening in a wide-flange beam increases the maxishy
mum moment capacity of the section (no shear acting) above
that of an unreinforced opening by increasing the area of
the section capable of resisting moment The effects of
interaction between moment and shear are also reduced by the
addition of reinforcing since the reinforcing is of such a
type as to be particularly well suited to resist secondary
bending moments due to Vierendeel action The maximum shear
carrying capacity of a reinforced opening may reach
(Vv) = d-2t-2h (6)P max d-2t
which is the maximum shear carrying capacity of the section
assuming no interaction and is derived from equation (5) by
division by equation (3) This can represent a considerable
14
increase in strength over the shear capacity of the unreinshy
forced opening which is normally much below (VVp)max because
secondary bending moments have to be resisted to a large
extent by the web since there is no reinforcing to perform
this task
The presence of an unreinforced rectangular opening in
the web of a wide-flange section oauses ohanges in the failure
modes of the beam as well as in the interaction ourve Sevshy
eral investigations have confirmed these ohanges in failure
modes(461213) Vllien subjected to pure bending the member
is found to fail by oomplete yielding of the tee sections
above and below the opening Load defleotion curves for this
case are similar to those for an unperforated beam under pure
bending in that with the attainment of Mp the curve becomes
horizontal and collapse eventually occurs with no further
increase in load
Vhen the perforated beam is subjected to bending with
shear large relative displacements occur between the ends
of the opening and at the same time localized plastiC binges
form at each of the four corners of the opening by complete
yielding of the tee section at these locations The load-
deflection curve in this situation is similar to the load-
deflection curve of an unperforated member under moment-
gradient except that the second portion of the curve after
15
the bend is not always as straight as that for the unpershy
forated beam and in fact may possess considerable
curvature in some cases(13) The value of the moment at the
opening at which the load-relative deflection curve bends
is not that of the unperforated section but instead is a
reduced value obtained by considering both reduced area and
moment-shear interaction as described previously_ Again
the increase in load above the value corresponding to the
predicted moment is due to strain hardening for the same
reasons as cited previously_ This strain hardening effect
makes it exceedingly difficult to ascertain at what value of
shear or moment an experimental test beam should be considershy
ed to have failed so that this failure load can be compared
to one predicted by theory It can be said with certainty
that this value should lie somewhere between the load at
which the load-relative deflection curve starts to bend from
its initial slope and the ultimate load at which the beam
suffers total collapse This total collapse will be either
by web buokling at the opening or by oraoking of one or more
of the corners of the opening after which deflections become
uncontrolled and the load carrying capacity of the beam
decreases
The use of the collapse load as the failure load would
however not be justified unless the effects of strain hardenshy
ing and the possibility ot tearing and buokling are incorporatshy
16
ed into the analysis Also the deflections become so exshy
cessive as to make the beam unserviceable before this load
is reached Indeed a rational definition would have to be
such as to have the failure load fall within the region
where the load-relative deflection curve bends from its
initial slope to some new slope One possible means of
defining failure in this type of situation is suggested in
ASCE tlOommentary on Plastic Design in Steel(14) and
is perhaps the most rational approach to the problem The
initial slope of the load-relative deflection curve is
multiplied by some constant factor to obtain a new slope
A line having this new elope is then drawn tangent to the
upper portion of the load-relative deflection curve and the
load at which this new slope intersects the initial slope is
taken to be the failure load This is analogous to considershy
ing strain hardening in some simple case where the slope of
the theoretical load-deflection curve in the strain hardening
range is equal to a constant times the initial slope of the
curve when the beam is still elastic If this method is to
be used a method of determining a suitable constant must
be chosen possibly from experiment
The modes of failure of a beam containing a reinforced
opening are expected to be the same as those with an unreinshy
forced opening under both pure bending and bending with shear()
Similarly the load-deflection curves or the load-relative
17
deflection curves would be the same in both cases Thus for
cases of moment gradient the same situation exists for both
reinforced and unreinforced openings where the load continues
to increase past the attainment of the predicted moment
capacity of the section due to strain hardening and the same
difficulty exists for determining failure loads for beams
with reinforced openings as for the unreinforced case
The method suggested in ASCE and described previousshy
ly for determining failure load was adopted for the purposes
of correlating experimental and theoretioal values of failure
load in this study Since the load-relative defleotion curves
for some of the test beams approached a fairly constant slope
in the strain hardening range it was decided to determine
the slopes and constant multiplication factors for these
cases and apply the same factor to all of the test beams
since all were similar It was thus decided to use a value
of thirty times the initial slope for the final slope in
determining experimental failure loads
23 Previous Ultimate Strength Investigations
While considerable theoretical and experimental work
has been done in the determination of elastic stresses around
openings in plates and beams relatively little has been done
ooncerning ultimate strength behavior In 1958 wJworley(12)
18
carried out an investigation of the ultimate strength of
aluminum alloy I-beams containing web openings of various
shapes Rectangular elliptical and triangular openings
were studied with the main objects of the research being
to determine which shape of opening resulted in the smallest
loss of strength and to verify the validity of an upper
bound theorem in predicting the fully plastiC load carrying
capaCity of the test beams The upper bound plastiC theorem
states that of all the possible mechanisms or combinations
of plastic hinges sufficient to cause collapse the one that
ensures collapse at the lowest load is the correct mechanism
under which the member will actually fail Worleys experishy
mental results were in fairly good agreement with the ultimate
loads predicted by the upper bound theorem and were the most
accurate for the case of rectangular openings where hinge
locations were more easily predicted than for the other openshy
ing types Of the various opening shapes tested it was found
that the elliptical opening was the strongest on a maximum
area removed baSiS while the triangular was stronger on a
maximum depth basiS The practical need for these two shapes
especially the triangular is however questionable Worley
excluded the effects of shear and axial force in his analysis
and for rectangular openings assumed a four hinge mechanism
with hinges considered at the corners of the opening
19
In 1963 W-CSo(5) presented a study of large circular
openings in wide-flange beams including an ultimate strength
analysis based on the assumption of a plastic hinge over the
center of the opening Sots analysis however neglected
secondary bending effects due to Vierendeel action in the
vioinity of the opening and also ignored shear yielding
effects in the web The experimental investigation performshy
ed in the ultimate strength range consisted of the testing
of two l4WF30 beams to collapse The first beam was tested
in pure bending so that shear and Vierendeel action were not
present and the ultimate strength predioted by Sos analysis
would be expeoted to be oorreot since the same strength would
be predicted in this case whether or not these effects were
considered Deviation between experiment and theory was 3
The second beam was tested under moment gradient but due to
the relative location of opening and maximum moment (the
beam was simply supported and subjected to a single concenshy
trated load) the beam was expected to and did fail under
the load and not at the opening
S-y Cheng(15) in 1966 considered bending shear and
axial forces in his investigation of the ultimate strength
of extended circular openings in wide-flange beams At high
values of shear a four hinge mechanism was assumed while at
low shears hinges were assumed above and below the opening
20
where the tee section was smallest - similar to the failure
mode in pure bending Stress distributions were assumed at
hinge locations for each case Two l4WF30 beams were tested
to destruction one in pure bending and the other with a
moment to shear ratio of 24 inches which is a high value of
shear for the size beam used While reasonable agreement
between theory and experiment was obtained for both beams
tested an inherent fault in Chengs work lies in its inshy
ability to predict a continuous variation of failure loads
as the shear varies from a low to a high value It is
impossible for the change from a one to a four hinge mechanism
to occur suddenly with only a slight increase in shear
Experiments in the ultimate strength region were performshy
ed by I-C Chen(6) in 1967 on two 14WF30 beams each containing
two large openings in their webs One simply supported beam
containing two 8 inch diameter circular openings spaced 8
inches apart was found to fail in the manner of a be~u conshy
taining only one opening failure being associated with the
opening subjected to the largest moment both being under
the same shear force In the second beam containing two
8x12 inch reotangular openings spaced 4 inches apart the two
openings failed as a unit with four hinges forming at the
outer oorners opoundthe openings and the web between them evenshy
tually buckling No theoretioal ultimate strength analysis
was offered by Chen
21
In 1968 JEBower(16) proposed an ultimate strength
theory for beams containing a single rectangular opening in
their webs A point of contraflexure for Vierendeel stresses
was assumed to occur at the midlength of the opening and
three alternate stress distributions were proposed for
complete yielding of the low moment edge of opening The
first of these stress distributions assumed no Vierendeel
action and was quickly discounted as giving unrealistically
high predictions of strength The two remaining stress
distributions both took into account secondary bending moments
due to shear the first assuming localized web yielding in
shear and the second assuming uniform shear distribution
over part of the web with this area yielding in combined
bending and shear The first of these lower bound solutions
was based on an unrealistic stress distribution and proved
to give unrealistically low predictions of the beam strength
The second lower bound solution which was finally adopted
by Bower was based on a more realistic stress distribution
but was restricted in that the point of contraflexure was
assumed at the midlength of the opening which is not always
the case
Experiments were performed on four 16WF36 beams each
oontaining one rectangular opening as part of this work
Collapse loads are oited for each of the test beams and are
22
compared with predictions from the second lower bound analysis
However since all of the beams were tested at relatively high
ratios of shear to moment considerable strain hardening
would have occurred before collapse and experimental results
which take advantage of the reserved strength due to this
strain hardening (even though accompanied by large deformashy
tions) cannot justifiably be compared to a theory that ignores
this effect
A more general ultimate strength analysis for beams with
rectangular openings was offered by RGRedwood(17) also in
1968 A point of contraflexure was assumed to occur someshy
where within the tee section above and below the opening but
its location was not dictated as in Bowers analysis A
four hinge mechanism was assumed on the basis of previous
tests(13) with stress distributions assumed at both high
and low moment edges of the opening Shear stresses were
assumed carried by the entire web of the section with web
yielding occurring in combined bending and shear
Redwoods analysis was correlated with his previous
experimental investigations and found to be conservative
when shears were large But again the effects of strain
hardening were included in the experimental collapse loads
and not in the theory If the experimental failure loads
could be related to the occurrence of full yielding at the
23
critical sections a more valid comparison with the theory
would result Such a comparison was taken into account by
Redwood in a later paper(la) In this paper failure is defined
in a way similar to that suggested in the previous section
Another recent paper by Redwood(19) deals with beams
containing multiple unreinforced openings in their webs A
method is offered for determining the minimum spacing required
between openings to prevent their interaction and failure
as a unit An analysis is also given for determining the
strength of a member when failure is associated with more
than one opening and this is combined with Redwoods analysis
offered previously(17) for failure associated with only one
opening The theory is compared to the experimental work
performed by Chen(6) in 1967 (7)In 1964 EPSegner Jr conducted an investigation
of several types of reinforcing for rectangular openings
testing six wide-flange beams in four different sizes each
containing two or more openings The openings in five of
the six beams were reinforced each With one of five main
types of reinforcing The openings were positioned at
several different moment to shear ratios and each of the
beams was tested to destruction Unfortunately little can
be said about the performance of the different types of
reinforcing under varying moment-shear conditions because
24
of the large number of variables included in each of the tests
Perhaps Segners most significant contribution is to be
found in his cost comparison of the various types of reinshy
forcing for rectangular openings Estimates cited for six
different fabricators clearly indicate that shear-type reinshy
forCing or reinforcing designed to carry high shear forces
around the opening is economically non-feasible except in
unusual circumstances The most economical type of reinshy
forcing included in this study consisted of two flat plates
bent to fit the shape of the opening and welded inside the
opening with a small gap between them occurring at the midshy
depth of the opening This is the same type as shown in
Figure la Another type of reinforcing included in Segnerts
experimental work but unfortunately omitted from his eco~
nomic comparison consisted of straight horizontal reinforcshy
ing plates welded above and below the opening at the openingis
boundary The plates extended past the vertical edges of the
opening to allow for anchorage of the plate Considerable
welding problems were said to have been encountered by placing
the reinforcing flush with the upper and lower edges of the
opening since the fillet was likely to overrun into the radii
of the re-entrant corners but this could easily be overcome
by leaving a small web stub between the plate and the opening
to allow for welding This type including the modification
25
for welding purposes is that given in Figure lb
Although this reinforcing type was not included in the
economic comparison presented by Segner it would seem to be
of only slightly greater cost than that in Figure la
Approximately the same amount of reinforcing material is
needed for these two types and while the straight bar reinshy
forcing requires more welding it does not require bending
of the plates and eliminates the worry of fit between the
plate bends and the opening radii After giving careful
consideration to the economics and fabrication problems of
reinforcing a rectangular opening in the web of a beam it
was decided to devote the present investigation to reinforcshy
ing of the horizontal straight bar type
24 Scope of the Investigation
An ultimate strength analysis is presented for wideshy
flange beams containing large rectangular openings in their
webs and reinforced with straight bar reinforcing above and
below the openings The investigation includes the effect
on beam strength of variable opening depth to beam depth
opening length to depth reinforcing Size and moment to
shear ratio One lOWF21 and ten l4WF38 beams were tested to
collapse Each of the test beams contained one rectangular
opening centered at the middepth of the beam and ten of the
26
eleven openings were reinforced Deflections were measured
at several pOints for all of the test beams and each beam
was painted with a brittle coating of whitewash in the region
of the opening to obtain an indication of the order of onset
of yielding Four of the test beams were also equipped with
electrical resistance strain gauges at critical sections The
experimental investigation encompassed each of the variables
of the theoretical work
27
CHAPTER III
ULTI1iATE STRENGTH ANALYSIS
31 Assumptions
Based on the discussions in the previous chapters the
following assumptions are made in this analysis of reinforcshy
ed rectangular openings with horizontal reinforcing bars
1 Failure of the member takes place by formation of a four
hinge mechanism with hinge locations being at the corners
of the opening These locations are shown in Figure 7a
a cross-section through the opening being given in Figure
7b
2 A point of contraflexure occurs somewhere within the
length of the tee section Its location is the same
above and below the opening but this location is not
dictated
3 Stress distributions at high and low moment edges of the
opening are those shown in Figure 8b Since the stresses
are antisymmetric with respect to the vertical axis of
the beam only the stresses for the tee-section above
the opening are indicated The resultant forces acting
on the tee-section are shown in Figure 8a
4 Shear stresses are carried only by the web of the teeshy
section and are uniformly distributed across this web at
28
hinge locations when hinges are fully formed While
the shear stress at the boundary of the opening must be
zero this assumption introduces only very slight error
into the theory since these stresses can increase from
zero to their maximum value at a very small distance from
the opening 1 s boundary_ Due to the presence of the reinshy
forcing bar it is likely that most of the shear will be
carried by the region of web between the reinforcing bar
and the flange particularly when the secondary bending
stresses are very high This is further discussed in
Section 34 and introduces no significant error in the
development of this method
5 Yielding in the web occurs lliLder combined bending and
shear according to the von Mises criterion stated in
equation (2) Yielding in the flange and reinforcing is
in direct tension or compression
On the basis of the assumed stress distributions equishy
librium equations can be obtained for the tee-section at
values of the shear force which may vary in some cases
from zero up to the maximum as given by equation (5) At
the high moment edge of the opening section (1) in Figure
Bb stress reversal will occur within the web when the shear
force is relatively low (case I) but will occur within the
flange when the shear force is high (case II) These two
29
cases will be repounderred to as low and high shear conditions
respectively_ Three different locations of stress reversal
are possible under the low stress conditions
1 Reversal in the web stub below the reinforcing This
occurs at very low values of shear
2 Reversal in that portion of the web to which the reinshy
forcing is attached
3 Reversal in the clear web between reinforcing and flange
The range of shear values corresponding to reversal in
this region is very small
At section (2) the low moment edge of the opening for
practical situations reversal will occur only in the flange
32 Low Shear Solution - Case I
Consider equilibrium of the portion of the beam to the
right of Section (2) in Figure 7a Taking moments about
section (2) gives
where V denotes shear force as before F2 is the resultant
force at section (2) and Y2 is the distance from the edge of
the opening to the resultant normal F2bull All other symbols
used in this section and not specifically defined here are
defined in Figures 7 and 8 Taking moments about section (1)
30
for that portion of the beam to the right of this section
yields
(8)
where Fl and Yl are comparable to F2 and Y2 respectively
Equilibrium of the tee-section in Figure 8a requires that
(9)
Oonsideration of the assumed stress distribution at section (1)
for stress reversal occurring in the web stub below the reinshy
forcing ie for 0 =klS ~ u gives on integrating the
stresses
Fl = Af ~yf + SW(1-2~)G + Ar ~yr (10)
FIYl = Af ~ Yf(s~) + ~S2WG(1-2ki) + ArJ yr(u1) (11)
where Af = bt the area of one flange and Ar = q(c-w) the
area of one pair of reinforcing bars Separate yield stress
values are used for flange web and reinforcing because of
the large variation possible in these in a single beam A
discussion of the determination of these stresses is included
in Chapter 5 Yield stresses are designated as ~ yf for the
flange G yw for the web and ~ yr for the reinforcing
31
and ~ the normal stress carrying capacity of the web is
calculated from
t2 _ r- 2 3(V)2 ~ - yw-4sw (12)
and is another way of stating the von Mises yield criterion
given by equation (2) From consideration of the stress
distribution at section (2) for stress reversal in the flange
F2 = Af ltS yf(1-2k2) + sw ~ + Ar c yr (13)
F2Y2 = Al~Yf [S(1-2k2)~(1-4k2+2k~)J -1-s2Wlti +Ar~ yr(u~) (14)
Although explicit expressions for shear and moment capacity
cannot be determined from the above equations it is possible
to obtain from them that portion of the interaction curve
relating combinations of shear and moment at midlength of
opening to cause collapse of the beam for shear values in
the assumed range Consideration of other locations of stress
reversal will yield expressions from which the remainder of
the interaction curve can be determined
Specifically for 0 ~ kls ~ u kl can be determined as
a function of k2 from equations (9) (10) and (13) and is
given by
32
From equations (7) (8) (11) and (14) a quadratic expression
is obtained for k2 in terms of known quantities and V
Z [AfCSyf ] Vak2 (sw cs ) s + t + k2 ( -d+2h) + A G = 0 (16 )
f yf
For a given value of V equations (12) (15) and (16) can be
used to determine the corresponding values of kl and k2bull Fl
can then be calculated from equation (10) and FIYl from equashy
tion (11) The moment at mid1ength of opening is then detershy
mined from
(17)
Thus for a given value of V a corresponding value for M can
be obtained The values of kl and k2 must be checked when
calculated to determine whether initial assumptions of
o ~ k1s ~ u and 0 ~ k2 ~ 10 have been met Only one solution
to the quadratic equation in k2 will fulfill these requireshy
ments unless both solutions are equal The above equations
will yield a value for M for a given value of V starting at
V = 0 and continuing for increments in V until the location
of stress reversal at section (1) moves into the region where
the reinforcing is attached ie for kls gt u When this
occurs neither solution to equation (16) will yield values
of k1 and k2 that satisfy the initial assumptions and the
33
initial equations for stress resultants at section (1) must
be replaced by new equations reflecting this change Quite
simply equations (10) and (11) are replaced by
respectively for u ~ kls ~ (u+q) Equations (13) and (14)
remain unchanged for section (2) since reversal will occur
only in the flange at this section Thus for u ~ klS ~ (u+q)
ie for reversal within the reinforcing equations (9)
(13) and (18) yield
Similarly from equations (7) (8) (14) and (19)
- (d-2h)]
va u 2( c-w) Go s ( c-w) G
+ + [ _----oiOioV] [ yr IJ = 0 (21)AfGyf Af csyf sw cs- + s c-w) csyr shy
The same procedure is followed as in the previous case
first V being assumed ~ being obtained from equation (12)
34
k2 from equation (21) kl from (20) Fl from (18) FIJl from
(19) and finally from equation (17) the value of M correshy
sponding to the assumed value of V Again the values
obtained for kl and k2 must be checked to assure that the
initial conditions of u ~ kls ~ (u+q) and 0 ~ k2 ~ 10 are
met These equations will yield admissible values of kl
and k2 for values of V increasing from the last admissible
value obtained by solution of the previous set of equations
and continuing to where kls reaches the value (u+q) ie
for stress reversal in the clear web at section (1) ~nen
(u+q) ~ kls ~ s equations (18) and (19) are replaced by
(22)
and equations (9) (13) and (22) give
(24)
While from equations (7) (8) (14) and (23)
(25)
35
For a given value of V a corresponding value for M is
determined in the same manner as for the two previous cases
Acceptable solutions will be obtainable as long as the stress
reversal at section (1) falls within the clear web However
when this reversal occurs in the flange the so-called high
shear solution is indicated
33 High Shear Solution -Case 11
When the shear force is high stress reversal at section
(1) occurs in the flange and the equations for resultant
normal force and moment arm from the edge of the opening
become
Fl = Af ltS f(2k -1) - sw~ - A C (26)Y 1 r yr
The stress reversal at section (2) will still occur in the
flange and equations (13) and (14) are used with the above
equations and equations (7) (8) and (9) to obtain
(28)
(29)
36
For a given value of V a corresponding M is obtained from
the above equations and equations (12) and (17)
By starting with a value of V = 0 and increasing this
by a small increment with each successive iteration correshy
sponding values of M can be found for the full range of V
values by use of the equations in this and the previous
section An interaction curve can then be plotted relating
V and M over their full range of values A typical intershy
action curve is shown in Figure 9 for a beam containing a
reinforced opening where the curve has been nondimensionalized
by division of V and M by Vp and Mp respectively Also
indicated in this curve are the four regions corresponding
to the different locations of stress reversal at the high
moment edge of the opening
34 Limits of Interaction Curves
It is quite possible for the MM values for a certainp range of VV values on the interaction curve to be greaterp than 10 as can be seen in Figure 9 This simply means
that the reinforced opening can be stronger than the unperfoshy
rated beam for pure bending and for bending with very low
shear However values of MM greater than 10 have no realp practical significance because in such cases failure of the
beam would occur not at the opening but at some unperforated
37
portion of the beam near the opening Therefore 10 is
taken as the maximum value of MM and a horizontal line isp drawn at this value from the MM axis to intersect thep interaction curve This is shown in Figure 9
The interaction curve is also limited with respect to
the maximum VV value permissible Since shear forces canp only be carried by the remaining part of the web the maximum
plastic shear capacity at the opening is equal to V thep plastic shear capacity of the uncut section times the ratio
of the remaining clear web to the initial clear web This
is written as
d-2t-2h (6)= d-2t
In other words when the web of the section at the opening
has yielded in shear its normal stress carrying capacity
~ becomes zero The value of V at which this occurs can be
determined from equation (12) and the ratio of this shear
value to Vp is given by equation (6) Vmen this limiting
value of shear is reached it is no longer possible to obtain
additional points on the interaction curve because any
further increment in V would yield an imaginary solution for
~ Rather when(VVp)max is reached a line is drawn from
this last point on the interaction curve perpendicular to
38
the vVp axis This line is the final portion of the intershy
action curve and represents the actual limiting value of
This limiting value of VVp is however not always
reached for all practical sizes of beam opening and reinshy
forcing It is possible for the equations in the previous
two sections to yield values of kl and k2 that no longer
conform to initial assumptions (for any position of stress
reversal) at a shear value less than the maximum predicted
by equation (6) This occurred in some of the cases tested
to confirm the consistency of these equations and was found
to be caused by an imaginary solution to the quadratic in k2
occurring while stress reversal at section (1) was still in
the clear web of the section Stress reversal at section (2)
was as assumed in the flange Consideration of other
locations of stress reversal did not give real answers This
condition was then investigated and it was found that because
of an interdependence of opening length and reinforcing area
either the opening length must be less than a given value or
the reinforcing area greater than another value in order
for the interaction curve to be able to pass this region
The limiting half length of opening a is given by
(30)
39
and is obtained by combining equations (7) (8) (14) (23)
and (24) with ~ equal to zero By eliminating small terms
this may be simplified to
(31)
Alternatively the minimum area of reinforcing required is
given by
A =2 ( 32) r 13
If this requirement is met it will be assured that the
maximum shear capacity of the section will be reached
Physically the interdependence of reinforcing area and length
of opening can be interpreted to mean that as opening length
is increased the secondary bending stresses which are a
function of shear and opening length increase at sections
(1) and (2) to such an extent that unless the reinforcing
area is increased so that it can carry these high stresses
the lower portion of the web is forced to carry such high
bending stresses that little or no shear can be carried by
this portion of the web The shear stress can then no longshy
er be considered to be uniform across the entire web of the
tee section but instead is restricted to the clear web
between flange and reinforcing or to a portion of this area
40
Reaching the maximum value of vVas given by equationp
(6) is not a necessity either for the interaction curve or
for the performance of a given beam and opening A given
interaction curve is still correct if it terminates before
reaching this value of vVp This occurs when the MMp value
decreases rapidly for very small increments in vvp and
becomes zero In this case the last portion of the intershy
action curve is very nearly a vertical line This line then
represents the actual maximum shear capacity for the given
beam opening and reinforcing dimensions Only when a beam
is to perform under high shear conditions and it is desired
to develop its maximum shear capacity is it necessary to
ensure that Ar is large enough so that this value can be
reached
41
CHAPTER IV
APPROXIMATE METHOD
41 General Remarks
If a particular beam and opening size is being investishy
gated over a very limited range of shear values it is a
fairly straightforward matter to calculate the moment capacity
of the beam corresponding to the given shear values using
the equations presented in the previous chapter hven if the
location of stress reversal were consistently assumed in the
wrong region the calculations would have to be repeated at
most four times for a particular shear value However it is
quickly realized that for a large range of shear values or
for a complete interaction curve it would be extremely
laborious to perform these calculations by hand and recourse
to automatic computation would seem almost essential A
computer program has been developed to perform the necessary
calculations for a complete interaction curve for a specified
beam opening and reinforcing size and is given in Appendix A
Since the practical development of a complete interaction
curve is seriously limited by the length of calculations
involved a simple to use approximate method is suggested for
determining the strength of a perforated beam at various
moment to shear ratios In the development of this approxishy
42
mate method the high shear region only is considered for
reasons which will become evident
42 DeveloEment of the Method
Combination of equations (3) (12) and (28) result in
the following expression
(33)
where for simplici ty ~I~- - ~Y= ~~ t the specified minimum
yield stress of the material Similarly equations (1) (17)
(26) (28) and (29) can be combined to give
M d(kl -k2) + t(k~-ki) (34) ~ = a-i) + wtf2t)~
Xf
and from equations (12) (28) and (29) kl and k2 are related
by
(35 )
If it is now assumed that the flange thickness is significantshy
ly less than half of the remaining clear web tlaquo s the
above expressions can be readily simplified Since (u+~) is
43
of the same order of magnitude as t it is also assumed that
(u+~) laquo By eliminating small terms and substituting for
kl+k -l-x = ~ equation (35) can be simplified to2 f
(36)
This simple quadratic can readily be evaluated for~ In
general both solutions will be real although for a wide
range of beam and opening sizes investigated the solution
corresponding to a minus in the quadratic formula was found
to fall within the region of low shear on the interaction
curve (as defined in the previous chapter) while the solution
corresponding to a plus consistently fell in the medium to
high shear region thus satisfying the initial assumptions
This latter solution was therefore considered to be the
correct one and the corresponding value for ~is given by A 2as [ 2 ] 12_2s2( r) + w2(s2~) _ 4A2
IS = If f)Af 3 r ( 37 ) - (s2 + 4a2 )
T
which may be rewritten as
_2~(Ar + l(Aw) ( 2h)2 1 ( r 2 ~ C = 1+01 If) 2 If l-er ~ - 16 X)(l+o)~ (38)
where Aw = wd and 0lt = i(~)2(k - 1)2
Equation (34) can also be simplified by eliminating small
44
terms and by considering that for the transition from low to
high shear to occur kl must equal unity Equation (34) then
becomes
M (39 )M= p AW
1 + 4A f
Similarly equation (33) can be simplified to
(40)
For zero or very small values of ~ the above equation can
yield values of VV greater than the maximum VVp value as p
given by equation (6) This implies that some portion of the
shear is carried by the flanges of the beam Since the flanges
can in fact carry some shear and since the theory as given
in Chapter III is sufficiently conservative for large shear
values (as can be seen from the experimental results given
in Chapter VI) equation (40) is not considered to predict
excessive values of shear capacity and is adapted for use in
this method of analysis The shear capacity is then given
by equation (40) and the corresponding maximum M~Ap value at
this shear value is given by equation (39) where ~ is given
by equation (38)
The maximum shear capacity of the section is given by
45
equation (40) when ~ is equal to zero Solution of equation
(38) for Ar when ~ equals zero gives the required reinforcing
area necessary to reach the maximum shear capacity of a secshy
tion This is given by
- AW(l 2h) flA (41)r - T -a-~
Equation (41) reduoes to equation (32) in Chapter III when
substitution is made for ~ When the reinforcing area
conforms to the above requirement the maximum shear capacshy
ityas given by
V 2hr = (I-a-) (42) p
will be reached and the corresponding maximum moment capacshy
ity at this value of shear is given by
Ar 1 - A
M fr= A p 1 + w
4Af Thus for a given beam opening and reinforcing size if
equation (41) is satisfied equations (42) and (43) together
fix one point on the approximate interaction curve while if
equation (41) is not satisfied this point is fixed by equashy
tions (38) (39) and (40) In either case a line is dropped
from this point perpendicular to the vvp axis thus forming
46
part of the approximate interaction curve The remainder of
the curve is obtained by connecting the point given by equashy
tion (42) and (43) or by equations (38) (39) and (40) with
a point on the M~Ip axis corresponding to the maximum moment
capacity of the section This maximum value of blfvl isp simply the plastic moment of the reinforced perforated secshy
tion divided by the plastic moment of the unperforated secshy
tion and is identical to the same point obtained in the
previous chapter with no shear force acting The maximum
value of Mi1p is given by
Z - wh2 + Arlt 2h+2u+q) = ---------w----------shyZ
or using a consistent approximation for Z this can be
rewri tten as
M A (45 ) M=
p 1 + w4Af
An approximate interaotion curve is given in Figure 9 for
comparison with the interaction ourve obtained by the method
desoribed in Chapter Ill
43 Limitations of the AEproximate Method
The maximum praotical M~lp value for the approximate
47
interaction curve is limited to 10 for the same reasons that
the more exact curve is so limited and a horizontal line
drawn from the MA~p axis at 10 and intersecting the approxshy
imate curve forms its upper portion The maximum value of
VVp for the approximate curve is limited to VVp max given
by equation (42) This limitation has been discussed in the
previous section
Equation (41) specifies the minimum size of reinforcing
necessary to reach the maximum shear capacity of the section
as given by equation (42) yVhen the reinforcing area conforms
to this minimum requirement equation (43) is used to predict
the moment capacity of the section corresponding to the shear
value of equation (42) Examination of equation (43) reveals
that as the reinforcing area is increased past the minimum
given by equation (41) the moment capacity decreases rather
than increases as would be expected from physical considershy
ations or from examination of interaction curves obtained
by the methods of Chapter Ill For sizes of reinforcing
only slightly greater than that given by equation (41)
equation (43) will be sufficiently accurate and will not
significantly underestimate the moment capacity of the secshy
tion although it may be deSirable to replace Ar in equation
(43) with the minimum Ar given by equation (41) Equation
(43) then becomes
48
A 2h l1 - ~(l-a)J~
M ( 46)~= A 1 + W
4Af This may be written more simply as
aw 1 - 73Af
= ---1-shyA 1 + w
4Af The corresponding shear value is given by equation (42)
However as Ar increases more and more above the value
given by equation (41) the moment capacity of the section
will be increasingly underestimated and if more accurate
values are desired recourse must be made to more accurate
methods Examination of equation (38) reveals that as Ar
increases past the value given by equation (41) 0 becomes
negative up to the point where
when the solution for cgt becomes imaginary For values of
Ar lying between those given by equations (41) and (48) ~
is negative and equations (39) and (42) can be used to
accurately predict the point on the approximate interaction
curve from which a perpendicular line should be dropped to
the VVp axis and a line drawn to the point given by equation
(44) on the MM axisp
49
Al though for this case a value exists for (gt equation
(42) rather than (40) is used to determine the shear capacshy
ity of the section This is the only logical approach beshy
cause Ar is greater than that required to reach the maximum
shear capacity and increasing the reinforcing area although
it cannot increase the shear capacity of the section past
that given by equation (42) also should not serve to decrease
this capacity
When Ar is greater than the value given by equation (48)
equation (39) cannot be used to obtain a more accurate preshy
diction of moment capacity because 0 as given by equation (38)
will not be real Consideration of the equations used in
deriving the approximate method leads to the conclusion that
will be imaginary only when the maximum shear capacity of
the section is reached while klslaquou+q) Equation (48) shows
the relation between reinforcing area and size of opening for
this to occur It can be seen that small opening size or
large reinforcing size will eause the maximum shear capacity
to be reached while kls (u+q) When this occurs equation
(42) predicts the shear capacity of the section since Ar is
greater than that required by equation (41) to reach this
maximum shear value At this value of shear ~ equals zero
and equations (17) (20) and (21) in Chapter III reduce to
(49a)
(50)
50
A q (5la )
M = _l_l_qdA_rf=--[2_U_2_+__(2_U_+_q_)_+_2_h_(_2U_+_q_)_-_2_(_k_l_S_)2_-_4_k_l_S_h_J_-_~_~_(_~~)
Mp Aw 1 + 1iA
f
By considering t laquo d equations (49a) and (5la) can be further
simplified to
(49)
(51)
Equations (49) (50) and (51) can then be used with equation (42)
to determine the pOint of intersection of the two lines composing
the approximate interaction curve
44 Summary and Discussion
Determination of the approximate interaction curve can be
summarized as follows
Case I
The maximum shear capacity of the section will be reached
if
A 2 AW(l_ 2h) fT (41)r 4 d 4a where a = ~(h)2(~ _ 1)2 The maximum shear capacity is then4 a 2h bull
given by
V (1 _ ~h) (42)Vp =
51
and the moment which can be attained with this shear acting
is Ar
1- ri- = Af (43)
p 1 + w 41f
where Ar is that given by the right hand side of equation (41)
Case 11
If equation (41) is not satisfied the maximum shear
capacity will not be reached and the shear capacity is given
by
(40)
The moment capacity which can be attained with this shear
acting is
1 1 + w
4Af where ~ is given by
A A _ ~( r) + l( w) ( 2h)2 1 ( r)2 0 ( )~ - 1+ltgtlt Af 2 If l-T 1+CgtI - 16 -x (l+olt)l 38
Case Ill
If Ar is significantly greater than that given by equashy
tion (41) the maximum shear capacity will still be given by
52
but if desired a more accurate estimate of the moment which
can be attained with this shear acting can be obtained as
follows
Case IlIA
For (48)
MMp at maximum VVp is given by
Ar 1 - I - ~
~ = __f_~_ ill A
P 1+ w4If
where r will be negative and is given by
(38)
Case IIIB
For A2 gt (aw) 2
+ (~)2w2 (48)r 3 ~
at maximum VV is given byp A A
1+-f(2h)__1_ JL (ha) (2dh ) (1+ 2dh )Af d 2[j Af (51)
A1 + w
4Af
53
where kl and k2 are given by
+l (50)s
(49)
and only that solution satisfying the conditions 0 ~ k2 ~ 10
and u ~ kls ~ (u+q) is correct
The appropriate one of these three cases can be used to
determine a point on the approximate interaction curve A
perpendicular line is then dropped from this point to the
vVp axis and forms part of the curve The remainder of the
curve is obtained by drawing a straight line from the initial
point to a point on the MMp axis given by equation (44) or
(45) and by then cutting off the approximate interaction curve
at the maximum Mlyenip value of 10 as described in the first
paragraph of this section
Complete and approximate interaction curves for each
size of beam opening wld reinforcing included in the expershy
imental part of this investigation are shown in Figures 10
through 15 A cross-section of the member is shovm on each
curve for reference and the method used in obtaining each of
the approximate curves is stated On Figures 11 14 and 15
the reinforcing size was greater than that given by equation
(41) and both Case I and Case III were used to obtain approxshy
54
imate curves for comparison It can be seen that only when
the reinforcing area was significantly greater than that
given by equation (41) (Figure 11) was there a large difshy
ference in the Case I and Case III values
For the partioular case of unreinforced openings by
substituting for Ar equal to zero in equations (39) and (40)
these reduoe to
M AW 2h 1
1 - 2If(l-or~ r= A (52)
p 1 + w4If
v (2h)JTr = I-d~ p
where ~= i(~)2(~ - 1)2 as before These equations are
identioal to those given by R_GRedwood(17) for unreinforced
openings Again a perpendioular is dropped from the point
defined by these two equations to the vVp axis and another
line is dravln from this point to a point on the MMp axis
given by
111 Z - wh2 (54)r = z
p
thus oompleting the approximate interaction curve for the
case of an unreinforoed opening Using the same approxishy
mations as used previously equation (54) oan be written
55
MM = 1 (55) p
which agrees with Redwoods work and gives a slightly highshy
er value for the maximum MM value A complete and approxshyp imate interaction curve for a section containing an unreinshy
forced opening is given in Figure 12 where the equations
given by Redwood(17) were used for the complete curve
56
CHAPTER V
EXPERIMENTAL INVESTIGATION
51 Selection of Test Beams
As discussed in Chapter I it was decided to limit this
investigation to rectangular openings reinforced with straight
horizontal strips welded above and below the opening It
was also decided to use a standard wide-flange beam rather
than a welded section because of the usual use of these in
building structures where openings are most oommonly requirshy
ed ASTM A 36 structural steel was used throughout all
of the experimental work because this material was used in
most of the previous investigations related to this work
The size of the test beams was chosen on the basis of
economy ease of handling and ease with which reinforcing
bars could be welded in place It was decided to use a secshy
tion that was compact at the specified yield stress and
also at the higher yield stresses expected in the test
beams In the selection of test beams only sections with
low depth to thickness ratios were conSidered in order to
avoid the problem of web instability The flange width to
thickness ratio was also kept as low as possible in order to
avoid premature compression flange buckling On the basis
of these considerations and after a preliminary test pershy
57
formed on a 10VF21 section it was decided to carry out the
remainder of the experimental investigation using a 14WF38
section of A 36 steel The properties of the test beams
used are listed in Table 1 A nominal opening depth to beam
depth ratio of 05 was chosen because of the practical need
for openings of approximately this depth in larger beams and
also because investigations of unreinforced openings were in
this range One test beam included in this work had a nominal
opening depth to beam depth ratio of 0643 A basic opening
length to depth ratiO or aspect ratiO of 15 was chosen
again from practical considerations Two beams were includshy
ed with aspect ratios of 20
The corner radii of the opening had to be large enough
to avoid excessive stress concentrations that might cause
premature cracking of the corners and yet small enough to
not appreciably decrease the effective area of the opening
In previous investigations corner radii ranged from 14 to
one inch A 58 inch radius was used in this study for the
14WF38 beams and a 316 inch radius for the 10WF21 beam
The area of reinforcing for each opening was chosen so
that the moment capacity of the unperforated member would be
equalled or exceeded and the full shear capacity of the net
section could be utilized The moment capacity condition
requires that
58
wh2 gt- (56)2h + 2u + q
This follows from equation (44) The reinforcing area reshy
quired to meet the shear condition is given by equation (32)
in Ohapter 111 It was found that for the 14WF38 beam used
in this investigation with 2hd equal to 05 ~~d ah equal
to 15 the area of reinforcing required to meet these condishy
tions was approximately ~vice that given by the right hand
side of equation (56) One beam was tested in the high shear
range with reinforcing such that the interaction curve fell
short of VVp msx Again it should be mentioned that the
length u is that required for welding the reinforcing in
place and should be as small as possible The width of the
reinforcing bars q was chosen so that the width to thickshy
ness ratio did not exceed 85 as specified by the design
code(910) for ultimate strength design The anchorage
length of the reinforcing bars was also designed by use of
the AISC and OISO design codes on the basis of develshy
oping the full strength of the reinforcing bars at the edges
of the opening The ultimate strength loads were taken as
167 times those for elastic design as recommended by the
codes
The openings in all of the test beams were flame cut
the 10WF2l beam number lA having the corners drilled before
59
cutting and then having the rough edges ground to the proper
size Beams numbered 2A 2B and 3A were entirely poundlame cut
including corners and were not poundinished poundurther The remainshy
ing beams had drilled corners with the rest of the opening
being poundlame cut They were not finished poundUrther
All test beams were simply supported and were loaded with
a single concentrated load The openings were positioned so
as to achieve the desired moment to shear ratios and all
openings were centered at the middepth opound the beam All beams
were locally reinpoundorced with cover plates so as to ensure
poundailure at the openings and web stipoundfeners were added under
the load and at reaction points Local reinpoundorcing was deshy
signed on the basis opound resisting the loads predicted by the
interaction curves plus the expected increase in loads above
this due to strain hardening Beam Sizes opening locations
and local reinpoundorcing are shown in Figures 16 17 and 18 poundor
each opound the test beams
52 Experimental SetuE
All beams were tested in a Baldwin-Tate-Emery 400k
Universal Testing Machine which is a mechanically operated
hydraulic testing machine opound 400k capacity The ends opound the
beam were supported by a specially reinpoundorced 14 inch wideshy
poundlange section that also poundormed part of the lateral bracing
60
system This is shown in Figures 19a and 20a Lateral bracshy
ing consisted of support against horizontal displacement and
rotation at pOints of load and at end reactions Bracing
for the beams numbered lA 2A and 3A was achieved by the
attachment of horizontal 8 inch wide-flange beams to the
vertical portion of the end supports with the 8 inch secshy
tions running the entire length of the test beams on each
side and positioned so that pins could be inserted at bracshy
ing points between the 8 inch sections and the top flange of
the test beam to allow for only vertical displacements of the
test beam The pins were given a heavy coating of grease to
minimize friction This type of bracing proved satisfactory
but made it very difficult to see parts of the test beam durshy
ing the test To alleviate this visual problem beam 2B was
tested with the lateral bracing described above on only one
side of the beam while for the other side vertical bars
attached rigidly to the 8 inch sections and bent to pass
over the test beam were held tightly against the upper flange
of the test beam at bracing points This arrangement proved
unsatisfactory and was not used for subsequent tests
For testing the remaining beams short 8 inch wide-flange
sections were attached vertically to the vertical portion of
the end supports and greased pins were used to provide latershy
al bracing at these locations (Figures 19b and 20b) Lateral
61
bracing at the point of load was provided by roller bearings
- two on each side of the test beam spaced 6 inches apart
vertically and bearing against the web stiffener of the beam
The roller bearings were attached to triangular sections
which in turn were attached to a wide-flange section held
rigidly to the laboratory floor See Figures 19c 20c
and 20d This type of lateral bracing provided nearly
frictionless vertical displacement of the beam while preshy
venting rotation and horizontal displacements and proved
to be very effective Access to the beam during testing
was not at all limited by this bracing system
Deflection dial gauges with a least reading of 0001
inch were used to determine deflections at points of load
end supports edges of openings 2 inches outside each openshy
ing edge and at centerline of beam when possible All dial
gauges were rigidly fixed to non-yielding supports Their
positions are indicated in Figures 16 17 and 18 Four of
the test beams were equipped with electrical resistance strain
gauges in the vicinity of the opening The locations of
these gauges are shown in Figure 21 Each test beam was
painted with an opaque brittle coating of whitewash - a
mixture of lime and water of the consistency of light cream
applied in the vicinity of the opening at least one day before
testing During testing this coating of whitewash flaked
62
off in minute pieces in areas undergoing plastic strains thus
indicating visually which sections of the beam had yielded
The flaking occurred at loads higher than those correspondshy
ing to yielding of each section and did not give an accurate
measure of the onset of yielding but instead gave an estishy
mate of the order in which each of the sections yielded
53 Testing Procedure
Essentially the same procedure was followed in testing
each of the beams The beam was first placed in position on
its end supports a fixed roller under one end and a free
roller under the other The bema was made level and centershy
ed with respect to its loading point and end supports
Lateral bracing was then fixed in place and the head of the
machine brought into contact with the specially hardened
roller through vhich the load was applied to the beam Dial
gauges were then put in position and strain gauge leads
connected to the Budd Automatic Strain Indicator A small
initial load was then applied to the beam and zero readings
were taken for all strain and dial gauges
At least four load increments of either lOk or 20k were
applied within the elastic range with all gauge readings beshy
ing recorded for each load increment When the first inshy
elastic response of the beam was noted either from strain
63
gauge readings on the beams that were so equipped or by
deflection vdth time of any of the dial gauges the load
increment was reduced to 5k and after each load increment was
applied all plastic flow was allowed to take place before
readings were taken To determine whether plastic flow had
ceased at each load increment dial gauge readings were plotshy
ted against time When the S-shaped curve reached its upper
portion and levelled out plastic flow had ceased and readshy
ings were taken During this time required for plastic flow
as much as 30 minutes for higher loads it was important to
hold the load on the beam constant Loading continued in
this manner until the ultinlate collapse of the test beam
either by web buckling at the opening or by tearing of one
or more of the openings corners When this occurred the
beam was no longer able to maintain the applied load The
load was then removed and the beam was taken out of the test
frame
54 Determination of Yield Stresses
In order to accurately access the expected strength of
each of the test beams it was necessary to determine their
actual yield stresses This was accomplished by the testing
of tensile coupons cut from the flange ana web of the beams
and from the reinforcing strip used at the openings The
64
dimensions of a typical tensile coupon are given in Figure 22a
and the locations from which such coupons were taken are shown
in Figure 22b The beams from which coupons were to be taken
were ordered an extra 12 inches long so that this section could
be cut off and tensile coupons made and tested before the testshy
ing of the actual beam Reinforcing strip was ordered an extra
36 inches long for the same purpose Test beams 2A 2B and
3A were all cut from the same beam and were all reinforced
from the same reinforcing strip Test beams 2C 2D 3B 4A
4B 5A and 6A were all cut from the same beam Reinforcing
for beams 2C 2D 4A and 4B was all cut from the same strip
Each of the tensile coupons was tested in either a 20k Riehle
or a 20k Instron Testing Machine Coupons tested in the
Riehle machine were tested under nearly constant load rate
An extensometer was attached to the coupons to automatically
record the stress-strain curves Since the crosshead
position could not be fixed on this particular machine
a static yield stress could not be obtained and therepoundore
only the lower yield stress is given in Table 2 Tensile
coupons tested in the Instron machine were loaded at a
constant cross head speed of 002 inches per minute When
the plastiC plateau was reached the crosshead position was
fixed and the load was allowed to drop off After about five
minutes the static yield stress had been reached and no
65
further change in load could be seen on the automatically
recorded stress-strain curve Straining was then allowed to
continue into the strain hardening range A typical stressshy
strain curve for a coupon tested in this machine is given in
Figure 23 Lower yield and static yield stresses are given
for coupons tested in the Instron machine in Table 2
Either the static yield or the lower yield stresses can
be used in determinimg the expected strength of a test beam
depending on which more closely approaches the actual test
conditions of the beam In this investigation the beams
were tested under loading increments with the loads being
held constant until plastic flow had ceased Since it was
thought that the method of obtaining the lower yield stresses
more closely paralleled the actual testing procedure these
stresses were used in evaluating the expected strength of
the test beams
66
CHAPTER VI
EXPERIMENTAL RESULTS
61 Behavior of Beams during Testing
Since the behavior of all the beams during testing was
quite similar a complete description of only one such typshy
ical beam number 20 is given here Deviations from this
typical behavior are discussed at the end of this section
Beam 20 was first tested elastically to a load of 80k
in lOk increments and was then unloaded Strain gauge and
dial gauge readings were taken at each load increment and
were analyzed After it was determined from these readings
that strain gauges and automatic recording equipment were
in good working order the beam was reloaded this time to
be tested to destruction This check was run for only this
one test beam all others being tested continuously through
elastic and plastic ranges
An initial load of 5k was again applied to the beam and
strain and dial gauge readings taken The load was then inshy
creased to 80k in 40k increments (lOk or 20k increments were
used in all other tests because separate elastic tests were
not performed on these) and then to 120k in lOk increments
With the load held stationary a slight increase of deflecshy
tion with time was noted on the dial gauges at this load so
67
increments were decreased to 5k bull
At l30k slight lateral deflection of the beam at the
opening was noted although this deflection never became exshy
cessive throughout the remainder of the test Strain gauge
readings first indicated yielding at both the bottom edge of
the upper reinforcing bar at the low moment edge of the openshy
ing (Figure 21 gauge 25) and at the top edge of the top
flange at the high moment edge of the opening (gauge 17) at
a l35k load When the load was increased to 140k yielding
occurred at the other top edge of the top flange at the high
moment edge of the opening (gauge 19) At a load of 145k
yielding had occurred at the center of the top flange at the
high moment edge of the opening (gauge 18) and also in the
web at the centerline of the opening (rosette gauge 10 11
12) At 155k the web at the high moment edge of the openshy
ing had yielded (rosette gauge 13 14 15) as had the web at
the low moment edge of the upper reinforcing bar (rosette
gauge 4 5 6) Slight displacement between the ends of the
opening could be seen at a load of l60k and at l65k the
lower edge of the upper reinforcing bar at the high moment
edge of the opening (gauge 20) had yielded
At l70k the upper edge of the upper reinforcing bar at
the high moment edge of the opening had yielded (gauge 21)
thus making the yielding at the high moment edge of the openshy
68
ing complete (based on average strain values for the flange
and reinforcing) While at this load the first flaking of
the whitewash was noted at both the upper low moment and
the lower high moment corners of the opening The web at the
middepth of the beam between the low moment ends of the reinshy
forcing yielded at 175k (rosette gauge 1 2 3) and whiteshy
wash flaking was detected on the underside of the top flange
at the high moment edge of the opening At lSOk the web at
the low moment edge of the opening (rosette gauge 7 S 9)
yielded and whitewash flaking occurred along the web immedishy
ately beneath the upper reinforcing bar from the low moment
corner of the opening to beyond the low moment end of the
reinforcing bar and also in the web above and below the
opening At 185k whitewash flaking occurred at the lower
low moment corner of the opening and in the web immediately
above the lower reinforcing bar from the corner of the openshy
ing to the low moment end of the reinforcing bar Yielding
occurred at the center of the top flange at the low moment
edge of the opening (gauge 23) at 190k and also at the top
edge of the upper reinforcing bar at the low moment edge of
the opening (gauge 26) This made yielding at the low moment
edge of the opening complete (based on average strain values
for the flange and reinforcing) At this same load whiteshy
wash flaking occurred in the web above and below the low
69
moment end of the upper reinforcing bar
The first strain hardening was also indicated from
strain gauge readings at the load of 190k and occurred in
the web at the centerline of the opening (rosette gauge 10
11 12) At 195k whitewash flaking occurred in the web
between the low moment ends of the upper and lower reinforcshy
ing bars Yielding occurred at the lower edge of the top
flange at the high moment edge of the opening (gauge 16) at
200k and strain hardening occurred at the upper edge of the
top flange at the high moment edge of the opening (gauge 17)
and at the lower edge of the upper reinforcing bar at the
high moment edge of the opening (gauge 20)
At 211k a crack developed in the lower low moment corshy
ner of the opening and it was no longer possible to maintain
the applied load The beam was then unloaded and removed
from the test frame The crack which occurred at the corner
radius was one half inch long and was inclined toward the low
moment end of the lower reinforcing bar A photograph of this
beam after completion of the test can be seen in Figure 24
Of the remaining beams in the test series only 2D 3B
and 4B were implemented with strain gauges the others having
only the brittle coating of whitewash to indicate the order
of onset of yielding The first of these beams to be tested
lA was given too thick a coating of whitewash and the flaking
70
of this whitewash during testing was not as satisfactory as
on other tests Similar problems were encountered with 2A
which had to be given a second coating of whitewash because
most of the first coat was rubbed off due to improper handshy
ling of the beam before testing The flaking off of the whiteshy
wash on beam 2B during testing was also not as good as was
expected although the whitewash had not been applied too
thickly This beam was tested on an extremely humid day
and it is thought that the problem with the whitewash flaking
was due to this excessive humidity
The order of onset of yielding as indicated by strain
gauge readings is given for each of the strain gauged beams
(20 2D 3B 4B) in Table 3a while the order of onset of
strain hardening is given for these beams in Table 3b Loads
corresponding to complete yielding of the cross-sections are
also given The order of whitewash flaking for each of the
beams is given in Table 4 Ultimate loads are also given
along with the mode of collapse of the beam
Of the eleven beams tested all but one were tested to
collapse The test of beam lA was terminated when deflecshy
tions became excessive although no web buckling or tearing
of corners had occurred and the beam was still able to mainshy
tain the applied load Only one of the beams tested to
collapse ultimately failed by web buckling This was the
beam with the unreinforced opening 6A All of the other
71
beams suffered ultimate collapse by the tearing of one or two
of the corners of the opening Beams 2A 2B 2C 3A 4A 4B
and 5A developed cracks at the lower low moment corners of the
openings Beam 3B cracked at the upper high moment corner of
the opening and beam 2D developed cracks at both the lower low
moment and the upper high moment corners of the opening simulshy
taneously Photographs of each of the test beams after collapse
are shovm in Figure 24 Comparison photographs of the beams for
variable moment to shear ratio reinforcing size aspect ratio
and opening depth to beam depth are given in Figures 25 and 26
62 Stress Distributions and Failure Loads
Based on measured strains stresses were calculated for
beams 2C 2D 3B and 4B Elastic stresses were determined
from the usual elastic theory while plastiC stresses were
determined from plasticity theory presented by Hill(8) and
reduced to the form given by Bower(l6) Initiation of strain
hardening was also determined from this method which is
summarized in Appendix B
Stress distributions at the high and low moment edges
of the opening of beam 2C are shown in Figure 27 while those
at the centerline of the opening and across the flange at the
high moment edge of the opening are given in Figure 28 The
variations in bending stress across the length of the opening
72
at the center of the top flange and at the top of the upper
reinforcing bar are shown in Figure 29 Figure 30 shows the
stress distribution at the high and low moment edges of the
opening for beam 3B and the stress distributions at the high
moment edge of the opening of beams 2D a~d 4B are given in
Figure 31
Experimental failure loads for each of the test beams
were determined from the load-deflection curves for each
test as described in Chapter 11 These curves and their
corresponding failure loads are given in Figures 32 through
42 Interaction curves based on the analysis presented in
Chapter III were dravn for each of the test beams using the
actual measured dimensions and yield stresses for each beam
The experimentally deterrQined failure loads were plotted on
these curves which are given in Figures 43 through 50
Approximate interaction curves for nominal dimensions and
yield stresses are also included in these figures
63 Other Factors
Of the eleven beams tested only one underwent signifshy
icant lateral buckling during testing Beam 2B buckled
laterally at the high moment edge of the opening due to the
inadequate lateral support provided as described in Chapter
V However final collapse of this beam was due to the tearshy
73
ing of one of the corners of the opening and not to the
lateral buckling Also the lateral buckling was not
significant until after the very high loads associated with
strain hardening were reached The modified lateral support
system shown in Figures 19b and c and 20bc and d and discussshy
ed in the previous chapter effectively prevented lateral
buckling of the remaining test beams and no further diffishy
oulties were encountered due to this factor
For each of the test beams lateral deflections were
largest at the high moment edge of the opening although they
never became significant except in the case of beam 2B A
curve showing lateral deflection at the high moment edge of
the opening versus shear force at the opening is given for a
typical test beam 20 in Figure 51 The shear corresponding
to the experimental failure load is indicated on the curve
and the laterally unsupported length of the beam is given
The laterally unsupported length of the test beams did not in
any case exceed the lengths specified by the design codes(9 10)
Local buckling of the top flange occurred at the high
moment edge of the opening for several of the beams tested
although this buckling always occurred at very high loads
after considerable strain hardening had taken place Figure
52 shows the difference in strain readings between the upper
and lower edges of the flange at the high moment edge of the
74
opening versus the shear force at the opening for a typical
test beam 20 The distribution of stresses across the width
of the flange at the high moment edge of the opening (Figure
28b) show a relatively uniform distribution up to yielding
at this location However the effects of local flangebull
buckling can be seen by the considerably higher compression
stresses at the edges of the flange at very high values of
shear
The nine beams containing reinforced openings which were
tested to destruction all exhibited an effect which was preshy
viously unexpected The strain gauge readings for rosette
gauges 1 2 3 and 4 5 6 on beam 20 (Figure 21) as well as
the whitewash flruring on all nine of these beams indicated
widespread yielding of the web between the low moment ends of
the reinforcing bars This effect occurred at loads near the
experimental failure loads of the beams but did not interact
with the development of hinges at the corners of the openings
because of the extension of the reinforcing bars well past
the edges of the openings In addition to the shear yielding
in the web between the low moment ends of the reinforcing
bars the whitewash flaking on beams 2D and 4A also indicated
the same type of yielding occurring at slightly higher loads
in the web between the high moment ends of the reinforcing
bars The whitewash flaking in these areas was sufficient
so that it can be seen in some of the photos in Figure 24
75
The shear yielding that occurs in the web between the
ends of the reinforcing bars may be due at least in part to
the development of the strength of the reinforcing bar withshy
in a short part of its anchorage length Considering the
reinforcing bar in compression above the opening it can be
seen that since its strength must increase from zero at the
ends the unbalanced compression force in the beam causes a
shearing force to occur in the web which at the low moment
end of the reinforcing is additive to the existing shears
(due to the vertical shear force on the beam) below the reinshy
forcing and subtracted from those above This is illustrated
in Figure 53 In the same manner the shears resulting from
the tension in the lower reinforcing bar act in the same
direction as and are added to those in the web between the
reinforcing bars while being subtracted from those in the web
between reinforcing and flange At the high moment ends of
the reinforcing bars the same effect can occur since the top
reinforcing bar is usually in tension while the lower bar is
in compression Again the shears between the reinforcing bars
are increased while those between reinforcing bar and flange
are decreased This would account for the yielding in the web
between the low moment ends of the reinforcing bars for all
of the reinforced beams tested to collapse as well as explaining
76
the yielding in the web between the high moment ends of the
reinforcing bars for beams 2D and 4A
77
CHAPTER VII
ANALYSIS OF RESULTS
71 Order of Onset of Yielding
Comparison of the order of onset of yielding as detershy
mined by strain gauge readings and whitewash flaking in
Tables 3 and 4 indicates that the whitewash flaking is a
reliable method of estimating the order of onset of yieldshy
ing Actually since the strain gauges were only at scattershy
ed locations while the whitewash covered the entire area
around the opening the whitewash flaking is a considerably
more complete guide to the order of onset of yielding It
can also be said that yielding begins first at the corners of
the opening as indicated by the whitewash consistently
flaking first at these locations even though it was impossishy
ble to confirm this by strain gauge readings since gauges
could not be fitted in these locations
The yielding patterns clearly indicate that failure of
the beams occurred by complete yielding of the cross-sections
at the edges of the openings ie at the assumed hinge
locations The formation of hinges at these locations was
accompanied or followed by the shear yielding of all or part
of the web along the length of the opening and by the shear
yielding of the web between the low moment ends of the reinshy
78
forcing bars and in two cases also between the high moment
ends of the reinforcing bars The increase in load past the
formation of the first hinge is accompanied by localized
strain hardening Since the corners of the opening yield
considerably before other locations strain hardening probshy
ably begins at these corners well before the first hinge is
completely formed Yielding in the web above and below the
opening does not seem to become complete until considerable
rotation has occurred at the hinge locations The complete
yielding of the web in these areas would indicate that the
full shear capacity of the member is utilized
72 Stress Distributions
Experimental bending and shear stresses are shown for
each of the strain gauged beams (20 2D 3B 4B) in Figures
27 through 31 Straight lines have been drawn through pOints
representing measured stresses although this does not mean
that the variation is necessarily linear Examination of
each of these stress distributions shows that stresses inshy
creased in proportion to increasing loads while the stresses
were still elastic While in the elastic range the neutral
axis remained in approximately the same pOSition but startshy
ed to move after the first yielding had occurred at each
cross-section This is as would be expected
79
Since strain gauge readings were not available for the
edges of the opening it is impossible to follow the complete
progression of yielding for the various cross-sections from
strain gauge readings However since it is lcnown from the
whitewash flaking on the test beams that yielding occurs
first at the corners of the opening where stress concentrashy
tions are high it can be said that at the low moment edges
of the openings (beams 2C and 3B) yielding began first at the
corners of the opening and then progressed to the reinforcshy
ing bars and web before the flange yielded At the high
moment edges of the openings yielding in the flange occurrshy
ed at lower shear values This would be expected from conshy
siderations of the total stresses (primary bending stresses
plus secondary bending stresses due to Vierendeel action) at
the cross-section in question At the flange the secondary
bending stresses are added to the primary bending stresses
at the high moment edge of the opening but subtract from the
primary bending stresses at the low moment edge of the openshy
ing The experimentally determined stress distributions at
the high and low moment edges of the openings are completely
compatible with those assumed in the development of the
theory in Chapter III (Figure 8) Bending stress distribushy
tions along the length of the opening at the top of the upper
reinforcing bar and at the centerline of the top flange show
80
the expected high stresses at the edges of the opening due
to the secondary bending stresses (Figure 29)
Comparison of stress distributions with those presented
by Bower(16) for beams with unreinforced rectangular openings
shows that the addition of horizontal reinforcing bars above
and below the opening changes the position of the neutral
aXiS but does not alter the location where the highest
stresses occur and plastic hinges consequently form The
order of the onset of yielding is also similar to that
found by Bower as was expected
73 Failure Loads
In Table 5 experimentally determined failure loads are
compared to those predicted by the theory presented in
Chapter III for each of the test be~~s Examination of this
table shows that although the theory may be considered someshy
what conservative in high shear for low shear the correlashy
tion between theory and experimental is good and in no case
did the theory overestimate the actual strength of the beam
Table 6 shows the comparison between experimental failure
loads and those predicted by the approximate analysis for
nominal beam dimensions and yield stresses It can be seen
from this table that the approximate method is less conservshy
ative in the high shear region while still not overestimating
81
the strength of the beam An added margin of safety also
exists because the additional strength of the beam due to
strain hardening has not been taken into account This extra
strength is an added safeguard against total collapse even
though it is accompanied by excessive deformations and finalshy
ly involves tearing or pOSSibly buckling
Experimentally determined failure loads are compared
with loads corresponding to complete yielding of cross-secshy
tions for the strain gauged beams (20 2D 3B 4B) in Table
7 It can be seen from this comparison that experimentally
determined failure loads are close to those corresponding to
the complete yielding of the cross-section at the high moment
edge of the opening while loads corresponding to the complete
yielding of the cross-section at the low moment edge of the
opening are considerably higher This can be accounted for
by the considerable amount of strain hardening that is
suspected of occurring at the corners of the opening before
complete yielding of the low moment edge and possibly also
the high moment edge of the opening occurs Complete yieldshy
ing of cross-sections at the high and low moment edges of
the openings are also compared with the theoretical loads
predicted by the analysis of Chapter III in Table 8 Again
the correlation is reasonably good
The performance of each of the test beams was as expectshy
82
ed With the exception of the shear yielding which occurred in
the web at the ends of the reinforcing bars as discussed in
Section 63 The method used in determining experimental
failure loads has been shown to be justifiable on the basis
of the good correlation between these loads and those correshy
sponding to complete yielding of cross-sections at high and
low moment edges of the opening (considering that strain
hardening has not been taken into account) On the basis of
comparison with experimental failure loads the theory develshy
oped in Chapter III has been shown to adequately predict the
performance of a given beam under varying moment to shear
ratios (although conservatively at high shear) The approxshy
imate method as developed in Chapter IV has been shown to
predict beam strength with accuracy adequate for design
purposes (assuming a suitable factor of safety is used)
14 Influence of Reinforcing and Other Variables
As can be seen from comparison of the experimental
results from test beams 2A 3A and 6A and those for beams 2B
and 3B there is a definite increase in beam strength with
the addition of horizontal reinforcing bars As predicted by
the theoretical analysis of Chapter Ill the maximum shear
capacity of a perforated section as given by equation (6)
can be reached by the addition of a certain minimum amount
83
of reinforcing as given by equation (32) If no reinforcing
or an amount less than that required by equation (32) is used
the maximum shear capacity cannot be reached This is conshy
firmed by the result of the tests on beams 2A 3A and 6A
For higher moment to shear ratios the increase in strength
with increased reinforcing size is adequately predicted by
the analysis in Chapter 111 (and also by the approximate
method of Chapter IV) This is confirmed by the tests on
beams 2B and 3B The increase in strength with the addition
of reinforcing bars and with the further increase in the
size of this reinforcing cen be seen by superimposing the
interaction curves of Figures 10 11 and 12 as has been done
in Figure 54
The influence of the magnitude of moment to shear ratio
on the strength of a beam of given size opening and reinforcshy
ing dimenSions is adequately predicted by interaction curves
generated by the method of Chapter 111 and by the approximate
interaction curves as in Chapter IV This is confirmed by
test series 2A 2B 20 2D series 3A 3B and by series 4A
4B See Figures 55 56 and 57
An increase in aspect ratio everything else being held
constant results in a decrease in strength of the beam This
is predicted by the interaction curves in Figures 10 and 13
which are superimposed in Figure 58 for easy reference and
84
is confirmed by the tests on beams in series 2A 4A and
series 2B 4B An increase in hole depth also has the effect
of lowering the strength of the member all other variables
being held constant This is predicted by the interaction
curves in Figures 10 and 14 which are superimposed in Figure
59 and is confirmed by the tests on beams 20 and 5A
The test results have also been plotted in Figures 54
through 59 but because of the variation in the sizes and
yield stresses of the actual test beams these results have
been plotted on the curves (which are based on nominal
dimensions and yields) on the basis of percent difference
be~veen the experimental failure loads of the test beams
and the values predicted by the exact interaction curves
(from measured beam dimensions and yield stresses)
85
CHAPTER VIII
CONCLUSIONS AND RECOMMENDATIONS
81 Conclusions
On the basis of the results and discussion presented in
the previous chapters the following conclusions can be
drawn
1 The flaking off of the brittle coating of whitewash on
the beams during testing is an accurate indication of
the order of onset of yielding although it does not inshy
dicate at what loads yielding actually occurs
2 High stress concentrations exist at the corners of
rectangular openings even when horizontal reinforcing
bars have been added above and below the opening
3 Failure of a beam under moment gradient containing a
single rectangular opening reinforced with horizontal
reinforcing bars above and below the opening occurs by
the formation of a four hinge mechanism the hinges
occurring at cross-sections at the edges of the opening
Ultimate collapse of such a beam occurs by the tearing
of one or more of the corners of the opening provided
the beam has sufficient lateral support to prevent
lateral buckling
4 With the development of the four hinge mechanism large
86
relative displacements take place between the ends of the
opening accompanied by full or partial shear yielding in
the web above and below the opening This yielding when
it occurs over the entire web area is an indication that
the full shear capacity of the section is utilized
5 Because of the shear yielding that occurs in the web beshy
tween the ends of the reinforcing bars the extension of
these reinforcing bars past the ends of the opening (while
designed on the oasis of developing the weld strength)
should not be less than a certain length (as yet undetershy
mined but probably about three inches for the size beam
and openings tested) due to the possible interaction of
the web yielding with the yielding at the corners of the
opening
6 The stress distributions assumed in the analysis in Chapshy
ter III are completely compatible with those found at the
high and low moment edges of the strain gauged test beams
The large influence of the secondary bending moments (due
to Vierendeel action) is confirmed by these stress
distributions
7 The interaction curve resulting from the analysis in
Chapter III predicts with reasonable accuracy the strength
of a beam with given opening and reinforcing size at any
combination of moment and shear This method is however
87
conservative at high shear values
8 The approximate method developed in Chapter IV also preshy
dicts with reasonable accuracy the strength of a beam
with given opening and reinforcing size for the full
range of moment and shear values and is less conservshy
ative at high values of shear
9 Due to the fact that the theory neglects the effects of
strain hardening there is a built in margin of safety
against complete collapse of the member although an
increase in load past the predicted failure load is
accompanied by excessive deformations
10 The correlation obtained between experimentally detershy
mined failure loads and loads corresponding to complete
yielding of cross-sections at the high moment edge of
the opening for the strain gauged beams suggests that
the method used in determining the experimental failure
loads is justifiable Comparison of experimental failure
loads with loads corresponding to complete yielding of
the cross-section at the low moment edge of the opening
would not be expected to be as good because of the strain
hardening that is assumed to occur at the corners of the
opening before this section is completely yielded
11 The addition of horizontal reinforcing bars above and
below a rectangular opening in a beam definitely increases
88
the strength of the beam If greater than a predictshy
able minimum area this reinforcing will make it possible
to achieve the full shear strength of the section as
given by equation (6) Any further increase in reinforcshy
ing size results in a further increase in the moment
capacity of the member for a given value of the shear
force
12 For a given size beam an increase in aspect ratio (openshy
ing length to depth) results in a decrease in the strength
of the beam over the full range of moment to shear ratios
if all other factors are held constant An increase in
the opening depth to beam depth ratio also has the same
effect all other variables being constant
13 The test performed on beam 6A containing the unreinshy
forced rectangular opening further confirmed the analysis
presented by Redwood(17 18) for beams containing single
unreinforced rectangular openings in their webs
82 Recommendations for Design
Based on the good agreement between experimental results
and failure loads predicted by the approximate interaction
curve it is recommended that the approximate method as
described in Chapter IV be used for design purposes assuming
that a suitable factor of safety is used The ease with
89
which the necessary calculations can be carried out makes
this method extremely practical The use of this method can
be outlined as follows When it is decided to cut an openshy
ing in the web of a beam for the passage of utilities the
necessary size of opening should first be determined and an
approximate interaction curve constructed for the beam conshy
taining an unreinforced opening by using e~uations (52) (53)
and (55) Mp and Vp should be calculated from equations (1)
and (3) respectively A line should then be drawn from the
origin at the particular moment to shear ratio which repshy
resents the actual position of the proposed opening in the
beam and extended to intersect the approximate interaction
curve The intersection of this line with the interaction
curve then represents the capacity of the beam if the openshy
ing is not to be reinforced If this capacity is less than
that required it is necessary to reinforce the opening
and reinforcing should be chosen on the basis of satisfying
the inequality of equation (41) The reinforcing should be
chosen so that the right hand side of equation (41) is not
greatly exceeded An approximate interaction curve for a
beam containing an opening with this size reinforcing can
then be constructed by using equations (42) (43) and (45)
where Ar is given by the right hand side of equation (41)
The intersection of the MV line with this approximate intershy
go
action curve then gives the capacity of the beam with this
size reinforcing If this exceeds the required capacity of
the section this size reinforcing should be adopted
However if the required capacity of the beam is greater
than that given by the approximate interaction curve two
possibilities may exist If the required shear is greater
than the maximum shear capacity of the section as given by
the vertical line on the approximate interaction curve or
by equation (42) then either shear reinforcing must be
added or the depth of the section increased in order to
provide the required strength If however the required
shear capacity is not greater than that given by equation
(42) but the point representing the required capacity of the
beam on the MV line lies outside the apprOximate intershy
action curve the area of reinforcing should be increased
above the value given by equation (48) and a new approximate
interaction curve constructed using equations (42) (45)
(49) (50) and (51) If the required capacity is still
greater than that given by this new approximate interaction
curve the reinforcing size would have to be further increased
until the reinforcing is such that the required strength is
provided The reinforcing size that meets this requirement
should then be adopted for use
91
83 Reoommendations for Future Work
With the completion of this study on the ultimate
strength of beams containing single rectangular openings
reinforced with straight reinforcing bars above and below
the openings it is logical that attention would turn to
similar studies for other commonly used opening shapes in
particular circular and extended circular openings with
horizontal reinforcing bars Also of interest would be an
ultimate strength investigation of reinforced closely spaced
multiple openings of rectangular or circular shape
Since the decision to cut and reinforce an opening in
the web of a beam is based primarily on economic considershy
ations an investigation into reducing the cost of reinshy
forced openings would be very much justified As the cost
of welding is paramount among the other factors involved in
reinforcing an opening reducing the e~mount of welding is
desirable If the horizontal reinforcing bars used in the
present study were doubled in size and welded to only one
side of the web above and below the opening the cost of
reinforcing would be almost halved while the same area of
reinforcing would be available for resisting the shear and
moment forces on the section However other factors such
as twisting moments would have to be taken into conSideration
due to the asymmetry of the section about its vertical axis
92
that would result from this type of reinforcing arrangement
An investigation of the ultimate strength of wide poundlange
sections containing large rectangular openings reinforced
with one-sided straight horizontal bar reinforcing has
already been initiated at McGill University
More information is also needed on the anchorage of the
reinforcing bars It would be desirable to determine at
what length such reinforcing is capable opound assuming its full
load An investigation of the required extension of reinshy
forcing bars past the ends of the opening to prevent preshy
mature poundailure due to interaction between hinge formation
and web yielding at reinforcing ends is also necessary
93
1)
) )J + 1 +1 I I
I
( a) (b)
I + --+--~+ -f--- -shy
I (c) (d)
II I I
I I j+shy
) 1)I l J I
(e) ( f)
Types of Reinforcing
Figure 1
94
primary bending stresses
secondary bending stresses
Stress Distribution at Opening
Figure 2
Ql ID Q)
Jt p ID
er
I I I I I I I
E I I I poundy Ipoundst strain
Idealized Stress-Strain Curve for structural Steel
Figure 3
---------- -----
95
MM unperforated beam no interaction
10~----~==~==~L---------------------~
~
unperforated beam including interaction
10 vVp
Interaction Curve - Unperforated Beam
Figure 4
-- -----------
96
deflection Pure Bending
(a)
~ o
r-I
deflection Bending with Shear
(b)
Load-Deflection Curves
Figure 5
97
1O~------------------------------------------~
l I
unperforated beamshy
shy
I r perforated beam
no interaction
----------- perforated beam l including interaction I I I I I I I I I
I I
Interaction Curve - Perforated Beam
Figure 6
i
98
1 CD (2) TIT
L
( a)
b
d2
(b)
Hinge Locations and Cross-section of Member
Figure 7
99
( a)
(S r CSyr+
tltS ltl direct shear direct shear
Stress Distribution at CD Stress Distribution at CD (for reversal in reinforcing)
Case I - Low Shear
+
CSyr ltS shy
direct shear
Stress Distribution at CD
Case 11 - High Shear
(b)
Stress Distributions and Resultant Forces
Figure 8
100
low highshear shear
I Ml4p k--~_____U_k-----LS_~_(_U_+-=q-)_____-L (u+q)kl s~s
I I r I I
I I I 1 I10
~-int eraction II curve 11
11
11 I I 11 I I
- I - I Iapproximate ~
interaction curve------ - 1
11~I11
i I I
I (d-2h-2t)I_~ I
d-2t 11
(1 -~) q
Interaction Curve Showing Low and High Shear Regions
Figure 9
101
14D38 7 x lof Opening
6 bull77611 x ~middotReinforcing 1 0513
03~
CH 125 1412700
0313 =--9F 0375 =Jb
approximate method ---l------ Case 11
04 vVp
Interaction Curve - 14WF38 Nominal
Figure 10
102
14WF38 7 x 10r Opening 6776 05132tbull
x e 3middot
Reinforcing
1412 11
10
approximate method Case I
04
Interaction Curve - 14WF38 Nominal
Figure 11
103
14WF38 7 x 10f Opening
0513No Reinforcing
MMp
10
-----approximate method for unreinforoed opening
04 VVp
Interaction Curve - 14WF38 Nominal
Figure 12
104
l4WF38 7 x l4~ Opening1pound x tReinforcing
Iapproximate method Case 11
I I I
04
Interaction Curve - l4WF38 Nominal
Figure 13
105
14WF38 9X 13- Opening lmiddotfx p Reinforcing
0513
1412
~-approximate method ~ Case IIIB
approximate method Case I
04
Interaction Curve - l4WF38 Nominal
Figure 14
106
10WF2l
5 x sf Opening 034(iIf x iWReinforcing t~l0240
CH h
55Q 125 990 025Q 0250~
approximate method ~ Case IlIA
approximate method I Case I
I I I
04
Interaction Curve - lOWF2l Nominal
Figure 15
107
43 11 39 18 0 (
I
I I i lA
26
I
111 99 I- middot1 t
22 2-S 45 J
) C
r I
2A
13 ) lA I ~
I)II45 35 ( ()
I
I
I If 2B
f 16~ 9 25 I2t~ 21-+1 1 1 i
30 11 24 27 0- 10- ro- )
I ~ I I
20
2119YlO 151( 21~fI211~ - rr I I
Test Beam Dimensions and
Dial Gauge Looations
Figure 16
108
tI
2D
22tl 231 45 tlI
( l (
I
3A
3119 Yt 11~ 34ft J3n~
45 25 J 35 ) (~ i-
I
I 1 3B
H 25 ft2ft5 cI 16 J2++ I I1 I
t 0- 23 45 J0- 0- (
I 4A
~5 ( 32 J211~ 2 YYt -IIII
Test Beam Dimensions and
Dial Gauge Locations
Figure 17
log
45 ~ 25 5S ) ~ (
4B
2 crYI 15 25 J-I2++ Irr
L J30 24 27 ~lt) (P-L
I 5A
2tYY 13 26211 1 I
22 6
6A
i
Test Beam Dimensions and
Dial Gauge Locations
Figure 18
--
110
If JL
a (1) p 02 ~
Cfl
tlOO ~ r-I 0 0 Q)
m ~ ~
Q SoOM
r-I Xl m ~ (1) p cD H
r-shy
~ ishy fO I- It
111
o N
-()
112
~ --- ~
~
~~ ~~
II I of
rf
A tshyshy I
1
ID I ~ I 0I middotrt
a1 +gt
- -l~ 0 ()
-t I H CJ
4gt 4gt bO ~
~ ~ Cl -rt
fiI
~ a1 ~
+gt CJI
~ amp ~ ~ ~ --- ~ I
II s I
~CJ~ 4t ~
I~ i ~
o
i-~ ~ - l
II I +1 I Ij
~I r
I tf~ft N
- shy
stress 8 1
lower Yield-lt ~i == 11 static yield-shyI l- 2 1 2 ~
( a)
F F-CL F-E [(4 ~
W-H- - shy
strain ( b)
Tensile Coupons Stress-Strain Curve from Instron Testing Machine
Figure 22 Figure 23 I- I- vJ
I
114
lA 2A 2B
20 2D 3A
3B 4A 4B
5A 6A
FIGURE 24
115
2B 20 2D 3A 3B 4At 4B
Variable Moment to Shear Ratio
20 5A
Variable Opening Depth to Beam Depth
FIGURE 25
116
2A 4A 2B 4B
Variable Opening Length to Depth
2B 3B
Variable Reinforoing Size
FIGURE 26
bullbull
117
Notes Shear force shown in kipsbott of flange bull Elastic o Yielded
r ~ 3
o
top of reinf
boundaryof opening bott of reinf~ ioiiIo ~_ 10 o 10 ~ ~ - Dending Stress Shear Stress
Ca) Stress Distribution at High Moment Edge of Opening - 20
~ bull
~ ~ boundary ~ of opening~
-0 I) 10 40 o to lO ~ Sending Stress Shear stress
(b) Stress Distribution at Low Moment Edge of Opening - 20
Figure 27
118
boundaryof opening
-70 0 __ tQ
Bending Stress Shear Stress
Ca) Stress Distribution at Oenterline of Opening - 20
-1iCgt
~I--=-shyoo---~-=-~ogt---- ---0 - ____ A~Sshy-
middot------------e----- ~~~ ~_______~-----Lr---t-o~p~of flangeo
oE
Cb) Bending Stress Distribution Across Flange at High Moment Edge of Opening - 20
Figure 28
119
-40
-lt0 lt----- shylow
moment edge gtgt bull
lt 0
high54 boundary of opening moment
edge ltgtgt
to
Ca) Bending Stress Distribution Across Length of Opening at Top of Flange - 20
high moment
edge
o
Cb) Bending Stress Distribution Across Length of Opening at Top of Reinforcing - 20
Figure 29
120
boundary---~~~~~~~~___ of Opening
o10 D
Bending Stress Shear Stress
(a) Stress Distribution at High Moment Edge of Opening - 3B
ibull
boundaryof opening
10 Igt lO
Bending Stress Shear Stress
(b) Stress Distribution at Low Moment Edge of Opening - 3B
Figure 30
bull bull bull bull
121
11 9 ~ oS j j ~
boundaryof opening
-lt10 -20 lt) -I-Lo Q lO 10
Bending Stress Shear Stress
(a) stress Distribution at High Moment Edge of Opening - 2D
boundaryof openin
-40 -20 0 ZO o 10 ZQ 30
Bending Stress Shear Stress
(b) Stress Distribution at High Moment Edge of Opening - 4B
Figure 31
122
Test Beam - lA
O6in relative defleotion between opening ends
Figure 32
Test Beam - 2A
O6in relative deflection between opening ends
Figure 33
123
lateral buckling - highmoment edge of opening413k-- shy
Test Beam - 2B
O6in relative deflection between opening ends
Figure 34
bull first strain hardening --~ complete yielding - low
moment edge of opening-J- -- --shy
J complete yielding - high moment edge I of opening I ----first yielding
Test Beam - 20
O6in relative deflection between opening ends
Figure 35
124
---- complete yielding - high moment edgeof opening
first yielding
Test Beam - 2D
O6in relative deflection between opening ends
Figure 36
Test Beam - 3A
O6in relative deflection between opening ends
Figure 37
125
k ---shy497 ---~ --1shy complete yieldingI J
---- first yielding
O6in
Figure 38
O6in
Figure 39
- high moment edge of opening
Test Beam - 3B
relative deflection between opening ends
Test Beam - 4A
relative deflection between opening ends
126
430k--shy
k445--shy
---f-----shy ----complete yielding shy
I ----first yielding
06in
Figure 40
O6in
Figure 41
high moment edgeof opening
Test Beam - 4B
relative defleetion between opening ends
Test Beam - 5A
relative deflection between opening ends
127
k45 o-~--
Test Beam - 6A
O6in relative deflection between opening ends
Figure 42
128
10 shy
10WF21
5t x ampf Opening If x t Reinforcing
~~approximate interaction ~ nominal dimensions and
~ ~
+~ ~ ~
I interaction curve ---I Imeasured dimensions and yields I
I I
04
Interaction Curves - Test Beam lA
Figure 43
curve yields
129
14WF38 7 x lot Opening
bull SIt x a Reinforcing
~-----approximate interaction curve nominal dimensions and yields
interaction curve-------- I
measured dimensions and yields
bull
Interaction Curves - Test Beams 2A and 2B
Figure 44
130
l4WF38 f x 10i Opening 11 x middotf Reinforcing
10 - ~approximate interaction curve nominal dimensions and yields
interaction curve----~ measured dimensions and yields
04
Interaction Curves - Test Beams 2C and 2D
Figure 45
10
131
l4WF38 7middotx lof Opening 2f x ~uReinforoing
approximate interaction curve nominal dimensions and yields
~
1 +3A
I interaction curve -------J
measured dimensions and yields
04
Interaction Curves - Test Beam 3A
Figure 46
10
132
14WF38 7 x lOi~ Opening2f x ~ Reinforcing
~ ~approximate interaction curve ~~ nominal dimensions and yields
~ ~ ~ ~ ~
I I
interaction curve ------I measured dimensions and yields
04
Interaction Ourves - Test Beam 3B
Figure 47
10
133
14WF38 H
7 x 14 Opening 1t x Reinforcing
-~
~~approximate interaction curve ~ nominal dimensions and yields
~ ~ +4B
~ ~ ~
~ interaction curve-----l measured dimensions and yields I
I I
04
Interaction Curves - Test Beams 4A and 4B
Figure 48
134
14WF38 9 x 13t~ Opening lix ~uReinforcing
10 --~ ~~approximate interaction curve
nominal dimensions and yields
~ ~
SAl
interaction curve measured dimensions and yields
04 vVp
Interaction Curves - Test Beam 5A
Figure 49
10
135
14WF38 7 x lof Opening No Reinforcing
r----approximate interaction curve nominal dimensions and yields
+ 6A
----interaction curve measured dimensions and yields
04
Interaction Curves - Test Beam 6A
Figure 50
136
shear (kips)
70
60
---- shear corresponding to experimental failure
50
40
30
20
laterally unsupported length = 54 inohes10
40 80 120 160 200 240
lateral deflection (in x 10-3 )
Lateral Deflection at High Moment Edge of Opening - 20
Figure 51
137
shear (kips)
70
60
------------shear oorresponding to experimental failure
50
40
30
20
10
4 8 12 16 20 24 28
strain differenoe at top flange (inin x 10-3)
Flange Buokling at High Moment Edge of Opening - 20
Figure 52
138
D f
P --IL-=====bull--Jf--P + dP
Shear Stresses at End of Reinforcing
Figure 53
139
l4WF38 7 x lot
Opening
3shy10 f ~--2f x e
Reinforcing
If x ~ Reinforcing
+3A +2A
No Reinforcing + 6A
04
Variable Reinforcing Size
Figure 54
140
14WF38 7 x lof Opening If xl-Reinforcing
+ 2B
+20
+2A
+2D
04 vVp
Variable Moment to Shear Ratio
Figure 55
141
14WF38 7x 10f Opening2i x iReinforcing
10 ---------- shy
+3B
+3A
04 vVp
Variable Moment to Shear Ratio
Figure 56
142
14WF38 7x 14~Opening 1f x f Reinforcing
+ 4B
+ 4A
04 vVp
Variable Moment to Shear Ratio
Figure 57
143
14WF38 1thx imiddotReinforCing
7 x lot Opening
7 x 14 Opening---
04
Variable Aspect Ratio
Figure 58
144shy
14WF38
------7middot x 10i Openinglift x ~~Reinforeing
9 x 13f Opening +20 Ii x i Reinforoing
+5A
04
Variable Opening Depth to Beam Depth
Figure 59
--
r b --1 t l=Ii= W
d
u q
Beam Size ~ d b t w 2a 2h u q c x R bull lA 10WF21 43 989 578 0324
11
0244 875 550 N
0260 0253 2720 N
400 316
2A 14WF38 22 1413 677 0496 0326 1046 700 0383 0381 2813 300 58
tI tI If If If tI tf tI It n tI It2B 45
ff 11 It2C 30 1422 668 0490 0305 1045 0267 0368 2720 n tI n tt tI tI n n tI2D 17 If tI n3A 22 1413 677 0496 0326 1046 0383 0381 5313 600
It 11 It If3B 45 1422 668 0490 0305 1045 0329 0361 5230
tf tI 11 tI fI tI tI4A 22 0340 0368 2720 300 If It tI ff If tI If It n4B 45 n n tI tt f1 tI5A 30 1344 901 0305 0371 3770 425
11If fI6A 22 1045 700 shy - - shy Table 1 -I
foo J1
146
Ave Test Coupon Desig- Testing Lower Static Lower Beam
Beam Location nation Machine Yield Yield Yield Series lA web W Riehle 573 - 573 lA
nflange F 362 - 431 nF 435 shy
F-E It 462 shyItreinf R 370 370
2B web W Instron 417 405 413 2A2B W 11 3A412 398
flange F Riehle 374 - 388 F-CL Instron 382 371 F-E It 397 395
reinf Rl Riehle 434 - 437 2D web W Instron 567 550 558 2C2D
rtW 540 527 3B4A 4B5Aflange F 490 474 446 6AItF-CL 418 406
F-E 478 shyIt 2C2Dreinf R6 398 384 398 4A4B
3A web W 11 411 shyfIflange F 398 379
reinf R2 Riehle 440 shyfI3B reinf R4 330 - 331 3B
R4 11 332 shyR4 Instron 332 shy
4A web W 565 549 flange F 11 487 476
F-CL 406 398 nF-E 429 415 5A reinf R5 tI 437 429 444 5A
R5 450 422 It6A web W 559 545 Itflange F 463 450 fIF-CL 408 402
F-E ff 438 425
Tensile Test Results
Table 2
147
Beam 20 2D 3B 4BLocation Top edge upper fl - BM edge 450K 575K 433lC 300
Bott upper reinf - LIvI edge 450 500 400 317 ~ top upper fl - BM edge 483 600 367 317 Web - ~ open 483 500 517 450 Web - BM edge 517 550 400 350 Web - LM end of upper reinf 517 - - -Bott upper reinf - BM edge 550 550 500 350 Top upper reinf - BM edge 567 800 467 433 ~ web - between LM ends reinf 583 - - shyWeb - LM edge 600 - 583 shy~ top upper fl - LM edge 633 - 600 shyTop upper reinf - LM edge 633 - 467 500 Bott edge upper fl - BM edge 667 - 517 383 Complete yield - BM edge - 567 625 483 383 Complete yield - LM edge 633 - 600 shy
(a) Shear Values Corresponding to Yielding
Location Beam 2C 2D 3B 4B
Top edge upper fl - BM edge 667k 775
k 567k 483k
Bott upper reinf - LM edge - 800 583 -~ top upper fl - BM edge - 775 533 -Web - ~ open 633 700 583 -Web - EM edge - 750 - -Bott upper reinf - BM edge 667 775 - -
(b) Shear Values Corresponding to Strain Hardening
Table 3
- - - - - - -
- - - - - - - - -
- -
BeamLocation Upper fl - BM edge Lower fl - BM edge Lower LM corner open Upper LM corner open Lower BM corner open Upper ID~ corner open Web above open Web below open Low Uif corner to end reinf Up n~ corner to end reinf Low IDH corner to end reinf Up rIM corner to end reinf Between ends reinf LM end Between ends reinf HM end Upper reinf - BM edge open Lower reinf - BM edge open Upper reinf - ilA edge open Lower reinf - LM edge open Lateral buckling - BM edge Web buckling at open Tearing - lower LM corner Tearing - upper BM corner
lA 2A 2B 20 2D 3A 3B ~ lI Ilt v 162 500 400 583 700 525 433
180 - - - 725 - 517 191 550 417 617 600 550 567 191 575 442 567 575 600 433
- 575 467 567 575 600 433
- 575 - - 600 600 shy202 625 475 600 600 700 533
- 625 475 600 625 700 583
- - - 617 700 - 550
- - - 600 675 675 550
- - - - - 675 shy
- 600 458 650 675 650 583
- - - - 725 - -- - - - - 725 -- - - - - 675 -- - - - - - -- - - - - 675 shy- - 483 - - - shy
- 700 517 703 825 775 shy- - - - 825 - 600
4A 4B Ilt Ilt
450 333 500 417 450 367 450 366 500 383 450 417 550 483 600 483 550 400 550 433 625 shy625 shy575 467 575 shy500 shy550 417
- 450 500 383
--675 513
5A le
350 500 400 400 433 483 433 467 500 417
--
500
--
467 500
---
517
-
6A
400 533
-367 367 383 433 533
-----------
550
--
Shear Values Corresponding to Whitewash Flaking
J-ITable 4 ~ 00
149
~hear a1 Beam Size MV [Failure Vp Exp VVp Theor VV_ Diff
lA 10WF21 43 180K 746K 0241 0235 + 26 2A 14WF38 22 532 1L021 0520 0466 +116 2B 11 45 413 0404 0363 +113 2C If 30 548 1301 0421 0403 + 45
u n2D 17 670 0515 0420 +226 n3A 22 575 1021 0562 0466 +206 tt3B 45 497 1301 0382 0345 +107 11 n4A 22 572 0440 0360 +222 n4B 45 430 0330 0295 +119 If It5A 30 445 0342 0296 +155 116A 22 450 0346 0271 +277
Correlation Between Experiment and Theory
Table 5
~hear at Approximate Beam Size MV Failure Exp VV Theor VV DiffVp p p
lA 10WF21 43 180K 746 K
0241 0254 - 51 2A 14VlF38 22 532 1021 0520 0503 + 34
It2B 45 413 0404 0344 +175 If2C 30 548 1301 0421 0414 + 17
It2D 17 670 0515 0505 + 20 3A 22 575 1021 0562 0505 +103
n3B 45 497 1301 0382 0377 + 13 4A tI 22 572 n 0440 0463 - 50
It It 03094B 45 430 0330 + 68 5A 30 445 tr 0342 0353 - 31 6A 22 450 tt 0346 0257 +346
Correlation Between Experiment and Approximate Theory
Table 6
150
Shear at Shear at Shear at Beam MV Failure Full Yield Dif Full Yield Dif
Exp H M Edge L M Edge k k k2C 30 548 567 + 35 633 +155
2D 17 670 625 - 67 - shy3B 45 497 483 - 28 600 +207 4B 45 430 383 -109 - shy
Correlation Between Experimental Failure and Complete Yielding
Table 7
Theor Shear at Shear at Beam MV Shear at Full Yield Dif Full Yield Diff
Failure H M Edge L M Edge
2C 30n 525k 567k + 80 633k +206 2D 17 546 625 +145 - shy3B 45 449 483 + 76 600 +336 4B 45 384 383 - 03 - shy
Correlation Between Theoretical Failure and Complete Yielding
Table 8
151
APPENDIX A
Computer Program for Interaction Curve
A computer program was developed to generate an intershy
action curve for a specified beam opening and reinforcing
size according to the method described in Chapter Ill The
program was wri tten in Fortran IV and can be used on any
standard digital computer that makes use of this language
The input for the program should be of the form given in
the following table
Data Number Items on of Cards Data Cards
Number of beams 1 NB
Dimensions of beams NB dbtw
Yield Stresses NB CS111 S~ lts
Number of openings per beam NB NE
Sizes of openings NH ah
Number of reinforcing sizes per opening NH NR
Sizes of reinforcing NR uqc
A listing of the computer program is given on the following
pages
152
C THIS PROGRA~ CO~PUTES ThE INTERACTION CURVE RELATING MOMENT AND C SHEAR VALUES WHICH CAUSE FAILURE OF A WICE FLANGE bEAM CONTAINING C A REINFORCED RECTANGULAR OPENING AT ThE MIDOEPTH C
REAL KlK2MPMMPKllK12K21 t K22 581 FORMAT(5FIO3) 584 FORMAT(3FIO3) 582 FOR~AT(2FIO3) 583 FORMA1(I5 681 FORMAT(lINTERACTION
lOt 0 B T 682 FORMAT( F133F63 683 FORMAT(O SIGF 684 FORMAT( 5F93
BETwEEN MOMENT AND SHEARtw)
SIGw SIGR VP Mpt)
605 FORMAT(O OPENING LENGTH middotF73middot HEIGHT =F73) 606 FORMAT(O MMP VVP SIG 601 FORMAT( middot5FI04 608 FORMATOV IS TOO LARGE SO SIGMA BECCMES 609 FORMATtOHIGH SHEAR SOLUTION) 611 FORMAT(O U QC) 612 FORMATe 3F63) 613 FORMAT(O STRESS REVERSAL IN REINFORCING 614 FORMATOSTRESS REVERSAL IN CLEAR WEe 615 FORMAT(O STRESS REVERSAL IN WEB STUB) b16 FORMAT(OLOW SHEAR SClUTIONt) 618 FORMATtO MAxIMU~ VVP Fb3)
c READ(S583)NB 00 200 I=lNB RE~D(5581tOBTW
READ(5584)SIGFSIGWSIGR VP=W(0~2T)SIGWSQRT(3) MP=BTSIGF(D-T bullbullW(D-2Tl2SIGW4 WRITE(6681) WRITEI6682)DtB t TW WRITE(6683) WRITE(~684)SIGFSIGWSlGRVPtMP
REAO(SS83)NH DO 200 ~=lNH
RE~D(5582JAH
REAC5583) NR A2=2A H2=2H WRITE(6605)A2H2 VVPM=(O-2T-2H)0-2T) WRITEt6618) VVPM CO 200 J=lNR READ(5584) UQC
Kl K2~)
COMPLEXJ
153
WRITE(661U WRITE(661Z) UQC WRITE(6606) VINCR=OO V=OO S=OZ-H-T AW=SW Af=BT AR=(C-WjQ R=U+Q
C C LOW SHEAR SOLUTION C C STRESS REVERSAL IN WEB STUB C
WRITE(66161 WRITE(661S)
101 V=V+VINCR XX=$IGWZ-O7SV2AW2 IF(XX) 201]00300
300 SIG=SQRT(XX) ALPHA=ARSIGR(AFSIGf BETA=AWSIGCAfSIGf) Cl=T+SBETA C2=-(D-2HJ C3=VAAFSIGF) C4=C22-40ClC3 IF(C4408399399
399 K21=(-C2+$QRT(C4)(2Cl K22=(-C2-SQRTCC4raquo)(2Clt Kll=K21BETA KI2=K22BETA IF(K21)330301301
301 IFK21-10)30230233C 302 IFCKll1330304304 304 IFKllS-U)320320330 330 IF(K22)408)31331 331 IF(K22-10)33233Z40a 332 IF(KIZ)408333333 333 IF(K12S-UJ32132140S 320 K2=K21
Kl=Kl1 GO TO 322
321 K2K22 Kl=K12
322 FY=AFSIGF(S+T2)+AWSIGSS(1-2Kl2)+ARSIGR(U+Q2) F=AFSIGF+AWSIG(1-2Kl+ARSIGR M=2FY+20HF-VA
154
MMP=MMP VVP=VVP WRITE(6607)MMPVVPSIGKlKZ VINCR=VP500 GO TO 101
C C STRESS REVERSAL IN REINFORCING C
408 WRITE(6613 GO TO 409
902 V=Vl 701 V=V+VINCR
XX=SIGW2-015V2AW2 IF(XX9011CQ100
100 SIG=SQRTXX) 409 Rl=(C-W)SIGR
R2=AWSIG+SRl Cl=T+SAFSIGFRZ C2=2SURIR2-(D-2HJ C3=VA(AFSIGF)+U2Rl(AFSIGFraquo)(SR1RZ-1) C4=C22-40C1C3 IF(C4)418403403
403 K21=(-C2+SQRT(C4)(Z0Cl KZ2=-C2-SQRT(C4)(Z0Cl) Kll=AFSIGFK21R2+URlR2 K12=AFSIGFK22R2+URIR2 IF(K21)430401401
401 IF(K21-10)4C240243C 402 IF(K11S-U)430404404 404 IF(Kl1S-R)42042043C 430 IFK22)418431431 431 IF(K22-10)432432418 432 IF(K12S-U418433433 433 [FtK12S-R)421421418 420 K2=K21
K l=K 11 GO TO 422
421 K2=K22 Kl=K12
422 FY=AFSIGFtS+T2)+AWSIGSS(1-2Kl2) 1 +(C-W)SIGR(U2+UC+SQ2-(KlS)2)
F=AFSIGF+AWSIG(I-2Kl)+(C-WJSIGR(2U+Q-2KlS) M=20FY+20HF-VA ~MP=MMP
VVP=VVP IF(MMP 418423423
423 WRITE(6601)MMPVVPSIGKlK2 VINCR=VP500
155
GO TO 701 C C STRESS REVERSAL IN CLEAR WEB C
418 WRITE(6614) GO TO 419
922 V=Vl 801 V=V+VINCR
XX=SIGW2-075V2AW2 IF(XX)921800800
800 SIG=SQRT XX) 419 Cl=AFSIGFS(AWSIG)+T
CZ=-O+2H-2SARSIGR(AWSIG) C3=VACAFSIGF)+2U+Q2)ARSIGR(AFSIGF)
1 +S(ARSIGR2fAFSIGFAWSIG C4= C224 ClC3 IF(C4)428410410
410 KZl=(-C2+SQRTCC4)(ZCl K22=(-C2-SQRTCC4)ZC1) Kll=AFSIGFK21(AWSIG)-ARSIGR(A~SIG)
K12~AFSIGFK22(AWSIG)-ARSIGRAWSIG)
IF(K21)S30501501 501 IFK21-10)502502530 50Z IF(KllS-RS30504504 S04 IF(Kll-l0S20520510 530 IFtKZ2)428531531 531IF(K22-10)532532428 532 IF(K12S-R428533533 533 IF(K12-10)521S21428 520 1lt2=K21
Kl=Kl1 GO TO 522
521 1lt2=K2Z Kl=K12
522 FY=AFSIGF($+T5+AWSIGS(i-2bullbullKl212-ARSIGR(U+Q2) F=AFSIGF+AWSIG(1-2Kl-ARSIGR M=2FY+2HF-VA MMP=MMP VVP=VVP IF (MM P) 428523523
523 WRITE(6601)MMPVVPSIGKlK2 VINCR=VP 500 GO TO 801
c C HIGH SHEAR SOLUTION C
428 WRITE(oo09) GO TO 352
156
2 V=Vl 4 V=V+V INCR
XX=SIGW2-015V2AW2 IF(XXJI0235D350
350 SIG=SQRHXX) 352 AlPHA=ARSIGR(AfSIGf
BETA=AWSIG(AfSIGf) 429 02=-10-BETA-AlPHA
03=05VA(AFSlGFT)+AlPHA+8ETA+O5(AlPHA+8ETA)2+OS8ETAST 1 +AlPHA(U+Q2IT-CD-2H(AlPHA+8ETA)O5T
04=D22-403 IFCD4)102351351
351 K21=(-D2+SQRTID4raquo2 K22=(-D2-SQRT(04112 Kll=1O+8ETA+AlPHA-K21 K12=10+BETA+AlPHA-K22 IFCK21630601601
601 IF(K21-10602~0263C
602 IF(Kll)630604604 604 IFIKll-10)62062D63C 630IFCK22)102631o31 631 IFIK22-10)632632102 632 IF(K12)102633633 633 IF(K12-10)621621lC2 620 K K21
Kl=Kll GO TO 622
621 K2=K22 Kl=K12
622 FYPT=Kl(D-2H)-TKl2-(S+ST) FY=AFSIGFFYPT-AWSIGS2-ARSIGRlU+Q2bullbull F=AFSIGfC2KI-l-AWSIG-ARSIGR M=20FY+20HF-VA MMP=MMP VVP=VVP IF(MMP) 102623623
623 WRITE(6607)MMPVVPSIGKlK2 VINCR=VPIOO GO TO 4
102 V I=V-VINCR VINCR=VINCRIOO VIMIN=VPI00DOO IF(VINCR-VIMIN) 19922
901 Vl=V-VINCR VINCR=VINCR200 VIMIN=VPIOOOO IF(VINCR-VIMIN)199902902
c
C
157
921 V1=V-VINCR VINCR=VINCRI200 VIMIN=VPI10000 IF(VINCR-VIMIN)199922922
199 CONTINUE GO TO 200
201 CONTINUE WRITE(b608)
200 CONTINUE RETURN END
158
APPENDIX B
Plasticity Relationships
In the elastic range stresses were computed from measured
strains by the usual elastic theory The values used for the
modulus of elasticity E and the shear modulus Gtwere 29OOOksi
and 11200ksi respectively When local yielding had occurred
according to the von Mises criterionas stated by equation (2)
Chapter 11 stresses were then computed by the plasticity
relations given by Hill(8) and reduced to the form given by
Bower(16) These relations are stated here for easy reference
Plasticity relations for a Prandtl-Reuss solid yield
dE = des _ ~(d)+ 2G dt (a)xT3Gt~xy
where E x is strain in the longitudinal direction and l$ xy
is the shearing strain Eliminating ~ by use of the von
Mises criteria gives
(b)
Since explicit integration of equation (b) would be
extremely difficult the equation is diVided by dE-x and the
derivatives d tSd E and d 6 yld poundx are replaced byx x
159
(c)
( d)
where~i and ~XYi are the bending and shearing stresses
respectively corresponding to ~ and ~f and ~xYf are
these stresses corresponding to poundx + 6 (x
Substituting equations (c) and (d) into equation (b)
gives
A~x - B6~ + AtS cs = AY l (e)
f
where (f)
and ( g)
The shear stress corresponding to a change in strain is given
by
2 2 ~ =Jcsy - CS f (h)
f [3
In order to determine whether strain hardening had occurred
an equivalent strain Xp was computed from
160
where lIE Xl ~yp Ezp and xyp are the plastic components of
strain and are given by
~ xp = poundx-t ( j)
Eyp = E yy (S
- i (k)
E (1)poundzp = z -~ (m)xyp = 6xy -
~
~
The constant volume condition was used to calculate ~ zp
(n)
The equivalent strain was compared to a reference strain
~ pr computed from the value for ~p for the onset of strain
hardening for a tensile test The strain hardening strain
was taken as euro x and it was assumed that E = poundoz For yy
A36 steel the strain hardening strain was taken as 115 ~yIE
and ~y was determined from a tensile test of a coupon from
the web of the test beam Strain hardening was considered
resent J f 6 gt or J P degpr-
The above relationships were included in a paper
presented by Bower(16) in 1968
161
BIBLIOGRAPHY
1 Muskhelishvili NISome Basic Problems of the Mathematical Theory of ElasticityU 2nd Edition P Noordhoff Itd 1963
2 HelIer SR Jr Brock JS and Bart R The itresses Around a Rectangular Opening with Rounded Corners in a Beam Subjected to Bending with Shear Proceedings Vol 1 Fourth U National Congress on Applied Mechanics Berkeley Calif 1962
3 Bower JE ItElastic Stresses Around Holes in WideshyFlange Beams Journal of the Structural Division ASCE Vol 92 No ST2 Proc Paper 4773April 1966
4 BowerJE Experimental Stresses in Wide-Flange Beams with Holes tl Journal of the Structural Division ASCE Vol 92 No ST5 Proc Paper 4945October 1966
5 So WC The Stresses Around Large Circular Openingsin the Webs of Wide-Flange Beams MEng Thesis McGill University Aug 1963
6 Chen IC tiThe Stresses Around Two Large Openings in the Webs of Wide-Flange Beams MEng Thesis McGill University Aug 1967
7 Segner EP Jr Reinforcement Requirements for Girder Web Openings Journal of the Structural Division ASCE Vol 90 No ST3 Proc Paper3919 June 1964
8 HillR The Mathematical Theory of PlastiCityClarendon Press Oxford University Press London 1950
9 Handbook of Steel Construction Canadian Institute of Steel Construction OntariO 1967
10 ltSpecifications for the DeSign Fabrication and Erection of Structural Steel for Buildings AISC 1963
11 Basler K Strength of Plate Girders in Shear Journal of the Structural Division ASCE Vol 87 No ST7 Proc Paper 2967 October 1961
162
12 Worley WJ Inelastic Behavior of Aluminum AlloyI-Beams With Web Cutouts University of Illinois Engineering Experimental Station Bulletin No 448 April 1958
13 Redwood RG and McCutcheon J 0 Beam Tests with Unreinforced Web Openings Journal of the Structural Division ASCE Vol 94 No ST1 Proc Paper5706 Jan 1968
14 nCommentary of Plastic DeSign in Steel ASCE Manual of Engineering Practice No 41 1961
15 Cheng SY flAn Investigation of Large Extended Openingsin the Webs of Wide-Flange Beams MBng Thesis McGill University Aug 1966
16 Bower JE Ultimate Strength of Beams with RectangularHoles Journal of the Structural Division ASCE Vol 94 No ST6 Proc Paper 5982 June 1968
17 Redwood RG Plastic Behavior and Design of Beams with Web Openings ff Proceedings of the Canadian Structural Engineering Conference Canadian Institute of Steel Construction Toronto Feb 1968
18 Redwood RG The Strength of Steel Beams with Unreinshyforced Web Holes Civil Engineering and PubliC Works Review Vol 64 No 755 London June 1969
19 Redwood RG Ultimate Strength Design of Beams with Multiple Openings Proceedings of the Structural Engineering Conference American Society of Civil Engineers Pittsburgh October 1968
vii
LIST OF FIGURES
Page
1 Types of Reinforcing 93
2 Stress Distribution at Opening 94
3 Idealized Stress-Strain Curve for Structural Steel 94
4 Interaction Curve - Unperforated Beam 95
5 Load - Deflection Curves 96
6 Interaction Curve - Perforated Beam 97
7 Hinge Locations and Cross-Section of Member 98
8 Stress Distributions and Resultant Forces 99
9 Interaction Curve Showing Low and High Shear Regions 100
10 Interaction Curve - 14WF38 Nominal 7 x lOin Opening Itn X iReinforcing 101
11 Interaction Curve - 14WF3~ Nominal 7f1 X lot Opening 213 x t Reinforcing 102
12 Interaction Curve - 14WF38 Nominal 7 xlot Opening No Reinforcing 103
13 Interaction Curve - 14WF38 Nominal 7 x 14 Opening It x lIt Reinforcing 104
14 Interaction Curve - 14WF38 Nominal 9 x 13t Opening li x -n Reinforcing 105
15 Interaction Curve - 10WF21 Nominal 5~ n x Bi Opening li x i lt Reinforcing 106J
16 Test Beam Dimensions and Dial Gauge Locations 107
17 Test Beam Dimensions and Dial Gauge Locations 108
18 Test Beam Dimensions and Dial Gauge Locations 109
19 Lateral Bracing System 110
viii
Page
20 Photographs of Lateral Bracing System III
21 Strain Gauge Locations 112
22 Tensile Coupons 113
23 Stress-Strain Curve from Instron Testing Machine 113
24 Photographs of Test Beams after Collapse 114
25 Comparison Photographs of Test Beams 115
26 Comparison Photographs of Test Beams 116
27a Stress Distribution at High Moment Edge of OpeningBeam 2C 117
27b Stress Distribution at Low Moment Edge of OpeningBeam 2C 117
28a Stress Distribution at Centerline of OpeningBeam 2C 118
28b Bending Stress Distribution Across Flange at High Moment Edge of Opening - Beam 2C 118
29a Bending Stress Distribution Across Length of Opening at Top of Flange Beam 2C 119
29b Bending Stress Distribution Across Length of Opening at Top of Reinforcing - Beam 2C 119
30a Stress Distribution at High MOment Edge of Opening - Beam 3B 120
30b Stress Distribution at Low Moment Edge of Opening - Beam 3B 120
31a Stress Distribution at High Moment Edge of Opening - Beam 2D 121
31b stress Distribution at High Moment Edge of Opening - Beam 4B 121
32 Load-Relative Deflection Curve - Beam lA 122
33 Load-Relative Deflection Curve - Beam 2A 122
ix
Page
34 Load-Relative Deflection Curve - Beam 2B 123
35 Load-Relative Deflection Curve - Beam 2C 123
36 Load-Relative Deflection Curve - Beam 2D 124
37 Load-Relative Deflection Curve - Beam 3A 124
38 Load-Relative Deflection Curve - Beam 3B 125
39 Load-Relative Deflection Curve - Beam 4A 125
40 Load-Relative Deflection Curve - Beam 4B 126
41 Load-Relative Deflection Curve - Beam 5A 126
42 Load-Relative Deflection Curve - Beam 6A 127
43 Interaction Curves - Test Beam lA 128
44 Interaction Curves - Test Beams 2A and 2B 129
45 Interaction Curves - Test Beams 2C and 2D 130
46 Interaction Curves - Test Beam 3A 131
47 Interaction Curves - Test Beam 3B 132
48 Interaction Curves - Test Beams 4A and 4B 133
49 Interaction Curves - Test Beam 5A 134
50 Interaction Curves - Test Beam 6A 135
51 Lateral Deflection at High Moment Edge of OpeningBeam 2C 136
52 Flange Buckling at High Moment Edge of OpeningBeam 2C 137
53 Shear Stresses at End of Reinforcing 138
54 Variable Reinforcing Size 139
55 Variable Moment to Shear Ratio 140
56 Variable Moment to Shear Ratio 141
x
Page
57 Variable Moment to Shear Ratio 142
58 Variable Aspect Ratio 143
59 Variable Opening Depth to Beam Depth M4
xi
LIST OF TABLES
Page
1 Beam Properties 145
2 Tensile Test Results 146
3a Shear Values Corresponding to Yielding 147
3b Shear Values Corresponding to Strain Hardening 147
4 Shear Values Corresponding to Whitewash Flaking 148
5 Correlation Between Experiment and Theory 149
6 Correlation Between Experiment and Approximate Theory 149
7 Correlation Between Experimental Failure and Complete Yielding 150
8 Correlation Between Theoretical Failure and Complete Yielding 150
SUJn1[ARY
ACKNOWLEDGEMENTS
NOTATION
LIST OF FIGURES
LIST OF TABLES
TABLE OF CONTENTS
Page
ii
iii
iv
vii
xi
CHAPTER I INTRODUCTION
11 General Background 1
12 Types of Reinforcing 2
13 Elastic and Ultimate Strength Analysis 4
CHAPTER 11 ULTINfATE STHEUGTH BEHAVIOR
21 Behavior of Unperforated Beams 8
22 Behavior of Beams with Web Openings 12
23 Previous Ultimate Strength Investigations 17
24 Scope of the Investigation 25
CHAPTER III ULTIMATE STRENGTH ANALYSIS
31 Assumptions 27
32 Low Shear Solution - Case I 29
33 High Shear Solution - Case 11 35
34 Limits of Interaction Curves 36
CHAPTER IV APPROXIMATE METHOD
41 General Remarks 41
42 Development of the Method 42
43 Limitations on the Approximate Method 46
44 Summary and Discussion 50
Page CHAPTER V EXPERIMENTAL INVESTIGATION
51 Selection of Test Beams 56
52 Experimental Setup 59
53 Testing Procedure 62
54 Determination of Yield Stresses 63
CHAPTER VI EXPERIMENTAL RESULTS
61 Behavior of Beams during Testing 66
62 Stress Distributions and Failure Loads 71
63 other Factors 72
CHAPTER VII ANALYSIS OF RESULTS
71 Order of Onset of Yielding 77
72 Stress Distributions 78
73 Failure Loads 80
74 Influence of Reinforcing and Other Variables 82
CHAPTER VIII CONCLUSIONS AND RECO~Th1ENDATIONS
81 Conclusions 85
82 Recommendations for Design 88
83 Recommendations for Future Work 91
FIGURES 93
TABLES 145
APPENDIX A Computer Program for Interaction Curve 151
APPENDIX B Plasticity Relationships 158
BIBLIOGRAPHY 161
1
CHAPTER I
INTRODUCTION
11 General Background
It has become common practice to cut openings in the
webs of beams to permit the passage of utility ducts By
passing these utilities through rather than under the beams
the height of each floor in a building can be reduced thereshy
by effecting a considerable saving in cost particularly in
the case of multistorey structures However cutting an
opening in the web of a beam may considerably reduce the
strength of the beam in the vicinity of the opening If
the opening is located at some position in the beam where
stresses are low this may cause no special problems but
if it is located in a high stress region the designer is
faced with the problem of finding an economioal way to inshy
crease the strength of the beam so that failure will not
result at the opening under working loads
Two alternate approaches are possible in this case
The size of the entire member in question may be increased
on the basis of providing sufficient strength at the openshy
ing so that failure will not ocour The other approach is
to reinforce the original member in the vicinity of the
opening so that the loads can be carried without inducing
2
high stresses The size of the member itself then need not
be increased
Just as the decision whether to pass utilities through
rather than under floor beams must be based primarily on
economic considerations the decision whether to reinforce
an opening or increase the size of the entire member when
the opening is located in a high stress region must also be
based on economics Since many methods of reinforcing an
opening are possible the relative costs and effects of each
type of reinforcing deserve consideration
12 Types of Reinforcing
Reinforcing for an opening in the web of a beam may be
of three basic types
1 reinforcing to resist high bending stresses and low shear
stresses
2 reinforcing to resist low bending stresses and high shear
stresses
3 reinforcing to resist both high bending and shear stresses
Two examples of the first type are illustrated in Figures
la and lb By increasing the areas of the sections above
and below the centroid they provide additional moment
resisting capacity to the section However since shear
stresses are considered to be carried only by the web of
the section this type of reinforcing cannot increase the
3
shear capacity above that given by the shear capacity of
the uncut section times the ratio of the net web area at
the opening to the initial web area of the beam Reinforcshy
ing types to resist high shear stresses are those that
increase the web area so that more web is available to
resist these stresses Web doubler plates as shovm in
Figure lc are typical of this type of reinforcing although
their use is usually very limited due to welding difficulties
This type of reinforcing also increases moment capacity by
increasing the area above and below the opening Another
type of shear reinforcing uses vertical or inclined web
stiffeners to carry the shear forces past the opening A
typical arrangement of inclined web stiffeners is shown in
Figure Id The third type of reinforcing is essentially a
combination of the first two examples of which can be seen
in Figures le and If The area above and below the opening
is increased to give added moment capaCity and the effective
web area is increased by the addition of vertical or inclined
shear plates to provide added shear capacity to the section
A combination of the reinforcing arrangements in Figures la
and Id would be another example of this type Many other
arrangements of web opening reinforcing are pOSSible but
those shown in Figure 1 and mentioned above are typical of
the three main types
Since the problem of cutting and reinforcing an opening
4
in a section is basically one of economics the cost of the
process of reinforcing an opening must be considered This
cost may be divided into three parts the cost of supplying
and cutting the material to be used in reinforcing the openshy
ing that of bending and fitting this material and welding
this material into place Since the cost of welding is
paramount among the several expenses it is advantageous to
keep the welding to a minimum in the selection of a reinforcshy
ing type This tends to make the high shear type of reinforcshy
ing uneconomical and essentially limits the more practical
opening reinforcings to those of the type considered in
Figures la and lb The present investigation is devoted to
this type of reinforcing and specifically to that arrangement
given in Figure lb
13 Elastic and Ultimate Strength Analysis
BaSically two types of analysis were available for this
study - elastic and ultimate strength The elastic analysiS
of the stresses in a beam containing an opening in its web
consists of the superposition of the stresses occurring in
an unperforated beam and the stresses resulting from forces
applied to the boundary of the opening in such a way as to
satisfy certain boundary conditions at the opening This
approach finds its basis in an important work presented by
NIMuskhelishvili(l) in the 1930s and was used by SR
5
Heller Jr et al(2) in 1962 and by JEBower(3) in 1966 to
investigate the elastic stresses around openings in wideshy
flange beams Bowers work also outlined the widely used
approximate Vierendeel analysis based on the assumption that
the beam behaves like a Vierendeel truss in the vicinity of
the opening The shear force carried by the section causes
secondary bending moments to occur within the tee sections
formed by the flange and the remaining part of the web above
and below the opening A point of contraflexure for the
secondary bending stresses is assumed to occur at the midshy
length of the opening The forces acting at the opening and
the resultant stress distributions are shown in Figure 2 It~
is assumed that the shear is carried equally by the tee secshy
tions above and below the opening and that the secondary and
primary bending stresses are additive
Bower also performed an experimental study(4) in 1966
to verify the results of his analysis A series of 16WF36
beams each containing one opening either circular or
rectangular with corner radii of 14 inch were tested at
varying moment to shear ratios The beams were implemented
with electrical resistance strain gauges in the vicinity of
the openings so that strains could be measured and compared
to those predicted by theory The results of Bowers tests
showed that very high stress concentrations occur at the
corners of rectangular openings while smaller stress concenshy
6
trations occur above and below circular openings where the
tee section is the smallest The findings for circular
openings confirm those given by So(5) in 1963 while those
for rectangular openings were confirmed by Chen(6) in 1967
Bower showed that for both types of openings investigated
the elastic analysis predicts all stresses and stress concenshy
trations with reasonable accuracy except for the octahedral
shear stresses away from the boundary of the opening The
elastic analYSiS however is complicated and requirea the
use of a computer and is incapable of dealing with the presshy
ence of notches or other irregularities at the opening The
approximate Vierendeel method was found to predict bending
stresses and octahedral shear stresses with acceptable
accuracy while failing to predict the stress concentrations
in both cases However the approximate method is relatively
simple and lends itself easily to hand calculations Since
the elastic analysis is not practical particularly for
design purposes because of the length of the calculations
involved it has been suggested by Bower and others(7) that
the Vierendeel analysis be used in its place with stress
concentrations neglected when an elastic analysis is desired
A design based on this method would result in a beam whose
response is not purely elastic under working loads
An analysis based on complete yielding of the sections
where high stress concentrations exist under elastic condishy
7
--~~
~ tions would eliminate this problem Such a plastic or
ultimate strength analysis would take advantage of the
additional strength of the perforated beam between the onset
of yielding and the complete plastification of the section
or sections that would cause failure or uncontrolled deformshy
ations of the beam Besides eliminating the problem of stress
concentrations in the elastic range a plastic analysis also
has the advantage of being simpler to use than the complete
elastic analysis and of not being rendered unusuable when
notches or irregularities are present at the opening since
the method depends only on the reasonably accurate prediction
of the sections where complete yielding or plastic hinges
will occur These regions can generally be determined withshy
out difficulty particularly in the case of rectangular
openings Consideration of these factors suggest an ultishy
mate strength analysis as the most rational approach to
the problem
8
CHAPTER 11
ULTIMATE STRENGTH BEHAVIOR
21 Behavior of Unperforated Beams
Ultimate strength analysis truces advantage of the ducshy
tility of structural steel This ductility mruces it possible
for the steel to undergo large deformations beyond the elastic
limit before failure occurs As can be seen from the idealized
stress-strain curve in Figure 3 the material is elastic up
to the yield level but after this level is reached the strain
increases extensively without any further increase in stress
Beoause of this attainment of the yield stress at the outershy
most fiber of a beam in bending does not cause the failure of
the member Rather the member has reserve strength that
permits increase of load up to the point where the entire
cross-section has reaohed the yield stress ie when a plastio
hinge has fonned at the yielded section Since rotation is
free to occur at plastic hinge locations when sufficient
hinges have formed so that the structure forms a mechanism
and is unstable under the applied loads collapse will occur
For a simply supported beam of uniform cross-section
formation of only one plastio hinge is suffioient to cause
collapse If no shear or axial forces are acting the plastic
moment or maximum moment capacity of the section is easily
9
obtained and is equal to the first moment of the area of the
section above or below the centroid about the centroid times
the yield stress of the material This is writte~ as
where Z is the plastic section modulus of the section and ~y
is the yield stress
The presence of a moment-gradient (shear) has the effect
of lowering the plastic moment capacity of a member Since
the shear force is carried by the web of the member the
moment carrying capacity of the web and therefore that of
the member must be reduced since the presence of shear
causes a reduction in the normal stress carrying capacity of
the web The yielding criterion of von Mises is generally
accepted as being the most applicable to structural steel
and can be explained physically in either of two ways
Henckys interpretation states that when the energy of disshy
tortion reaches a maximum value yielding results A preferred
explanation offered by Prandtl states that when the shear
stress on the octahedral plane reaches some maximum value
yielding occurs(8) Von Mises t yield criteria can be
expressed mathematically as
10
where ltSyiS the yield stress ltS the normal stress and the
shear stress The effect of shear on moment capacity can
best be illustrated by an interaction curve as shown in
Figure 4 where the axes have been non-dimensionalized by
diVision by Mp and Vp Vp is the maximum shear carrying
capacity of the section under pure shear and is obtained
from equation (2) as
where = Vw( d-2t) V is the shear force and w( d-2t) the
clear web area Equation (3) presupposes that the flanges
of the section carry no shear The broken line in Figure 4
illustrates the interaction between moment and shear for an
unperforated wide-flange section as predicted by equation (2)
Such an interaction curve shows for any given moment value
the corresponding shear value that a member can safely sustain
Any value less than those on the interaction curve (those
bounded by the VV and MM axes and the interaction curve)p p represents a combination of moment and shear which the member
can safely carry Values on or outside the interaction curve
represent those combinations which would cause collapse of the
member The reduction in strength due to shear is however (9)fairly small for unperforated sections and OISC and
AISc(lO) design codes for buildings allow it to be neglectshy
11
ed for design purposes since the ooouranoe of strain hardenshy
ing makes possible the attainment of moments greater than Mp
in the presence of shear The allowable moment and shear
values thus permitted are those bounded by the solid line in
Figure 4
The inorease in strength due to strain hardening oan best
be illustrated by considering the load-defleotion curves in
Figure 5 The load-defleotion ourve for a beam in pure bendshy
ing is given in Figure 5a When the plastio moment of the
seotion is reaohed the defleotions beoome exoessive and
increase with no further inorease in load This ooours
beoause the member forms a meohanism with the formation of
a plastio hinge at the attainment of Mp However when shear
is present the load-defleotion ourve does not beoome horishy
zontal when the reduoed Mp Mp as predioted by equation (2)
and given by the interaction curve in Figure 4 is reached
but rather oontinues to climb at a lesser slope reaching
values equal to or greater than the full Mp given by equation
(1) This oan be seen in Figure 5b The increase in strength
above Mp under moment gradient is due to strain hardening
and is usually neglected in simple plastiC theory although
it can be predicted but the procedure is complicated for
all but very simple cases Strain hardening occurs in the
presence of shear because yielding occurs in localized areas
or slip bands so that the material within these bands strain
12
hardens before adjacent areas reach the point of yield Alshy
though simple plastic theory neglects strain hardening the
significance of this phenomenon should not be underestimated
since all rolled sections are proportioned such that the limit
of shear carrying capacity of the web lies within the strain
hardening range(ll)
22 Behavior of Beams with Web Openings
The introduction of an opening into the web of a wideshy
flange section has two effects on the interaction curve The
first and more immediately apparent of these effects is the
reduction of shear and moment capacity by the reduction of the
area available to resist these forces The moment capacity
is reduced to
(4)
where w is the web thickness and h is the half depth of the
opening The shear capacity is reduced to
v = w( d-2t-2h) $-3
This change in the interaction curve is shown by the broken
line in Figure 6 The second effect caused by the presence
of an opening is the strong interaction between moment and
shear due to the member behaving like a Vierendeel truss in
13
the vicinity of the opening This is the same type of
behavior described in Section 13 except that the member
is analyzed in the plastic rather than the elastic range
The secondary bending moments caused by the shear force are
added to the primary bending moments thus causing the critical
sections to yield completely at lower loads than would be exshy
pected were this interaction effect ignored This is shown
by the line in Figure 6 where the effects of shear as given
by equation (2) have also been included
The addition of horizontal bar reinforcing above and
below an opening in a wide-flange beam increases the maxishy
mum moment capacity of the section (no shear acting) above
that of an unreinforced opening by increasing the area of
the section capable of resisting moment The effects of
interaction between moment and shear are also reduced by the
addition of reinforcing since the reinforcing is of such a
type as to be particularly well suited to resist secondary
bending moments due to Vierendeel action The maximum shear
carrying capacity of a reinforced opening may reach
(Vv) = d-2t-2h (6)P max d-2t
which is the maximum shear carrying capacity of the section
assuming no interaction and is derived from equation (5) by
division by equation (3) This can represent a considerable
14
increase in strength over the shear capacity of the unreinshy
forced opening which is normally much below (VVp)max because
secondary bending moments have to be resisted to a large
extent by the web since there is no reinforcing to perform
this task
The presence of an unreinforced rectangular opening in
the web of a wide-flange section oauses ohanges in the failure
modes of the beam as well as in the interaction ourve Sevshy
eral investigations have confirmed these ohanges in failure
modes(461213) Vllien subjected to pure bending the member
is found to fail by oomplete yielding of the tee sections
above and below the opening Load defleotion curves for this
case are similar to those for an unperforated beam under pure
bending in that with the attainment of Mp the curve becomes
horizontal and collapse eventually occurs with no further
increase in load
Vhen the perforated beam is subjected to bending with
shear large relative displacements occur between the ends
of the opening and at the same time localized plastiC binges
form at each of the four corners of the opening by complete
yielding of the tee section at these locations The load-
deflection curve in this situation is similar to the load-
deflection curve of an unperforated member under moment-
gradient except that the second portion of the curve after
15
the bend is not always as straight as that for the unpershy
forated beam and in fact may possess considerable
curvature in some cases(13) The value of the moment at the
opening at which the load-relative deflection curve bends
is not that of the unperforated section but instead is a
reduced value obtained by considering both reduced area and
moment-shear interaction as described previously_ Again
the increase in load above the value corresponding to the
predicted moment is due to strain hardening for the same
reasons as cited previously_ This strain hardening effect
makes it exceedingly difficult to ascertain at what value of
shear or moment an experimental test beam should be considershy
ed to have failed so that this failure load can be compared
to one predicted by theory It can be said with certainty
that this value should lie somewhere between the load at
which the load-relative deflection curve starts to bend from
its initial slope and the ultimate load at which the beam
suffers total collapse This total collapse will be either
by web buokling at the opening or by oraoking of one or more
of the corners of the opening after which deflections become
uncontrolled and the load carrying capacity of the beam
decreases
The use of the collapse load as the failure load would
however not be justified unless the effects of strain hardenshy
ing and the possibility ot tearing and buokling are incorporatshy
16
ed into the analysis Also the deflections become so exshy
cessive as to make the beam unserviceable before this load
is reached Indeed a rational definition would have to be
such as to have the failure load fall within the region
where the load-relative deflection curve bends from its
initial slope to some new slope One possible means of
defining failure in this type of situation is suggested in
ASCE tlOommentary on Plastic Design in Steel(14) and
is perhaps the most rational approach to the problem The
initial slope of the load-relative deflection curve is
multiplied by some constant factor to obtain a new slope
A line having this new elope is then drawn tangent to the
upper portion of the load-relative deflection curve and the
load at which this new slope intersects the initial slope is
taken to be the failure load This is analogous to considershy
ing strain hardening in some simple case where the slope of
the theoretical load-deflection curve in the strain hardening
range is equal to a constant times the initial slope of the
curve when the beam is still elastic If this method is to
be used a method of determining a suitable constant must
be chosen possibly from experiment
The modes of failure of a beam containing a reinforced
opening are expected to be the same as those with an unreinshy
forced opening under both pure bending and bending with shear()
Similarly the load-deflection curves or the load-relative
17
deflection curves would be the same in both cases Thus for
cases of moment gradient the same situation exists for both
reinforced and unreinforced openings where the load continues
to increase past the attainment of the predicted moment
capacity of the section due to strain hardening and the same
difficulty exists for determining failure loads for beams
with reinforced openings as for the unreinforced case
The method suggested in ASCE and described previousshy
ly for determining failure load was adopted for the purposes
of correlating experimental and theoretioal values of failure
load in this study Since the load-relative defleotion curves
for some of the test beams approached a fairly constant slope
in the strain hardening range it was decided to determine
the slopes and constant multiplication factors for these
cases and apply the same factor to all of the test beams
since all were similar It was thus decided to use a value
of thirty times the initial slope for the final slope in
determining experimental failure loads
23 Previous Ultimate Strength Investigations
While considerable theoretical and experimental work
has been done in the determination of elastic stresses around
openings in plates and beams relatively little has been done
ooncerning ultimate strength behavior In 1958 wJworley(12)
18
carried out an investigation of the ultimate strength of
aluminum alloy I-beams containing web openings of various
shapes Rectangular elliptical and triangular openings
were studied with the main objects of the research being
to determine which shape of opening resulted in the smallest
loss of strength and to verify the validity of an upper
bound theorem in predicting the fully plastiC load carrying
capaCity of the test beams The upper bound plastiC theorem
states that of all the possible mechanisms or combinations
of plastic hinges sufficient to cause collapse the one that
ensures collapse at the lowest load is the correct mechanism
under which the member will actually fail Worleys experishy
mental results were in fairly good agreement with the ultimate
loads predicted by the upper bound theorem and were the most
accurate for the case of rectangular openings where hinge
locations were more easily predicted than for the other openshy
ing types Of the various opening shapes tested it was found
that the elliptical opening was the strongest on a maximum
area removed baSiS while the triangular was stronger on a
maximum depth basiS The practical need for these two shapes
especially the triangular is however questionable Worley
excluded the effects of shear and axial force in his analysis
and for rectangular openings assumed a four hinge mechanism
with hinges considered at the corners of the opening
19
In 1963 W-CSo(5) presented a study of large circular
openings in wide-flange beams including an ultimate strength
analysis based on the assumption of a plastic hinge over the
center of the opening Sots analysis however neglected
secondary bending effects due to Vierendeel action in the
vioinity of the opening and also ignored shear yielding
effects in the web The experimental investigation performshy
ed in the ultimate strength range consisted of the testing
of two l4WF30 beams to collapse The first beam was tested
in pure bending so that shear and Vierendeel action were not
present and the ultimate strength predioted by Sos analysis
would be expeoted to be oorreot since the same strength would
be predicted in this case whether or not these effects were
considered Deviation between experiment and theory was 3
The second beam was tested under moment gradient but due to
the relative location of opening and maximum moment (the
beam was simply supported and subjected to a single concenshy
trated load) the beam was expected to and did fail under
the load and not at the opening
S-y Cheng(15) in 1966 considered bending shear and
axial forces in his investigation of the ultimate strength
of extended circular openings in wide-flange beams At high
values of shear a four hinge mechanism was assumed while at
low shears hinges were assumed above and below the opening
20
where the tee section was smallest - similar to the failure
mode in pure bending Stress distributions were assumed at
hinge locations for each case Two l4WF30 beams were tested
to destruction one in pure bending and the other with a
moment to shear ratio of 24 inches which is a high value of
shear for the size beam used While reasonable agreement
between theory and experiment was obtained for both beams
tested an inherent fault in Chengs work lies in its inshy
ability to predict a continuous variation of failure loads
as the shear varies from a low to a high value It is
impossible for the change from a one to a four hinge mechanism
to occur suddenly with only a slight increase in shear
Experiments in the ultimate strength region were performshy
ed by I-C Chen(6) in 1967 on two 14WF30 beams each containing
two large openings in their webs One simply supported beam
containing two 8 inch diameter circular openings spaced 8
inches apart was found to fail in the manner of a be~u conshy
taining only one opening failure being associated with the
opening subjected to the largest moment both being under
the same shear force In the second beam containing two
8x12 inch reotangular openings spaced 4 inches apart the two
openings failed as a unit with four hinges forming at the
outer oorners opoundthe openings and the web between them evenshy
tually buckling No theoretioal ultimate strength analysis
was offered by Chen
21
In 1968 JEBower(16) proposed an ultimate strength
theory for beams containing a single rectangular opening in
their webs A point of contraflexure for Vierendeel stresses
was assumed to occur at the midlength of the opening and
three alternate stress distributions were proposed for
complete yielding of the low moment edge of opening The
first of these stress distributions assumed no Vierendeel
action and was quickly discounted as giving unrealistically
high predictions of strength The two remaining stress
distributions both took into account secondary bending moments
due to shear the first assuming localized web yielding in
shear and the second assuming uniform shear distribution
over part of the web with this area yielding in combined
bending and shear The first of these lower bound solutions
was based on an unrealistic stress distribution and proved
to give unrealistically low predictions of the beam strength
The second lower bound solution which was finally adopted
by Bower was based on a more realistic stress distribution
but was restricted in that the point of contraflexure was
assumed at the midlength of the opening which is not always
the case
Experiments were performed on four 16WF36 beams each
oontaining one rectangular opening as part of this work
Collapse loads are oited for each of the test beams and are
22
compared with predictions from the second lower bound analysis
However since all of the beams were tested at relatively high
ratios of shear to moment considerable strain hardening
would have occurred before collapse and experimental results
which take advantage of the reserved strength due to this
strain hardening (even though accompanied by large deformashy
tions) cannot justifiably be compared to a theory that ignores
this effect
A more general ultimate strength analysis for beams with
rectangular openings was offered by RGRedwood(17) also in
1968 A point of contraflexure was assumed to occur someshy
where within the tee section above and below the opening but
its location was not dictated as in Bowers analysis A
four hinge mechanism was assumed on the basis of previous
tests(13) with stress distributions assumed at both high
and low moment edges of the opening Shear stresses were
assumed carried by the entire web of the section with web
yielding occurring in combined bending and shear
Redwoods analysis was correlated with his previous
experimental investigations and found to be conservative
when shears were large But again the effects of strain
hardening were included in the experimental collapse loads
and not in the theory If the experimental failure loads
could be related to the occurrence of full yielding at the
23
critical sections a more valid comparison with the theory
would result Such a comparison was taken into account by
Redwood in a later paper(la) In this paper failure is defined
in a way similar to that suggested in the previous section
Another recent paper by Redwood(19) deals with beams
containing multiple unreinforced openings in their webs A
method is offered for determining the minimum spacing required
between openings to prevent their interaction and failure
as a unit An analysis is also given for determining the
strength of a member when failure is associated with more
than one opening and this is combined with Redwoods analysis
offered previously(17) for failure associated with only one
opening The theory is compared to the experimental work
performed by Chen(6) in 1967 (7)In 1964 EPSegner Jr conducted an investigation
of several types of reinforcing for rectangular openings
testing six wide-flange beams in four different sizes each
containing two or more openings The openings in five of
the six beams were reinforced each With one of five main
types of reinforcing The openings were positioned at
several different moment to shear ratios and each of the
beams was tested to destruction Unfortunately little can
be said about the performance of the different types of
reinforcing under varying moment-shear conditions because
24
of the large number of variables included in each of the tests
Perhaps Segners most significant contribution is to be
found in his cost comparison of the various types of reinshy
forcing for rectangular openings Estimates cited for six
different fabricators clearly indicate that shear-type reinshy
forCing or reinforcing designed to carry high shear forces
around the opening is economically non-feasible except in
unusual circumstances The most economical type of reinshy
forcing included in this study consisted of two flat plates
bent to fit the shape of the opening and welded inside the
opening with a small gap between them occurring at the midshy
depth of the opening This is the same type as shown in
Figure la Another type of reinforcing included in Segnerts
experimental work but unfortunately omitted from his eco~
nomic comparison consisted of straight horizontal reinforcshy
ing plates welded above and below the opening at the openingis
boundary The plates extended past the vertical edges of the
opening to allow for anchorage of the plate Considerable
welding problems were said to have been encountered by placing
the reinforcing flush with the upper and lower edges of the
opening since the fillet was likely to overrun into the radii
of the re-entrant corners but this could easily be overcome
by leaving a small web stub between the plate and the opening
to allow for welding This type including the modification
25
for welding purposes is that given in Figure lb
Although this reinforcing type was not included in the
economic comparison presented by Segner it would seem to be
of only slightly greater cost than that in Figure la
Approximately the same amount of reinforcing material is
needed for these two types and while the straight bar reinshy
forcing requires more welding it does not require bending
of the plates and eliminates the worry of fit between the
plate bends and the opening radii After giving careful
consideration to the economics and fabrication problems of
reinforcing a rectangular opening in the web of a beam it
was decided to devote the present investigation to reinforcshy
ing of the horizontal straight bar type
24 Scope of the Investigation
An ultimate strength analysis is presented for wideshy
flange beams containing large rectangular openings in their
webs and reinforced with straight bar reinforcing above and
below the openings The investigation includes the effect
on beam strength of variable opening depth to beam depth
opening length to depth reinforcing Size and moment to
shear ratio One lOWF21 and ten l4WF38 beams were tested to
collapse Each of the test beams contained one rectangular
opening centered at the middepth of the beam and ten of the
26
eleven openings were reinforced Deflections were measured
at several pOints for all of the test beams and each beam
was painted with a brittle coating of whitewash in the region
of the opening to obtain an indication of the order of onset
of yielding Four of the test beams were also equipped with
electrical resistance strain gauges at critical sections The
experimental investigation encompassed each of the variables
of the theoretical work
27
CHAPTER III
ULTI1iATE STRENGTH ANALYSIS
31 Assumptions
Based on the discussions in the previous chapters the
following assumptions are made in this analysis of reinforcshy
ed rectangular openings with horizontal reinforcing bars
1 Failure of the member takes place by formation of a four
hinge mechanism with hinge locations being at the corners
of the opening These locations are shown in Figure 7a
a cross-section through the opening being given in Figure
7b
2 A point of contraflexure occurs somewhere within the
length of the tee section Its location is the same
above and below the opening but this location is not
dictated
3 Stress distributions at high and low moment edges of the
opening are those shown in Figure 8b Since the stresses
are antisymmetric with respect to the vertical axis of
the beam only the stresses for the tee-section above
the opening are indicated The resultant forces acting
on the tee-section are shown in Figure 8a
4 Shear stresses are carried only by the web of the teeshy
section and are uniformly distributed across this web at
28
hinge locations when hinges are fully formed While
the shear stress at the boundary of the opening must be
zero this assumption introduces only very slight error
into the theory since these stresses can increase from
zero to their maximum value at a very small distance from
the opening 1 s boundary_ Due to the presence of the reinshy
forcing bar it is likely that most of the shear will be
carried by the region of web between the reinforcing bar
and the flange particularly when the secondary bending
stresses are very high This is further discussed in
Section 34 and introduces no significant error in the
development of this method
5 Yielding in the web occurs lliLder combined bending and
shear according to the von Mises criterion stated in
equation (2) Yielding in the flange and reinforcing is
in direct tension or compression
On the basis of the assumed stress distributions equishy
librium equations can be obtained for the tee-section at
values of the shear force which may vary in some cases
from zero up to the maximum as given by equation (5) At
the high moment edge of the opening section (1) in Figure
Bb stress reversal will occur within the web when the shear
force is relatively low (case I) but will occur within the
flange when the shear force is high (case II) These two
29
cases will be repounderred to as low and high shear conditions
respectively_ Three different locations of stress reversal
are possible under the low stress conditions
1 Reversal in the web stub below the reinforcing This
occurs at very low values of shear
2 Reversal in that portion of the web to which the reinshy
forcing is attached
3 Reversal in the clear web between reinforcing and flange
The range of shear values corresponding to reversal in
this region is very small
At section (2) the low moment edge of the opening for
practical situations reversal will occur only in the flange
32 Low Shear Solution - Case I
Consider equilibrium of the portion of the beam to the
right of Section (2) in Figure 7a Taking moments about
section (2) gives
where V denotes shear force as before F2 is the resultant
force at section (2) and Y2 is the distance from the edge of
the opening to the resultant normal F2bull All other symbols
used in this section and not specifically defined here are
defined in Figures 7 and 8 Taking moments about section (1)
30
for that portion of the beam to the right of this section
yields
(8)
where Fl and Yl are comparable to F2 and Y2 respectively
Equilibrium of the tee-section in Figure 8a requires that
(9)
Oonsideration of the assumed stress distribution at section (1)
for stress reversal occurring in the web stub below the reinshy
forcing ie for 0 =klS ~ u gives on integrating the
stresses
Fl = Af ~yf + SW(1-2~)G + Ar ~yr (10)
FIYl = Af ~ Yf(s~) + ~S2WG(1-2ki) + ArJ yr(u1) (11)
where Af = bt the area of one flange and Ar = q(c-w) the
area of one pair of reinforcing bars Separate yield stress
values are used for flange web and reinforcing because of
the large variation possible in these in a single beam A
discussion of the determination of these stresses is included
in Chapter 5 Yield stresses are designated as ~ yf for the
flange G yw for the web and ~ yr for the reinforcing
31
and ~ the normal stress carrying capacity of the web is
calculated from
t2 _ r- 2 3(V)2 ~ - yw-4sw (12)
and is another way of stating the von Mises yield criterion
given by equation (2) From consideration of the stress
distribution at section (2) for stress reversal in the flange
F2 = Af ltS yf(1-2k2) + sw ~ + Ar c yr (13)
F2Y2 = Al~Yf [S(1-2k2)~(1-4k2+2k~)J -1-s2Wlti +Ar~ yr(u~) (14)
Although explicit expressions for shear and moment capacity
cannot be determined from the above equations it is possible
to obtain from them that portion of the interaction curve
relating combinations of shear and moment at midlength of
opening to cause collapse of the beam for shear values in
the assumed range Consideration of other locations of stress
reversal will yield expressions from which the remainder of
the interaction curve can be determined
Specifically for 0 ~ kls ~ u kl can be determined as
a function of k2 from equations (9) (10) and (13) and is
given by
32
From equations (7) (8) (11) and (14) a quadratic expression
is obtained for k2 in terms of known quantities and V
Z [AfCSyf ] Vak2 (sw cs ) s + t + k2 ( -d+2h) + A G = 0 (16 )
f yf
For a given value of V equations (12) (15) and (16) can be
used to determine the corresponding values of kl and k2bull Fl
can then be calculated from equation (10) and FIYl from equashy
tion (11) The moment at mid1ength of opening is then detershy
mined from
(17)
Thus for a given value of V a corresponding value for M can
be obtained The values of kl and k2 must be checked when
calculated to determine whether initial assumptions of
o ~ k1s ~ u and 0 ~ k2 ~ 10 have been met Only one solution
to the quadratic equation in k2 will fulfill these requireshy
ments unless both solutions are equal The above equations
will yield a value for M for a given value of V starting at
V = 0 and continuing for increments in V until the location
of stress reversal at section (1) moves into the region where
the reinforcing is attached ie for kls gt u When this
occurs neither solution to equation (16) will yield values
of k1 and k2 that satisfy the initial assumptions and the
33
initial equations for stress resultants at section (1) must
be replaced by new equations reflecting this change Quite
simply equations (10) and (11) are replaced by
respectively for u ~ kls ~ (u+q) Equations (13) and (14)
remain unchanged for section (2) since reversal will occur
only in the flange at this section Thus for u ~ klS ~ (u+q)
ie for reversal within the reinforcing equations (9)
(13) and (18) yield
Similarly from equations (7) (8) (14) and (19)
- (d-2h)]
va u 2( c-w) Go s ( c-w) G
+ + [ _----oiOioV] [ yr IJ = 0 (21)AfGyf Af csyf sw cs- + s c-w) csyr shy
The same procedure is followed as in the previous case
first V being assumed ~ being obtained from equation (12)
34
k2 from equation (21) kl from (20) Fl from (18) FIJl from
(19) and finally from equation (17) the value of M correshy
sponding to the assumed value of V Again the values
obtained for kl and k2 must be checked to assure that the
initial conditions of u ~ kls ~ (u+q) and 0 ~ k2 ~ 10 are
met These equations will yield admissible values of kl
and k2 for values of V increasing from the last admissible
value obtained by solution of the previous set of equations
and continuing to where kls reaches the value (u+q) ie
for stress reversal in the clear web at section (1) ~nen
(u+q) ~ kls ~ s equations (18) and (19) are replaced by
(22)
and equations (9) (13) and (22) give
(24)
While from equations (7) (8) (14) and (23)
(25)
35
For a given value of V a corresponding value for M is
determined in the same manner as for the two previous cases
Acceptable solutions will be obtainable as long as the stress
reversal at section (1) falls within the clear web However
when this reversal occurs in the flange the so-called high
shear solution is indicated
33 High Shear Solution -Case 11
When the shear force is high stress reversal at section
(1) occurs in the flange and the equations for resultant
normal force and moment arm from the edge of the opening
become
Fl = Af ltS f(2k -1) - sw~ - A C (26)Y 1 r yr
The stress reversal at section (2) will still occur in the
flange and equations (13) and (14) are used with the above
equations and equations (7) (8) and (9) to obtain
(28)
(29)
36
For a given value of V a corresponding M is obtained from
the above equations and equations (12) and (17)
By starting with a value of V = 0 and increasing this
by a small increment with each successive iteration correshy
sponding values of M can be found for the full range of V
values by use of the equations in this and the previous
section An interaction curve can then be plotted relating
V and M over their full range of values A typical intershy
action curve is shown in Figure 9 for a beam containing a
reinforced opening where the curve has been nondimensionalized
by division of V and M by Vp and Mp respectively Also
indicated in this curve are the four regions corresponding
to the different locations of stress reversal at the high
moment edge of the opening
34 Limits of Interaction Curves
It is quite possible for the MM values for a certainp range of VV values on the interaction curve to be greaterp than 10 as can be seen in Figure 9 This simply means
that the reinforced opening can be stronger than the unperfoshy
rated beam for pure bending and for bending with very low
shear However values of MM greater than 10 have no realp practical significance because in such cases failure of the
beam would occur not at the opening but at some unperforated
37
portion of the beam near the opening Therefore 10 is
taken as the maximum value of MM and a horizontal line isp drawn at this value from the MM axis to intersect thep interaction curve This is shown in Figure 9
The interaction curve is also limited with respect to
the maximum VV value permissible Since shear forces canp only be carried by the remaining part of the web the maximum
plastic shear capacity at the opening is equal to V thep plastic shear capacity of the uncut section times the ratio
of the remaining clear web to the initial clear web This
is written as
d-2t-2h (6)= d-2t
In other words when the web of the section at the opening
has yielded in shear its normal stress carrying capacity
~ becomes zero The value of V at which this occurs can be
determined from equation (12) and the ratio of this shear
value to Vp is given by equation (6) Vmen this limiting
value of shear is reached it is no longer possible to obtain
additional points on the interaction curve because any
further increment in V would yield an imaginary solution for
~ Rather when(VVp)max is reached a line is drawn from
this last point on the interaction curve perpendicular to
38
the vVp axis This line is the final portion of the intershy
action curve and represents the actual limiting value of
This limiting value of VVp is however not always
reached for all practical sizes of beam opening and reinshy
forcing It is possible for the equations in the previous
two sections to yield values of kl and k2 that no longer
conform to initial assumptions (for any position of stress
reversal) at a shear value less than the maximum predicted
by equation (6) This occurred in some of the cases tested
to confirm the consistency of these equations and was found
to be caused by an imaginary solution to the quadratic in k2
occurring while stress reversal at section (1) was still in
the clear web of the section Stress reversal at section (2)
was as assumed in the flange Consideration of other
locations of stress reversal did not give real answers This
condition was then investigated and it was found that because
of an interdependence of opening length and reinforcing area
either the opening length must be less than a given value or
the reinforcing area greater than another value in order
for the interaction curve to be able to pass this region
The limiting half length of opening a is given by
(30)
39
and is obtained by combining equations (7) (8) (14) (23)
and (24) with ~ equal to zero By eliminating small terms
this may be simplified to
(31)
Alternatively the minimum area of reinforcing required is
given by
A =2 ( 32) r 13
If this requirement is met it will be assured that the
maximum shear capacity of the section will be reached
Physically the interdependence of reinforcing area and length
of opening can be interpreted to mean that as opening length
is increased the secondary bending stresses which are a
function of shear and opening length increase at sections
(1) and (2) to such an extent that unless the reinforcing
area is increased so that it can carry these high stresses
the lower portion of the web is forced to carry such high
bending stresses that little or no shear can be carried by
this portion of the web The shear stress can then no longshy
er be considered to be uniform across the entire web of the
tee section but instead is restricted to the clear web
between flange and reinforcing or to a portion of this area
40
Reaching the maximum value of vVas given by equationp
(6) is not a necessity either for the interaction curve or
for the performance of a given beam and opening A given
interaction curve is still correct if it terminates before
reaching this value of vVp This occurs when the MMp value
decreases rapidly for very small increments in vvp and
becomes zero In this case the last portion of the intershy
action curve is very nearly a vertical line This line then
represents the actual maximum shear capacity for the given
beam opening and reinforcing dimensions Only when a beam
is to perform under high shear conditions and it is desired
to develop its maximum shear capacity is it necessary to
ensure that Ar is large enough so that this value can be
reached
41
CHAPTER IV
APPROXIMATE METHOD
41 General Remarks
If a particular beam and opening size is being investishy
gated over a very limited range of shear values it is a
fairly straightforward matter to calculate the moment capacity
of the beam corresponding to the given shear values using
the equations presented in the previous chapter hven if the
location of stress reversal were consistently assumed in the
wrong region the calculations would have to be repeated at
most four times for a particular shear value However it is
quickly realized that for a large range of shear values or
for a complete interaction curve it would be extremely
laborious to perform these calculations by hand and recourse
to automatic computation would seem almost essential A
computer program has been developed to perform the necessary
calculations for a complete interaction curve for a specified
beam opening and reinforcing size and is given in Appendix A
Since the practical development of a complete interaction
curve is seriously limited by the length of calculations
involved a simple to use approximate method is suggested for
determining the strength of a perforated beam at various
moment to shear ratios In the development of this approxishy
42
mate method the high shear region only is considered for
reasons which will become evident
42 DeveloEment of the Method
Combination of equations (3) (12) and (28) result in
the following expression
(33)
where for simplici ty ~I~- - ~Y= ~~ t the specified minimum
yield stress of the material Similarly equations (1) (17)
(26) (28) and (29) can be combined to give
M d(kl -k2) + t(k~-ki) (34) ~ = a-i) + wtf2t)~
Xf
and from equations (12) (28) and (29) kl and k2 are related
by
(35 )
If it is now assumed that the flange thickness is significantshy
ly less than half of the remaining clear web tlaquo s the
above expressions can be readily simplified Since (u+~) is
43
of the same order of magnitude as t it is also assumed that
(u+~) laquo By eliminating small terms and substituting for
kl+k -l-x = ~ equation (35) can be simplified to2 f
(36)
This simple quadratic can readily be evaluated for~ In
general both solutions will be real although for a wide
range of beam and opening sizes investigated the solution
corresponding to a minus in the quadratic formula was found
to fall within the region of low shear on the interaction
curve (as defined in the previous chapter) while the solution
corresponding to a plus consistently fell in the medium to
high shear region thus satisfying the initial assumptions
This latter solution was therefore considered to be the
correct one and the corresponding value for ~is given by A 2as [ 2 ] 12_2s2( r) + w2(s2~) _ 4A2
IS = If f)Af 3 r ( 37 ) - (s2 + 4a2 )
T
which may be rewritten as
_2~(Ar + l(Aw) ( 2h)2 1 ( r 2 ~ C = 1+01 If) 2 If l-er ~ - 16 X)(l+o)~ (38)
where Aw = wd and 0lt = i(~)2(k - 1)2
Equation (34) can also be simplified by eliminating small
44
terms and by considering that for the transition from low to
high shear to occur kl must equal unity Equation (34) then
becomes
M (39 )M= p AW
1 + 4A f
Similarly equation (33) can be simplified to
(40)
For zero or very small values of ~ the above equation can
yield values of VV greater than the maximum VVp value as p
given by equation (6) This implies that some portion of the
shear is carried by the flanges of the beam Since the flanges
can in fact carry some shear and since the theory as given
in Chapter III is sufficiently conservative for large shear
values (as can be seen from the experimental results given
in Chapter VI) equation (40) is not considered to predict
excessive values of shear capacity and is adapted for use in
this method of analysis The shear capacity is then given
by equation (40) and the corresponding maximum M~Ap value at
this shear value is given by equation (39) where ~ is given
by equation (38)
The maximum shear capacity of the section is given by
45
equation (40) when ~ is equal to zero Solution of equation
(38) for Ar when ~ equals zero gives the required reinforcing
area necessary to reach the maximum shear capacity of a secshy
tion This is given by
- AW(l 2h) flA (41)r - T -a-~
Equation (41) reduoes to equation (32) in Chapter III when
substitution is made for ~ When the reinforcing area
conforms to the above requirement the maximum shear capacshy
ityas given by
V 2hr = (I-a-) (42) p
will be reached and the corresponding maximum moment capacshy
ity at this value of shear is given by
Ar 1 - A
M fr= A p 1 + w
4Af Thus for a given beam opening and reinforcing size if
equation (41) is satisfied equations (42) and (43) together
fix one point on the approximate interaction curve while if
equation (41) is not satisfied this point is fixed by equashy
tions (38) (39) and (40) In either case a line is dropped
from this point perpendicular to the vvp axis thus forming
46
part of the approximate interaction curve The remainder of
the curve is obtained by connecting the point given by equashy
tion (42) and (43) or by equations (38) (39) and (40) with
a point on the M~Ip axis corresponding to the maximum moment
capacity of the section This maximum value of blfvl isp simply the plastic moment of the reinforced perforated secshy
tion divided by the plastic moment of the unperforated secshy
tion and is identical to the same point obtained in the
previous chapter with no shear force acting The maximum
value of Mi1p is given by
Z - wh2 + Arlt 2h+2u+q) = ---------w----------shyZ
or using a consistent approximation for Z this can be
rewri tten as
M A (45 ) M=
p 1 + w4Af
An approximate interaotion curve is given in Figure 9 for
comparison with the interaction ourve obtained by the method
desoribed in Chapter Ill
43 Limitations of the AEproximate Method
The maximum praotical M~lp value for the approximate
47
interaction curve is limited to 10 for the same reasons that
the more exact curve is so limited and a horizontal line
drawn from the MA~p axis at 10 and intersecting the approxshy
imate curve forms its upper portion The maximum value of
VVp for the approximate curve is limited to VVp max given
by equation (42) This limitation has been discussed in the
previous section
Equation (41) specifies the minimum size of reinforcing
necessary to reach the maximum shear capacity of the section
as given by equation (42) yVhen the reinforcing area conforms
to this minimum requirement equation (43) is used to predict
the moment capacity of the section corresponding to the shear
value of equation (42) Examination of equation (43) reveals
that as the reinforcing area is increased past the minimum
given by equation (41) the moment capacity decreases rather
than increases as would be expected from physical considershy
ations or from examination of interaction curves obtained
by the methods of Chapter Ill For sizes of reinforcing
only slightly greater than that given by equation (41)
equation (43) will be sufficiently accurate and will not
significantly underestimate the moment capacity of the secshy
tion although it may be deSirable to replace Ar in equation
(43) with the minimum Ar given by equation (41) Equation
(43) then becomes
48
A 2h l1 - ~(l-a)J~
M ( 46)~= A 1 + W
4Af This may be written more simply as
aw 1 - 73Af
= ---1-shyA 1 + w
4Af The corresponding shear value is given by equation (42)
However as Ar increases more and more above the value
given by equation (41) the moment capacity of the section
will be increasingly underestimated and if more accurate
values are desired recourse must be made to more accurate
methods Examination of equation (38) reveals that as Ar
increases past the value given by equation (41) 0 becomes
negative up to the point where
when the solution for cgt becomes imaginary For values of
Ar lying between those given by equations (41) and (48) ~
is negative and equations (39) and (42) can be used to
accurately predict the point on the approximate interaction
curve from which a perpendicular line should be dropped to
the VVp axis and a line drawn to the point given by equation
(44) on the MM axisp
49
Al though for this case a value exists for (gt equation
(42) rather than (40) is used to determine the shear capacshy
ity of the section This is the only logical approach beshy
cause Ar is greater than that required to reach the maximum
shear capacity and increasing the reinforcing area although
it cannot increase the shear capacity of the section past
that given by equation (42) also should not serve to decrease
this capacity
When Ar is greater than the value given by equation (48)
equation (39) cannot be used to obtain a more accurate preshy
diction of moment capacity because 0 as given by equation (38)
will not be real Consideration of the equations used in
deriving the approximate method leads to the conclusion that
will be imaginary only when the maximum shear capacity of
the section is reached while klslaquou+q) Equation (48) shows
the relation between reinforcing area and size of opening for
this to occur It can be seen that small opening size or
large reinforcing size will eause the maximum shear capacity
to be reached while kls (u+q) When this occurs equation
(42) predicts the shear capacity of the section since Ar is
greater than that required by equation (41) to reach this
maximum shear value At this value of shear ~ equals zero
and equations (17) (20) and (21) in Chapter III reduce to
(49a)
(50)
50
A q (5la )
M = _l_l_qdA_rf=--[2_U_2_+__(2_U_+_q_)_+_2_h_(_2U_+_q_)_-_2_(_k_l_S_)2_-_4_k_l_S_h_J_-_~_~_(_~~)
Mp Aw 1 + 1iA
f
By considering t laquo d equations (49a) and (5la) can be further
simplified to
(49)
(51)
Equations (49) (50) and (51) can then be used with equation (42)
to determine the pOint of intersection of the two lines composing
the approximate interaction curve
44 Summary and Discussion
Determination of the approximate interaction curve can be
summarized as follows
Case I
The maximum shear capacity of the section will be reached
if
A 2 AW(l_ 2h) fT (41)r 4 d 4a where a = ~(h)2(~ _ 1)2 The maximum shear capacity is then4 a 2h bull
given by
V (1 _ ~h) (42)Vp =
51
and the moment which can be attained with this shear acting
is Ar
1- ri- = Af (43)
p 1 + w 41f
where Ar is that given by the right hand side of equation (41)
Case 11
If equation (41) is not satisfied the maximum shear
capacity will not be reached and the shear capacity is given
by
(40)
The moment capacity which can be attained with this shear
acting is
1 1 + w
4Af where ~ is given by
A A _ ~( r) + l( w) ( 2h)2 1 ( r)2 0 ( )~ - 1+ltgtlt Af 2 If l-T 1+CgtI - 16 -x (l+olt)l 38
Case Ill
If Ar is significantly greater than that given by equashy
tion (41) the maximum shear capacity will still be given by
52
but if desired a more accurate estimate of the moment which
can be attained with this shear acting can be obtained as
follows
Case IlIA
For (48)
MMp at maximum VVp is given by
Ar 1 - I - ~
~ = __f_~_ ill A
P 1+ w4If
where r will be negative and is given by
(38)
Case IIIB
For A2 gt (aw) 2
+ (~)2w2 (48)r 3 ~
at maximum VV is given byp A A
1+-f(2h)__1_ JL (ha) (2dh ) (1+ 2dh )Af d 2[j Af (51)
A1 + w
4Af
53
where kl and k2 are given by
+l (50)s
(49)
and only that solution satisfying the conditions 0 ~ k2 ~ 10
and u ~ kls ~ (u+q) is correct
The appropriate one of these three cases can be used to
determine a point on the approximate interaction curve A
perpendicular line is then dropped from this point to the
vVp axis and forms part of the curve The remainder of the
curve is obtained by drawing a straight line from the initial
point to a point on the MMp axis given by equation (44) or
(45) and by then cutting off the approximate interaction curve
at the maximum Mlyenip value of 10 as described in the first
paragraph of this section
Complete and approximate interaction curves for each
size of beam opening wld reinforcing included in the expershy
imental part of this investigation are shown in Figures 10
through 15 A cross-section of the member is shovm on each
curve for reference and the method used in obtaining each of
the approximate curves is stated On Figures 11 14 and 15
the reinforcing size was greater than that given by equation
(41) and both Case I and Case III were used to obtain approxshy
54
imate curves for comparison It can be seen that only when
the reinforcing area was significantly greater than that
given by equation (41) (Figure 11) was there a large difshy
ference in the Case I and Case III values
For the partioular case of unreinforced openings by
substituting for Ar equal to zero in equations (39) and (40)
these reduoe to
M AW 2h 1
1 - 2If(l-or~ r= A (52)
p 1 + w4If
v (2h)JTr = I-d~ p
where ~= i(~)2(~ - 1)2 as before These equations are
identioal to those given by R_GRedwood(17) for unreinforced
openings Again a perpendioular is dropped from the point
defined by these two equations to the vVp axis and another
line is dravln from this point to a point on the MMp axis
given by
111 Z - wh2 (54)r = z
p
thus oompleting the approximate interaction curve for the
case of an unreinforoed opening Using the same approxishy
mations as used previously equation (54) oan be written
55
MM = 1 (55) p
which agrees with Redwoods work and gives a slightly highshy
er value for the maximum MM value A complete and approxshyp imate interaction curve for a section containing an unreinshy
forced opening is given in Figure 12 where the equations
given by Redwood(17) were used for the complete curve
56
CHAPTER V
EXPERIMENTAL INVESTIGATION
51 Selection of Test Beams
As discussed in Chapter I it was decided to limit this
investigation to rectangular openings reinforced with straight
horizontal strips welded above and below the opening It
was also decided to use a standard wide-flange beam rather
than a welded section because of the usual use of these in
building structures where openings are most oommonly requirshy
ed ASTM A 36 structural steel was used throughout all
of the experimental work because this material was used in
most of the previous investigations related to this work
The size of the test beams was chosen on the basis of
economy ease of handling and ease with which reinforcing
bars could be welded in place It was decided to use a secshy
tion that was compact at the specified yield stress and
also at the higher yield stresses expected in the test
beams In the selection of test beams only sections with
low depth to thickness ratios were conSidered in order to
avoid the problem of web instability The flange width to
thickness ratio was also kept as low as possible in order to
avoid premature compression flange buckling On the basis
of these considerations and after a preliminary test pershy
57
formed on a 10VF21 section it was decided to carry out the
remainder of the experimental investigation using a 14WF38
section of A 36 steel The properties of the test beams
used are listed in Table 1 A nominal opening depth to beam
depth ratio of 05 was chosen because of the practical need
for openings of approximately this depth in larger beams and
also because investigations of unreinforced openings were in
this range One test beam included in this work had a nominal
opening depth to beam depth ratio of 0643 A basic opening
length to depth ratiO or aspect ratiO of 15 was chosen
again from practical considerations Two beams were includshy
ed with aspect ratios of 20
The corner radii of the opening had to be large enough
to avoid excessive stress concentrations that might cause
premature cracking of the corners and yet small enough to
not appreciably decrease the effective area of the opening
In previous investigations corner radii ranged from 14 to
one inch A 58 inch radius was used in this study for the
14WF38 beams and a 316 inch radius for the 10WF21 beam
The area of reinforcing for each opening was chosen so
that the moment capacity of the unperforated member would be
equalled or exceeded and the full shear capacity of the net
section could be utilized The moment capacity condition
requires that
58
wh2 gt- (56)2h + 2u + q
This follows from equation (44) The reinforcing area reshy
quired to meet the shear condition is given by equation (32)
in Ohapter 111 It was found that for the 14WF38 beam used
in this investigation with 2hd equal to 05 ~~d ah equal
to 15 the area of reinforcing required to meet these condishy
tions was approximately ~vice that given by the right hand
side of equation (56) One beam was tested in the high shear
range with reinforcing such that the interaction curve fell
short of VVp msx Again it should be mentioned that the
length u is that required for welding the reinforcing in
place and should be as small as possible The width of the
reinforcing bars q was chosen so that the width to thickshy
ness ratio did not exceed 85 as specified by the design
code(910) for ultimate strength design The anchorage
length of the reinforcing bars was also designed by use of
the AISC and OISO design codes on the basis of develshy
oping the full strength of the reinforcing bars at the edges
of the opening The ultimate strength loads were taken as
167 times those for elastic design as recommended by the
codes
The openings in all of the test beams were flame cut
the 10WF2l beam number lA having the corners drilled before
59
cutting and then having the rough edges ground to the proper
size Beams numbered 2A 2B and 3A were entirely poundlame cut
including corners and were not poundinished poundurther The remainshy
ing beams had drilled corners with the rest of the opening
being poundlame cut They were not finished poundUrther
All test beams were simply supported and were loaded with
a single concentrated load The openings were positioned so
as to achieve the desired moment to shear ratios and all
openings were centered at the middepth opound the beam All beams
were locally reinpoundorced with cover plates so as to ensure
poundailure at the openings and web stipoundfeners were added under
the load and at reaction points Local reinpoundorcing was deshy
signed on the basis opound resisting the loads predicted by the
interaction curves plus the expected increase in loads above
this due to strain hardening Beam Sizes opening locations
and local reinpoundorcing are shown in Figures 16 17 and 18 poundor
each opound the test beams
52 Experimental SetuE
All beams were tested in a Baldwin-Tate-Emery 400k
Universal Testing Machine which is a mechanically operated
hydraulic testing machine opound 400k capacity The ends opound the
beam were supported by a specially reinpoundorced 14 inch wideshy
poundlange section that also poundormed part of the lateral bracing
60
system This is shown in Figures 19a and 20a Lateral bracshy
ing consisted of support against horizontal displacement and
rotation at pOints of load and at end reactions Bracing
for the beams numbered lA 2A and 3A was achieved by the
attachment of horizontal 8 inch wide-flange beams to the
vertical portion of the end supports with the 8 inch secshy
tions running the entire length of the test beams on each
side and positioned so that pins could be inserted at bracshy
ing points between the 8 inch sections and the top flange of
the test beam to allow for only vertical displacements of the
test beam The pins were given a heavy coating of grease to
minimize friction This type of bracing proved satisfactory
but made it very difficult to see parts of the test beam durshy
ing the test To alleviate this visual problem beam 2B was
tested with the lateral bracing described above on only one
side of the beam while for the other side vertical bars
attached rigidly to the 8 inch sections and bent to pass
over the test beam were held tightly against the upper flange
of the test beam at bracing points This arrangement proved
unsatisfactory and was not used for subsequent tests
For testing the remaining beams short 8 inch wide-flange
sections were attached vertically to the vertical portion of
the end supports and greased pins were used to provide latershy
al bracing at these locations (Figures 19b and 20b) Lateral
61
bracing at the point of load was provided by roller bearings
- two on each side of the test beam spaced 6 inches apart
vertically and bearing against the web stiffener of the beam
The roller bearings were attached to triangular sections
which in turn were attached to a wide-flange section held
rigidly to the laboratory floor See Figures 19c 20c
and 20d This type of lateral bracing provided nearly
frictionless vertical displacement of the beam while preshy
venting rotation and horizontal displacements and proved
to be very effective Access to the beam during testing
was not at all limited by this bracing system
Deflection dial gauges with a least reading of 0001
inch were used to determine deflections at points of load
end supports edges of openings 2 inches outside each openshy
ing edge and at centerline of beam when possible All dial
gauges were rigidly fixed to non-yielding supports Their
positions are indicated in Figures 16 17 and 18 Four of
the test beams were equipped with electrical resistance strain
gauges in the vicinity of the opening The locations of
these gauges are shown in Figure 21 Each test beam was
painted with an opaque brittle coating of whitewash - a
mixture of lime and water of the consistency of light cream
applied in the vicinity of the opening at least one day before
testing During testing this coating of whitewash flaked
62
off in minute pieces in areas undergoing plastic strains thus
indicating visually which sections of the beam had yielded
The flaking occurred at loads higher than those correspondshy
ing to yielding of each section and did not give an accurate
measure of the onset of yielding but instead gave an estishy
mate of the order in which each of the sections yielded
53 Testing Procedure
Essentially the same procedure was followed in testing
each of the beams The beam was first placed in position on
its end supports a fixed roller under one end and a free
roller under the other The bema was made level and centershy
ed with respect to its loading point and end supports
Lateral bracing was then fixed in place and the head of the
machine brought into contact with the specially hardened
roller through vhich the load was applied to the beam Dial
gauges were then put in position and strain gauge leads
connected to the Budd Automatic Strain Indicator A small
initial load was then applied to the beam and zero readings
were taken for all strain and dial gauges
At least four load increments of either lOk or 20k were
applied within the elastic range with all gauge readings beshy
ing recorded for each load increment When the first inshy
elastic response of the beam was noted either from strain
63
gauge readings on the beams that were so equipped or by
deflection vdth time of any of the dial gauges the load
increment was reduced to 5k and after each load increment was
applied all plastic flow was allowed to take place before
readings were taken To determine whether plastic flow had
ceased at each load increment dial gauge readings were plotshy
ted against time When the S-shaped curve reached its upper
portion and levelled out plastic flow had ceased and readshy
ings were taken During this time required for plastic flow
as much as 30 minutes for higher loads it was important to
hold the load on the beam constant Loading continued in
this manner until the ultinlate collapse of the test beam
either by web buckling at the opening or by tearing of one
or more of the openings corners When this occurred the
beam was no longer able to maintain the applied load The
load was then removed and the beam was taken out of the test
frame
54 Determination of Yield Stresses
In order to accurately access the expected strength of
each of the test beams it was necessary to determine their
actual yield stresses This was accomplished by the testing
of tensile coupons cut from the flange ana web of the beams
and from the reinforcing strip used at the openings The
64
dimensions of a typical tensile coupon are given in Figure 22a
and the locations from which such coupons were taken are shown
in Figure 22b The beams from which coupons were to be taken
were ordered an extra 12 inches long so that this section could
be cut off and tensile coupons made and tested before the testshy
ing of the actual beam Reinforcing strip was ordered an extra
36 inches long for the same purpose Test beams 2A 2B and
3A were all cut from the same beam and were all reinforced
from the same reinforcing strip Test beams 2C 2D 3B 4A
4B 5A and 6A were all cut from the same beam Reinforcing
for beams 2C 2D 4A and 4B was all cut from the same strip
Each of the tensile coupons was tested in either a 20k Riehle
or a 20k Instron Testing Machine Coupons tested in the
Riehle machine were tested under nearly constant load rate
An extensometer was attached to the coupons to automatically
record the stress-strain curves Since the crosshead
position could not be fixed on this particular machine
a static yield stress could not be obtained and therepoundore
only the lower yield stress is given in Table 2 Tensile
coupons tested in the Instron machine were loaded at a
constant cross head speed of 002 inches per minute When
the plastiC plateau was reached the crosshead position was
fixed and the load was allowed to drop off After about five
minutes the static yield stress had been reached and no
65
further change in load could be seen on the automatically
recorded stress-strain curve Straining was then allowed to
continue into the strain hardening range A typical stressshy
strain curve for a coupon tested in this machine is given in
Figure 23 Lower yield and static yield stresses are given
for coupons tested in the Instron machine in Table 2
Either the static yield or the lower yield stresses can
be used in determinimg the expected strength of a test beam
depending on which more closely approaches the actual test
conditions of the beam In this investigation the beams
were tested under loading increments with the loads being
held constant until plastic flow had ceased Since it was
thought that the method of obtaining the lower yield stresses
more closely paralleled the actual testing procedure these
stresses were used in evaluating the expected strength of
the test beams
66
CHAPTER VI
EXPERIMENTAL RESULTS
61 Behavior of Beams during Testing
Since the behavior of all the beams during testing was
quite similar a complete description of only one such typshy
ical beam number 20 is given here Deviations from this
typical behavior are discussed at the end of this section
Beam 20 was first tested elastically to a load of 80k
in lOk increments and was then unloaded Strain gauge and
dial gauge readings were taken at each load increment and
were analyzed After it was determined from these readings
that strain gauges and automatic recording equipment were
in good working order the beam was reloaded this time to
be tested to destruction This check was run for only this
one test beam all others being tested continuously through
elastic and plastic ranges
An initial load of 5k was again applied to the beam and
strain and dial gauge readings taken The load was then inshy
creased to 80k in 40k increments (lOk or 20k increments were
used in all other tests because separate elastic tests were
not performed on these) and then to 120k in lOk increments
With the load held stationary a slight increase of deflecshy
tion with time was noted on the dial gauges at this load so
67
increments were decreased to 5k bull
At l30k slight lateral deflection of the beam at the
opening was noted although this deflection never became exshy
cessive throughout the remainder of the test Strain gauge
readings first indicated yielding at both the bottom edge of
the upper reinforcing bar at the low moment edge of the openshy
ing (Figure 21 gauge 25) and at the top edge of the top
flange at the high moment edge of the opening (gauge 17) at
a l35k load When the load was increased to 140k yielding
occurred at the other top edge of the top flange at the high
moment edge of the opening (gauge 19) At a load of 145k
yielding had occurred at the center of the top flange at the
high moment edge of the opening (gauge 18) and also in the
web at the centerline of the opening (rosette gauge 10 11
12) At 155k the web at the high moment edge of the openshy
ing had yielded (rosette gauge 13 14 15) as had the web at
the low moment edge of the upper reinforcing bar (rosette
gauge 4 5 6) Slight displacement between the ends of the
opening could be seen at a load of l60k and at l65k the
lower edge of the upper reinforcing bar at the high moment
edge of the opening (gauge 20) had yielded
At l70k the upper edge of the upper reinforcing bar at
the high moment edge of the opening had yielded (gauge 21)
thus making the yielding at the high moment edge of the openshy
68
ing complete (based on average strain values for the flange
and reinforcing) While at this load the first flaking of
the whitewash was noted at both the upper low moment and
the lower high moment corners of the opening The web at the
middepth of the beam between the low moment ends of the reinshy
forcing yielded at 175k (rosette gauge 1 2 3) and whiteshy
wash flaking was detected on the underside of the top flange
at the high moment edge of the opening At lSOk the web at
the low moment edge of the opening (rosette gauge 7 S 9)
yielded and whitewash flaking occurred along the web immedishy
ately beneath the upper reinforcing bar from the low moment
corner of the opening to beyond the low moment end of the
reinforcing bar and also in the web above and below the
opening At 185k whitewash flaking occurred at the lower
low moment corner of the opening and in the web immediately
above the lower reinforcing bar from the corner of the openshy
ing to the low moment end of the reinforcing bar Yielding
occurred at the center of the top flange at the low moment
edge of the opening (gauge 23) at 190k and also at the top
edge of the upper reinforcing bar at the low moment edge of
the opening (gauge 26) This made yielding at the low moment
edge of the opening complete (based on average strain values
for the flange and reinforcing) At this same load whiteshy
wash flaking occurred in the web above and below the low
69
moment end of the upper reinforcing bar
The first strain hardening was also indicated from
strain gauge readings at the load of 190k and occurred in
the web at the centerline of the opening (rosette gauge 10
11 12) At 195k whitewash flaking occurred in the web
between the low moment ends of the upper and lower reinforcshy
ing bars Yielding occurred at the lower edge of the top
flange at the high moment edge of the opening (gauge 16) at
200k and strain hardening occurred at the upper edge of the
top flange at the high moment edge of the opening (gauge 17)
and at the lower edge of the upper reinforcing bar at the
high moment edge of the opening (gauge 20)
At 211k a crack developed in the lower low moment corshy
ner of the opening and it was no longer possible to maintain
the applied load The beam was then unloaded and removed
from the test frame The crack which occurred at the corner
radius was one half inch long and was inclined toward the low
moment end of the lower reinforcing bar A photograph of this
beam after completion of the test can be seen in Figure 24
Of the remaining beams in the test series only 2D 3B
and 4B were implemented with strain gauges the others having
only the brittle coating of whitewash to indicate the order
of onset of yielding The first of these beams to be tested
lA was given too thick a coating of whitewash and the flaking
70
of this whitewash during testing was not as satisfactory as
on other tests Similar problems were encountered with 2A
which had to be given a second coating of whitewash because
most of the first coat was rubbed off due to improper handshy
ling of the beam before testing The flaking off of the whiteshy
wash on beam 2B during testing was also not as good as was
expected although the whitewash had not been applied too
thickly This beam was tested on an extremely humid day
and it is thought that the problem with the whitewash flaking
was due to this excessive humidity
The order of onset of yielding as indicated by strain
gauge readings is given for each of the strain gauged beams
(20 2D 3B 4B) in Table 3a while the order of onset of
strain hardening is given for these beams in Table 3b Loads
corresponding to complete yielding of the cross-sections are
also given The order of whitewash flaking for each of the
beams is given in Table 4 Ultimate loads are also given
along with the mode of collapse of the beam
Of the eleven beams tested all but one were tested to
collapse The test of beam lA was terminated when deflecshy
tions became excessive although no web buckling or tearing
of corners had occurred and the beam was still able to mainshy
tain the applied load Only one of the beams tested to
collapse ultimately failed by web buckling This was the
beam with the unreinforced opening 6A All of the other
71
beams suffered ultimate collapse by the tearing of one or two
of the corners of the opening Beams 2A 2B 2C 3A 4A 4B
and 5A developed cracks at the lower low moment corners of the
openings Beam 3B cracked at the upper high moment corner of
the opening and beam 2D developed cracks at both the lower low
moment and the upper high moment corners of the opening simulshy
taneously Photographs of each of the test beams after collapse
are shovm in Figure 24 Comparison photographs of the beams for
variable moment to shear ratio reinforcing size aspect ratio
and opening depth to beam depth are given in Figures 25 and 26
62 Stress Distributions and Failure Loads
Based on measured strains stresses were calculated for
beams 2C 2D 3B and 4B Elastic stresses were determined
from the usual elastic theory while plastiC stresses were
determined from plasticity theory presented by Hill(8) and
reduced to the form given by Bower(l6) Initiation of strain
hardening was also determined from this method which is
summarized in Appendix B
Stress distributions at the high and low moment edges
of the opening of beam 2C are shown in Figure 27 while those
at the centerline of the opening and across the flange at the
high moment edge of the opening are given in Figure 28 The
variations in bending stress across the length of the opening
72
at the center of the top flange and at the top of the upper
reinforcing bar are shown in Figure 29 Figure 30 shows the
stress distribution at the high and low moment edges of the
opening for beam 3B and the stress distributions at the high
moment edge of the opening of beams 2D a~d 4B are given in
Figure 31
Experimental failure loads for each of the test beams
were determined from the load-deflection curves for each
test as described in Chapter 11 These curves and their
corresponding failure loads are given in Figures 32 through
42 Interaction curves based on the analysis presented in
Chapter III were dravn for each of the test beams using the
actual measured dimensions and yield stresses for each beam
The experimentally deterrQined failure loads were plotted on
these curves which are given in Figures 43 through 50
Approximate interaction curves for nominal dimensions and
yield stresses are also included in these figures
63 Other Factors
Of the eleven beams tested only one underwent signifshy
icant lateral buckling during testing Beam 2B buckled
laterally at the high moment edge of the opening due to the
inadequate lateral support provided as described in Chapter
V However final collapse of this beam was due to the tearshy
73
ing of one of the corners of the opening and not to the
lateral buckling Also the lateral buckling was not
significant until after the very high loads associated with
strain hardening were reached The modified lateral support
system shown in Figures 19b and c and 20bc and d and discussshy
ed in the previous chapter effectively prevented lateral
buckling of the remaining test beams and no further diffishy
oulties were encountered due to this factor
For each of the test beams lateral deflections were
largest at the high moment edge of the opening although they
never became significant except in the case of beam 2B A
curve showing lateral deflection at the high moment edge of
the opening versus shear force at the opening is given for a
typical test beam 20 in Figure 51 The shear corresponding
to the experimental failure load is indicated on the curve
and the laterally unsupported length of the beam is given
The laterally unsupported length of the test beams did not in
any case exceed the lengths specified by the design codes(9 10)
Local buckling of the top flange occurred at the high
moment edge of the opening for several of the beams tested
although this buckling always occurred at very high loads
after considerable strain hardening had taken place Figure
52 shows the difference in strain readings between the upper
and lower edges of the flange at the high moment edge of the
74
opening versus the shear force at the opening for a typical
test beam 20 The distribution of stresses across the width
of the flange at the high moment edge of the opening (Figure
28b) show a relatively uniform distribution up to yielding
at this location However the effects of local flangebull
buckling can be seen by the considerably higher compression
stresses at the edges of the flange at very high values of
shear
The nine beams containing reinforced openings which were
tested to destruction all exhibited an effect which was preshy
viously unexpected The strain gauge readings for rosette
gauges 1 2 3 and 4 5 6 on beam 20 (Figure 21) as well as
the whitewash flruring on all nine of these beams indicated
widespread yielding of the web between the low moment ends of
the reinforcing bars This effect occurred at loads near the
experimental failure loads of the beams but did not interact
with the development of hinges at the corners of the openings
because of the extension of the reinforcing bars well past
the edges of the openings In addition to the shear yielding
in the web between the low moment ends of the reinforcing
bars the whitewash flaking on beams 2D and 4A also indicated
the same type of yielding occurring at slightly higher loads
in the web between the high moment ends of the reinforcing
bars The whitewash flaking in these areas was sufficient
so that it can be seen in some of the photos in Figure 24
75
The shear yielding that occurs in the web between the
ends of the reinforcing bars may be due at least in part to
the development of the strength of the reinforcing bar withshy
in a short part of its anchorage length Considering the
reinforcing bar in compression above the opening it can be
seen that since its strength must increase from zero at the
ends the unbalanced compression force in the beam causes a
shearing force to occur in the web which at the low moment
end of the reinforcing is additive to the existing shears
(due to the vertical shear force on the beam) below the reinshy
forcing and subtracted from those above This is illustrated
in Figure 53 In the same manner the shears resulting from
the tension in the lower reinforcing bar act in the same
direction as and are added to those in the web between the
reinforcing bars while being subtracted from those in the web
between reinforcing and flange At the high moment ends of
the reinforcing bars the same effect can occur since the top
reinforcing bar is usually in tension while the lower bar is
in compression Again the shears between the reinforcing bars
are increased while those between reinforcing bar and flange
are decreased This would account for the yielding in the web
between the low moment ends of the reinforcing bars for all
of the reinforced beams tested to collapse as well as explaining
76
the yielding in the web between the high moment ends of the
reinforcing bars for beams 2D and 4A
77
CHAPTER VII
ANALYSIS OF RESULTS
71 Order of Onset of Yielding
Comparison of the order of onset of yielding as detershy
mined by strain gauge readings and whitewash flaking in
Tables 3 and 4 indicates that the whitewash flaking is a
reliable method of estimating the order of onset of yieldshy
ing Actually since the strain gauges were only at scattershy
ed locations while the whitewash covered the entire area
around the opening the whitewash flaking is a considerably
more complete guide to the order of onset of yielding It
can also be said that yielding begins first at the corners of
the opening as indicated by the whitewash consistently
flaking first at these locations even though it was impossishy
ble to confirm this by strain gauge readings since gauges
could not be fitted in these locations
The yielding patterns clearly indicate that failure of
the beams occurred by complete yielding of the cross-sections
at the edges of the openings ie at the assumed hinge
locations The formation of hinges at these locations was
accompanied or followed by the shear yielding of all or part
of the web along the length of the opening and by the shear
yielding of the web between the low moment ends of the reinshy
78
forcing bars and in two cases also between the high moment
ends of the reinforcing bars The increase in load past the
formation of the first hinge is accompanied by localized
strain hardening Since the corners of the opening yield
considerably before other locations strain hardening probshy
ably begins at these corners well before the first hinge is
completely formed Yielding in the web above and below the
opening does not seem to become complete until considerable
rotation has occurred at the hinge locations The complete
yielding of the web in these areas would indicate that the
full shear capacity of the member is utilized
72 Stress Distributions
Experimental bending and shear stresses are shown for
each of the strain gauged beams (20 2D 3B 4B) in Figures
27 through 31 Straight lines have been drawn through pOints
representing measured stresses although this does not mean
that the variation is necessarily linear Examination of
each of these stress distributions shows that stresses inshy
creased in proportion to increasing loads while the stresses
were still elastic While in the elastic range the neutral
axis remained in approximately the same pOSition but startshy
ed to move after the first yielding had occurred at each
cross-section This is as would be expected
79
Since strain gauge readings were not available for the
edges of the opening it is impossible to follow the complete
progression of yielding for the various cross-sections from
strain gauge readings However since it is lcnown from the
whitewash flaking on the test beams that yielding occurs
first at the corners of the opening where stress concentrashy
tions are high it can be said that at the low moment edges
of the openings (beams 2C and 3B) yielding began first at the
corners of the opening and then progressed to the reinforcshy
ing bars and web before the flange yielded At the high
moment edges of the openings yielding in the flange occurrshy
ed at lower shear values This would be expected from conshy
siderations of the total stresses (primary bending stresses
plus secondary bending stresses due to Vierendeel action) at
the cross-section in question At the flange the secondary
bending stresses are added to the primary bending stresses
at the high moment edge of the opening but subtract from the
primary bending stresses at the low moment edge of the openshy
ing The experimentally determined stress distributions at
the high and low moment edges of the openings are completely
compatible with those assumed in the development of the
theory in Chapter III (Figure 8) Bending stress distribushy
tions along the length of the opening at the top of the upper
reinforcing bar and at the centerline of the top flange show
80
the expected high stresses at the edges of the opening due
to the secondary bending stresses (Figure 29)
Comparison of stress distributions with those presented
by Bower(16) for beams with unreinforced rectangular openings
shows that the addition of horizontal reinforcing bars above
and below the opening changes the position of the neutral
aXiS but does not alter the location where the highest
stresses occur and plastic hinges consequently form The
order of the onset of yielding is also similar to that
found by Bower as was expected
73 Failure Loads
In Table 5 experimentally determined failure loads are
compared to those predicted by the theory presented in
Chapter III for each of the test be~~s Examination of this
table shows that although the theory may be considered someshy
what conservative in high shear for low shear the correlashy
tion between theory and experimental is good and in no case
did the theory overestimate the actual strength of the beam
Table 6 shows the comparison between experimental failure
loads and those predicted by the approximate analysis for
nominal beam dimensions and yield stresses It can be seen
from this table that the approximate method is less conservshy
ative in the high shear region while still not overestimating
81
the strength of the beam An added margin of safety also
exists because the additional strength of the beam due to
strain hardening has not been taken into account This extra
strength is an added safeguard against total collapse even
though it is accompanied by excessive deformations and finalshy
ly involves tearing or pOSSibly buckling
Experimentally determined failure loads are compared
with loads corresponding to complete yielding of cross-secshy
tions for the strain gauged beams (20 2D 3B 4B) in Table
7 It can be seen from this comparison that experimentally
determined failure loads are close to those corresponding to
the complete yielding of the cross-section at the high moment
edge of the opening while loads corresponding to the complete
yielding of the cross-section at the low moment edge of the
opening are considerably higher This can be accounted for
by the considerable amount of strain hardening that is
suspected of occurring at the corners of the opening before
complete yielding of the low moment edge and possibly also
the high moment edge of the opening occurs Complete yieldshy
ing of cross-sections at the high and low moment edges of
the openings are also compared with the theoretical loads
predicted by the analysis of Chapter III in Table 8 Again
the correlation is reasonably good
The performance of each of the test beams was as expectshy
82
ed With the exception of the shear yielding which occurred in
the web at the ends of the reinforcing bars as discussed in
Section 63 The method used in determining experimental
failure loads has been shown to be justifiable on the basis
of the good correlation between these loads and those correshy
sponding to complete yielding of cross-sections at high and
low moment edges of the opening (considering that strain
hardening has not been taken into account) On the basis of
comparison with experimental failure loads the theory develshy
oped in Chapter III has been shown to adequately predict the
performance of a given beam under varying moment to shear
ratios (although conservatively at high shear) The approxshy
imate method as developed in Chapter IV has been shown to
predict beam strength with accuracy adequate for design
purposes (assuming a suitable factor of safety is used)
14 Influence of Reinforcing and Other Variables
As can be seen from comparison of the experimental
results from test beams 2A 3A and 6A and those for beams 2B
and 3B there is a definite increase in beam strength with
the addition of horizontal reinforcing bars As predicted by
the theoretical analysis of Chapter Ill the maximum shear
capacity of a perforated section as given by equation (6)
can be reached by the addition of a certain minimum amount
83
of reinforcing as given by equation (32) If no reinforcing
or an amount less than that required by equation (32) is used
the maximum shear capacity cannot be reached This is conshy
firmed by the result of the tests on beams 2A 3A and 6A
For higher moment to shear ratios the increase in strength
with increased reinforcing size is adequately predicted by
the analysis in Chapter 111 (and also by the approximate
method of Chapter IV) This is confirmed by the tests on
beams 2B and 3B The increase in strength with the addition
of reinforcing bars and with the further increase in the
size of this reinforcing cen be seen by superimposing the
interaction curves of Figures 10 11 and 12 as has been done
in Figure 54
The influence of the magnitude of moment to shear ratio
on the strength of a beam of given size opening and reinforcshy
ing dimenSions is adequately predicted by interaction curves
generated by the method of Chapter 111 and by the approximate
interaction curves as in Chapter IV This is confirmed by
test series 2A 2B 20 2D series 3A 3B and by series 4A
4B See Figures 55 56 and 57
An increase in aspect ratio everything else being held
constant results in a decrease in strength of the beam This
is predicted by the interaction curves in Figures 10 and 13
which are superimposed in Figure 58 for easy reference and
84
is confirmed by the tests on beams in series 2A 4A and
series 2B 4B An increase in hole depth also has the effect
of lowering the strength of the member all other variables
being held constant This is predicted by the interaction
curves in Figures 10 and 14 which are superimposed in Figure
59 and is confirmed by the tests on beams 20 and 5A
The test results have also been plotted in Figures 54
through 59 but because of the variation in the sizes and
yield stresses of the actual test beams these results have
been plotted on the curves (which are based on nominal
dimensions and yields) on the basis of percent difference
be~veen the experimental failure loads of the test beams
and the values predicted by the exact interaction curves
(from measured beam dimensions and yield stresses)
85
CHAPTER VIII
CONCLUSIONS AND RECOMMENDATIONS
81 Conclusions
On the basis of the results and discussion presented in
the previous chapters the following conclusions can be
drawn
1 The flaking off of the brittle coating of whitewash on
the beams during testing is an accurate indication of
the order of onset of yielding although it does not inshy
dicate at what loads yielding actually occurs
2 High stress concentrations exist at the corners of
rectangular openings even when horizontal reinforcing
bars have been added above and below the opening
3 Failure of a beam under moment gradient containing a
single rectangular opening reinforced with horizontal
reinforcing bars above and below the opening occurs by
the formation of a four hinge mechanism the hinges
occurring at cross-sections at the edges of the opening
Ultimate collapse of such a beam occurs by the tearing
of one or more of the corners of the opening provided
the beam has sufficient lateral support to prevent
lateral buckling
4 With the development of the four hinge mechanism large
86
relative displacements take place between the ends of the
opening accompanied by full or partial shear yielding in
the web above and below the opening This yielding when
it occurs over the entire web area is an indication that
the full shear capacity of the section is utilized
5 Because of the shear yielding that occurs in the web beshy
tween the ends of the reinforcing bars the extension of
these reinforcing bars past the ends of the opening (while
designed on the oasis of developing the weld strength)
should not be less than a certain length (as yet undetershy
mined but probably about three inches for the size beam
and openings tested) due to the possible interaction of
the web yielding with the yielding at the corners of the
opening
6 The stress distributions assumed in the analysis in Chapshy
ter III are completely compatible with those found at the
high and low moment edges of the strain gauged test beams
The large influence of the secondary bending moments (due
to Vierendeel action) is confirmed by these stress
distributions
7 The interaction curve resulting from the analysis in
Chapter III predicts with reasonable accuracy the strength
of a beam with given opening and reinforcing size at any
combination of moment and shear This method is however
87
conservative at high shear values
8 The approximate method developed in Chapter IV also preshy
dicts with reasonable accuracy the strength of a beam
with given opening and reinforcing size for the full
range of moment and shear values and is less conservshy
ative at high values of shear
9 Due to the fact that the theory neglects the effects of
strain hardening there is a built in margin of safety
against complete collapse of the member although an
increase in load past the predicted failure load is
accompanied by excessive deformations
10 The correlation obtained between experimentally detershy
mined failure loads and loads corresponding to complete
yielding of cross-sections at the high moment edge of
the opening for the strain gauged beams suggests that
the method used in determining the experimental failure
loads is justifiable Comparison of experimental failure
loads with loads corresponding to complete yielding of
the cross-section at the low moment edge of the opening
would not be expected to be as good because of the strain
hardening that is assumed to occur at the corners of the
opening before this section is completely yielded
11 The addition of horizontal reinforcing bars above and
below a rectangular opening in a beam definitely increases
88
the strength of the beam If greater than a predictshy
able minimum area this reinforcing will make it possible
to achieve the full shear strength of the section as
given by equation (6) Any further increase in reinforcshy
ing size results in a further increase in the moment
capacity of the member for a given value of the shear
force
12 For a given size beam an increase in aspect ratio (openshy
ing length to depth) results in a decrease in the strength
of the beam over the full range of moment to shear ratios
if all other factors are held constant An increase in
the opening depth to beam depth ratio also has the same
effect all other variables being constant
13 The test performed on beam 6A containing the unreinshy
forced rectangular opening further confirmed the analysis
presented by Redwood(17 18) for beams containing single
unreinforced rectangular openings in their webs
82 Recommendations for Design
Based on the good agreement between experimental results
and failure loads predicted by the approximate interaction
curve it is recommended that the approximate method as
described in Chapter IV be used for design purposes assuming
that a suitable factor of safety is used The ease with
89
which the necessary calculations can be carried out makes
this method extremely practical The use of this method can
be outlined as follows When it is decided to cut an openshy
ing in the web of a beam for the passage of utilities the
necessary size of opening should first be determined and an
approximate interaction curve constructed for the beam conshy
taining an unreinforced opening by using e~uations (52) (53)
and (55) Mp and Vp should be calculated from equations (1)
and (3) respectively A line should then be drawn from the
origin at the particular moment to shear ratio which repshy
resents the actual position of the proposed opening in the
beam and extended to intersect the approximate interaction
curve The intersection of this line with the interaction
curve then represents the capacity of the beam if the openshy
ing is not to be reinforced If this capacity is less than
that required it is necessary to reinforce the opening
and reinforcing should be chosen on the basis of satisfying
the inequality of equation (41) The reinforcing should be
chosen so that the right hand side of equation (41) is not
greatly exceeded An approximate interaction curve for a
beam containing an opening with this size reinforcing can
then be constructed by using equations (42) (43) and (45)
where Ar is given by the right hand side of equation (41)
The intersection of the MV line with this approximate intershy
go
action curve then gives the capacity of the beam with this
size reinforcing If this exceeds the required capacity of
the section this size reinforcing should be adopted
However if the required capacity of the beam is greater
than that given by the approximate interaction curve two
possibilities may exist If the required shear is greater
than the maximum shear capacity of the section as given by
the vertical line on the approximate interaction curve or
by equation (42) then either shear reinforcing must be
added or the depth of the section increased in order to
provide the required strength If however the required
shear capacity is not greater than that given by equation
(42) but the point representing the required capacity of the
beam on the MV line lies outside the apprOximate intershy
action curve the area of reinforcing should be increased
above the value given by equation (48) and a new approximate
interaction curve constructed using equations (42) (45)
(49) (50) and (51) If the required capacity is still
greater than that given by this new approximate interaction
curve the reinforcing size would have to be further increased
until the reinforcing is such that the required strength is
provided The reinforcing size that meets this requirement
should then be adopted for use
91
83 Reoommendations for Future Work
With the completion of this study on the ultimate
strength of beams containing single rectangular openings
reinforced with straight reinforcing bars above and below
the openings it is logical that attention would turn to
similar studies for other commonly used opening shapes in
particular circular and extended circular openings with
horizontal reinforcing bars Also of interest would be an
ultimate strength investigation of reinforced closely spaced
multiple openings of rectangular or circular shape
Since the decision to cut and reinforce an opening in
the web of a beam is based primarily on economic considershy
ations an investigation into reducing the cost of reinshy
forced openings would be very much justified As the cost
of welding is paramount among the other factors involved in
reinforcing an opening reducing the e~mount of welding is
desirable If the horizontal reinforcing bars used in the
present study were doubled in size and welded to only one
side of the web above and below the opening the cost of
reinforcing would be almost halved while the same area of
reinforcing would be available for resisting the shear and
moment forces on the section However other factors such
as twisting moments would have to be taken into conSideration
due to the asymmetry of the section about its vertical axis
92
that would result from this type of reinforcing arrangement
An investigation of the ultimate strength of wide poundlange
sections containing large rectangular openings reinforced
with one-sided straight horizontal bar reinforcing has
already been initiated at McGill University
More information is also needed on the anchorage of the
reinforcing bars It would be desirable to determine at
what length such reinforcing is capable opound assuming its full
load An investigation of the required extension of reinshy
forcing bars past the ends of the opening to prevent preshy
mature poundailure due to interaction between hinge formation
and web yielding at reinforcing ends is also necessary
93
1)
) )J + 1 +1 I I
I
( a) (b)
I + --+--~+ -f--- -shy
I (c) (d)
II I I
I I j+shy
) 1)I l J I
(e) ( f)
Types of Reinforcing
Figure 1
94
primary bending stresses
secondary bending stresses
Stress Distribution at Opening
Figure 2
Ql ID Q)
Jt p ID
er
I I I I I I I
E I I I poundy Ipoundst strain
Idealized Stress-Strain Curve for structural Steel
Figure 3
---------- -----
95
MM unperforated beam no interaction
10~----~==~==~L---------------------~
~
unperforated beam including interaction
10 vVp
Interaction Curve - Unperforated Beam
Figure 4
-- -----------
96
deflection Pure Bending
(a)
~ o
r-I
deflection Bending with Shear
(b)
Load-Deflection Curves
Figure 5
97
1O~------------------------------------------~
l I
unperforated beamshy
shy
I r perforated beam
no interaction
----------- perforated beam l including interaction I I I I I I I I I
I I
Interaction Curve - Perforated Beam
Figure 6
i
98
1 CD (2) TIT
L
( a)
b
d2
(b)
Hinge Locations and Cross-section of Member
Figure 7
99
( a)
(S r CSyr+
tltS ltl direct shear direct shear
Stress Distribution at CD Stress Distribution at CD (for reversal in reinforcing)
Case I - Low Shear
+
CSyr ltS shy
direct shear
Stress Distribution at CD
Case 11 - High Shear
(b)
Stress Distributions and Resultant Forces
Figure 8
100
low highshear shear
I Ml4p k--~_____U_k-----LS_~_(_U_+-=q-)_____-L (u+q)kl s~s
I I r I I
I I I 1 I10
~-int eraction II curve 11
11
11 I I 11 I I
- I - I Iapproximate ~
interaction curve------ - 1
11~I11
i I I
I (d-2h-2t)I_~ I
d-2t 11
(1 -~) q
Interaction Curve Showing Low and High Shear Regions
Figure 9
101
14D38 7 x lof Opening
6 bull77611 x ~middotReinforcing 1 0513
03~
CH 125 1412700
0313 =--9F 0375 =Jb
approximate method ---l------ Case 11
04 vVp
Interaction Curve - 14WF38 Nominal
Figure 10
102
14WF38 7 x 10r Opening 6776 05132tbull
x e 3middot
Reinforcing
1412 11
10
approximate method Case I
04
Interaction Curve - 14WF38 Nominal
Figure 11
103
14WF38 7 x 10f Opening
0513No Reinforcing
MMp
10
-----approximate method for unreinforoed opening
04 VVp
Interaction Curve - 14WF38 Nominal
Figure 12
104
l4WF38 7 x l4~ Opening1pound x tReinforcing
Iapproximate method Case 11
I I I
04
Interaction Curve - l4WF38 Nominal
Figure 13
105
14WF38 9X 13- Opening lmiddotfx p Reinforcing
0513
1412
~-approximate method ~ Case IIIB
approximate method Case I
04
Interaction Curve - l4WF38 Nominal
Figure 14
106
10WF2l
5 x sf Opening 034(iIf x iWReinforcing t~l0240
CH h
55Q 125 990 025Q 0250~
approximate method ~ Case IlIA
approximate method I Case I
I I I
04
Interaction Curve - lOWF2l Nominal
Figure 15
107
43 11 39 18 0 (
I
I I i lA
26
I
111 99 I- middot1 t
22 2-S 45 J
) C
r I
2A
13 ) lA I ~
I)II45 35 ( ()
I
I
I If 2B
f 16~ 9 25 I2t~ 21-+1 1 1 i
30 11 24 27 0- 10- ro- )
I ~ I I
20
2119YlO 151( 21~fI211~ - rr I I
Test Beam Dimensions and
Dial Gauge Looations
Figure 16
108
tI
2D
22tl 231 45 tlI
( l (
I
3A
3119 Yt 11~ 34ft J3n~
45 25 J 35 ) (~ i-
I
I 1 3B
H 25 ft2ft5 cI 16 J2++ I I1 I
t 0- 23 45 J0- 0- (
I 4A
~5 ( 32 J211~ 2 YYt -IIII
Test Beam Dimensions and
Dial Gauge Locations
Figure 17
log
45 ~ 25 5S ) ~ (
4B
2 crYI 15 25 J-I2++ Irr
L J30 24 27 ~lt) (P-L
I 5A
2tYY 13 26211 1 I
22 6
6A
i
Test Beam Dimensions and
Dial Gauge Locations
Figure 18
--
110
If JL
a (1) p 02 ~
Cfl
tlOO ~ r-I 0 0 Q)
m ~ ~
Q SoOM
r-I Xl m ~ (1) p cD H
r-shy
~ ishy fO I- It
111
o N
-()
112
~ --- ~
~
~~ ~~
II I of
rf
A tshyshy I
1
ID I ~ I 0I middotrt
a1 +gt
- -l~ 0 ()
-t I H CJ
4gt 4gt bO ~
~ ~ Cl -rt
fiI
~ a1 ~
+gt CJI
~ amp ~ ~ ~ --- ~ I
II s I
~CJ~ 4t ~
I~ i ~
o
i-~ ~ - l
II I +1 I Ij
~I r
I tf~ft N
- shy
stress 8 1
lower Yield-lt ~i == 11 static yield-shyI l- 2 1 2 ~
( a)
F F-CL F-E [(4 ~
W-H- - shy
strain ( b)
Tensile Coupons Stress-Strain Curve from Instron Testing Machine
Figure 22 Figure 23 I- I- vJ
I
114
lA 2A 2B
20 2D 3A
3B 4A 4B
5A 6A
FIGURE 24
115
2B 20 2D 3A 3B 4At 4B
Variable Moment to Shear Ratio
20 5A
Variable Opening Depth to Beam Depth
FIGURE 25
116
2A 4A 2B 4B
Variable Opening Length to Depth
2B 3B
Variable Reinforoing Size
FIGURE 26
bullbull
117
Notes Shear force shown in kipsbott of flange bull Elastic o Yielded
r ~ 3
o
top of reinf
boundaryof opening bott of reinf~ ioiiIo ~_ 10 o 10 ~ ~ - Dending Stress Shear Stress
Ca) Stress Distribution at High Moment Edge of Opening - 20
~ bull
~ ~ boundary ~ of opening~
-0 I) 10 40 o to lO ~ Sending Stress Shear stress
(b) Stress Distribution at Low Moment Edge of Opening - 20
Figure 27
118
boundaryof opening
-70 0 __ tQ
Bending Stress Shear Stress
Ca) Stress Distribution at Oenterline of Opening - 20
-1iCgt
~I--=-shyoo---~-=-~ogt---- ---0 - ____ A~Sshy-
middot------------e----- ~~~ ~_______~-----Lr---t-o~p~of flangeo
oE
Cb) Bending Stress Distribution Across Flange at High Moment Edge of Opening - 20
Figure 28
119
-40
-lt0 lt----- shylow
moment edge gtgt bull
lt 0
high54 boundary of opening moment
edge ltgtgt
to
Ca) Bending Stress Distribution Across Length of Opening at Top of Flange - 20
high moment
edge
o
Cb) Bending Stress Distribution Across Length of Opening at Top of Reinforcing - 20
Figure 29
120
boundary---~~~~~~~~___ of Opening
o10 D
Bending Stress Shear Stress
(a) Stress Distribution at High Moment Edge of Opening - 3B
ibull
boundaryof opening
10 Igt lO
Bending Stress Shear Stress
(b) Stress Distribution at Low Moment Edge of Opening - 3B
Figure 30
bull bull bull bull
121
11 9 ~ oS j j ~
boundaryof opening
-lt10 -20 lt) -I-Lo Q lO 10
Bending Stress Shear Stress
(a) stress Distribution at High Moment Edge of Opening - 2D
boundaryof openin
-40 -20 0 ZO o 10 ZQ 30
Bending Stress Shear Stress
(b) Stress Distribution at High Moment Edge of Opening - 4B
Figure 31
122
Test Beam - lA
O6in relative defleotion between opening ends
Figure 32
Test Beam - 2A
O6in relative deflection between opening ends
Figure 33
123
lateral buckling - highmoment edge of opening413k-- shy
Test Beam - 2B
O6in relative deflection between opening ends
Figure 34
bull first strain hardening --~ complete yielding - low
moment edge of opening-J- -- --shy
J complete yielding - high moment edge I of opening I ----first yielding
Test Beam - 20
O6in relative deflection between opening ends
Figure 35
124
---- complete yielding - high moment edgeof opening
first yielding
Test Beam - 2D
O6in relative deflection between opening ends
Figure 36
Test Beam - 3A
O6in relative deflection between opening ends
Figure 37
125
k ---shy497 ---~ --1shy complete yieldingI J
---- first yielding
O6in
Figure 38
O6in
Figure 39
- high moment edge of opening
Test Beam - 3B
relative deflection between opening ends
Test Beam - 4A
relative deflection between opening ends
126
430k--shy
k445--shy
---f-----shy ----complete yielding shy
I ----first yielding
06in
Figure 40
O6in
Figure 41
high moment edgeof opening
Test Beam - 4B
relative defleetion between opening ends
Test Beam - 5A
relative deflection between opening ends
127
k45 o-~--
Test Beam - 6A
O6in relative deflection between opening ends
Figure 42
128
10 shy
10WF21
5t x ampf Opening If x t Reinforcing
~~approximate interaction ~ nominal dimensions and
~ ~
+~ ~ ~
I interaction curve ---I Imeasured dimensions and yields I
I I
04
Interaction Curves - Test Beam lA
Figure 43
curve yields
129
14WF38 7 x lot Opening
bull SIt x a Reinforcing
~-----approximate interaction curve nominal dimensions and yields
interaction curve-------- I
measured dimensions and yields
bull
Interaction Curves - Test Beams 2A and 2B
Figure 44
130
l4WF38 f x 10i Opening 11 x middotf Reinforcing
10 - ~approximate interaction curve nominal dimensions and yields
interaction curve----~ measured dimensions and yields
04
Interaction Curves - Test Beams 2C and 2D
Figure 45
10
131
l4WF38 7middotx lof Opening 2f x ~uReinforoing
approximate interaction curve nominal dimensions and yields
~
1 +3A
I interaction curve -------J
measured dimensions and yields
04
Interaction Curves - Test Beam 3A
Figure 46
10
132
14WF38 7 x lOi~ Opening2f x ~ Reinforcing
~ ~approximate interaction curve ~~ nominal dimensions and yields
~ ~ ~ ~ ~
I I
interaction curve ------I measured dimensions and yields
04
Interaction Ourves - Test Beam 3B
Figure 47
10
133
14WF38 H
7 x 14 Opening 1t x Reinforcing
-~
~~approximate interaction curve ~ nominal dimensions and yields
~ ~ +4B
~ ~ ~
~ interaction curve-----l measured dimensions and yields I
I I
04
Interaction Curves - Test Beams 4A and 4B
Figure 48
134
14WF38 9 x 13t~ Opening lix ~uReinforcing
10 --~ ~~approximate interaction curve
nominal dimensions and yields
~ ~
SAl
interaction curve measured dimensions and yields
04 vVp
Interaction Curves - Test Beam 5A
Figure 49
10
135
14WF38 7 x lof Opening No Reinforcing
r----approximate interaction curve nominal dimensions and yields
+ 6A
----interaction curve measured dimensions and yields
04
Interaction Curves - Test Beam 6A
Figure 50
136
shear (kips)
70
60
---- shear corresponding to experimental failure
50
40
30
20
laterally unsupported length = 54 inohes10
40 80 120 160 200 240
lateral deflection (in x 10-3 )
Lateral Deflection at High Moment Edge of Opening - 20
Figure 51
137
shear (kips)
70
60
------------shear oorresponding to experimental failure
50
40
30
20
10
4 8 12 16 20 24 28
strain differenoe at top flange (inin x 10-3)
Flange Buokling at High Moment Edge of Opening - 20
Figure 52
138
D f
P --IL-=====bull--Jf--P + dP
Shear Stresses at End of Reinforcing
Figure 53
139
l4WF38 7 x lot
Opening
3shy10 f ~--2f x e
Reinforcing
If x ~ Reinforcing
+3A +2A
No Reinforcing + 6A
04
Variable Reinforcing Size
Figure 54
140
14WF38 7 x lof Opening If xl-Reinforcing
+ 2B
+20
+2A
+2D
04 vVp
Variable Moment to Shear Ratio
Figure 55
141
14WF38 7x 10f Opening2i x iReinforcing
10 ---------- shy
+3B
+3A
04 vVp
Variable Moment to Shear Ratio
Figure 56
142
14WF38 7x 14~Opening 1f x f Reinforcing
+ 4B
+ 4A
04 vVp
Variable Moment to Shear Ratio
Figure 57
143
14WF38 1thx imiddotReinforCing
7 x lot Opening
7 x 14 Opening---
04
Variable Aspect Ratio
Figure 58
144shy
14WF38
------7middot x 10i Openinglift x ~~Reinforeing
9 x 13f Opening +20 Ii x i Reinforoing
+5A
04
Variable Opening Depth to Beam Depth
Figure 59
--
r b --1 t l=Ii= W
d
u q
Beam Size ~ d b t w 2a 2h u q c x R bull lA 10WF21 43 989 578 0324
11
0244 875 550 N
0260 0253 2720 N
400 316
2A 14WF38 22 1413 677 0496 0326 1046 700 0383 0381 2813 300 58
tI tI If If If tI tf tI It n tI It2B 45
ff 11 It2C 30 1422 668 0490 0305 1045 0267 0368 2720 n tI n tt tI tI n n tI2D 17 If tI n3A 22 1413 677 0496 0326 1046 0383 0381 5313 600
It 11 It If3B 45 1422 668 0490 0305 1045 0329 0361 5230
tf tI 11 tI fI tI tI4A 22 0340 0368 2720 300 If It tI ff If tI If It n4B 45 n n tI tt f1 tI5A 30 1344 901 0305 0371 3770 425
11If fI6A 22 1045 700 shy - - shy Table 1 -I
foo J1
146
Ave Test Coupon Desig- Testing Lower Static Lower Beam
Beam Location nation Machine Yield Yield Yield Series lA web W Riehle 573 - 573 lA
nflange F 362 - 431 nF 435 shy
F-E It 462 shyItreinf R 370 370
2B web W Instron 417 405 413 2A2B W 11 3A412 398
flange F Riehle 374 - 388 F-CL Instron 382 371 F-E It 397 395
reinf Rl Riehle 434 - 437 2D web W Instron 567 550 558 2C2D
rtW 540 527 3B4A 4B5Aflange F 490 474 446 6AItF-CL 418 406
F-E 478 shyIt 2C2Dreinf R6 398 384 398 4A4B
3A web W 11 411 shyfIflange F 398 379
reinf R2 Riehle 440 shyfI3B reinf R4 330 - 331 3B
R4 11 332 shyR4 Instron 332 shy
4A web W 565 549 flange F 11 487 476
F-CL 406 398 nF-E 429 415 5A reinf R5 tI 437 429 444 5A
R5 450 422 It6A web W 559 545 Itflange F 463 450 fIF-CL 408 402
F-E ff 438 425
Tensile Test Results
Table 2
147
Beam 20 2D 3B 4BLocation Top edge upper fl - BM edge 450K 575K 433lC 300
Bott upper reinf - LIvI edge 450 500 400 317 ~ top upper fl - BM edge 483 600 367 317 Web - ~ open 483 500 517 450 Web - BM edge 517 550 400 350 Web - LM end of upper reinf 517 - - -Bott upper reinf - BM edge 550 550 500 350 Top upper reinf - BM edge 567 800 467 433 ~ web - between LM ends reinf 583 - - shyWeb - LM edge 600 - 583 shy~ top upper fl - LM edge 633 - 600 shyTop upper reinf - LM edge 633 - 467 500 Bott edge upper fl - BM edge 667 - 517 383 Complete yield - BM edge - 567 625 483 383 Complete yield - LM edge 633 - 600 shy
(a) Shear Values Corresponding to Yielding
Location Beam 2C 2D 3B 4B
Top edge upper fl - BM edge 667k 775
k 567k 483k
Bott upper reinf - LM edge - 800 583 -~ top upper fl - BM edge - 775 533 -Web - ~ open 633 700 583 -Web - EM edge - 750 - -Bott upper reinf - BM edge 667 775 - -
(b) Shear Values Corresponding to Strain Hardening
Table 3
- - - - - - -
- - - - - - - - -
- -
BeamLocation Upper fl - BM edge Lower fl - BM edge Lower LM corner open Upper LM corner open Lower BM corner open Upper ID~ corner open Web above open Web below open Low Uif corner to end reinf Up n~ corner to end reinf Low IDH corner to end reinf Up rIM corner to end reinf Between ends reinf LM end Between ends reinf HM end Upper reinf - BM edge open Lower reinf - BM edge open Upper reinf - ilA edge open Lower reinf - LM edge open Lateral buckling - BM edge Web buckling at open Tearing - lower LM corner Tearing - upper BM corner
lA 2A 2B 20 2D 3A 3B ~ lI Ilt v 162 500 400 583 700 525 433
180 - - - 725 - 517 191 550 417 617 600 550 567 191 575 442 567 575 600 433
- 575 467 567 575 600 433
- 575 - - 600 600 shy202 625 475 600 600 700 533
- 625 475 600 625 700 583
- - - 617 700 - 550
- - - 600 675 675 550
- - - - - 675 shy
- 600 458 650 675 650 583
- - - - 725 - -- - - - - 725 -- - - - - 675 -- - - - - - -- - - - - 675 shy- - 483 - - - shy
- 700 517 703 825 775 shy- - - - 825 - 600
4A 4B Ilt Ilt
450 333 500 417 450 367 450 366 500 383 450 417 550 483 600 483 550 400 550 433 625 shy625 shy575 467 575 shy500 shy550 417
- 450 500 383
--675 513
5A le
350 500 400 400 433 483 433 467 500 417
--
500
--
467 500
---
517
-
6A
400 533
-367 367 383 433 533
-----------
550
--
Shear Values Corresponding to Whitewash Flaking
J-ITable 4 ~ 00
149
~hear a1 Beam Size MV [Failure Vp Exp VVp Theor VV_ Diff
lA 10WF21 43 180K 746K 0241 0235 + 26 2A 14WF38 22 532 1L021 0520 0466 +116 2B 11 45 413 0404 0363 +113 2C If 30 548 1301 0421 0403 + 45
u n2D 17 670 0515 0420 +226 n3A 22 575 1021 0562 0466 +206 tt3B 45 497 1301 0382 0345 +107 11 n4A 22 572 0440 0360 +222 n4B 45 430 0330 0295 +119 If It5A 30 445 0342 0296 +155 116A 22 450 0346 0271 +277
Correlation Between Experiment and Theory
Table 5
~hear at Approximate Beam Size MV Failure Exp VV Theor VV DiffVp p p
lA 10WF21 43 180K 746 K
0241 0254 - 51 2A 14VlF38 22 532 1021 0520 0503 + 34
It2B 45 413 0404 0344 +175 If2C 30 548 1301 0421 0414 + 17
It2D 17 670 0515 0505 + 20 3A 22 575 1021 0562 0505 +103
n3B 45 497 1301 0382 0377 + 13 4A tI 22 572 n 0440 0463 - 50
It It 03094B 45 430 0330 + 68 5A 30 445 tr 0342 0353 - 31 6A 22 450 tt 0346 0257 +346
Correlation Between Experiment and Approximate Theory
Table 6
150
Shear at Shear at Shear at Beam MV Failure Full Yield Dif Full Yield Dif
Exp H M Edge L M Edge k k k2C 30 548 567 + 35 633 +155
2D 17 670 625 - 67 - shy3B 45 497 483 - 28 600 +207 4B 45 430 383 -109 - shy
Correlation Between Experimental Failure and Complete Yielding
Table 7
Theor Shear at Shear at Beam MV Shear at Full Yield Dif Full Yield Diff
Failure H M Edge L M Edge
2C 30n 525k 567k + 80 633k +206 2D 17 546 625 +145 - shy3B 45 449 483 + 76 600 +336 4B 45 384 383 - 03 - shy
Correlation Between Theoretical Failure and Complete Yielding
Table 8
151
APPENDIX A
Computer Program for Interaction Curve
A computer program was developed to generate an intershy
action curve for a specified beam opening and reinforcing
size according to the method described in Chapter Ill The
program was wri tten in Fortran IV and can be used on any
standard digital computer that makes use of this language
The input for the program should be of the form given in
the following table
Data Number Items on of Cards Data Cards
Number of beams 1 NB
Dimensions of beams NB dbtw
Yield Stresses NB CS111 S~ lts
Number of openings per beam NB NE
Sizes of openings NH ah
Number of reinforcing sizes per opening NH NR
Sizes of reinforcing NR uqc
A listing of the computer program is given on the following
pages
152
C THIS PROGRA~ CO~PUTES ThE INTERACTION CURVE RELATING MOMENT AND C SHEAR VALUES WHICH CAUSE FAILURE OF A WICE FLANGE bEAM CONTAINING C A REINFORCED RECTANGULAR OPENING AT ThE MIDOEPTH C
REAL KlK2MPMMPKllK12K21 t K22 581 FORMAT(5FIO3) 584 FORMAT(3FIO3) 582 FOR~AT(2FIO3) 583 FORMA1(I5 681 FORMAT(lINTERACTION
lOt 0 B T 682 FORMAT( F133F63 683 FORMAT(O SIGF 684 FORMAT( 5F93
BETwEEN MOMENT AND SHEARtw)
SIGw SIGR VP Mpt)
605 FORMAT(O OPENING LENGTH middotF73middot HEIGHT =F73) 606 FORMAT(O MMP VVP SIG 601 FORMAT( middot5FI04 608 FORMATOV IS TOO LARGE SO SIGMA BECCMES 609 FORMATtOHIGH SHEAR SOLUTION) 611 FORMAT(O U QC) 612 FORMATe 3F63) 613 FORMAT(O STRESS REVERSAL IN REINFORCING 614 FORMATOSTRESS REVERSAL IN CLEAR WEe 615 FORMAT(O STRESS REVERSAL IN WEB STUB) b16 FORMAT(OLOW SHEAR SClUTIONt) 618 FORMATtO MAxIMU~ VVP Fb3)
c READ(S583)NB 00 200 I=lNB RE~D(5581tOBTW
READ(5584)SIGFSIGWSIGR VP=W(0~2T)SIGWSQRT(3) MP=BTSIGF(D-T bullbullW(D-2Tl2SIGW4 WRITE(6681) WRITEI6682)DtB t TW WRITE(6683) WRITE(~684)SIGFSIGWSlGRVPtMP
REAO(SS83)NH DO 200 ~=lNH
RE~D(5582JAH
REAC5583) NR A2=2A H2=2H WRITE(6605)A2H2 VVPM=(O-2T-2H)0-2T) WRITEt6618) VVPM CO 200 J=lNR READ(5584) UQC
Kl K2~)
COMPLEXJ
153
WRITE(661U WRITE(661Z) UQC WRITE(6606) VINCR=OO V=OO S=OZ-H-T AW=SW Af=BT AR=(C-WjQ R=U+Q
C C LOW SHEAR SOLUTION C C STRESS REVERSAL IN WEB STUB C
WRITE(66161 WRITE(661S)
101 V=V+VINCR XX=$IGWZ-O7SV2AW2 IF(XX) 201]00300
300 SIG=SQRT(XX) ALPHA=ARSIGR(AFSIGf BETA=AWSIGCAfSIGf) Cl=T+SBETA C2=-(D-2HJ C3=VAAFSIGF) C4=C22-40ClC3 IF(C4408399399
399 K21=(-C2+$QRT(C4)(2Cl K22=(-C2-SQRTCC4raquo)(2Clt Kll=K21BETA KI2=K22BETA IF(K21)330301301
301 IFK21-10)30230233C 302 IFCKll1330304304 304 IFKllS-U)320320330 330 IF(K22)408)31331 331 IF(K22-10)33233Z40a 332 IF(KIZ)408333333 333 IF(K12S-UJ32132140S 320 K2=K21
Kl=Kl1 GO TO 322
321 K2K22 Kl=K12
322 FY=AFSIGF(S+T2)+AWSIGSS(1-2Kl2)+ARSIGR(U+Q2) F=AFSIGF+AWSIG(1-2Kl+ARSIGR M=2FY+20HF-VA
154
MMP=MMP VVP=VVP WRITE(6607)MMPVVPSIGKlKZ VINCR=VP500 GO TO 101
C C STRESS REVERSAL IN REINFORCING C
408 WRITE(6613 GO TO 409
902 V=Vl 701 V=V+VINCR
XX=SIGW2-015V2AW2 IF(XX9011CQ100
100 SIG=SQRTXX) 409 Rl=(C-W)SIGR
R2=AWSIG+SRl Cl=T+SAFSIGFRZ C2=2SURIR2-(D-2HJ C3=VA(AFSIGF)+U2Rl(AFSIGFraquo)(SR1RZ-1) C4=C22-40C1C3 IF(C4)418403403
403 K21=(-C2+SQRT(C4)(Z0Cl KZ2=-C2-SQRT(C4)(Z0Cl) Kll=AFSIGFK21R2+URlR2 K12=AFSIGFK22R2+URIR2 IF(K21)430401401
401 IF(K21-10)4C240243C 402 IF(K11S-U)430404404 404 IF(Kl1S-R)42042043C 430 IFK22)418431431 431 IF(K22-10)432432418 432 IF(K12S-U418433433 433 [FtK12S-R)421421418 420 K2=K21
K l=K 11 GO TO 422
421 K2=K22 Kl=K12
422 FY=AFSIGFtS+T2)+AWSIGSS(1-2Kl2) 1 +(C-W)SIGR(U2+UC+SQ2-(KlS)2)
F=AFSIGF+AWSIG(I-2Kl)+(C-WJSIGR(2U+Q-2KlS) M=20FY+20HF-VA ~MP=MMP
VVP=VVP IF(MMP 418423423
423 WRITE(6601)MMPVVPSIGKlK2 VINCR=VP500
155
GO TO 701 C C STRESS REVERSAL IN CLEAR WEB C
418 WRITE(6614) GO TO 419
922 V=Vl 801 V=V+VINCR
XX=SIGW2-075V2AW2 IF(XX)921800800
800 SIG=SQRT XX) 419 Cl=AFSIGFS(AWSIG)+T
CZ=-O+2H-2SARSIGR(AWSIG) C3=VACAFSIGF)+2U+Q2)ARSIGR(AFSIGF)
1 +S(ARSIGR2fAFSIGFAWSIG C4= C224 ClC3 IF(C4)428410410
410 KZl=(-C2+SQRTCC4)(ZCl K22=(-C2-SQRTCC4)ZC1) Kll=AFSIGFK21(AWSIG)-ARSIGR(A~SIG)
K12~AFSIGFK22(AWSIG)-ARSIGRAWSIG)
IF(K21)S30501501 501 IFK21-10)502502530 50Z IF(KllS-RS30504504 S04 IF(Kll-l0S20520510 530 IFtKZ2)428531531 531IF(K22-10)532532428 532 IF(K12S-R428533533 533 IF(K12-10)521S21428 520 1lt2=K21
Kl=Kl1 GO TO 522
521 1lt2=K2Z Kl=K12
522 FY=AFSIGF($+T5+AWSIGS(i-2bullbullKl212-ARSIGR(U+Q2) F=AFSIGF+AWSIG(1-2Kl-ARSIGR M=2FY+2HF-VA MMP=MMP VVP=VVP IF (MM P) 428523523
523 WRITE(6601)MMPVVPSIGKlK2 VINCR=VP 500 GO TO 801
c C HIGH SHEAR SOLUTION C
428 WRITE(oo09) GO TO 352
156
2 V=Vl 4 V=V+V INCR
XX=SIGW2-015V2AW2 IF(XXJI0235D350
350 SIG=SQRHXX) 352 AlPHA=ARSIGR(AfSIGf
BETA=AWSIG(AfSIGf) 429 02=-10-BETA-AlPHA
03=05VA(AFSlGFT)+AlPHA+8ETA+O5(AlPHA+8ETA)2+OS8ETAST 1 +AlPHA(U+Q2IT-CD-2H(AlPHA+8ETA)O5T
04=D22-403 IFCD4)102351351
351 K21=(-D2+SQRTID4raquo2 K22=(-D2-SQRT(04112 Kll=1O+8ETA+AlPHA-K21 K12=10+BETA+AlPHA-K22 IFCK21630601601
601 IF(K21-10602~0263C
602 IF(Kll)630604604 604 IFIKll-10)62062D63C 630IFCK22)102631o31 631 IFIK22-10)632632102 632 IF(K12)102633633 633 IF(K12-10)621621lC2 620 K K21
Kl=Kll GO TO 622
621 K2=K22 Kl=K12
622 FYPT=Kl(D-2H)-TKl2-(S+ST) FY=AFSIGFFYPT-AWSIGS2-ARSIGRlU+Q2bullbull F=AFSIGfC2KI-l-AWSIG-ARSIGR M=20FY+20HF-VA MMP=MMP VVP=VVP IF(MMP) 102623623
623 WRITE(6607)MMPVVPSIGKlK2 VINCR=VPIOO GO TO 4
102 V I=V-VINCR VINCR=VINCRIOO VIMIN=VPI00DOO IF(VINCR-VIMIN) 19922
901 Vl=V-VINCR VINCR=VINCR200 VIMIN=VPIOOOO IF(VINCR-VIMIN)199902902
c
C
157
921 V1=V-VINCR VINCR=VINCRI200 VIMIN=VPI10000 IF(VINCR-VIMIN)199922922
199 CONTINUE GO TO 200
201 CONTINUE WRITE(b608)
200 CONTINUE RETURN END
158
APPENDIX B
Plasticity Relationships
In the elastic range stresses were computed from measured
strains by the usual elastic theory The values used for the
modulus of elasticity E and the shear modulus Gtwere 29OOOksi
and 11200ksi respectively When local yielding had occurred
according to the von Mises criterionas stated by equation (2)
Chapter 11 stresses were then computed by the plasticity
relations given by Hill(8) and reduced to the form given by
Bower(16) These relations are stated here for easy reference
Plasticity relations for a Prandtl-Reuss solid yield
dE = des _ ~(d)+ 2G dt (a)xT3Gt~xy
where E x is strain in the longitudinal direction and l$ xy
is the shearing strain Eliminating ~ by use of the von
Mises criteria gives
(b)
Since explicit integration of equation (b) would be
extremely difficult the equation is diVided by dE-x and the
derivatives d tSd E and d 6 yld poundx are replaced byx x
159
(c)
( d)
where~i and ~XYi are the bending and shearing stresses
respectively corresponding to ~ and ~f and ~xYf are
these stresses corresponding to poundx + 6 (x
Substituting equations (c) and (d) into equation (b)
gives
A~x - B6~ + AtS cs = AY l (e)
f
where (f)
and ( g)
The shear stress corresponding to a change in strain is given
by
2 2 ~ =Jcsy - CS f (h)
f [3
In order to determine whether strain hardening had occurred
an equivalent strain Xp was computed from
160
where lIE Xl ~yp Ezp and xyp are the plastic components of
strain and are given by
~ xp = poundx-t ( j)
Eyp = E yy (S
- i (k)
E (1)poundzp = z -~ (m)xyp = 6xy -
~
~
The constant volume condition was used to calculate ~ zp
(n)
The equivalent strain was compared to a reference strain
~ pr computed from the value for ~p for the onset of strain
hardening for a tensile test The strain hardening strain
was taken as euro x and it was assumed that E = poundoz For yy
A36 steel the strain hardening strain was taken as 115 ~yIE
and ~y was determined from a tensile test of a coupon from
the web of the test beam Strain hardening was considered
resent J f 6 gt or J P degpr-
The above relationships were included in a paper
presented by Bower(16) in 1968
161
BIBLIOGRAPHY
1 Muskhelishvili NISome Basic Problems of the Mathematical Theory of ElasticityU 2nd Edition P Noordhoff Itd 1963
2 HelIer SR Jr Brock JS and Bart R The itresses Around a Rectangular Opening with Rounded Corners in a Beam Subjected to Bending with Shear Proceedings Vol 1 Fourth U National Congress on Applied Mechanics Berkeley Calif 1962
3 Bower JE ItElastic Stresses Around Holes in WideshyFlange Beams Journal of the Structural Division ASCE Vol 92 No ST2 Proc Paper 4773April 1966
4 BowerJE Experimental Stresses in Wide-Flange Beams with Holes tl Journal of the Structural Division ASCE Vol 92 No ST5 Proc Paper 4945October 1966
5 So WC The Stresses Around Large Circular Openingsin the Webs of Wide-Flange Beams MEng Thesis McGill University Aug 1963
6 Chen IC tiThe Stresses Around Two Large Openings in the Webs of Wide-Flange Beams MEng Thesis McGill University Aug 1967
7 Segner EP Jr Reinforcement Requirements for Girder Web Openings Journal of the Structural Division ASCE Vol 90 No ST3 Proc Paper3919 June 1964
8 HillR The Mathematical Theory of PlastiCityClarendon Press Oxford University Press London 1950
9 Handbook of Steel Construction Canadian Institute of Steel Construction OntariO 1967
10 ltSpecifications for the DeSign Fabrication and Erection of Structural Steel for Buildings AISC 1963
11 Basler K Strength of Plate Girders in Shear Journal of the Structural Division ASCE Vol 87 No ST7 Proc Paper 2967 October 1961
162
12 Worley WJ Inelastic Behavior of Aluminum AlloyI-Beams With Web Cutouts University of Illinois Engineering Experimental Station Bulletin No 448 April 1958
13 Redwood RG and McCutcheon J 0 Beam Tests with Unreinforced Web Openings Journal of the Structural Division ASCE Vol 94 No ST1 Proc Paper5706 Jan 1968
14 nCommentary of Plastic DeSign in Steel ASCE Manual of Engineering Practice No 41 1961
15 Cheng SY flAn Investigation of Large Extended Openingsin the Webs of Wide-Flange Beams MBng Thesis McGill University Aug 1966
16 Bower JE Ultimate Strength of Beams with RectangularHoles Journal of the Structural Division ASCE Vol 94 No ST6 Proc Paper 5982 June 1968
17 Redwood RG Plastic Behavior and Design of Beams with Web Openings ff Proceedings of the Canadian Structural Engineering Conference Canadian Institute of Steel Construction Toronto Feb 1968
18 Redwood RG The Strength of Steel Beams with Unreinshyforced Web Holes Civil Engineering and PubliC Works Review Vol 64 No 755 London June 1969
19 Redwood RG Ultimate Strength Design of Beams with Multiple Openings Proceedings of the Structural Engineering Conference American Society of Civil Engineers Pittsburgh October 1968

xi
LIST OF TABLES
Page
1 Beam Properties 145
2 Tensile Test Results 146
3a Shear Values Corresponding to Yielding 147
3b Shear Values Corresponding to Strain Hardening 147
4 Shear Values Corresponding to Whitewash Flaking 148
5 Correlation Between Experiment and Theory 149
6 Correlation Between Experiment and Approximate Theory 149
7 Correlation Between Experimental Failure and Complete Yielding 150
8 Correlation Between Theoretical Failure and Complete Yielding 150
SUJn1[ARY
ACKNOWLEDGEMENTS
NOTATION
LIST OF FIGURES
LIST OF TABLES
TABLE OF CONTENTS
Page
ii
iii
iv
vii
xi
CHAPTER I INTRODUCTION
11 General Background 1
12 Types of Reinforcing 2
13 Elastic and Ultimate Strength Analysis 4
CHAPTER 11 ULTINfATE STHEUGTH BEHAVIOR
21 Behavior of Unperforated Beams 8
22 Behavior of Beams with Web Openings 12
23 Previous Ultimate Strength Investigations 17
24 Scope of the Investigation 25
CHAPTER III ULTIMATE STRENGTH ANALYSIS
31 Assumptions 27
32 Low Shear Solution - Case I 29
33 High Shear Solution - Case 11 35
34 Limits of Interaction Curves 36
CHAPTER IV APPROXIMATE METHOD
41 General Remarks 41
42 Development of the Method 42
43 Limitations on the Approximate Method 46
44 Summary and Discussion 50
Page CHAPTER V EXPERIMENTAL INVESTIGATION
51 Selection of Test Beams 56
52 Experimental Setup 59
53 Testing Procedure 62
54 Determination of Yield Stresses 63
CHAPTER VI EXPERIMENTAL RESULTS
61 Behavior of Beams during Testing 66
62 Stress Distributions and Failure Loads 71
63 other Factors 72
CHAPTER VII ANALYSIS OF RESULTS
71 Order of Onset of Yielding 77
72 Stress Distributions 78
73 Failure Loads 80
74 Influence of Reinforcing and Other Variables 82
CHAPTER VIII CONCLUSIONS AND RECO~Th1ENDATIONS
81 Conclusions 85
82 Recommendations for Design 88
83 Recommendations for Future Work 91
FIGURES 93
TABLES 145
APPENDIX A Computer Program for Interaction Curve 151
APPENDIX B Plasticity Relationships 158
BIBLIOGRAPHY 161
1
CHAPTER I
INTRODUCTION
11 General Background
It has become common practice to cut openings in the
webs of beams to permit the passage of utility ducts By
passing these utilities through rather than under the beams
the height of each floor in a building can be reduced thereshy
by effecting a considerable saving in cost particularly in
the case of multistorey structures However cutting an
opening in the web of a beam may considerably reduce the
strength of the beam in the vicinity of the opening If
the opening is located at some position in the beam where
stresses are low this may cause no special problems but
if it is located in a high stress region the designer is
faced with the problem of finding an economioal way to inshy
crease the strength of the beam so that failure will not
result at the opening under working loads
Two alternate approaches are possible in this case
The size of the entire member in question may be increased
on the basis of providing sufficient strength at the openshy
ing so that failure will not ocour The other approach is
to reinforce the original member in the vicinity of the
opening so that the loads can be carried without inducing
2
high stresses The size of the member itself then need not
be increased
Just as the decision whether to pass utilities through
rather than under floor beams must be based primarily on
economic considerations the decision whether to reinforce
an opening or increase the size of the entire member when
the opening is located in a high stress region must also be
based on economics Since many methods of reinforcing an
opening are possible the relative costs and effects of each
type of reinforcing deserve consideration
12 Types of Reinforcing
Reinforcing for an opening in the web of a beam may be
of three basic types
1 reinforcing to resist high bending stresses and low shear
stresses
2 reinforcing to resist low bending stresses and high shear
stresses
3 reinforcing to resist both high bending and shear stresses
Two examples of the first type are illustrated in Figures
la and lb By increasing the areas of the sections above
and below the centroid they provide additional moment
resisting capacity to the section However since shear
stresses are considered to be carried only by the web of
the section this type of reinforcing cannot increase the
3
shear capacity above that given by the shear capacity of
the uncut section times the ratio of the net web area at
the opening to the initial web area of the beam Reinforcshy
ing types to resist high shear stresses are those that
increase the web area so that more web is available to
resist these stresses Web doubler plates as shovm in
Figure lc are typical of this type of reinforcing although
their use is usually very limited due to welding difficulties
This type of reinforcing also increases moment capacity by
increasing the area above and below the opening Another
type of shear reinforcing uses vertical or inclined web
stiffeners to carry the shear forces past the opening A
typical arrangement of inclined web stiffeners is shown in
Figure Id The third type of reinforcing is essentially a
combination of the first two examples of which can be seen
in Figures le and If The area above and below the opening
is increased to give added moment capaCity and the effective
web area is increased by the addition of vertical or inclined
shear plates to provide added shear capacity to the section
A combination of the reinforcing arrangements in Figures la
and Id would be another example of this type Many other
arrangements of web opening reinforcing are pOSSible but
those shown in Figure 1 and mentioned above are typical of
the three main types
Since the problem of cutting and reinforcing an opening
4
in a section is basically one of economics the cost of the
process of reinforcing an opening must be considered This
cost may be divided into three parts the cost of supplying
and cutting the material to be used in reinforcing the openshy
ing that of bending and fitting this material and welding
this material into place Since the cost of welding is
paramount among the several expenses it is advantageous to
keep the welding to a minimum in the selection of a reinforcshy
ing type This tends to make the high shear type of reinforcshy
ing uneconomical and essentially limits the more practical
opening reinforcings to those of the type considered in
Figures la and lb The present investigation is devoted to
this type of reinforcing and specifically to that arrangement
given in Figure lb
13 Elastic and Ultimate Strength Analysis
BaSically two types of analysis were available for this
study - elastic and ultimate strength The elastic analysiS
of the stresses in a beam containing an opening in its web
consists of the superposition of the stresses occurring in
an unperforated beam and the stresses resulting from forces
applied to the boundary of the opening in such a way as to
satisfy certain boundary conditions at the opening This
approach finds its basis in an important work presented by
NIMuskhelishvili(l) in the 1930s and was used by SR
5
Heller Jr et al(2) in 1962 and by JEBower(3) in 1966 to
investigate the elastic stresses around openings in wideshy
flange beams Bowers work also outlined the widely used
approximate Vierendeel analysis based on the assumption that
the beam behaves like a Vierendeel truss in the vicinity of
the opening The shear force carried by the section causes
secondary bending moments to occur within the tee sections
formed by the flange and the remaining part of the web above
and below the opening A point of contraflexure for the
secondary bending stresses is assumed to occur at the midshy
length of the opening The forces acting at the opening and
the resultant stress distributions are shown in Figure 2 It~
is assumed that the shear is carried equally by the tee secshy
tions above and below the opening and that the secondary and
primary bending stresses are additive
Bower also performed an experimental study(4) in 1966
to verify the results of his analysis A series of 16WF36
beams each containing one opening either circular or
rectangular with corner radii of 14 inch were tested at
varying moment to shear ratios The beams were implemented
with electrical resistance strain gauges in the vicinity of
the openings so that strains could be measured and compared
to those predicted by theory The results of Bowers tests
showed that very high stress concentrations occur at the
corners of rectangular openings while smaller stress concenshy
6
trations occur above and below circular openings where the
tee section is the smallest The findings for circular
openings confirm those given by So(5) in 1963 while those
for rectangular openings were confirmed by Chen(6) in 1967
Bower showed that for both types of openings investigated
the elastic analysis predicts all stresses and stress concenshy
trations with reasonable accuracy except for the octahedral
shear stresses away from the boundary of the opening The
elastic analYSiS however is complicated and requirea the
use of a computer and is incapable of dealing with the presshy
ence of notches or other irregularities at the opening The
approximate Vierendeel method was found to predict bending
stresses and octahedral shear stresses with acceptable
accuracy while failing to predict the stress concentrations
in both cases However the approximate method is relatively
simple and lends itself easily to hand calculations Since
the elastic analysis is not practical particularly for
design purposes because of the length of the calculations
involved it has been suggested by Bower and others(7) that
the Vierendeel analysis be used in its place with stress
concentrations neglected when an elastic analysis is desired
A design based on this method would result in a beam whose
response is not purely elastic under working loads
An analysis based on complete yielding of the sections
where high stress concentrations exist under elastic condishy
7
--~~
~ tions would eliminate this problem Such a plastic or
ultimate strength analysis would take advantage of the
additional strength of the perforated beam between the onset
of yielding and the complete plastification of the section
or sections that would cause failure or uncontrolled deformshy
ations of the beam Besides eliminating the problem of stress
concentrations in the elastic range a plastic analysis also
has the advantage of being simpler to use than the complete
elastic analysis and of not being rendered unusuable when
notches or irregularities are present at the opening since
the method depends only on the reasonably accurate prediction
of the sections where complete yielding or plastic hinges
will occur These regions can generally be determined withshy
out difficulty particularly in the case of rectangular
openings Consideration of these factors suggest an ultishy
mate strength analysis as the most rational approach to
the problem
8
CHAPTER 11
ULTIMATE STRENGTH BEHAVIOR
21 Behavior of Unperforated Beams
Ultimate strength analysis truces advantage of the ducshy
tility of structural steel This ductility mruces it possible
for the steel to undergo large deformations beyond the elastic
limit before failure occurs As can be seen from the idealized
stress-strain curve in Figure 3 the material is elastic up
to the yield level but after this level is reached the strain
increases extensively without any further increase in stress
Beoause of this attainment of the yield stress at the outershy
most fiber of a beam in bending does not cause the failure of
the member Rather the member has reserve strength that
permits increase of load up to the point where the entire
cross-section has reaohed the yield stress ie when a plastio
hinge has fonned at the yielded section Since rotation is
free to occur at plastic hinge locations when sufficient
hinges have formed so that the structure forms a mechanism
and is unstable under the applied loads collapse will occur
For a simply supported beam of uniform cross-section
formation of only one plastio hinge is suffioient to cause
collapse If no shear or axial forces are acting the plastic
moment or maximum moment capacity of the section is easily
9
obtained and is equal to the first moment of the area of the
section above or below the centroid about the centroid times
the yield stress of the material This is writte~ as
where Z is the plastic section modulus of the section and ~y
is the yield stress
The presence of a moment-gradient (shear) has the effect
of lowering the plastic moment capacity of a member Since
the shear force is carried by the web of the member the
moment carrying capacity of the web and therefore that of
the member must be reduced since the presence of shear
causes a reduction in the normal stress carrying capacity of
the web The yielding criterion of von Mises is generally
accepted as being the most applicable to structural steel
and can be explained physically in either of two ways
Henckys interpretation states that when the energy of disshy
tortion reaches a maximum value yielding results A preferred
explanation offered by Prandtl states that when the shear
stress on the octahedral plane reaches some maximum value
yielding occurs(8) Von Mises t yield criteria can be
expressed mathematically as
10
where ltSyiS the yield stress ltS the normal stress and the
shear stress The effect of shear on moment capacity can
best be illustrated by an interaction curve as shown in
Figure 4 where the axes have been non-dimensionalized by
diVision by Mp and Vp Vp is the maximum shear carrying
capacity of the section under pure shear and is obtained
from equation (2) as
where = Vw( d-2t) V is the shear force and w( d-2t) the
clear web area Equation (3) presupposes that the flanges
of the section carry no shear The broken line in Figure 4
illustrates the interaction between moment and shear for an
unperforated wide-flange section as predicted by equation (2)
Such an interaction curve shows for any given moment value
the corresponding shear value that a member can safely sustain
Any value less than those on the interaction curve (those
bounded by the VV and MM axes and the interaction curve)p p represents a combination of moment and shear which the member
can safely carry Values on or outside the interaction curve
represent those combinations which would cause collapse of the
member The reduction in strength due to shear is however (9)fairly small for unperforated sections and OISC and
AISc(lO) design codes for buildings allow it to be neglectshy
11
ed for design purposes since the ooouranoe of strain hardenshy
ing makes possible the attainment of moments greater than Mp
in the presence of shear The allowable moment and shear
values thus permitted are those bounded by the solid line in
Figure 4
The inorease in strength due to strain hardening oan best
be illustrated by considering the load-defleotion curves in
Figure 5 The load-defleotion ourve for a beam in pure bendshy
ing is given in Figure 5a When the plastio moment of the
seotion is reaohed the defleotions beoome exoessive and
increase with no further inorease in load This ooours
beoause the member forms a meohanism with the formation of
a plastio hinge at the attainment of Mp However when shear
is present the load-defleotion ourve does not beoome horishy
zontal when the reduoed Mp Mp as predioted by equation (2)
and given by the interaction curve in Figure 4 is reached
but rather oontinues to climb at a lesser slope reaching
values equal to or greater than the full Mp given by equation
(1) This oan be seen in Figure 5b The increase in strength
above Mp under moment gradient is due to strain hardening
and is usually neglected in simple plastiC theory although
it can be predicted but the procedure is complicated for
all but very simple cases Strain hardening occurs in the
presence of shear because yielding occurs in localized areas
or slip bands so that the material within these bands strain
12
hardens before adjacent areas reach the point of yield Alshy
though simple plastic theory neglects strain hardening the
significance of this phenomenon should not be underestimated
since all rolled sections are proportioned such that the limit
of shear carrying capacity of the web lies within the strain
hardening range(ll)
22 Behavior of Beams with Web Openings
The introduction of an opening into the web of a wideshy
flange section has two effects on the interaction curve The
first and more immediately apparent of these effects is the
reduction of shear and moment capacity by the reduction of the
area available to resist these forces The moment capacity
is reduced to
(4)
where w is the web thickness and h is the half depth of the
opening The shear capacity is reduced to
v = w( d-2t-2h) $-3
This change in the interaction curve is shown by the broken
line in Figure 6 The second effect caused by the presence
of an opening is the strong interaction between moment and
shear due to the member behaving like a Vierendeel truss in
13
the vicinity of the opening This is the same type of
behavior described in Section 13 except that the member
is analyzed in the plastic rather than the elastic range
The secondary bending moments caused by the shear force are
added to the primary bending moments thus causing the critical
sections to yield completely at lower loads than would be exshy
pected were this interaction effect ignored This is shown
by the line in Figure 6 where the effects of shear as given
by equation (2) have also been included
The addition of horizontal bar reinforcing above and
below an opening in a wide-flange beam increases the maxishy
mum moment capacity of the section (no shear acting) above
that of an unreinforced opening by increasing the area of
the section capable of resisting moment The effects of
interaction between moment and shear are also reduced by the
addition of reinforcing since the reinforcing is of such a
type as to be particularly well suited to resist secondary
bending moments due to Vierendeel action The maximum shear
carrying capacity of a reinforced opening may reach
(Vv) = d-2t-2h (6)P max d-2t
which is the maximum shear carrying capacity of the section
assuming no interaction and is derived from equation (5) by
division by equation (3) This can represent a considerable
14
increase in strength over the shear capacity of the unreinshy
forced opening which is normally much below (VVp)max because
secondary bending moments have to be resisted to a large
extent by the web since there is no reinforcing to perform
this task
The presence of an unreinforced rectangular opening in
the web of a wide-flange section oauses ohanges in the failure
modes of the beam as well as in the interaction ourve Sevshy
eral investigations have confirmed these ohanges in failure
modes(461213) Vllien subjected to pure bending the member
is found to fail by oomplete yielding of the tee sections
above and below the opening Load defleotion curves for this
case are similar to those for an unperforated beam under pure
bending in that with the attainment of Mp the curve becomes
horizontal and collapse eventually occurs with no further
increase in load
Vhen the perforated beam is subjected to bending with
shear large relative displacements occur between the ends
of the opening and at the same time localized plastiC binges
form at each of the four corners of the opening by complete
yielding of the tee section at these locations The load-
deflection curve in this situation is similar to the load-
deflection curve of an unperforated member under moment-
gradient except that the second portion of the curve after
15
the bend is not always as straight as that for the unpershy
forated beam and in fact may possess considerable
curvature in some cases(13) The value of the moment at the
opening at which the load-relative deflection curve bends
is not that of the unperforated section but instead is a
reduced value obtained by considering both reduced area and
moment-shear interaction as described previously_ Again
the increase in load above the value corresponding to the
predicted moment is due to strain hardening for the same
reasons as cited previously_ This strain hardening effect
makes it exceedingly difficult to ascertain at what value of
shear or moment an experimental test beam should be considershy
ed to have failed so that this failure load can be compared
to one predicted by theory It can be said with certainty
that this value should lie somewhere between the load at
which the load-relative deflection curve starts to bend from
its initial slope and the ultimate load at which the beam
suffers total collapse This total collapse will be either
by web buokling at the opening or by oraoking of one or more
of the corners of the opening after which deflections become
uncontrolled and the load carrying capacity of the beam
decreases
The use of the collapse load as the failure load would
however not be justified unless the effects of strain hardenshy
ing and the possibility ot tearing and buokling are incorporatshy
16
ed into the analysis Also the deflections become so exshy
cessive as to make the beam unserviceable before this load
is reached Indeed a rational definition would have to be
such as to have the failure load fall within the region
where the load-relative deflection curve bends from its
initial slope to some new slope One possible means of
defining failure in this type of situation is suggested in
ASCE tlOommentary on Plastic Design in Steel(14) and
is perhaps the most rational approach to the problem The
initial slope of the load-relative deflection curve is
multiplied by some constant factor to obtain a new slope
A line having this new elope is then drawn tangent to the
upper portion of the load-relative deflection curve and the
load at which this new slope intersects the initial slope is
taken to be the failure load This is analogous to considershy
ing strain hardening in some simple case where the slope of
the theoretical load-deflection curve in the strain hardening
range is equal to a constant times the initial slope of the
curve when the beam is still elastic If this method is to
be used a method of determining a suitable constant must
be chosen possibly from experiment
The modes of failure of a beam containing a reinforced
opening are expected to be the same as those with an unreinshy
forced opening under both pure bending and bending with shear()
Similarly the load-deflection curves or the load-relative
17
deflection curves would be the same in both cases Thus for
cases of moment gradient the same situation exists for both
reinforced and unreinforced openings where the load continues
to increase past the attainment of the predicted moment
capacity of the section due to strain hardening and the same
difficulty exists for determining failure loads for beams
with reinforced openings as for the unreinforced case
The method suggested in ASCE and described previousshy
ly for determining failure load was adopted for the purposes
of correlating experimental and theoretioal values of failure
load in this study Since the load-relative defleotion curves
for some of the test beams approached a fairly constant slope
in the strain hardening range it was decided to determine
the slopes and constant multiplication factors for these
cases and apply the same factor to all of the test beams
since all were similar It was thus decided to use a value
of thirty times the initial slope for the final slope in
determining experimental failure loads
23 Previous Ultimate Strength Investigations
While considerable theoretical and experimental work
has been done in the determination of elastic stresses around
openings in plates and beams relatively little has been done
ooncerning ultimate strength behavior In 1958 wJworley(12)
18
carried out an investigation of the ultimate strength of
aluminum alloy I-beams containing web openings of various
shapes Rectangular elliptical and triangular openings
were studied with the main objects of the research being
to determine which shape of opening resulted in the smallest
loss of strength and to verify the validity of an upper
bound theorem in predicting the fully plastiC load carrying
capaCity of the test beams The upper bound plastiC theorem
states that of all the possible mechanisms or combinations
of plastic hinges sufficient to cause collapse the one that
ensures collapse at the lowest load is the correct mechanism
under which the member will actually fail Worleys experishy
mental results were in fairly good agreement with the ultimate
loads predicted by the upper bound theorem and were the most
accurate for the case of rectangular openings where hinge
locations were more easily predicted than for the other openshy
ing types Of the various opening shapes tested it was found
that the elliptical opening was the strongest on a maximum
area removed baSiS while the triangular was stronger on a
maximum depth basiS The practical need for these two shapes
especially the triangular is however questionable Worley
excluded the effects of shear and axial force in his analysis
and for rectangular openings assumed a four hinge mechanism
with hinges considered at the corners of the opening
19
In 1963 W-CSo(5) presented a study of large circular
openings in wide-flange beams including an ultimate strength
analysis based on the assumption of a plastic hinge over the
center of the opening Sots analysis however neglected
secondary bending effects due to Vierendeel action in the
vioinity of the opening and also ignored shear yielding
effects in the web The experimental investigation performshy
ed in the ultimate strength range consisted of the testing
of two l4WF30 beams to collapse The first beam was tested
in pure bending so that shear and Vierendeel action were not
present and the ultimate strength predioted by Sos analysis
would be expeoted to be oorreot since the same strength would
be predicted in this case whether or not these effects were
considered Deviation between experiment and theory was 3
The second beam was tested under moment gradient but due to
the relative location of opening and maximum moment (the
beam was simply supported and subjected to a single concenshy
trated load) the beam was expected to and did fail under
the load and not at the opening
S-y Cheng(15) in 1966 considered bending shear and
axial forces in his investigation of the ultimate strength
of extended circular openings in wide-flange beams At high
values of shear a four hinge mechanism was assumed while at
low shears hinges were assumed above and below the opening
20
where the tee section was smallest - similar to the failure
mode in pure bending Stress distributions were assumed at
hinge locations for each case Two l4WF30 beams were tested
to destruction one in pure bending and the other with a
moment to shear ratio of 24 inches which is a high value of
shear for the size beam used While reasonable agreement
between theory and experiment was obtained for both beams
tested an inherent fault in Chengs work lies in its inshy
ability to predict a continuous variation of failure loads
as the shear varies from a low to a high value It is
impossible for the change from a one to a four hinge mechanism
to occur suddenly with only a slight increase in shear
Experiments in the ultimate strength region were performshy
ed by I-C Chen(6) in 1967 on two 14WF30 beams each containing
two large openings in their webs One simply supported beam
containing two 8 inch diameter circular openings spaced 8
inches apart was found to fail in the manner of a be~u conshy
taining only one opening failure being associated with the
opening subjected to the largest moment both being under
the same shear force In the second beam containing two
8x12 inch reotangular openings spaced 4 inches apart the two
openings failed as a unit with four hinges forming at the
outer oorners opoundthe openings and the web between them evenshy
tually buckling No theoretioal ultimate strength analysis
was offered by Chen
21
In 1968 JEBower(16) proposed an ultimate strength
theory for beams containing a single rectangular opening in
their webs A point of contraflexure for Vierendeel stresses
was assumed to occur at the midlength of the opening and
three alternate stress distributions were proposed for
complete yielding of the low moment edge of opening The
first of these stress distributions assumed no Vierendeel
action and was quickly discounted as giving unrealistically
high predictions of strength The two remaining stress
distributions both took into account secondary bending moments
due to shear the first assuming localized web yielding in
shear and the second assuming uniform shear distribution
over part of the web with this area yielding in combined
bending and shear The first of these lower bound solutions
was based on an unrealistic stress distribution and proved
to give unrealistically low predictions of the beam strength
The second lower bound solution which was finally adopted
by Bower was based on a more realistic stress distribution
but was restricted in that the point of contraflexure was
assumed at the midlength of the opening which is not always
the case
Experiments were performed on four 16WF36 beams each
oontaining one rectangular opening as part of this work
Collapse loads are oited for each of the test beams and are
22
compared with predictions from the second lower bound analysis
However since all of the beams were tested at relatively high
ratios of shear to moment considerable strain hardening
would have occurred before collapse and experimental results
which take advantage of the reserved strength due to this
strain hardening (even though accompanied by large deformashy
tions) cannot justifiably be compared to a theory that ignores
this effect
A more general ultimate strength analysis for beams with
rectangular openings was offered by RGRedwood(17) also in
1968 A point of contraflexure was assumed to occur someshy
where within the tee section above and below the opening but
its location was not dictated as in Bowers analysis A
four hinge mechanism was assumed on the basis of previous
tests(13) with stress distributions assumed at both high
and low moment edges of the opening Shear stresses were
assumed carried by the entire web of the section with web
yielding occurring in combined bending and shear
Redwoods analysis was correlated with his previous
experimental investigations and found to be conservative
when shears were large But again the effects of strain
hardening were included in the experimental collapse loads
and not in the theory If the experimental failure loads
could be related to the occurrence of full yielding at the
23
critical sections a more valid comparison with the theory
would result Such a comparison was taken into account by
Redwood in a later paper(la) In this paper failure is defined
in a way similar to that suggested in the previous section
Another recent paper by Redwood(19) deals with beams
containing multiple unreinforced openings in their webs A
method is offered for determining the minimum spacing required
between openings to prevent their interaction and failure
as a unit An analysis is also given for determining the
strength of a member when failure is associated with more
than one opening and this is combined with Redwoods analysis
offered previously(17) for failure associated with only one
opening The theory is compared to the experimental work
performed by Chen(6) in 1967 (7)In 1964 EPSegner Jr conducted an investigation
of several types of reinforcing for rectangular openings
testing six wide-flange beams in four different sizes each
containing two or more openings The openings in five of
the six beams were reinforced each With one of five main
types of reinforcing The openings were positioned at
several different moment to shear ratios and each of the
beams was tested to destruction Unfortunately little can
be said about the performance of the different types of
reinforcing under varying moment-shear conditions because
24
of the large number of variables included in each of the tests
Perhaps Segners most significant contribution is to be
found in his cost comparison of the various types of reinshy
forcing for rectangular openings Estimates cited for six
different fabricators clearly indicate that shear-type reinshy
forCing or reinforcing designed to carry high shear forces
around the opening is economically non-feasible except in
unusual circumstances The most economical type of reinshy
forcing included in this study consisted of two flat plates
bent to fit the shape of the opening and welded inside the
opening with a small gap between them occurring at the midshy
depth of the opening This is the same type as shown in
Figure la Another type of reinforcing included in Segnerts
experimental work but unfortunately omitted from his eco~
nomic comparison consisted of straight horizontal reinforcshy
ing plates welded above and below the opening at the openingis
boundary The plates extended past the vertical edges of the
opening to allow for anchorage of the plate Considerable
welding problems were said to have been encountered by placing
the reinforcing flush with the upper and lower edges of the
opening since the fillet was likely to overrun into the radii
of the re-entrant corners but this could easily be overcome
by leaving a small web stub between the plate and the opening
to allow for welding This type including the modification
25
for welding purposes is that given in Figure lb
Although this reinforcing type was not included in the
economic comparison presented by Segner it would seem to be
of only slightly greater cost than that in Figure la
Approximately the same amount of reinforcing material is
needed for these two types and while the straight bar reinshy
forcing requires more welding it does not require bending
of the plates and eliminates the worry of fit between the
plate bends and the opening radii After giving careful
consideration to the economics and fabrication problems of
reinforcing a rectangular opening in the web of a beam it
was decided to devote the present investigation to reinforcshy
ing of the horizontal straight bar type
24 Scope of the Investigation
An ultimate strength analysis is presented for wideshy
flange beams containing large rectangular openings in their
webs and reinforced with straight bar reinforcing above and
below the openings The investigation includes the effect
on beam strength of variable opening depth to beam depth
opening length to depth reinforcing Size and moment to
shear ratio One lOWF21 and ten l4WF38 beams were tested to
collapse Each of the test beams contained one rectangular
opening centered at the middepth of the beam and ten of the
26
eleven openings were reinforced Deflections were measured
at several pOints for all of the test beams and each beam
was painted with a brittle coating of whitewash in the region
of the opening to obtain an indication of the order of onset
of yielding Four of the test beams were also equipped with
electrical resistance strain gauges at critical sections The
experimental investigation encompassed each of the variables
of the theoretical work
27
CHAPTER III
ULTI1iATE STRENGTH ANALYSIS
31 Assumptions
Based on the discussions in the previous chapters the
following assumptions are made in this analysis of reinforcshy
ed rectangular openings with horizontal reinforcing bars
1 Failure of the member takes place by formation of a four
hinge mechanism with hinge locations being at the corners
of the opening These locations are shown in Figure 7a
a cross-section through the opening being given in Figure
7b
2 A point of contraflexure occurs somewhere within the
length of the tee section Its location is the same
above and below the opening but this location is not
dictated
3 Stress distributions at high and low moment edges of the
opening are those shown in Figure 8b Since the stresses
are antisymmetric with respect to the vertical axis of
the beam only the stresses for the tee-section above
the opening are indicated The resultant forces acting
on the tee-section are shown in Figure 8a
4 Shear stresses are carried only by the web of the teeshy
section and are uniformly distributed across this web at
28
hinge locations when hinges are fully formed While
the shear stress at the boundary of the opening must be
zero this assumption introduces only very slight error
into the theory since these stresses can increase from
zero to their maximum value at a very small distance from
the opening 1 s boundary_ Due to the presence of the reinshy
forcing bar it is likely that most of the shear will be
carried by the region of web between the reinforcing bar
and the flange particularly when the secondary bending
stresses are very high This is further discussed in
Section 34 and introduces no significant error in the
development of this method
5 Yielding in the web occurs lliLder combined bending and
shear according to the von Mises criterion stated in
equation (2) Yielding in the flange and reinforcing is
in direct tension or compression
On the basis of the assumed stress distributions equishy
librium equations can be obtained for the tee-section at
values of the shear force which may vary in some cases
from zero up to the maximum as given by equation (5) At
the high moment edge of the opening section (1) in Figure
Bb stress reversal will occur within the web when the shear
force is relatively low (case I) but will occur within the
flange when the shear force is high (case II) These two
29
cases will be repounderred to as low and high shear conditions
respectively_ Three different locations of stress reversal
are possible under the low stress conditions
1 Reversal in the web stub below the reinforcing This
occurs at very low values of shear
2 Reversal in that portion of the web to which the reinshy
forcing is attached
3 Reversal in the clear web between reinforcing and flange
The range of shear values corresponding to reversal in
this region is very small
At section (2) the low moment edge of the opening for
practical situations reversal will occur only in the flange
32 Low Shear Solution - Case I
Consider equilibrium of the portion of the beam to the
right of Section (2) in Figure 7a Taking moments about
section (2) gives
where V denotes shear force as before F2 is the resultant
force at section (2) and Y2 is the distance from the edge of
the opening to the resultant normal F2bull All other symbols
used in this section and not specifically defined here are
defined in Figures 7 and 8 Taking moments about section (1)
30
for that portion of the beam to the right of this section
yields
(8)
where Fl and Yl are comparable to F2 and Y2 respectively
Equilibrium of the tee-section in Figure 8a requires that
(9)
Oonsideration of the assumed stress distribution at section (1)
for stress reversal occurring in the web stub below the reinshy
forcing ie for 0 =klS ~ u gives on integrating the
stresses
Fl = Af ~yf + SW(1-2~)G + Ar ~yr (10)
FIYl = Af ~ Yf(s~) + ~S2WG(1-2ki) + ArJ yr(u1) (11)
where Af = bt the area of one flange and Ar = q(c-w) the
area of one pair of reinforcing bars Separate yield stress
values are used for flange web and reinforcing because of
the large variation possible in these in a single beam A
discussion of the determination of these stresses is included
in Chapter 5 Yield stresses are designated as ~ yf for the
flange G yw for the web and ~ yr for the reinforcing
31
and ~ the normal stress carrying capacity of the web is
calculated from
t2 _ r- 2 3(V)2 ~ - yw-4sw (12)
and is another way of stating the von Mises yield criterion
given by equation (2) From consideration of the stress
distribution at section (2) for stress reversal in the flange
F2 = Af ltS yf(1-2k2) + sw ~ + Ar c yr (13)
F2Y2 = Al~Yf [S(1-2k2)~(1-4k2+2k~)J -1-s2Wlti +Ar~ yr(u~) (14)
Although explicit expressions for shear and moment capacity
cannot be determined from the above equations it is possible
to obtain from them that portion of the interaction curve
relating combinations of shear and moment at midlength of
opening to cause collapse of the beam for shear values in
the assumed range Consideration of other locations of stress
reversal will yield expressions from which the remainder of
the interaction curve can be determined
Specifically for 0 ~ kls ~ u kl can be determined as
a function of k2 from equations (9) (10) and (13) and is
given by
32
From equations (7) (8) (11) and (14) a quadratic expression
is obtained for k2 in terms of known quantities and V
Z [AfCSyf ] Vak2 (sw cs ) s + t + k2 ( -d+2h) + A G = 0 (16 )
f yf
For a given value of V equations (12) (15) and (16) can be
used to determine the corresponding values of kl and k2bull Fl
can then be calculated from equation (10) and FIYl from equashy
tion (11) The moment at mid1ength of opening is then detershy
mined from
(17)
Thus for a given value of V a corresponding value for M can
be obtained The values of kl and k2 must be checked when
calculated to determine whether initial assumptions of
o ~ k1s ~ u and 0 ~ k2 ~ 10 have been met Only one solution
to the quadratic equation in k2 will fulfill these requireshy
ments unless both solutions are equal The above equations
will yield a value for M for a given value of V starting at
V = 0 and continuing for increments in V until the location
of stress reversal at section (1) moves into the region where
the reinforcing is attached ie for kls gt u When this
occurs neither solution to equation (16) will yield values
of k1 and k2 that satisfy the initial assumptions and the
33
initial equations for stress resultants at section (1) must
be replaced by new equations reflecting this change Quite
simply equations (10) and (11) are replaced by
respectively for u ~ kls ~ (u+q) Equations (13) and (14)
remain unchanged for section (2) since reversal will occur
only in the flange at this section Thus for u ~ klS ~ (u+q)
ie for reversal within the reinforcing equations (9)
(13) and (18) yield
Similarly from equations (7) (8) (14) and (19)
- (d-2h)]
va u 2( c-w) Go s ( c-w) G
+ + [ _----oiOioV] [ yr IJ = 0 (21)AfGyf Af csyf sw cs- + s c-w) csyr shy
The same procedure is followed as in the previous case
first V being assumed ~ being obtained from equation (12)
34
k2 from equation (21) kl from (20) Fl from (18) FIJl from
(19) and finally from equation (17) the value of M correshy
sponding to the assumed value of V Again the values
obtained for kl and k2 must be checked to assure that the
initial conditions of u ~ kls ~ (u+q) and 0 ~ k2 ~ 10 are
met These equations will yield admissible values of kl
and k2 for values of V increasing from the last admissible
value obtained by solution of the previous set of equations
and continuing to where kls reaches the value (u+q) ie
for stress reversal in the clear web at section (1) ~nen
(u+q) ~ kls ~ s equations (18) and (19) are replaced by
(22)
and equations (9) (13) and (22) give
(24)
While from equations (7) (8) (14) and (23)
(25)
35
For a given value of V a corresponding value for M is
determined in the same manner as for the two previous cases
Acceptable solutions will be obtainable as long as the stress
reversal at section (1) falls within the clear web However
when this reversal occurs in the flange the so-called high
shear solution is indicated
33 High Shear Solution -Case 11
When the shear force is high stress reversal at section
(1) occurs in the flange and the equations for resultant
normal force and moment arm from the edge of the opening
become
Fl = Af ltS f(2k -1) - sw~ - A C (26)Y 1 r yr
The stress reversal at section (2) will still occur in the
flange and equations (13) and (14) are used with the above
equations and equations (7) (8) and (9) to obtain
(28)
(29)
36
For a given value of V a corresponding M is obtained from
the above equations and equations (12) and (17)
By starting with a value of V = 0 and increasing this
by a small increment with each successive iteration correshy
sponding values of M can be found for the full range of V
values by use of the equations in this and the previous
section An interaction curve can then be plotted relating
V and M over their full range of values A typical intershy
action curve is shown in Figure 9 for a beam containing a
reinforced opening where the curve has been nondimensionalized
by division of V and M by Vp and Mp respectively Also
indicated in this curve are the four regions corresponding
to the different locations of stress reversal at the high
moment edge of the opening
34 Limits of Interaction Curves
It is quite possible for the MM values for a certainp range of VV values on the interaction curve to be greaterp than 10 as can be seen in Figure 9 This simply means
that the reinforced opening can be stronger than the unperfoshy
rated beam for pure bending and for bending with very low
shear However values of MM greater than 10 have no realp practical significance because in such cases failure of the
beam would occur not at the opening but at some unperforated
37
portion of the beam near the opening Therefore 10 is
taken as the maximum value of MM and a horizontal line isp drawn at this value from the MM axis to intersect thep interaction curve This is shown in Figure 9
The interaction curve is also limited with respect to
the maximum VV value permissible Since shear forces canp only be carried by the remaining part of the web the maximum
plastic shear capacity at the opening is equal to V thep plastic shear capacity of the uncut section times the ratio
of the remaining clear web to the initial clear web This
is written as
d-2t-2h (6)= d-2t
In other words when the web of the section at the opening
has yielded in shear its normal stress carrying capacity
~ becomes zero The value of V at which this occurs can be
determined from equation (12) and the ratio of this shear
value to Vp is given by equation (6) Vmen this limiting
value of shear is reached it is no longer possible to obtain
additional points on the interaction curve because any
further increment in V would yield an imaginary solution for
~ Rather when(VVp)max is reached a line is drawn from
this last point on the interaction curve perpendicular to
38
the vVp axis This line is the final portion of the intershy
action curve and represents the actual limiting value of
This limiting value of VVp is however not always
reached for all practical sizes of beam opening and reinshy
forcing It is possible for the equations in the previous
two sections to yield values of kl and k2 that no longer
conform to initial assumptions (for any position of stress
reversal) at a shear value less than the maximum predicted
by equation (6) This occurred in some of the cases tested
to confirm the consistency of these equations and was found
to be caused by an imaginary solution to the quadratic in k2
occurring while stress reversal at section (1) was still in
the clear web of the section Stress reversal at section (2)
was as assumed in the flange Consideration of other
locations of stress reversal did not give real answers This
condition was then investigated and it was found that because
of an interdependence of opening length and reinforcing area
either the opening length must be less than a given value or
the reinforcing area greater than another value in order
for the interaction curve to be able to pass this region
The limiting half length of opening a is given by
(30)
39
and is obtained by combining equations (7) (8) (14) (23)
and (24) with ~ equal to zero By eliminating small terms
this may be simplified to
(31)
Alternatively the minimum area of reinforcing required is
given by
A =2 ( 32) r 13
If this requirement is met it will be assured that the
maximum shear capacity of the section will be reached
Physically the interdependence of reinforcing area and length
of opening can be interpreted to mean that as opening length
is increased the secondary bending stresses which are a
function of shear and opening length increase at sections
(1) and (2) to such an extent that unless the reinforcing
area is increased so that it can carry these high stresses
the lower portion of the web is forced to carry such high
bending stresses that little or no shear can be carried by
this portion of the web The shear stress can then no longshy
er be considered to be uniform across the entire web of the
tee section but instead is restricted to the clear web
between flange and reinforcing or to a portion of this area
40
Reaching the maximum value of vVas given by equationp
(6) is not a necessity either for the interaction curve or
for the performance of a given beam and opening A given
interaction curve is still correct if it terminates before
reaching this value of vVp This occurs when the MMp value
decreases rapidly for very small increments in vvp and
becomes zero In this case the last portion of the intershy
action curve is very nearly a vertical line This line then
represents the actual maximum shear capacity for the given
beam opening and reinforcing dimensions Only when a beam
is to perform under high shear conditions and it is desired
to develop its maximum shear capacity is it necessary to
ensure that Ar is large enough so that this value can be
reached
41
CHAPTER IV
APPROXIMATE METHOD
41 General Remarks
If a particular beam and opening size is being investishy
gated over a very limited range of shear values it is a
fairly straightforward matter to calculate the moment capacity
of the beam corresponding to the given shear values using
the equations presented in the previous chapter hven if the
location of stress reversal were consistently assumed in the
wrong region the calculations would have to be repeated at
most four times for a particular shear value However it is
quickly realized that for a large range of shear values or
for a complete interaction curve it would be extremely
laborious to perform these calculations by hand and recourse
to automatic computation would seem almost essential A
computer program has been developed to perform the necessary
calculations for a complete interaction curve for a specified
beam opening and reinforcing size and is given in Appendix A
Since the practical development of a complete interaction
curve is seriously limited by the length of calculations
involved a simple to use approximate method is suggested for
determining the strength of a perforated beam at various
moment to shear ratios In the development of this approxishy
42
mate method the high shear region only is considered for
reasons which will become evident
42 DeveloEment of the Method
Combination of equations (3) (12) and (28) result in
the following expression
(33)
where for simplici ty ~I~- - ~Y= ~~ t the specified minimum
yield stress of the material Similarly equations (1) (17)
(26) (28) and (29) can be combined to give
M d(kl -k2) + t(k~-ki) (34) ~ = a-i) + wtf2t)~
Xf
and from equations (12) (28) and (29) kl and k2 are related
by
(35 )
If it is now assumed that the flange thickness is significantshy
ly less than half of the remaining clear web tlaquo s the
above expressions can be readily simplified Since (u+~) is
43
of the same order of magnitude as t it is also assumed that
(u+~) laquo By eliminating small terms and substituting for
kl+k -l-x = ~ equation (35) can be simplified to2 f
(36)
This simple quadratic can readily be evaluated for~ In
general both solutions will be real although for a wide
range of beam and opening sizes investigated the solution
corresponding to a minus in the quadratic formula was found
to fall within the region of low shear on the interaction
curve (as defined in the previous chapter) while the solution
corresponding to a plus consistently fell in the medium to
high shear region thus satisfying the initial assumptions
This latter solution was therefore considered to be the
correct one and the corresponding value for ~is given by A 2as [ 2 ] 12_2s2( r) + w2(s2~) _ 4A2
IS = If f)Af 3 r ( 37 ) - (s2 + 4a2 )
T
which may be rewritten as
_2~(Ar + l(Aw) ( 2h)2 1 ( r 2 ~ C = 1+01 If) 2 If l-er ~ - 16 X)(l+o)~ (38)
where Aw = wd and 0lt = i(~)2(k - 1)2
Equation (34) can also be simplified by eliminating small
44
terms and by considering that for the transition from low to
high shear to occur kl must equal unity Equation (34) then
becomes
M (39 )M= p AW
1 + 4A f
Similarly equation (33) can be simplified to
(40)
For zero or very small values of ~ the above equation can
yield values of VV greater than the maximum VVp value as p
given by equation (6) This implies that some portion of the
shear is carried by the flanges of the beam Since the flanges
can in fact carry some shear and since the theory as given
in Chapter III is sufficiently conservative for large shear
values (as can be seen from the experimental results given
in Chapter VI) equation (40) is not considered to predict
excessive values of shear capacity and is adapted for use in
this method of analysis The shear capacity is then given
by equation (40) and the corresponding maximum M~Ap value at
this shear value is given by equation (39) where ~ is given
by equation (38)
The maximum shear capacity of the section is given by
45
equation (40) when ~ is equal to zero Solution of equation
(38) for Ar when ~ equals zero gives the required reinforcing
area necessary to reach the maximum shear capacity of a secshy
tion This is given by
- AW(l 2h) flA (41)r - T -a-~
Equation (41) reduoes to equation (32) in Chapter III when
substitution is made for ~ When the reinforcing area
conforms to the above requirement the maximum shear capacshy
ityas given by
V 2hr = (I-a-) (42) p
will be reached and the corresponding maximum moment capacshy
ity at this value of shear is given by
Ar 1 - A
M fr= A p 1 + w
4Af Thus for a given beam opening and reinforcing size if
equation (41) is satisfied equations (42) and (43) together
fix one point on the approximate interaction curve while if
equation (41) is not satisfied this point is fixed by equashy
tions (38) (39) and (40) In either case a line is dropped
from this point perpendicular to the vvp axis thus forming
46
part of the approximate interaction curve The remainder of
the curve is obtained by connecting the point given by equashy
tion (42) and (43) or by equations (38) (39) and (40) with
a point on the M~Ip axis corresponding to the maximum moment
capacity of the section This maximum value of blfvl isp simply the plastic moment of the reinforced perforated secshy
tion divided by the plastic moment of the unperforated secshy
tion and is identical to the same point obtained in the
previous chapter with no shear force acting The maximum
value of Mi1p is given by
Z - wh2 + Arlt 2h+2u+q) = ---------w----------shyZ
or using a consistent approximation for Z this can be
rewri tten as
M A (45 ) M=
p 1 + w4Af
An approximate interaotion curve is given in Figure 9 for
comparison with the interaction ourve obtained by the method
desoribed in Chapter Ill
43 Limitations of the AEproximate Method
The maximum praotical M~lp value for the approximate
47
interaction curve is limited to 10 for the same reasons that
the more exact curve is so limited and a horizontal line
drawn from the MA~p axis at 10 and intersecting the approxshy
imate curve forms its upper portion The maximum value of
VVp for the approximate curve is limited to VVp max given
by equation (42) This limitation has been discussed in the
previous section
Equation (41) specifies the minimum size of reinforcing
necessary to reach the maximum shear capacity of the section
as given by equation (42) yVhen the reinforcing area conforms
to this minimum requirement equation (43) is used to predict
the moment capacity of the section corresponding to the shear
value of equation (42) Examination of equation (43) reveals
that as the reinforcing area is increased past the minimum
given by equation (41) the moment capacity decreases rather
than increases as would be expected from physical considershy
ations or from examination of interaction curves obtained
by the methods of Chapter Ill For sizes of reinforcing
only slightly greater than that given by equation (41)
equation (43) will be sufficiently accurate and will not
significantly underestimate the moment capacity of the secshy
tion although it may be deSirable to replace Ar in equation
(43) with the minimum Ar given by equation (41) Equation
(43) then becomes
48
A 2h l1 - ~(l-a)J~
M ( 46)~= A 1 + W
4Af This may be written more simply as
aw 1 - 73Af
= ---1-shyA 1 + w
4Af The corresponding shear value is given by equation (42)
However as Ar increases more and more above the value
given by equation (41) the moment capacity of the section
will be increasingly underestimated and if more accurate
values are desired recourse must be made to more accurate
methods Examination of equation (38) reveals that as Ar
increases past the value given by equation (41) 0 becomes
negative up to the point where
when the solution for cgt becomes imaginary For values of
Ar lying between those given by equations (41) and (48) ~
is negative and equations (39) and (42) can be used to
accurately predict the point on the approximate interaction
curve from which a perpendicular line should be dropped to
the VVp axis and a line drawn to the point given by equation
(44) on the MM axisp
49
Al though for this case a value exists for (gt equation
(42) rather than (40) is used to determine the shear capacshy
ity of the section This is the only logical approach beshy
cause Ar is greater than that required to reach the maximum
shear capacity and increasing the reinforcing area although
it cannot increase the shear capacity of the section past
that given by equation (42) also should not serve to decrease
this capacity
When Ar is greater than the value given by equation (48)
equation (39) cannot be used to obtain a more accurate preshy
diction of moment capacity because 0 as given by equation (38)
will not be real Consideration of the equations used in
deriving the approximate method leads to the conclusion that
will be imaginary only when the maximum shear capacity of
the section is reached while klslaquou+q) Equation (48) shows
the relation between reinforcing area and size of opening for
this to occur It can be seen that small opening size or
large reinforcing size will eause the maximum shear capacity
to be reached while kls (u+q) When this occurs equation
(42) predicts the shear capacity of the section since Ar is
greater than that required by equation (41) to reach this
maximum shear value At this value of shear ~ equals zero
and equations (17) (20) and (21) in Chapter III reduce to
(49a)
(50)
50
A q (5la )
M = _l_l_qdA_rf=--[2_U_2_+__(2_U_+_q_)_+_2_h_(_2U_+_q_)_-_2_(_k_l_S_)2_-_4_k_l_S_h_J_-_~_~_(_~~)
Mp Aw 1 + 1iA
f
By considering t laquo d equations (49a) and (5la) can be further
simplified to
(49)
(51)
Equations (49) (50) and (51) can then be used with equation (42)
to determine the pOint of intersection of the two lines composing
the approximate interaction curve
44 Summary and Discussion
Determination of the approximate interaction curve can be
summarized as follows
Case I
The maximum shear capacity of the section will be reached
if
A 2 AW(l_ 2h) fT (41)r 4 d 4a where a = ~(h)2(~ _ 1)2 The maximum shear capacity is then4 a 2h bull
given by
V (1 _ ~h) (42)Vp =
51
and the moment which can be attained with this shear acting
is Ar
1- ri- = Af (43)
p 1 + w 41f
where Ar is that given by the right hand side of equation (41)
Case 11
If equation (41) is not satisfied the maximum shear
capacity will not be reached and the shear capacity is given
by
(40)
The moment capacity which can be attained with this shear
acting is
1 1 + w
4Af where ~ is given by
A A _ ~( r) + l( w) ( 2h)2 1 ( r)2 0 ( )~ - 1+ltgtlt Af 2 If l-T 1+CgtI - 16 -x (l+olt)l 38
Case Ill
If Ar is significantly greater than that given by equashy
tion (41) the maximum shear capacity will still be given by
52
but if desired a more accurate estimate of the moment which
can be attained with this shear acting can be obtained as
follows
Case IlIA
For (48)
MMp at maximum VVp is given by
Ar 1 - I - ~
~ = __f_~_ ill A
P 1+ w4If
where r will be negative and is given by
(38)
Case IIIB
For A2 gt (aw) 2
+ (~)2w2 (48)r 3 ~
at maximum VV is given byp A A
1+-f(2h)__1_ JL (ha) (2dh ) (1+ 2dh )Af d 2[j Af (51)
A1 + w
4Af
53
where kl and k2 are given by
+l (50)s
(49)
and only that solution satisfying the conditions 0 ~ k2 ~ 10
and u ~ kls ~ (u+q) is correct
The appropriate one of these three cases can be used to
determine a point on the approximate interaction curve A
perpendicular line is then dropped from this point to the
vVp axis and forms part of the curve The remainder of the
curve is obtained by drawing a straight line from the initial
point to a point on the MMp axis given by equation (44) or
(45) and by then cutting off the approximate interaction curve
at the maximum Mlyenip value of 10 as described in the first
paragraph of this section
Complete and approximate interaction curves for each
size of beam opening wld reinforcing included in the expershy
imental part of this investigation are shown in Figures 10
through 15 A cross-section of the member is shovm on each
curve for reference and the method used in obtaining each of
the approximate curves is stated On Figures 11 14 and 15
the reinforcing size was greater than that given by equation
(41) and both Case I and Case III were used to obtain approxshy
54
imate curves for comparison It can be seen that only when
the reinforcing area was significantly greater than that
given by equation (41) (Figure 11) was there a large difshy
ference in the Case I and Case III values
For the partioular case of unreinforced openings by
substituting for Ar equal to zero in equations (39) and (40)
these reduoe to
M AW 2h 1
1 - 2If(l-or~ r= A (52)
p 1 + w4If
v (2h)JTr = I-d~ p
where ~= i(~)2(~ - 1)2 as before These equations are
identioal to those given by R_GRedwood(17) for unreinforced
openings Again a perpendioular is dropped from the point
defined by these two equations to the vVp axis and another
line is dravln from this point to a point on the MMp axis
given by
111 Z - wh2 (54)r = z
p
thus oompleting the approximate interaction curve for the
case of an unreinforoed opening Using the same approxishy
mations as used previously equation (54) oan be written
55
MM = 1 (55) p
which agrees with Redwoods work and gives a slightly highshy
er value for the maximum MM value A complete and approxshyp imate interaction curve for a section containing an unreinshy
forced opening is given in Figure 12 where the equations
given by Redwood(17) were used for the complete curve
56
CHAPTER V
EXPERIMENTAL INVESTIGATION
51 Selection of Test Beams
As discussed in Chapter I it was decided to limit this
investigation to rectangular openings reinforced with straight
horizontal strips welded above and below the opening It
was also decided to use a standard wide-flange beam rather
than a welded section because of the usual use of these in
building structures where openings are most oommonly requirshy
ed ASTM A 36 structural steel was used throughout all
of the experimental work because this material was used in
most of the previous investigations related to this work
The size of the test beams was chosen on the basis of
economy ease of handling and ease with which reinforcing
bars could be welded in place It was decided to use a secshy
tion that was compact at the specified yield stress and
also at the higher yield stresses expected in the test
beams In the selection of test beams only sections with
low depth to thickness ratios were conSidered in order to
avoid the problem of web instability The flange width to
thickness ratio was also kept as low as possible in order to
avoid premature compression flange buckling On the basis
of these considerations and after a preliminary test pershy
57
formed on a 10VF21 section it was decided to carry out the
remainder of the experimental investigation using a 14WF38
section of A 36 steel The properties of the test beams
used are listed in Table 1 A nominal opening depth to beam
depth ratio of 05 was chosen because of the practical need
for openings of approximately this depth in larger beams and
also because investigations of unreinforced openings were in
this range One test beam included in this work had a nominal
opening depth to beam depth ratio of 0643 A basic opening
length to depth ratiO or aspect ratiO of 15 was chosen
again from practical considerations Two beams were includshy
ed with aspect ratios of 20
The corner radii of the opening had to be large enough
to avoid excessive stress concentrations that might cause
premature cracking of the corners and yet small enough to
not appreciably decrease the effective area of the opening
In previous investigations corner radii ranged from 14 to
one inch A 58 inch radius was used in this study for the
14WF38 beams and a 316 inch radius for the 10WF21 beam
The area of reinforcing for each opening was chosen so
that the moment capacity of the unperforated member would be
equalled or exceeded and the full shear capacity of the net
section could be utilized The moment capacity condition
requires that
58
wh2 gt- (56)2h + 2u + q
This follows from equation (44) The reinforcing area reshy
quired to meet the shear condition is given by equation (32)
in Ohapter 111 It was found that for the 14WF38 beam used
in this investigation with 2hd equal to 05 ~~d ah equal
to 15 the area of reinforcing required to meet these condishy
tions was approximately ~vice that given by the right hand
side of equation (56) One beam was tested in the high shear
range with reinforcing such that the interaction curve fell
short of VVp msx Again it should be mentioned that the
length u is that required for welding the reinforcing in
place and should be as small as possible The width of the
reinforcing bars q was chosen so that the width to thickshy
ness ratio did not exceed 85 as specified by the design
code(910) for ultimate strength design The anchorage
length of the reinforcing bars was also designed by use of
the AISC and OISO design codes on the basis of develshy
oping the full strength of the reinforcing bars at the edges
of the opening The ultimate strength loads were taken as
167 times those for elastic design as recommended by the
codes
The openings in all of the test beams were flame cut
the 10WF2l beam number lA having the corners drilled before
59
cutting and then having the rough edges ground to the proper
size Beams numbered 2A 2B and 3A were entirely poundlame cut
including corners and were not poundinished poundurther The remainshy
ing beams had drilled corners with the rest of the opening
being poundlame cut They were not finished poundUrther
All test beams were simply supported and were loaded with
a single concentrated load The openings were positioned so
as to achieve the desired moment to shear ratios and all
openings were centered at the middepth opound the beam All beams
were locally reinpoundorced with cover plates so as to ensure
poundailure at the openings and web stipoundfeners were added under
the load and at reaction points Local reinpoundorcing was deshy
signed on the basis opound resisting the loads predicted by the
interaction curves plus the expected increase in loads above
this due to strain hardening Beam Sizes opening locations
and local reinpoundorcing are shown in Figures 16 17 and 18 poundor
each opound the test beams
52 Experimental SetuE
All beams were tested in a Baldwin-Tate-Emery 400k
Universal Testing Machine which is a mechanically operated
hydraulic testing machine opound 400k capacity The ends opound the
beam were supported by a specially reinpoundorced 14 inch wideshy
poundlange section that also poundormed part of the lateral bracing
60
system This is shown in Figures 19a and 20a Lateral bracshy
ing consisted of support against horizontal displacement and
rotation at pOints of load and at end reactions Bracing
for the beams numbered lA 2A and 3A was achieved by the
attachment of horizontal 8 inch wide-flange beams to the
vertical portion of the end supports with the 8 inch secshy
tions running the entire length of the test beams on each
side and positioned so that pins could be inserted at bracshy
ing points between the 8 inch sections and the top flange of
the test beam to allow for only vertical displacements of the
test beam The pins were given a heavy coating of grease to
minimize friction This type of bracing proved satisfactory
but made it very difficult to see parts of the test beam durshy
ing the test To alleviate this visual problem beam 2B was
tested with the lateral bracing described above on only one
side of the beam while for the other side vertical bars
attached rigidly to the 8 inch sections and bent to pass
over the test beam were held tightly against the upper flange
of the test beam at bracing points This arrangement proved
unsatisfactory and was not used for subsequent tests
For testing the remaining beams short 8 inch wide-flange
sections were attached vertically to the vertical portion of
the end supports and greased pins were used to provide latershy
al bracing at these locations (Figures 19b and 20b) Lateral
61
bracing at the point of load was provided by roller bearings
- two on each side of the test beam spaced 6 inches apart
vertically and bearing against the web stiffener of the beam
The roller bearings were attached to triangular sections
which in turn were attached to a wide-flange section held
rigidly to the laboratory floor See Figures 19c 20c
and 20d This type of lateral bracing provided nearly
frictionless vertical displacement of the beam while preshy
venting rotation and horizontal displacements and proved
to be very effective Access to the beam during testing
was not at all limited by this bracing system
Deflection dial gauges with a least reading of 0001
inch were used to determine deflections at points of load
end supports edges of openings 2 inches outside each openshy
ing edge and at centerline of beam when possible All dial
gauges were rigidly fixed to non-yielding supports Their
positions are indicated in Figures 16 17 and 18 Four of
the test beams were equipped with electrical resistance strain
gauges in the vicinity of the opening The locations of
these gauges are shown in Figure 21 Each test beam was
painted with an opaque brittle coating of whitewash - a
mixture of lime and water of the consistency of light cream
applied in the vicinity of the opening at least one day before
testing During testing this coating of whitewash flaked
62
off in minute pieces in areas undergoing plastic strains thus
indicating visually which sections of the beam had yielded
The flaking occurred at loads higher than those correspondshy
ing to yielding of each section and did not give an accurate
measure of the onset of yielding but instead gave an estishy
mate of the order in which each of the sections yielded
53 Testing Procedure
Essentially the same procedure was followed in testing
each of the beams The beam was first placed in position on
its end supports a fixed roller under one end and a free
roller under the other The bema was made level and centershy
ed with respect to its loading point and end supports
Lateral bracing was then fixed in place and the head of the
machine brought into contact with the specially hardened
roller through vhich the load was applied to the beam Dial
gauges were then put in position and strain gauge leads
connected to the Budd Automatic Strain Indicator A small
initial load was then applied to the beam and zero readings
were taken for all strain and dial gauges
At least four load increments of either lOk or 20k were
applied within the elastic range with all gauge readings beshy
ing recorded for each load increment When the first inshy
elastic response of the beam was noted either from strain
63
gauge readings on the beams that were so equipped or by
deflection vdth time of any of the dial gauges the load
increment was reduced to 5k and after each load increment was
applied all plastic flow was allowed to take place before
readings were taken To determine whether plastic flow had
ceased at each load increment dial gauge readings were plotshy
ted against time When the S-shaped curve reached its upper
portion and levelled out plastic flow had ceased and readshy
ings were taken During this time required for plastic flow
as much as 30 minutes for higher loads it was important to
hold the load on the beam constant Loading continued in
this manner until the ultinlate collapse of the test beam
either by web buckling at the opening or by tearing of one
or more of the openings corners When this occurred the
beam was no longer able to maintain the applied load The
load was then removed and the beam was taken out of the test
frame
54 Determination of Yield Stresses
In order to accurately access the expected strength of
each of the test beams it was necessary to determine their
actual yield stresses This was accomplished by the testing
of tensile coupons cut from the flange ana web of the beams
and from the reinforcing strip used at the openings The
64
dimensions of a typical tensile coupon are given in Figure 22a
and the locations from which such coupons were taken are shown
in Figure 22b The beams from which coupons were to be taken
were ordered an extra 12 inches long so that this section could
be cut off and tensile coupons made and tested before the testshy
ing of the actual beam Reinforcing strip was ordered an extra
36 inches long for the same purpose Test beams 2A 2B and
3A were all cut from the same beam and were all reinforced
from the same reinforcing strip Test beams 2C 2D 3B 4A
4B 5A and 6A were all cut from the same beam Reinforcing
for beams 2C 2D 4A and 4B was all cut from the same strip
Each of the tensile coupons was tested in either a 20k Riehle
or a 20k Instron Testing Machine Coupons tested in the
Riehle machine were tested under nearly constant load rate
An extensometer was attached to the coupons to automatically
record the stress-strain curves Since the crosshead
position could not be fixed on this particular machine
a static yield stress could not be obtained and therepoundore
only the lower yield stress is given in Table 2 Tensile
coupons tested in the Instron machine were loaded at a
constant cross head speed of 002 inches per minute When
the plastiC plateau was reached the crosshead position was
fixed and the load was allowed to drop off After about five
minutes the static yield stress had been reached and no
65
further change in load could be seen on the automatically
recorded stress-strain curve Straining was then allowed to
continue into the strain hardening range A typical stressshy
strain curve for a coupon tested in this machine is given in
Figure 23 Lower yield and static yield stresses are given
for coupons tested in the Instron machine in Table 2
Either the static yield or the lower yield stresses can
be used in determinimg the expected strength of a test beam
depending on which more closely approaches the actual test
conditions of the beam In this investigation the beams
were tested under loading increments with the loads being
held constant until plastic flow had ceased Since it was
thought that the method of obtaining the lower yield stresses
more closely paralleled the actual testing procedure these
stresses were used in evaluating the expected strength of
the test beams
66
CHAPTER VI
EXPERIMENTAL RESULTS
61 Behavior of Beams during Testing
Since the behavior of all the beams during testing was
quite similar a complete description of only one such typshy
ical beam number 20 is given here Deviations from this
typical behavior are discussed at the end of this section
Beam 20 was first tested elastically to a load of 80k
in lOk increments and was then unloaded Strain gauge and
dial gauge readings were taken at each load increment and
were analyzed After it was determined from these readings
that strain gauges and automatic recording equipment were
in good working order the beam was reloaded this time to
be tested to destruction This check was run for only this
one test beam all others being tested continuously through
elastic and plastic ranges
An initial load of 5k was again applied to the beam and
strain and dial gauge readings taken The load was then inshy
creased to 80k in 40k increments (lOk or 20k increments were
used in all other tests because separate elastic tests were
not performed on these) and then to 120k in lOk increments
With the load held stationary a slight increase of deflecshy
tion with time was noted on the dial gauges at this load so
67
increments were decreased to 5k bull
At l30k slight lateral deflection of the beam at the
opening was noted although this deflection never became exshy
cessive throughout the remainder of the test Strain gauge
readings first indicated yielding at both the bottom edge of
the upper reinforcing bar at the low moment edge of the openshy
ing (Figure 21 gauge 25) and at the top edge of the top
flange at the high moment edge of the opening (gauge 17) at
a l35k load When the load was increased to 140k yielding
occurred at the other top edge of the top flange at the high
moment edge of the opening (gauge 19) At a load of 145k
yielding had occurred at the center of the top flange at the
high moment edge of the opening (gauge 18) and also in the
web at the centerline of the opening (rosette gauge 10 11
12) At 155k the web at the high moment edge of the openshy
ing had yielded (rosette gauge 13 14 15) as had the web at
the low moment edge of the upper reinforcing bar (rosette
gauge 4 5 6) Slight displacement between the ends of the
opening could be seen at a load of l60k and at l65k the
lower edge of the upper reinforcing bar at the high moment
edge of the opening (gauge 20) had yielded
At l70k the upper edge of the upper reinforcing bar at
the high moment edge of the opening had yielded (gauge 21)
thus making the yielding at the high moment edge of the openshy
68
ing complete (based on average strain values for the flange
and reinforcing) While at this load the first flaking of
the whitewash was noted at both the upper low moment and
the lower high moment corners of the opening The web at the
middepth of the beam between the low moment ends of the reinshy
forcing yielded at 175k (rosette gauge 1 2 3) and whiteshy
wash flaking was detected on the underside of the top flange
at the high moment edge of the opening At lSOk the web at
the low moment edge of the opening (rosette gauge 7 S 9)
yielded and whitewash flaking occurred along the web immedishy
ately beneath the upper reinforcing bar from the low moment
corner of the opening to beyond the low moment end of the
reinforcing bar and also in the web above and below the
opening At 185k whitewash flaking occurred at the lower
low moment corner of the opening and in the web immediately
above the lower reinforcing bar from the corner of the openshy
ing to the low moment end of the reinforcing bar Yielding
occurred at the center of the top flange at the low moment
edge of the opening (gauge 23) at 190k and also at the top
edge of the upper reinforcing bar at the low moment edge of
the opening (gauge 26) This made yielding at the low moment
edge of the opening complete (based on average strain values
for the flange and reinforcing) At this same load whiteshy
wash flaking occurred in the web above and below the low
69
moment end of the upper reinforcing bar
The first strain hardening was also indicated from
strain gauge readings at the load of 190k and occurred in
the web at the centerline of the opening (rosette gauge 10
11 12) At 195k whitewash flaking occurred in the web
between the low moment ends of the upper and lower reinforcshy
ing bars Yielding occurred at the lower edge of the top
flange at the high moment edge of the opening (gauge 16) at
200k and strain hardening occurred at the upper edge of the
top flange at the high moment edge of the opening (gauge 17)
and at the lower edge of the upper reinforcing bar at the
high moment edge of the opening (gauge 20)
At 211k a crack developed in the lower low moment corshy
ner of the opening and it was no longer possible to maintain
the applied load The beam was then unloaded and removed
from the test frame The crack which occurred at the corner
radius was one half inch long and was inclined toward the low
moment end of the lower reinforcing bar A photograph of this
beam after completion of the test can be seen in Figure 24
Of the remaining beams in the test series only 2D 3B
and 4B were implemented with strain gauges the others having
only the brittle coating of whitewash to indicate the order
of onset of yielding The first of these beams to be tested
lA was given too thick a coating of whitewash and the flaking
70
of this whitewash during testing was not as satisfactory as
on other tests Similar problems were encountered with 2A
which had to be given a second coating of whitewash because
most of the first coat was rubbed off due to improper handshy
ling of the beam before testing The flaking off of the whiteshy
wash on beam 2B during testing was also not as good as was
expected although the whitewash had not been applied too
thickly This beam was tested on an extremely humid day
and it is thought that the problem with the whitewash flaking
was due to this excessive humidity
The order of onset of yielding as indicated by strain
gauge readings is given for each of the strain gauged beams
(20 2D 3B 4B) in Table 3a while the order of onset of
strain hardening is given for these beams in Table 3b Loads
corresponding to complete yielding of the cross-sections are
also given The order of whitewash flaking for each of the
beams is given in Table 4 Ultimate loads are also given
along with the mode of collapse of the beam
Of the eleven beams tested all but one were tested to
collapse The test of beam lA was terminated when deflecshy
tions became excessive although no web buckling or tearing
of corners had occurred and the beam was still able to mainshy
tain the applied load Only one of the beams tested to
collapse ultimately failed by web buckling This was the
beam with the unreinforced opening 6A All of the other
71
beams suffered ultimate collapse by the tearing of one or two
of the corners of the opening Beams 2A 2B 2C 3A 4A 4B
and 5A developed cracks at the lower low moment corners of the
openings Beam 3B cracked at the upper high moment corner of
the opening and beam 2D developed cracks at both the lower low
moment and the upper high moment corners of the opening simulshy
taneously Photographs of each of the test beams after collapse
are shovm in Figure 24 Comparison photographs of the beams for
variable moment to shear ratio reinforcing size aspect ratio
and opening depth to beam depth are given in Figures 25 and 26
62 Stress Distributions and Failure Loads
Based on measured strains stresses were calculated for
beams 2C 2D 3B and 4B Elastic stresses were determined
from the usual elastic theory while plastiC stresses were
determined from plasticity theory presented by Hill(8) and
reduced to the form given by Bower(l6) Initiation of strain
hardening was also determined from this method which is
summarized in Appendix B
Stress distributions at the high and low moment edges
of the opening of beam 2C are shown in Figure 27 while those
at the centerline of the opening and across the flange at the
high moment edge of the opening are given in Figure 28 The
variations in bending stress across the length of the opening
72
at the center of the top flange and at the top of the upper
reinforcing bar are shown in Figure 29 Figure 30 shows the
stress distribution at the high and low moment edges of the
opening for beam 3B and the stress distributions at the high
moment edge of the opening of beams 2D a~d 4B are given in
Figure 31
Experimental failure loads for each of the test beams
were determined from the load-deflection curves for each
test as described in Chapter 11 These curves and their
corresponding failure loads are given in Figures 32 through
42 Interaction curves based on the analysis presented in
Chapter III were dravn for each of the test beams using the
actual measured dimensions and yield stresses for each beam
The experimentally deterrQined failure loads were plotted on
these curves which are given in Figures 43 through 50
Approximate interaction curves for nominal dimensions and
yield stresses are also included in these figures
63 Other Factors
Of the eleven beams tested only one underwent signifshy
icant lateral buckling during testing Beam 2B buckled
laterally at the high moment edge of the opening due to the
inadequate lateral support provided as described in Chapter
V However final collapse of this beam was due to the tearshy
73
ing of one of the corners of the opening and not to the
lateral buckling Also the lateral buckling was not
significant until after the very high loads associated with
strain hardening were reached The modified lateral support
system shown in Figures 19b and c and 20bc and d and discussshy
ed in the previous chapter effectively prevented lateral
buckling of the remaining test beams and no further diffishy
oulties were encountered due to this factor
For each of the test beams lateral deflections were
largest at the high moment edge of the opening although they
never became significant except in the case of beam 2B A
curve showing lateral deflection at the high moment edge of
the opening versus shear force at the opening is given for a
typical test beam 20 in Figure 51 The shear corresponding
to the experimental failure load is indicated on the curve
and the laterally unsupported length of the beam is given
The laterally unsupported length of the test beams did not in
any case exceed the lengths specified by the design codes(9 10)
Local buckling of the top flange occurred at the high
moment edge of the opening for several of the beams tested
although this buckling always occurred at very high loads
after considerable strain hardening had taken place Figure
52 shows the difference in strain readings between the upper
and lower edges of the flange at the high moment edge of the
74
opening versus the shear force at the opening for a typical
test beam 20 The distribution of stresses across the width
of the flange at the high moment edge of the opening (Figure
28b) show a relatively uniform distribution up to yielding
at this location However the effects of local flangebull
buckling can be seen by the considerably higher compression
stresses at the edges of the flange at very high values of
shear
The nine beams containing reinforced openings which were
tested to destruction all exhibited an effect which was preshy
viously unexpected The strain gauge readings for rosette
gauges 1 2 3 and 4 5 6 on beam 20 (Figure 21) as well as
the whitewash flruring on all nine of these beams indicated
widespread yielding of the web between the low moment ends of
the reinforcing bars This effect occurred at loads near the
experimental failure loads of the beams but did not interact
with the development of hinges at the corners of the openings
because of the extension of the reinforcing bars well past
the edges of the openings In addition to the shear yielding
in the web between the low moment ends of the reinforcing
bars the whitewash flaking on beams 2D and 4A also indicated
the same type of yielding occurring at slightly higher loads
in the web between the high moment ends of the reinforcing
bars The whitewash flaking in these areas was sufficient
so that it can be seen in some of the photos in Figure 24
75
The shear yielding that occurs in the web between the
ends of the reinforcing bars may be due at least in part to
the development of the strength of the reinforcing bar withshy
in a short part of its anchorage length Considering the
reinforcing bar in compression above the opening it can be
seen that since its strength must increase from zero at the
ends the unbalanced compression force in the beam causes a
shearing force to occur in the web which at the low moment
end of the reinforcing is additive to the existing shears
(due to the vertical shear force on the beam) below the reinshy
forcing and subtracted from those above This is illustrated
in Figure 53 In the same manner the shears resulting from
the tension in the lower reinforcing bar act in the same
direction as and are added to those in the web between the
reinforcing bars while being subtracted from those in the web
between reinforcing and flange At the high moment ends of
the reinforcing bars the same effect can occur since the top
reinforcing bar is usually in tension while the lower bar is
in compression Again the shears between the reinforcing bars
are increased while those between reinforcing bar and flange
are decreased This would account for the yielding in the web
between the low moment ends of the reinforcing bars for all
of the reinforced beams tested to collapse as well as explaining
76
the yielding in the web between the high moment ends of the
reinforcing bars for beams 2D and 4A
77
CHAPTER VII
ANALYSIS OF RESULTS
71 Order of Onset of Yielding
Comparison of the order of onset of yielding as detershy
mined by strain gauge readings and whitewash flaking in
Tables 3 and 4 indicates that the whitewash flaking is a
reliable method of estimating the order of onset of yieldshy
ing Actually since the strain gauges were only at scattershy
ed locations while the whitewash covered the entire area
around the opening the whitewash flaking is a considerably
more complete guide to the order of onset of yielding It
can also be said that yielding begins first at the corners of
the opening as indicated by the whitewash consistently
flaking first at these locations even though it was impossishy
ble to confirm this by strain gauge readings since gauges
could not be fitted in these locations
The yielding patterns clearly indicate that failure of
the beams occurred by complete yielding of the cross-sections
at the edges of the openings ie at the assumed hinge
locations The formation of hinges at these locations was
accompanied or followed by the shear yielding of all or part
of the web along the length of the opening and by the shear
yielding of the web between the low moment ends of the reinshy
78
forcing bars and in two cases also between the high moment
ends of the reinforcing bars The increase in load past the
formation of the first hinge is accompanied by localized
strain hardening Since the corners of the opening yield
considerably before other locations strain hardening probshy
ably begins at these corners well before the first hinge is
completely formed Yielding in the web above and below the
opening does not seem to become complete until considerable
rotation has occurred at the hinge locations The complete
yielding of the web in these areas would indicate that the
full shear capacity of the member is utilized
72 Stress Distributions
Experimental bending and shear stresses are shown for
each of the strain gauged beams (20 2D 3B 4B) in Figures
27 through 31 Straight lines have been drawn through pOints
representing measured stresses although this does not mean
that the variation is necessarily linear Examination of
each of these stress distributions shows that stresses inshy
creased in proportion to increasing loads while the stresses
were still elastic While in the elastic range the neutral
axis remained in approximately the same pOSition but startshy
ed to move after the first yielding had occurred at each
cross-section This is as would be expected
79
Since strain gauge readings were not available for the
edges of the opening it is impossible to follow the complete
progression of yielding for the various cross-sections from
strain gauge readings However since it is lcnown from the
whitewash flaking on the test beams that yielding occurs
first at the corners of the opening where stress concentrashy
tions are high it can be said that at the low moment edges
of the openings (beams 2C and 3B) yielding began first at the
corners of the opening and then progressed to the reinforcshy
ing bars and web before the flange yielded At the high
moment edges of the openings yielding in the flange occurrshy
ed at lower shear values This would be expected from conshy
siderations of the total stresses (primary bending stresses
plus secondary bending stresses due to Vierendeel action) at
the cross-section in question At the flange the secondary
bending stresses are added to the primary bending stresses
at the high moment edge of the opening but subtract from the
primary bending stresses at the low moment edge of the openshy
ing The experimentally determined stress distributions at
the high and low moment edges of the openings are completely
compatible with those assumed in the development of the
theory in Chapter III (Figure 8) Bending stress distribushy
tions along the length of the opening at the top of the upper
reinforcing bar and at the centerline of the top flange show
80
the expected high stresses at the edges of the opening due
to the secondary bending stresses (Figure 29)
Comparison of stress distributions with those presented
by Bower(16) for beams with unreinforced rectangular openings
shows that the addition of horizontal reinforcing bars above
and below the opening changes the position of the neutral
aXiS but does not alter the location where the highest
stresses occur and plastic hinges consequently form The
order of the onset of yielding is also similar to that
found by Bower as was expected
73 Failure Loads
In Table 5 experimentally determined failure loads are
compared to those predicted by the theory presented in
Chapter III for each of the test be~~s Examination of this
table shows that although the theory may be considered someshy
what conservative in high shear for low shear the correlashy
tion between theory and experimental is good and in no case
did the theory overestimate the actual strength of the beam
Table 6 shows the comparison between experimental failure
loads and those predicted by the approximate analysis for
nominal beam dimensions and yield stresses It can be seen
from this table that the approximate method is less conservshy
ative in the high shear region while still not overestimating
81
the strength of the beam An added margin of safety also
exists because the additional strength of the beam due to
strain hardening has not been taken into account This extra
strength is an added safeguard against total collapse even
though it is accompanied by excessive deformations and finalshy
ly involves tearing or pOSSibly buckling
Experimentally determined failure loads are compared
with loads corresponding to complete yielding of cross-secshy
tions for the strain gauged beams (20 2D 3B 4B) in Table
7 It can be seen from this comparison that experimentally
determined failure loads are close to those corresponding to
the complete yielding of the cross-section at the high moment
edge of the opening while loads corresponding to the complete
yielding of the cross-section at the low moment edge of the
opening are considerably higher This can be accounted for
by the considerable amount of strain hardening that is
suspected of occurring at the corners of the opening before
complete yielding of the low moment edge and possibly also
the high moment edge of the opening occurs Complete yieldshy
ing of cross-sections at the high and low moment edges of
the openings are also compared with the theoretical loads
predicted by the analysis of Chapter III in Table 8 Again
the correlation is reasonably good
The performance of each of the test beams was as expectshy
82
ed With the exception of the shear yielding which occurred in
the web at the ends of the reinforcing bars as discussed in
Section 63 The method used in determining experimental
failure loads has been shown to be justifiable on the basis
of the good correlation between these loads and those correshy
sponding to complete yielding of cross-sections at high and
low moment edges of the opening (considering that strain
hardening has not been taken into account) On the basis of
comparison with experimental failure loads the theory develshy
oped in Chapter III has been shown to adequately predict the
performance of a given beam under varying moment to shear
ratios (although conservatively at high shear) The approxshy
imate method as developed in Chapter IV has been shown to
predict beam strength with accuracy adequate for design
purposes (assuming a suitable factor of safety is used)
14 Influence of Reinforcing and Other Variables
As can be seen from comparison of the experimental
results from test beams 2A 3A and 6A and those for beams 2B
and 3B there is a definite increase in beam strength with
the addition of horizontal reinforcing bars As predicted by
the theoretical analysis of Chapter Ill the maximum shear
capacity of a perforated section as given by equation (6)
can be reached by the addition of a certain minimum amount
83
of reinforcing as given by equation (32) If no reinforcing
or an amount less than that required by equation (32) is used
the maximum shear capacity cannot be reached This is conshy
firmed by the result of the tests on beams 2A 3A and 6A
For higher moment to shear ratios the increase in strength
with increased reinforcing size is adequately predicted by
the analysis in Chapter 111 (and also by the approximate
method of Chapter IV) This is confirmed by the tests on
beams 2B and 3B The increase in strength with the addition
of reinforcing bars and with the further increase in the
size of this reinforcing cen be seen by superimposing the
interaction curves of Figures 10 11 and 12 as has been done
in Figure 54
The influence of the magnitude of moment to shear ratio
on the strength of a beam of given size opening and reinforcshy
ing dimenSions is adequately predicted by interaction curves
generated by the method of Chapter 111 and by the approximate
interaction curves as in Chapter IV This is confirmed by
test series 2A 2B 20 2D series 3A 3B and by series 4A
4B See Figures 55 56 and 57
An increase in aspect ratio everything else being held
constant results in a decrease in strength of the beam This
is predicted by the interaction curves in Figures 10 and 13
which are superimposed in Figure 58 for easy reference and
84
is confirmed by the tests on beams in series 2A 4A and
series 2B 4B An increase in hole depth also has the effect
of lowering the strength of the member all other variables
being held constant This is predicted by the interaction
curves in Figures 10 and 14 which are superimposed in Figure
59 and is confirmed by the tests on beams 20 and 5A
The test results have also been plotted in Figures 54
through 59 but because of the variation in the sizes and
yield stresses of the actual test beams these results have
been plotted on the curves (which are based on nominal
dimensions and yields) on the basis of percent difference
be~veen the experimental failure loads of the test beams
and the values predicted by the exact interaction curves
(from measured beam dimensions and yield stresses)
85
CHAPTER VIII
CONCLUSIONS AND RECOMMENDATIONS
81 Conclusions
On the basis of the results and discussion presented in
the previous chapters the following conclusions can be
drawn
1 The flaking off of the brittle coating of whitewash on
the beams during testing is an accurate indication of
the order of onset of yielding although it does not inshy
dicate at what loads yielding actually occurs
2 High stress concentrations exist at the corners of
rectangular openings even when horizontal reinforcing
bars have been added above and below the opening
3 Failure of a beam under moment gradient containing a
single rectangular opening reinforced with horizontal
reinforcing bars above and below the opening occurs by
the formation of a four hinge mechanism the hinges
occurring at cross-sections at the edges of the opening
Ultimate collapse of such a beam occurs by the tearing
of one or more of the corners of the opening provided
the beam has sufficient lateral support to prevent
lateral buckling
4 With the development of the four hinge mechanism large
86
relative displacements take place between the ends of the
opening accompanied by full or partial shear yielding in
the web above and below the opening This yielding when
it occurs over the entire web area is an indication that
the full shear capacity of the section is utilized
5 Because of the shear yielding that occurs in the web beshy
tween the ends of the reinforcing bars the extension of
these reinforcing bars past the ends of the opening (while
designed on the oasis of developing the weld strength)
should not be less than a certain length (as yet undetershy
mined but probably about three inches for the size beam
and openings tested) due to the possible interaction of
the web yielding with the yielding at the corners of the
opening
6 The stress distributions assumed in the analysis in Chapshy
ter III are completely compatible with those found at the
high and low moment edges of the strain gauged test beams
The large influence of the secondary bending moments (due
to Vierendeel action) is confirmed by these stress
distributions
7 The interaction curve resulting from the analysis in
Chapter III predicts with reasonable accuracy the strength
of a beam with given opening and reinforcing size at any
combination of moment and shear This method is however
87
conservative at high shear values
8 The approximate method developed in Chapter IV also preshy
dicts with reasonable accuracy the strength of a beam
with given opening and reinforcing size for the full
range of moment and shear values and is less conservshy
ative at high values of shear
9 Due to the fact that the theory neglects the effects of
strain hardening there is a built in margin of safety
against complete collapse of the member although an
increase in load past the predicted failure load is
accompanied by excessive deformations
10 The correlation obtained between experimentally detershy
mined failure loads and loads corresponding to complete
yielding of cross-sections at the high moment edge of
the opening for the strain gauged beams suggests that
the method used in determining the experimental failure
loads is justifiable Comparison of experimental failure
loads with loads corresponding to complete yielding of
the cross-section at the low moment edge of the opening
would not be expected to be as good because of the strain
hardening that is assumed to occur at the corners of the
opening before this section is completely yielded
11 The addition of horizontal reinforcing bars above and
below a rectangular opening in a beam definitely increases
88
the strength of the beam If greater than a predictshy
able minimum area this reinforcing will make it possible
to achieve the full shear strength of the section as
given by equation (6) Any further increase in reinforcshy
ing size results in a further increase in the moment
capacity of the member for a given value of the shear
force
12 For a given size beam an increase in aspect ratio (openshy
ing length to depth) results in a decrease in the strength
of the beam over the full range of moment to shear ratios
if all other factors are held constant An increase in
the opening depth to beam depth ratio also has the same
effect all other variables being constant
13 The test performed on beam 6A containing the unreinshy
forced rectangular opening further confirmed the analysis
presented by Redwood(17 18) for beams containing single
unreinforced rectangular openings in their webs
82 Recommendations for Design
Based on the good agreement between experimental results
and failure loads predicted by the approximate interaction
curve it is recommended that the approximate method as
described in Chapter IV be used for design purposes assuming
that a suitable factor of safety is used The ease with
89
which the necessary calculations can be carried out makes
this method extremely practical The use of this method can
be outlined as follows When it is decided to cut an openshy
ing in the web of a beam for the passage of utilities the
necessary size of opening should first be determined and an
approximate interaction curve constructed for the beam conshy
taining an unreinforced opening by using e~uations (52) (53)
and (55) Mp and Vp should be calculated from equations (1)
and (3) respectively A line should then be drawn from the
origin at the particular moment to shear ratio which repshy
resents the actual position of the proposed opening in the
beam and extended to intersect the approximate interaction
curve The intersection of this line with the interaction
curve then represents the capacity of the beam if the openshy
ing is not to be reinforced If this capacity is less than
that required it is necessary to reinforce the opening
and reinforcing should be chosen on the basis of satisfying
the inequality of equation (41) The reinforcing should be
chosen so that the right hand side of equation (41) is not
greatly exceeded An approximate interaction curve for a
beam containing an opening with this size reinforcing can
then be constructed by using equations (42) (43) and (45)
where Ar is given by the right hand side of equation (41)
The intersection of the MV line with this approximate intershy
go
action curve then gives the capacity of the beam with this
size reinforcing If this exceeds the required capacity of
the section this size reinforcing should be adopted
However if the required capacity of the beam is greater
than that given by the approximate interaction curve two
possibilities may exist If the required shear is greater
than the maximum shear capacity of the section as given by
the vertical line on the approximate interaction curve or
by equation (42) then either shear reinforcing must be
added or the depth of the section increased in order to
provide the required strength If however the required
shear capacity is not greater than that given by equation
(42) but the point representing the required capacity of the
beam on the MV line lies outside the apprOximate intershy
action curve the area of reinforcing should be increased
above the value given by equation (48) and a new approximate
interaction curve constructed using equations (42) (45)
(49) (50) and (51) If the required capacity is still
greater than that given by this new approximate interaction
curve the reinforcing size would have to be further increased
until the reinforcing is such that the required strength is
provided The reinforcing size that meets this requirement
should then be adopted for use
91
83 Reoommendations for Future Work
With the completion of this study on the ultimate
strength of beams containing single rectangular openings
reinforced with straight reinforcing bars above and below
the openings it is logical that attention would turn to
similar studies for other commonly used opening shapes in
particular circular and extended circular openings with
horizontal reinforcing bars Also of interest would be an
ultimate strength investigation of reinforced closely spaced
multiple openings of rectangular or circular shape
Since the decision to cut and reinforce an opening in
the web of a beam is based primarily on economic considershy
ations an investigation into reducing the cost of reinshy
forced openings would be very much justified As the cost
of welding is paramount among the other factors involved in
reinforcing an opening reducing the e~mount of welding is
desirable If the horizontal reinforcing bars used in the
present study were doubled in size and welded to only one
side of the web above and below the opening the cost of
reinforcing would be almost halved while the same area of
reinforcing would be available for resisting the shear and
moment forces on the section However other factors such
as twisting moments would have to be taken into conSideration
due to the asymmetry of the section about its vertical axis
92
that would result from this type of reinforcing arrangement
An investigation of the ultimate strength of wide poundlange
sections containing large rectangular openings reinforced
with one-sided straight horizontal bar reinforcing has
already been initiated at McGill University
More information is also needed on the anchorage of the
reinforcing bars It would be desirable to determine at
what length such reinforcing is capable opound assuming its full
load An investigation of the required extension of reinshy
forcing bars past the ends of the opening to prevent preshy
mature poundailure due to interaction between hinge formation
and web yielding at reinforcing ends is also necessary
93
1)
) )J + 1 +1 I I
I
( a) (b)
I + --+--~+ -f--- -shy
I (c) (d)
II I I
I I j+shy
) 1)I l J I
(e) ( f)
Types of Reinforcing
Figure 1
94
primary bending stresses
secondary bending stresses
Stress Distribution at Opening
Figure 2
Ql ID Q)
Jt p ID
er
I I I I I I I
E I I I poundy Ipoundst strain
Idealized Stress-Strain Curve for structural Steel
Figure 3
---------- -----
95
MM unperforated beam no interaction
10~----~==~==~L---------------------~
~
unperforated beam including interaction
10 vVp
Interaction Curve - Unperforated Beam
Figure 4
-- -----------
96
deflection Pure Bending
(a)
~ o
r-I
deflection Bending with Shear
(b)
Load-Deflection Curves
Figure 5
97
1O~------------------------------------------~
l I
unperforated beamshy
shy
I r perforated beam
no interaction
----------- perforated beam l including interaction I I I I I I I I I
I I
Interaction Curve - Perforated Beam
Figure 6
i
98
1 CD (2) TIT
L
( a)
b
d2
(b)
Hinge Locations and Cross-section of Member
Figure 7
99
( a)
(S r CSyr+
tltS ltl direct shear direct shear
Stress Distribution at CD Stress Distribution at CD (for reversal in reinforcing)
Case I - Low Shear
+
CSyr ltS shy
direct shear
Stress Distribution at CD
Case 11 - High Shear
(b)
Stress Distributions and Resultant Forces
Figure 8
100
low highshear shear
I Ml4p k--~_____U_k-----LS_~_(_U_+-=q-)_____-L (u+q)kl s~s
I I r I I
I I I 1 I10
~-int eraction II curve 11
11
11 I I 11 I I
- I - I Iapproximate ~
interaction curve------ - 1
11~I11
i I I
I (d-2h-2t)I_~ I
d-2t 11
(1 -~) q
Interaction Curve Showing Low and High Shear Regions
Figure 9
101
14D38 7 x lof Opening
6 bull77611 x ~middotReinforcing 1 0513
03~
CH 125 1412700
0313 =--9F 0375 =Jb
approximate method ---l------ Case 11
04 vVp
Interaction Curve - 14WF38 Nominal
Figure 10
102
14WF38 7 x 10r Opening 6776 05132tbull
x e 3middot
Reinforcing
1412 11
10
approximate method Case I
04
Interaction Curve - 14WF38 Nominal
Figure 11
103
14WF38 7 x 10f Opening
0513No Reinforcing
MMp
10
-----approximate method for unreinforoed opening
04 VVp
Interaction Curve - 14WF38 Nominal
Figure 12
104
l4WF38 7 x l4~ Opening1pound x tReinforcing
Iapproximate method Case 11
I I I
04
Interaction Curve - l4WF38 Nominal
Figure 13
105
14WF38 9X 13- Opening lmiddotfx p Reinforcing
0513
1412
~-approximate method ~ Case IIIB
approximate method Case I
04
Interaction Curve - l4WF38 Nominal
Figure 14
106
10WF2l
5 x sf Opening 034(iIf x iWReinforcing t~l0240
CH h
55Q 125 990 025Q 0250~
approximate method ~ Case IlIA
approximate method I Case I
I I I
04
Interaction Curve - lOWF2l Nominal
Figure 15
107
43 11 39 18 0 (
I
I I i lA
26
I
111 99 I- middot1 t
22 2-S 45 J
) C
r I
2A
13 ) lA I ~
I)II45 35 ( ()
I
I
I If 2B
f 16~ 9 25 I2t~ 21-+1 1 1 i
30 11 24 27 0- 10- ro- )
I ~ I I
20
2119YlO 151( 21~fI211~ - rr I I
Test Beam Dimensions and
Dial Gauge Looations
Figure 16
108
tI
2D
22tl 231 45 tlI
( l (
I
3A
3119 Yt 11~ 34ft J3n~
45 25 J 35 ) (~ i-
I
I 1 3B
H 25 ft2ft5 cI 16 J2++ I I1 I
t 0- 23 45 J0- 0- (
I 4A
~5 ( 32 J211~ 2 YYt -IIII
Test Beam Dimensions and
Dial Gauge Locations
Figure 17
log
45 ~ 25 5S ) ~ (
4B
2 crYI 15 25 J-I2++ Irr
L J30 24 27 ~lt) (P-L
I 5A
2tYY 13 26211 1 I
22 6
6A
i
Test Beam Dimensions and
Dial Gauge Locations
Figure 18
--
110
If JL
a (1) p 02 ~
Cfl
tlOO ~ r-I 0 0 Q)
m ~ ~
Q SoOM
r-I Xl m ~ (1) p cD H
r-shy
~ ishy fO I- It
111
o N
-()
112
~ --- ~
~
~~ ~~
II I of
rf
A tshyshy I
1
ID I ~ I 0I middotrt
a1 +gt
- -l~ 0 ()
-t I H CJ
4gt 4gt bO ~
~ ~ Cl -rt
fiI
~ a1 ~
+gt CJI
~ amp ~ ~ ~ --- ~ I
II s I
~CJ~ 4t ~
I~ i ~
o
i-~ ~ - l
II I +1 I Ij
~I r
I tf~ft N
- shy
stress 8 1
lower Yield-lt ~i == 11 static yield-shyI l- 2 1 2 ~
( a)
F F-CL F-E [(4 ~
W-H- - shy
strain ( b)
Tensile Coupons Stress-Strain Curve from Instron Testing Machine
Figure 22 Figure 23 I- I- vJ
I
114
lA 2A 2B
20 2D 3A
3B 4A 4B
5A 6A
FIGURE 24
115
2B 20 2D 3A 3B 4At 4B
Variable Moment to Shear Ratio
20 5A
Variable Opening Depth to Beam Depth
FIGURE 25
116
2A 4A 2B 4B
Variable Opening Length to Depth
2B 3B
Variable Reinforoing Size
FIGURE 26
bullbull
117
Notes Shear force shown in kipsbott of flange bull Elastic o Yielded
r ~ 3
o
top of reinf
boundaryof opening bott of reinf~ ioiiIo ~_ 10 o 10 ~ ~ - Dending Stress Shear Stress
Ca) Stress Distribution at High Moment Edge of Opening - 20
~ bull
~ ~ boundary ~ of opening~
-0 I) 10 40 o to lO ~ Sending Stress Shear stress
(b) Stress Distribution at Low Moment Edge of Opening - 20
Figure 27
118
boundaryof opening
-70 0 __ tQ
Bending Stress Shear Stress
Ca) Stress Distribution at Oenterline of Opening - 20
-1iCgt
~I--=-shyoo---~-=-~ogt---- ---0 - ____ A~Sshy-
middot------------e----- ~~~ ~_______~-----Lr---t-o~p~of flangeo
oE
Cb) Bending Stress Distribution Across Flange at High Moment Edge of Opening - 20
Figure 28
119
-40
-lt0 lt----- shylow
moment edge gtgt bull
lt 0
high54 boundary of opening moment
edge ltgtgt
to
Ca) Bending Stress Distribution Across Length of Opening at Top of Flange - 20
high moment
edge
o
Cb) Bending Stress Distribution Across Length of Opening at Top of Reinforcing - 20
Figure 29
120
boundary---~~~~~~~~___ of Opening
o10 D
Bending Stress Shear Stress
(a) Stress Distribution at High Moment Edge of Opening - 3B
ibull
boundaryof opening
10 Igt lO
Bending Stress Shear Stress
(b) Stress Distribution at Low Moment Edge of Opening - 3B
Figure 30
bull bull bull bull
121
11 9 ~ oS j j ~
boundaryof opening
-lt10 -20 lt) -I-Lo Q lO 10
Bending Stress Shear Stress
(a) stress Distribution at High Moment Edge of Opening - 2D
boundaryof openin
-40 -20 0 ZO o 10 ZQ 30
Bending Stress Shear Stress
(b) Stress Distribution at High Moment Edge of Opening - 4B
Figure 31
122
Test Beam - lA
O6in relative defleotion between opening ends
Figure 32
Test Beam - 2A
O6in relative deflection between opening ends
Figure 33
123
lateral buckling - highmoment edge of opening413k-- shy
Test Beam - 2B
O6in relative deflection between opening ends
Figure 34
bull first strain hardening --~ complete yielding - low
moment edge of opening-J- -- --shy
J complete yielding - high moment edge I of opening I ----first yielding
Test Beam - 20
O6in relative deflection between opening ends
Figure 35
124
---- complete yielding - high moment edgeof opening
first yielding
Test Beam - 2D
O6in relative deflection between opening ends
Figure 36
Test Beam - 3A
O6in relative deflection between opening ends
Figure 37
125
k ---shy497 ---~ --1shy complete yieldingI J
---- first yielding
O6in
Figure 38
O6in
Figure 39
- high moment edge of opening
Test Beam - 3B
relative deflection between opening ends
Test Beam - 4A
relative deflection between opening ends
126
430k--shy
k445--shy
---f-----shy ----complete yielding shy
I ----first yielding
06in
Figure 40
O6in
Figure 41
high moment edgeof opening
Test Beam - 4B
relative defleetion between opening ends
Test Beam - 5A
relative deflection between opening ends
127
k45 o-~--
Test Beam - 6A
O6in relative deflection between opening ends
Figure 42
128
10 shy
10WF21
5t x ampf Opening If x t Reinforcing
~~approximate interaction ~ nominal dimensions and
~ ~
+~ ~ ~
I interaction curve ---I Imeasured dimensions and yields I
I I
04
Interaction Curves - Test Beam lA
Figure 43
curve yields
129
14WF38 7 x lot Opening
bull SIt x a Reinforcing
~-----approximate interaction curve nominal dimensions and yields
interaction curve-------- I
measured dimensions and yields
bull
Interaction Curves - Test Beams 2A and 2B
Figure 44
130
l4WF38 f x 10i Opening 11 x middotf Reinforcing
10 - ~approximate interaction curve nominal dimensions and yields
interaction curve----~ measured dimensions and yields
04
Interaction Curves - Test Beams 2C and 2D
Figure 45
10
131
l4WF38 7middotx lof Opening 2f x ~uReinforoing
approximate interaction curve nominal dimensions and yields
~
1 +3A
I interaction curve -------J
measured dimensions and yields
04
Interaction Curves - Test Beam 3A
Figure 46
10
132
14WF38 7 x lOi~ Opening2f x ~ Reinforcing
~ ~approximate interaction curve ~~ nominal dimensions and yields
~ ~ ~ ~ ~
I I
interaction curve ------I measured dimensions and yields
04
Interaction Ourves - Test Beam 3B
Figure 47
10
133
14WF38 H
7 x 14 Opening 1t x Reinforcing
-~
~~approximate interaction curve ~ nominal dimensions and yields
~ ~ +4B
~ ~ ~
~ interaction curve-----l measured dimensions and yields I
I I
04
Interaction Curves - Test Beams 4A and 4B
Figure 48
134
14WF38 9 x 13t~ Opening lix ~uReinforcing
10 --~ ~~approximate interaction curve
nominal dimensions and yields
~ ~
SAl
interaction curve measured dimensions and yields
04 vVp
Interaction Curves - Test Beam 5A
Figure 49
10
135
14WF38 7 x lof Opening No Reinforcing
r----approximate interaction curve nominal dimensions and yields
+ 6A
----interaction curve measured dimensions and yields
04
Interaction Curves - Test Beam 6A
Figure 50
136
shear (kips)
70
60
---- shear corresponding to experimental failure
50
40
30
20
laterally unsupported length = 54 inohes10
40 80 120 160 200 240
lateral deflection (in x 10-3 )
Lateral Deflection at High Moment Edge of Opening - 20
Figure 51
137
shear (kips)
70
60
------------shear oorresponding to experimental failure
50
40
30
20
10
4 8 12 16 20 24 28
strain differenoe at top flange (inin x 10-3)
Flange Buokling at High Moment Edge of Opening - 20
Figure 52
138
D f
P --IL-=====bull--Jf--P + dP
Shear Stresses at End of Reinforcing
Figure 53
139
l4WF38 7 x lot
Opening
3shy10 f ~--2f x e
Reinforcing
If x ~ Reinforcing
+3A +2A
No Reinforcing + 6A
04
Variable Reinforcing Size
Figure 54
140
14WF38 7 x lof Opening If xl-Reinforcing
+ 2B
+20
+2A
+2D
04 vVp
Variable Moment to Shear Ratio
Figure 55
141
14WF38 7x 10f Opening2i x iReinforcing
10 ---------- shy
+3B
+3A
04 vVp
Variable Moment to Shear Ratio
Figure 56
142
14WF38 7x 14~Opening 1f x f Reinforcing
+ 4B
+ 4A
04 vVp
Variable Moment to Shear Ratio
Figure 57
143
14WF38 1thx imiddotReinforCing
7 x lot Opening
7 x 14 Opening---
04
Variable Aspect Ratio
Figure 58
144shy
14WF38
------7middot x 10i Openinglift x ~~Reinforeing
9 x 13f Opening +20 Ii x i Reinforoing
+5A
04
Variable Opening Depth to Beam Depth
Figure 59
--
r b --1 t l=Ii= W
d
u q
Beam Size ~ d b t w 2a 2h u q c x R bull lA 10WF21 43 989 578 0324
11
0244 875 550 N
0260 0253 2720 N
400 316
2A 14WF38 22 1413 677 0496 0326 1046 700 0383 0381 2813 300 58
tI tI If If If tI tf tI It n tI It2B 45
ff 11 It2C 30 1422 668 0490 0305 1045 0267 0368 2720 n tI n tt tI tI n n tI2D 17 If tI n3A 22 1413 677 0496 0326 1046 0383 0381 5313 600
It 11 It If3B 45 1422 668 0490 0305 1045 0329 0361 5230
tf tI 11 tI fI tI tI4A 22 0340 0368 2720 300 If It tI ff If tI If It n4B 45 n n tI tt f1 tI5A 30 1344 901 0305 0371 3770 425
11If fI6A 22 1045 700 shy - - shy Table 1 -I
foo J1
146
Ave Test Coupon Desig- Testing Lower Static Lower Beam
Beam Location nation Machine Yield Yield Yield Series lA web W Riehle 573 - 573 lA
nflange F 362 - 431 nF 435 shy
F-E It 462 shyItreinf R 370 370
2B web W Instron 417 405 413 2A2B W 11 3A412 398
flange F Riehle 374 - 388 F-CL Instron 382 371 F-E It 397 395
reinf Rl Riehle 434 - 437 2D web W Instron 567 550 558 2C2D
rtW 540 527 3B4A 4B5Aflange F 490 474 446 6AItF-CL 418 406
F-E 478 shyIt 2C2Dreinf R6 398 384 398 4A4B
3A web W 11 411 shyfIflange F 398 379
reinf R2 Riehle 440 shyfI3B reinf R4 330 - 331 3B
R4 11 332 shyR4 Instron 332 shy
4A web W 565 549 flange F 11 487 476
F-CL 406 398 nF-E 429 415 5A reinf R5 tI 437 429 444 5A
R5 450 422 It6A web W 559 545 Itflange F 463 450 fIF-CL 408 402
F-E ff 438 425
Tensile Test Results
Table 2
147
Beam 20 2D 3B 4BLocation Top edge upper fl - BM edge 450K 575K 433lC 300
Bott upper reinf - LIvI edge 450 500 400 317 ~ top upper fl - BM edge 483 600 367 317 Web - ~ open 483 500 517 450 Web - BM edge 517 550 400 350 Web - LM end of upper reinf 517 - - -Bott upper reinf - BM edge 550 550 500 350 Top upper reinf - BM edge 567 800 467 433 ~ web - between LM ends reinf 583 - - shyWeb - LM edge 600 - 583 shy~ top upper fl - LM edge 633 - 600 shyTop upper reinf - LM edge 633 - 467 500 Bott edge upper fl - BM edge 667 - 517 383 Complete yield - BM edge - 567 625 483 383 Complete yield - LM edge 633 - 600 shy
(a) Shear Values Corresponding to Yielding
Location Beam 2C 2D 3B 4B
Top edge upper fl - BM edge 667k 775
k 567k 483k
Bott upper reinf - LM edge - 800 583 -~ top upper fl - BM edge - 775 533 -Web - ~ open 633 700 583 -Web - EM edge - 750 - -Bott upper reinf - BM edge 667 775 - -
(b) Shear Values Corresponding to Strain Hardening
Table 3
- - - - - - -
- - - - - - - - -
- -
BeamLocation Upper fl - BM edge Lower fl - BM edge Lower LM corner open Upper LM corner open Lower BM corner open Upper ID~ corner open Web above open Web below open Low Uif corner to end reinf Up n~ corner to end reinf Low IDH corner to end reinf Up rIM corner to end reinf Between ends reinf LM end Between ends reinf HM end Upper reinf - BM edge open Lower reinf - BM edge open Upper reinf - ilA edge open Lower reinf - LM edge open Lateral buckling - BM edge Web buckling at open Tearing - lower LM corner Tearing - upper BM corner
lA 2A 2B 20 2D 3A 3B ~ lI Ilt v 162 500 400 583 700 525 433
180 - - - 725 - 517 191 550 417 617 600 550 567 191 575 442 567 575 600 433
- 575 467 567 575 600 433
- 575 - - 600 600 shy202 625 475 600 600 700 533
- 625 475 600 625 700 583
- - - 617 700 - 550
- - - 600 675 675 550
- - - - - 675 shy
- 600 458 650 675 650 583
- - - - 725 - -- - - - - 725 -- - - - - 675 -- - - - - - -- - - - - 675 shy- - 483 - - - shy
- 700 517 703 825 775 shy- - - - 825 - 600
4A 4B Ilt Ilt
450 333 500 417 450 367 450 366 500 383 450 417 550 483 600 483 550 400 550 433 625 shy625 shy575 467 575 shy500 shy550 417
- 450 500 383
--675 513
5A le
350 500 400 400 433 483 433 467 500 417
--
500
--
467 500
---
517
-
6A
400 533
-367 367 383 433 533
-----------
550
--
Shear Values Corresponding to Whitewash Flaking
J-ITable 4 ~ 00
149
~hear a1 Beam Size MV [Failure Vp Exp VVp Theor VV_ Diff
lA 10WF21 43 180K 746K 0241 0235 + 26 2A 14WF38 22 532 1L021 0520 0466 +116 2B 11 45 413 0404 0363 +113 2C If 30 548 1301 0421 0403 + 45
u n2D 17 670 0515 0420 +226 n3A 22 575 1021 0562 0466 +206 tt3B 45 497 1301 0382 0345 +107 11 n4A 22 572 0440 0360 +222 n4B 45 430 0330 0295 +119 If It5A 30 445 0342 0296 +155 116A 22 450 0346 0271 +277
Correlation Between Experiment and Theory
Table 5
~hear at Approximate Beam Size MV Failure Exp VV Theor VV DiffVp p p
lA 10WF21 43 180K 746 K
0241 0254 - 51 2A 14VlF38 22 532 1021 0520 0503 + 34
It2B 45 413 0404 0344 +175 If2C 30 548 1301 0421 0414 + 17
It2D 17 670 0515 0505 + 20 3A 22 575 1021 0562 0505 +103
n3B 45 497 1301 0382 0377 + 13 4A tI 22 572 n 0440 0463 - 50
It It 03094B 45 430 0330 + 68 5A 30 445 tr 0342 0353 - 31 6A 22 450 tt 0346 0257 +346
Correlation Between Experiment and Approximate Theory
Table 6
150
Shear at Shear at Shear at Beam MV Failure Full Yield Dif Full Yield Dif
Exp H M Edge L M Edge k k k2C 30 548 567 + 35 633 +155
2D 17 670 625 - 67 - shy3B 45 497 483 - 28 600 +207 4B 45 430 383 -109 - shy
Correlation Between Experimental Failure and Complete Yielding
Table 7
Theor Shear at Shear at Beam MV Shear at Full Yield Dif Full Yield Diff
Failure H M Edge L M Edge
2C 30n 525k 567k + 80 633k +206 2D 17 546 625 +145 - shy3B 45 449 483 + 76 600 +336 4B 45 384 383 - 03 - shy
Correlation Between Theoretical Failure and Complete Yielding
Table 8
151
APPENDIX A
Computer Program for Interaction Curve
A computer program was developed to generate an intershy
action curve for a specified beam opening and reinforcing
size according to the method described in Chapter Ill The
program was wri tten in Fortran IV and can be used on any
standard digital computer that makes use of this language
The input for the program should be of the form given in
the following table
Data Number Items on of Cards Data Cards
Number of beams 1 NB
Dimensions of beams NB dbtw
Yield Stresses NB CS111 S~ lts
Number of openings per beam NB NE
Sizes of openings NH ah
Number of reinforcing sizes per opening NH NR
Sizes of reinforcing NR uqc
A listing of the computer program is given on the following
pages
152
C THIS PROGRA~ CO~PUTES ThE INTERACTION CURVE RELATING MOMENT AND C SHEAR VALUES WHICH CAUSE FAILURE OF A WICE FLANGE bEAM CONTAINING C A REINFORCED RECTANGULAR OPENING AT ThE MIDOEPTH C
REAL KlK2MPMMPKllK12K21 t K22 581 FORMAT(5FIO3) 584 FORMAT(3FIO3) 582 FOR~AT(2FIO3) 583 FORMA1(I5 681 FORMAT(lINTERACTION
lOt 0 B T 682 FORMAT( F133F63 683 FORMAT(O SIGF 684 FORMAT( 5F93
BETwEEN MOMENT AND SHEARtw)
SIGw SIGR VP Mpt)
605 FORMAT(O OPENING LENGTH middotF73middot HEIGHT =F73) 606 FORMAT(O MMP VVP SIG 601 FORMAT( middot5FI04 608 FORMATOV IS TOO LARGE SO SIGMA BECCMES 609 FORMATtOHIGH SHEAR SOLUTION) 611 FORMAT(O U QC) 612 FORMATe 3F63) 613 FORMAT(O STRESS REVERSAL IN REINFORCING 614 FORMATOSTRESS REVERSAL IN CLEAR WEe 615 FORMAT(O STRESS REVERSAL IN WEB STUB) b16 FORMAT(OLOW SHEAR SClUTIONt) 618 FORMATtO MAxIMU~ VVP Fb3)
c READ(S583)NB 00 200 I=lNB RE~D(5581tOBTW
READ(5584)SIGFSIGWSIGR VP=W(0~2T)SIGWSQRT(3) MP=BTSIGF(D-T bullbullW(D-2Tl2SIGW4 WRITE(6681) WRITEI6682)DtB t TW WRITE(6683) WRITE(~684)SIGFSIGWSlGRVPtMP
REAO(SS83)NH DO 200 ~=lNH
RE~D(5582JAH
REAC5583) NR A2=2A H2=2H WRITE(6605)A2H2 VVPM=(O-2T-2H)0-2T) WRITEt6618) VVPM CO 200 J=lNR READ(5584) UQC
Kl K2~)
COMPLEXJ
153
WRITE(661U WRITE(661Z) UQC WRITE(6606) VINCR=OO V=OO S=OZ-H-T AW=SW Af=BT AR=(C-WjQ R=U+Q
C C LOW SHEAR SOLUTION C C STRESS REVERSAL IN WEB STUB C
WRITE(66161 WRITE(661S)
101 V=V+VINCR XX=$IGWZ-O7SV2AW2 IF(XX) 201]00300
300 SIG=SQRT(XX) ALPHA=ARSIGR(AFSIGf BETA=AWSIGCAfSIGf) Cl=T+SBETA C2=-(D-2HJ C3=VAAFSIGF) C4=C22-40ClC3 IF(C4408399399
399 K21=(-C2+$QRT(C4)(2Cl K22=(-C2-SQRTCC4raquo)(2Clt Kll=K21BETA KI2=K22BETA IF(K21)330301301
301 IFK21-10)30230233C 302 IFCKll1330304304 304 IFKllS-U)320320330 330 IF(K22)408)31331 331 IF(K22-10)33233Z40a 332 IF(KIZ)408333333 333 IF(K12S-UJ32132140S 320 K2=K21
Kl=Kl1 GO TO 322
321 K2K22 Kl=K12
322 FY=AFSIGF(S+T2)+AWSIGSS(1-2Kl2)+ARSIGR(U+Q2) F=AFSIGF+AWSIG(1-2Kl+ARSIGR M=2FY+20HF-VA
154
MMP=MMP VVP=VVP WRITE(6607)MMPVVPSIGKlKZ VINCR=VP500 GO TO 101
C C STRESS REVERSAL IN REINFORCING C
408 WRITE(6613 GO TO 409
902 V=Vl 701 V=V+VINCR
XX=SIGW2-015V2AW2 IF(XX9011CQ100
100 SIG=SQRTXX) 409 Rl=(C-W)SIGR
R2=AWSIG+SRl Cl=T+SAFSIGFRZ C2=2SURIR2-(D-2HJ C3=VA(AFSIGF)+U2Rl(AFSIGFraquo)(SR1RZ-1) C4=C22-40C1C3 IF(C4)418403403
403 K21=(-C2+SQRT(C4)(Z0Cl KZ2=-C2-SQRT(C4)(Z0Cl) Kll=AFSIGFK21R2+URlR2 K12=AFSIGFK22R2+URIR2 IF(K21)430401401
401 IF(K21-10)4C240243C 402 IF(K11S-U)430404404 404 IF(Kl1S-R)42042043C 430 IFK22)418431431 431 IF(K22-10)432432418 432 IF(K12S-U418433433 433 [FtK12S-R)421421418 420 K2=K21
K l=K 11 GO TO 422
421 K2=K22 Kl=K12
422 FY=AFSIGFtS+T2)+AWSIGSS(1-2Kl2) 1 +(C-W)SIGR(U2+UC+SQ2-(KlS)2)
F=AFSIGF+AWSIG(I-2Kl)+(C-WJSIGR(2U+Q-2KlS) M=20FY+20HF-VA ~MP=MMP
VVP=VVP IF(MMP 418423423
423 WRITE(6601)MMPVVPSIGKlK2 VINCR=VP500
155
GO TO 701 C C STRESS REVERSAL IN CLEAR WEB C
418 WRITE(6614) GO TO 419
922 V=Vl 801 V=V+VINCR
XX=SIGW2-075V2AW2 IF(XX)921800800
800 SIG=SQRT XX) 419 Cl=AFSIGFS(AWSIG)+T
CZ=-O+2H-2SARSIGR(AWSIG) C3=VACAFSIGF)+2U+Q2)ARSIGR(AFSIGF)
1 +S(ARSIGR2fAFSIGFAWSIG C4= C224 ClC3 IF(C4)428410410
410 KZl=(-C2+SQRTCC4)(ZCl K22=(-C2-SQRTCC4)ZC1) Kll=AFSIGFK21(AWSIG)-ARSIGR(A~SIG)
K12~AFSIGFK22(AWSIG)-ARSIGRAWSIG)
IF(K21)S30501501 501 IFK21-10)502502530 50Z IF(KllS-RS30504504 S04 IF(Kll-l0S20520510 530 IFtKZ2)428531531 531IF(K22-10)532532428 532 IF(K12S-R428533533 533 IF(K12-10)521S21428 520 1lt2=K21
Kl=Kl1 GO TO 522
521 1lt2=K2Z Kl=K12
522 FY=AFSIGF($+T5+AWSIGS(i-2bullbullKl212-ARSIGR(U+Q2) F=AFSIGF+AWSIG(1-2Kl-ARSIGR M=2FY+2HF-VA MMP=MMP VVP=VVP IF (MM P) 428523523
523 WRITE(6601)MMPVVPSIGKlK2 VINCR=VP 500 GO TO 801
c C HIGH SHEAR SOLUTION C
428 WRITE(oo09) GO TO 352
156
2 V=Vl 4 V=V+V INCR
XX=SIGW2-015V2AW2 IF(XXJI0235D350
350 SIG=SQRHXX) 352 AlPHA=ARSIGR(AfSIGf
BETA=AWSIG(AfSIGf) 429 02=-10-BETA-AlPHA
03=05VA(AFSlGFT)+AlPHA+8ETA+O5(AlPHA+8ETA)2+OS8ETAST 1 +AlPHA(U+Q2IT-CD-2H(AlPHA+8ETA)O5T
04=D22-403 IFCD4)102351351
351 K21=(-D2+SQRTID4raquo2 K22=(-D2-SQRT(04112 Kll=1O+8ETA+AlPHA-K21 K12=10+BETA+AlPHA-K22 IFCK21630601601
601 IF(K21-10602~0263C
602 IF(Kll)630604604 604 IFIKll-10)62062D63C 630IFCK22)102631o31 631 IFIK22-10)632632102 632 IF(K12)102633633 633 IF(K12-10)621621lC2 620 K K21
Kl=Kll GO TO 622
621 K2=K22 Kl=K12
622 FYPT=Kl(D-2H)-TKl2-(S+ST) FY=AFSIGFFYPT-AWSIGS2-ARSIGRlU+Q2bullbull F=AFSIGfC2KI-l-AWSIG-ARSIGR M=20FY+20HF-VA MMP=MMP VVP=VVP IF(MMP) 102623623
623 WRITE(6607)MMPVVPSIGKlK2 VINCR=VPIOO GO TO 4
102 V I=V-VINCR VINCR=VINCRIOO VIMIN=VPI00DOO IF(VINCR-VIMIN) 19922
901 Vl=V-VINCR VINCR=VINCR200 VIMIN=VPIOOOO IF(VINCR-VIMIN)199902902
c
C
157
921 V1=V-VINCR VINCR=VINCRI200 VIMIN=VPI10000 IF(VINCR-VIMIN)199922922
199 CONTINUE GO TO 200
201 CONTINUE WRITE(b608)
200 CONTINUE RETURN END
158
APPENDIX B
Plasticity Relationships
In the elastic range stresses were computed from measured
strains by the usual elastic theory The values used for the
modulus of elasticity E and the shear modulus Gtwere 29OOOksi
and 11200ksi respectively When local yielding had occurred
according to the von Mises criterionas stated by equation (2)
Chapter 11 stresses were then computed by the plasticity
relations given by Hill(8) and reduced to the form given by
Bower(16) These relations are stated here for easy reference
Plasticity relations for a Prandtl-Reuss solid yield
dE = des _ ~(d)+ 2G dt (a)xT3Gt~xy
where E x is strain in the longitudinal direction and l$ xy
is the shearing strain Eliminating ~ by use of the von
Mises criteria gives
(b)
Since explicit integration of equation (b) would be
extremely difficult the equation is diVided by dE-x and the
derivatives d tSd E and d 6 yld poundx are replaced byx x
159
(c)
( d)
where~i and ~XYi are the bending and shearing stresses
respectively corresponding to ~ and ~f and ~xYf are
these stresses corresponding to poundx + 6 (x
Substituting equations (c) and (d) into equation (b)
gives
A~x - B6~ + AtS cs = AY l (e)
f
where (f)
and ( g)
The shear stress corresponding to a change in strain is given
by
2 2 ~ =Jcsy - CS f (h)
f [3
In order to determine whether strain hardening had occurred
an equivalent strain Xp was computed from
160
where lIE Xl ~yp Ezp and xyp are the plastic components of
strain and are given by
~ xp = poundx-t ( j)
Eyp = E yy (S
- i (k)
E (1)poundzp = z -~ (m)xyp = 6xy -
~
~
The constant volume condition was used to calculate ~ zp
(n)
The equivalent strain was compared to a reference strain
~ pr computed from the value for ~p for the onset of strain
hardening for a tensile test The strain hardening strain
was taken as euro x and it was assumed that E = poundoz For yy
A36 steel the strain hardening strain was taken as 115 ~yIE
and ~y was determined from a tensile test of a coupon from
the web of the test beam Strain hardening was considered
resent J f 6 gt or J P degpr-
The above relationships were included in a paper
presented by Bower(16) in 1968
161
BIBLIOGRAPHY
1 Muskhelishvili NISome Basic Problems of the Mathematical Theory of ElasticityU 2nd Edition P Noordhoff Itd 1963
2 HelIer SR Jr Brock JS and Bart R The itresses Around a Rectangular Opening with Rounded Corners in a Beam Subjected to Bending with Shear Proceedings Vol 1 Fourth U National Congress on Applied Mechanics Berkeley Calif 1962
3 Bower JE ItElastic Stresses Around Holes in WideshyFlange Beams Journal of the Structural Division ASCE Vol 92 No ST2 Proc Paper 4773April 1966
4 BowerJE Experimental Stresses in Wide-Flange Beams with Holes tl Journal of the Structural Division ASCE Vol 92 No ST5 Proc Paper 4945October 1966
5 So WC The Stresses Around Large Circular Openingsin the Webs of Wide-Flange Beams MEng Thesis McGill University Aug 1963
6 Chen IC tiThe Stresses Around Two Large Openings in the Webs of Wide-Flange Beams MEng Thesis McGill University Aug 1967
7 Segner EP Jr Reinforcement Requirements for Girder Web Openings Journal of the Structural Division ASCE Vol 90 No ST3 Proc Paper3919 June 1964
8 HillR The Mathematical Theory of PlastiCityClarendon Press Oxford University Press London 1950
9 Handbook of Steel Construction Canadian Institute of Steel Construction OntariO 1967
10 ltSpecifications for the DeSign Fabrication and Erection of Structural Steel for Buildings AISC 1963
11 Basler K Strength of Plate Girders in Shear Journal of the Structural Division ASCE Vol 87 No ST7 Proc Paper 2967 October 1961
162
12 Worley WJ Inelastic Behavior of Aluminum AlloyI-Beams With Web Cutouts University of Illinois Engineering Experimental Station Bulletin No 448 April 1958
13 Redwood RG and McCutcheon J 0 Beam Tests with Unreinforced Web Openings Journal of the Structural Division ASCE Vol 94 No ST1 Proc Paper5706 Jan 1968
14 nCommentary of Plastic DeSign in Steel ASCE Manual of Engineering Practice No 41 1961
15 Cheng SY flAn Investigation of Large Extended Openingsin the Webs of Wide-Flange Beams MBng Thesis McGill University Aug 1966
16 Bower JE Ultimate Strength of Beams with RectangularHoles Journal of the Structural Division ASCE Vol 94 No ST6 Proc Paper 5982 June 1968
17 Redwood RG Plastic Behavior and Design of Beams with Web Openings ff Proceedings of the Canadian Structural Engineering Conference Canadian Institute of Steel Construction Toronto Feb 1968
18 Redwood RG The Strength of Steel Beams with Unreinshyforced Web Holes Civil Engineering and PubliC Works Review Vol 64 No 755 London June 1969
19 Redwood RG Ultimate Strength Design of Beams with Multiple Openings Proceedings of the Structural Engineering Conference American Society of Civil Engineers Pittsburgh October 1968
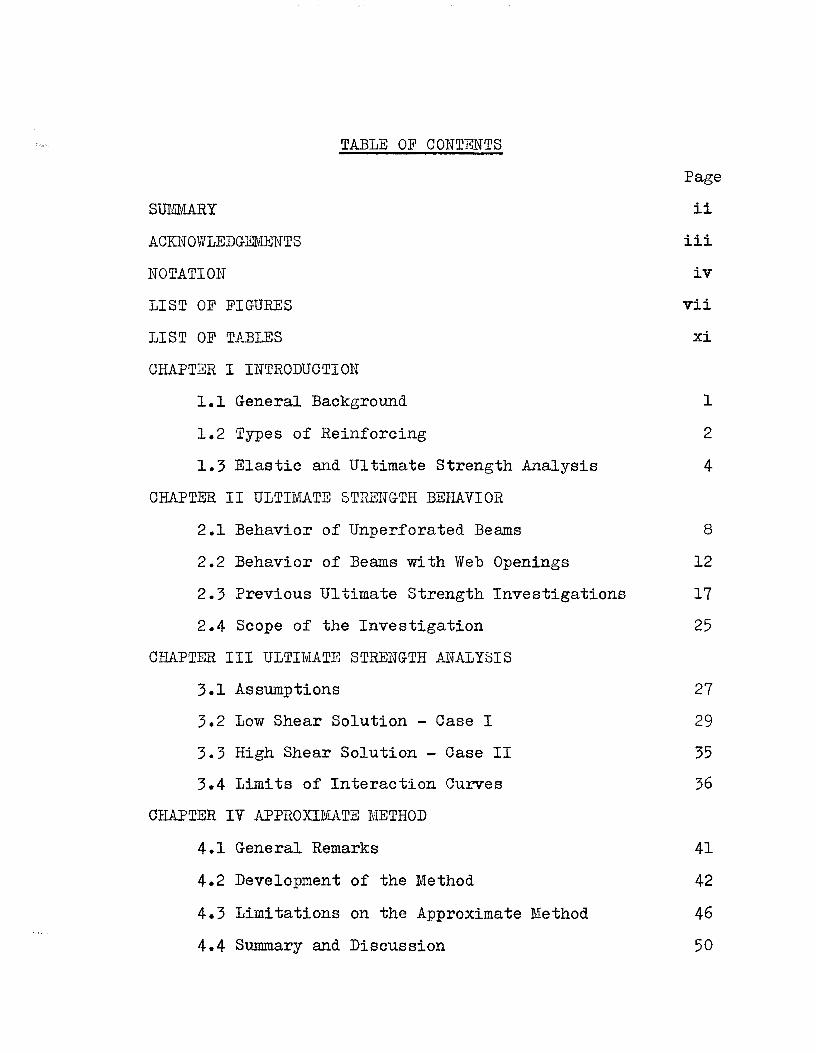