
www.urt-resistors.com
AEC-Q200 . RoHS
1 Revision 13/02/2017
APPLICATIONS
FEATURES
• Upto15Wpermanentpowerinfreeair.• Continuouscurrentloadupto350A(0.1mohm)• Highpulsepowerrating.• Maximumfasteningtorque10Nm• Shuntavailablewithtinnedoruntinnedterminals.• Openframeelectronbeamweldedpunchedouttype.
• CurrentsensorforEBM(ElectronicBatteryManagement)inmotorcars,trucks,forklifts,hybrid&electricvehicles.
• Currentsensinginbusbars.• Currentsensinginweldingequipments
UEB SERIESLOW OHM BATTERY SHUNT RESISTORS
PARAMETER / PERFORMANCE TEST & TEST METHOD PERFORMANCE REQUIREMENTS
PowerRating ForFeCrAl-Fullpowerdissipationat70°Candlinearlyderated tozeroat+170°C. ForManganin(<0.5%ImprovedStability)- Fullpowerdissipationat105°C&linearlyderatedtozeroat+135°C. ForManganin(<1%Stability)-Fullpowerdissipationat140°C andlinearlyderatedtozeroat+170°C.Inductance <1nHResistanceTolerance ±1%(0.5%andothertoleranceavailableonrequest)TemperatureRange -40°Cto+170°CVoltageRating/LimitingVoltage/Max.WorkingVoltage PxR(Subjecttomax.TerminalTemperatureof120°C)TemperatureCoefficientofResistance <50ppm/K(DependingonResistanceValue)(AmbientTemperatureRange20°C-60°C)LifeTest/OperationalLife-2000hratedpowerwith ΔR±1%-AverageTemperaturelimitationonTerminalkeptat120°CThermalEMV(0-60°C) 0.3μV/KInternalheatresistance(Rthi) From2°K/W
ELECTRICAL AND ENVIRONMENTAL CHARACTERISTICS
www.urt-resistors.com
AEC-Q200 . RoHS
2 Revision 13/02/2017
UEB SERIESLOW OHM BATTERY SHUNT RESISTORS
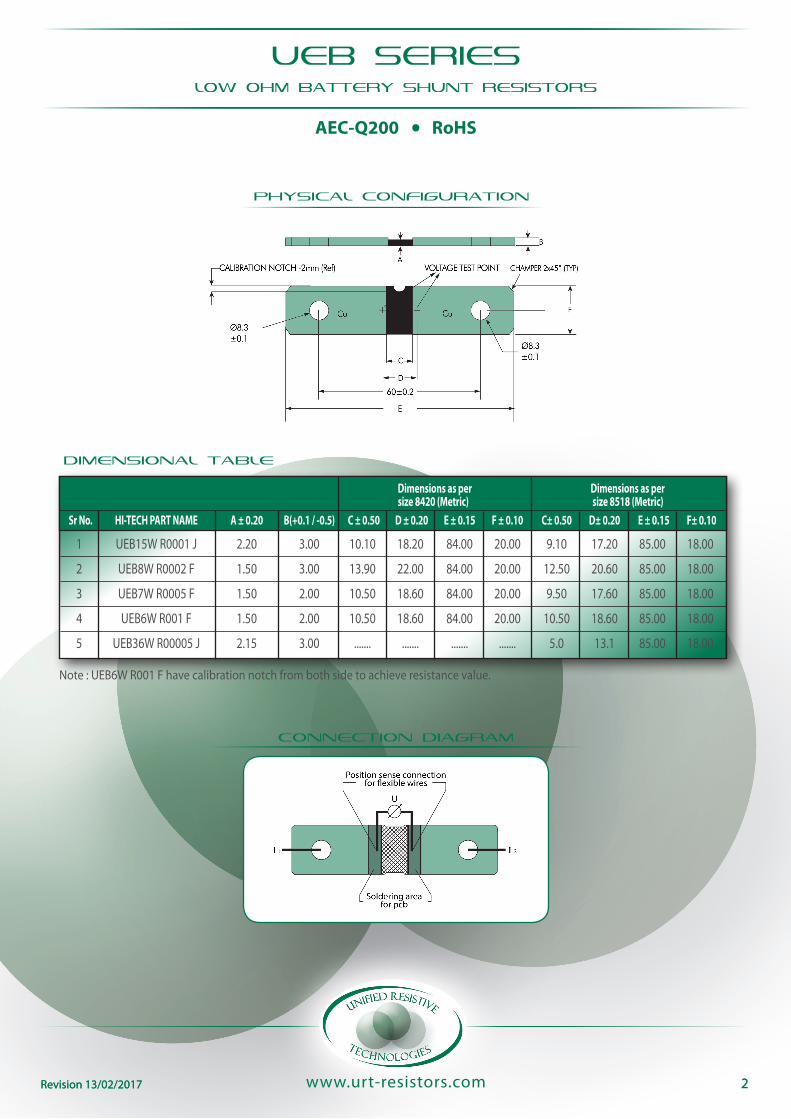
PHYSICAL CONFIGURATION
DIMENSIONAL TABLE
Note:UEB6WR001Fhavecalibrationnotchfrombothsidetoachieveresistancevalue.
Dimensions as per Dimensions as per size 8420 (Metric) size 8518 (Metric) Sr No. HI-TECH PART NAME A ± 0.20 B(+0.1 / -0.5) C ± 0.50 D ± 0.20 E ± 0.15 F ± 0.10 C± 0.50 D± 0.20 E ± 0.15 F± 0.10
1 UEB15WR0001J 2.20 3.00 10.10 18.20 84.00 20.00 9.10 17.20 85.00 18.00
2 UEB8WR0002F 1.50 3.00 13.90 22.00 84.00 20.00 12.50 20.60 85.00 18.00
3 UEB7WR0005F 1.50 2.00 10.50 18.60 84.00 20.00 9.50 17.60 85.00 18.00
4 UEB6WR001F 1.50 2.00 10.50 18.60 84.00 20.00 10.50 18.60 85.00 18.00
5 UEB36WR00005J 2.15 3.00 ....... ....... ....... ....... 5.0 13.1 85.00 18.00
CONNECTION DIAGRAM
2Revision13/02/2017
www.urt-resistors.com
AEC-Q200 . RoHS
3 Revision 13/02/2017
UEB SERIESLOW OHM BATTERY SHUNT RESISTORS
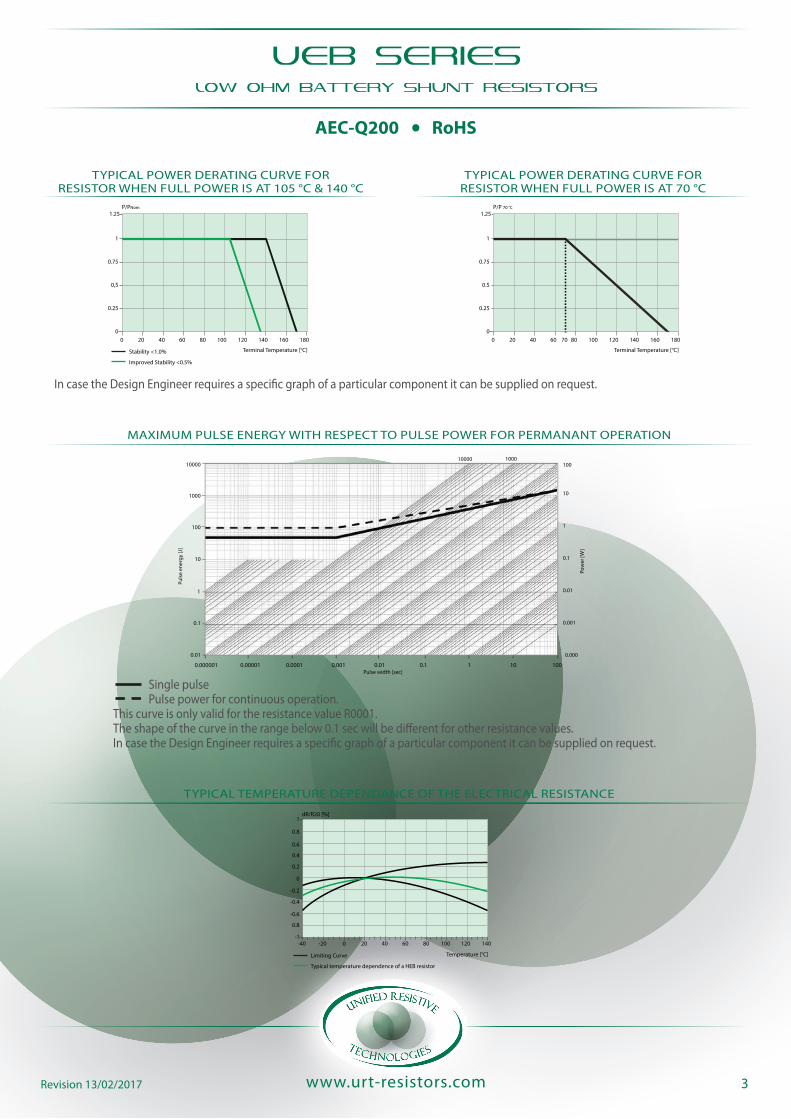
TYPICALPOWERDERATINGCURVEFORRESISTORWHENFULLPOWERISAT105°C&140°C
TYPICALPOWERDERATINGCURVEFORRESISTORWHENFULLPOWERISAT70°C
IncasetheDesignEngineerrequiresaspecificgraphofaparticularcomponentitcanbesuppliedonrequest.
TYPICALTEMPERATUREDEPENDANCEOFTHEELECTRICALRESISTANCE
4/4
Rev Date : 06/09/2016
LOW OHM BATTERY
SHUNT RESISTORS
HEBSize
8420(Metric) &
8518(Metric)
www.htr-india.com
TYPICAL POWER DERATING CURVE FOR RESISTOR WHEN FULL POWER IS AT 105° C & 140° C
TYPICAL POWER DERATING CURVE FOR RESISTOR WHEN FULL POWER IS AT 70° C
Single pulsePulse power for continuous operation.
This curve is only valid for the resistance value R0001.The shape of the curve in the range below 0.1 sec will be different for other resistance values.In case the Design Engineer requires a specific graph of a particular component it can be supplied on request.
In case the Design Engineer requires a specific graph of a particular component it can be supplied on request.
TYPICAL TEMPERATURE DEPENDANCE OF THE ELECTRICAL RESISTANCE
MAXIMUM PULSE ENERGY WITH RESPECT TO PULSE POWER FOR PERMANANT OPERATION
10000
1000
100
10
1
10000 1000
0.000
0.001
0.01
0.1
1
10
100
0.1
0.01
0.000001 0.00001 0.0001 0.001 0.01 0.1 1 10 100Pulse width [sec]
Puls
e en
ergy
[J]
Pow
er [W
]
1
0.75
0.5
0.25
00 20 40 60 8070 100 120 140 160 180
1.25
Terminal Temperature [°C]
P/P 70 °C
1
0.75
0,5
0.25
00 20 40 60 80 100 120 140 160 180
1.25
Terminal Temperature [°C]
P/PNom
Stability <1.0%
Improved Stability <0.5%
-40-1
1
0.8
0.6
0.4
0.2
0
-0.2
-0.4
-0.6
0.8
-20 0 20 40 60 80 100 120
Temperature [°C]
dR/R20 [%]
Limiting Curve
Typical temperature dependence of a HEB resistor
140
e : [email protected]/4
Rev Date : 06/09/2016
LOW OHM BATTERY
SHUNT RESISTORS
HEBSize
8420(Metric) &
8518(Metric)
www.htr-india.com
TYPICAL POWER DERATING CURVE FOR RESISTOR WHEN FULL POWER IS AT 105° C & 140° C
TYPICAL POWER DERATING CURVE FOR RESISTOR WHEN FULL POWER IS AT 70° C
Single pulsePulse power for continuous operation.
This curve is only valid for the resistance value R0001.The shape of the curve in the range below 0.1 sec will be different for other resistance values.In case the Design Engineer requires a specific graph of a particular component it can be supplied on request.
In case the Design Engineer requires a specific graph of a particular component it can be supplied on request.
TYPICAL TEMPERATURE DEPENDANCE OF THE ELECTRICAL RESISTANCE
MAXIMUM PULSE ENERGY WITH RESPECT TO PULSE POWER FOR PERMANANT OPERATION
10000
1000
100
10
1
10000 1000
0.000
0.001
0.01
0.1
1
10
100
0.1
0.01
0.000001 0.00001 0.0001 0.001 0.01 0.1 1 10 100Pulse width [sec]
Puls
e en
ergy
[J]
Pow
er [W
]
1
0.75
0.5
0.25
00 20 40 60 8070 100 120 140 160 180
1.25
Terminal Temperature [°C]
P/P 70 °C
1
0.75
0,5
0.25
00 20 40 60 80 100 120 140 160 180
1.25
Terminal Temperature [°C]
P/PNom
Stability <1.0%
Improved Stability <0.5%
-40-1
1
0.8
0.6
0.4
0.2
0
-0.2
-0.4
-0.6
0.8
-20 0 20 40 60 80 100 120
Temperature [°C]
dR/R20 [%]
Limiting Curve
Typical temperature dependence of a HEB resistor
140
4/4
Rev Date : 06/09/2016
LOW OHM BATTERY
SHUNT RESISTORS
HEBSize
8420(Metric) &
8518(Metric)
www.htr-india.com
TYPICAL POWER DERATING CURVE FOR RESISTOR WHEN FULL POWER IS AT 105° C & 140° C
TYPICAL POWER DERATING CURVE FOR RESISTOR WHEN FULL POWER IS AT 70° C
Single pulsePulse power for continuous operation.
This curve is only valid for the resistance value R0001.The shape of the curve in the range below 0.1 sec will be different for other resistance values.In case the Design Engineer requires a specific graph of a particular component it can be supplied on request.
In case the Design Engineer requires a specific graph of a particular component it can be supplied on request.
TYPICAL TEMPERATURE DEPENDANCE OF THE ELECTRICAL RESISTANCE
MAXIMUM PULSE ENERGY WITH RESPECT TO PULSE POWER FOR PERMANANT OPERATION
10000
1000
100
10
1
10000 1000
0.000
0.001
0.01
0.1
1
10
100
0.1
0.01
0.000001 0.00001 0.0001 0.001 0.01 0.1 1 10 100Pulse width [sec]
Puls
e en
ergy
[J]
Pow
er [W
]
1
0.75
0.5
0.25
00 20 40 60 8070 100 120 140 160 180
1.25
Terminal Temperature [°C]
P/P 70 °C
1
0.75
0,5
0.25
00 20 40 60 80 100 120 140 160 180
1.25
Terminal Temperature [°C]
P/PNom
Stability <1.0%
Improved Stability <0.5%
-40-1
1
0.8
0.6
0.4
0.2
0
-0.2
-0.4
-0.6
0.8
-20 0 20 40 60 80 100 120
Temperature [°C]
dR/R20 [%]
Limiting Curve
Typical temperature dependence of a HEB resistor
140
MAXIMUMPULSEENERGYWITHRESPECTTOPULSEPOWERFORPERMANANTOPERATION
SinglepulsePulsepowerforcontinuousoperation.ThiscurveisonlyvalidfortheresistancevalueR0001.Theshapeofthecurveintherangebelow0.1secwillbedifferentforotherresistancevalues.IncasetheDesignEngineerrequiresaspecificgraphofaparticularcomponentitcanbesuppliedonrequest.
4/4
Rev Date : 06/09/2016
LOW OHM BATTERY
SHUNT RESISTORS
HEBSize
8420(Metric) &
8518(Metric)
www.htr-india.com
TYPICAL POWER DERATING CURVE FOR RESISTOR WHEN FULL POWER IS AT 105° C & 140° C
TYPICAL POWER DERATING CURVE FOR RESISTOR WHEN FULL POWER IS AT 70° C
Single pulsePulse power for continuous operation.
This curve is only valid for the resistance value R0001.The shape of the curve in the range below 0.1 sec will be different for other resistance values.In case the Design Engineer requires a specific graph of a particular component it can be supplied on request.
In case the Design Engineer requires a specific graph of a particular component it can be supplied on request.
TYPICAL TEMPERATURE DEPENDANCE OF THE ELECTRICAL RESISTANCE
MAXIMUM PULSE ENERGY WITH RESPECT TO PULSE POWER FOR PERMANANT OPERATION
10000
1000
100
10
1
10000 1000
0.000
0.001
0.01
0.1
1
10
100
0.1
0.01
0.000001 0.00001 0.0001 0.001 0.01 0.1 1 10 100Pulse width [sec]
Puls
e en
ergy
[J]
Pow
er [W
]
1
0.75
0.5
0.25
00 20 40 60 8070 100 120 140 160 180
1.25
Terminal Temperature [°C]
P/P 70 °C
1
0.75
0,5
0.25
00 20 40 60 80 100 120 140 160 180
1.25
Terminal Temperature [°C]
P/PNom
Stability <1.0%
Improved Stability <0.5%
-40-1
1
0.8
0.6
0.4
0.2
0
-0.2
-0.4
-0.6
0.8
-20 0 20 40 60 80 100 120
Temperature [°C]
dR/R20 [%]
Limiting Curve
Typical temperature dependence of a HEB resistor
140

www.urt-resistors.com
AEC-Q200 . RoHS
4 Revision 13/02/2017
PACKAGING
Resistorsshallbepackedinsealedplasticpacketsplacedinsmallcardboardcartons(Type‘A’Box)ofapproximatesize200mmx150mmx70mm-200pcs.&such2BoxespackedinMasterCartonofapproximatesize310mmx205mmx95mm.
StorageCondition(Packed):Temp25°Cto35°C,Humidity30to80%RH,Shelflife-12monthsFloorLife(Unpacked):Temp25°Cto35°C,Humidity30to80%RH,Floorlife-15days
UEB SERIESLOW OHM BATTERY SHUNT RESISTORS
MARKING
URTPARTNO PRINTING
UEB15WR0001J URT R0001 5%DATECODE
ORDERING INFORMATION
SERIES TYPE PACKING RESISTANCEVALUE TOLERANCE
UEB UEB15W Bulk R0001 F
1.ForRoHsversion-UEB15W2.ForTinnedversion-UEB15W-T3.ForUntinnedversion-UEB15W-TU


