
01
TY
ND
P 20
18 S
cena
rio
Rep
ort
TYNDP 2018
Scenario ReportMain Report
Foreword
FOREWORD 1
1. Introduction 2 1.1. Public Consultation Summary
2. Scenario description and storylines 6 2.1. Scenario Global Climate Action 2.2. Scenario Sustainable Transition 2.3. Scenario Distributed Generation
3. Scenario Results 16 3.1. Demand 3.2. Supply 3.3. Increase of Renewable Energy Sources 3.4. Reduction in CO2 Emissions 3.5. Electricity Marginal Cost 3.6. Benchmarking
4. Stakeholder process, feedback and 34 how this shaped the scenarios
5. Scenario development methodology 38 5.1. Changes and improvements from TYNDP 2016/2017 scenarios 5.1.1. ENTSO-E TYNDP 2016 scenarios 5.1.2. ENTSOG TYNDP 2017 scenarios 5.1.3. Improvements for TYNDP 2018 5.2. Main methodology elements 5.2.1. Electricity sector methodology elements 5.2.2. Gas sector methodology elements 5.3. Scenario fuel and carbon price
assumptions
6. Next Steps 48
7. Glossary 50 7.1. Definitions 7.2 Abbreviations 7.3 Useful information
Contents
1
TY
ND
P 20
18 S
cena
rio
Rep
ort
It is with great pleasure that the two ENTSOs release this Scenario Report.
Our infrastructure is the backbone for the delivery of gas and electricity to citizens across all of the EU. It aims to connect countries and ensure secure, competitive and sustainable access to energy for customers throughout the year. As the EU voluntarily undertakes the energy transition, this infrastructure will have a key role to play in supporting the uptake of new technologies and meeting ambitious decarbonisation challenges. The TYNDPs are here to assess the requirements for these aims, in terms of the infrastructure. The starting point for that is to define scenarios depicting the future which the EU strives to achieve.
For the first time, both ENTSOs have pooled efforts to develop a common set of scenarios, building on their combined expertise and modelling capabilities as well as on the input received from dozens of stakeholders from the industry, NGOs, National Regulatory Authorities and Member States. This co-development approach results in a set of ambitious, technically robust and equally realistic scenarios. Joint scenarios outline three markedly different possible paths towards a low-carbon energy system in line with EU targets. They build on innovative and challenging storylines and are complemented by an additional perspective based on the EC EUCO 30 policy scenario.
Both ENTSOs believe that the unique value of the presented scenarios lies in their comprehensiveness and transparency. This makes them the best possible foundations on which to perform a fully-fledged and fully consistent test and assessment of the electricity and gas infrastructure, against the very same possible future developments, as part of the TYNDPs 2018. We also see these transparent scenarios as a sound basis for any party wishing to perform their own analysis of future energy policies, market designs or technologies. The scenarios highlight that consumers will be central to achieving decarbonisation, through an evolution of behaviour, a fit-for-purpose regulatory framework and reliance on a renewable energy through new usages. This will especially be the case for the transport and heating sectors, where clear complementarities and synergies appear between electricity and gas. In this context, smart integration of the electricity, gas and transport systems and smart approaches to handling peak demand will be key in the future energy landscape.
Decarbonisation should be smart, efficient and secure. Therefore, for the first time together both ENTSOs examine the possible renewable generation, renewable gases development and the uptake of a wide range of technologies, among which smart grid technologies, centralised or smaller-scale electricity storage, power-to-gas or CCS/CCU still deserve to be further explored.
The presented scenarios set the scene for EU energy and climate goals. The TYNDPs will next assess what is required, in terms of developing the electricity and gas infrastructure, for society to materialise the benefits of meeting EU ambitious goals.
Following the release of the draft report, scenario workshop and subsequent public consultation, the ENTSOs have endeavoured to improve both the scenarios themselves and the supporting publications. We now look forward to the next steps in the TYNDP process.
Jan IngwersenGeneral Manager, ENTSOG
Laurent SchmittSecretary General, ENTSO-E
3
TY
ND
P 20
18 S
cena
rio
Rep
ort
What is this report about? This Scenario Report provides a detailed overview of possible European energy futures up to 2040. All scenarios have been built as realistic and technically sound, based on forward looking policies, whilst also being ambitious in nature and aiming at reducing emissions by 80 to 95% in line with EU targets for 20501. They will be used by ENTSOs and other organisations to analyse the future of the European energy system, starting with the yearly Mid-term Adequacy Forecast released for consultation by ENTSO-E in autumn 2017 and the Ten Year Network Development Plans for gas and electricity to be released in 2018.
New platforms to study the future of gas and electricity, designed by allFor the first time, the ENTSOs for gas and electricity have pooled their efforts and expertise to provide a joint set of scenarios, allowing for assessments of future investment decisions in Europe to be based on comparable analysis between the sectors.
Dozens of representatives from all sides of the energy sector, consumer and environmental associations, governments and regulators have co-constructed a new set of storylines with the ENTSOs. Together, we described three markedly different and ambitious paths towards delivering the future European emission targets. They have been complemented by an external scenario for 2030. These scenarios set the frame for a rich range of indicators including macro-economic trends, energy use in different sectors, technological input assumptions and power generation by fuel type.
This uniquely common approach has led to resolutely forward-looking scenarios. The expertise of gas and electricity TSOs also ensures that the scenarios are broadly technically feasible; for instance, making it possible to maintain the energy balance at all time in each country. This is key to test the need and performance of possible future infrastructure in challenging but realistic situations.
What are the main storylines of the scenarios?The TYNDP 2018 scenarios cover from 2020 to 2040. 2020 and 2025 are labelled as Best Estimate scenarios due to a lower level of uncertainty. As uncertainty increases over longer time horizons, the 2030 and 2040 scenarios have been designed with European 2050 targets as an objective, recognising the work done in the e-Highway 2050 project2.
The scenarios for 2030 and 2040, co-constructed with stakeholders representing among others the industry, NGOs, Member States and Regulators, follow these storylines:
Sustainable TransitionTargets reached through national regulation, emission trading schemes and subsidies, maximising the use of existing infrastructure.
Distributed GenerationProsumers at the centre – small-scale generation, batteries and fuel switching society engaged and empowered.
Global Climate ActionFull speed global decarbonisation, large-scale renewables development in both electricity and gas sectors.
External Scenario: Based On EUCO 30 is a core policy scenario produced by the European Commission. The scenario models the achievement of the 2030 climate and energy targets as agreed by the European Council in 2014, but including an energy efficiency target of 30%. The ENTSOs both welcome this new collaboration with the European Commission and welcome further cooperation.
Section 1
Introduction
1 https://ec.eur opa. eu/clima/policies/ strategies/2050_en2 http://www.e-highway2050.eu/e- highway2050/The e-Highway 2050 project addressed the developments of the pan-European electricity
transmission network in 2050, dealing with the transition paths for the whole power system.
How to read this report?The report is intended to provide readers with a condensed overview of the scenarios. This includes the storylines and key assumptions of these scenarios (Section 2) that lead into the scenario results (Section 3) in terms of demand, supply and EU climate targets. The stakeholder engagement process (Section 4) has been fundamental in selecting which scenarios to consider and give them their framework. The significant changes in the scenario building process that have taken place compared to the latest TYNDP editions are summarised in the scenario development methodology (Section 5). This intensive scenario development process is the starting point towards electricity and gas TYNDPs’ next steps (Section 6).
The ENTSO’s scenario development process is unique in that it comes with a huge amount of scenario data, at country-level granularity, made transparently available public-wide, which goes beyond the overview provided in this Scenario Report. Interested stakeholders are invited to review the additional information and data provided within the Annexes, that now includes the public consultation feedback received following the launch of the Draft Scenario Report.
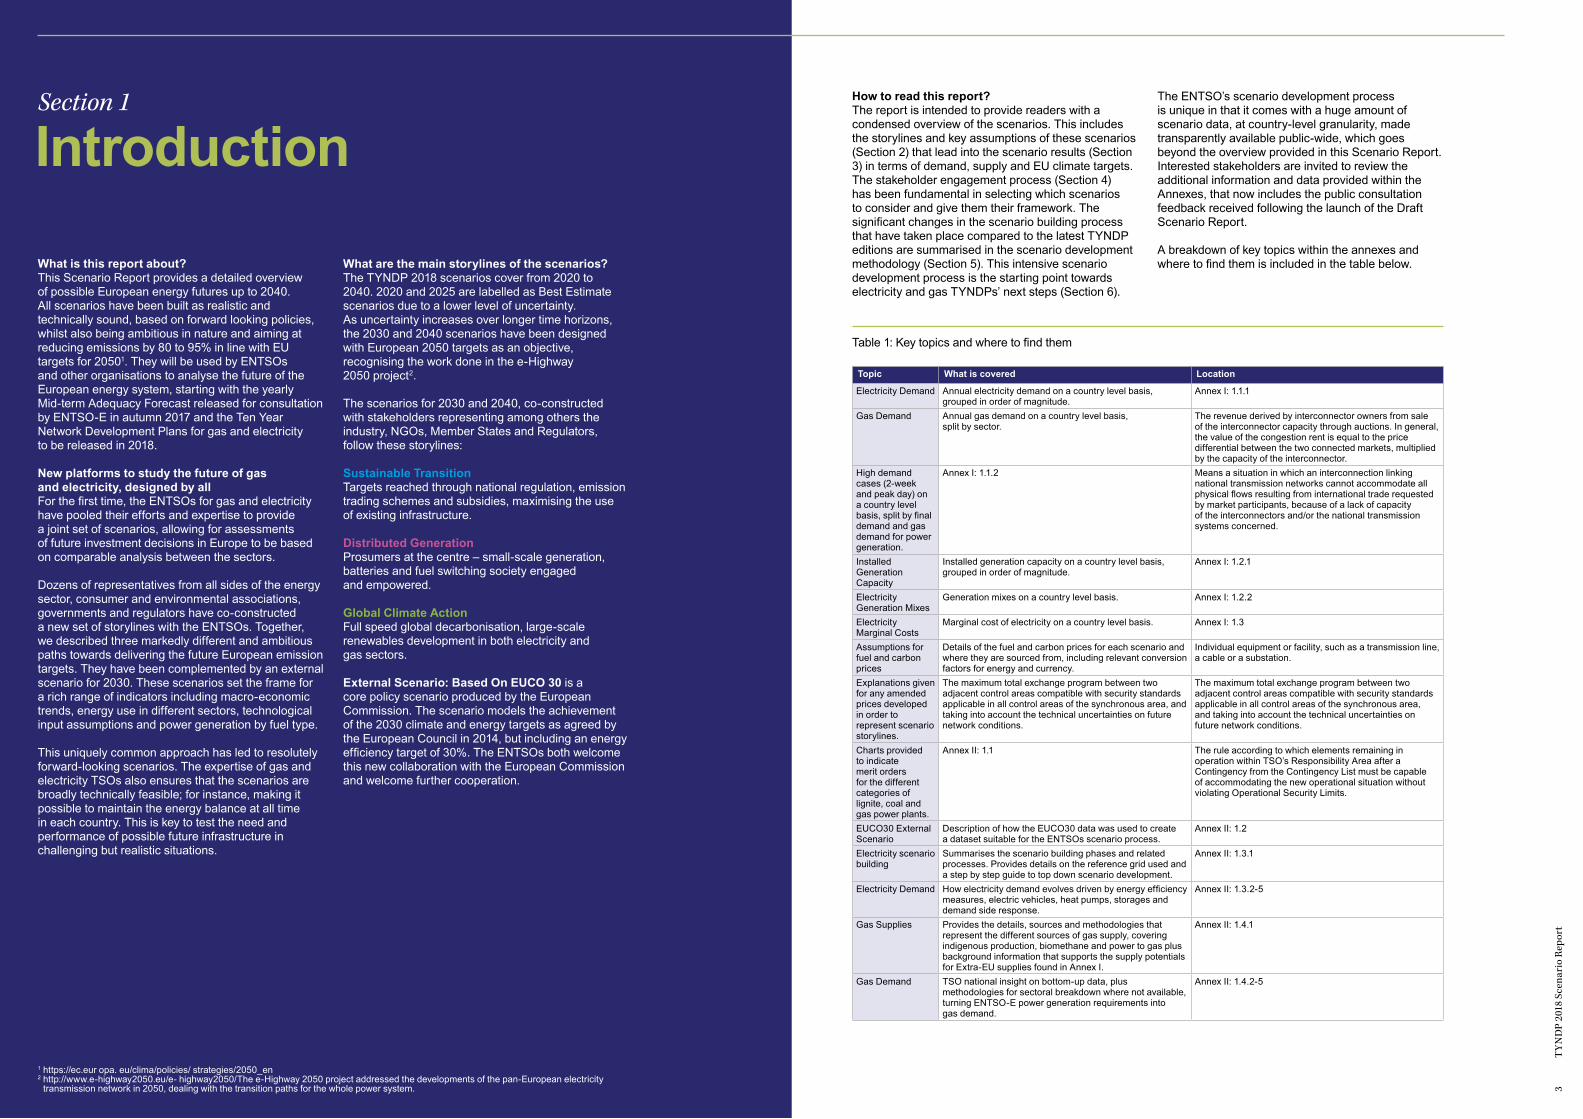
A breakdown of key topics within the annexes and where to find them is included in the table below.
Topic What is covered Location
Electricity Demand Annual electricity demand on a country level basis, grouped in order of magnitude.
Annex I: 1.1.1
Gas Demand Annual gas demand on a country level basis, split by sector.
The revenue derived by interconnector owners from sale of the interconnector capacity through auctions. In general, the value of the congestion rent is equal to the price differential between the two connected markets, multiplied by the capacity of the interconnector.
High demand cases (2-week and peak day) on a country level basis, split by final demand and gas demand for power generation.
Annex I: 1.1.2 Means a situation in which an interconnection linking national transmission networks cannot accommodate all physical flows resulting from international trade requested by market participants, because of a lack of capacity of the interconnectors and/or the national transmission systems concerned.
Installed Generation Capacity
Installed generation capacity on a country level basis, grouped in order of magnitude.
Annex I: 1.2.1
Electricity Generation Mixes
Generation mixes on a country level basis. Annex I: 1.2.2
Electricity Marginal Costs
Marginal cost of electricity on a country level basis. Annex I: 1.3
Assumptions for fuel and carbon prices
Details of the fuel and carbon prices for each scenario and where they are sourced from, including relevant conversion factors for energy and currency.
Individual equipment or facility, such as a transmission line, a cable or a substation.
Explanations given for any amended prices developed in order to represent scenario storylines.
The maximum total exchange program between two adjacent control areas compatible with security standards applicable in all control areas of the synchronous area, and taking into account the technical uncertainties on future network conditions.
The maximum total exchange program between two adjacent control areas compatible with security standards applicable in all control areas of the synchronous area, and taking into account the technical uncertainties on future network conditions.
Charts provided to indicate merit orders for the different categories of lignite, coal and gas power plants.
Annex II: 1.1 The rule according to which elements remaining in operation within TSO’s Responsibility Area after a Contingency from the Contingency List must be capable of accommodating the new operational situation without violating Operational Security Limits.
EUCO30 External Scenario
Description of how the EUCO30 data was used to create a dataset suitable for the ENTSOs scenario process.
Annex II: 1.2
Electricity scenario building
Summarises the scenario building phases and related processes. Provides details on the reference grid used and a step by step guide to top down scenario development.
Annex II: 1.3.1
Electricity Demand How electricity demand evolves driven by energy efficiency measures, electric vehicles, heat pumps, storages and demand side response.
Annex II: 1.3.2-5
Gas Supplies Provides the details, sources and methodologies that represent the different sources of gas supply, covering indigenous production, biomethane and power to gas plus background information that supports the supply potentials for Extra-EU supplies found in Annex I.
Annex II: 1.4.1
Gas Demand TSO national insight on bottom-up data, plus methodologies for sectoral breakdown where not available, turning ENTSO-E power generation requirements into gas demand.
Annex II: 1.4.2-5
Table 1: Key topics and where to find them

5
TY
ND
P 20
18 S
cena
rio
Rep
ort
1.1
Public consultation summaryFormatThe publication of the draft TYNDP 2018 Scenario Report on 2nd October 2017 also launched the start of a public consultation window, running until 10th November 2017. Stakeholders were invited to provide feedback using a questionnaire made available online. Within this period, the ENTSOs also hosted a Joint ENTSOs scenarios workshop that provided an overview of the scenario development process but also an open panel discussion involving European Commission, ACER, E3G and both ENTSOs, talking about the role of scenarios in infrastructure development.
Main Findings Stakeholders were generally all supportive to varying degrees of the joint ENTSOs process and saw benefits to this approach. The ENTSOs will endeavour to continually improve the joint ENTSOs process. Future scenario development processes will seek to enhance and improve gas and electricity interactions, looking for synergies, leading to better sharing of data and cooperation.
A number of stakeholders expressed the wish to see a Behind the Targets scenario as part of the TYNDP 2018 framework. Behind the Targets is a possible future and it was one of the initial scenarios proposed for the scenario framework. However, the ENTSOs can only develop a certain number of scenarios and during the stakeholder consultation there was a majority for not including the behind the target scenario when compared to the other scenarios. Additionally, the behind the target scenario would likely be a very conservative estimate of the future which may mean the challenges posed by the scenario do not reflect what future infrastructure needs to be assessed against. In some ways, if the data in the 2025 scenario was considered in the 2030 time-frame, it could be considered to reflect a future that is behind the targets. The same logic could be applied to 2030 scenario data in 2040.
Additional explanation, information or data has been requested by a number of organisations. Where possible to incorporate additional information, the ENTSOs have endeavoured to do so. However, in some cases, feedback can only be taken forward to future scenario development processes due to the complexity and time required to produce the work. Equally, some information requested already existed
within the annexes provided. The ENTSOs have attempted to maintain a balance between an easy to digest main report and an in-depth representation within the annexes and supporting datasets. As a result, within the main report there is now a reference table to aid navigation to the relevant section of the annexes.
Equally, information provided from previous stakeholder engagement sessions and consultations has not been repeated within this document, however links to this resource have been included where appropriate.
The levels of green or renewable gases were considered under represented within the scenarios. Biomethane data has been revisited for all scenarios following the public consultation, using a combination of additional data from TSOs, along with a top-down methodology based on publicly available information on the current national development and future perspective and potential technical production level assumptions of biomethane in the EU. For TYNDP purposes, ENTSOG collects data related to network demand and supply, however following stakeholder input to represent the role that biogas plays in the European energy mix, the European Biogas Association (EBA) have provided the overview in the final report.
Although some stakeholders also felt that the potential for P2G had not been explored fully, due to the methodology used for determining this from electricity market model outputs, this data has not changed. However, this input will be taken forward to the next process where P2G may play a more fundamental role within some scenarios, depending on stakeholder input.
This leads onto the topic of hydrogen, which apart from its or synthetic methane injection into the gas grid, is not widely covered in the scenarios. This was a result of a combination of stakeholder feedback and the ENTSOs focus on the power and gas sectors. The ENTSOs will seek to widen the range of stakeholders it consults for future processes and may look to provide assumptions on other sectors. This will enable a full picture to be provided with relation to EU targets, and may help to satisfy requests for assessing whether or not scenarios are Paris compliant in future.
During discussions on the scenarios, it has been raised that the Top-Down scenarios are not strictly top-down creations due to the fact they are elaborated from bottom-up data collections. References to ‘Top-Down’ scenarios have not changed for this final report, but the ENTSOs will reconsider the terminology for future processes. On the topic of naming, the scenario names receive mixed responses, the ENTSOs will seek to get input on the chosen names at an early stage of the next process.
Overall, the ENTSOs have learnt a lot from the first joint scenario development process and welcome further feedback following the publication of the final report.
Full detailed responsesAll the public consultation feedback is detailed in a new annex supporting this document, with the corresponding responses provided by the team responsible for the scenario development process, expert representatives from the electricity and gas transmission system operators of Europe.
The ENTSOs would like to thank all those that participated in the process, both the public consultation of the draft report and all stakeholder engagement sessions prior to this. Developing scenarios is a process of continual improvement and where is has not been possible to factor in some suggestions for TYNDP 2018, all stakeholder input has been received with the aim of enhancing the next set of scenarios.
Due to the length of the process, it will not be long before the kick off of the TYNDP 2020 scenario development timeline, and we would encourage as many stakeholders to engage in this process as early as possible so those views can be taken into consideration from the very beginning.

Section 2
Scenario description and storylines
7
TY
ND
P 20
18 S
cena
rio
Rep
ort
> SCENARIOS
> STORYLINES
> PARAMETERS
> FRAMEWORK
Image courtesy of Terranets
9
TY
ND
P 20
18 S
cena
rio
Rep
ort
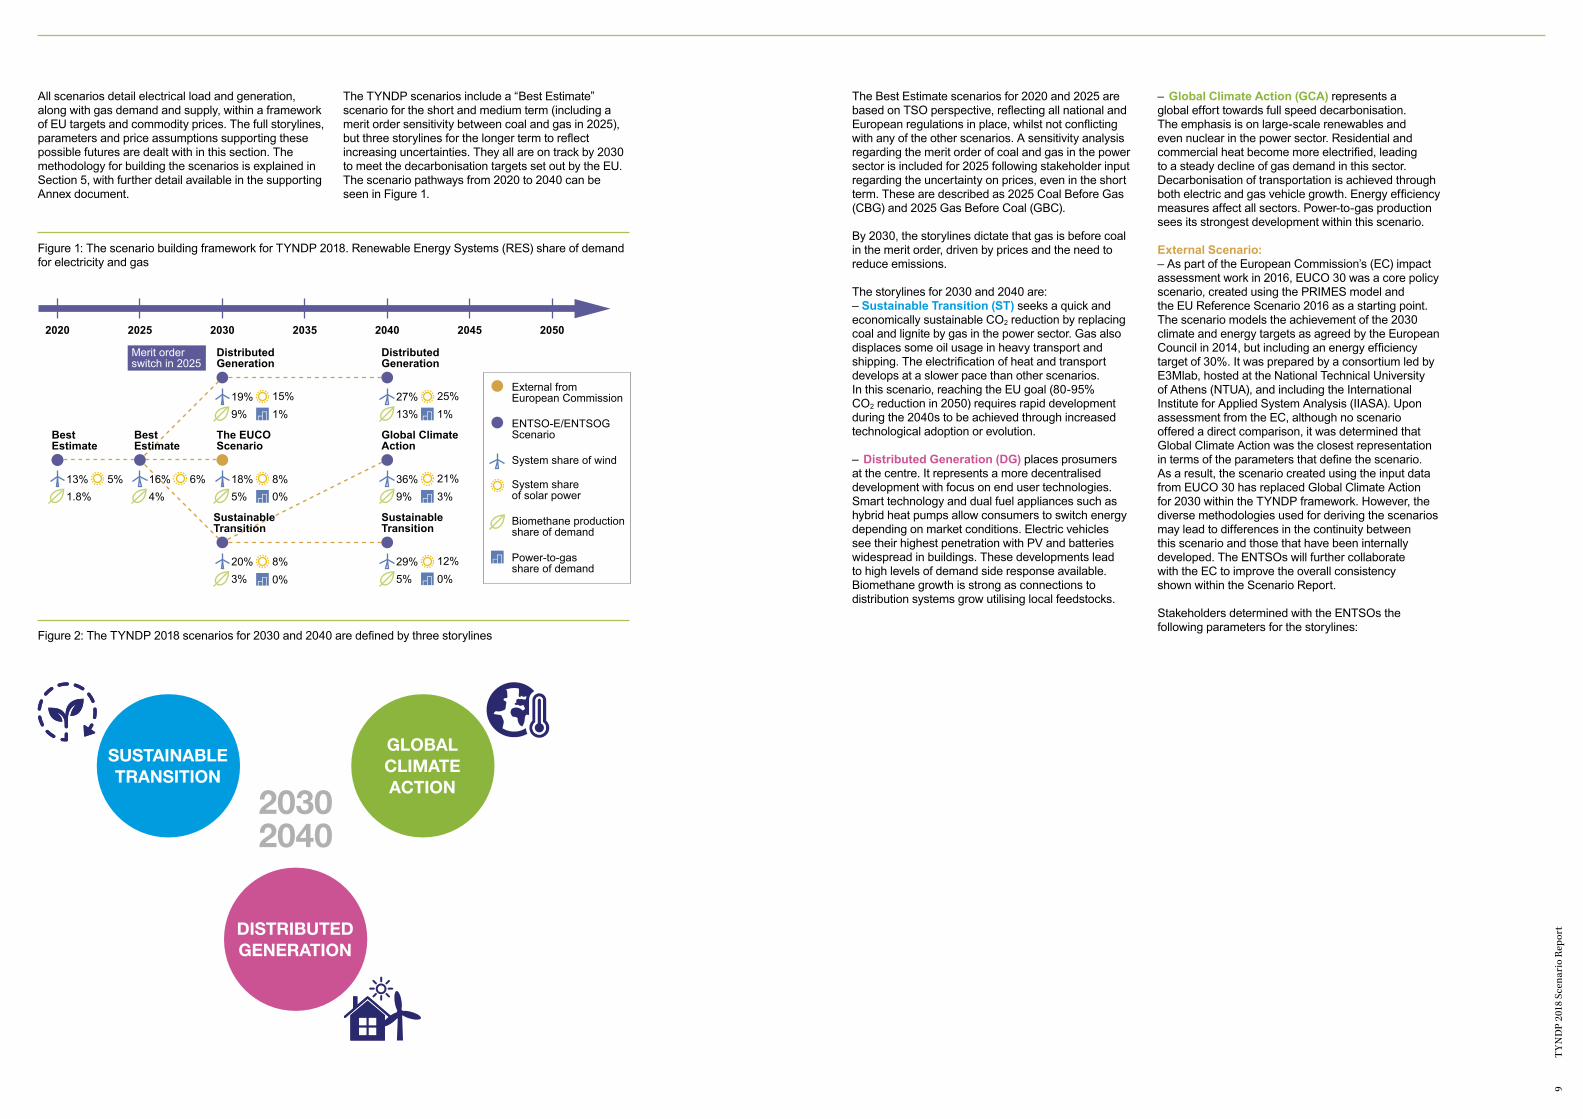
All scenarios detail electrical load and generation, along with gas demand and supply, within a framework of EU targets and commodity prices. The full storylines, parameters and price assumptions supporting these possible futures are dealt with in this section. The methodology for building the scenarios is explained in Section 5, with further detail available in the supporting Annex document.
The TYNDP scenarios include a “Best Estimate” scenario for the short and medium term (including a merit order sensitivity between coal and gas in 2025), but three storylines for the longer term to reflect increasing uncertainties. They all are on track by 2030 to meet the decarbonisation targets set out by the EU. The scenario pathways from 2020 to 2040 can be seen in Figure 1.
The Best Estimate scenarios for 2020 and 2025 are based on TSO perspective, reflecting all national and European regulations in place, whilst not conflicting with any of the other scenarios. A sensitivity analysis regarding the merit order of coal and gas in the power sector is included for 2025 following stakeholder input regarding the uncertainty on prices, even in the short term. These are described as 2025 Coal Before Gas (CBG) and 2025 Gas Before Coal (GBC).
By 2030, the storylines dictate that gas is before coal in the merit order, driven by prices and the need to reduce emissions.
The storylines for 2030 and 2040 are:– Sustainable Transition (ST) seeks a quick and economically sustainable CO2 reduction by replacing coal and lignite by gas in the power sector. Gas also displaces some oil usage in heavy transport and shipping. The electrification of heat and transport develops at a slower pace than other scenarios. In this scenario, reaching the EU goal (80-95% CO2 reduction in 2050) requires rapid development during the 2040s to be achieved through increased technological adoption or evolution. – Distributed Generation (DG) places prosumers at the centre. It represents a more decentralised development with focus on end user technologies. Smart technology and dual fuel appliances such as hybrid heat pumps allow consumers to switch energy depending on market conditions. Electric vehicles see their highest penetration with PV and batteries widespread in buildings. These developments lead to high levels of demand side response available. Biomethane growth is strong as connections to distribution systems grow utilising local feedstocks.
– Global Climate Action (GCA) represents a global effort towards full speed decarbonisation. The emphasis is on large-scale renewables and even nuclear in the power sector. Residential and commercial heat become more electrified, leading to a steady decline of gas demand in this sector. Decarbonisation of transportation is achieved through both electric and gas vehicle growth. Energy efficiency measures affect all sectors. Power-to-gas production sees its strongest development within this scenario.
External Scenario:– As part of the European Commission’s (EC) impact assessment work in 2016, EUCO 30 was a core policy scenario, created using the PRIMES model and the EU Reference Scenario 2016 as a starting point. The scenario models the achievement of the 2030 climate and energy targets as agreed by the European Council in 2014, but including an energy efficiency target of 30%. It was prepared by a consortium led by E3Mlab, hosted at the National Technical University of Athens (NTUA), and including the International Institute for Applied System Analysis (IIASA). Upon assessment from the EC, although no scenario offered a direct comparison, it was determined that Global Climate Action was the closest representation in terms of the parameters that define the scenario. As a result, the scenario created using the input data from EUCO 30 has replaced Global Climate Action for 2030 within the TYNDP framework. However, the diverse methodologies used for deriving the scenarios may lead to differences in the continuity between this scenario and those that have been internally developed. The ENTSOs will further collaborate with the EC to improve the overall consistency shown within the Scenario Report.
Stakeholders determined with the ENTSOs the following parameters for the storylines:
Figure 1: The scenario building framework for TYNDP 2018. Renewable Energy Systems (RES) share of demand for electricity and gas
Figure 2: The TYNDP 2018 scenarios for 2030 and 2040 are defined by three storylines
SUSTAINABLE TRANSITION
DISTRIBUTED GENERATION
20302040
GLOBAL CLIMATE ACTION
2020 2025 2030
DistributedGeneration
BestEstimate
BestEstimate
The EUCOScenario
Global ClimateAction
SustainableTransition
SustainableTransition
DistributedGeneration
2035 2040 2045 2050
5%1.8%13% 6%
4%16% 8%
15%
0%
0%
5%18%
1%9%19% 25%
1%13%27%
21%3%9%
36%
12%0%5%
29%8%3%20%
External from European Commission
ENTSO-E/ENTSOGScenario
System share of wind
System shareof solar power
Biomethane productionshare of demand
Power-to-gasshare of demand
Merit orderswitch in 2025

11
TY
ND
P 20
18 S
cena
rio
Rep
ort
Scenario Global Climate Action Sustainable Transition Distributed Generation
Category Criteria Parameter
Macroeconomic Trends
Climate action driven by
Global ETS EU ETS & direct RES subsidies
EU ETS
EU on track to 2030 target?
Beyond On track Slightly beyond
EU on track to 2050 target?
On track Slightly behind On track
Economic conditions
High growth Moderate growth High growth
Transport
Electric and hybrid vehicles
High growth Moderate growth Very high growth
Gas vehicles
High growth Very high growth Low growth
Residential/ Commercial
Demand flexibility
High growth Moderate growth Very high growth
Electricity demand
Moderate growth Stable Moderate growth
Gas demand
Reduction Slight reduction Reduction
Electric heat pump
High growth Low growth Moderate growth
Energy efficiency
High growth Moderate growth High growth
Hybrid heat pump
High growth Moderate growth Very high growth
Industry
Electricity demand
Stable Stable Moderate growth
Gas demand
Stable Stable Reduction
CCS Low growth Low growth Not significant
Demand and flexibility
Moderate growth Low growth Very high growth
Power
Merit order Gas Before Coal Gas Before Coal Gas Before Coal
Nuclear Depending on national policies
Reduction Reduction
Storage Moderate growth Low growth Very high growth
Wind High growth Moderate growth High growth
Solar High growth Moderate growth Very high growth
Other bio-energies
Moderate growth Moderate growth High growth
CCS Not significant Not significant Not significant
Adequacy Some surplus capacity Some surplus capacity High surplus capacity
Non-fossil gas sources
Power-to-gas
High growth Not significant High growth
Bio-methane
High growth High growth High growth
Scenario Global Climate Action Sustainable Transition Distributed Generation
Category Criteria Parameter
Macroeconomic Trends
Climate action driven by
Investment in RES driven by target not cost. Thermal Fleet determined by LCOE decisions in thermal investment loop.
Bottom Up TSO Data.For 2040Investment in RES driven by target not cost.Thermal Fleet determined by LCOE decisions in thermal
Investment in RES driven by targets not cost.
Thermal Fleet determined by LCOE decisions in thermal optimization Tool.
EU on track to 2030 target?
Targets Checked by Comparing with EUCO30
Targets Checked by Comparing with EUCO30
Targets Checked by Comparing with EUCO30
EU on track to 2050 target?
Midpoint to 80% CO2 reduction
Midpoint to 80% CO2 reduction
Midpoint to 80% CO2 reduction
Economic conditions
High GDP growth Moderate GDP growth High GDP growth
Transport
Electric and hybrid vehicles
% increase according to IEA EV outlook MEDIUM forecast up to 2040
% increase according to IEA EV outlook LOW forecast up to 2040.
% increase according to IEA EV outlook HIGH forecast up to 2040
Gas vehicles
ENTSOG Data Collection ENTSOG Data Collection ENTSOG Data Collection
Residential/ Commercial
Demand flexibility
Extrapolation of TSO trend provided for 2025-2030
ENTSOE Data Collection Extrapolation of TSO trend provided for 2025-2030
Electricity demand
Interpolation of DG2040 and ST2040 (see Annex II)
Extrapoltation of TSO trend provided for 2025-2030 (see Annex II)
Ranging from -0.5% to +1.5%/year dependingon composite index (see Annex II)
Gas demand
ENTSOG Data Collection ENTSOG Data Collection ENTSOG Data Collection
Electric heat pump
Depending on predicted growth rate (see Annex II)
ENTSOE Data Collection & Depending on predicted growth rate (see Annex II)
Depending on predicted growth rate (see Annex II)
Energy efficiency
Linked to country demand trend per capita – limited between -0.5% and 1.5%, on a country by country basis
Linked to country demand trend per capita – limited between -0.5% and 1.5%, on a country by country basis
Linked to country demand trend per capita – limited between -0.5% and 1.5%, on a country by country basis
Hybrid heat pump
HHPs number equal country specific share of added HPs (see Annex II)
HHPs number equal country specific share of added HPs (see Annex II)
HHPs number equal country specific share of added HPs (see Annex II)
Industry
Electricity demand
Same as ENTSOE Data Collection for Sustainable Transition 2030
Same as ENTSOE Data Collection for Sustainable Transition 2030
Same as ENTSOE Data Collection for Sustainable Transition 2030
Gas demand
ENTSOG Data Collection ENTSOG Data Collection ENTSOG Data Collection
CCS Methodology based on EC Roadmap to 2050 (see Annex II)
Methodology based on EC Roadmap to 2050 (see Annex II)
Methodology based on EC Roadmap to 2050 (see Annex II)
Demand and flexibility
Extrapolation of TSO trend provided for 2025-2030
ENTSOE Data Collection & Extrapolation of TSO trend provided for 2025-2030
Extrapolation of TSO trend provided for 2025-2030
Figure 3: Overview of the guiding parameters for the scenarios Figure 3b: Quantification of the guiding parameters for the scenarios
continued on next page
13
TY
ND
P 20
18 S
cena
rio
Rep
ort
Scenario Global Climate Action Sustainable Transition Distributed Generation
Category Criteria Parameter
Power
Merit order Gas Before Coal Gas Before Coal Gas Before Coal
Nuclear Depending on national policies. Investment is allowed if viable from thermal investment loop.
Nuclear power plants taken out according to data collection. No new nuclear power plants after 2030
Nuclear power plants taken out according to data collection. No new nuclear power plants after 2030
Storage 10% of new solar installations are with batteries. 0,1 kWh battery/1kW solar -> 500 W/kWh.Pumped storage increase: based on additional pumped hydro project from TYNDP16
ENTSOE Data collection DG2030:10% of solar installations are with batteries. 0,1 kWh battery/1kW solar -> 500 W/kWh.Hydro based on ENTSOE data collection for ST2030.DG2040:50% of solar installations with batteries. 0,5kWh battery/1kW solar -> 500 W/kWh.Hydro based on ENTSOE data collection for ST2030.
Wind GCA2040:(34% vs Demand)50% of New wind is onshore.50% of New wind is Offshore.
ST2030:Data Collection (19% vs Demand)ST2040: Data Collection (27% vs Demand)
DG2030:(15% vs Demand).DG2040:(25% vs Demand)Development of onshore and offshore wind is based on shares from data collection ST23030.
Solar GCA2040:(17% vs Demand)
ST2030: Data CollectionST2040: (10% vs Demand)
DG2030*15% solar compared to demand. Minimum level of Solar in a country: 0,75 kWx capita (aprox 1,5 kW per household).DG2040*25% solar compared to demand. Minimum level of Solar in a country: 1,0 kWx capita (aprox 1,5 kW per household).No upper limit per country.
Other bio-energies
Data Collection Data Collection Data Collection
CCS No CCS Data Collected No CCS
Adequacy Thermal Investment Loop Checks Against3 Hours LOLE (Note: 3 Climate Years only).
Thermal Investment Loop Checks Against3 Hours LOLE (Note: 3 Climate Years only).
Thermal Investment Loop Checks Against3 Hours LOLE (Note: 3 Climate Years only).
Non-fossil gas sources
Power-to-gas
Methodology based on modelling output (see Annex II)
Methodology based on modelling output (see Annex II)
Methodology based on modelling output (see Annex II)
Bio-methane
ENTSOG Data Collection ENTSOG Data Collection ENTSOG Data Collection
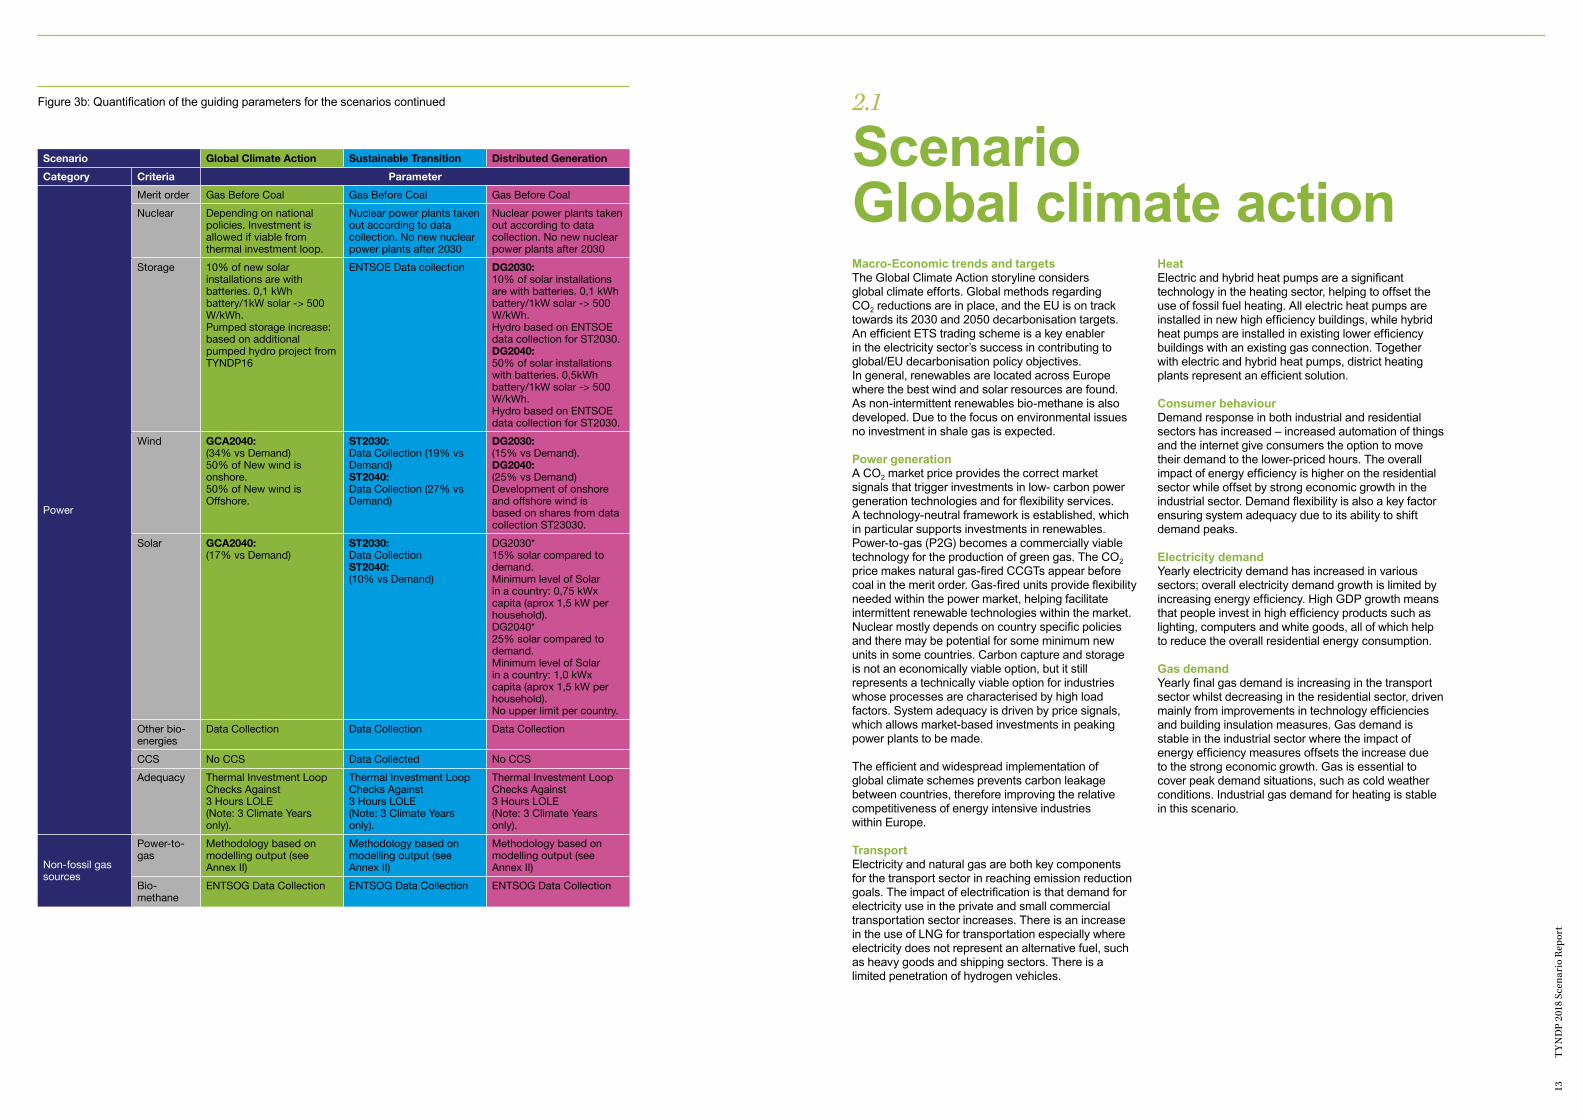
Figure 3b: Quantification of the guiding parameters for the scenarios continued 2.1
Scenario Global climate actionMacro-Economic trends and targetsThe Global Climate Action storyline considers global climate efforts. Global methods regarding CO2 reductions are in place, and the EU is on track towards its 2030 and 2050 decarbonisation targets. An efficient ETS trading scheme is a key enabler in the electricity sector’s success in contributing to global/EU decarbonisation policy objectives. In general, renewables are located across Europe where the best wind and solar resources are found. As non-intermittent renewables bio-methane is also developed. Due to the focus on environmental issues no investment in shale gas is expected.
Power generationA CO2 market price provides the correct market signals that trigger investments in low- carbon power generation technologies and for flexibility services. A technology-neutral framework is established, which in particular supports investments in renewables. Power-to-gas (P2G) becomes a commercially viable technology for the production of green gas. The CO2 price makes natural gas-fired CCGTs appear before coal in the merit order. Gas-fired units provide flexibility needed within the power market, helping facilitate intermittent renewable technologies within the market. Nuclear mostly depends on country specific policies and there may be potential for some minimum new units in some countries. Carbon capture and storage is not an economically viable option, but it still represents a technically viable option for industries whose processes are characterised by high load factors. System adequacy is driven by price signals, which allows market-based investments in peaking power plants to be made.
The efficient and widespread implementation of global climate schemes prevents carbon leakage between countries, therefore improving the relative competitiveness of energy intensive industries within Europe. TransportElectricity and natural gas are both key components for the transport sector in reaching emission reduction goals. The impact of electrification is that demand for electricity use in the private and small commercial transportation sector increases. There is an increase in the use of LNG for transportation especially where electricity does not represent an alternative fuel, such as heavy goods and shipping sectors. There is a limited penetration of hydrogen vehicles.
HeatElectric and hybrid heat pumps are a significant technology in the heating sector, helping to offset the use of fossil fuel heating. All electric heat pumps are installed in new high efficiency buildings, while hybrid heat pumps are installed in existing lower efficiency buildings with an existing gas connection. Together with electric and hybrid heat pumps, district heating plants represent an efficient solution.
Consumer behaviourDemand response in both industrial and residential sectors has increased – increased automation of things and the internet give consumers the option to move their demand to the lower-priced hours. The overall impact of energy efficiency is higher on the residential sector while offset by strong economic growth in the industrial sector. Demand flexibility is also a key factor ensuring system adequacy due to its ability to shift demand peaks.
Electricity demandYearly electricity demand has increased in various sectors; overall electricity demand growth is limited by increasing energy efficiency. High GDP growth means that people invest in high efficiency products such as lighting, computers and white goods, all of which help to reduce the overall residential energy consumption.
Gas demandYearly final gas demand is increasing in the transport sector whilst decreasing in the residential sector, driven mainly from improvements in technology efficiencies and building insulation measures. Gas demand is stable in the industrial sector where the impact of energy efficiency measures offsets the increase due to the strong economic growth. Gas is essential to cover peak demand situations, such as cold weather conditions. Industrial gas demand for heating is stable in this scenario.
15
TY
ND
P 20
18 S
cena
rio
Rep
ort
2.2
Scenario Sustainable transition
2.3
Scenario Distributed generation
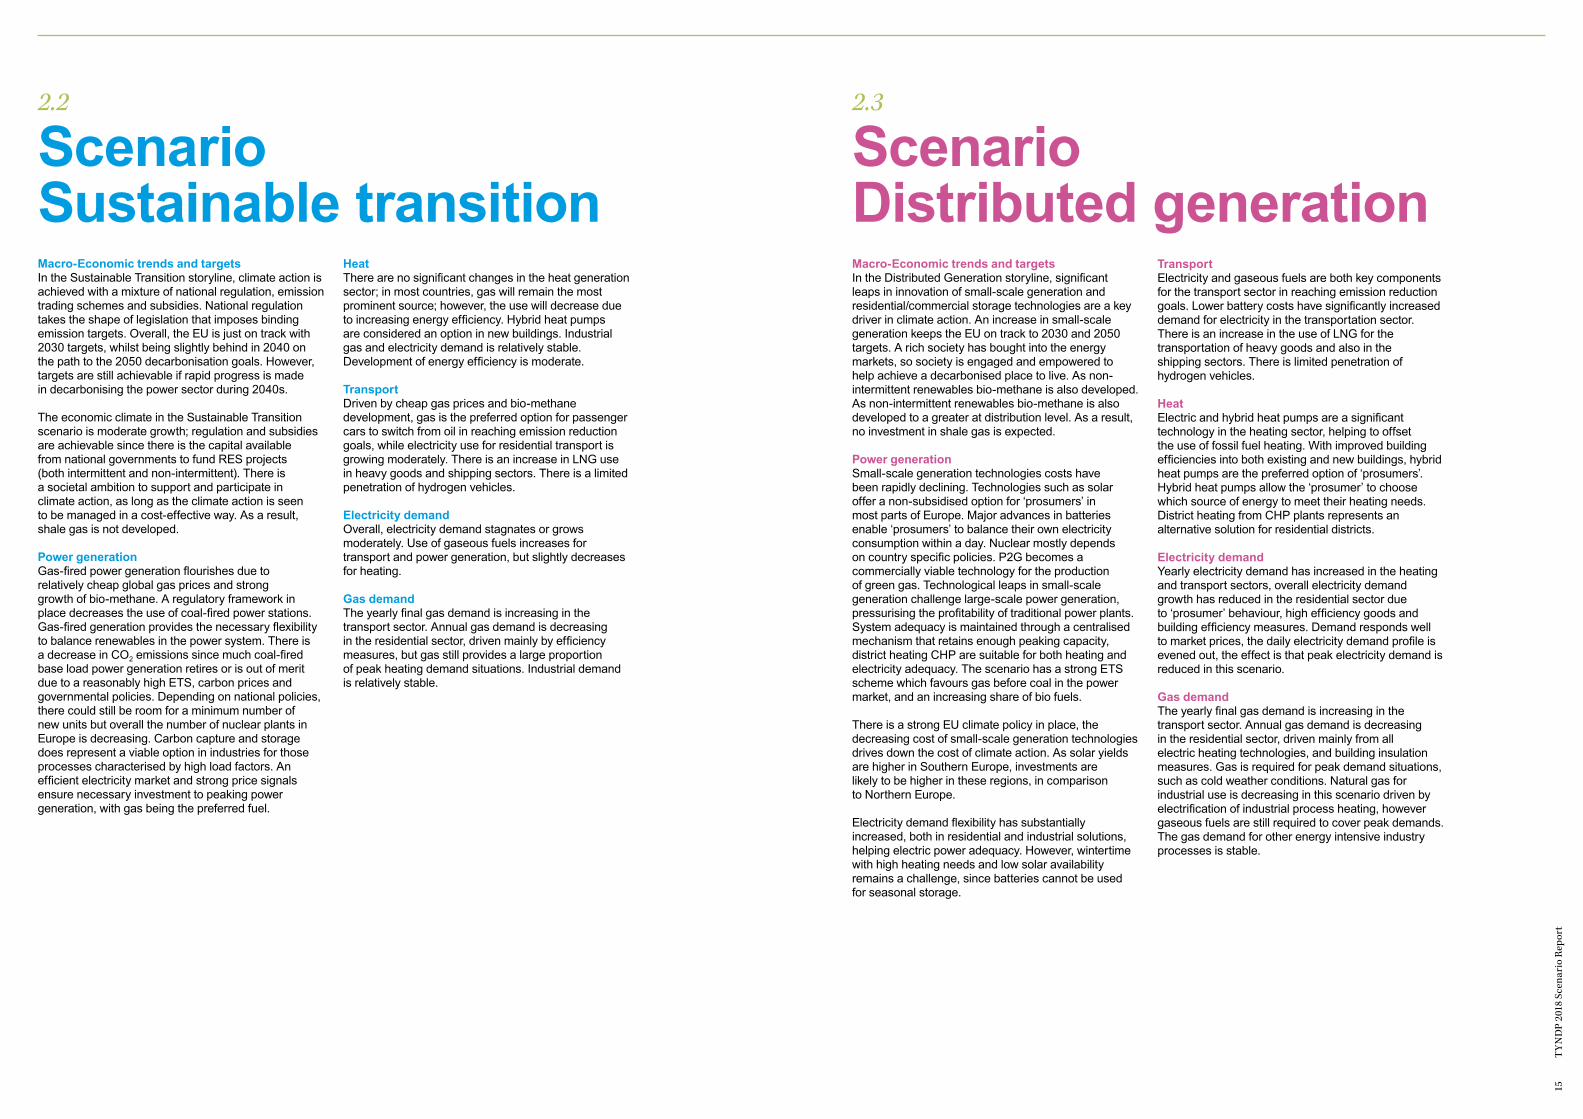
Macro-Economic trends and targetsIn the Sustainable Transition storyline, climate action is achieved with a mixture of national regulation, emission trading schemes and subsidies. National regulation takes the shape of legislation that imposes binding emission targets. Overall, the EU is just on track with 2030 targets, whilst being slightly behind in 2040 on the path to the 2050 decarbonisation goals. However, targets are still achievable if rapid progress is made in decarbonising the power sector during 2040s.
The economic climate in the Sustainable Transition scenario is moderate growth; regulation and subsidies are achievable since there is the capital available from national governments to fund RES projects (both intermittent and non-intermittent). There is a societal ambition to support and participate in climate action, as long as the climate action is seen to be managed in a cost-effective way. As a result, shale gas is not developed.
Power generationGas-fired power generation flourishes due to relatively cheap global gas prices and strong growth of bio-methane. A regulatory framework in place decreases the use of coal-fired power stations. Gas-fired generation provides the necessary flexibility to balance renewables in the power system. There is a decrease in CO2 emissions since much coal-fired base load power generation retires or is out of merit due to a reasonably high ETS, carbon prices and governmental policies. Depending on national policies, there could still be room for a minimum number of new units but overall the number of nuclear plants in Europe is decreasing. Carbon capture and storage does represent a viable option in industries for those processes characterised by high load factors. An efficient electricity market and strong price signals ensure necessary investment to peaking power generation, with gas being the preferred fuel.
HeatThere are no significant changes in the heat generation sector; in most countries, gas will remain the most prominent source; however, the use will decrease due to increasing energy efficiency. Hybrid heat pumps are considered an option in new buildings. Industrial gas and electricity demand is relatively stable. Development of energy efficiency is moderate.
TransportDriven by cheap gas prices and bio-methane development, gas is the preferred option for passenger cars to switch from oil in reaching emission reduction goals, while electricity use for residential transport is growing moderately. There is an increase in LNG use in heavy goods and shipping sectors. There is a limited penetration of hydrogen vehicles.
Electricity demandOverall, electricity demand stagnates or grows moderately. Use of gaseous fuels increases for transport and power generation, but slightly decreases for heating.
Gas demandThe yearly final gas demand is increasing in the transport sector. Annual gas demand is decreasing in the residential sector, driven mainly by efficiency measures, but gas still provides a large proportion of peak heating demand situations. Industrial demand is relatively stable.
Macro-Economic trends and targetsIn the Distributed Generation storyline, significant leaps in innovation of small-scale generation and residential/commercial storage technologies are a key driver in climate action. An increase in small-scale generation keeps the EU on track to 2030 and 2050 targets. A rich society has bought into the energy markets, so society is engaged and empowered to help achieve a decarbonised place to live. As non-intermittent renewables bio-methane is also developed. As non-intermittent renewables bio-methane is also developed to a greater at distribution level. As a result, no investment in shale gas is expected.
Power generationSmall-scale generation technologies costs have been rapidly declining. Technologies such as solar offer a non-subsidised option for ‘prosumers’ in most parts of Europe. Major advances in batteries enable ‘prosumers’ to balance their own electricity consumption within a day. Nuclear mostly depends on country specific policies. P2G becomes a commercially viable technology for the production of green gas. Technological leaps in small-scale generation challenge large-scale power generation, pressurising the profitability of traditional power plants. System adequacy is maintained through a centralised mechanism that retains enough peaking capacity, district heating CHP are suitable for both heating and electricity adequacy. The scenario has a strong ETS scheme which favours gas before coal in the power market, and an increasing share of bio fuels.
There is a strong EU climate policy in place, the decreasing cost of small-scale generation technologies drives down the cost of climate action. As solar yields are higher in Southern Europe, investments are likely to be higher in these regions, in comparison to Northern Europe.
Electricity demand flexibility has substantially increased, both in residential and industrial solutions, helping electric power adequacy. However, wintertime with high heating needs and low solar availability remains a challenge, since batteries cannot be used for seasonal storage.
TransportElectricity and gaseous fuels are both key components for the transport sector in reaching emission reduction goals. Lower battery costs have significantly increased demand for electricity in the transportation sector. There is an increase in the use of LNG for the transportation of heavy goods and also in the shipping sectors. There is limited penetration of hydrogen vehicles.
HeatElectric and hybrid heat pumps are a significant technology in the heating sector, helping to offset the use of fossil fuel heating. With improved building efficiencies into both existing and new buildings, hybrid heat pumps are the preferred option of ‘prosumers’. Hybrid heat pumps allow the ‘prosumer’ to choose which source of energy to meet their heating needs. District heating from CHP plants represents an alternative solution for residential districts.
Electricity demandYearly electricity demand has increased in the heating and transport sectors, overall electricity demand growth has reduced in the residential sector due to ‘prosumer’ behaviour, high efficiency goods and building efficiency measures. Demand responds well to market prices, the daily electricity demand profile is evened out, the effect is that peak electricity demand is reduced in this scenario.
Gas demandThe yearly final gas demand is increasing in the transport sector. Annual gas demand is decreasing in the residential sector, driven mainly from all electric heating technologies, and building insulation measures. Gas is required for peak demand situations, such as cold weather conditions. Natural gas for industrial use is decreasing in this scenario driven by electrification of industrial process heating, however gaseous fuels are still required to cover peak demands. The gas demand for other energy intensive industry processes is stable.
Section 3
Scenario results
17
TY
ND
P 20
18 S
cena
rio
Rep
ort
> RESULTS
> DEMAND
> SUPPLY
> EMISSIONS
> RES
Image courtesy of Gascade

19
TY
ND
P 20
18 S
cena
rio
Rep
ort
3.1
Demand
Electricity Demand The highest levels of demand in both the 2030 and 2040 timeframes are in the Distributed Generation scenario. In this scenario, there is very high growth in demand flexibility which accommodates this growth in demand, as the demand curve is easier to manage. The actual growth in demand is due to the very high increase in electric vehicles and heat pumps, although a high percentage of those are hybrid heat pumps which equally aid demand side management. Peak electricity demand is defined as the highest
single hourly demand period in a given year. This figures is therefore given in GW, which differs from the gas peak demand which is given in GWh/day.
The Global Climate Action scenario is the second highest in the 2040 timeframe, due to high growth in both electric vehicles and heat pumps. It should be noted that demand levels would be higher if not for the high growth in energy efficiency.
Sustainable Transition has the lowest demand in both the 2030 and 2040 scenario as this scenario still focuses predominately on gas in the heating sector, but also in the power generation and transport sectors. The Distributed Generation scenario shows the highest
peak demand value of all scenario, which is consistent with its characteristic as the scenario with the highest growth in demand.
Figure 4: Electricity annual demand by scenario
Figure 4B: Peak electricity annual demand by scenario
Figure 5: Increase in numbers of electric vehicles, electric heat pumps and hybrid heat pumps by scenario. *EUCO heat pump numbers have been derived from consumption data and may not represent the same numbers in that scenario.
Electricity Demand 2015 Demand
0
1000
2000
3000
4000
5000
500
1500
2500
3500
4500
TWh
2020 2025CBG
2025GBC
ST2030
ST2040
GCA2040
DG2030
DG2040
EUCO2030
Electricity annual demand by scenario
Peak Electricity Demand
0
200
400
600
800
100
300
500
700
GW
2020BE
2025BE
ST2030
DG2030
ST2040
GCA2040
EUCO2030
DG2040
Peak Electricity Demand average of scenarios
EV HP Hybrid HP
0
10000
30000
50000
70000
90000
20000
40000
60000
80000
Incr
ease
in th
ousa
nds
2020 2025 ST2030
DG2030
ST2040
GCA2040
EUCO2030
DG2040
Increase in numbers of electric vehicles, heat pumps and hybrid heat pumps
Summarised below are the results of the scenario building process, covering the electricity and gas sectors in terms of supply and demand as well as the evolution of CO2 emissions and renewable energy sources. These results are displayed at EU level4 and represent the initial data from the process; additional checks and new calculations will be made and
presented in the final version of the Scenario Report.Annual and peak demand information is provided as both help define the infrastructure requirements of the future.
A description of the methodologies used is available in Section 5, with further details in the supporting Annex.
4 EU Level represents all countries considered under the respective ENTSO-E and ENTSOG TYNDPs (for the full list of countries, please refer to the methodology Annex) and may be referred to as EU28+. For specific information related to EU targets, data represents only the EU28 and is labelled as such. Where multiple tools have been used to generate the results, averages of these results are used in the main report using the ‘normal’ climate year (a normal hydro climate condition (between wet and dry). Two additional data tables representing dry and wet climate conditions can be found in our scenario data sets). Where applicable, the range of these tools is detailed in the Annex and full granularity of the data will be made available on the ENTSOs websites.
21
TY
ND
P 20
18 S
cena
rio
Rep
ort
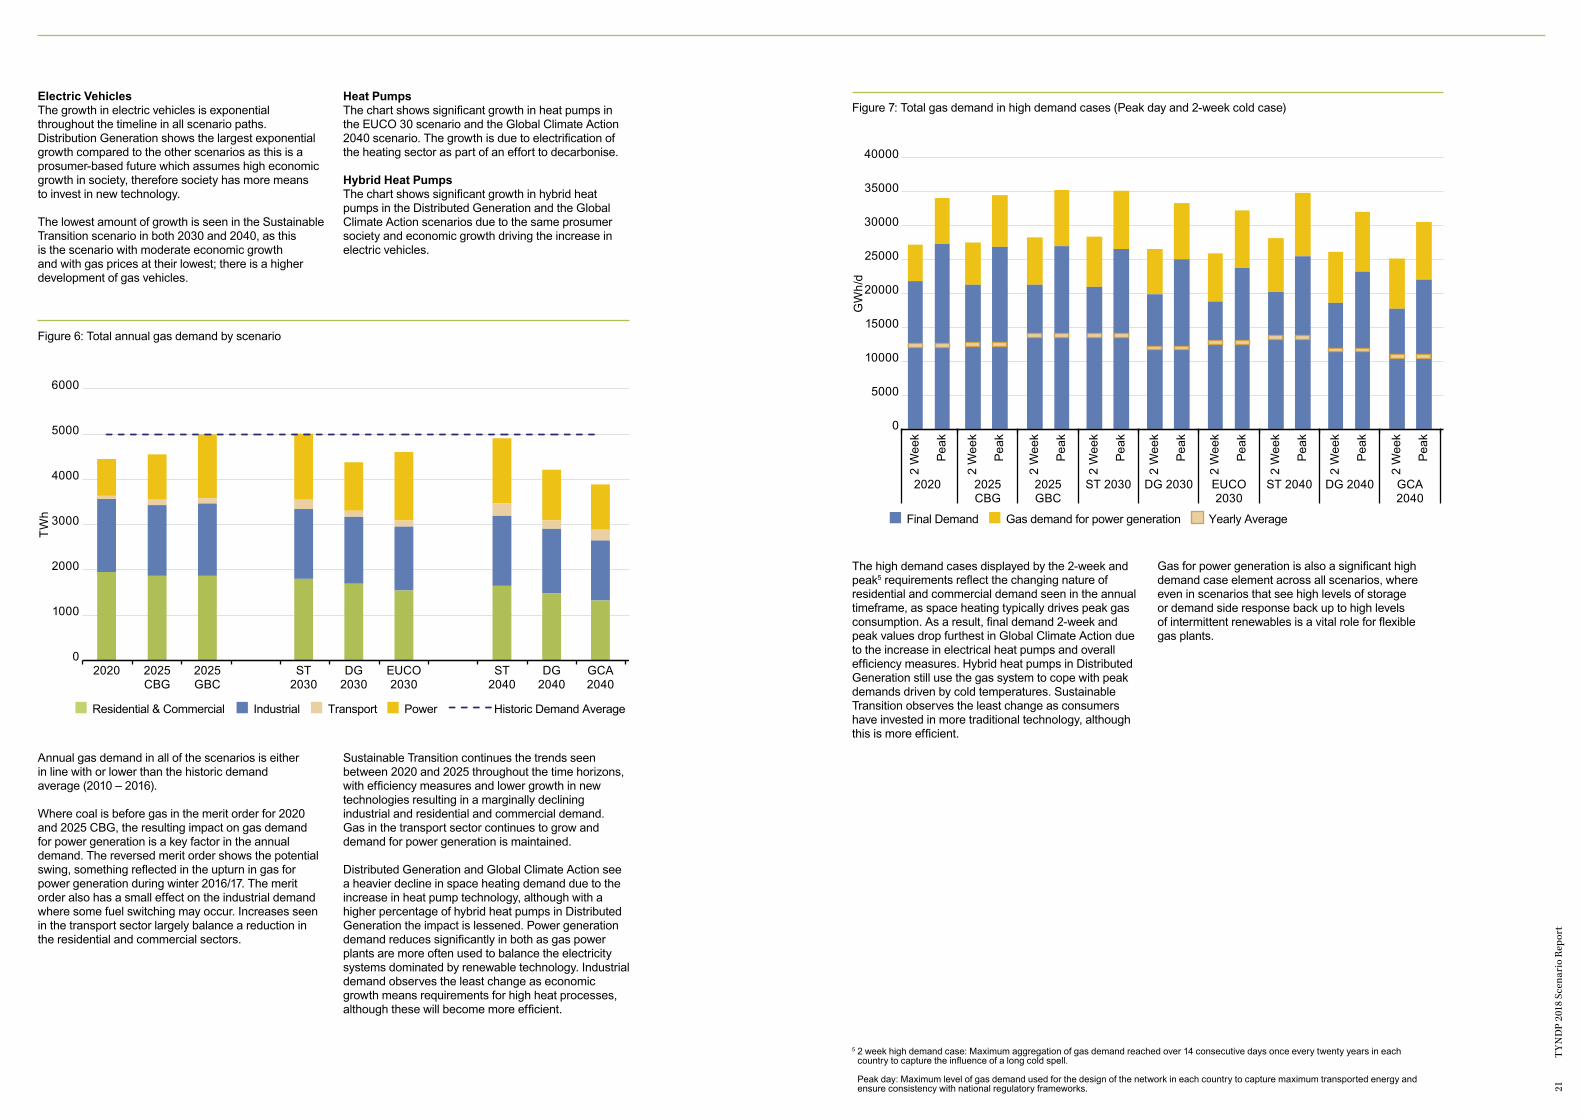
Electric VehiclesThe growth in electric vehicles is exponential throughout the timeline in all scenario paths. Distribution Generation shows the largest exponential growth compared to the other scenarios as this is a prosumer-based future which assumes high economic growth in society, therefore society has more means to invest in new technology.
The lowest amount of growth is seen in the Sustainable Transition scenario in both 2030 and 2040, as this is the scenario with moderate economic growth and with gas prices at their lowest; there is a higher development of gas vehicles.
Heat PumpsThe chart shows significant growth in heat pumps in the EUCO 30 scenario and the Global Climate Action 2040 scenario. The growth is due to electrification of the heating sector as part of an effort to decarbonise.
Hybrid Heat PumpsThe chart shows significant growth in hybrid heat pumps in the Distributed Generation and the Global Climate Action scenarios due to the same prosumer society and economic growth driving the increase in electric vehicles.
Annual gas demand in all of the scenarios is either in line with or lower than the historic demand average (2010 – 2016).
Where coal is before gas in the merit order for 2020 and 2025 CBG, the resulting impact on gas demand for power generation is a key factor in the annual demand. The reversed merit order shows the potential swing, something reflected in the upturn in gas for power generation during winter 2016/17. The merit order also has a small effect on the industrial demand where some fuel switching may occur. Increases seen in the transport sector largely balance a reduction in the residential and commercial sectors.
Sustainable Transition continues the trends seen between 2020 and 2025 throughout the time horizons, with efficiency measures and lower growth in new technologies resulting in a marginally declining industrial and residential and commercial demand. Gas in the transport sector continues to grow and demand for power generation is maintained.
Distributed Generation and Global Climate Action see a heavier decline in space heating demand due to the increase in heat pump technology, although with a higher percentage of hybrid heat pumps in Distributed Generation the impact is lessened. Power generation demand reduces significantly in both as gas power plants are more often used to balance the electricity systems dominated by renewable technology. Industrial demand observes the least change as economic growth means requirements for high heat processes, although these will become more efficient.
The high demand cases displayed by the 2-week and peak5 requirements reflect the changing nature of residential and commercial demand seen in the annual timeframe, as space heating typically drives peak gas consumption. As a result, final demand 2-week and peak values drop furthest in Global Climate Action due to the increase in electrical heat pumps and overall efficiency measures. Hybrid heat pumps in Distributed Generation still use the gas system to cope with peak demands driven by cold temperatures. Sustainable Transition observes the least change as consumers have invested in more traditional technology, although this is more efficient.
Gas for power generation is also a significant high demand case element across all scenarios, where even in scenarios that see high levels of storage or demand side response back up to high levels of intermittent renewables is a vital role for flexible gas plants.
Figure 6: Total annual gas demand by scenario
Residential & Commercial Industrial Transport Power Historic Demand Average
0
2000
3000
4000
5000
6000
1000
TWh
2020 2025CBG
2025GBC
ST2030
ST2040
GCA2040
DG2030
DG2040
EUCO2030
Total annual gas demand by scenario
Figure 7: Total gas demand in high demand cases (Peak day and 2-week cold case)
Final Demand Gas demand for power generation Yearly Average
0
10000
15000
20000
30000
25000
35000
40000
5000
GW
h/d
2020 2025CBG
2025GBC
ST 2030 ST 2040 GCA2040
DG 2030 DG 2040EUCO2030
2 W
eek
Peak
2 W
eek
Peak
2 W
eek
Peak
2 W
eek
Peak
2 W
eek
Peak
2 W
eek
Peak
2 W
eek
Peak
2 W
eek
Peak
2 W
eek
Peak
Total gas demand in high demand cases (Peak day and 2-week cold case)
5 2 week high demand case: Maximum aggregation of gas demand reached over 14 consecutive days once every twenty years in each country to capture the influence of a long cold spell. Peak day: Maximum level of gas demand used for the design of the network in each country to capture maximum transported energy and ensure consistency with national regulatory frameworks.
23
TY
ND
P 20
18 S
cena
rio
Rep
ort
3.2
Supply
Figure 8: Electricity installed generation capacity by source and scenario
Figure 10: Gas supply – Indigenous production and maximum supply potentials by source
Figure 9: Electricity net generation by source and scenario
Nuclear Coal + Lignite Gas Peak Hydro and pumped storage WindSolar Biomass and other RES Other Non RES
0
500
1500
2500
1000
2000
GW
2020 2025 ST2030
DG2030
ST2040
GCA2040
EUCO2030
DG2040
Electricity installed generation capacity by source and scenario
National ProductionTurkey Azerbaijan LNG
Biomethane P2G Russia Norway Algeria Lybia
0
2000
4000
6000
8000
1000
3000
5000
7000
TWh
2020 2025 ST 2030 DG 2030 ST 2040 GCA2040
EUCO2030
DG 2040
Gas supply – Indigenous production and maximum supply potentials by source
Nuclear Coal + Lignite Gas Peak Hydro and pumped storage WindSolar Biomass and other RES Other Non RES
0
1000
500
3000
5000
2000
4000
1500
3500
2500
4500
TWh
2020 2025CBG
2025GBC
ST 2030 ST 2040 GCA2040
DG 2030 DG 2040EUCO2030
Electricity installed generation capacity by source and scenario
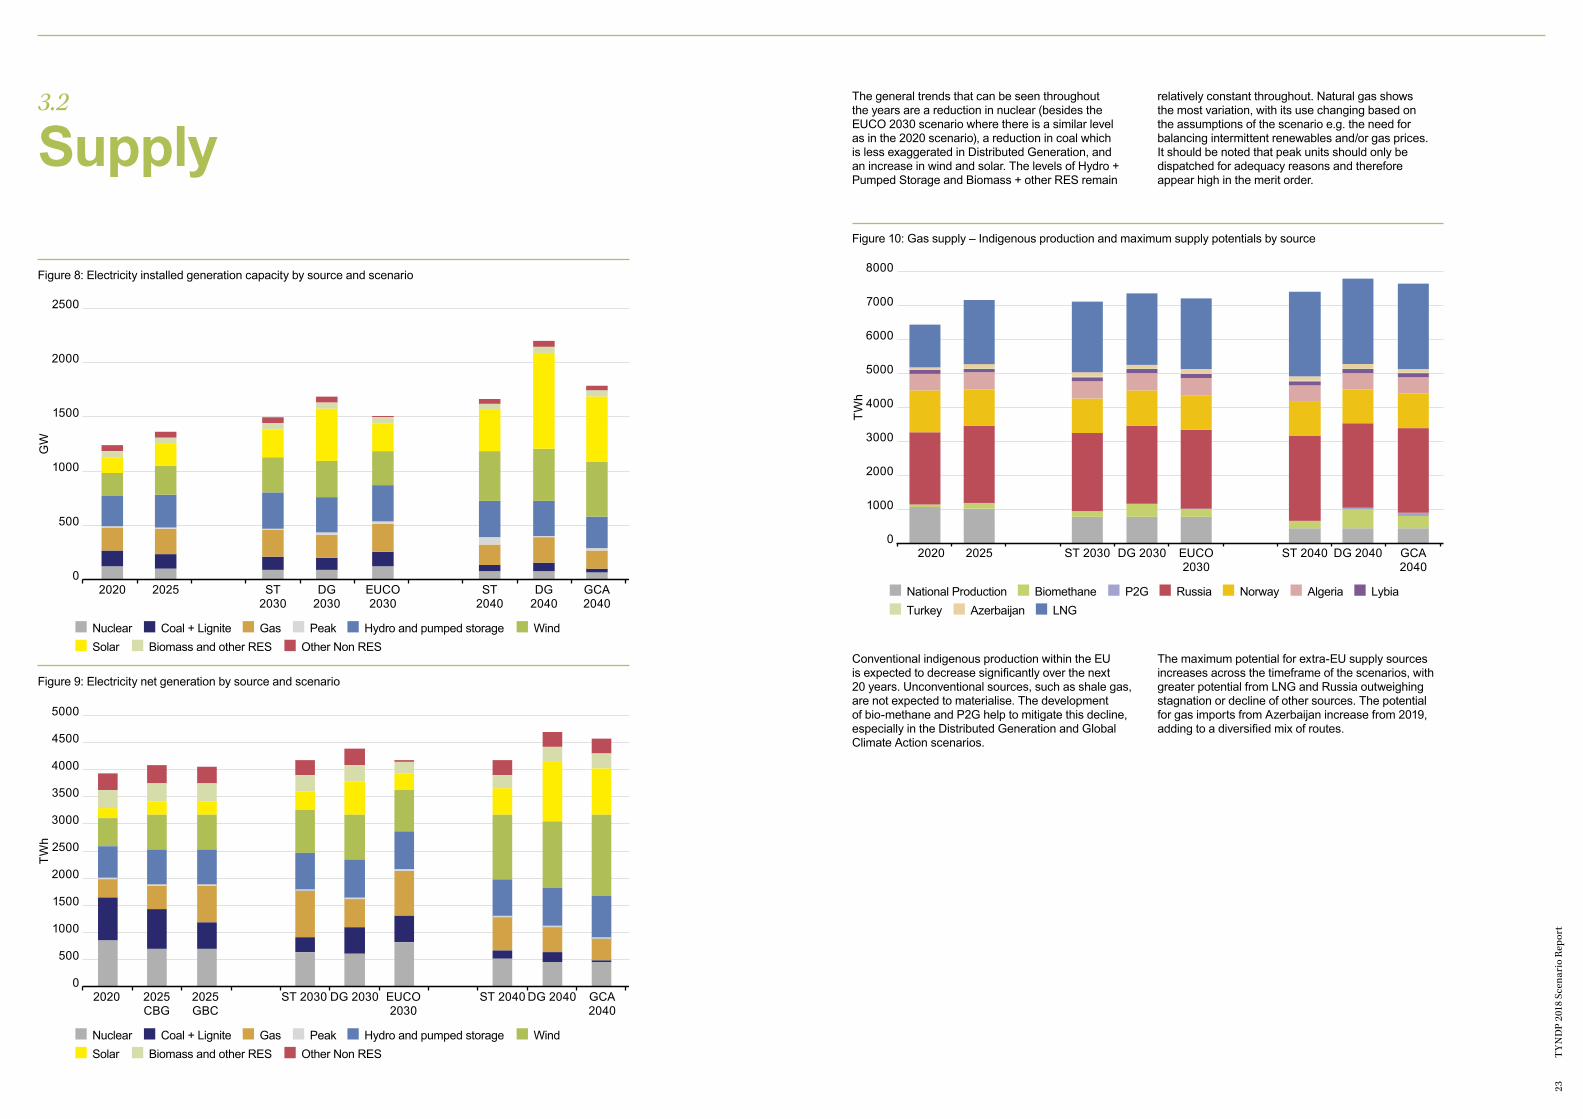
The general trends that can be seen throughout the years are a reduction in nuclear (besides the EUCO 2030 scenario where there is a similar level as in the 2020 scenario), a reduction in coal which is less exaggerated in Distributed Generation, and an increase in wind and solar. The levels of Hydro + Pumped Storage and Biomass + other RES remain
relatively constant throughout. Natural gas shows the most variation, with its use changing based on the assumptions of the scenario e.g. the need for balancing intermittent renewables and/or gas prices. It should be noted that peak units should only be dispatched for adequacy reasons and therefore appear high in the merit order.
Conventional indigenous production within the EU is expected to decrease significantly over the next 20 years. Unconventional sources, such as shale gas, are not expected to materialise. The development of bio-methane and P2G help to mitigate this decline, especially in the Distributed Generation and Global Climate Action scenarios.
The maximum potential for extra-EU supply sources increases across the timeframe of the scenarios, with greater potential from LNG and Russia outweighing stagnation or decline of other sources. The potential for gas imports from Azerbaijan increase from 2019, adding to a diversified mix of routes.
25
TY
ND
P 20
18 S
cena
rio
Rep
ort
3.3
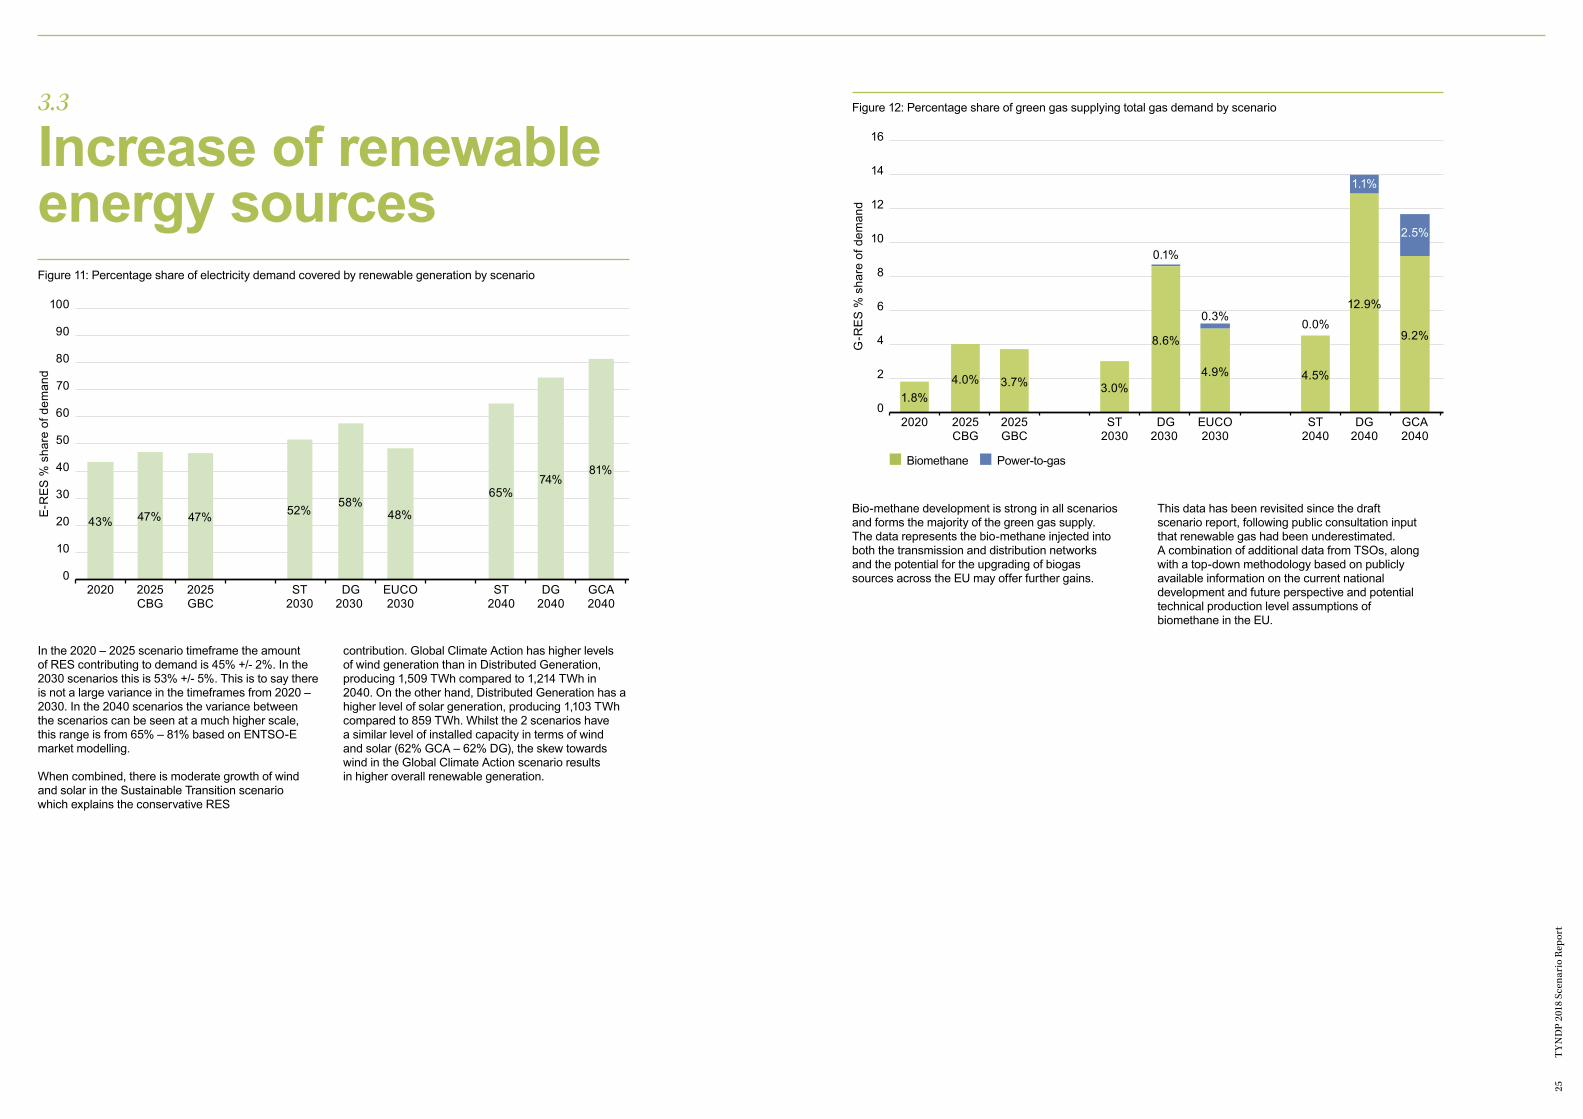
Increase of renewable energy sourcesFigure 11: Percentage share of electricity demand covered by renewable generation by scenario
Figure 12: Percentage share of green gas supplying total gas demand by scenario
0
20
30
40
60
80
100
10
50
70
90
E-R
ES
% s
hare
of d
eman
d
2020 2025CBG
2025GBC
ST2030
ST2040
GCA2040
DG2030
DG2040
EUCO2030
43% 47% 47% 52%58%
48%
65%74%
81%
Percentage share of electricity demand covered by renewable generation by scenario
Biomethane Power-to-gas
0
4
8
12
16
2
6
10
14
G-R
ES
% s
hare
of d
eman
d
2020 2025CBG
2025GBC
ST2030
ST2040
GCA2040
DG2030
DG2040
EUCO2030
1.8%4.0% 3.7% 3.0%
0.1%
8.6%
0.3%
4.9%
1.1%
12.9%
2.5%
9.2%
4.5%
0.0%
Percentage share of green gas supplying total gas demand by scenario
In the 2020 – 2025 scenario timeframe the amount of RES contributing to demand is 45% +/- 2%. In the 2030 scenarios this is 53% +/- 5%. This is to say there is not a large variance in the timeframes from 2020 – 2030. In the 2040 scenarios the variance between the scenarios can be seen at a much higher scale, this range is from 65% – 81% based on ENTSO-E market modelling.
When combined, there is moderate growth of wind and solar in the Sustainable Transition scenario which explains the conservative RES
contribution. Global Climate Action has higher levels of wind generation than in Distributed Generation, producing 1,509 TWh compared to 1,214 TWh in 2040. On the other hand, Distributed Generation has a higher level of solar generation, producing 1,103 TWh compared to 859 TWh. Whilst the 2 scenarios have a similar level of installed capacity in terms of wind and solar (62% GCA – 62% DG), the skew towards wind in the Global Climate Action scenario results in higher overall renewable generation.
Bio-methane development is strong in all scenarios and forms the majority of the green gas supply. The data represents the bio-methane injected into both the transmission and distribution networks and the potential for the upgrading of biogas sources across the EU may offer further gains.
This data has been revisited since the draft scenario report, following public consultation input that renewable gas had been underestimated. A combination of additional data from TSOs, along with a top-down methodology based on publicly available information on the current national development and future perspective and potential technical production level assumptions of biomethane in the EU.
27
TY
ND
P 20
18 S
cena
rio
Rep
ort
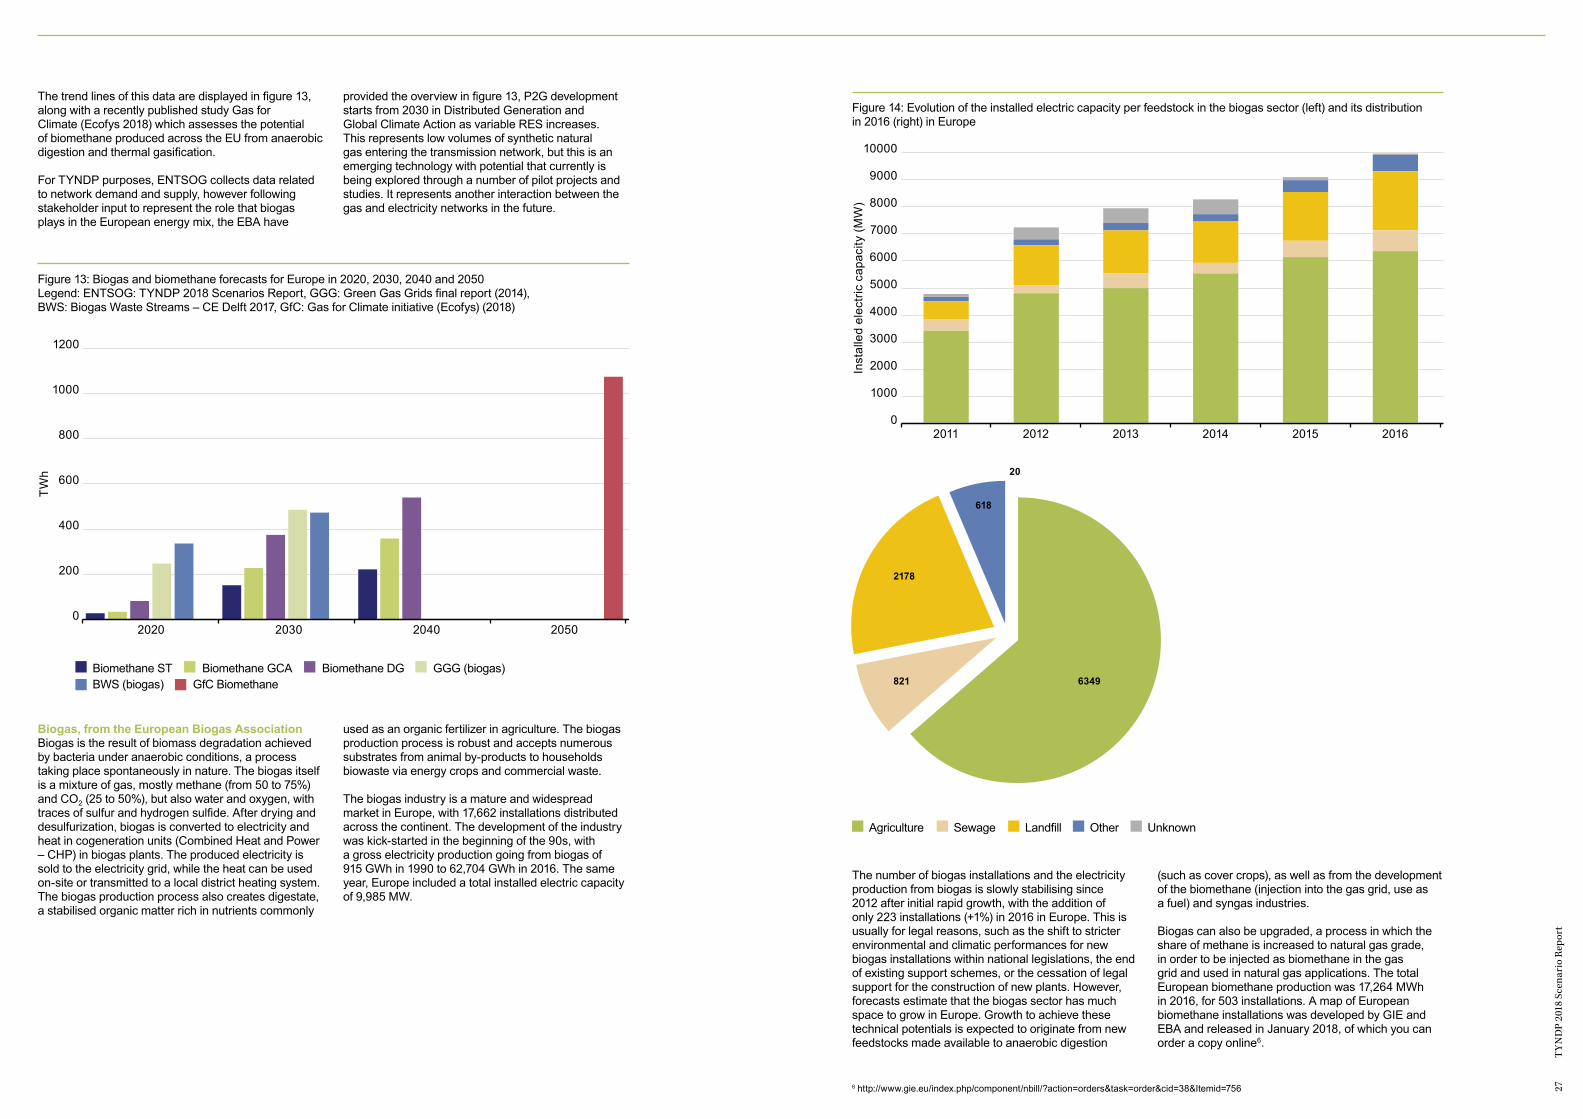
Figure 14: Evolution of the installed electric capacity per feedstock in the biogas sector (left) and its distribution in 2016 (right) in Europe
Agriculture Sewage Landfill Other Unknown
0
3000
4000
6000
8000
10000
1000
2000
5000
7000
9000
Inst
alle
d el
ectri
c ca
paci
ty (M
W)
2011 2012 2013 2014 20162015
Evolution of the installed electric capacity per feedstock in the biogas sector (left) and its distribution in 2016 (right) in Europe
Agriculture Sewage Landfill Other Unknown
0
3000
4000
6000
8000
10000
1000
2000
5000
7000
9000
G-R
ES
% s
hare
of d
eman
d
2011 2012 2013 2014 20162015
Evolution of the installed electric capacity per feedstock in the biogas sector (left) and its distribution in 2016 (right) in Europe
6349
618
20
2178
821
Biogas, from the European Biogas Association Biogas is the result of biomass degradation achieved by bacteria under anaerobic conditions, a process taking place spontaneously in nature. The biogas itself is a mixture of gas, mostly methane (from 50 to 75%) and CO2 (25 to 50%), but also water and oxygen, with traces of sulfur and hydrogen sulfide. After drying and desulfurization, biogas is converted to electricity and heat in cogeneration units (Combined Heat and Power – CHP) in biogas plants. The produced electricity is sold to the electricity grid, while the heat can be used on-site or transmitted to a local district heating system. The biogas production process also creates digestate, a stabilised organic matter rich in nutrients commonly
used as an organic fertilizer in agriculture. The biogas production process is robust and accepts numerous substrates from animal by-products to households biowaste via energy crops and commercial waste.
The biogas industry is a mature and widespread market in Europe, with 17,662 installations distributed across the continent. The development of the industry was kick-started in the beginning of the 90s, with a gross electricity production going from biogas of 915 GWh in 1990 to 62,704 GWh in 2016. The same year, Europe included a total installed electric capacity of 9,985 MW.
The trend lines of this data are displayed in figure 13, along with a recently published study Gas for Climate (Ecofys 2018) which assesses the potential of biomethane produced across the EU from anaerobic digestion and thermal gasification.
For TYNDP purposes, ENTSOG collects data related to network demand and supply, however following stakeholder input to represent the role that biogas plays in the European energy mix, the EBA have
provided the overview in figure 13, P2G development starts from 2030 in Distributed Generation and Global Climate Action as variable RES increases. This represents low volumes of synthetic natural gas entering the transmission network, but this is an emerging technology with potential that currently is being explored through a number of pilot projects and studies. It represents another interaction between the gas and electricity networks in the future.
The number of biogas installations and the electricity production from biogas is slowly stabilising since 2012 after initial rapid growth, with the addition of only 223 installations (+1%) in 2016 in Europe. This is usually for legal reasons, such as the shift to stricter environmental and climatic performances for new biogas installations within national legislations, the end of existing support schemes, or the cessation of legal support for the construction of new plants. However, forecasts estimate that the biogas sector has much space to grow in Europe. Growth to achieve these technical potentials is expected to originate from new feedstocks made available to anaerobic digestion
(such as cover crops), as well as from the development of the biomethane (injection into the gas grid, use as a fuel) and syngas industries.
Biogas can also be upgraded, a process in which the share of methane is increased to natural gas grade, in order to be injected as biomethane in the gas grid and used in natural gas applications. The total European biomethane production was 17,264 MWh in 2016, for 503 installations. A map of European biomethane installations was developed by GIE and EBA and released in January 2018, of which you can order a copy online6.
6 http://www.gie.eu/index.php/component/nbill/?action=orders&task=order&cid=38&Itemid=756
Figure 13: Biogas and biomethane forecasts for Europe in 2020, 2030, 2040 and 2050Legend: ENTSOG: TYNDP 2018 Scenarios Report, GGG: Green Gas Grids final report (2014), BWS: Biogas Waste Streams – CE Delft 2017, GfC: Gas for Climate initiative (Ecofys) (2018)
Biomethane STBWS (biogas) GfC Biomethane
Biomethane GCA Biomethane DG GGG (biogas)
0
400
800
1000
1200
200
600
TWh
2020 2030 20502040
29
TY
ND
P 20
18 S
cena
rio
Rep
ort
3.4
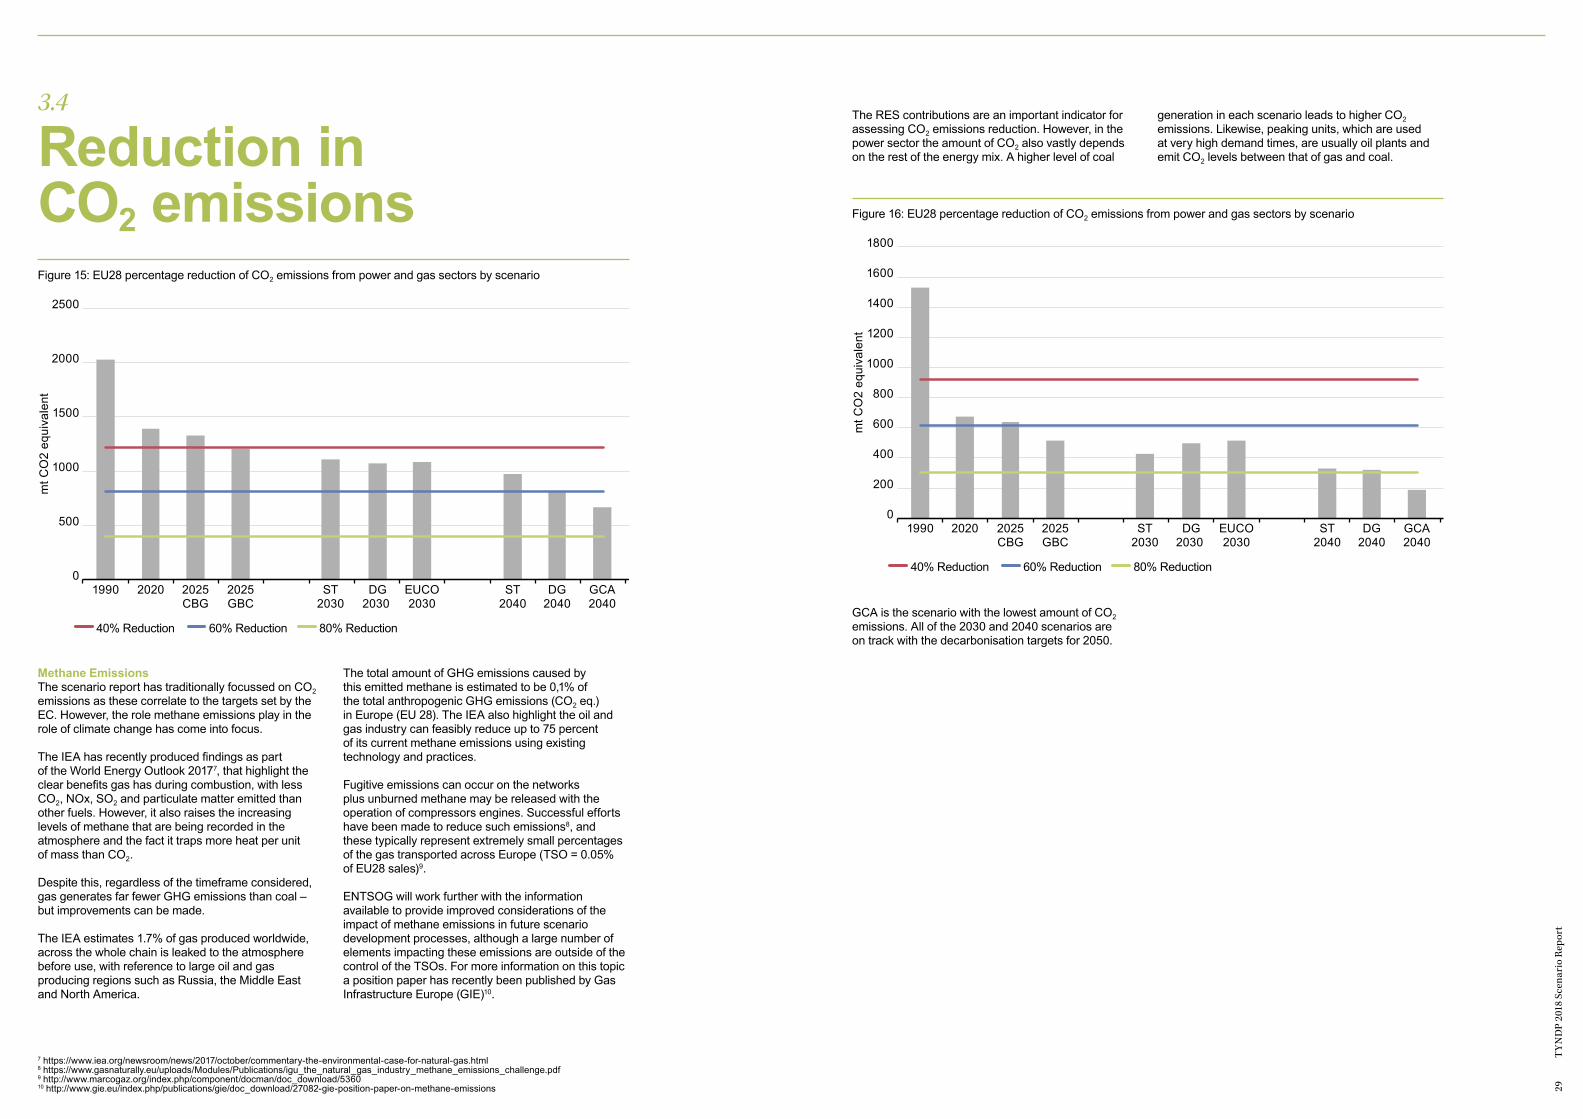
Reduction in CO2 emissionsFigure 15: EU28 percentage reduction of CO2 emissions from power and gas sectors by scenario
Figure 16: EU28 percentage reduction of CO2 emissions from power and gas sectors by scenario
40% Reduction 60% Reduction 80% Reduction
0
1000
2000
2500
500
1500
mt C
O2
equi
vale
nt
1990 2020 2025CBG
2025GBC
ST2030
ST2040
GCA2040
DG2030
DG2040
EUCO2030
EU28 percentage reduction of CO2 emissions from power and gas sectors by scenario
40% Reduction 60% Reduction 80% Reduction
0
800
1000
1400
1600
1800
200
400
600
1200
mt C
O2
equi
vale
nt
1990 2020 2025CBG
2025GBC
ST2030
ST2040
GCA2040
DG2030
DG2040
EUCO2030
EU28 percentage reduction of CO2 emissions from power and gas sectors by scenario
Methane EmissionsThe scenario report has traditionally focussed on CO2 emissions as these correlate to the targets set by the EC. However, the role methane emissions play in the role of climate change has come into focus.
The IEA has recently produced findings as part of the World Energy Outlook 20177, that highlight the clear benefits gas has during combustion, with less CO2, NOx, SO2 and particulate matter emitted than other fuels. However, it also raises the increasing levels of methane that are being recorded in the atmosphere and the fact it traps more heat per unit of mass than CO2.
Despite this, regardless of the timeframe considered, gas generates far fewer GHG emissions than coal – but improvements can be made.
The IEA estimates 1.7% of gas produced worldwide, across the whole chain is leaked to the atmosphere before use, with reference to large oil and gas producing regions such as Russia, the Middle East and North America.
The total amount of GHG emissions caused by this emitted methane is estimated to be 0,1% of the total anthropogenic GHG emissions (CO2 eq.) in Europe (EU 28). The IEA also highlight the oil and gas industry can feasibly reduce up to 75 percent of its current methane emissions using existing technology and practices.
Fugitive emissions can occur on the networks plus unburned methane may be released with the operation of compressors engines. Successful efforts have been made to reduce such emissions8, and these typically represent extremely small percentages of the gas transported across Europe (TSO = 0.05% of EU28 sales)9.
ENTSOG will work further with the information available to provide improved considerations of the impact of methane emissions in future scenario development processes, although a large number of elements impacting these emissions are outside of the control of the TSOs. For more information on this topic a position paper has recently been published by Gas Infrastructure Europe (GIE)10.
The RES contributions are an important indicator for assessing CO2 emissions reduction. However, in the power sector the amount of CO2 also vastly depends on the rest of the energy mix. A higher level of coal
generation in each scenario leads to higher CO2 emissions. Likewise, peaking units, which are used at very high demand times, are usually oil plants and emit CO2 levels between that of gas and coal.
GCA is the scenario with the lowest amount of CO2 emissions. All of the 2030 and 2040 scenarios are on track with the decarbonisation targets for 2050.
7 https://www.iea.org/newsroom/news/2017/october/commentary-the-environmental-case-for-natural-gas.html8 https://www.gasnaturally.eu/uploads/Modules/Publications/igu_the_natural_gas_industry_methane_emissions_challenge.pdf9 http://www.marcogaz.org/index.php/component/docman/doc_download/536010 http://www.gie.eu/index.php/publications/gie/doc_download/27082-gie-position-paper-on-methane-emissions

31
TY
ND
P 20
18 S
cena
rio
Rep
ort
3.5
Electricity marginal cost
3.6
Benchmarking
Figure 17: Marginal cost of electricity, yearly average per scenario, €/MWh (real values)
Figure 18: Electricity demand comparison to WEO 2016 scenarios
0
20
30
40
60
80
100
10
50
70
90
€/M
Wh
2020 2025CBG
2025GBC
ST2030
ST2040
GCA2040
DG2030
DG2040
EUCO2030
3853
66
8672 67
48
6660
Marginal cost of electricity, yearly average per scenario, €/MWh (real values)
The marginal cost of electricity in the scenarios is primarily driven by assumptions on fuel and CO2 prices. The increases in zero marginal cost wind and solar power generation has significant impact on the average marginal cost of the system. Sustainable Transition is a low fuel price scenario, Global Climate Action captures a policy environment with a high CO2 price and in Distributed Generation, world energy
fuel prices are highest. The higher fuel prices in Distributed Generation and Global Climate Action lead to higher marginal costs compared to the Sustainable Transition scenario, despite a significantly higher share of renewables in Distributed Generation and Global Climate Action. Fuel prices are explained in more detail in section 5.3.
Although all scenario development processes follow different assumptions and use different modelling techniques, the ENTSOs see value in benchmarking the output against other sources of information. The charts below offer a comparison in terms of demand for both sectors against those in the IEA
World Energy Outlook 201611. Similar values can be seen for both sectors, showing that despite different scenario assumptions, there are certain consistencies in terms of demand evolution seen by IEA and the scenario development from the ENTSOs.
11 Current policies (CPS): This scenario only considers policies that have formally adopted implementing measures along with the assumption that these will remain unchanged. New policies (NPS): This scenario, in addition to the considerations for the current policies, adds relevant policy intentions that have been announced even if they have not yet been fully defined. Policies are introduced in a cautious manner relating to renewable energy, energy efficiency, alternative fuels in transport, carbon pricing, energy subsidies and the future of nuclear power. 450 Scenario (450 S): This scenario takes the goal of limiting the increase in the global average temperature to two degrees Celsius by assuming a range of policies that reduce GHG emissions to a stable concentration of 450 parts per million by 2100.
0
2000
3000
5000
7000
1000
4000
6000
TWh
ST 2030 DG 2030 ENTSOsEUCO 30
IEA WEO16CPS
IEA WEO16450S
IEA WEO16NPS
Electricity demand comparison to WEO 2016 scenarios
0
2000
3000
5000
7000
1000
4000
6000
TWh
ST 2040 DG 2040 GCA 2040 IEA WEO16CPS
IEA WEO16450S
IEA WEO16NPS
Electricity demand comparison to WEO 2016 scenarios

Figure 19: Gas demand comparison to WEO 2016 scenarios
33
TY
ND
P 20
18 S
cena
rio
Rep
ort
0
2000
3000
5000
7000
1000
4000
6000
TWh
ST 2030 DG 2030 ENTSOsEUCO 30
IEA WEO16CPS
IEA WEO16450S
IEA WEO16NPS
Gas demand comparison to WEO 2016 scenarios
0
2000
3000
5000
7000
1000
4000
6000
TWh
ST 2040 DG 2040 GCA 2040 IEA WEO16CPS
IEA WEO16450S
IEA WEO16NPS
Gas demand comparison to WEO 2016 scenarios
Section 4
Stakeholder process, feedback and how this shaped the scenarios
35
TY
ND
P 20
18 S
cena
rio
Rep
ort
> STAKEHOLDERS
> GAS AND ELECTRICITY SECTORS, NGOs
> REGULATORS
> MEMBERS STATES
> WORKSHOPS
> WEBINARS
> CONSULTATIONS
Image courtesy of SNAM
37
TY
ND
P 20
18 S
cena
rio
Rep
ort
External stakeholders representing the gas and electricity sectors, consumer and environmental NGOs, regulators and Members States were key in building an ambitious, yet technically sound, set of scenarios.
A new process was set up by ENTSO-E and ENTSOG to work jointly with stakeholders through interactive workshops, webinars and web-consultations. Dozens of stakeholders provided input to formulate, with the ENTSOs, the new scenarios storylines for 2030 and 2040.
As a result, the ENTSOs scenarios uniquely represent generally accepted, yet highly ambitious, views of what the future could look like, rather than a view of the future desired or promoted by any organisation. They will allow the testing of Europe’s future energy infrastructures under varied and stressing situations.
The development process is covered in detail by the material released prior to the publication of this report12, the high level process for these storylines followed the steps below:
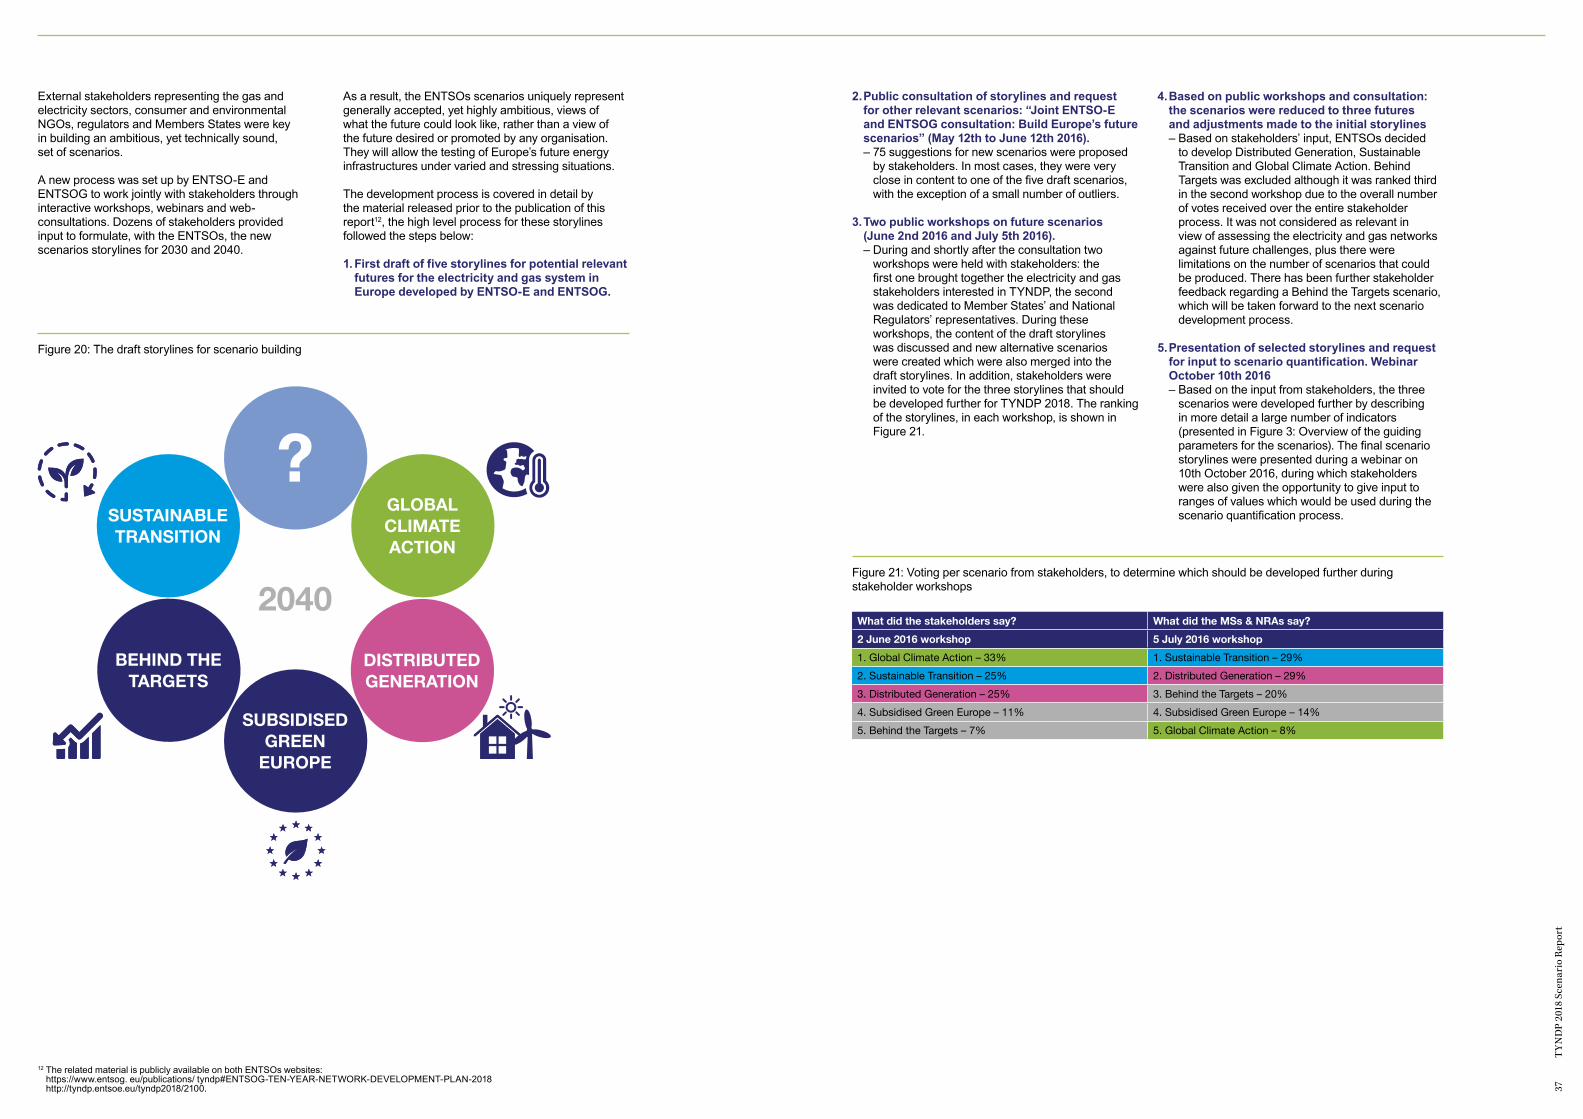
1. First draft of five storylines for potential relevant futures for the electricity and gas system in Europe developed by ENTSO-E and ENTSOG.
2. Public consultation of storylines and request for other relevant scenarios: “Joint ENTSO-E and ENTSOG consultation: Build Europe’s future scenarios” (May 12th to June 12th 2016).
– 75 suggestions for new scenarios were proposed by stakeholders. In most cases, they were very close in content to one of the five draft scenarios, with the exception of a small number of outliers.
3. Two public workshops on future scenarios (June 2nd 2016 and July 5th 2016).
– During and shortly after the consultation two workshops were held with stakeholders: the first one brought together the electricity and gas stakeholders interested in TYNDP, the second was dedicated to Member States’ and National Regulators’ representatives. During these workshops, the content of the draft storylines was discussed and new alternative scenarios were created which were also merged into the draft storylines. In addition, stakeholders were invited to vote for the three storylines that should be developed further for TYNDP 2018. The ranking of the storylines, in each workshop, is shown in Figure 21.
4. Based on public workshops and consultation: the scenarios were reduced to three futures and adjustments made to the initial storylines
– Based on stakeholders’ input, ENTSOs decided to develop Distributed Generation, Sustainable Transition and Global Climate Action. Behind Targets was excluded although it was ranked third in the second workshop due to the overall number of votes received over the entire stakeholder process. It was not considered as relevant in view of assessing the electricity and gas networks against future challenges, plus there were limitations on the number of scenarios that could be produced. There has been further stakeholder feedback regarding a Behind the Targets scenario, which will be taken forward to the next scenario development process.
5. Presentation of selected storylines and request for input to scenario quantification. Webinar October 10th 2016
– Based on the input from stakeholders, the three scenarios were developed further by describing in more detail a large number of indicators (presented in Figure 3: Overview of the guiding parameters for the scenarios). The final scenario storylines were presented during a webinar on 10th October 2016, during which stakeholders were also given the opportunity to give input to ranges of values which would be used during the scenario quantification process.
12 The related material is publicly available on both ENTSOs websites: https://www.entsog. eu/publications/ tyndp#ENTSOG-TEN-YEAR-NETWORK-DEVELOPMENT-PLAN-2018 http://tyndp.entsoe.eu/tyndp2018/2100.
Figure 20: The draft storylines for scenario building
Figure 21: Voting per scenario from stakeholders, to determine which should be developed further during stakeholder workshops
2040
SUSTAINABLE TRANSITION
SUBSIDISED GREEN
EUROPE
GLOBAL CLIMATE ACTION
?
BEHIND THE TARGETS
DISTRIBUTED GENERATION
What did the stakeholders say? What did the MSs & NRAs say?
2 June 2016 workshop 5 July 2016 workshop
1. Global Climate Action – 33% 1. Sustainable Transition – 29%
2. Sustainable Transition – 25% 2. Distributed Generation – 29%
3. Distributed Generation – 25% 3. Behind the Targets – 20%
4. Subsidised Green Europe – 11% 4. Subsidised Green Europe – 14%
5. Behind the Targets – 7% 5. Global Climate Action – 8%
Further information regarding the EUCO 30 scenario can be found on the European Commission’s Energy Modelling website13. How this data has been used in the scenario building process has been detailed within this report and supporting Annexes, including its translation from one modelling tool to another and assumptions made.
Altogether the scenarios represent the possible evolution of relevant futures for the energy system in Europe, including in terms of policy anticipation which will drive these changes. The selection of the three scenarios, as well as the content in the storylines, is based on input received during the stakeholder consultation process.
All input to the scenario development process, from stakeholder input to underlying policies or actual quantitative parameters, are all assumptions which determine the output of the scenario results driven by the methodologies and tools used. Changes to these assumptions would reflect in different outcomes than those presented in this document.
13 https://ec.europa.eu/energy/en/data-analysis/energy-modelling 39
TY
ND
P 20
18 S
cena
rio
Rep
ort
Section 5
Scenario development methodology
The scenarios describe three storylines for the European gas and electricity systems transition from 2020 until 2040, detailing electrical load and generation along with gas demand and supply, within a framework of EU targets and commodity prices.
The ENTSO-E and ENTSOG jointly developed pathways are also supplemented with an external scenario based on inputs developed by the European Commission for 2030, called the EUCO scenario.
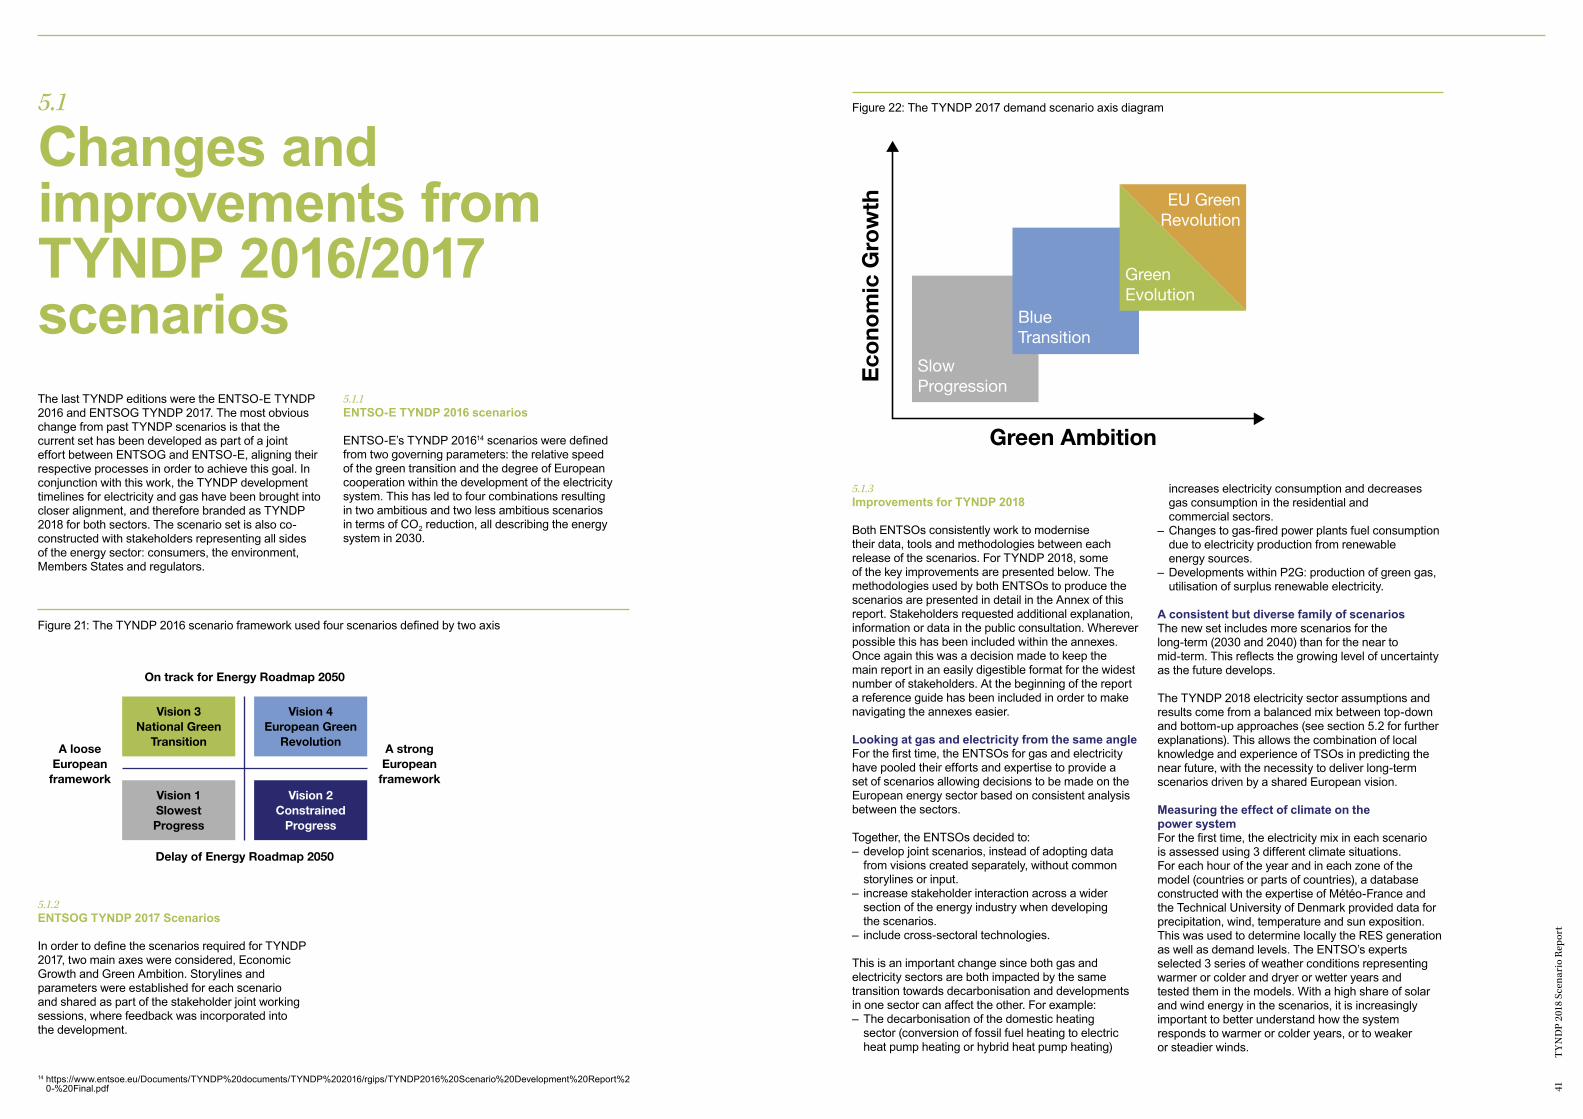
41
TY
ND
P 20
18 S
cena
rio
Rep
ort
5.1
Changes and improvements from TYNDP 2016/2017 scenariosThe last TYNDP editions were the ENTSO-E TYNDP 2016 and ENTSOG TYNDP 2017. The most obvious change from past TYNDP scenarios is that the current set has been developed as part of a joint effort between ENTSOG and ENTSO-E, aligning their respective processes in order to achieve this goal. In conjunction with this work, the TYNDP development timelines for electricity and gas have been brought into closer alignment, and therefore branded as TYNDP 2018 for both sectors. The scenario set is also co-constructed with stakeholders representing all sides of the energy sector: consumers, the environment, Members States and regulators.
5.1.1ENTSO-E TYNDP 2016 scenarios
ENTSO-E’s TYNDP 201614 scenarios were defined from two governing parameters: the relative speed of the green transition and the degree of European cooperation within the development of the electricity system. This has led to four combinations resulting in two ambitious and two less ambitious scenarios in terms of CO2 reduction, all describing the energy system in 2030.
5.1.2ENTSOG TYNDP 2017 Scenarios
In order to define the scenarios required for TYNDP 2017, two main axes were considered, Economic Growth and Green Ambition. Storylines and parameters were established for each scenario and shared as part of the stakeholder joint working sessions, where feedback was incorporated into the development.
5.1.3Improvements for TYNDP 2018
Both ENTSOs consistently work to modernise their data, tools and methodologies between each release of the scenarios. For TYNDP 2018, some of the key improvements are presented below. The methodologies used by both ENTSOs to produce the scenarios are presented in detail in the Annex of this report. Stakeholders requested additional explanation, information or data in the public consultation. Wherever possible this has been included within the annexes. Once again this was a decision made to keep the main report in an easily digestible format for the widest number of stakeholders. At the beginning of the report a reference guide has been included in order to make navigating the annexes easier.
Looking at gas and electricity from the same angleFor the first time, the ENTSOs for gas and electricity have pooled their efforts and expertise to provide a set of scenarios allowing decisions to be made on the European energy sector based on consistent analysis between the sectors.
Together, the ENTSOs decided to:– develop joint scenarios, instead of adopting data
from visions created separately, without common storylines or input.
– increase stakeholder interaction across a wider section of the energy industry when developing the scenarios.
– include cross-sectoral technologies.
This is an important change since both gas and electricity sectors are both impacted by the same transition towards decarbonisation and developments in one sector can affect the other. For example:– The decarbonisation of the domestic heating
sector (conversion of fossil fuel heating to electric heat pump heating or hybrid heat pump heating)
increases electricity consumption and decreases gas consumption in the residential and commercial sectors.
– Changes to gas-fired power plants fuel consumption due to electricity production from renewable energy sources.
– Developments within P2G: production of green gas, utilisation of surplus renewable electricity.
A consistent but diverse family of scenarios The new set includes more scenarios for the long-term (2030 and 2040) than for the near to mid-term. This reflects the growing level of uncertainty as the future develops.
The TYNDP 2018 electricity sector assumptions and results come from a balanced mix between top-down and bottom-up approaches (see section 5.2 for further explanations). This allows the combination of local knowledge and experience of TSOs in predicting the near future, with the necessity to deliver long-term scenarios driven by a shared European vision.
Measuring the effect of climate on the power systemFor the first time, the electricity mix in each scenario is assessed using 3 different climate situations. For each hour of the year and in each zone of the model (countries or parts of countries), a database constructed with the expertise of Météo-France and the Technical University of Denmark provided data for precipitation, wind, temperature and sun exposition. This was used to determine locally the RES generation as well as demand levels. The ENTSO’s experts selected 3 series of weather conditions representing warmer or colder and dryer or wetter years and tested them in the models. With a high share of solar and wind energy in the scenarios, it is increasingly important to better understand how the system responds to warmer or colder years, or to weaker or steadier winds.
14 https://www.entsoe.eu/Documents/TYNDP%20documents/TYNDP%202016/rgips/TYNDP2016%20Scenario%20Development%20Report%2 0-%20Final.pdf
On track for Energy Roadmap 2050
A loose European
framework
A strong European
framework
Delay of Energy Roadmap 2050
Vision 3 National Green
Transition
Vision 1 Slowest Progress
Vision 4 European Green
Revolution
Vision 2 Constrained
Progress
Figure 21: The TYNDP 2016 scenario framework used four scenarios defined by two axis
Figure 22: The TYNDP 2017 demand scenario axis diagram
Eco
nom
ic G
row
th
Green Ambition
EU Green Revolution
Green Evolution
BlueTransition
Slow Progression

43
TY
ND
P 20
18 S
cena
rio
Rep
ort
Improving the modelling of demand ENTSO-E and ENTSOG have both focused on improving the prediction of energy consumption. New approaches and algorithms were developed to more precisely forecast the penetration of electricity demand side technologies (including demand response, electric vehicles, heat pumps and home storage). These served as input to determine specific
load profiles for each zone, scenario and climate condition. The gas demand data for scenarios now includes a sectoral breakdown for all countries.
Thanks to the new level of collaboration between ENTSOG and ENTSO-E, the output of electricity models now directly serves as an input for the gas scenarios power sector consumption profiles.
For TYNDP 2017, ENTSOG developed a gas for power generation methodology called the ‘Thermal Gap’ approach, aligning with specific ENTSO-E TYNDP 2016 Visions and using this data as an input. The installed capacity and generation data of coal and gas plants were used to create a ‘Thermal Gap’, which depending on the storyline would either be dominated by gas or coal by flexing the production between each fuel source to meet the required generation. As a result, although the overall generation values were the same, the share from gas or coal would differ compared with the ENTSO-E Visions.
In the electricity sector the development of renewable energy sources that have started over past years will see a tremendous evolution in the future. Also the demand for electricity is expected to develop significantly in sectors currently not massively electrified, such as heating or transport. In the gas sector, significant changes are expected in the demand pattern, with the role of gas expected to decrease in the heating sector but to develop in parts of the transport sector. In terms of supplies, the gas sector is also expected to experience a development of renewable gas sources, produced within the European borders, that will be complemented by the gas supplies coming from extra-EU supply sources.
Figure 23: TYNDP 2018 scenario framework
Today
2016
2020
2030
Vision 3
Scenarios
Vision
Forecast
Near
ENTSOG: TYNDP 17
1 Scenario2 Scenarios(coal vs gas merit order switch)
3 Scenarios
3 Scenarios
ENTSO-E: TYNDP 16
2020 2025 2030 2040
Mid Far
Vision 4
Vision 1
Vision 2
5.2
Main methodology elementsThe scenarios present consistent results for the gas and electricity sectors thanks to common storylines and datasets, plus a high level of coordination throughout the process. Because the different sectors face significantly different challenges moving forwards, and due to the fact electricity and gas are inherently different products, the ENTSOs have developed and retained scenario development methodologies best fitted to these sectoral challenges. While the main elements are summarised below, more detailed information can be found in the Annex report.
5.2.1Electricity sector methodology elements
Bottom-up and top-downTo build the TYNDP 2018 electricity scenario, ENTSO-E used a balanced mix between top-down and bottom-up approaches. This allows the combination of local knowledge and experience of TSOs in predicting the near future with the necessity to deliver long-term scenarios driven by a shared European vision.
– Because the near future is relatively predictable (especially as energy sector investments generally require long development periods), near-term scenarios for 2020 and 2025, as well as Sustainable Transition 2030, make the best use of the local knowledge of TSOs. Each TSO provides their estimation of demand, generation capacity and other elements based on common European storylines for each scenario. After analysis and consistency correction of the data, modelling tools calculate the output value of scenarios.
– Looking further into the future allows more margin of manoeuvre to determine the European and local energy landscapes. Longer-term scenarios (all 2040 and Distributed Generation 2030) are therefore built with a top-down approach and include a set of pre-determined European targets (such as the share of demand covered by RES technologies).
– For the top-down scenarios, a Thermal and RES Distribution phase was added in order to include peaking units for adequacy, access economic viability of plants and optimise the PV, onshore and offshore wind generation in the scenario. More information on optimisation can be found in the Annex II: Methodology.
Scenario re-runThe Scenario Re-run provides a window of opportunity for scenario refinement. After the initial scenario results are published in draft there is an opportunity for TSOs to provide feedback on the scenarios. During the re-run phase the TSO long term adequacy correspondents can formally request corrections or adaptions to the scenarios, but they can be accepted or rejected dependent on whether the request is consistent with the scenario storylines.
The final re-runs scenarios for 2025 and 2030 are fed into the ENTSOE & ENTSOG TYNDP CBA project assessment phases. During the scenario re-run phase, the TYNDP reference grid was changed to reflect the current TYNDP process. The final 2025 and 2030 CBA scenarios results are based on the TYNDP18 2027 reference grid.
One key element of the ENTSOE TYNDP18 process is the Identification of System Need (IoSN) process, this is a planning study that aims to assess potential infrastructure needs beyond 2030. The final 2040 scenario results are based on three new 2040 electricity grids resulting from the ENTOE TYNDP 18 IoSN process.
The market nodes for Crete, Corsica, Iceland, Israel and Tunisia were included in the 2025 and 2030 simulations. This was to improve the quality of the simulations and enable further studies following the scenario market studies.
General processThe process to draft description of storylines and eventually turn them into the results presented in this report involved dozens of experts from all regions of Europe. Here Europe is split into nodes by countries, then some countries further split into areas. A full list of the market nodes can be seen in Annex II: Methodology (1.3.2).
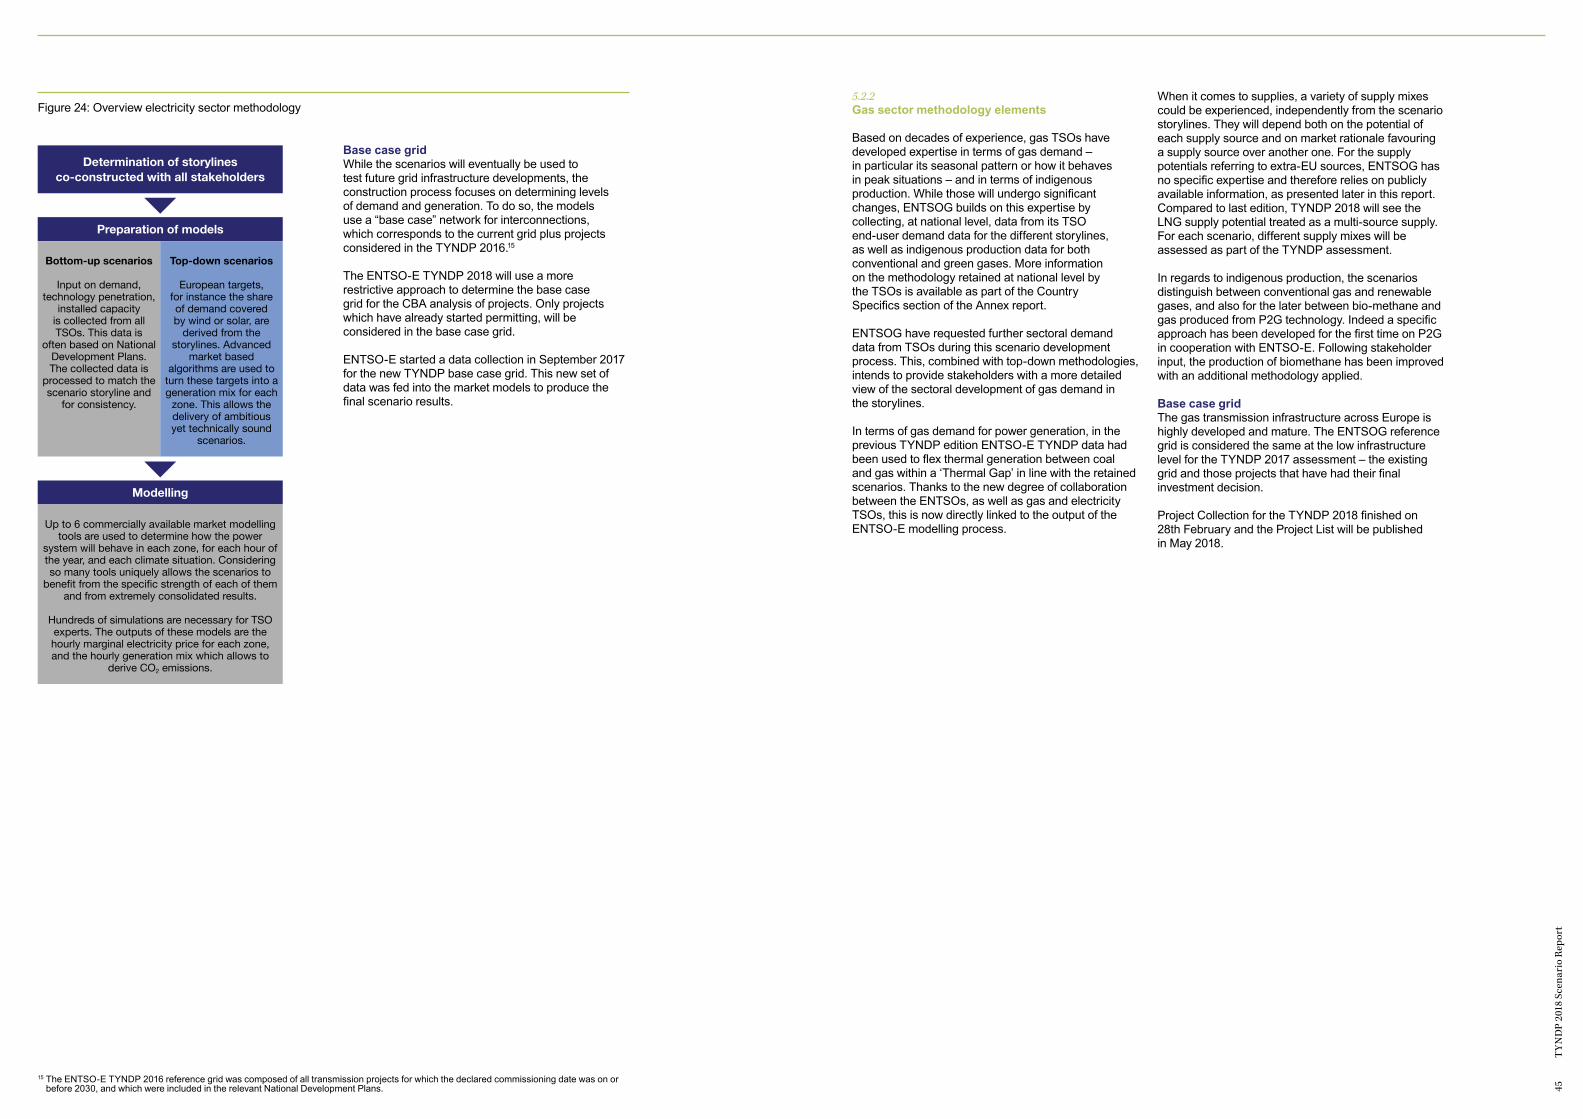
45
TY
ND
P 20
18 S
cena
rio
Rep
ort
Figure 24: Overview electricity sector methodology
Determination of storylines co-constructed with all stakeholders
Preparation of models
Modelling
Bottom-up scenarios
Input on demand, technology penetration,
installed capacity is collected from all TSOs. This data is
often based on National Development Plans. The collected data is
processed to match the scenario storyline and
for consistency.
Up to 6 commercially available market modelling tools are used to determine how the power
system will behave in each zone, for each hour of the year, and each climate situation. Considering so many tools uniquely allows the scenarios to
benefit from the specific strength of each of them and from extremely consolidated results.
Hundreds of simulations are necessary for TSO experts. The outputs of these models are the hourly marginal electricity price for each zone, and the hourly generation mix which allows to
derive CO2 emissions.
Top-down scenarios
European targets, for instance the share of demand covered by wind or solar, are
derived from the storylines. Advanced
market based algorithms are used to
turn these targets into a generation mix for each
zone. This allows the delivery of ambitious yet technically sound
scenarios.
Base case gridWhile the scenarios will eventually be used to test future grid infrastructure developments, the construction process focuses on determining levels of demand and generation. To do so, the models use a “base case” network for interconnections, which corresponds to the current grid plus projects considered in the TYNDP 2016.15
The ENTSO-E TYNDP 2018 will use a more restrictive approach to determine the base case grid for the CBA analysis of projects. Only projects which have already started permitting, will be considered in the base case grid.
ENTSO-E started a data collection in September 2017 for the new TYNDP base case grid. This new set of data was fed into the market models to produce the final scenario results.
15 The ENTSO-E TYNDP 2016 reference grid was composed of all transmission projects for which the declared commissioning date was on or before 2030, and which were included in the relevant National Development Plans.
5.2.2Gas sector methodology elements
Based on decades of experience, gas TSOs have developed expertise in terms of gas demand – in particular its seasonal pattern or how it behaves in peak situations – and in terms of indigenous production. While those will undergo significant changes, ENTSOG builds on this expertise by collecting, at national level, data from its TSO end-user demand data for the different storylines, as well as indigenous production data for both conventional and green gases. More information on the methodology retained at national level by the TSOs is available as part of the Country Specifics section of the Annex report.
ENTSOG have requested further sectoral demand data from TSOs during this scenario development process. This, combined with top-down methodologies, intends to provide stakeholders with a more detailed view of the sectoral development of gas demand in the storylines.
In terms of gas demand for power generation, in the previous TYNDP edition ENTSO-E TYNDP data had been used to flex thermal generation between coal and gas within a ‘Thermal Gap’ in line with the retained scenarios. Thanks to the new degree of collaboration between the ENTSOs, as well as gas and electricity TSOs, this is now directly linked to the output of the ENTSO-E modelling process.
When it comes to supplies, a variety of supply mixes could be experienced, independently from the scenario storylines. They will depend both on the potential of each supply source and on market rationale favouring a supply source over another one. For the supply potentials referring to extra-EU sources, ENTSOG has no specific expertise and therefore relies on publicly available information, as presented later in this report. Compared to last edition, TYNDP 2018 will see the LNG supply potential treated as a multi-source supply. For each scenario, different supply mixes will be assessed as part of the TYNDP assessment.
In regards to indigenous production, the scenarios distinguish between conventional gas and renewable gases, and also for the later between bio-methane and gas produced from P2G technology. Indeed a specific approach has been developed for the first time on P2G in cooperation with ENTSO-E. Following stakeholder input, the production of biomethane has been improved with an additional methodology applied.
Base case gridThe gas transmission infrastructure across Europe is highly developed and mature. The ENTSOG reference grid is considered the same at the low infrastructure level for the TYNDP 2017 assessment – the existing grid and those projects that have had their final investment decision.
Project Collection for the TYNDP 2018 finished on 28th February and the Project List will be published in May 2018.
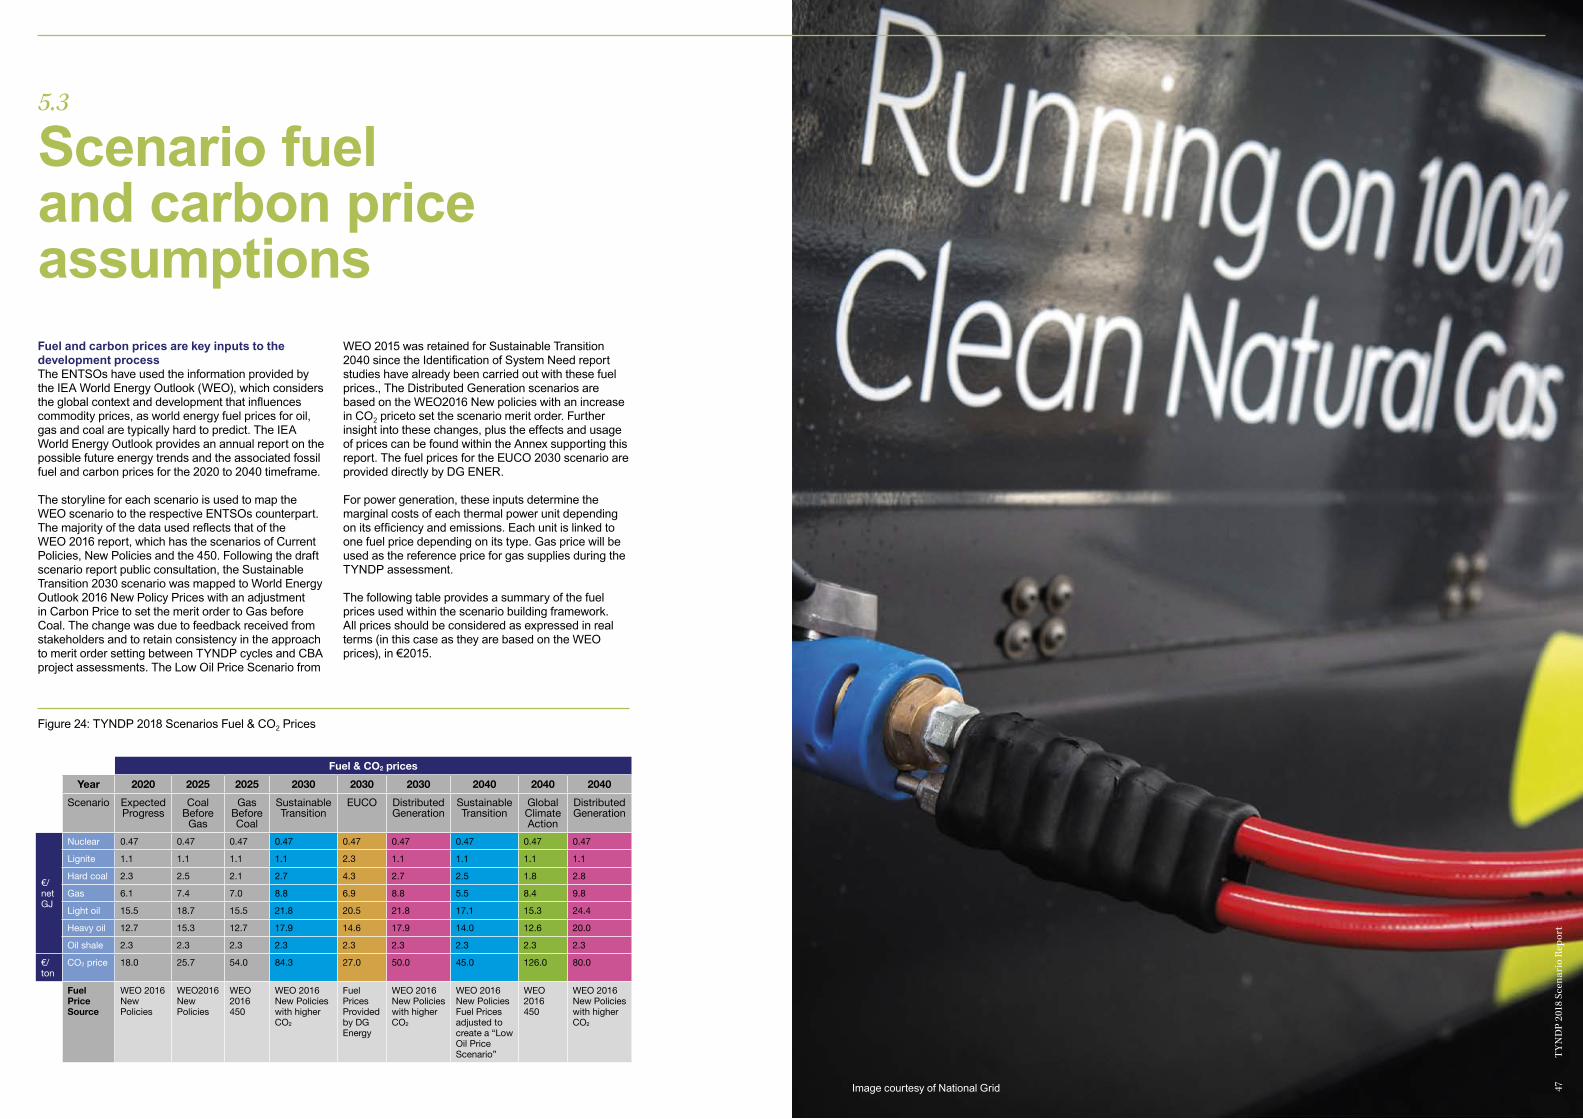
5.3
Scenario fuel and carbon price assumptionsFuel and carbon prices are key inputs to the development processThe ENTSOs have used the information provided by the IEA World Energy Outlook (WEO), which considers the global context and development that influences commodity prices, as world energy fuel prices for oil, gas and coal are typically hard to predict. The IEA World Energy Outlook provides an annual report on the possible future energy trends and the associated fossil fuel and carbon prices for the 2020 to 2040 timeframe.
The storyline for each scenario is used to map the WEO scenario to the respective ENTSOs counterpart. The majority of the data used reflects that of the WEO 2016 report, which has the scenarios of Current Policies, New Policies and the 450. Following the draft scenario report public consultation, the Sustainable Transition 2030 scenario was mapped to World Energy Outlook 2016 New Policy Prices with an adjustment in Carbon Price to set the merit order to Gas before Coal. The change was due to feedback received from stakeholders and to retain consistency in the approach to merit order setting between TYNDP cycles and CBA project assessments. The Low Oil Price Scenario from
WEO 2015 was retained for Sustainable Transition 2040 since the Identification of System Need report studies have already been carried out with these fuel prices., The Distributed Generation scenarios are based on the WEO2016 New policies with an increase in CO2 priceto set the scenario merit order. Further insight into these changes, plus the effects and usage of prices can be found within the Annex supporting this report. The fuel prices for the EUCO 2030 scenario are provided directly by DG ENER.
For power generation, these inputs determine the marginal costs of each thermal power unit depending on its efficiency and emissions. Each unit is linked to one fuel price depending on its type. Gas price will be used as the reference price for gas supplies during the TYNDP assessment.
The following table provides a summary of the fuel prices used within the scenario building framework. All prices should be considered as expressed in real terms (in this case as they are based on the WEO prices), in €2015.
Fuel & CO2 prices
Year 2020 2025 2025 2030 2030 2030 2040 2040 2040
Scenario Expected Progress
Coal Before
Gas
Gas Before Coal
Sustainable Transition
EUCO Distributed Generation
Sustainable Transition
Global Climate Action
Distributed Generation
€/net GJ
Nuclear 0.47 0.47 0.47 0.47 0.47 0.47 0.47 0.47 0.47
Lignite 1.1 1.1 1.1 1.1 2.3 1.1 1.1 1.1 1.1
Hard coal 2.3 2.5 2.1 2.7 4.3 2.7 2.5 1.8 2.8
Gas 6.1 7.4 7.0 8.8 6.9 8.8 5.5 8.4 9.8
Light oil 15.5 18.7 15.5 21.8 20.5 21.8 17.1 15.3 24.4
Heavy oil 12.7 15.3 12.7 17.9 14.6 17.9 14.0 12.6 20.0
Oil shale 2.3 2.3 2.3 2.3 2.3 2.3 2.3 2.3 2.3
€/ton
CO2 price 18.0 25.7 54.0 84.3 27.0 50.0 45.0 126.0 80.0
Fuel Price Source
WEO 2016 New Policies
WEO2016 New Policies
WEO 2016450
WEO 2016New Policies with higher CO2
Fuel Prices Provided by DG Energy
WEO 2016 New Policies with higher CO2
WEO 2016 New Policies Fuel Prices adjusted to create a “Low Oil Price Scenario”
WEO 2016450
WEO 2016 New Policies with higher CO2
Figure 24: TYNDP 2018 Scenarios Fuel & CO2 Prices
47
TY
ND
P 20
18 S
cena
rio
Rep
ort
Image courtesy of National Grid

Section 6
Next steps
16 On the gas side subject to the entry into force of the 2nd CBA Methodology expected summer 2018, the individual project assessments are planned to be performed over the second half of 2018 and to be published as part of the TYNDP final version. 49
T
YN
DP
2018
Sce
nari
o R
epor
t
Both ENTSOs are currently working on the 2nd version of their CBA Methodologies, in view of their entry into force for application to the TYNDPs 2018 assessment phase.
Equally both ENTSOs have now completed the project collection phase, which featured workshops for each sector with project promoters.
Over the coming months, the ENTSOs will pursue their respective TYNDP 2018 development process, in a close timeline:– The electricity and gas draft TYNDPs will be published
in Q3 2018 for public consultation.– Further to receiving the public consultation feedback as well
as ACER opinion, the ENTSOs will publish the final TYNDPs, by end 2018 for electricity and in spring 2019 for gas16.
– Both TYNDPs will support the 4th PCI selection process.

Section 7
Glossary
7.1 GAS DEFINITIONS
7.2 ABBREVIATIONS
7.3 USEFUL INFORMATION
51
TY
ND
P 20
18 S
cena
rio
Rep
ort
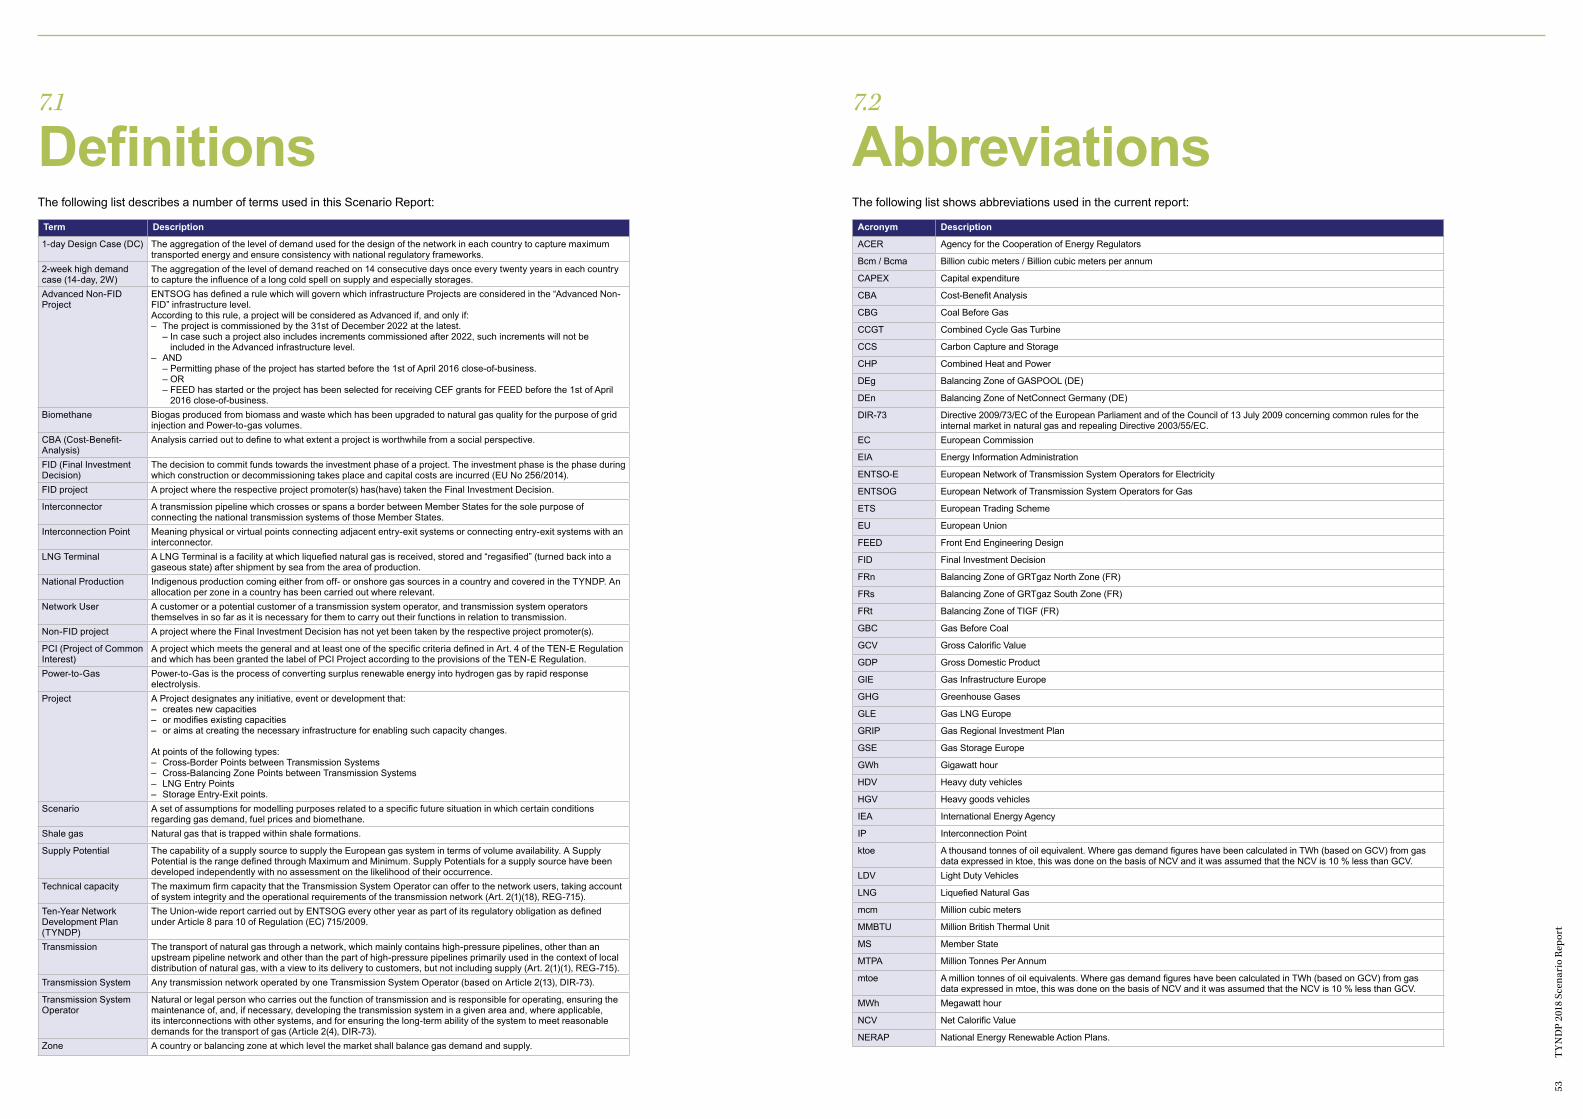
53
TY
ND
P 20
18 S
cena
rio
Rep
ort
7.2
AbbreviationsThe following list describes a number of terms used in this Scenario Report:
Term Description
1-day Design Case (DC) The aggregation of the level of demand used for the design of the network in each country to capture maximum transported energy and ensure consistency with national regulatory frameworks.
2-week high demand case (14-day, 2W)
The aggregation of the level of demand reached on 14 consecutive days once every twenty years in each country to capture the influence of a long cold spell on supply and especially storages.
Advanced Non-FID Project
ENTSOG has defined a rule which will govern which infrastructure Projects are considered in the “Advanced Non-FID” infrastructure level. According to this rule, a project will be considered as Advanced if, and only if: – The project is commissioned by the 31st of December 2022 at the latest. – In case such a project also includes increments commissioned after 2022, such increments will not be
included in the Advanced infrastructure level. – AND – Permitting phase of the project has started before the 1st of April 2016 close-of-business. – OR – FEED has started or the project has been selected for receiving CEF grants for FEED before the 1st of April
2016 close-of-business.Biomethane Biogas produced from biomass and waste which has been upgraded to natural gas quality for the purpose of grid
injection and Power-to-gas volumes.CBA (Cost-Benefit-Analysis)
Analysis carried out to define to what extent a project is worthwhile from a social perspective.
FID (Final Investment Decision)
The decision to commit funds towards the investment phase of a project. The investment phase is the phase during which construction or decommissioning takes place and capital costs are incurred (EU No 256/2014).
FID project A project where the respective project promoter(s) has(have) taken the Final Investment Decision.
Interconnector A transmission pipeline which crosses or spans a border between Member States for the sole purpose of connecting the national transmission systems of those Member States.
Interconnection Point Meaning physical or virtual points connecting adjacent entry-exit systems or connecting entry-exit systems with an interconnector.
LNG Terminal A LNG Terminal is a facility at which liquefied natural gas is received, stored and “regasified” (turned back into a gaseous state) after shipment by sea from the area of production.
National Production Indigenous production coming either from off- or onshore gas sources in a country and covered in the TYNDP. An allocation per zone in a country has been carried out where relevant.
Network User A customer or a potential customer of a transmission system operator, and transmission system operators themselves in so far as it is necessary for them to carry out their functions in relation to transmission.
Non-FID project A project where the Final Investment Decision has not yet been taken by the respective project promoter(s).
PCI (Project of Common Interest)
A project which meets the general and at least one of the specific criteria defined in Art. 4 of the TEN-E Regulation and which has been granted the label of PCI Project according to the provisions of the TEN-E Regulation.
Power-to-Gas Power-to-Gas is the process of converting surplus renewable energy into hydrogen gas by rapid response electrolysis.
Project A Project designates any initiative, event or development that: – creates new capacities – or modifies existing capacities – or aims at creating the necessary infrastructure for enabling such capacity changes.
At points of the following types:– Cross-Border Points between Transmission Systems – Cross-Balancing Zone Points between Transmission Systems – LNG Entry Points – Storage Entry-Exit points.
Scenario A set of assumptions for modelling purposes related to a specific future situation in which certain conditions regarding gas demand, fuel prices and biomethane.
Shale gas Natural gas that is trapped within shale formations.
Supply Potential The capability of a supply source to supply the European gas system in terms of volume availability. A Supply Potential is the range defined through Maximum and Minimum. Supply Potentials for a supply source have been developed independently with no assessment on the likelihood of their occurrence.
Technical capacity The maximum firm capacity that the Transmission System Operator can offer to the network users, taking account of system integrity and the operational requirements of the transmission network (Art. 2(1)(18), REG-715).
Ten-Year Network Development Plan (TYNDP)
The Union-wide report carried out by ENTSOG every other year as part of its regulatory obligation as defined under Article 8 para 10 of Regulation (EC) 715/2009.
Transmission The transport of natural gas through a network, which mainly contains high-pressure pipelines, other than an upstream pipeline network and other than the part of high-pressure pipelines primarily used in the context of local distribution of natural gas, with a view to its delivery to customers, but not including supply (Art. 2(1)(1), REG-715).
Transmission System Any transmission network operated by one Transmission System Operator (based on Article 2(13), DIR-73).
Transmission System Operator
Natural or legal person who carries out the function of transmission and is responsible for operating, ensuring the maintenance of, and, if necessary, developing the transmission system in a given area and, where applicable, its interconnections with other systems, and for ensuring the long-term ability of the system to meet reasonable demands for the transport of gas (Article 2(4), DIR-73).
Zone A country or balancing zone at which level the market shall balance gas demand and supply.
7.1
DefinitionsThe following list shows abbreviations used in the current report:
Acronym Description
ACER Agency for the Cooperation of Energy Regulators
Bcm / Bcma Billion cubic meters / Billion cubic meters per annum
CAPEX Capital expenditure
CBA Cost-Benefit Analysis
CBG Coal Before Gas
CCGT Combined Cycle Gas Turbine
CCS Carbon Capture and Storage
CHP Combined Heat and Power
DEg Balancing Zone of GASPOOL (DE)
DEn Balancing Zone of NetConnect Germany (DE)
DIR-73 Directive 2009/73/EC of the European Parliament and of the Council of 13 July 2009 concerning common rules for the internal market in natural gas and repealing Directive 2003/55/EC.
EC European Commission
EIA Energy Information Administration
ENTSO-E European Network of Transmission System Operators for Electricity
ENTSOG European Network of Transmission System Operators for Gas
ETS European Trading Scheme
EU European Union
FEED Front End Engineering Design
FID Final Investment Decision
FRn Balancing Zone of GRTgaz North Zone (FR)
FRs Balancing Zone of GRTgaz South Zone (FR)
FRt Balancing Zone of TIGF (FR)
GBC Gas Before Coal
GCV Gross Calorific Value
GDP Gross Domestic Product
GIE Gas Infrastructure Europe
GHG Greenhouse Gases
GLE Gas LNG Europe
GRIP Gas Regional Investment Plan
GSE Gas Storage Europe
GWh Gigawatt hour
HDV Heavy duty vehicles
HGV Heavy goods vehicles
IEA International Energy Agency
IP Interconnection Point
ktoe A thousand tonnes of oil equivalent. Where gas demand figures have been calculated in TWh (based on GCV) from gas data expressed in ktoe, this was done on the basis of NCV and it was assumed that the NCV is 10 % less than GCV.
LDV Light Duty Vehicles
LNG Liquefied Natural Gas
mcm Million cubic meters
MMBTU Million British Thermal Unit
MS Member State
MTPA Million Tonnes Per Annum
mtoe A million tonnes of oil equivalents. Where gas demand figures have been calculated in TWh (based on GCV) from gas data expressed in mtoe, this was done on the basis of NCV and it was assumed that the NCV is 10 % less than GCV.
MWh Megawatt hour
NCV Net Calorific Value
NERAP National Energy Renewable Action Plans.
55
TY
ND
P 20
18 S
cena
rio
Rep
ort
7.3
Useful information
For queries about this report please contact the Scenario Building team which coordinated the release of this report:David McGowan – [email protected] Rzepczyk – [email protected] Powell – [email protected] Gudge – [email protected]
For press queries, please contact:Claire Camus – [email protected] Sara Piskor – [email protected]
General queries: [email protected]@entsog.eu
Acronym Description
OPEX Operational expenditure
PCI Project of Common Interest
PRIMES Price Inducted Market Equalibrium System
PV Photo Voltaic
P2G Power-to-Gas
REG-703 GQ
REG-347 Regulation (EU) No 347/2013 of the European Parliament and of the council of 17 April 2013 on guidelines for trans-European energy infrastructure and repealing Decision No 1364/2006/EC and amending Regulations (EC) No 713/2009, (EC) No 714/2009 and (EC) No 715/2009
REG-715 Regulation (EC) No 715/2009 of the European Parliament and of the Council of 13 July 2009 on conditions for access to the natural gas transmission networks.
REG-SoS Regulation (EU) No 994/2010 of the European Parliament and of the Council of 20 October 2010 concerning measures to safeguard security of gas supply and repealing Council Directive 2004/67/EC.
RES Renewable Energy Sources
SoS Security of Supply
TSO Transmission System Operator
TWh Terawatt hour
TYNDP Ten-Year Network Development Plan
UGS Underground Gas Storage (facility)
Abbreviations continued
ENTSOG AISBL Avenue de Cortenbergh 100, 1000 Brussels, Belgium
Tel (+32) 2 894 51 00 Fax (+32) 2 894 51 01
[email protected] www.entsog.eu
BE0822 653 040
ENTSO-E AISBL Avenue de Cortenbergh 100, 1000 Brussels, Belgium
Tel (+32) 2 741 09 50
[email protected] www.entsoe.eu
©ENTSO-E 2018


