Download - Tutorial: VISIO example Stevedoring Industry Business Process Mapping Six Sigma Simplicity

Tutorial:• VISIO example• Stevedoring Industry
Business Process Mapping
Six Sigma Simplicity
2
Safety Contact and Quick Introductions
• Who has a Safety Contact?
Objective
• Learn standard format for Process Mapping• Document core processes• Communicate and share information• Determine what, where, and how
improvement can be made
3

Benefits
• Standardized Maps allow us to:– Understand a process– Simplify a process based on understanding– Implement process re-design to:
• Enhance Safety• Eliminate Waste• Reduce Variation
4

Safety: Standard processes lead to safe behaviors and
hazard free conditions for predictable outcomes
Quality: Standard processes produce predictable results and predictable cycle times
Speed: ‘Synchronized Flow/Production’ requires reliablelead times based on predictable cycle times
Cost Standardized processes are the foundation ofReduction: Process Excellence/Continuous Improvement
Mapping Promotes Processes Standardization
5

6
• Common language to describe organization process groups Category1.0 Develop Vision & Strategy2.0 Develop & Manage Products & Services3.0 Market & Sell Products & Services4.0 Deliver Products & Services (Cargo)5.0 Manage Customer Service6.0 Develop & Manage Human Capital7.0 Manage Information Technology8.0 Manage Financial Resources9.0 Acquire, Construct & Manage Assets10.0 Manage Enterprise Risk, Compliance, Remediation & Resiliency11.0 Manage External Relationships12.0 Develop & Manage Business Capabilities
Standardized Enterprise-wide Categories
Operating Processes
SupportServices
Management
7
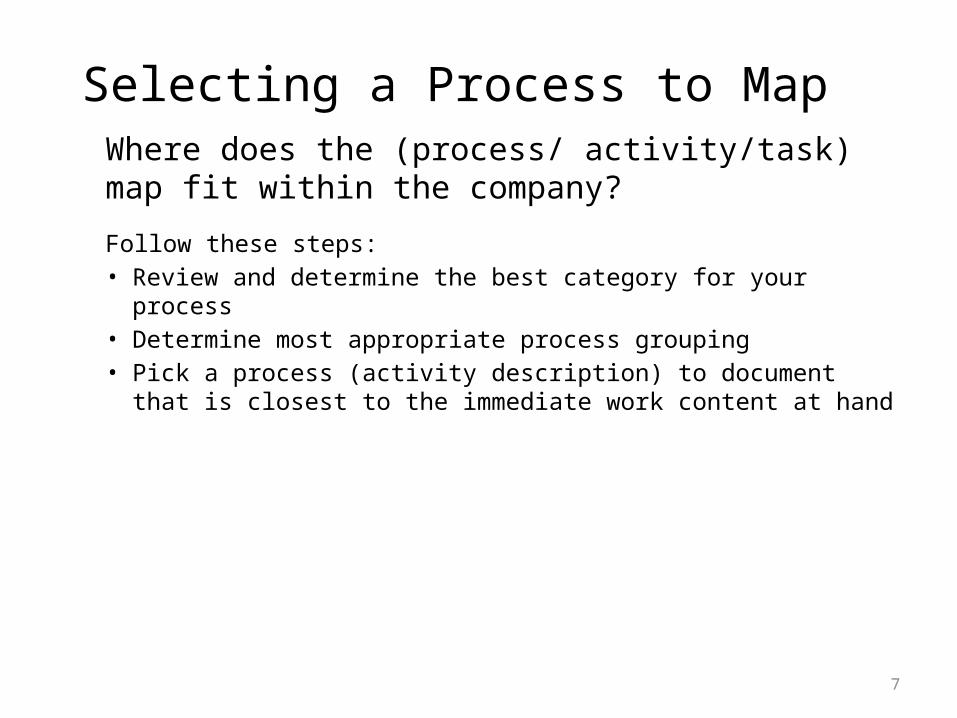
Selecting a Process to MapWhere does the (process/ activity/task) map fit within the company?
Follow these steps:• Review and determine the best category for your process• Determine most appropriate process grouping• Pick a process (activity description) to document that is
closest to the immediate work content at hand

Thoughts on Mapping the Process
• A process is a number of steps completed in order to achieve an objective
• Observe and map the actual process– Talk to the people involved & get the facts– Reality is invariably different from perception; few
processes work the way we think they do• Process map what is, not what you would like
the process to be

Defining a Process
• A Process:– has start and stop points– is an interrelated activities that convert inputs into
results (outputs)– consumes resources– requires standards for repeatable performance
9

Creating a Map
• Define specific tasks that will be required to reach desired output
• Determine inputs and outputs of each step• Using standard process symbols, determine sequence
of the steps• Identify people, function, or roles for each step• Map points along primary process where decisions are
made• Recognize one or more alternate paths and merge
paths back after decision10

11
Common Mapping Symbols• Start & Stop: Shows start or end of process
• Line with Arrow: Denotes direction of flow
• Activity: Shows tasks or activities performed
• Decision: Shows a decision point
• Connector: Process continued on same page (designated with a letter or number)
Start
ProcessStep
?

12
Common Mapping Symbols continued
• Off page Connector: Links to another page
• Predefined Process: Completed elsewhere
• Document: Step deals with a document
• Database: Data storage location
• Call-out: Add additional information
Hyperlink

13
Reviewing Process Mapping Grammar• Verb: action taken• Subject: person, thing
that performs action • Object: thing (or person)
that receives the action
Start Decision ?Flow Line
ProcessStep
ProcessStep Stop
lifts, locks, moves
crane driver, gear man, superintendent
container, stow plan, twist lock

Benefits of the Swim Lane Format
• Helps visualize operation sequence and flow of information• Maps the actions required to complete the task• Identifies hand-offs between functions• Assists in making work visible by highlighting:
• Decisions• Event sequences• Wait times or delays
14

15
Map (Swim Lane Example)
• The value of the Swim Lane technique is that is shows you who or which department is responsible for the steps in a process
Calls for Order
Customer Hungry
Take Order
Make Pizza
Cook Pizza
Box Pizza
Deliver Pizza
Customer Eats
Customer
Cashier
Cook
Deliverer
Pizza Correct
Calls for Order
Customer Hungry
Take Order
Make Pizza
Cook Pizza
Box Pizza
Deliver Pizza
Customer Eats
Customer
Cashier
Cook
Deliverer
Customer
Cashier
Cook
Deliverer
Pizza Correct

Creating a Map
• Assemble those familiar with the process.• Have one individual question and challenge the
group to think through the rationale to document the way things are (current state).
• Identify someone who is neutral to the process and will facilitate discussion (as opposed to participating in the discussion).
• Get agreement that the process map is correct from people working the process. (Functions, Sequencing, Decision points, etc)
16

Creating a Map
• Think about the five to six high-level steps that occur within each individual's process 80 percent of the time or more.
• Each member focuses on his or her own work process and swim lane.
• Use basic flow charting symbols to outline the process steps. Beginning and end steps are ovals, process steps are written inside squares, and decisions are written inside the diamond shape.
17

Creating a Map
• Connect each activity with an arrow, even if they cross swim lanes.
• Ask each person to discuss the sub-processes that occur in each step.
• Analyze the Swim Lane Diagram once it is completed to assure that the process steps are connected and flow from start to end.
18

Map (Stevedoring Example)
19

Mapping Tips
• Use group interview method and a facilitator whenever possible
• Select a few key people to help create the map– Knowledgeable of the process– Interested in improving the process– Available for the duration of the documentation effort
• Establish ground rules at the start and post them• Use room large enough for people to move around• Have paper and post-it notes to write on• Ask each person for their input into the process
20

Mapping Tips
• Re-sequence steps until group is satisfied that the process is adequately mapped
• Keep energy flowing• Facilitator should act as a catalyst to jump start
the group and help keep the group on track• Respect everyone’s contribution• Display map or route a copy around so
everyone can review it for correctness
21

Create Maps Using Visio Software
• A common (universal) package which features:– quicker access to other MS products/ tools – updated shapes and stencils – improved and expanded themes and effects make
it easier to create professional diagrams• Electronic Maps can be stored and accessed in
common shared location.
22

23
Visio Tutorial – Creating this Map Step-by-Step

• From the File menu, click on New > Cross-Functional Flowchart.
A Visio Tutorial…
24

A Visio Tutorial…
25
• Highlight US Units (click radio button). • Double click on “Create” icon.• Visio will automatically create a drawing window (blank).

A Visio Tutorial…
26
• Key Terms Ribbon
Drawing Window
Shapes Pane

A Visio Tutorial…
27
Determine “Title” (Name of the process to be documented)
• Drawing window is now ready to populate and label
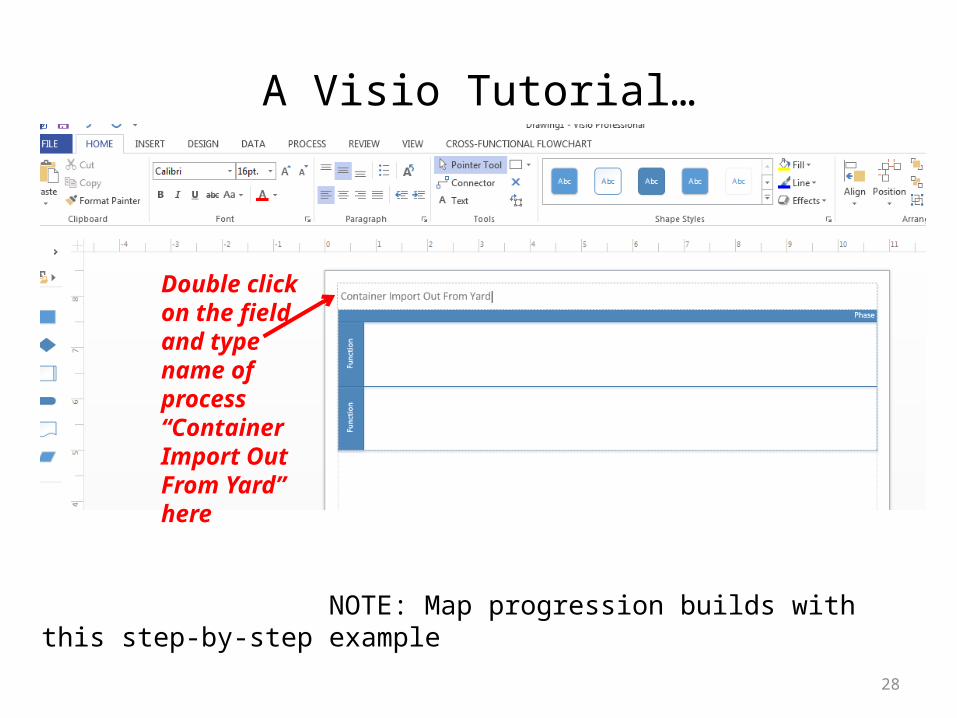
A Visio Tutorial…
28
Double click on the field and type name of process“Container Import Out From Yard”here
NOTE: Map progression builds with this step-by-step example

A Visio Tutorial…
29
Determine “Phase”
• Continue to label Map

A Visio Tutorial…
30
Double click on the field and type “Phase 1 Overview” here

A Visio Tutorial…
31
Determine “Functions”(Title each swim lane. They may or may not be the same as the subject.)
• Continue to label Map

A Visio Tutorial…
32
Double click and label each swim lane “Vessel”, “Trucking Co.”here

A Visio Tutorial…• Insert additional swim lanes by drop and dragging swim lane icon from the Shapes
Pane to the Drawing Window.
33
(Previous Sample Map)
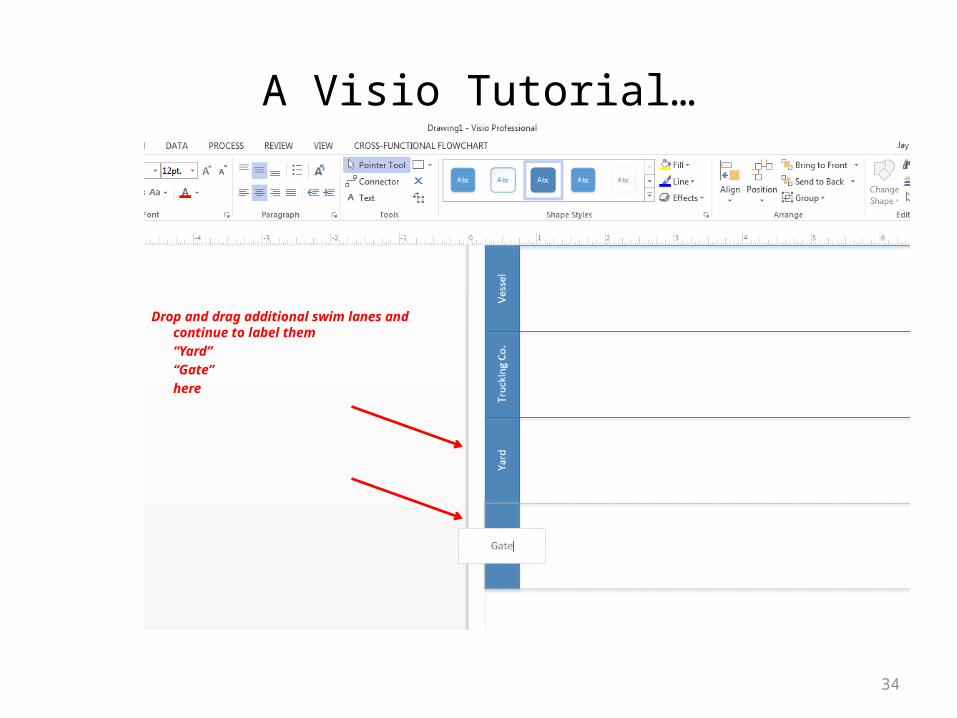
A Visio Tutorial…
Drop and drag additional swim lanes and continue to label them “Yard”“Gate”here
34

A Visio Tutorial…
35
Identify “Start”(Oval shape)
• Pre-determine the start and end points with team in prior meeting

A Visio Tutorial…
36
Drop and drag oval shape here
Click here on ribbon to lighten background

A Visio Tutorial…• Add text to shapes and connectors by selecting it and then typing. Once
you’re finished adding text, simply click on a blank area of the page to go back to editing.
37
With lighten background, double click icon to begin typing.
(Previous Sample Map)
Start

A Visio Tutorial…
38
Double click and type “Start” here

A Visio Tutorial…
39
When complete, click on blank area(oval icon re-appears)
Determine next step, drop and drag another icon over … (i.e. - Rectangle)
Double click on rectangle icon and type “Vessel discharges container ” here
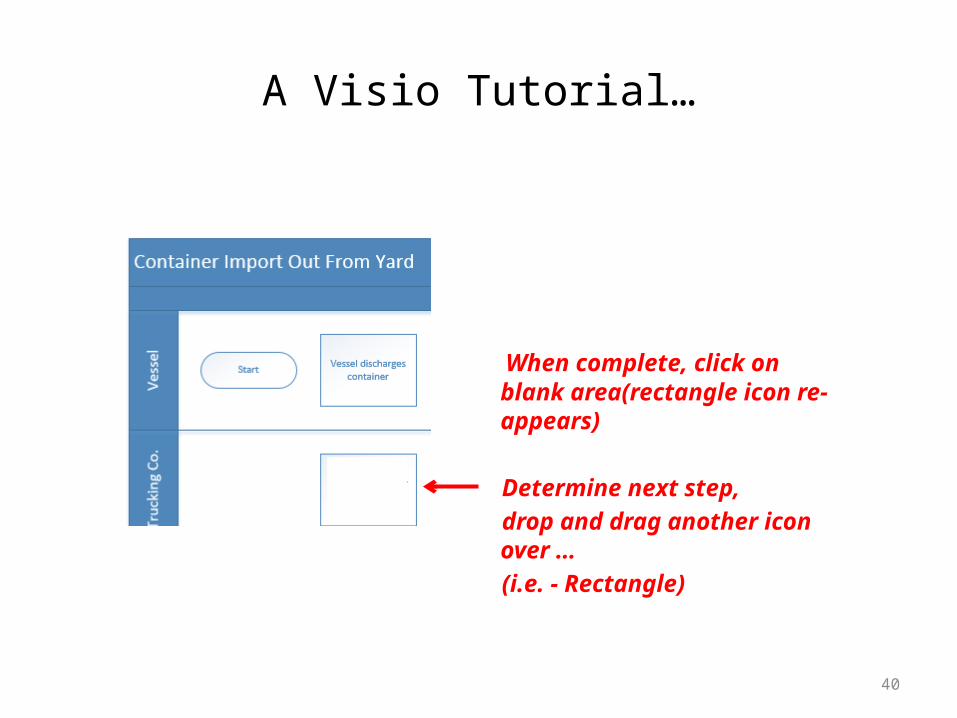
A Visio Tutorial…
40
When complete, click on blank area(rectangle icon re-appears)
Determine next step, drop and drag another icon over … (i.e. - Rectangle)
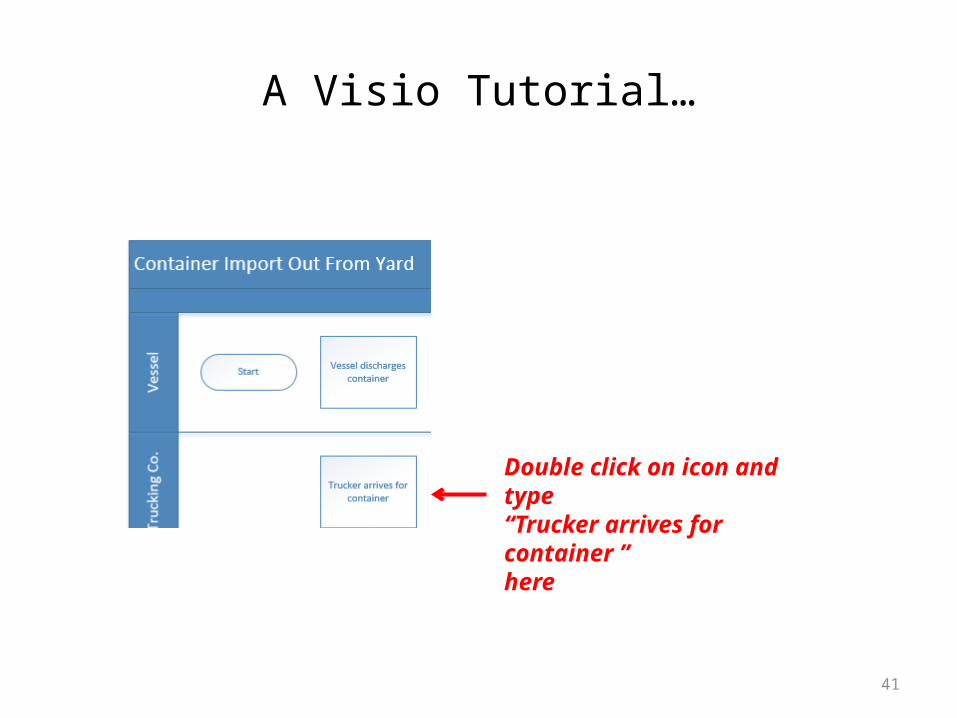
A Visio Tutorial…
41
Double click on icon and type“Trucker arrives for container ” here
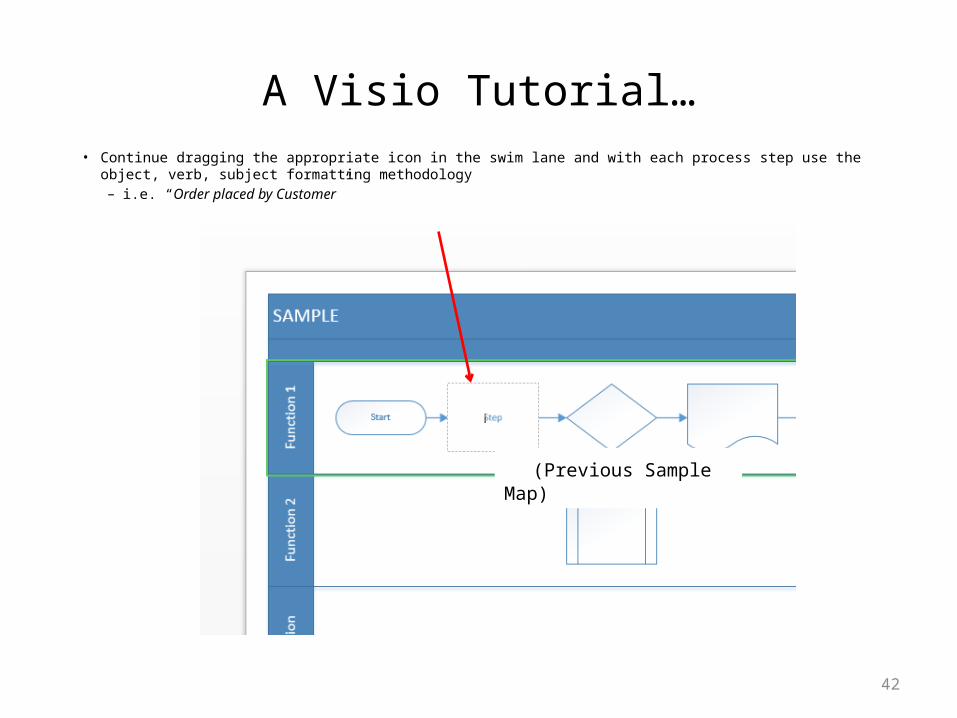
A Visio Tutorial…• Continue dragging the appropriate icon in the swim lane and with each process step use the object, verb, subject formatting
methodology– i.e. “Order placed by Customer”
42
(Previous Sample Map)

A Visio Tutorial…
43
Continue to drop and drag icons in the swim lanes and type text within each icon…
Diamond shapes represent a decision and are worded in question format…
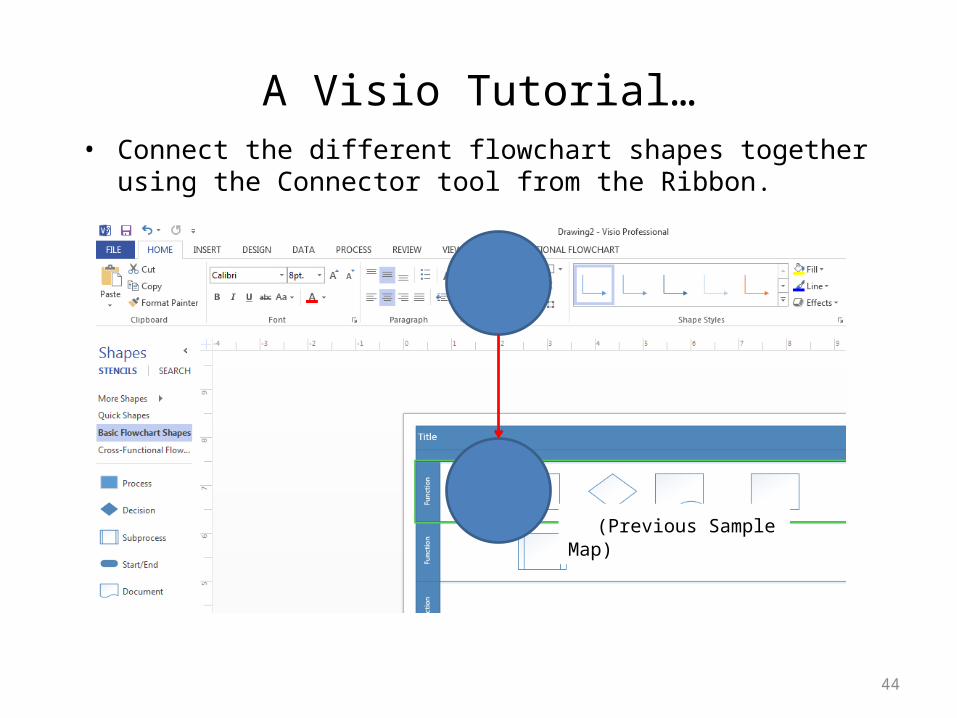
A Visio Tutorial…• Connect the different flowchart shapes together using the Connector
tool from the Ribbon.
44
(Previous Sample Map)

A Visio Tutorial…
45
Drop and drag connecter linkage from one icon to anotherhere
Click on Connectorin ribbonto activate

A Visio Tutorial…
46
Continue to connect (link) each of the remaining icons

A Visio Tutorial…• Additional information can be added to the map by utilizing a ‘callout’
icon from the Shapes pane and typing the text or clicking on a connector line and inserting the ‘text’ there
47
“call out”
“text”
(Previous Sample Map)

A Visio Tutorial…
48
Type text “Wheeled”Here
Click on line to activate text boxHere

A Visio Tutorial…
49
Click on line to activate text boxHere
Type text “Decked”Here

A Visio Tutorial…
50
• Completed Map

A Visio Tutorial…• Save file in appropriate location. (“Save as” …)
51

Visio Exercise
• In pairs, create a Process Map using Visio Scenario: Customer starts out by deciding on a product and placing an order.
This initiates the pick sheet being printed out at the warehouse and a check of “stock status”.
If the stock is unavailable, system automatically generates an ‘out of stock’ notice and new available delivery date to the Customer.
If product is available, the Customer’s Credit Card is charged by Accounting and simultaneously Oracle (system) updates the Inventory at which time the order is e-mailed to the warehouse to pick (Fulfillment department).
52

Visio Exercise
Map should include:• Name of Process• Start and Stop points• Subjects• Lanes• Steps (System and Process)• Text (Call-outs/Notations)
53

Visio Exercise – Completed Map (Sample)
54
Map Hierarchy Review
• Review and determine the best category for your process• Determine most appropriate process grouping• Pick a process (activity description) to document that is
closest to the immediate work content at hand
55
Follow these Steps:
Let’s walk through an example … (H.R. process – “testing candidates”)
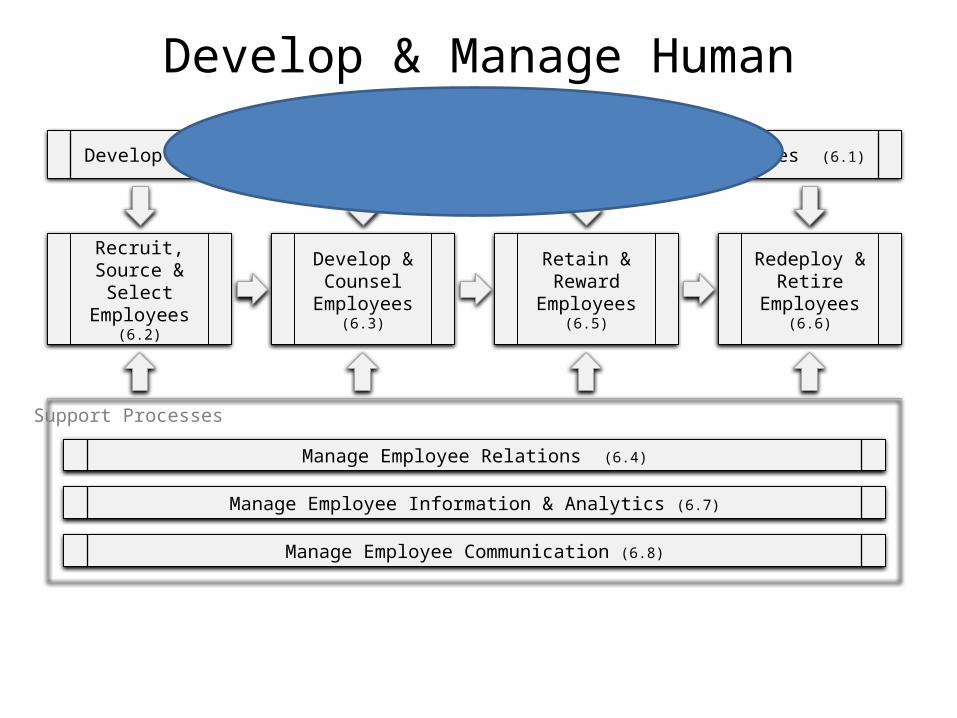
Develop & Manage Human Capital (6.0)
Recruit, Source & Select
Employees(6.2)
Develop & Counsel
Employees(6.3)
Retain & Reward
Employees(6.5)
Redeploy & Retire
Employees(6.6)
Develop & Manage Human Resources Planning, Policies & Strategies (6.1)
Support Processes
Manage Employee Relations (6.4)
Manage Employee Information & Analytics (6.7)
Manage Employee Communication (6.8)

Recruit, Source & Select Employees (6.2)
Manage Employee
Requisitions(6.2.1)
Recruit / Source
Candidates(6.2.2)
Screen & Select Candidates
(6.2.3)
Manage New Hire / Re-Hire
(6.2.4)
Support Processes
Manage Applicant Information (6.2.5)

Screen & Select Candidates (6.2.3)
Identify & Deploy
Candidate Selection Tools
(6.2.3.1)
Test Candidates(6.2.3.3)
Interview Candidates
(6.2.3.2)
Select & Reject Candidates
(6.2.3.4)
Obtain Candidate
Background Information
(6.2.3.5)
Recruit / Source
Candidates(6.2.2)
Manage New Hire /
Re-Hire(6.2.4)

Test Candidates (6.2.3.3)Test Candidates (6.2.3.3)
Agen
cyRe
crui
ter
Hiri
ng M
anag
erCa
ndid
ate
Hiring Mgr wants to do a phone
screen?
Schedule 30 min phone interview on
Hiring Manger’s calendar
Complete phone interview
Y
Email PI/PLI to Hiring Manager File PI/PLI results
Qualified? Request interview from Recruiter
N
Y
Get availability from agency
NInterview
candidates(6.2.3.2)
Email PI/PLI to qualified candidate
Candidate completes PI/PLI
Identify & Deploy
Candidate Selection Tools
(6.2.3.1)
Test results automatically
emailed to Recruiter
Select and reject
candidates(6.2.3.4)
Benefits
• A visual tool and a common language across the enterprise
• Greater understanding of processes and procedures
• Ease of new employee orientation• Opportunities for improvement are highlighted• Simplified processes lead to operating
efficiencies

Process Maps
• Any questions?
62
![Stevedoring Industry Award [MA000053] Pay Guide](https://cdn.vdocuments.us/doc/165x107/61570271a097e25c76500bac/stevedoring-industry-award-ma000053-pay-guide.jpg)


