
Tutorial for running COMSOL files from COMSOL website
Step 1: Open your browser (Chrome/explorer etc.) and enter the below link
https://www.comsol.com/books/elements-of-chemical-reaction-engineering-5th/models
You will see that following page opens
Step 2: You will find that there are many COMSOL exercises available to download. Scroll down the page
and find “Tubular Reactor Exercise Downloads”. Click on “Tubular Reactor with Nonisothermal cooling
Jacket” under this section

Step 3: You will see that the following page opens. Click on Download the application files. Currently you
can’t download any COMSOL file (.mph file). To access any COMSOL files, you need to have a COMSOL
account which can be created for FREE. Click on “COMSOL Access” present at the bottom of the page

Step 4: The following page will appear. If you already have a COMSOL account then move to Step 6. If
you don’t have an account, then click on “Create an Access Account” to create one

Step 5: The following page will appear where you need to provide few details and create a password. Fill
in the details and submit. You will receive an email from COMSOL with an activation link. Click on the
link to activate your COMSOL account

Step 6: After you have created your account, Log In with your registered Email Id and password.
Step 7: This will again open up the same page as was obtained in Step 3. However, now you can download
any COMSOL file. Click on “tubular_reactor.mph-3.68 MB” to download the file. The file will get
downloaded at the bottom of the browser

Step 8: Click on the downloaded file. You will see that your model opens up in COMSOL. Click on the
various buttons present under Model Builder to view 1D, 2D or 3D profiles for Temperature, Concentration
and Conversion.

Step 9. Click on Temperature, 1D under Model Builder to view Temperature 1D Plot
Step 10. Click on Conversion, 1D under Model Builder to view Conversion 1D Plot

Step 11: Click on Parameters under “Model Builder” to view and change any parameter values
Step 12: Let’s change a parameter and see the effect on the profile. Change the Diff value to 1e-6 from
1e-9. After you are done, Click on Compute present under Home toolbar or Study toolbar

Step 13: Click on Temperature,1 D to view Temperature profile when diffusivity is decreased. The
following graph will be obtained
Now click on Conversion, 1D to view Conversion profile
Step 14: Similarly, change other parameters and analyze the change in Temperature and Conversion
profiles

Step 15: To view the axial profiles, click on cut Line 2D 1 present under Data sets
Change point 1 and 2 as shown below. Vary z from 0 to L keeping r fixed at 0

Step 16: Click on Temperature,1D to obtain axial temperature profile. Change the graph and axis titles as
shown below
Click on Conversion,1D to obtain axial conversion profile. Change the graph and axis titles

Step 17: To change the flow conditions from laminar flow to plug flow, expand Definitions and click on
Variables 1. You will see a list of defined variables. We want to change the expression for velocity (uz)
Change the expression of uz by entering “u0” in the text field. Click on Compute Button

Step 18: Now, again click on Temperature,1 D graph to obtain temperature profile for plug flow
Click on Conversion,1 D graph to obtain conversion profile for plug flow
Step 19: Now obtain axial profile for plug flow reactor in a similar way as was done for laminar flow
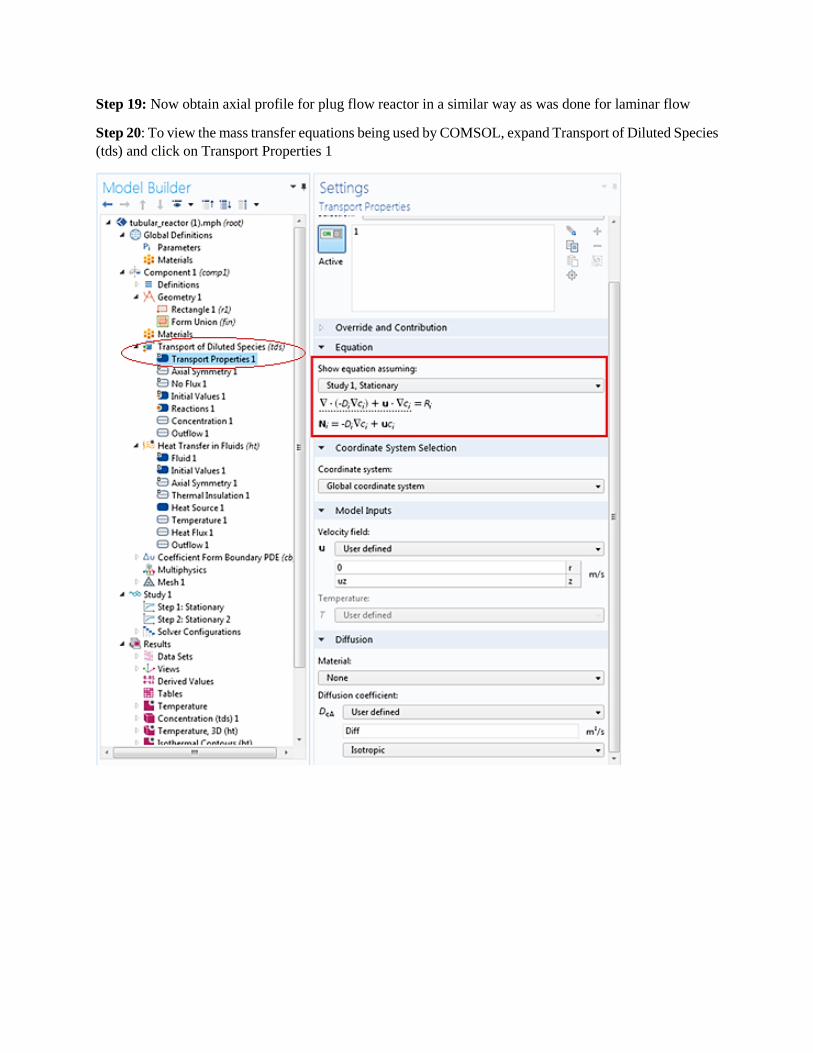
Step 20: To view the mass transfer equations being used by COMSOL, expand Transport of Diluted Species
(tds) and click on Transport Properties 1

Step 21: To view the heat transfer equations being used by COMSOL, expand Heat Transfer in Fluids (ht)
and click on Fluid 1

Step 22: To view the equations for Coolant flow being used by COMSOL, expand Coefficient Form
Boundary PDE (cb) and click on Coefficient Form PDE1

Step 23: To view the mass transfer boundary conditions, expand the “Transport of Diluted species” and
view the various tabs which include boundary conditions and initial values. If you click on “No Flux 1”
you can find the equation that is applied (under equation) and the boundary on which this equation is applied
(dark blue color on the geometry)
Step 24: Similarly, you can check the boundary conditions for heat transfer and coolant flow


