Trends in Wastewater Disinfection Peracetic Acid (PAA)
County Sanitary Engineers Association of Ohio2016 Summer Conference
Lewis Center, OHEd Pelton – Pelton Environmental
Table of Contents
PART 1 – Peracetic Acid
PART 2 – Wastewater Disinfection
PART 3 – Case Studies
PART 4 – Conversion Pathway
PART 5 – Equipment and Implementation
PART 6 – Experience
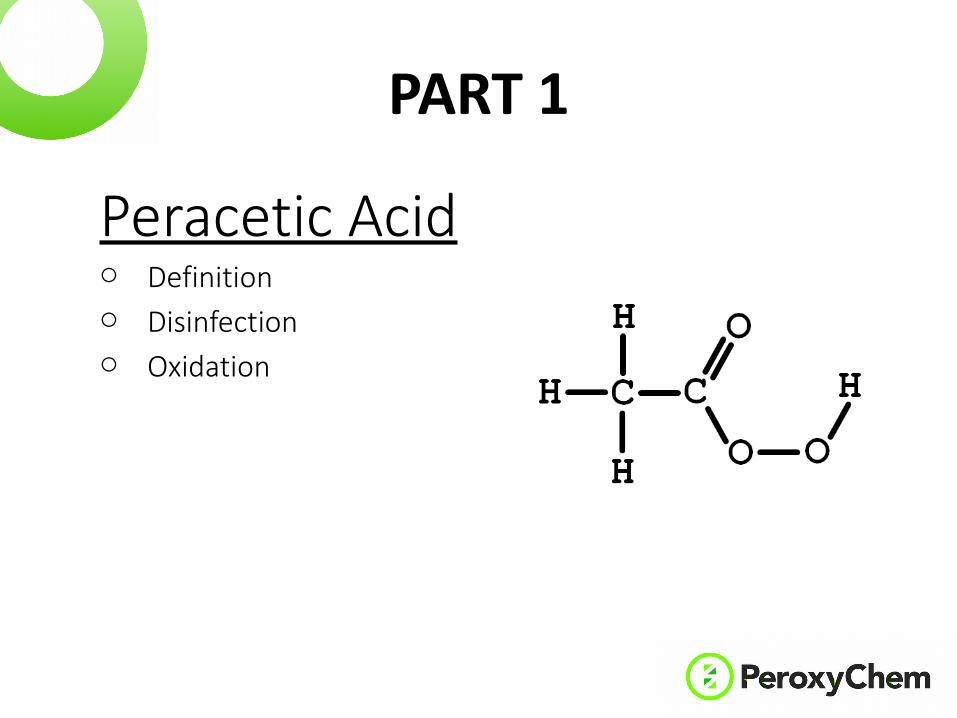
Peracetic Acido Definition o Disinfectiono Oxidation
PART 1
Definition
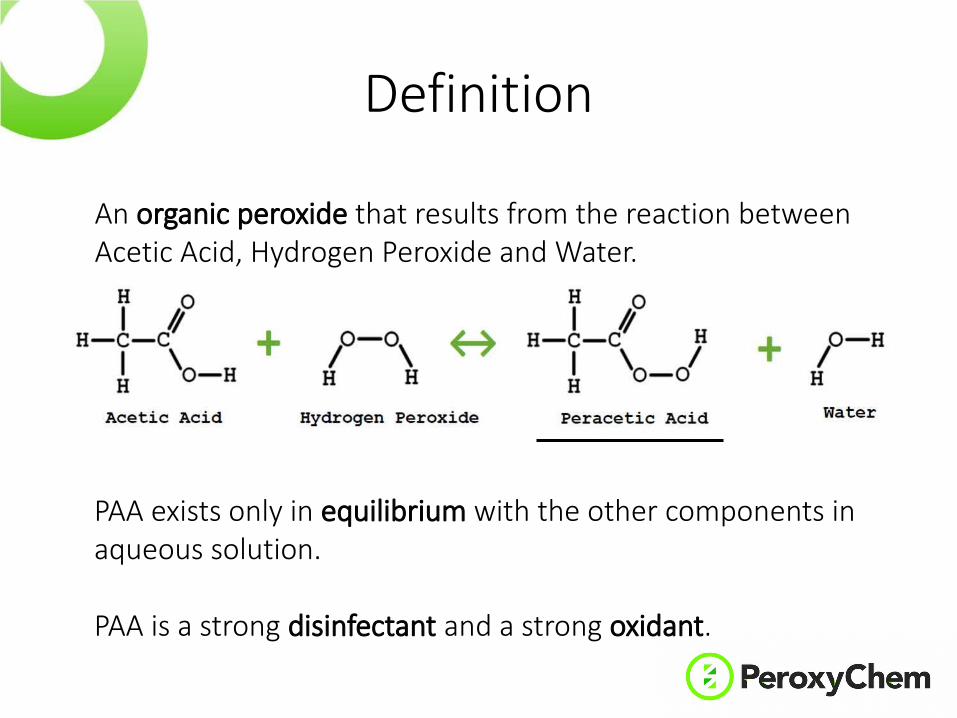
An organic peroxide that results from the reaction between Acetic Acid, Hydrogen Peroxide and Water.
PAA exists only in equilibrium with the other components in aqueous solution.
PAA is a strong disinfectant and a strong oxidant.
Strong Disinfectant
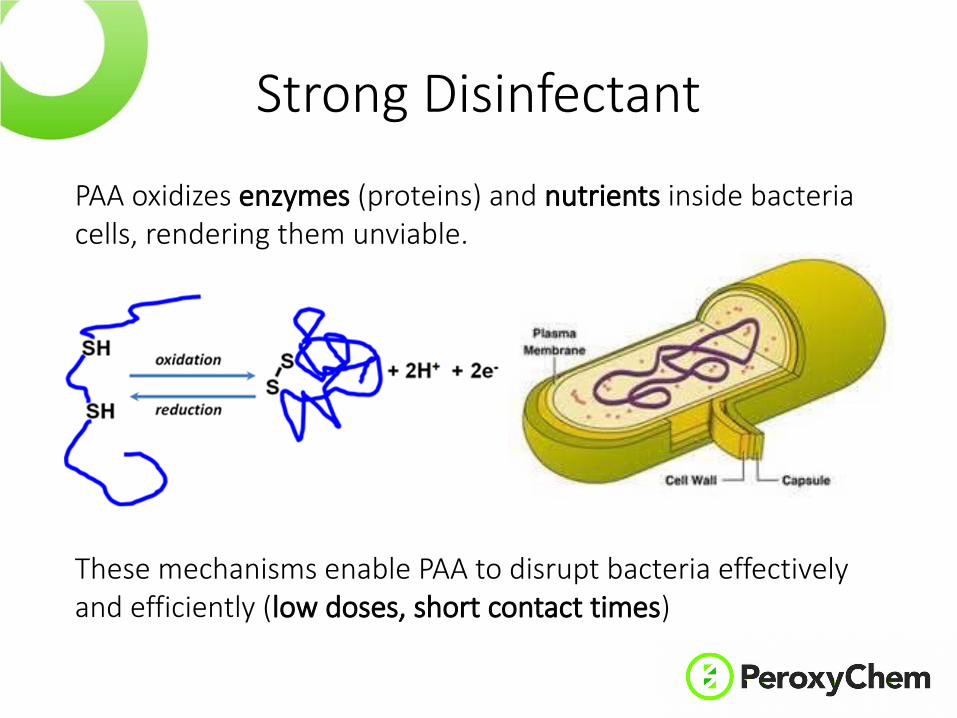
PAA oxidizes enzymes (proteins) and nutrients inside bacteria cells, rendering them unviable.
These mechanisms enable PAA to disrupt bacteria effectively and efficiently (low doses, short contact times)
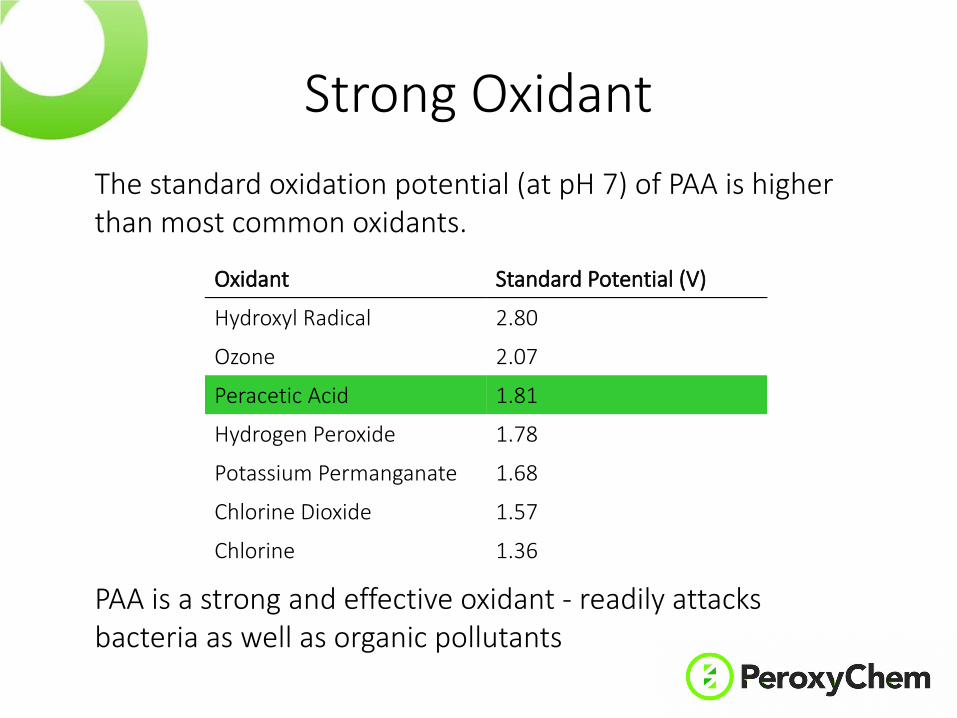
Strong OxidantThe standard oxidation potential (at pH 7) of PAA is higher than most common oxidants.
Oxidant Standard Potential (V)
Hydroxyl Radical 2.80
Ozone 2.07
Peracetic Acid 1.81
Hydrogen Peroxide 1.78
Potassium Permanganate 1.68
Chlorine Dioxide 1.57
Chlorine 1.36
PAA is a strong and effective oxidant - readily attacks bacteria as well as organic pollutants

Uses in Microbial Control
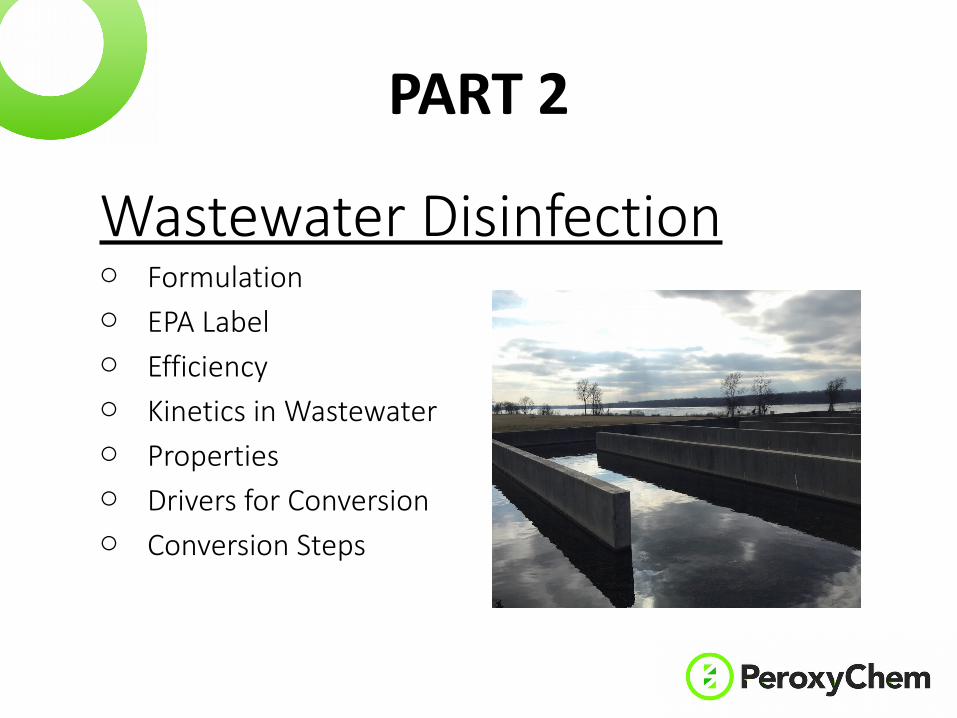
Wastewater Disinfectiono Formulationo EPA Labelo Efficiencyo Kinetics in Wastewatero Propertieso Drivers for Conversiono Conversion Steps
PART 2

FormulationManufacturers are developing peracetic acid solutions that are specifically formulated for wastewater disinfection. POTW’s should opt for these blends to reduce dosage requirements and operating costs. PeroxyChem’s peracetic acid formulation for wastewater disinfection is registered and labeled as VigorOx® WWT II
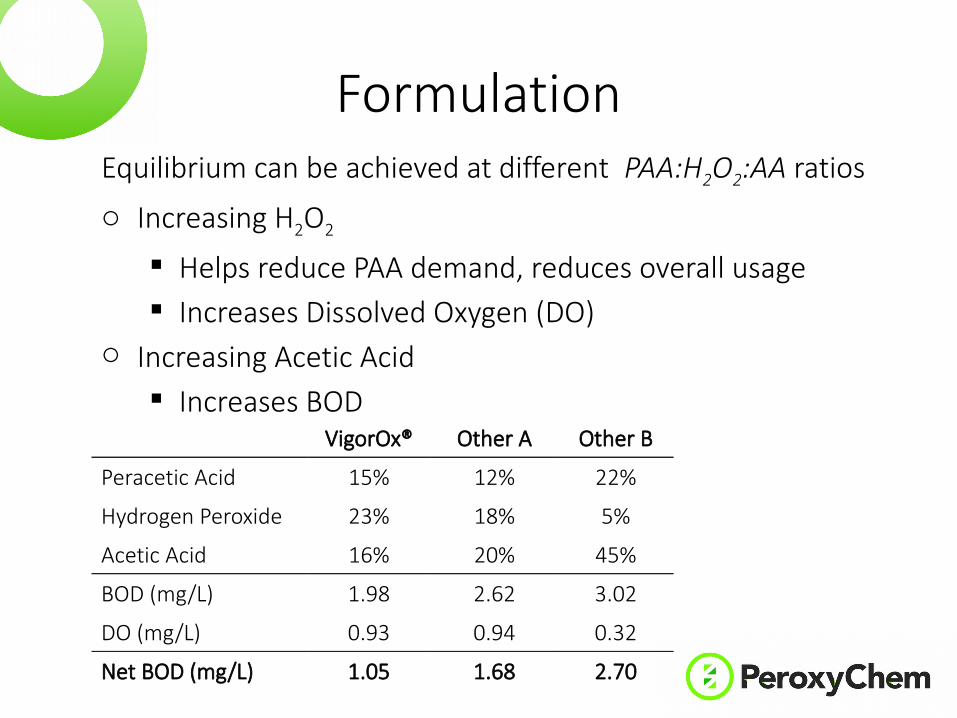
FormulationEquilibrium can be achieved at different PAA:H2O2:AA ratioso Increasing H2O2
Helps reduce PAA demand, reduces overall usage Increases Dissolved Oxygen (DO)
o Increasing Acetic Acid Increases BOD
VigorOx® Other A Other B
Peracetic Acid 15% 12% 22%
Hydrogen Peroxide 23% 18% 5%
Acetic Acid 16% 20% 45%
BOD (mg/L) 1.98 2.62 3.02
DO (mg/L) 0.93 0.94 0.32
Net BOD (mg/L) 1.05 1.68 2.70
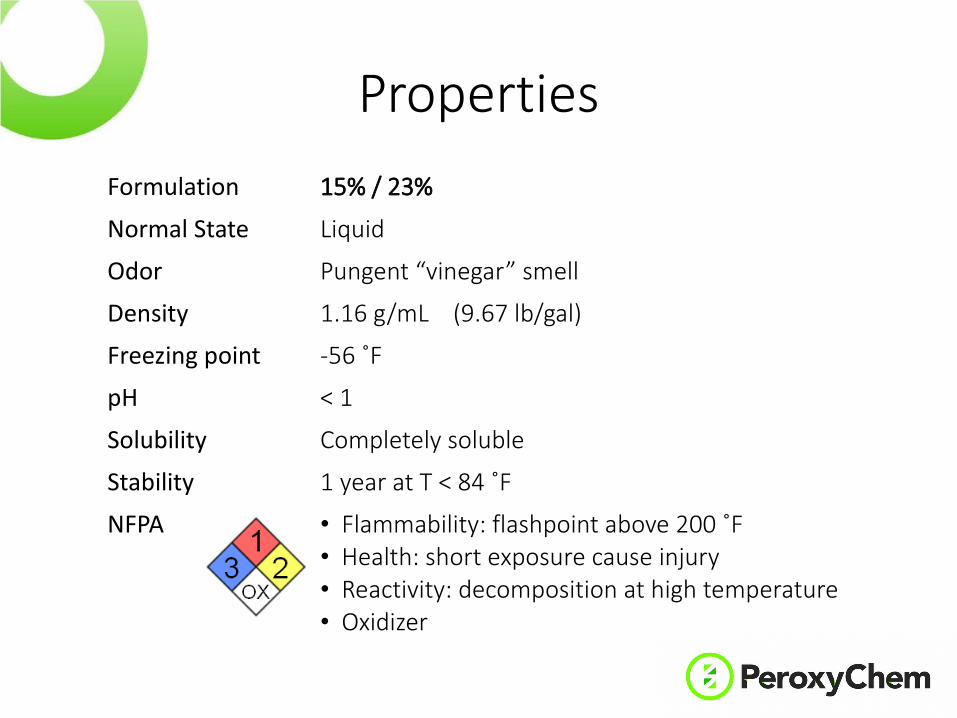
PropertiesFormulation 15% / 23%
Normal State Liquid
Odor Pungent “vinegar” smell
Density 1.16 g/mL (9.67 lb/gal)
Freezing point -56 ˚F
pH < 1
Solubility Completely soluble
Stability 1 year at T < 84 ˚F
NFPA • Flammability: flashpoint above 200 ˚F• Health: short exposure cause injury• Reactivity: decomposition at high temperature• Oxidizer
Reactions in Wastewater
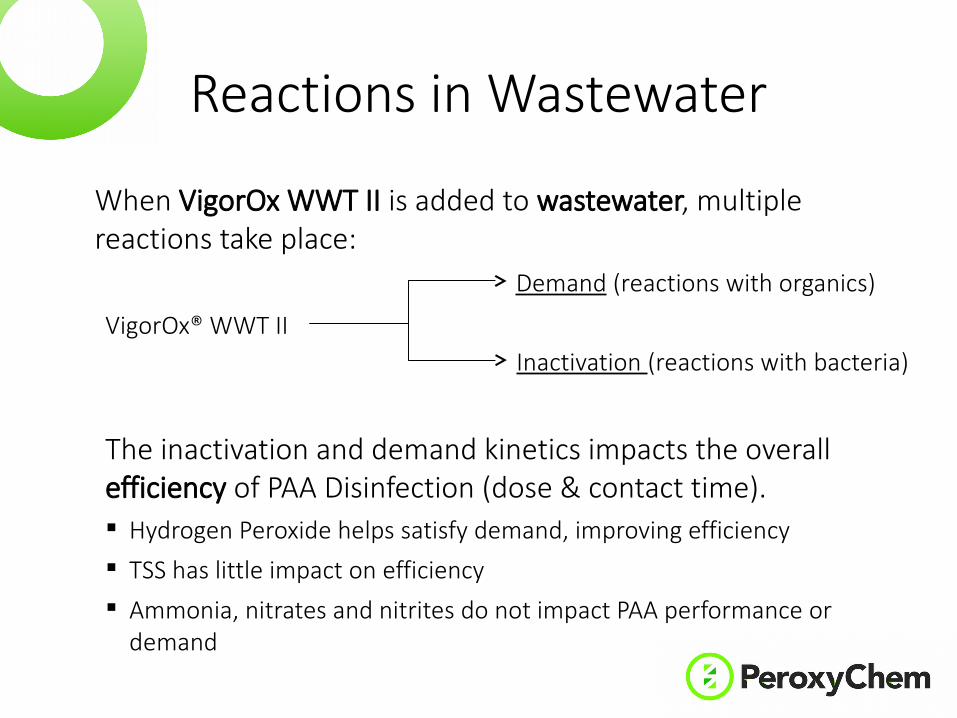
When VigorOx WWT II is added to wastewater, multiple reactions take place:
VigorOx® WWT II
Demand (reactions with organics)
Inactivation (reactions with bacteria)
The inactivation and demand kinetics impacts the overall efficiency of PAA Disinfection (dose & contact time). Hydrogen Peroxide helps satisfy demand, improving efficiency TSS has little impact on efficiency Ammonia, nitrates and nitrites do not impact PAA performance or
demand
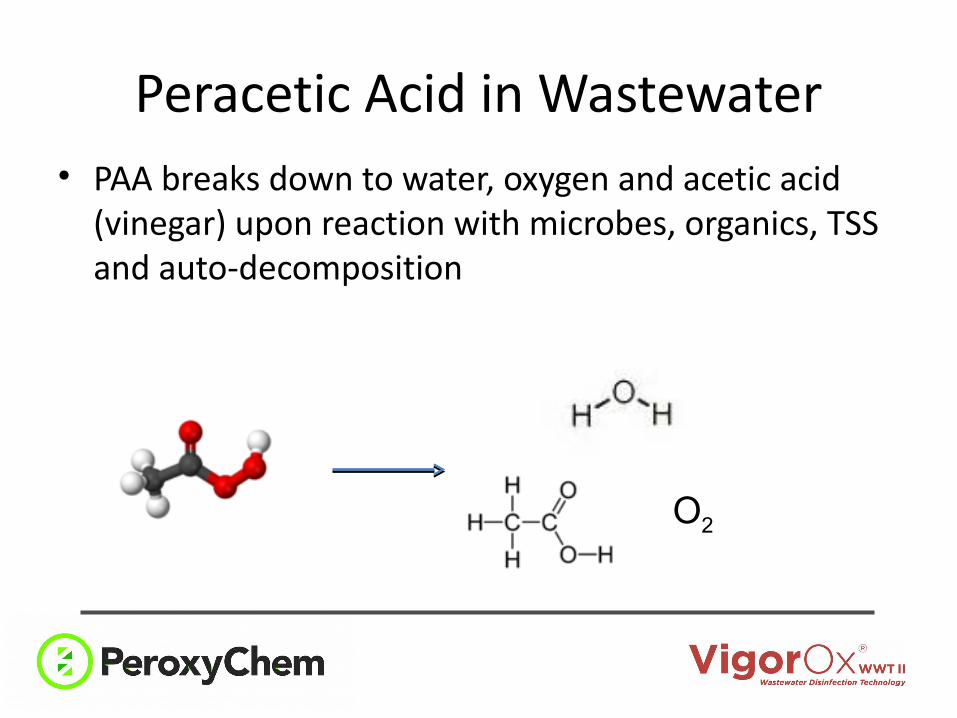
Peracetic Acid in Wastewater• PAA breaks down to water, oxygen and acetic acid
(vinegar) upon reaction with microbes, organics, TSS and auto-decomposition
O2

Efficacy – Demand
1.75 2 2.5 6 8 100.00
0.50
1.00
1.50
2.00
2.50
3.00
3.50
4.00
4.50
10 min.15 min.30 min.Control
Increasing PAA concentration (ppm)
Log1
0 CF
U/1
00 m
L re
mai
ning
Initial Demand Disinfection
Significant disinfection is not observed until demand is satisfied
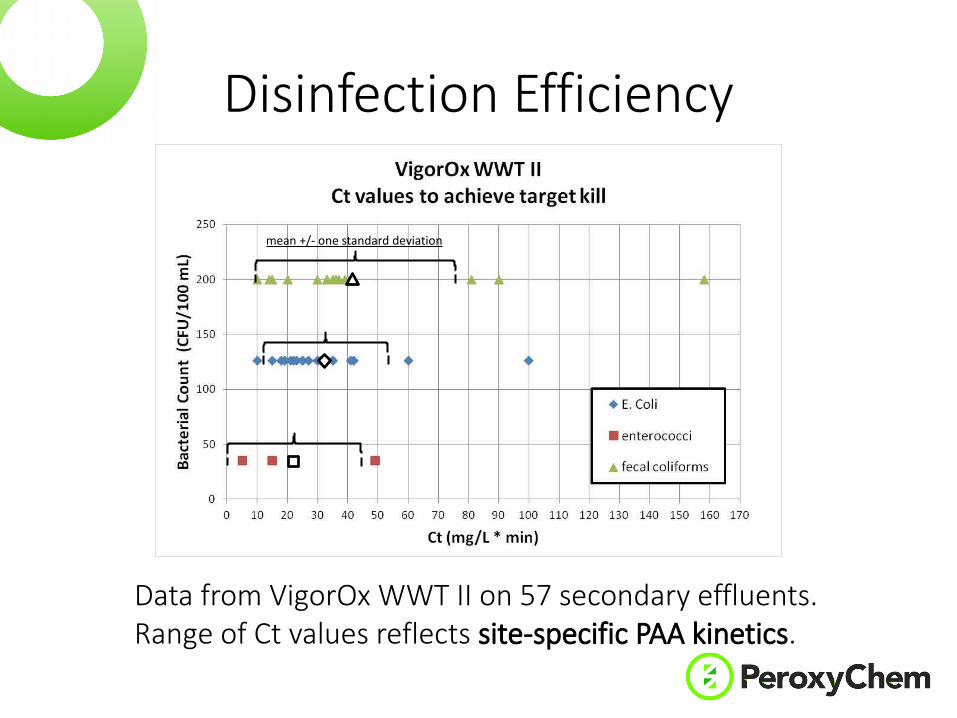
Disinfection Efficiency
Data from VigorOx WWT II on 57 secondary effluents.Range of Ct values reflects site-specific PAA kinetics.
mean +/- one standard deviation
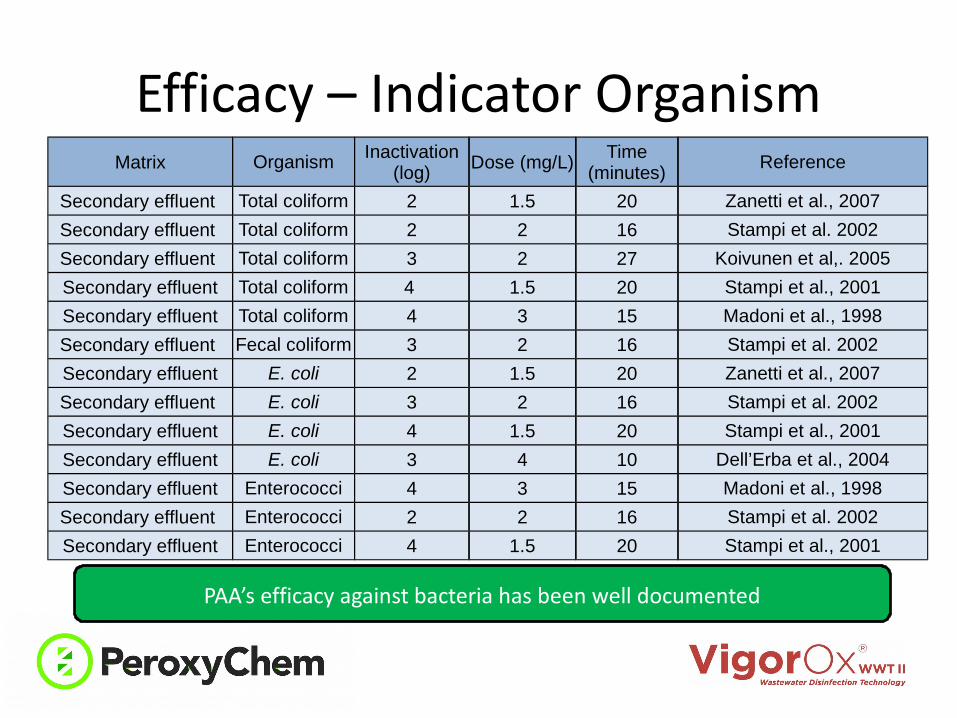
Efficacy – Indicator OrganismMatrix Organism Inactivation
(log)Dose (mg/L)
Time (minutes)
Reference
Secondary effluent Total coliform 2 1.5 20 Zanetti et al., 2007
Secondary effluent Total coliform 2 2 16 Stampi et al. 2002
Secondary effluent Total coliform 3 2 27 Koivunen et al,. 2005
Secondary effluent Total coliform 4 1.5 20 Stampi et al., 2001
Secondary effluent Total coliform 4 3 15 Madoni et al., 1998
Secondary effluent Fecal coliform 3 2 16 Stampi et al. 2002
Secondary effluent E. coli 2 1.5 20 Zanetti et al., 2007
Secondary effluent E. coli 3 2 16 Stampi et al. 2002
Secondary effluent E. coli 4 1.5 20 Stampi et al., 2001
Secondary effluent E. coli 3 4 10 Dell’Erba et al., 2004
Secondary effluent Enterococci 4 3 15 Madoni et al., 1998
Secondary effluent Enterococci 2 2 16 Stampi et al. 2002
Secondary effluent Enterococci 4 1.5 20 Stampi et al., 2001
PAA’s efficacy against bacteria has been well documented
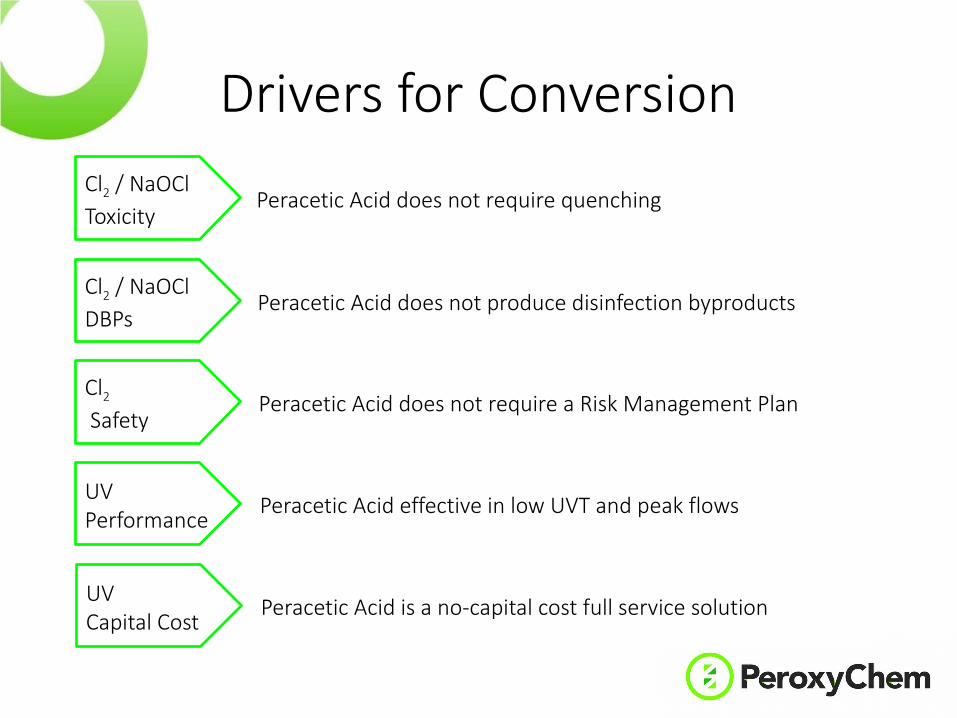
Drivers for ConversionCl2 / NaOCl Toxicity
Cl2 / NaOCl DBPs
Cl2 Safety
UV Performance
UV Capital Cost
Peracetic Acid does not require quenching
Peracetic Acid does not produce disinfection byproducts
Peracetic Acid does not require a Risk Management Plan
Peracetic Acid effective in low UVT and peak flows
Peracetic Acid is a no-capital cost full service solution

Drivers for Conversion to PAAChlorine Toxicity
Need to add dechlorination
High Operating CostChlorine DBPs
High Chlorine Demand
Disinfection Capacity
Need to replace chlorination with UV
Need to increase disinfection capacity
High Capital Cost
PAA can be the most economical disinfection alternative
New contact tank
New UV system
Higher Chlorine Dose
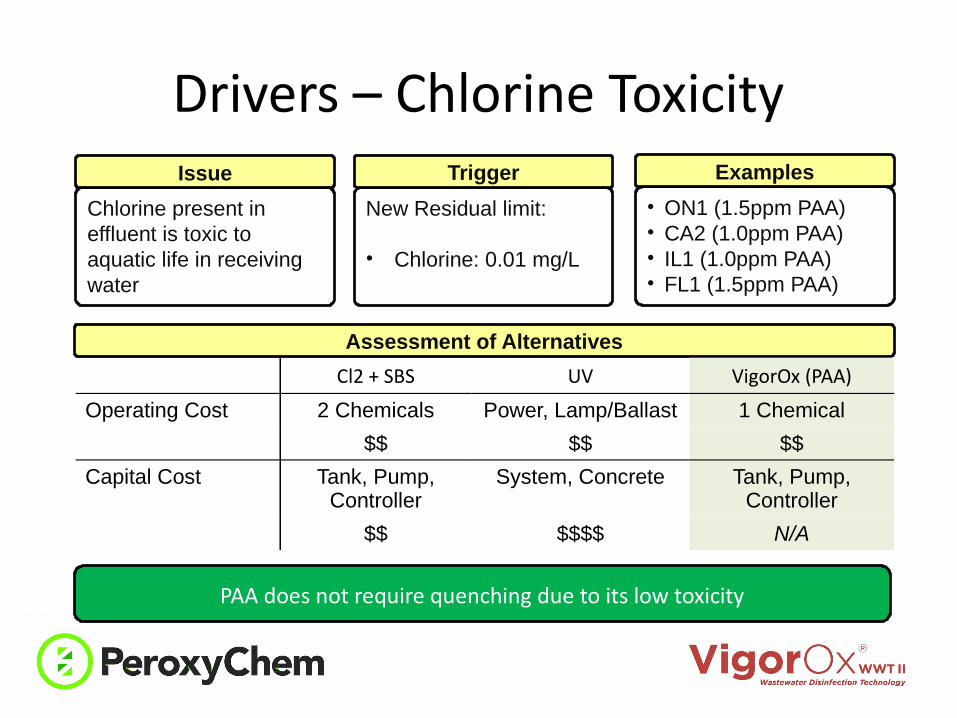
Drivers – Chlorine Toxicity
PAA does not require quenching due to its low toxicity
• ON1 (1.5ppm PAA)• CA2 (1.0ppm PAA)• IL1 (1.0ppm PAA)• FL1 (1.5ppm PAA)
Chlorine present in effluent is toxic to aquatic life in receiving water
New Residual limit:
• Chlorine: 0.01 mg/L
ExamplesIssue Trigger
Assessment of Alternatives
Cl2 + SBS UV VigorOx (PAA)
Operating Cost 2 Chemicals Power, Lamp/Ballast 1 Chemical
$$ $$ $$
Capital Cost Tank, Pump, Controller
System, Concrete Tank, Pump, Controller
$$ $$$$ N/A
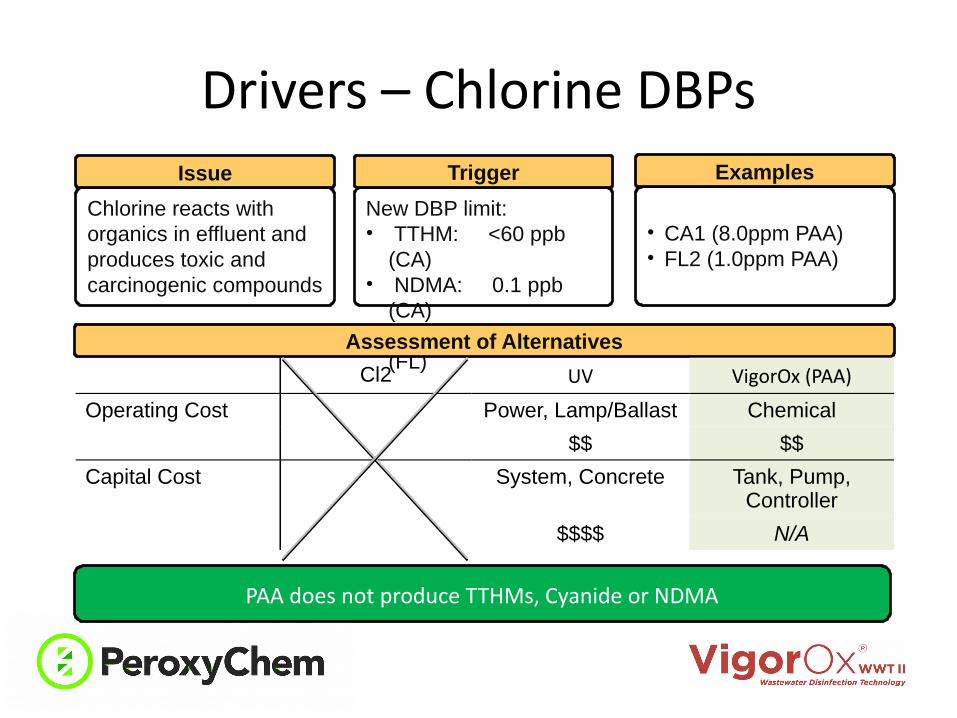
Drivers – Chlorine DBPs
PAA does not produce TTHMs, Cyanide or NDMA
• CA1 (8.0ppm PAA)• FL2 (1.0ppm PAA)
Chlorine reacts with organics in effluent and produces toxic and carcinogenic compounds
New DBP limit:• TTHM: <60 ppb
(CA)• NDMA: 0.1 ppb
(CA)• Cyanide: 1.0 ppb
(FL)
ExamplesIssue Trigger
Assessment of Alternatives
Cl2 UV VigorOx (PAA)
Operating Cost Power, Lamp/Ballast Chemical
$$ $$
Capital Cost System, Concrete Tank, Pump, Controller
$$$$ N/A
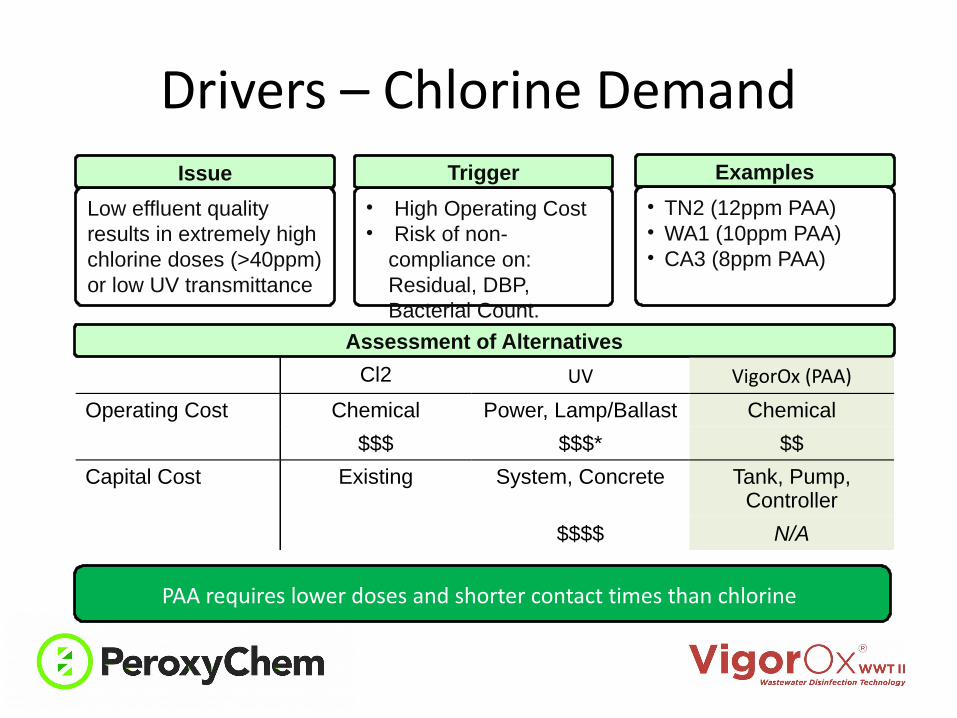
Drivers – Chlorine Demand
PAA requires lower doses and shorter contact times than chlorine
• TN2 (12ppm PAA)• WA1 (10ppm PAA)• CA3 (8ppm PAA)
Low effluent quality results in extremely high chlorine doses (>40ppm) or low UV transmittance
• High Operating Cost• Risk of non-
compliance on: Residual, DBP, Bacterial Count.
ExamplesIssue Trigger
Assessment of Alternatives
Cl2 UV VigorOx (PAA)
Operating Cost Chemical Power, Lamp/Ballast Chemical
$$$ $$$* $$
Capital Cost Existing System, Concrete Tank, Pump, Controller
$$$$ N/A
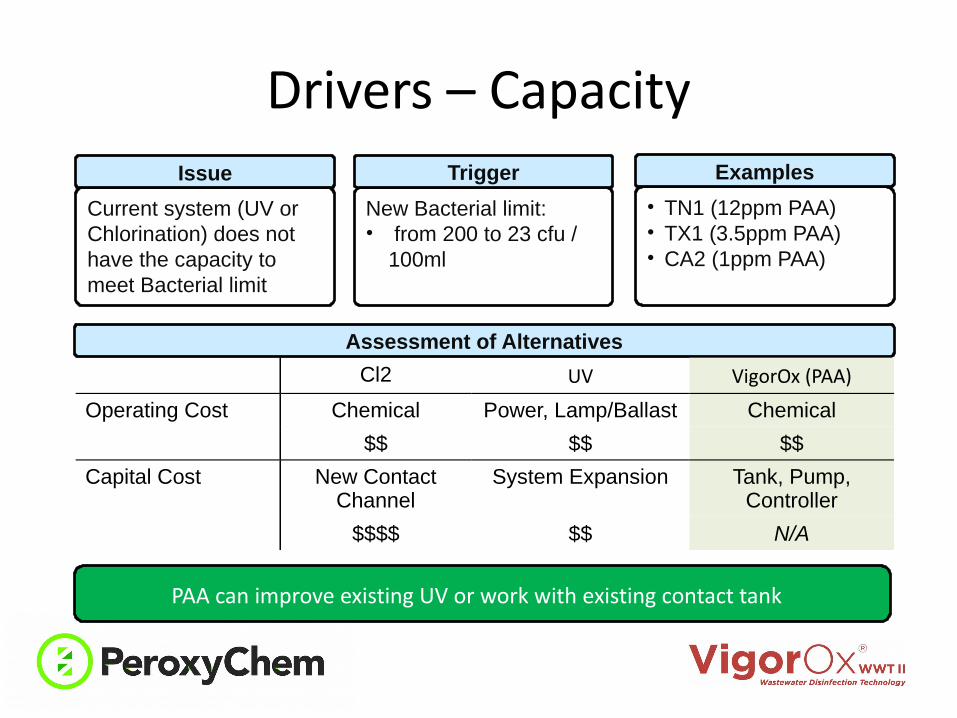
Drivers – Capacity
PAA can improve existing UV or work with existing contact tank
• TN1 (12ppm PAA)• TX1 (3.5ppm PAA)• CA2 (1ppm PAA)
Current system (UV or Chlorination) does not have the capacity to meet Bacterial limit
New Bacterial limit:• from 200 to 23 cfu /
100ml
ExamplesIssue Trigger
Assessment of Alternatives
Cl2 UV VigorOx (PAA)
Operating Cost Chemical Power, Lamp/Ballast Chemical
$$ $$ $$
Capital Cost New Contact Channel
System Expansion Tank, Pump, Controller
$$$$ $$ N/A

Case Studieso Floridao New Jerseyo Tennesseeo Texaso Illinoiso Oregono Kentucky
PART 3
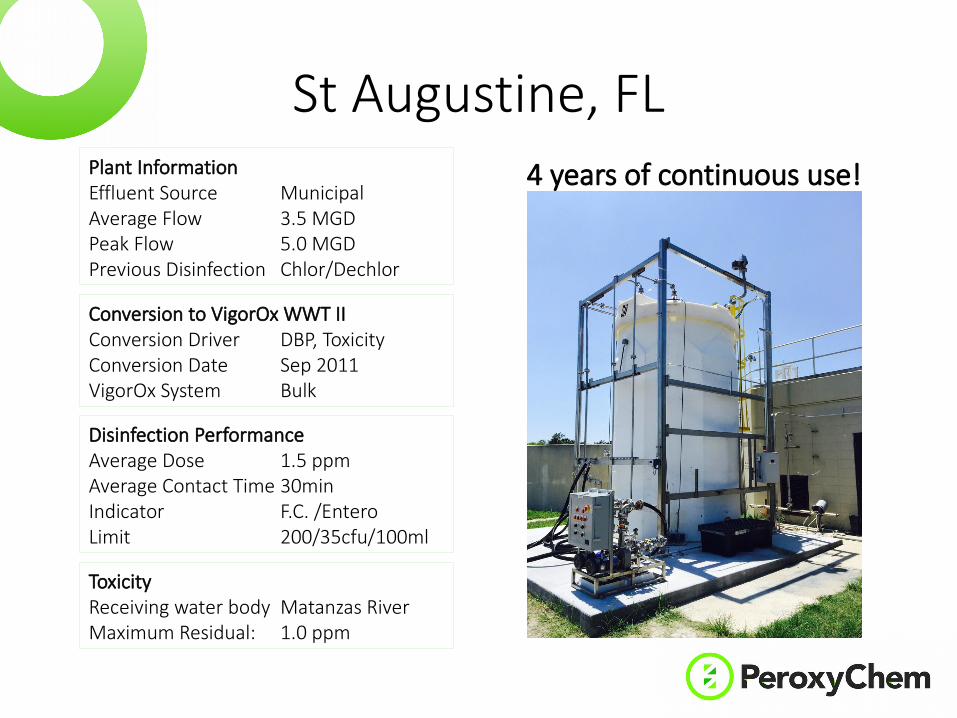
St Augustine, FLPlant InformationEffluent Source MunicipalAverage Flow 3.5 MGDPeak Flow 5.0 MGDPrevious Disinfection Chlor/Dechlor
Conversion to VigorOx WWT IIConversion Driver DBP, ToxicityConversion Date Sep 2011VigorOx System Bulk
Disinfection PerformanceAverage Dose 1.5 ppmAverage Contact Time 30minIndicator F.C. /EnteroLimit 200/35cfu/100ml
ToxicityReceiving water body Matanzas RiverMaximum Residual: 1.0 ppm
4 years of continuous use!
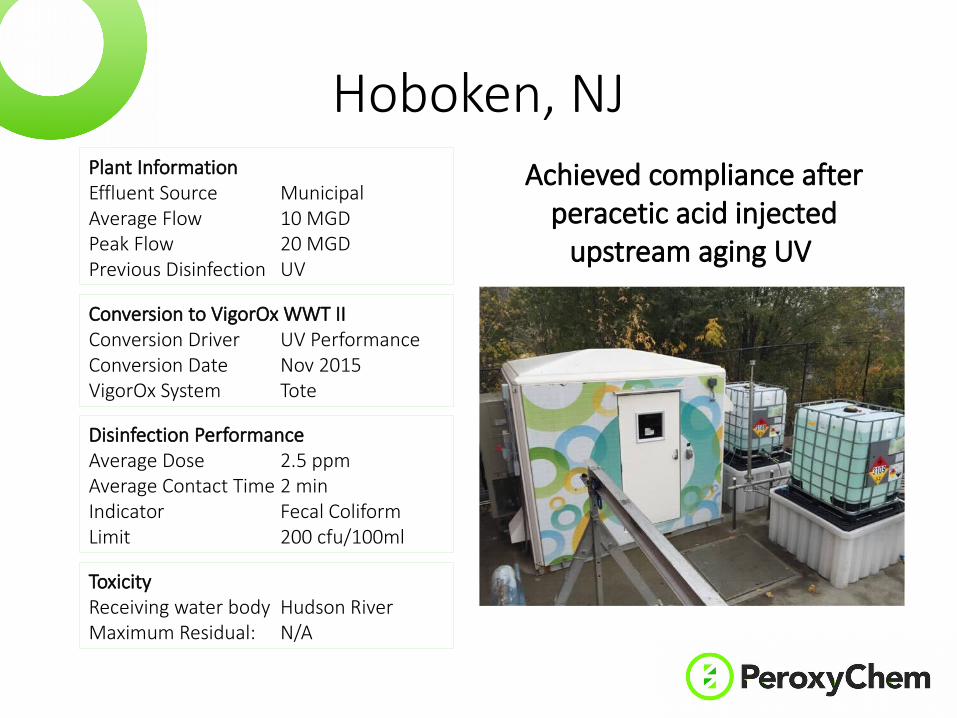
Hoboken, NJPlant InformationEffluent Source MunicipalAverage Flow 10 MGDPeak Flow 20 MGDPrevious Disinfection UV
Conversion to VigorOx WWT IIConversion Driver UV PerformanceConversion Date Nov 2015VigorOx System Tote
Disinfection PerformanceAverage Dose 2.5 ppmAverage Contact Time 2 minIndicator Fecal ColiformLimit 200 cfu/100ml
ToxicityReceiving water body Hudson RiverMaximum Residual: N/A
Achieved compliance after peracetic acid injected
upstream aging UV
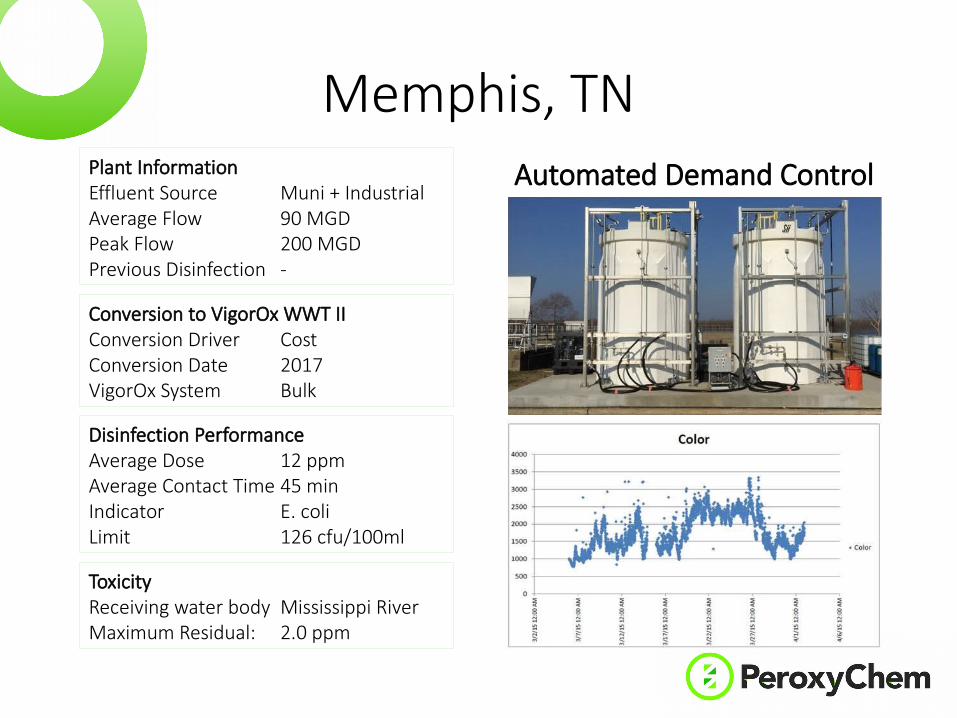
Memphis, TNPlant InformationEffluent Source Muni + IndustrialAverage Flow 90 MGDPeak Flow 200 MGDPrevious Disinfection -
Conversion to VigorOx WWT IIConversion Driver CostConversion Date 2017VigorOx System Bulk
Disinfection PerformanceAverage Dose 12 ppmAverage Contact Time 45 minIndicator E. coliLimit 126 cfu/100ml
ToxicityReceiving water body Mississippi RiverMaximum Residual: 2.0 ppm
Automated Demand Control
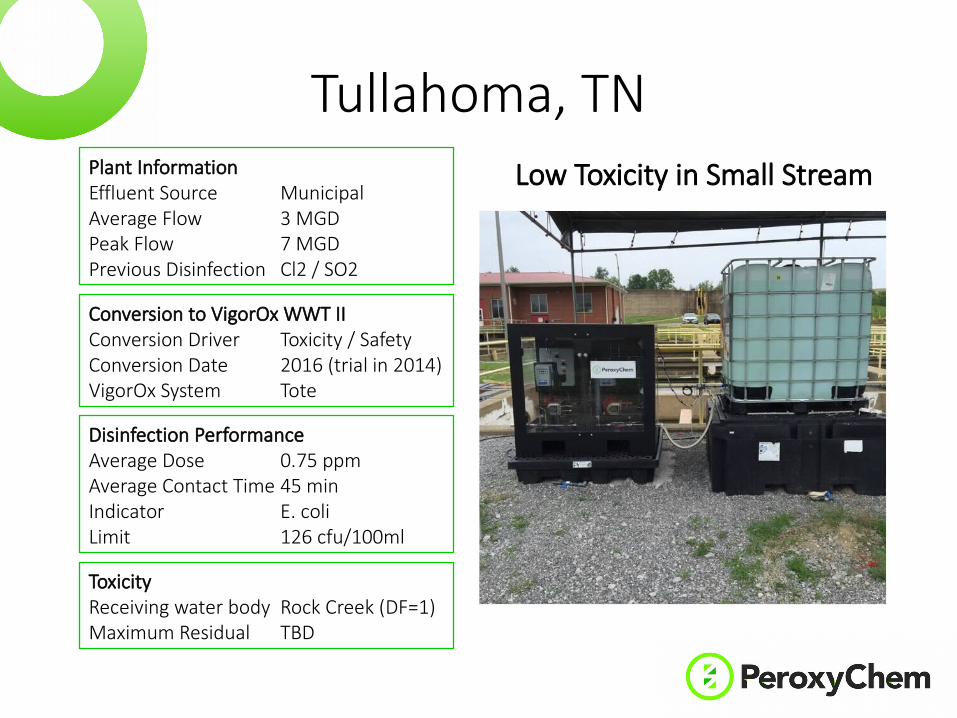
Tullahoma, TNPlant InformationEffluent Source MunicipalAverage Flow 3 MGDPeak Flow 7 MGDPrevious Disinfection Cl2 / SO2
Conversion to VigorOx WWT IIConversion Driver Toxicity / SafetyConversion Date 2016 (trial in 2014)VigorOx System Tote
Disinfection PerformanceAverage Dose 0.75 ppmAverage Contact Time 45 minIndicator E. coliLimit 126 cfu/100ml
ToxicityReceiving water body Rock Creek (DF=1)Maximum Residual TBD
Low Toxicity in Small Stream
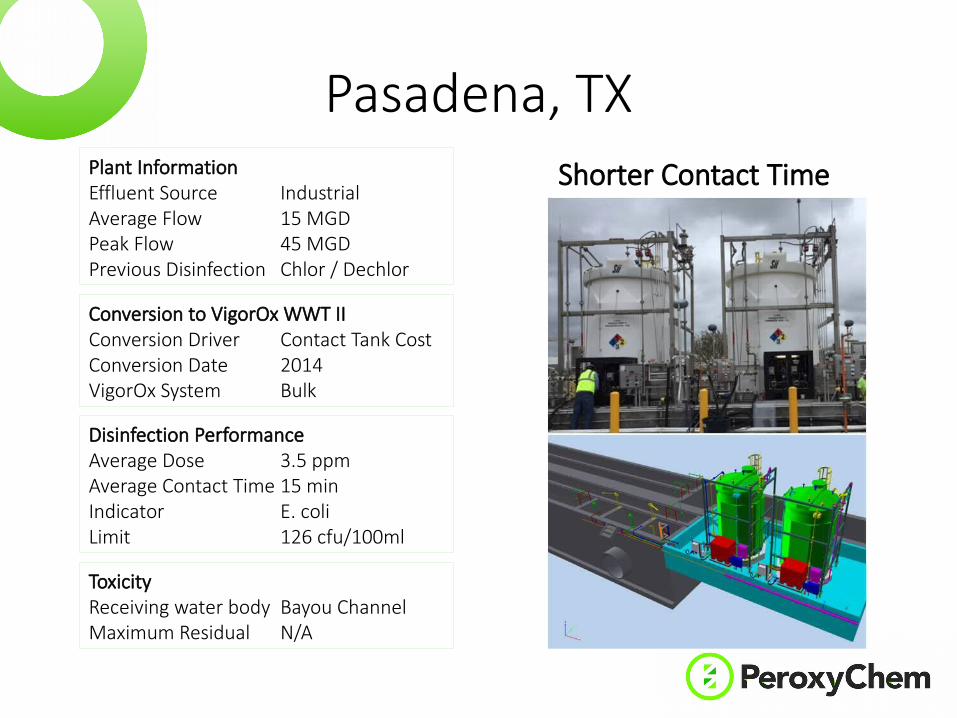
Pasadena, TXPlant InformationEffluent Source IndustrialAverage Flow 15 MGDPeak Flow 45 MGDPrevious Disinfection Chlor / Dechlor
Conversion to VigorOx WWT IIConversion Driver Contact Tank CostConversion Date 2014VigorOx System Bulk
Disinfection PerformanceAverage Dose 3.5 ppmAverage Contact Time 15 minIndicator E. coliLimit 126 cfu/100ml
ToxicityReceiving water body Bayou ChannelMaximum Residual N/A
Shorter Contact Time
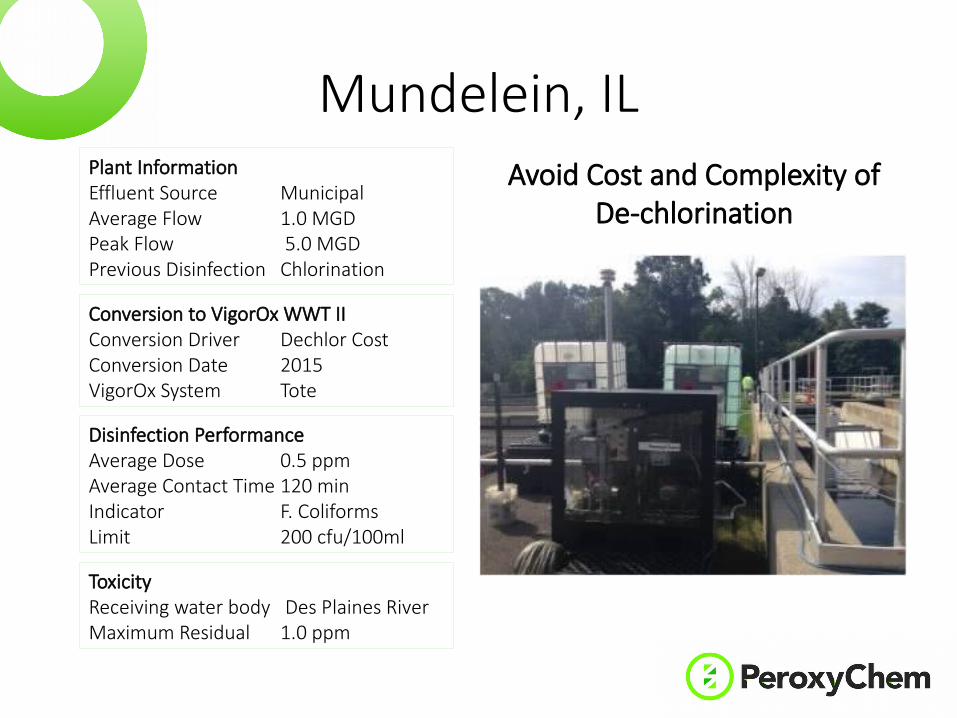
Mundelein, ILPlant InformationEffluent Source MunicipalAverage Flow 1.0 MGDPeak Flow 5.0 MGDPrevious Disinfection Chlorination
Conversion to VigorOx WWT IIConversion Driver Dechlor CostConversion Date 2015VigorOx System Tote
Disinfection PerformanceAverage Dose 0.5 ppmAverage Contact Time 120 minIndicator F. ColiformsLimit 200 cfu/100ml
ToxicityReceiving water body Des Plaines River Maximum Residual 1.0 ppm
Avoid Cost and Complexity of De-chlorination
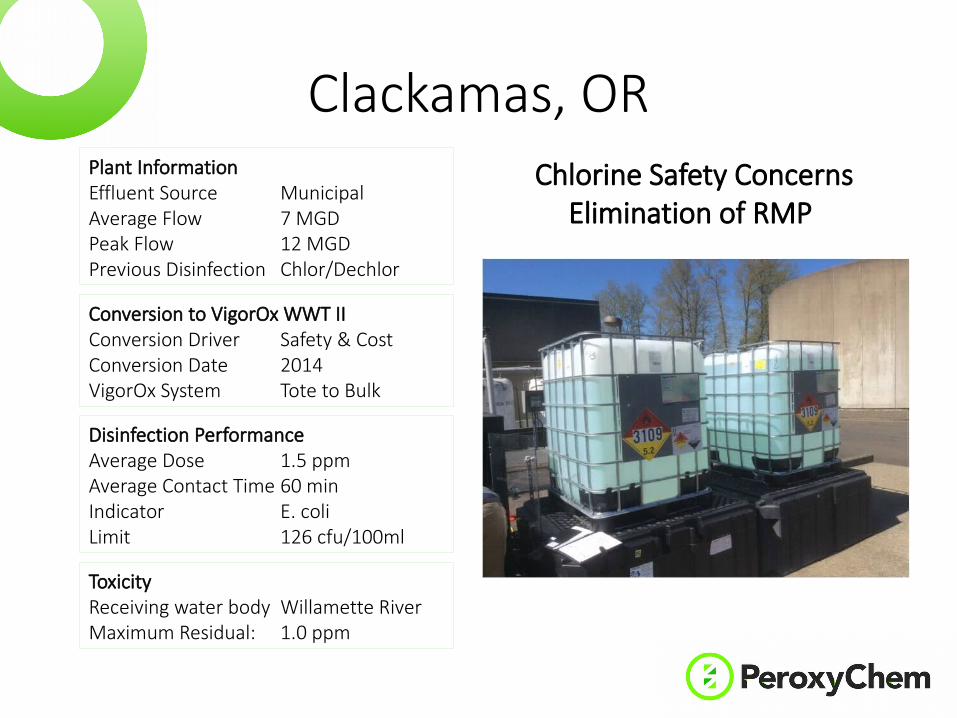
Clackamas, ORPlant InformationEffluent Source MunicipalAverage Flow 7 MGDPeak Flow 12 MGDPrevious Disinfection Chlor/Dechlor
Conversion to VigorOx WWT IIConversion Driver Safety & CostConversion Date 2014VigorOx System Tote to Bulk
Disinfection PerformanceAverage Dose 1.5 ppmAverage Contact Time 60 minIndicator E. coliLimit 126 cfu/100ml
ToxicityReceiving water body Willamette RiverMaximum Residual: 1.0 ppm
Chlorine Safety ConcernsElimination of RMP
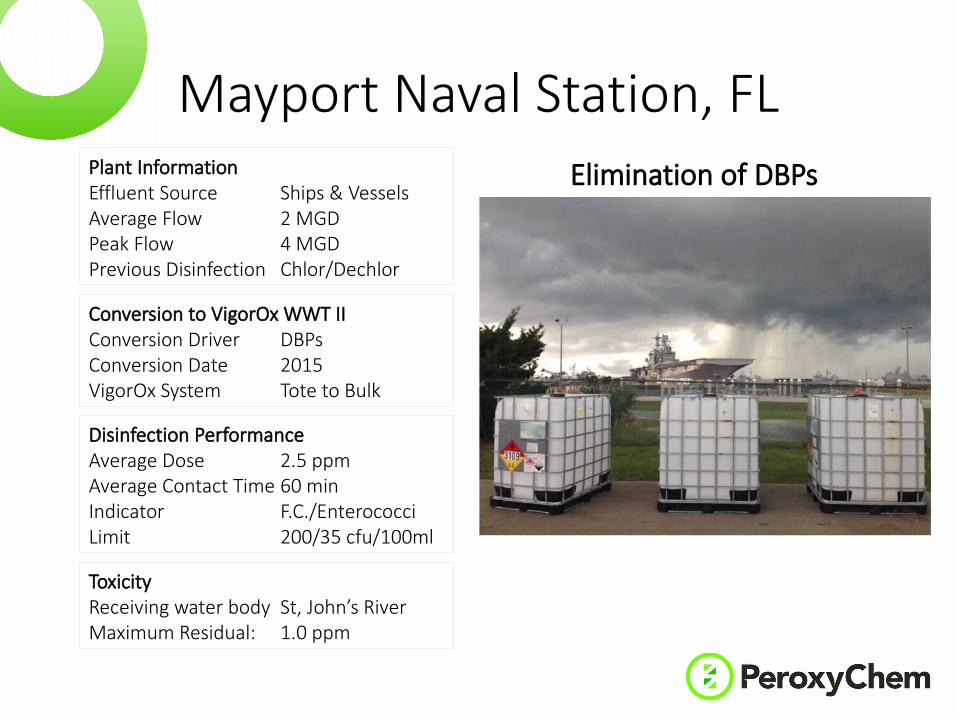
Mayport Naval Station, FLPlant InformationEffluent Source Ships & VesselsAverage Flow 2 MGDPeak Flow 4 MGDPrevious Disinfection Chlor/Dechlor
Conversion to VigorOx WWT IIConversion Driver DBPsConversion Date 2015VigorOx System Tote to Bulk
Disinfection PerformanceAverage Dose 2.5 ppmAverage Contact Time 60 minIndicator F.C./EnterococciLimit 200/35 cfu/100ml
ToxicityReceiving water body St, John’s RiverMaximum Residual: 1.0 ppm
Elimination of DBPs

Bowling Green, KYPlant InformationEffluent Source MunicipalAverage Flow 7 MGDPeak Flow 15 MGDPrevious Disinfection UV
Conversion to VigorOx WWT IIConversion Driver UV Operating CostConversion Date 2015VigorOx System Tote
Disinfection PerformanceAverage Dose 1.3 ppmAverage Contact Time 20 minIndicator E. coliLimit 126 cfu/100ml
ToxicityReceiving water body Barren RiverMaximum Residual 1.0 ppm
Replaced UV System – O&M
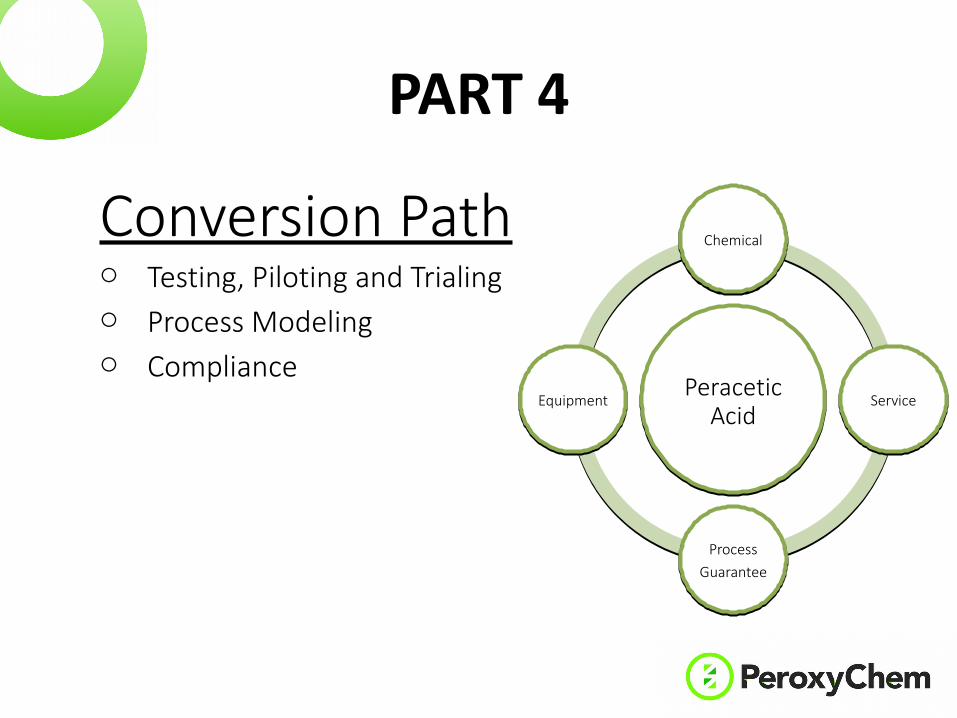
Conversion Patho Testing, Piloting and Trialingo Process Modelingo Compliance
PART 4
Peracetic Acid
Peracetic Acid
ChemicalChemical
ServiceService
ProcessGuarantee
ProcessGuarantee
EquipmentEquipment
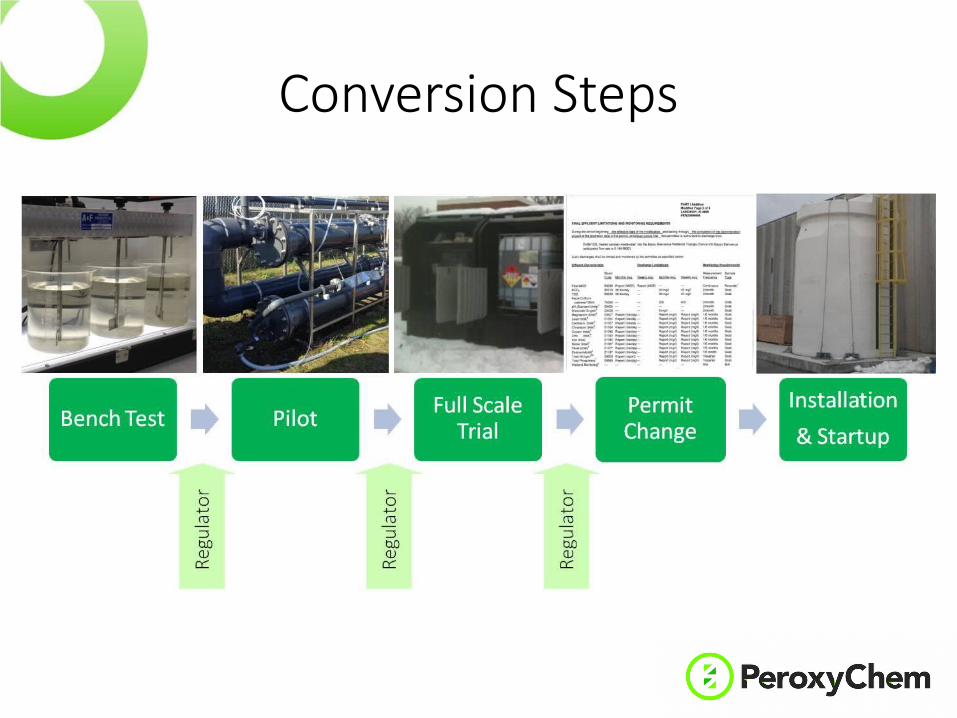
Conversion Steps
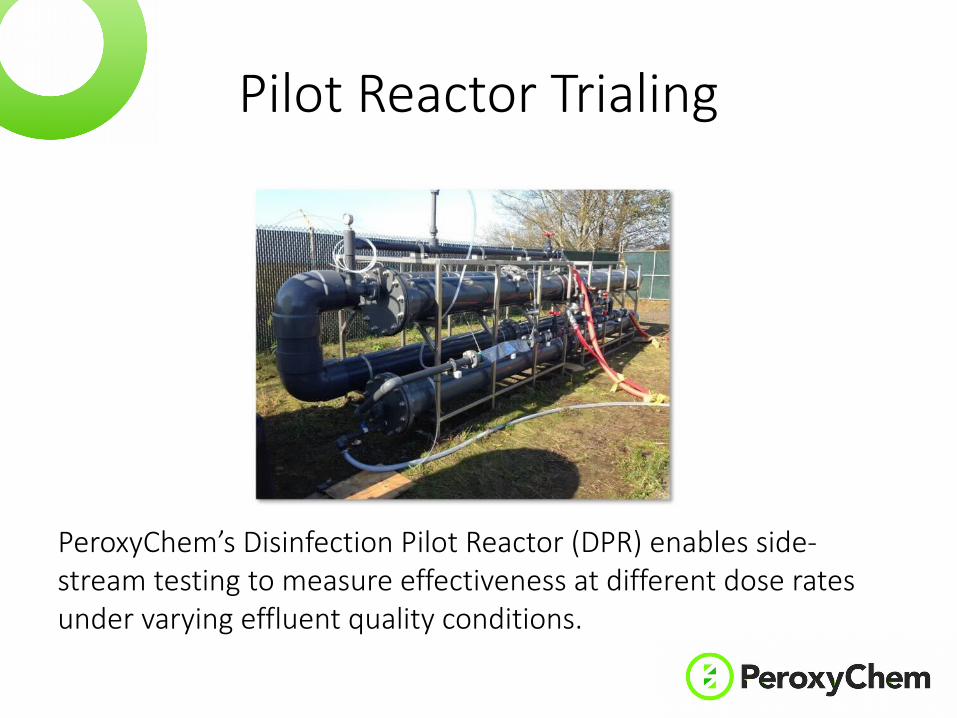
Pilot Reactor Trialing
PeroxyChem’s Disinfection Pilot Reactor (DPR) enables side-stream testing to measure effectiveness at different dose rates under varying effluent quality conditions.
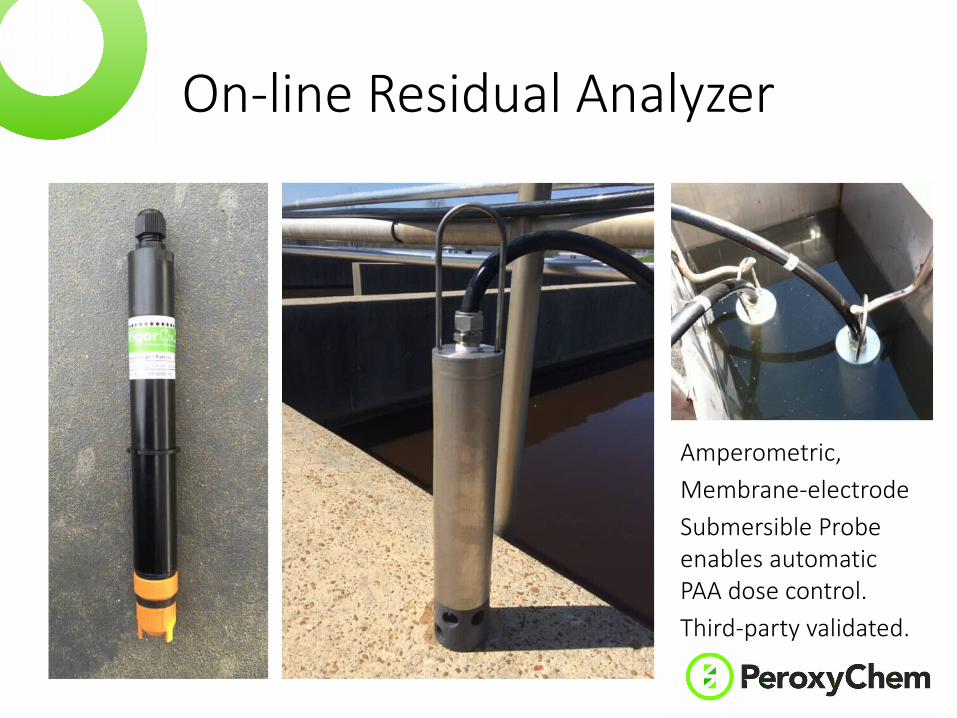
On-line Residual Analyzer
Amperometric,Membrane-electrodeSubmersible Probe enables automatic PAA dose control.Third-party validated.
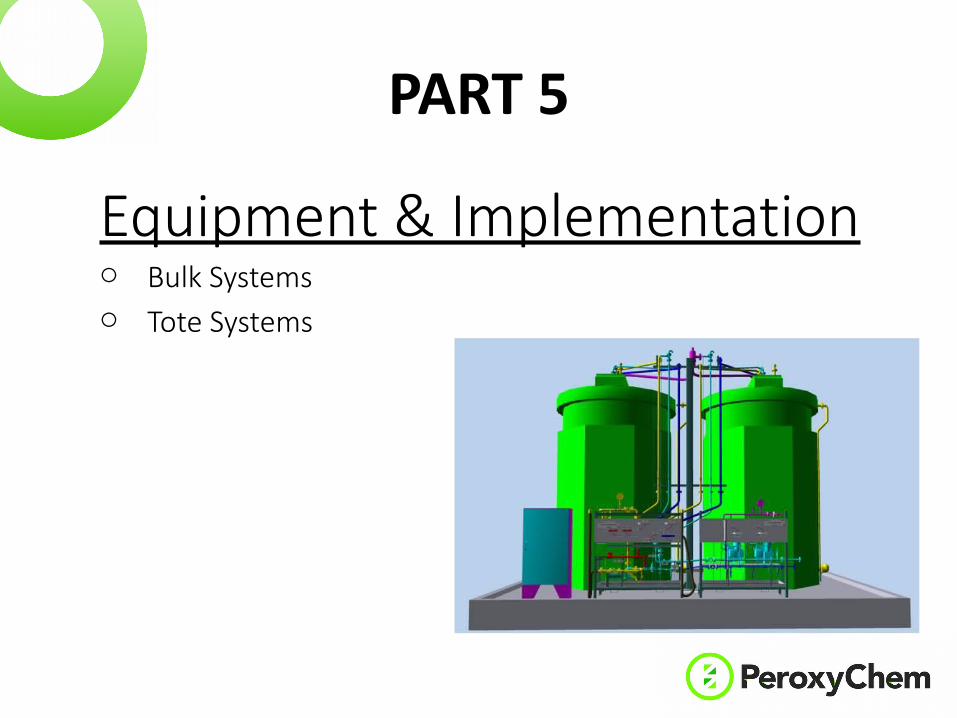
Equipment & Implementationo Bulk Systemso Tote Systems
PART 5
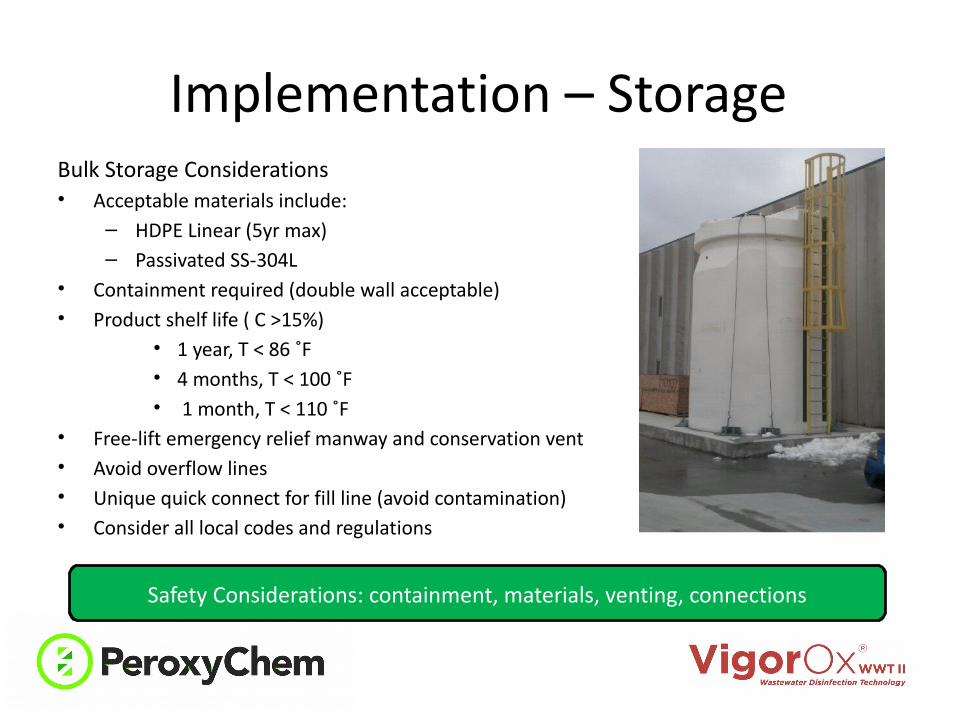
Implementation – Storage
Safety Considerations: containment, materials, venting, connections
Bulk Storage Considerations• Acceptable materials include:
– HDPE Linear (5yr max)– Passivated SS-304L
• Containment required (double wall acceptable)• Product shelf life ( C >15%)
• 1 year, T < 86 ˚F • 4 months, T < 100 ˚F• 1 month, T < 110 ˚F
• Free-lift emergency relief manway and conservation vent • Avoid overflow lines• Unique quick connect for fill line (avoid contamination)• Consider all local codes and regulations
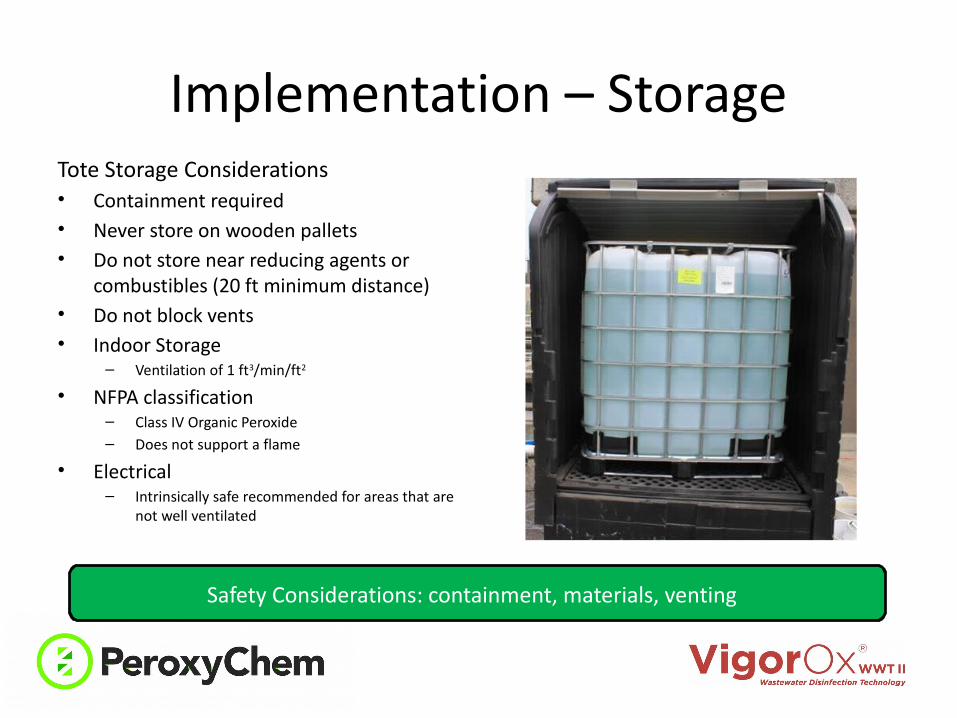
Implementation – StorageTote Storage Considerations• Containment required• Never store on wooden pallets• Do not store near reducing agents or
combustibles (20 ft minimum distance)• Do not block vents• Indoor Storage
– Ventilation of 1 ft3/min/ft2
• NFPA classification– Class IV Organic Peroxide– Does not support a flame
• Electrical– Intrinsically safe recommended for areas that are
not well ventilated
Safety Considerations: containment, materials, venting
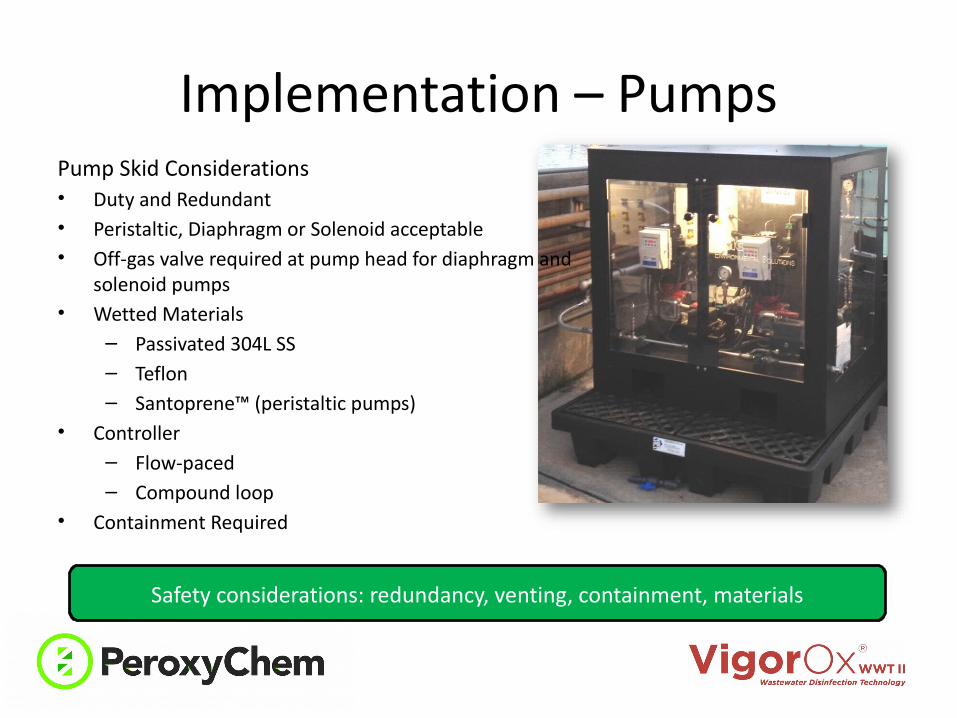
Implementation – Pumps
Safety considerations: redundancy, venting, containment, materials
Pump Skid Considerations• Duty and Redundant• Peristaltic, Diaphragm or Solenoid acceptable• Off-gas valve required at pump head for diaphragm and
solenoid pumps• Wetted Materials
– Passivated 304L SS– Teflon– Santoprene™ (peristaltic pumps)
• Controller– Flow-paced– Compound loop
• Containment Required
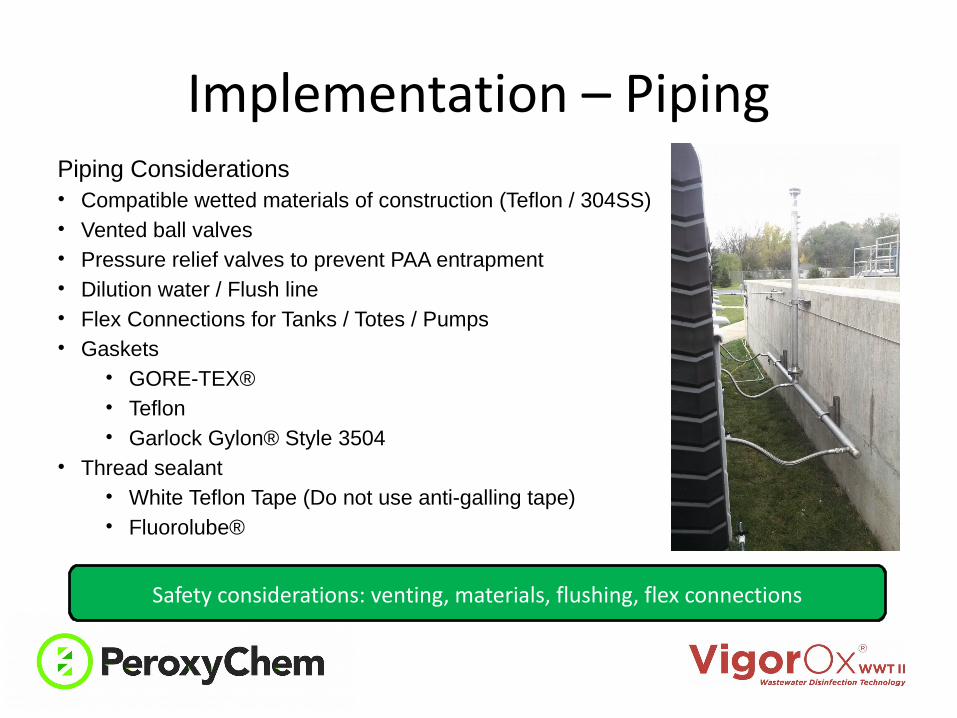
Implementation – Piping
Safety considerations: venting, materials, flushing, flex connections
Piping Considerations• Compatible wetted materials of construction (Teflon / 304SS)• Vented ball valves• Pressure relief valves to prevent PAA entrapment• Dilution water / Flush line• Flex Connections for Tanks / Totes / Pumps• Gaskets
• GORE-TEX® • Teflon• Garlock Gylon® Style 3504
• Thread sealant• White Teflon Tape (Do not use anti-galling tape)• Fluorolube®
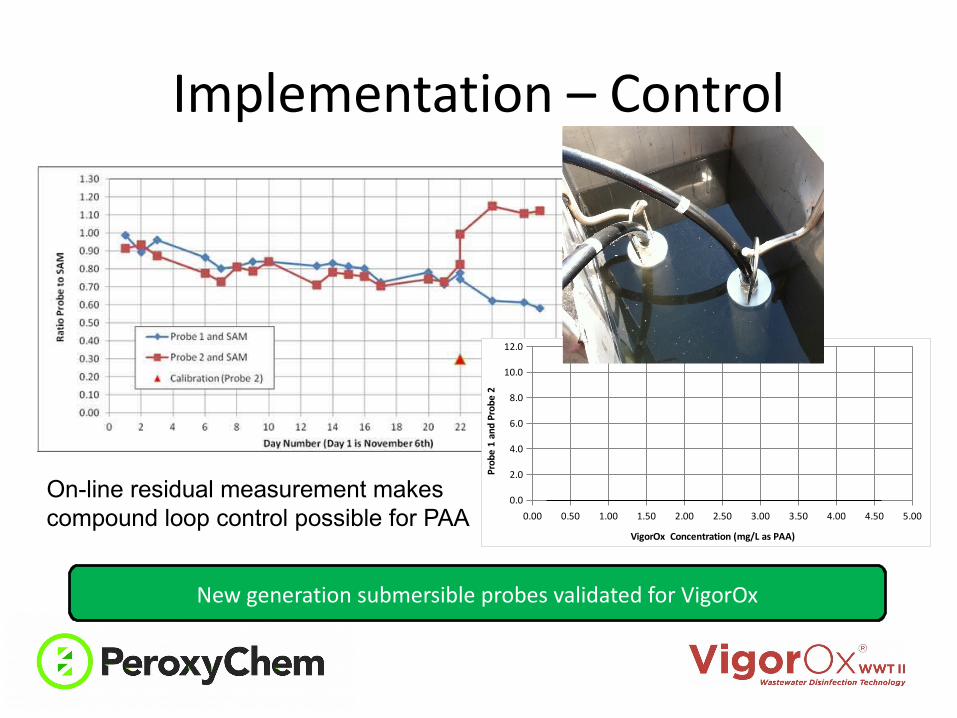
Implementation – Control
New generation submersible probes validated for VigorOx
0.00 0.50 1.00 1.50 2.00 2.50 3.00 3.50 4.00 4.50 5.000.0
2.0
4.0
6.0
8.0
10.0
12.0
VigorOx Concentration (mg/L as PAA)
Prob
e 1
and
Prob
e 2
On-line residual measurement makes compound loop control possible for PAA
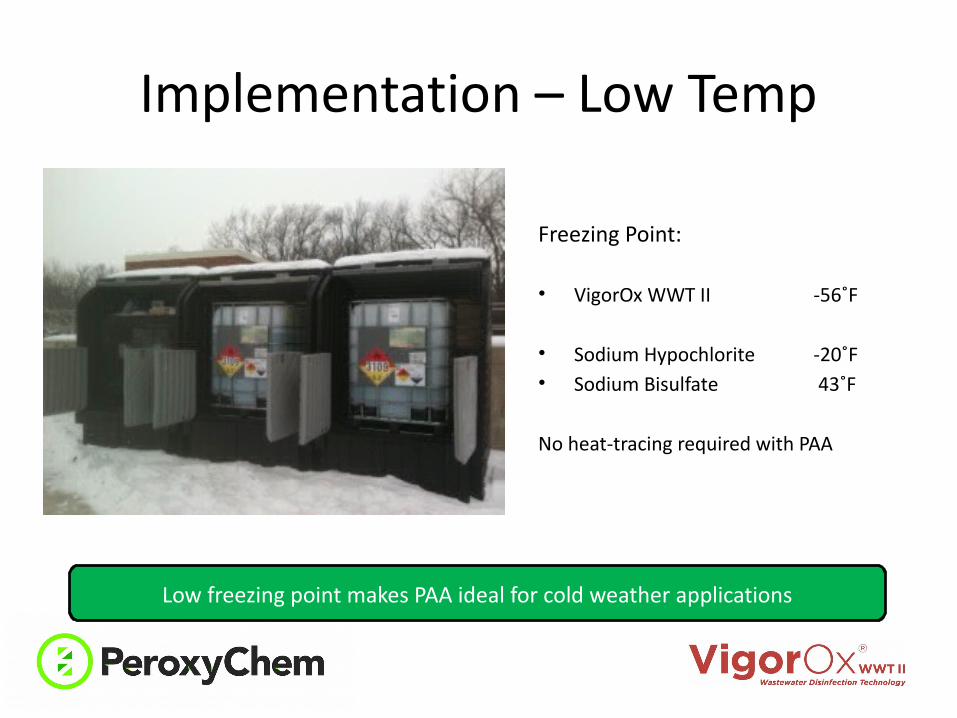
Implementation – Low Temp
Low freezing point makes PAA ideal for cold weather applications
Freezing Point:
• VigorOx WWT II -56˚F
• Sodium Hypochlorite -20˚F• Sodium Bisulfate 43˚F
No heat-tracing required with PAA
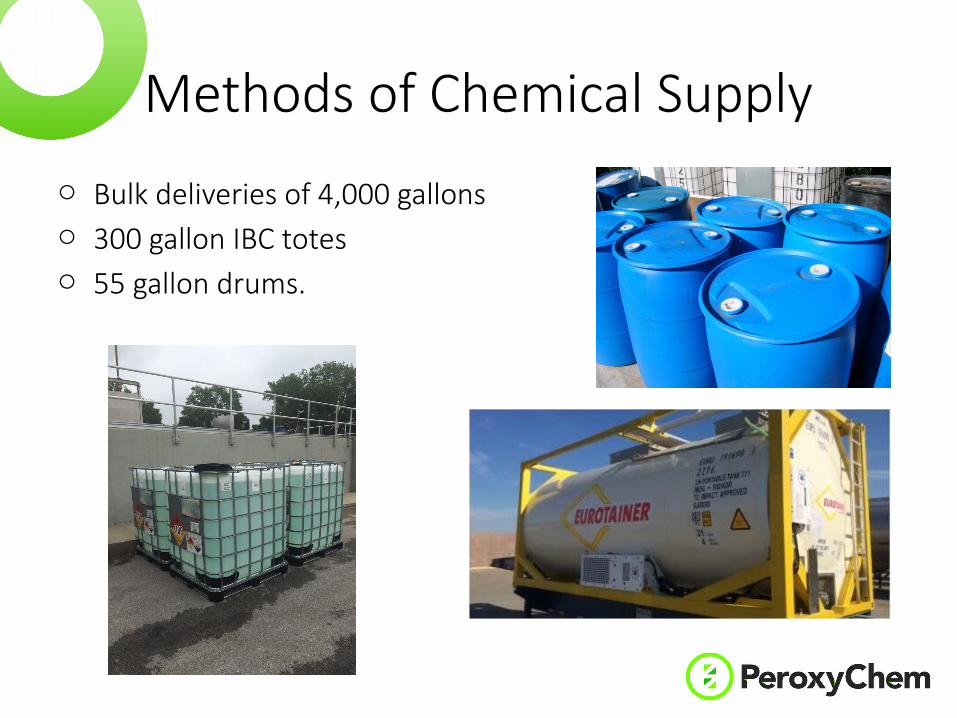
Methods of Chemical Supplyo Bulk deliveries of 4,000 gallonso 300 gallon IBC totes o 55 gallon drums.
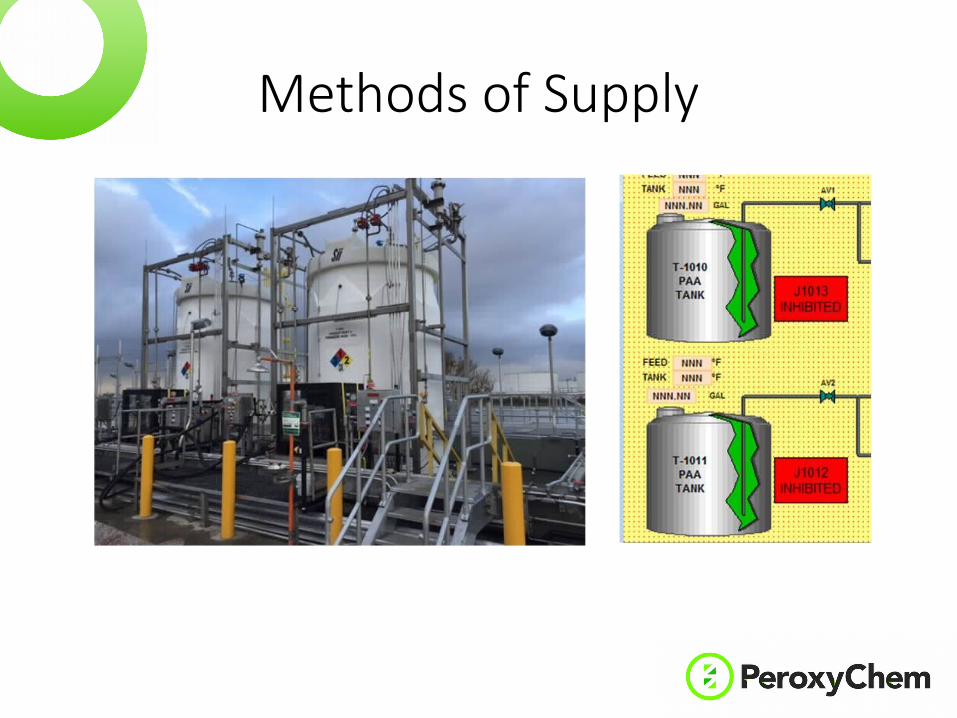
Methods of Supply
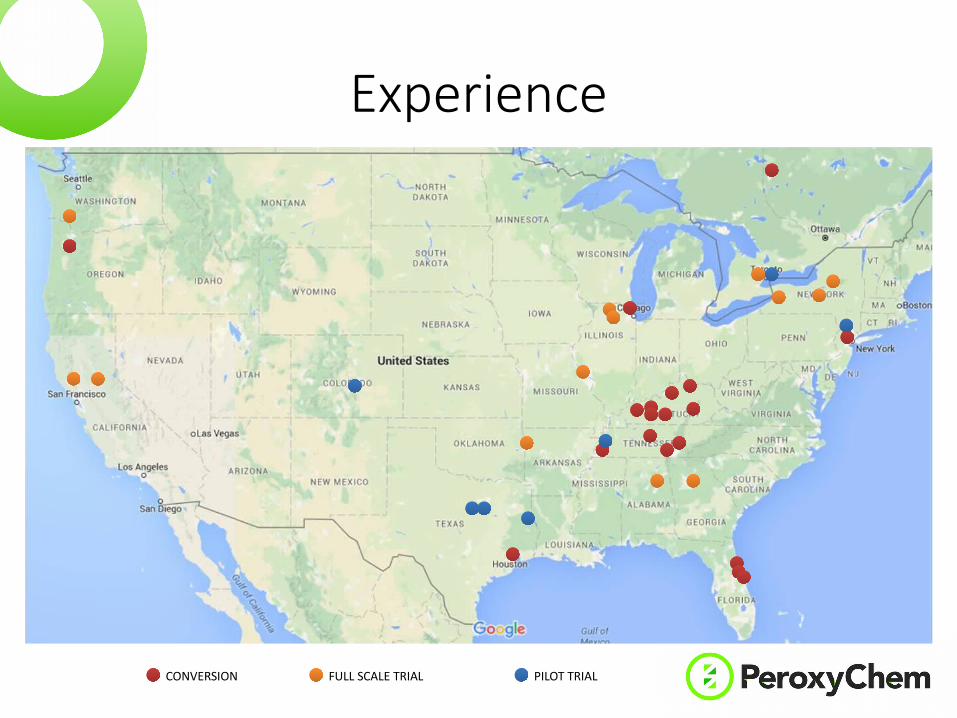
Experience
CONVERSION FULL SCALE TRIAL PILOT TRIAL
Experience in OH.
• One replacement of Sodium Hypo, Steubenville, OH• Ohio EPA position: currently the same as Chlorine low residual
and ergo quenching required• Pilot Testing in Cincinnati, OH
o Acute toxicity testingo E Coli disinfectiono CT evaluation