
Trends in the Criminal Justice System
Mike Lawlor, Undersecretary
Presented
January 2016

Trends in criminal justice
• Reduction in index crimes, 2008 to 2015*: 28.3%
• Reduction in criminal arrests, 2009 to 2015: 31.3%
• Reduction in prison population, 2010 to 2016: 14.1%
• Reduction in minority prison population, 2010 to 2016: 17.9%
• Reduction in total releases, 2007-2010 v. 2012-2015 : 16.8%
• Reduction in prison admits, 2009 to 2015: 25.2%
• Reduction in pre-trial admits, 2009 to 2015: 24.2%
*2015 Crime data is based on OPM estimate of partial-year UCR data
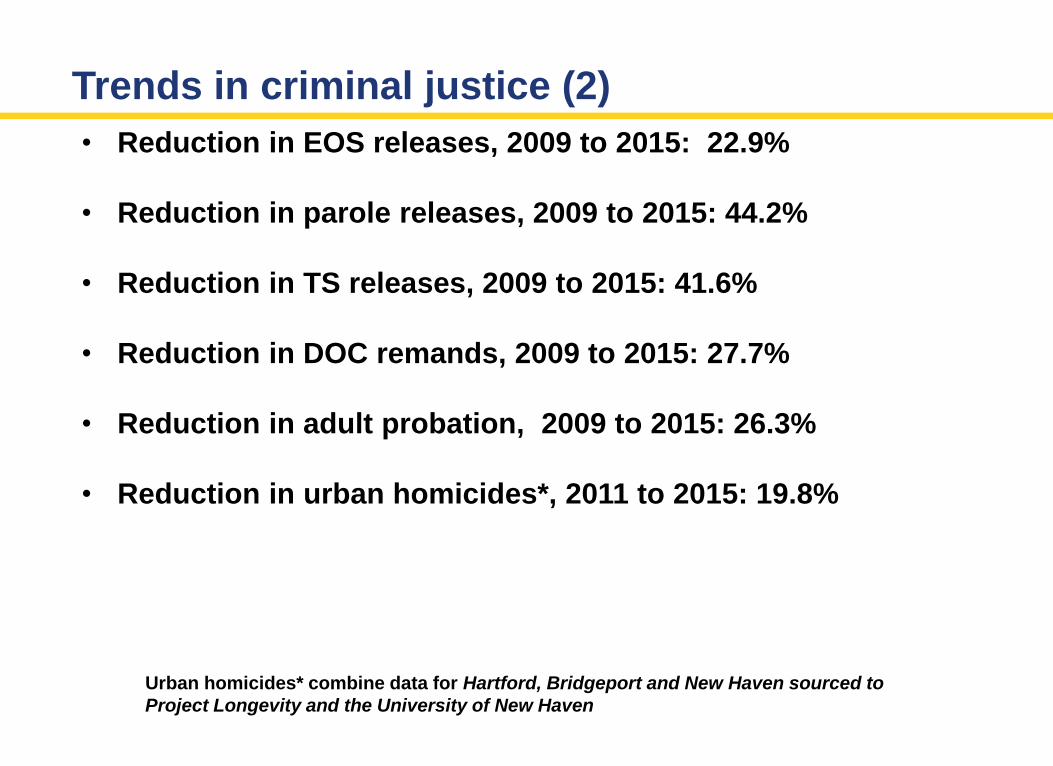
Trends in criminal justice (2)
• Reduction in EOS releases, 2009 to 2015: 22.9%
• Reduction in parole releases, 2009 to 2015: 44.2%
• Reduction in TS releases, 2009 to 2015: 41.6%
• Reduction in DOC remands, 2009 to 2015: 27.7%
• Reduction in adult probation, 2009 to 2015: 26.3%
• Reduction in urban homicides*, 2011 to 2015: 19.8%
Urban homicides* combine data for Hartford, Bridgeport and New Haven sourced to
Project Longevity and the University of New Haven

Total index crimes – CT UCR, 1960 - 2015
*2015 data based on OPM estimate, see following slide

Reductions in Violent Crime, 2013 to 2014
Town 2013 2014 % Decrease
Hartford 1473 1380 -6%
New Haven 1643 1380 -16%
Bridgeport 1397 1338 -4%
Three Cities 4513 4098 -9%
All Other 4640 4397 -5%
Statewide 9153 8495 -7%
Violent Crimes

Murders in Connecticut 1960 - 2015
The FBI defines murder as the willful (non-negligent) killing of one human being by another
Source: CT UCR

Source: OCME & Municipal Police Agencies
Urban Homicides

Reported crimes (UCR) and arrests
Source: CT DOC
10,399 10,254 10,096 10,525 10,550 10,768 10,532 10,077 9,887 10,167 9,107 8,495
92,042 94,197 92,183 90,627 86,850 87,442 82,712 78,519 77,445 77,380 71,191 69,351
-
25,000
50,000
75,000
100,000
125,000
2003 2004 2005 2006 2007 2008 2009 2010 2011 2012 2013 2014
Reported crimesProperty crime Violent crime
119,432 118,940 115,601 115,337 114,011 117,196 124,249114,156 114,789
101,065 94,856 90,310 84,703
0
20,000
40,000
60,000
80,000
100,000
120,000
140,000
2003 2004 2005 2006 2007 2008 2009 2010 2011 2012 2013 2014 2015
Statewide ArrestsSource: CT Offenders-based Tracking system (OBTS)
Note: a preliminary analysis by OPM-CJPPD projects that UCR reported crimes could
drop by as much as 9.2% in 2015 compared to 2014 totals.
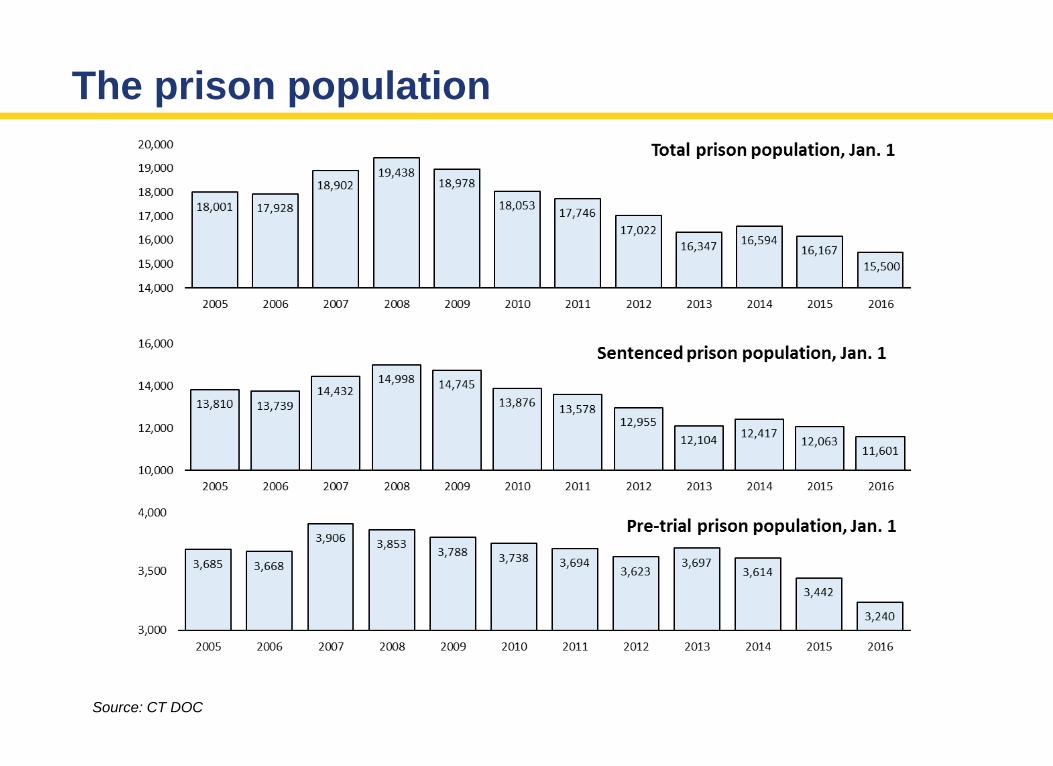
The prison population
Source: CT DOC

Population: York C.I. Jan. 1, 2006-2016
Source: CT DOC
York, C.I. is the only women’s facility in CT
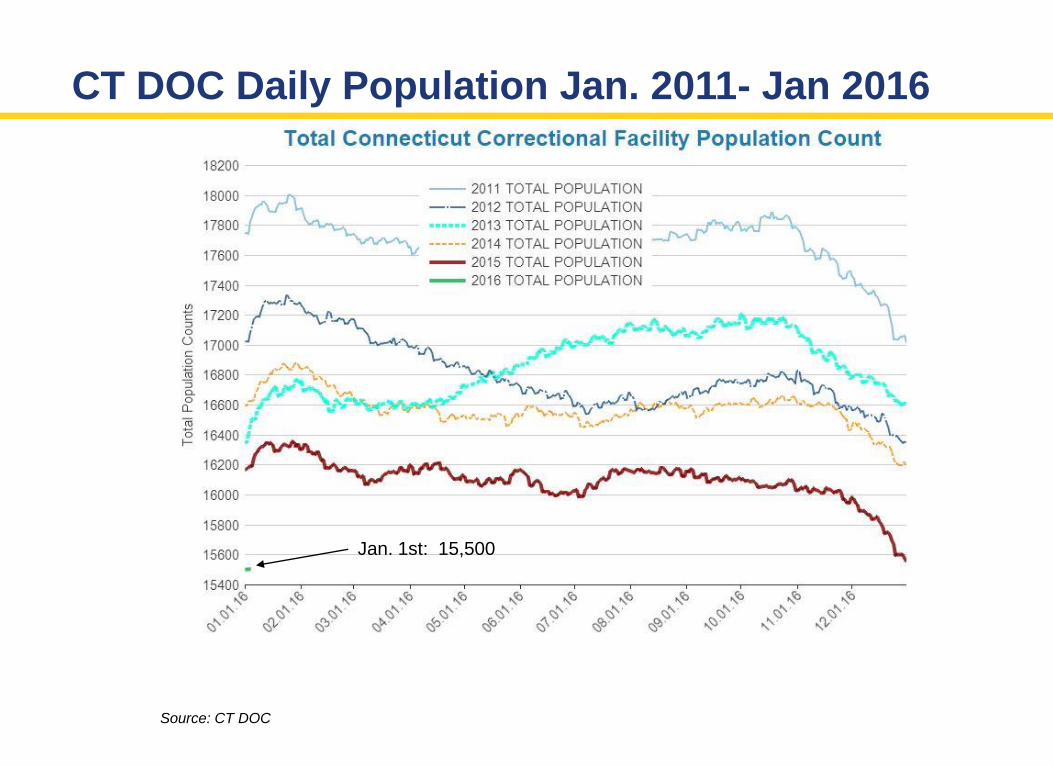
CT DOC Daily Population Jan. 2011- Jan 2016
Jan. 1st: 15,500
Source: CT DOC

Racial/ethnic composition of the prison population
Source: CT DOC

Source: CT DOC
Reduction 18-21 Cohort
35
31
2
20
92
5654
54
00
54
85
18
22
3
19
62
52
21
51
97
54
32
13
18
6
17
65
51
80
49
72
56
30
17
12
6
16
11
48
60
48
46
5562
12
94
14
25
47
13
47
42
53
61
13
75
12
52
47
86
48
67
56
01
15
69
11
04
46
47
4847
54
85
8
76
96
4
43
05
47
88
53
59
0
1000
2000
3000
4000
5000
6000
<16 16-17 18-21 22-29 30-39 >40
Incarceration and Age
2009 2010 2011 2012 2013 2014 2015 2016
Total incarcerated population on January 1.

DOC admissions 2005 - 2015
Source: CT DOC
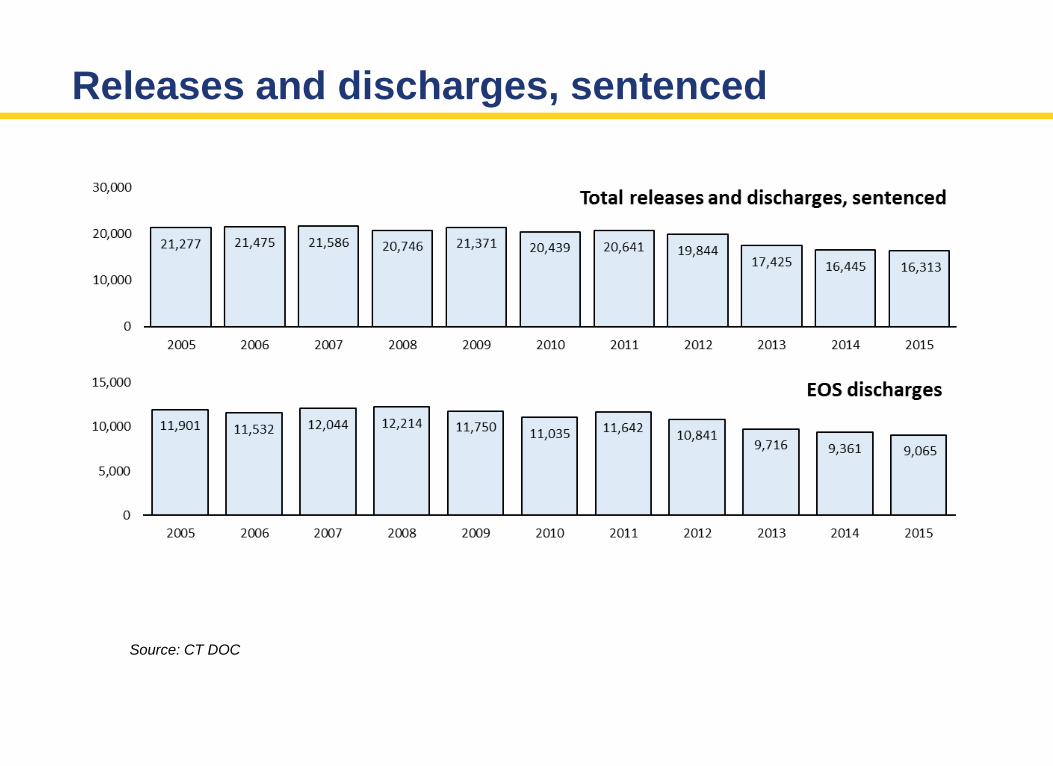
Releases and discharges, sentenced
Source: CT DOC
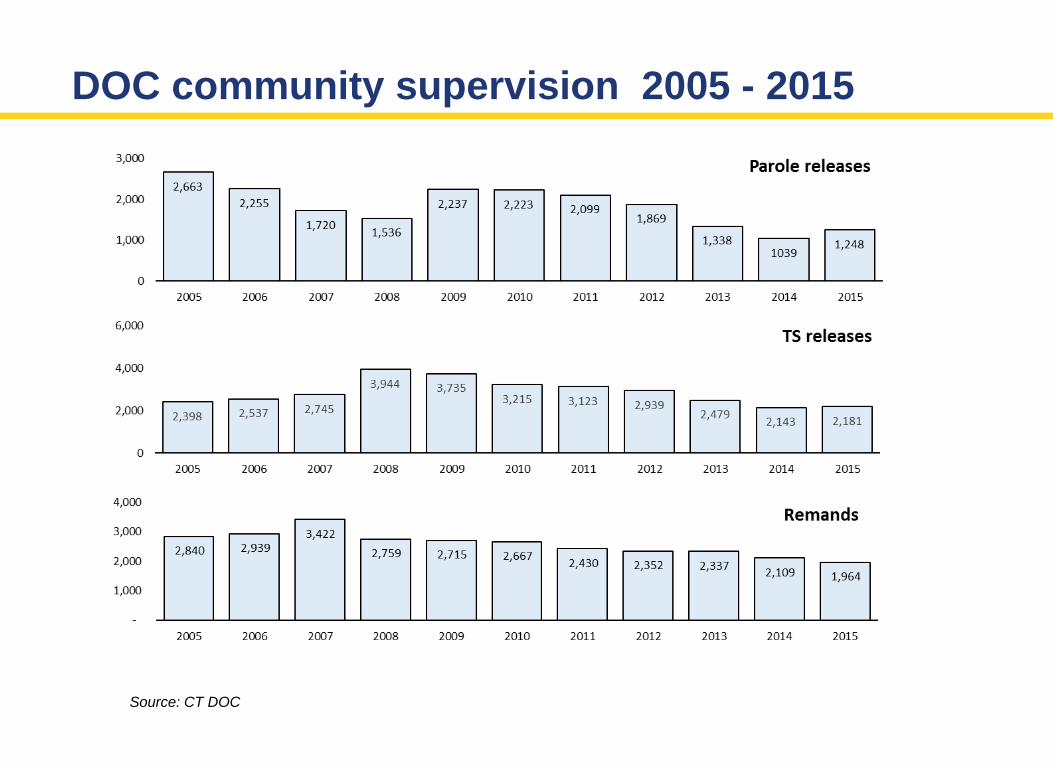
DOC community supervision 2005 - 2015
Source: CT DOC

DUI home confinement and special parole
Source: CT DOC

Recidivism among prisoners
Source: OPM - CJPPD

Probation population
Source: CSSD
Note: 2016* data, shows data for December 1, 2015

OPM’s input-output model of the CJ system

www.ct.gov/opm/CriminalJustice/Research


