TransMontaigne Partners L.P.NAPTP
2013 Investor Conference May 22nd 2013

2
Forward Looking Statements
All statements, other than statements of historical facts, contained herein and made by representatives of TransMontaigne Partners L.P. during this presentation may constitute “forward-looking statements” within the meaning of the Private Securities Litigation Reform Act of 1995. Forward-looking statements address activities, events or developments that the Partnership expects, believes or anticipates will or may occur in the future. These forward-looking statements are based on certain assumptions made by the Partnership based on management’s experience and perception of historical trends, current conditions, expected future developments and other factors it believes are appropriate in the circumstances.
Any forward-looking statements contained herein or made by representatives of the Partnership during this presentation are subject to risks and uncertainties, many of which are beyond the Partnership’s ability to control or predict. If one or more of these risks or uncertainties materialize, or if underlying assumptions prove incorrect, then the Partnership’s actual results may differ materially from those implied or expressed by the forward-looking statements. Important factors that could cause actual results to differ materially from management’s expectations include a reduction in revenues from any of our significant customers upon which we rely for a substantial majority of our revenues, debt levels and restrictions in our debt agreements that may limit our operational flexibility, our ability to raise additional funds through equity or debt financings, the impact on our facilities or operations of extreme weather conditions, costs associated with environmental compliance and remediation, failure by any of our significant customers to continue to engage us to provide services after the expiration of existing terminaling services agreements, the impact of Morgan Stanley’s status as a bank holding company on its ability to conduct non banking activities, approve any “significant” acquisition or investment that we may propose or retain its investment in our general partner and other factors detailed in the Partnership’s filings with the Securities and Exchange Commission, including our annual report on Form 10-K for the year ended December 31, 2012 filed March 12, 2013. As a result of these risks and uncertainties, investors should not place undue reliance on forward-looking statements.
The Partnership undertakes no obligation to update any forward-looking statements, whether as a result of new information or future events.
Company Overview
Overview of TLP’s Business
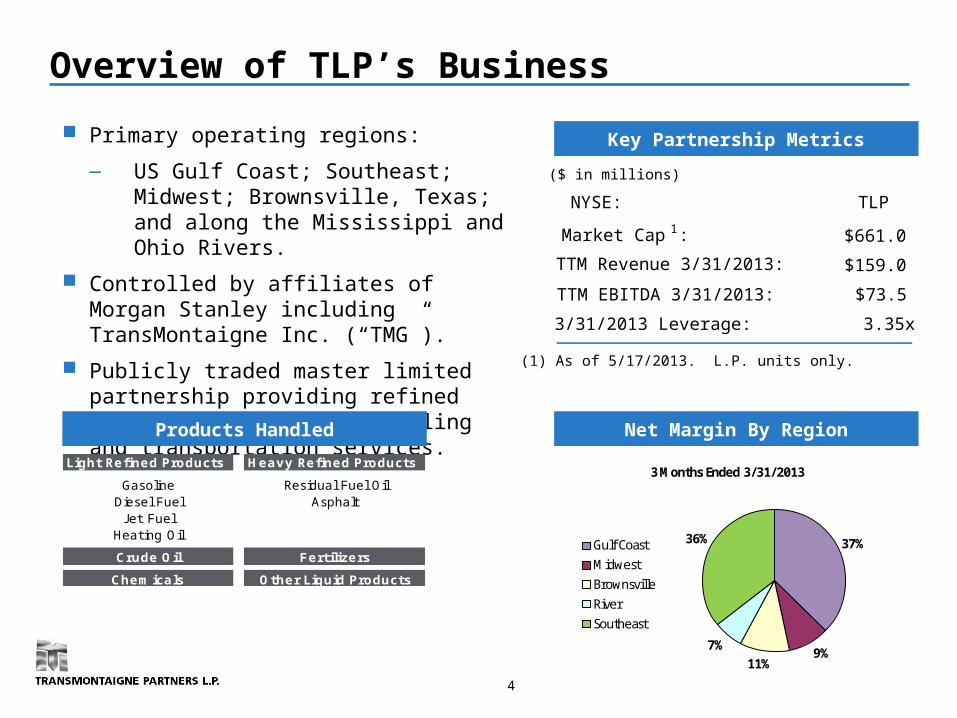
Primary operating regions:
― US Gulf Coast; Southeast; Midwest; Brownsville, Texas; and along the Mississippi and Ohio Rivers.
Controlled by affiliates of Morgan Stanley including TransMontaigne Inc. (“TMG”).
Publicly traded master limited partnership providing refined petroleum products terminaling and transportation services.
Net Margin By Region
Key Partnership Metrics
Products Handled
Light Refined Products Heavy Refined Products
Gasoline Residual Fuel OilDiesel Fuel Asphalt
J et FuelHeating Oil
Crude Oil Fertilizers
Chemicals Other Liquid Products
4
($ in millions)
NYSE: TLP
Market Cap 1 : $661.0
TTM Revenue 3/31/2013: $159.0
TTM EBITDA 3/31/2013: $73.5
3/31/2013 Leverage: 3.35x
37%
9%11%
7%
36%
3 Months Ended 3/31/2013
Gulf Coast
Midwest
Brownsville
River
Southeast
(1) As of 5/17/2013. L.P. units only.

5
Area of Operations
6
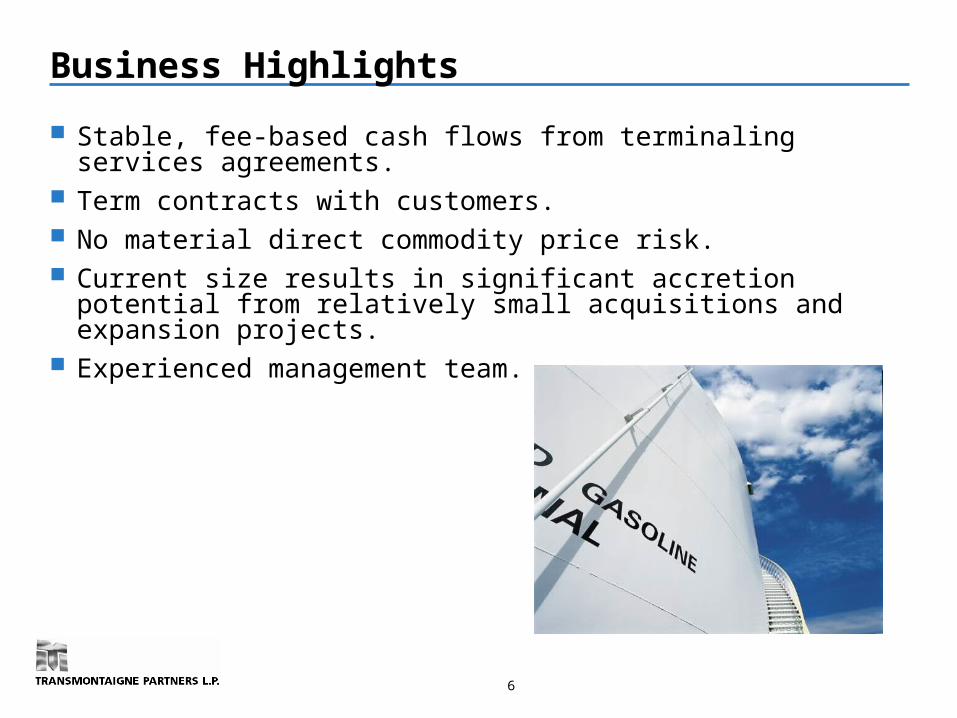
Business Highlights
Stable, fee-based cash flows from terminaling services agreements. Term contracts with customers. No material direct commodity price risk. Current size results in significant accretion potential from relatively
small acquisitions and expansion projects. Experienced management team.

Key Customer Relationships
U.S. Government
7
8
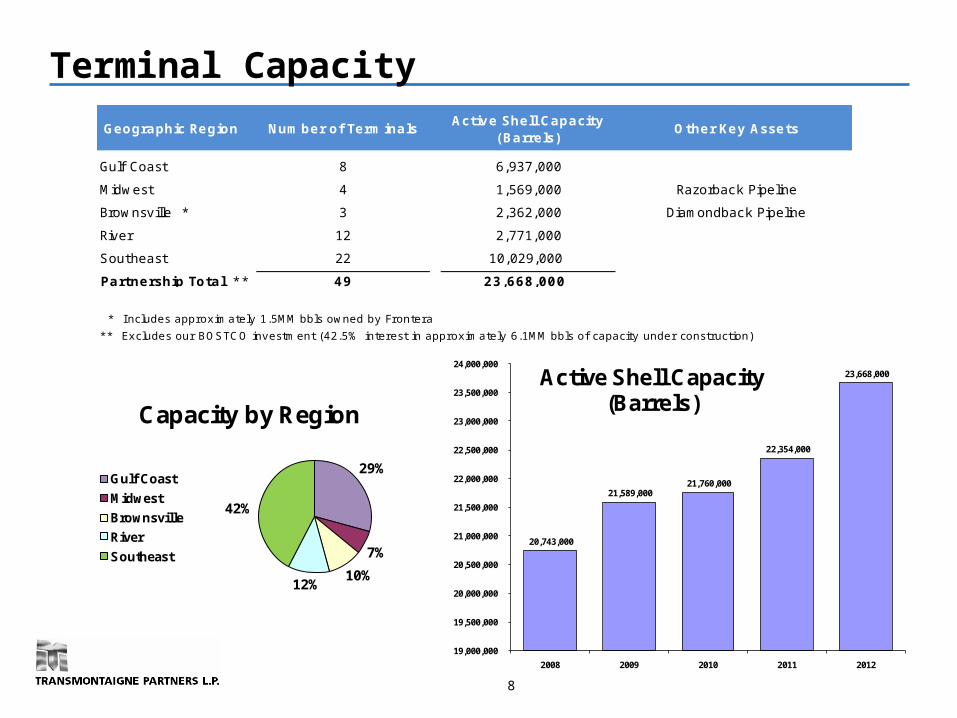
Terminal Capacity
20,743,000
21,589,000 21,760,000
22,354,000
23,668,000
19,000,000
19,500,000
20,000,000
20,500,000
21,000,000
21,500,000
22,000,000
22,500,000
23,000,000
23,500,000
24,000,000
2008 2009 2010 2011 2012
Active Shell Capacity (Barrels)
29%
7%
10%12%
42%
Capacity by Region
Gulf Coast
Midwest
Brownsville
River
Southeast
Geographic Region Number of TerminalsActive Shell Capacity
(Barrels)Other Key Assets
Gulf Coast 8 6,937,000
Midwest 4 1,569,000 Razorback Pipeline
Brownsville * 3 2,362,000 Diamondback Pipeline
River 12 2,771,000
Southeast 22 10,029,000
Partnership Total * * 49 23,668,000
* I ncludes approximately 1.5MM bbls owned by Frontera
** Excludes our BOSTCO investment (42.5% interest in approximately 6.1MM bbls of capacity under construction)
9
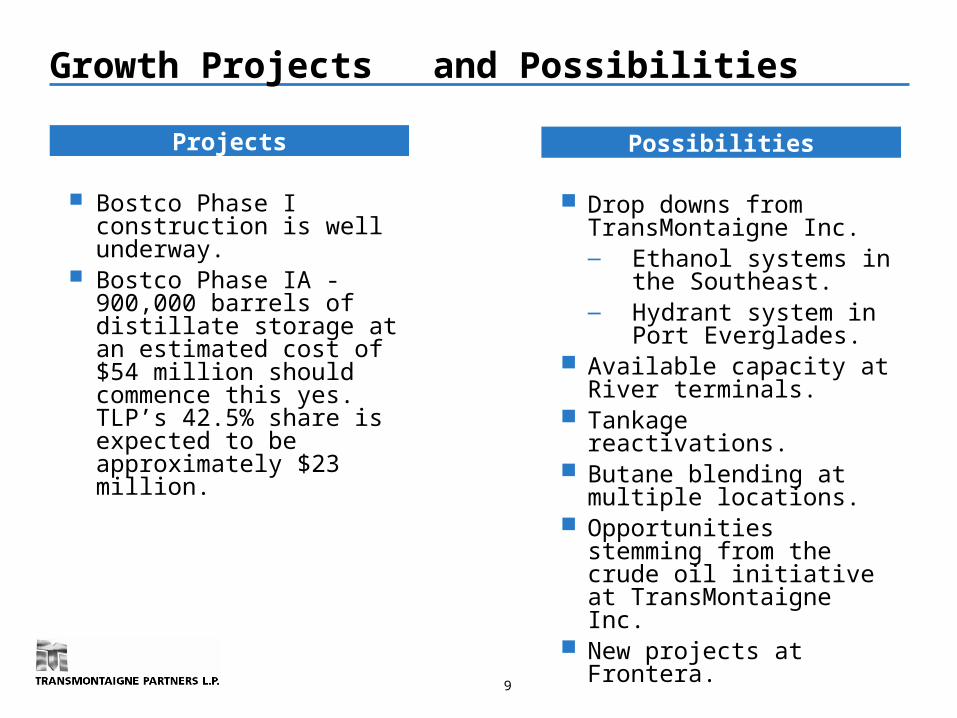
Growth Projects and Possibilities
Bostco Phase I construction is well underway.
Bostco Phase IA - 900,000 barrels of distillate storage at an estimated cost of $54 million should commence this yes. TLP’s 42.5% share is expected to be approximately $23 million.
Drop downs from TransMontaigne Inc.― Ethanol systems in the
Southeast.― Hydrant system in Port
Everglades. Available capacity at River
terminals. Tankage reactivations. Butane blending at multiple
locations. Opportunities stemming from
the crude oil initiative at TransMontaigne Inc.
New projects at Frontera.
Projects Possibilities
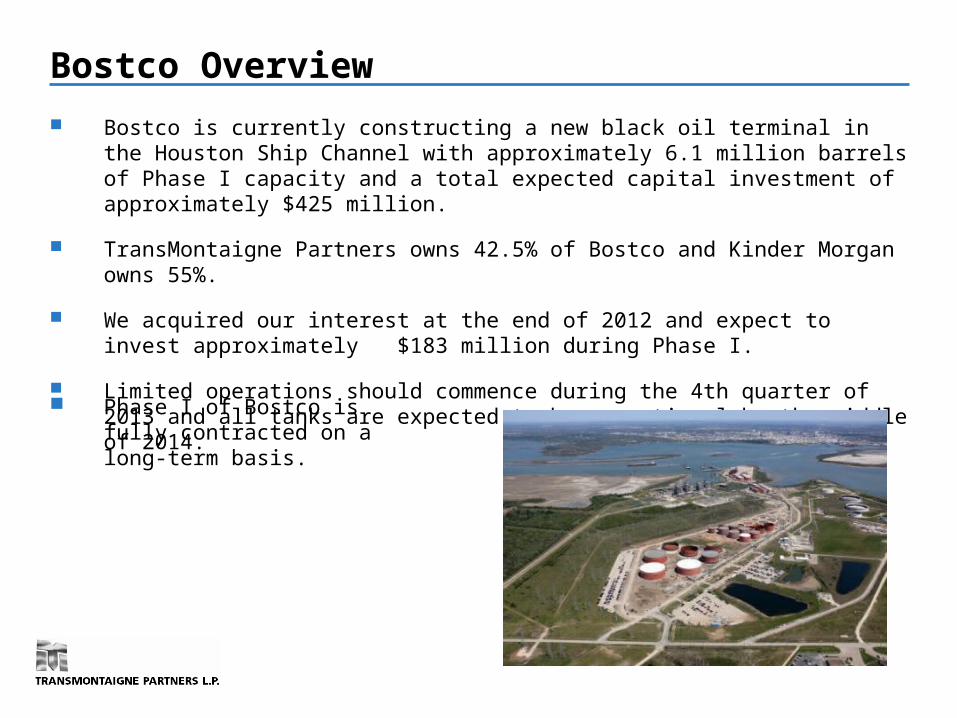
Bostco Overview
Bostco is currently constructing a new black oil terminal in the Houston Ship Channel with approximately 6.1 million barrels of Phase I capacity and a total expected capital investment of approximately $425 million.
TransMontaigne Partners owns 42.5% of Bostco and Kinder Morgan owns 55%.
We acquired our interest at the end of 2012 and expect to invest approximately $183 million during Phase I.
Limited operations should commence during the 4th quarter of 2013 and all tanks are expected to be operational by the middle of 2014.
Phase I of Bostco is fully contracted on a long-term basis.
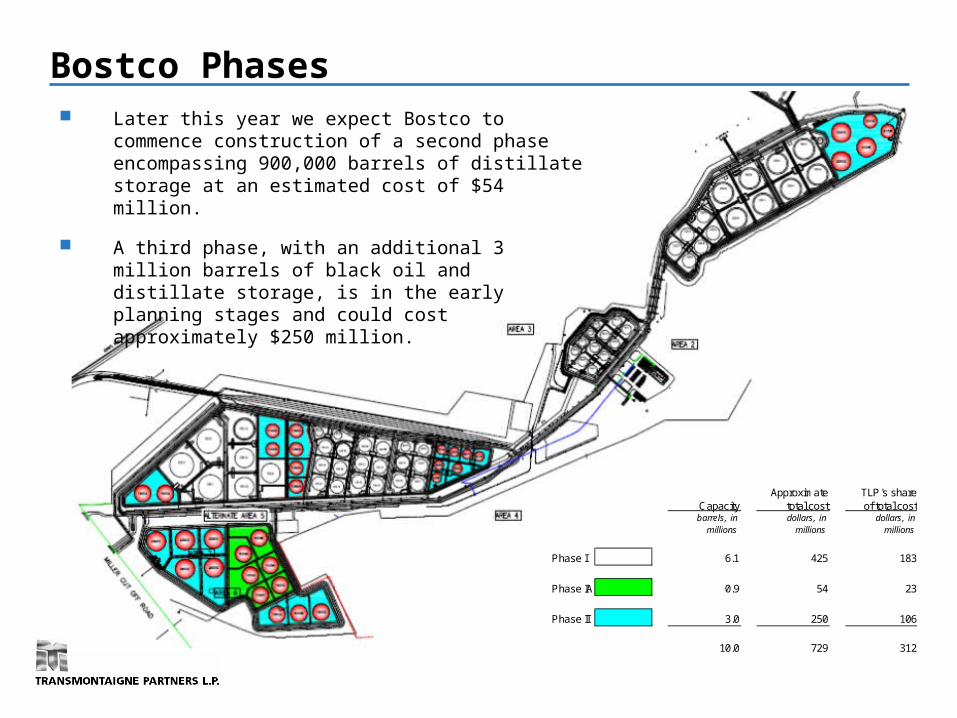
Bostco Phases
Approximate TLP's shareCapacity total cost of total costbarrels, in dollars, in dollars, in
millions millions millions
Phase I 6.1 425 183
Phase IA 0.9 54 23
Phase II 3.0 250 106
10.0 729 312
Later this year we expect Bostco to commence construction of a second phase encompassing 900,000 barrels of distillate storage at an estimated cost of $54 million.
A third phase, with an additional 3 million barrels of black oil and distillate storage, is in the early planning stages and could cost approximately $250 million.
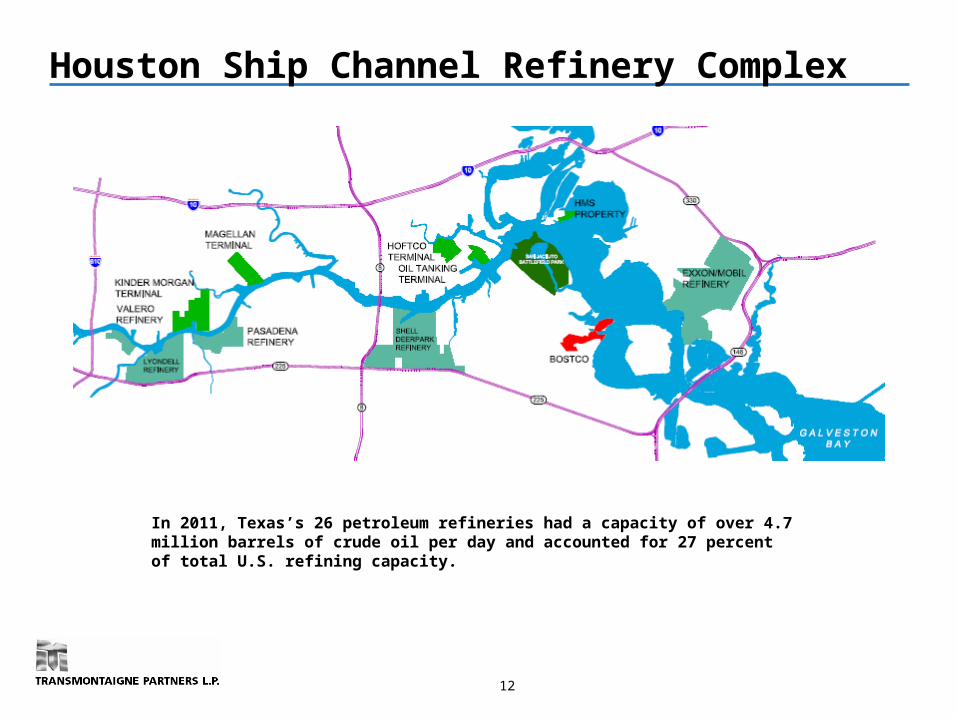
Houston Ship Channel Refinery Complex
12
In 2011, Texas’s 26 petroleum refineries had a capacity of over 4.7 million barrels of crude oil per day and accounted for 27 percent of total U.S. refining capacity.

Bostco Advantages Its location and design will make Bostco highly competitive.
The deep water docks are designed to maximize loading and unloading efficiency, which is a common problem at competing terminals.
The tanks are configured for optimum utilization and minimal interface/product regrades thereby reducing costs for customers.
Market analysis indicates that key global fuel oil deficit markets will continue to be supplied on a long haul basis from the US Gulf Coast.
Bostco is well positioned to meet this increasing demand for export capacity.
Financial Update

Consistent Performance
Historical EBITDA Historical Leverage
Distributable Cash Flow Capital Expenditures
15
($ in millions)
($ in millions) ($ in millions)
$60
$69 $69
$72
2009 2010 2011 2012
$44
$53 $53 $58
$33 $38 $40
$42
2009 2010 2011 2012
Cushion Actual Distributions
$30$35
$47
$96
2009 2010 2011 2012
Acquisitions/ Expansion/ I nvestments Maintenance
$38$43
$55
$104
2.7x
1.8x 1.7x
2.6x Historical Avg. of 2.2x
2009 2010 2011 2012

Insulation from Commodity Price Volitility
16
$1.00
$1.50
$2.00
$2.50
$3.00
$3.50
$-
$5.0
$10.0
$15.0
$20.0
$25.0
$30.0
$35.0
$40.0
$45.0 M
ar-0
8
Jun-
08
Sep-
08
Dec
-08
Mar
-09
Jun-
09
Sep-
09
Dec
-09
Mar
-10
Jun-
10
Sep-
10
Dec
-10
Mar
-11
Jun-
11
Sep-
11
Dec
-11
Mar
-12
Jun-
12
Sep-
12
Dec
-12
Mar
-13
Ga
so
lin
e P
ric
e
TL
P's
Re
ve
nu
e (i
n m
illio
ns
)
TLP's Revenue
Gasoline

17
Results of Operations
Mar. 31, 2012
June 30, 2012
Sept. 30, 2012
Dec. 31, 2012
Mar. 31, 2013
Revenue:Terminaling services fees, net 29,288$ 29,322$ 30,167$ 30,688$ 30,725$ Pipeline transportation fees 1,527 1,199 1,268 1,662 1,988 Management fees and reimbursed costs 1,455 1,288 1,531 1,532 1,805 Other 6,563 6,633 5,908 6,208 7,080
Total revenue 38,833 38,442 38,874 40,090 41,598
Direct operating costs and expenses (13,969) (16,184) (16,170) (19,641) (16,728)
Net operating margins 24,864 22,258 22,704 20,449 24,870
G&A, depreciation, gains and other, net (13,916) (9,732) (12,004) (12,480) (12,410) Operating income 10,948 12,526 10,700 7,969 12,460
Other expenses, net (806) (872) (847) (1,046) (922)
Net earnings 10,142$ 11,654$ 9,853$ 6,923$ 11,538$
Three Months Ended (in thousands)

18
Structure of Terminaling Services Agreements
Mar. 31, 2012
June 30, 2012
Sept. 30, 2012
Dec. 31, 2012
Mar. 31, 2013
Firm commitments:Terminaling services fees, net:
External customers 7,805$ 7,999$ 8,300$ 8,308$ 8,641$ Affiliates 20,762 20,681 21,345 21,559 21,384
Total firm commitments 28,567 28,680 29,645 29,867 30,025
Variable:Terminaling services fees, net:
External customers 728 695 562 829 756 Affiliates (7) (53) (40) (8) (56)
721 642 522 821 700 Pipeline transportation fees 1,527 1,199 1,268 1,662 1,988 Management fees and reimbursed costs 1,455 1,288 1,531 1,532 1,805 Other 6,563 6,633 5,908 6,208 7,080
Total variable 10,266 9,762 9,229 10,223 11,573
Total revenue 38,833$ 38,442$ 38,874$ 40,090$ 41,598$
Firm commitments 73.6% 74.6% 76.3% 74.5% 72.2%Variable 26.4% 25.4% 23.7% 25.5% 27.8%
100.0% 100.0% 100.0% 100.0% 100.0%
Three Months Ended (in thousands)
19
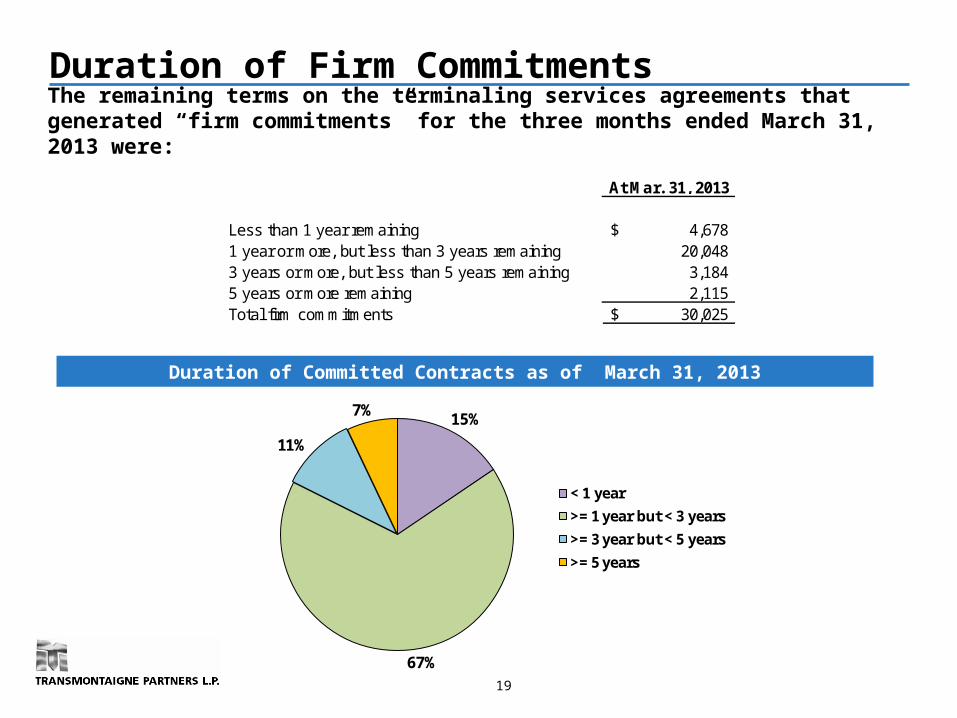
Duration of Firm Commitments
The remaining terms on the terminaling services agreements that generated “firm commitments” for the three months ended March 31, 2013 were:
Duration of Committed Contracts as of March 31, 2013
At Mar. 31, 2013
Less than 1 year remaining 4,678$ 1 year or more, but less than 3 years remaining 20,048 3 years or more, but less than 5 years remaining 3,184 5 years or more remaining 2,115 Total firm commitments 30,025$
15%
67%
11%
7%
< 1 year
>= 1 year but < 3 years
>= 3 year but < 5 years
>= 5 years
20
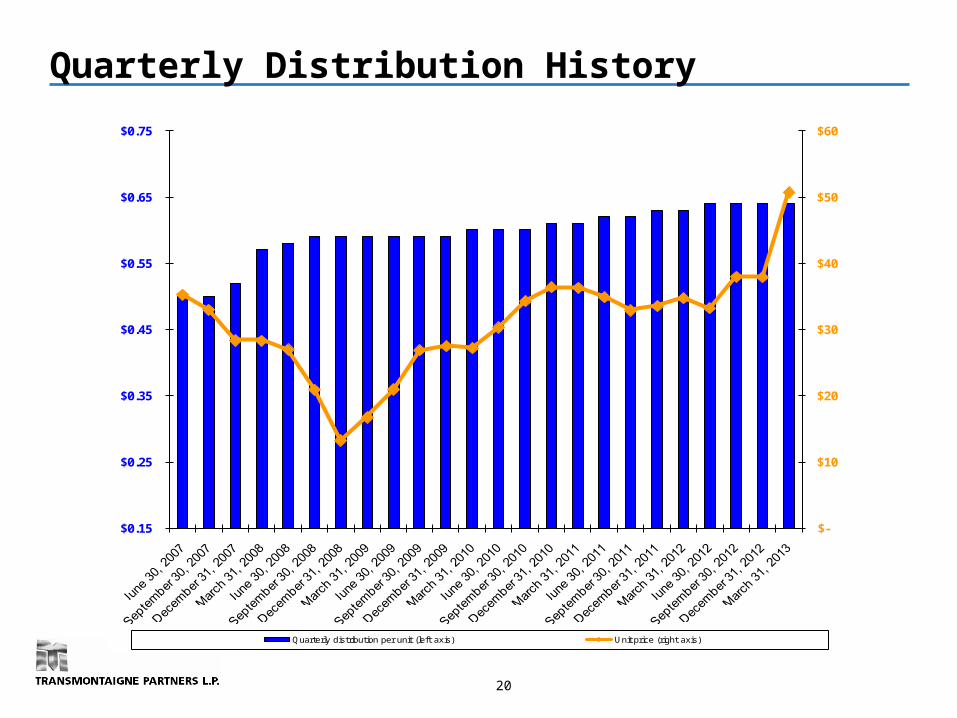
Quarterly Distribution History
(1)
$-
$10
$20
$30
$40
$50
$60
$0.15
$0.25
$0.35
$0.45
$0.55
$0.65
$0.75
Quarterly distribution per unit (left axis) Unit price (right axis)
21
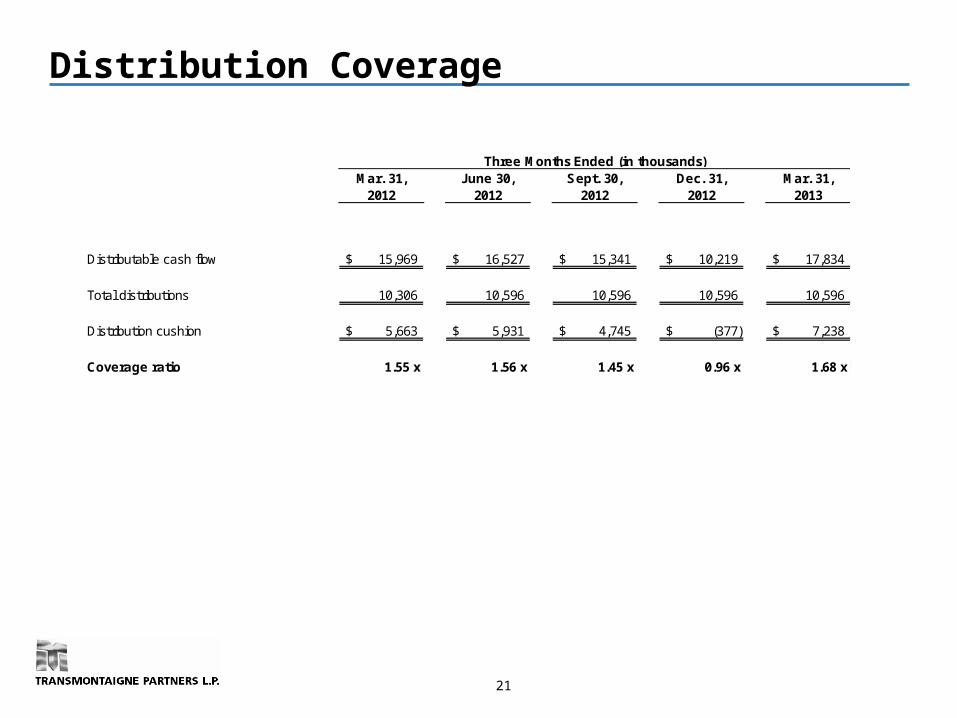
Distribution Coverage
Mar. 31, 2012
June 30, 2012
Sept. 30, 2012
Dec. 31, 2012
Mar. 31, 2013
Distributable cash flow 15,969$ 16,527$ 15,341$ 10,219$ 17,834$
Total distributions 10,306 10,596 10,596 10,596 10,596
Distribution cushion 5,663$ 5,931$ 4,745$ (377)$ 7,238$
Coverage ratio 1.55 x 1.56 x 1.45 x 0.96 x 1.68 x
Three Months Ended (in thousands)
22
1st Quarter 2013 Financial Performance
Distributable cash flow of $17.8 million as compared to $16.0 million for the year-ago quarter. The $17.8 million is an all-time quarterly high for TransMontaigne Partners L.P.
Revenue of $41.6 million as compared to $38.8 million for the year-ago quarter.
Direct operating costs and expenses of $16.7 million as compared to $14.0 million for the year-ago quarter.
Quarterly distribution per limited partner unit of $0.64 as compared to $0.63 per unit for the year-ago quarter.
Distribution cushion of 1.68x.
Leverage ratio of debt to EBITDA of 3.35x.

23
Liquidity and Capital Resources
Our credit facility provides for a maximum borrowing line of credit equal to $350 million, and allows us to make up to $300 million of investments in Bostco. At March 31, 2013, our outstanding borrowings were $246 million, and our investments in the Bostco construction project were approximately $136 million.
At March 31, 2013, the remaining expenditures to complete the approved additional investments and expansion capital projects are estimated to be approximately $50 million, which most all of this is committed to Bostco. We expect to fund our additional investments and capital expenditures with borrowings under our credit facility.

Key Considerations
High Quality,
Diversified Assets
Unique
Operating Platform
Strong
Financial Profile
Leading presence in five core geographic regions. Term contracts with high-quality industry participants. Focus on fee-based contracts with commitments. Limited direct commodity price exposure.
Strong financial profile.― Average historical Leverage Ratio of 2.2x over the past
four fiscal years (Debt to EBITDA).― At March 31, 2013 unused borrowing capacity of $104
million. Distribution coverage for 2012, 2011, 2010, and 2009 of
38%, 33%, 39% and 33%, respectively.
Experienced and proven management team and board. Half of the board consists of independent directors. Integrated platform capitalizing on strengths of TLP,
TMG and MSCG.
24

Appendix

26
Gulf Coast Terminal Operations
Terminal locations include Port Everglades North, Port Everglades South, Jacksonville, Cape Canaveral, Port Manatee, Fisher Island, Tampa and Pensacola.
― Total active storage capacity of 6.9 million barrels.
― Supply modes include vessel, truck and rail.
― Delivery modes include pipeline, truck, rail and vessel.
― Products handled include gasoline, distillate, residual fuel oil, asphalt, jet fuel, crude oil, bio-diesel and marine fuel.
There are no major product supply pipelines into Florida and no refineries within Florida.
The Florida market has a diversity of supply alternatives (Europe, Gulf Coast, Caribbean and Latin America).
― Ports served are among the busiest cruise ship ports in the nation.
― Significant customers include MSCG and Marathon.
27
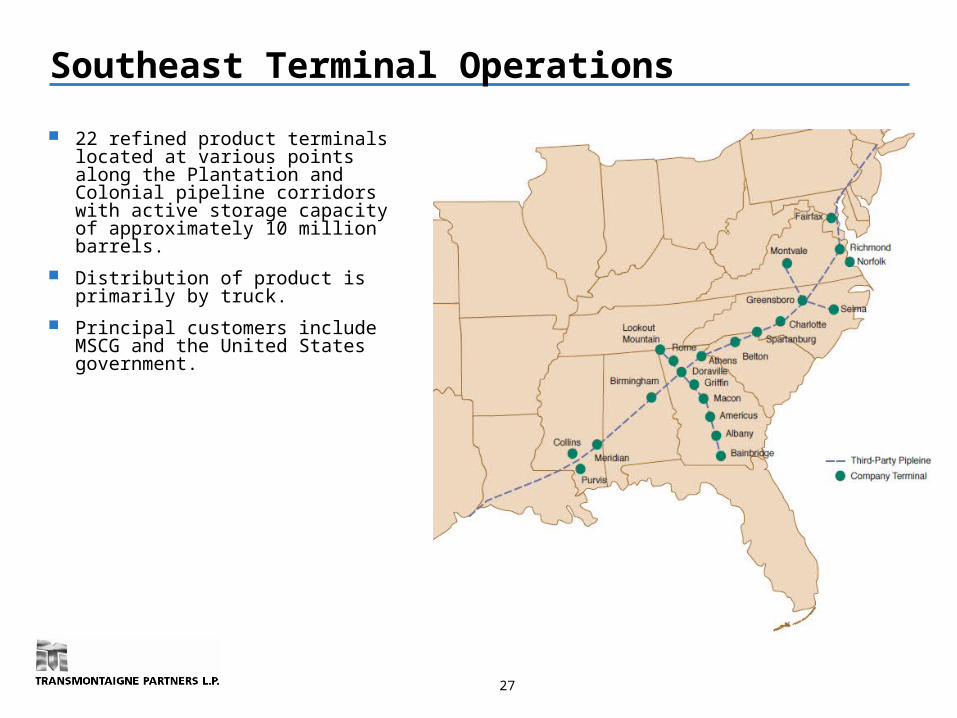
Southeast Terminal Operations
22 refined product terminals located at various points along the Plantation and Colonial pipeline corridors with active storage capacity of approximately 10 million barrels.
Distribution of product is primarily by truck.
Principal customers include MSCG and the United States government.

28
Brownsville Terminal Operations Brownsville is ideally located to handle liquid products movements between the Gulf of Mexico, northern
Mexico and the United States. Products handled include gasoline, diesel, condensate, VGO, LPG, asphalt, lube oil, wax, vegetable oil and
chemicals. Operations at Brownsville include managing and operating a pipeline between Brownsville and Cadereyta on
behalf of PMI, an affiliate of Mexico’s state-owned energy company, PEMEX. Supply and delivery modes include vessel, pipeline, truck and rail. On April 1, 2011, formed a 50/50 JV with PMI (a/k/a Frontera) with approximately 1.5 million barrels of light
product tankage in Brownsville. Received proceeds from PMI of $25.6 million. TLP operates 100% of the terminal including Frontera. The JV helps secure our customer relationship with PMI and aligns interests on future development and expansion at the Port of Brownsville.
Total active storage capacity of 2.4 million barrels (including Frontera).
29
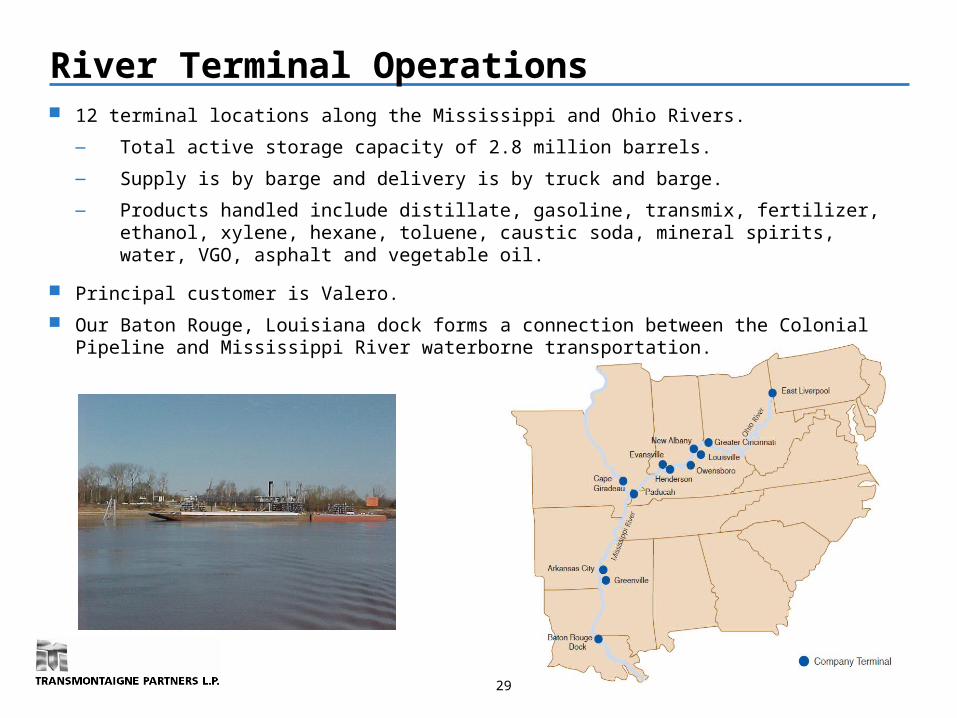
River Terminal Operations 12 terminal locations along the Mississippi and Ohio Rivers.
― Total active storage capacity of 2.8 million barrels.
― Supply is by barge and delivery is by truck and barge.
― Products handled include distillate, gasoline, transmix, fertilizer, ethanol, xylene, hexane, toluene, caustic soda, mineral spirits, water, VGO, asphalt and vegetable oil.
Principal customer is Valero.
Our Baton Rouge, Louisiana dock forms a connection between the Colonial Pipeline and Mississippi River waterborne transportation.
30
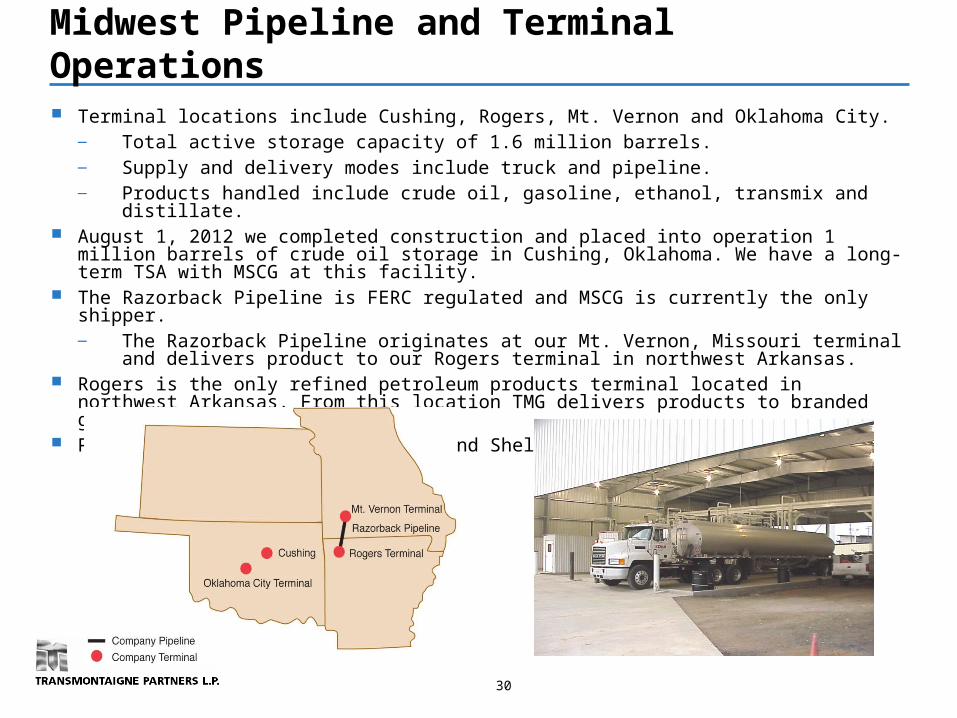
Midwest Pipeline and Terminal Operations Terminal locations include Cushing, Rogers, Mt. Vernon and Oklahoma City.
― Total active storage capacity of 1.6 million barrels.― Supply and delivery modes include truck and pipeline.― Products handled include crude oil, gasoline, ethanol, transmix and distillate.
August 1, 2012 we completed construction and placed into operation 1 million barrels of crude oil storage in Cushing, Oklahoma. We have a long-term TSA with MSCG at this facility.
The Razorback Pipeline is FERC regulated and MSCG is currently the only shipper.― The Razorback Pipeline originates at our Mt. Vernon, Missouri terminal and delivers product to
our Rogers terminal in northwest Arkansas. Rogers is the only refined petroleum products terminal located in northwest Arkansas. From this
location TMG delivers products to branded gasoline retailers. Principal customers include MSCG and Shell Oil Products U.S.
31
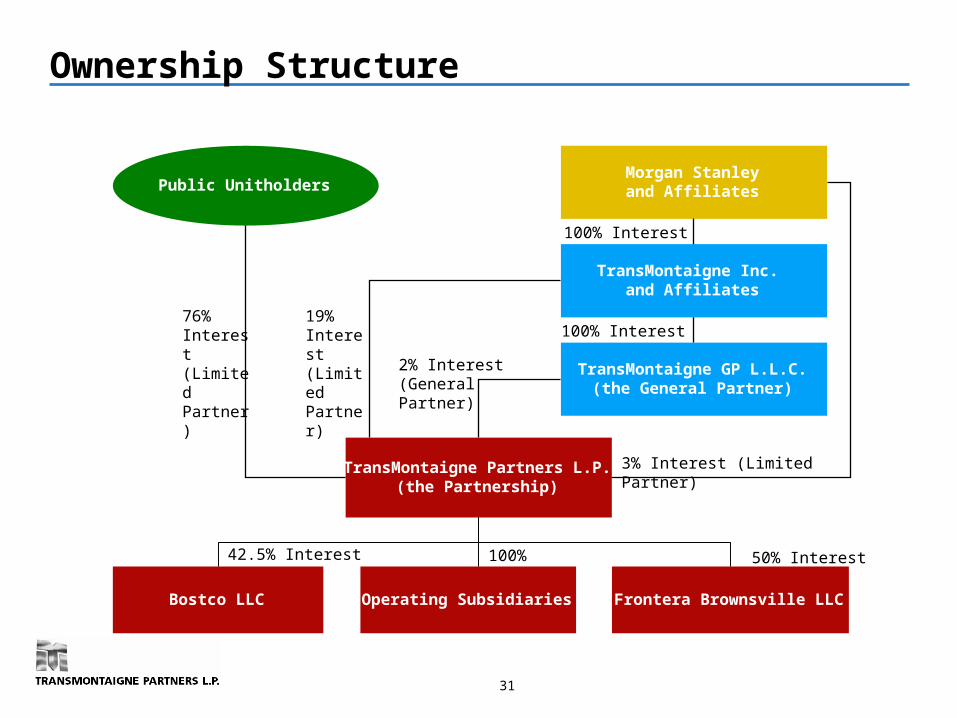
Ownership Structure
100% Interest
Morgan Stanleyand Affiliates
TransMontaigne GP L.L.C.(the General Partner)
Public Unitholders
76% Interest (LimitedPartner)
TransMontaigne Inc. and Affiliates
100% Interest
3% Interest (Limited Partner)
2% Interest (GeneralPartner)
100% Interest
19% Interest (LimitedPartner)
50% Interest
Operating Subsidiaries
TransMontaigne Partners L.P.(the Partnership)
Bostco LLC Frontera Brownsville LLC
42.5% Interest
32
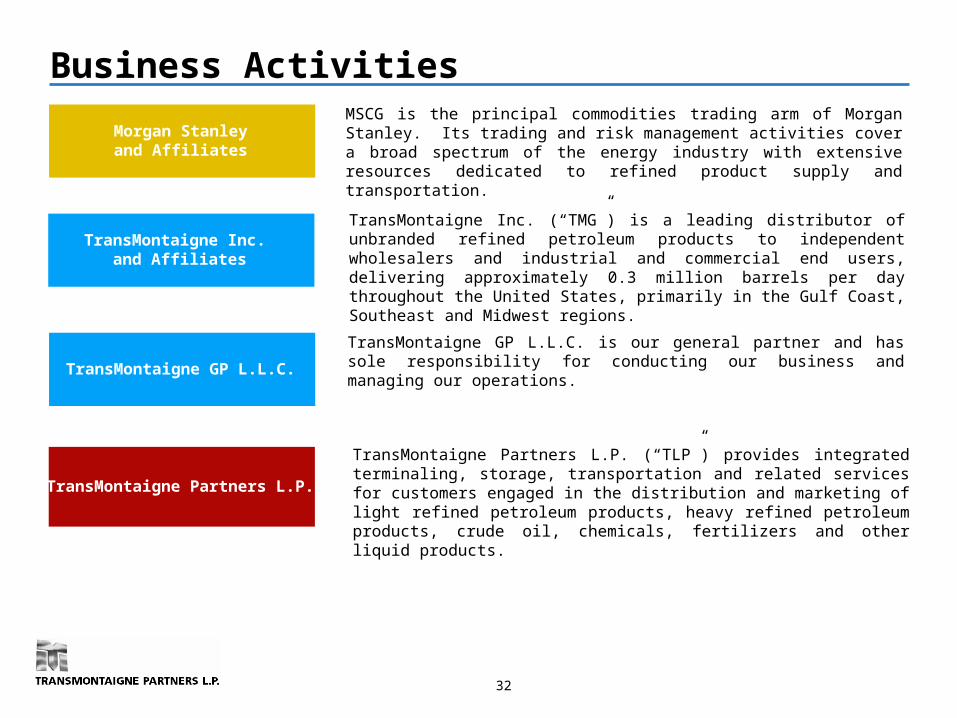
Business Activities
Morgan Stanleyand Affiliates
TransMontaigne GP L.L.C.
TransMontaigne Partners L.P.
TransMontaigne Inc. and Affiliates
MSCG is the principal commodities trading arm of Morgan Stanley. Its trading and risk management activities cover a broad spectrum of the energy industry with extensive resources dedicated to refined product supply and transportation.
TransMontaigne Inc. (“TMG”) is a leading distributor of unbranded refined petroleum products to independent wholesalers and industrial and commercial end users, delivering approximately 0.3 million barrels per day throughout the United States, primarily in the Gulf Coast, Southeast and Midwest regions.
TransMontaigne GP L.L.C. is our general partner and has sole responsibility for conducting our business and managing our operations.
TransMontaigne Partners L.P. (“TLP”) provides integrated terminaling, storage, transportation and related services for customers engaged in the distribution and marketing of light refined petroleum products, heavy refined petroleum products, crude oil, chemicals, fertilizers and other liquid products.
33
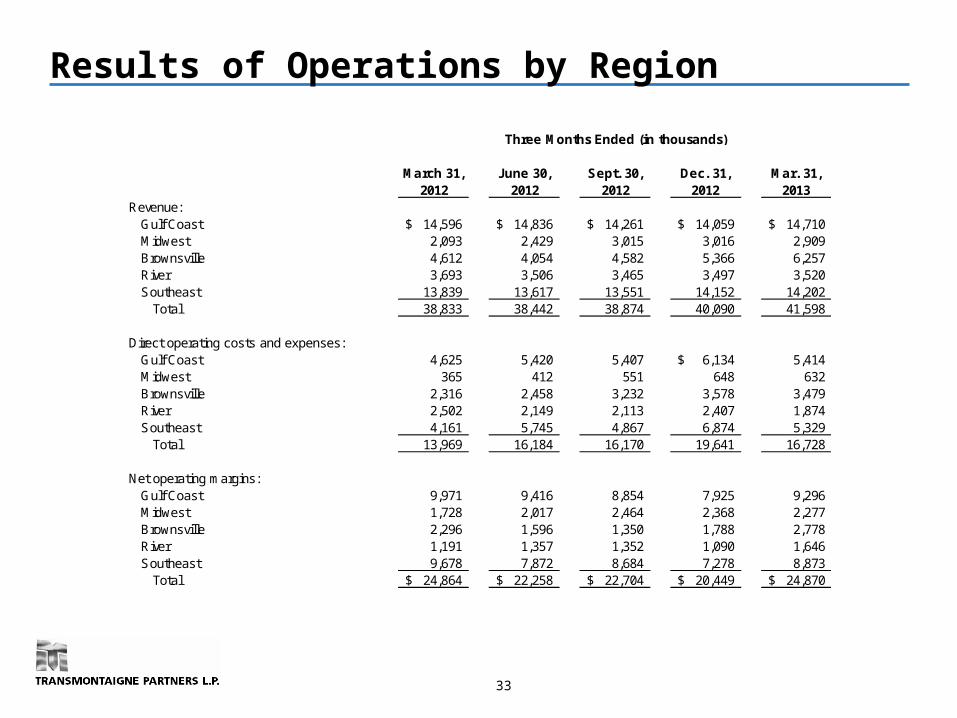
Results of Operations by Region
March 31, 2012
June 30, 2012
Sept. 30, 2012
Dec. 31, 2012
Mar. 31, 2013
Revenue:Gulf Coast 14,596$ 14,836$ 14,261$ 14,059$ 14,710$ Midwest 2,093 2,429 3,015 3,016 2,909 Brownsville 4,612 4,054 4,582 5,366 6,257 River 3,693 3,506 3,465 3,497 3,520 Southeast 13,839 13,617 13,551 14,152 14,202
Total 38,833 38,442 38,874 40,090 41,598
Direct operating costs and expenses:Gulf Coast 4,625 5,420 5,407 6,134$ 5,414 Midwest 365 412 551 648 632 Brownsville 2,316 2,458 3,232 3,578 3,479 River 2,502 2,149 2,113 2,407 1,874 Southeast 4,161 5,745 4,867 6,874 5,329
Total 13,969 16,184 16,170 19,641 16,728
Net operating margins:Gulf Coast 9,971 9,416 8,854 7,925 9,296 Midwest 1,728 2,017 2,464 2,368 2,277 Brownsville 2,296 1,596 1,350 1,788 2,778 River 1,191 1,357 1,352 1,090 1,646 Southeast 9,678 7,872 8,684 7,278 8,873
Total 24,864$ 22,258$ 22,704$ 20,449$ 24,870$
Three Months Ended (in thousands)
34
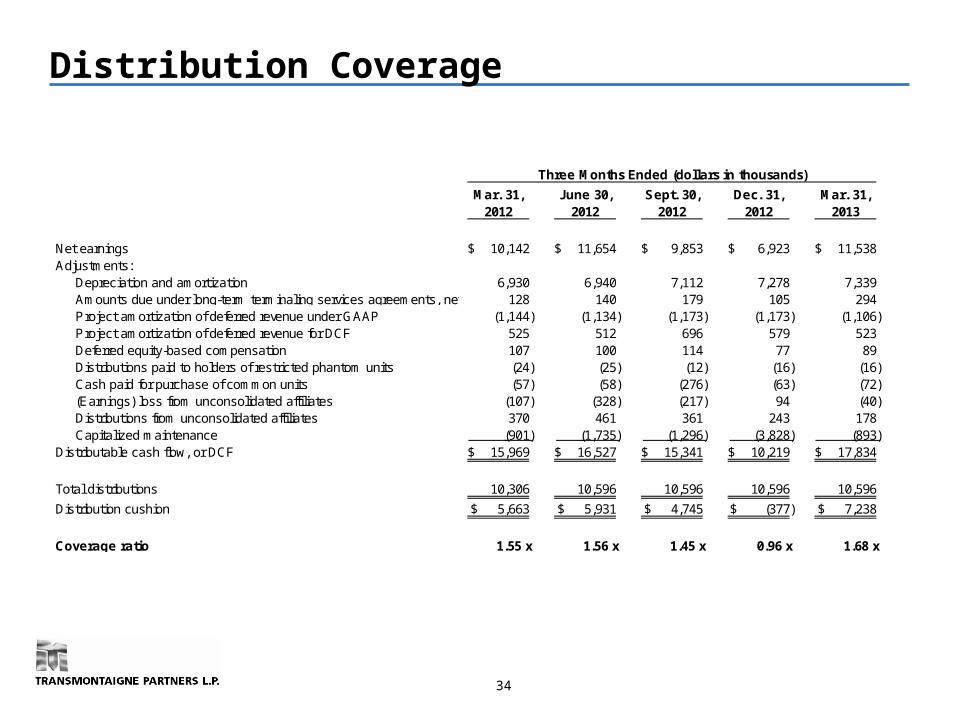
Distribution Coverage
Mar. 31, June 30, Sept. 30, Dec. 31, Mar. 31,2012 2012 2012 2012 2013
Net earnings 10,142$ 11,654$ 9,853$ 6,923$ 11,538$ Adjustments:
Depreciation and amortization 6,930 6,940 7,112 7,278 7,339 Amounts due under long-term terminaling services agreements, net 128 140 179 105 294 Project amortization of deferred revenue under GAAP (1,144) (1,134) (1,173) (1,173) (1,106) Project amortization of deferred revenue for DCF 525 512 696 579 523 Deferred equity-based compensation 107 100 114 77 89 Distributions paid to holders of restricted phantom units (24) (25) (12) (16) (16) Cash paid for purchase of common units (57) (58) (276) (63) (72) (Earnings) loss from unconsolidated affiliates (107) (328) (217) 94 (40) Distributions from unconsolidated affiliates 370 461 361 243 178 Capitalized maintenance (901) (1,735) (1,296) (3,828) (893)
Distributable cash flow, or DCF 15,969$ 16,527$ 15,341$ 10,219$ 17,834$
Total distributions 10,306 10,596 10,596 10,596 10,596
Distribution cushion 5,663$ 5,931$ 4,745$ (377)$ 7,238$
Coverage ratio 1.55 x 1.56 x 1.45 x 0.96 x 1.68 x
Three Months Ended (dollars in thousands)


