Download - Transit Service Guidelines
2019 New Transit Service Plan
VTA Board of DirectorsJanuary 2019
Agenda Item 7.2
Draft Proposal
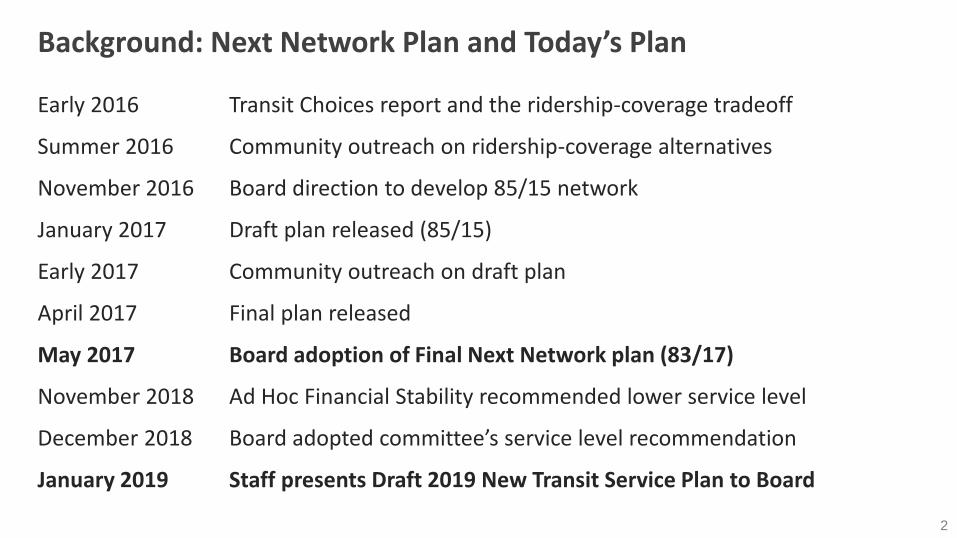
Background: Next Network Plan and Today’s Plan
2
Early 2016 Transit Choices report and the ridership-coverage tradeoff
Summer 2016 Community outreach on ridership-coverage alternatives
November 2016 Board direction to develop 85/15 network
January 2017 Draft plan released (85/15)
Early 2017 Community outreach on draft plan
April 2017 Final plan released
May 2017 Board adoption of Final Next Network plan (83/17)
November 2018 Ad Hoc Financial Stability recommended lower service level
December 2018 Board adopted committee’s service level recommendation
January 2019 Staff presents Draft 2019 New Transit Service Plan to Board
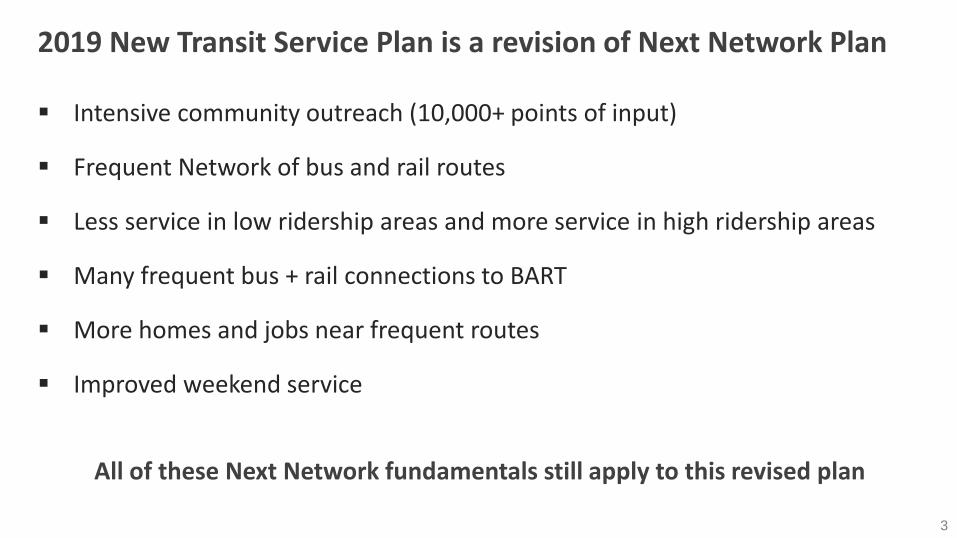
2019 New Transit Service Plan is a revision of Next Network Plan
3
▪ Intensive community outreach (10,000+ points of input)
▪ Frequent Network of bus and rail routes
▪ Less service in low ridership areas and more service in high ridership areas
▪ Many frequent bus + rail connections to BART
▪ More homes and jobs near frequent routes
▪ Improved weekend service
All of these Next Network fundamentals still apply to this revised plan
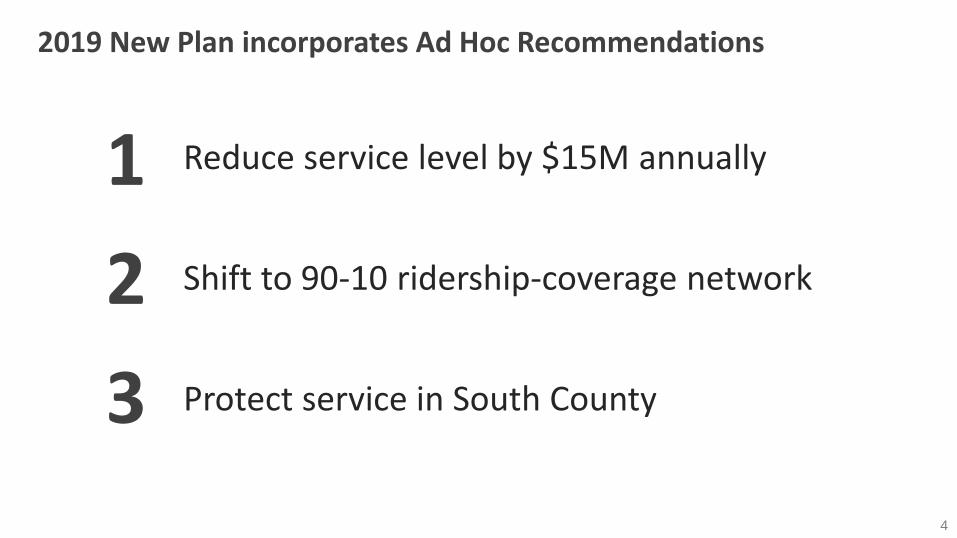
2019 New Plan incorporates Ad Hoc Recommendations
4
Reduce service level by $15M annually
Shift to 90-10 ridership-coverage network
Protect service in South County
1
2
3

Annual Service Levels
5
Current Service
1.52 Mbus hours
156,000rail hours
70/30ridership/coverage
2019 New Plan
1.49 Mbus hours
172,000rail hours
90/10ridership/coverage
Next Network
1.60 Mbus hours
192,000rail hours
83/17ridership/coverage
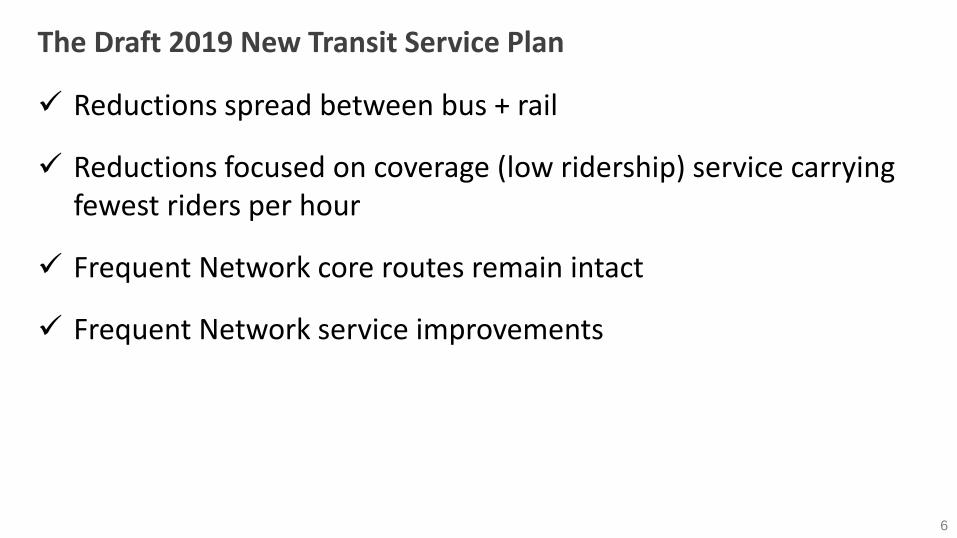
The Draft 2019 New Transit Service Plan
6
✓ Reductions spread between bus + rail
✓ Reductions focused on coverage (low ridership) service carrying fewest riders per hour
✓ Frequent Network core routes remain intact
✓ Frequent Network service improvements

Draft 2019 Proposed Light Rail Service
7
Orange Line retained from Next Network
Green Line retained from Next Network
Blue Line shortened to Baypointe
Almaden Line replaced with bus
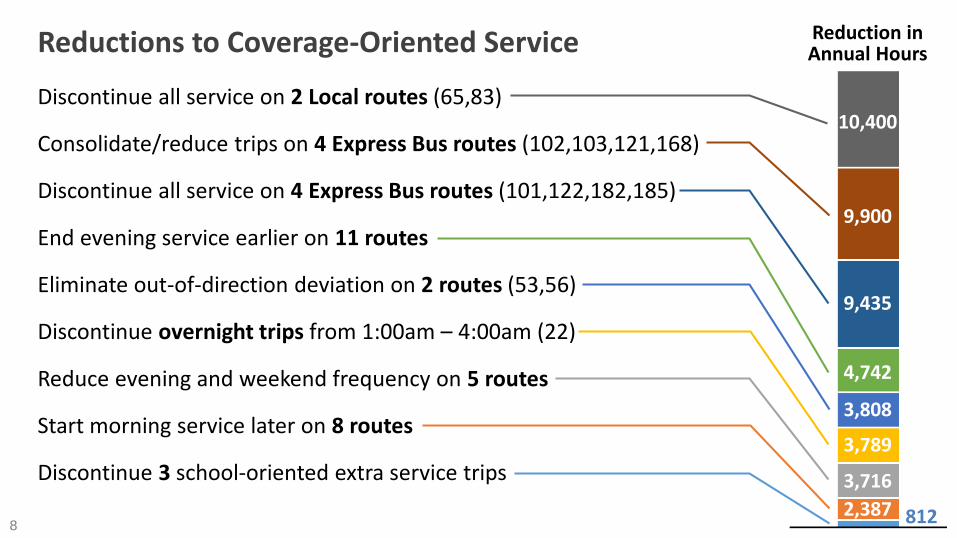
Reductions to Coverage-Oriented Service
8
Discontinue all service on 2 Local routes (65,83)
Consolidate/reduce trips on 4 Express Bus routes (102,103,121,168)
Discontinue all service on 4 Express Bus routes (101,122,182,185)
End evening service earlier on 11 routes
Eliminate out-of-direction deviation on 2 routes (53,56)
Discontinue overnight trips from 1:00am – 4:00am (22)
Reduce evening and weekend frequency on 5 routes
Start morning service later on 8 routes
Discontinue 3 school-oriented extra service trips
Reduction inAnnual Hours
10,400
9,900
9,435
4,742
3,808
3,789
3,716
2,387 812
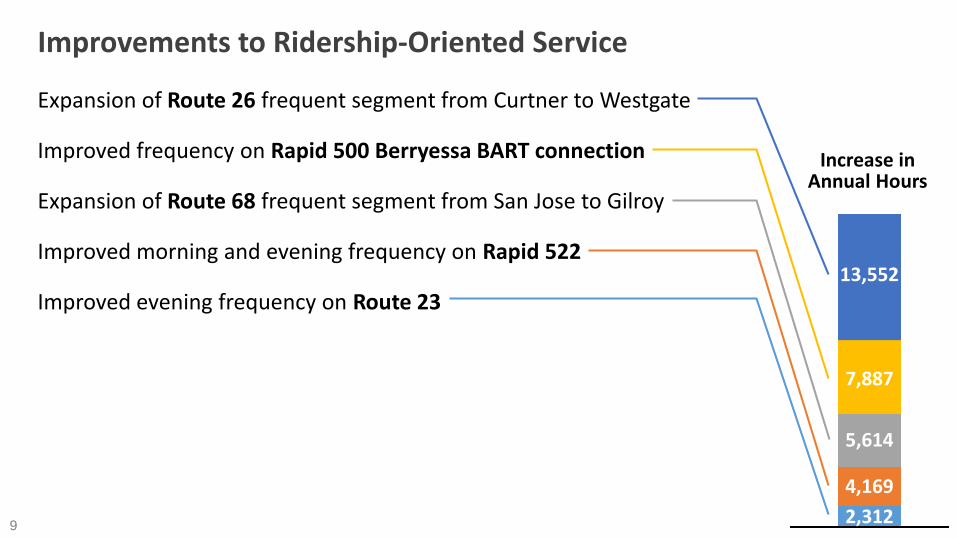
Improvements to Ridership-Oriented Service
9
Expansion of Route 26 frequent segment from Curtner to Westgate
Improved frequency on Rapid 500 Berryessa BART connection
Expansion of Route 68 frequent segment from San Jose to Gilroy
Improved morning and evening frequency on Rapid 522
Improved evening frequency on Route 23
Increase inAnnual Hours
13,552
7,887
5,614
4,169
2,312
10
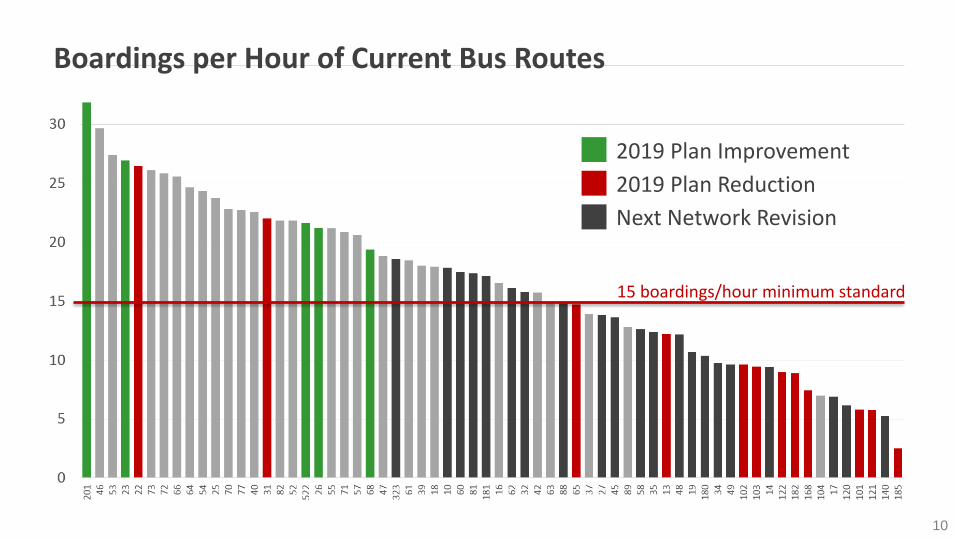
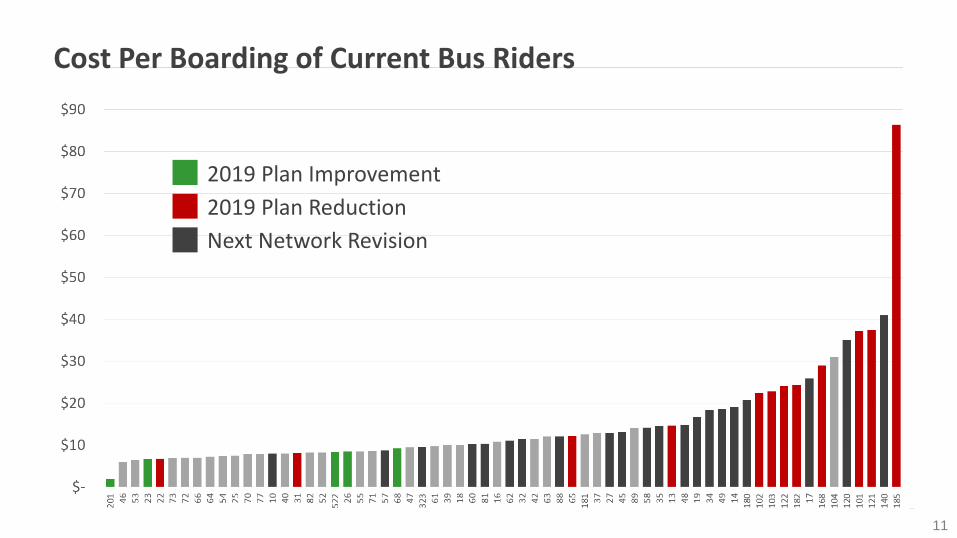
Boardings per Hour of Current Bus Routes
2019 Plan Improvement
2019 Plan Reduction
Next Network Revision
15 boardings/hour minimum standard
11
Cost Per Boarding of Current Bus Riders
2019 Plan Improvement
2019 Plan Reduction
Next Network Revision

Projected Cost and Ridership
4% lower cost than Next Network Plan
1% less boardings than Next Network Plan
7-9% more boardings than Current Plan
12
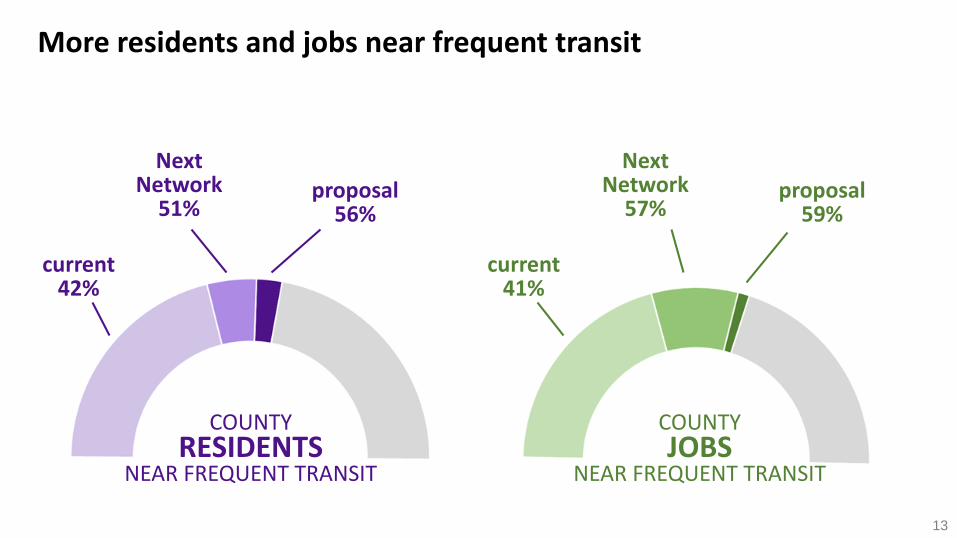
COUNTY RESIDENTS
NEAR FREQUENT TRANSIT
More residents and jobs near frequent transit
13
COUNTY JOBS
NEAR FREQUENT TRANSIT
current42%
NextNetwork
51%proposal
56%
current41%
NextNetwork
57%proposal
59%
FYI you could report as absolute values instead of %. The NTSP serves an addtl. 243k residents and 170k jobs over the current
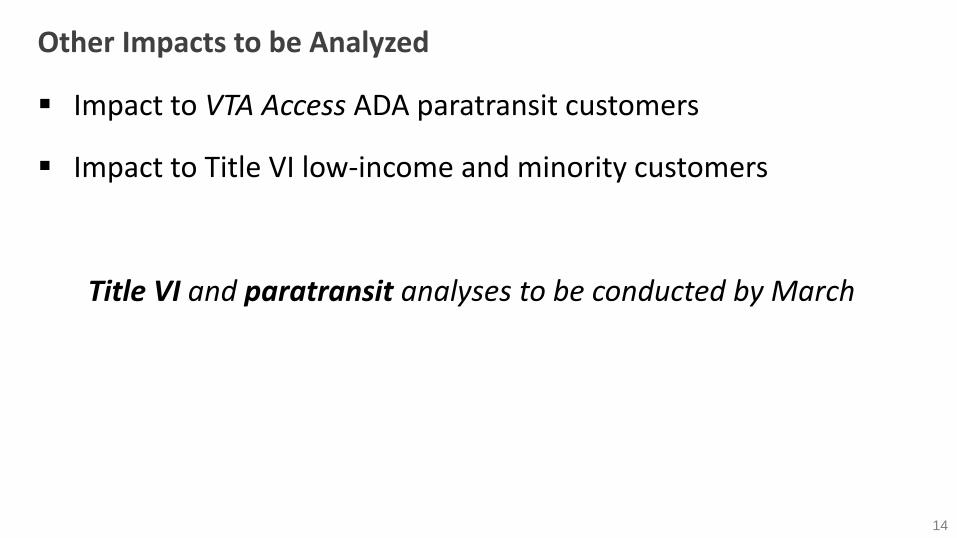
Other Impacts to be Analyzed
14
▪ Impact to VTA Access ADA paratransit customers
▪ Impact to Title VI low-income and minority customers
Title VI and paratransit analyses to be conducted by March
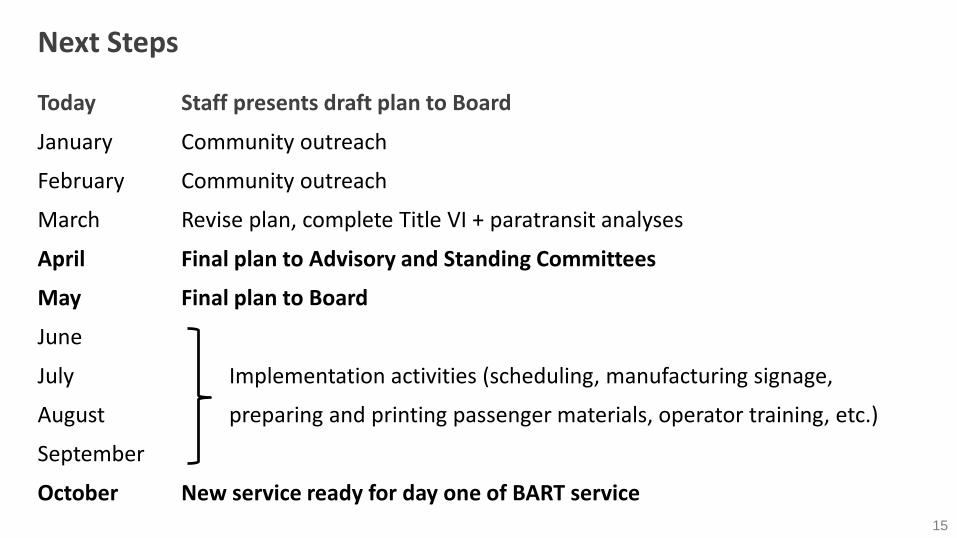
Today Staff presents draft plan to Board
January Community outreach
February Community outreach
March Revise plan, complete Title VI + paratransit analyses
April Final plan to Advisory and Standing Committees
May Final plan to Board
June
July Implementation activities (scheduling, manufacturing signage,
August preparing and printing passenger materials, operator training, etc.)
September
October New service ready for day one of BART service
Next Steps
15

Community Engagement
16
▪ 6 Community meetings
▪ Targeted meetings with impacted stakeholders
▪ Dedicated website for detailed information
▪ Online video presentation
▪ Printed materials on buses + trains
▪ Email blasts, blog posts, VTA website features
ACTION TODAY: staff requests Board approval to proceed andconduct outreach on the proposal

17

18
Original Next NetworkLight Rail Plan

66
54
45
33
28 2827
2625 24 23 23 23 22 22 22 21 21 21 21 20 20 19 19 19 18 18 18 18 17 17
16 15 15 15 15 15 14 14 14 14 14 14 14 13 13 13 12 12 12 11 1110 10 10 9 9 8 8 7 7 7 7 6 6 6
3
Route-by-Route Productivity (Weekday Boardings per Hour)
19
minimum
productivity
standard
Express routes local routes

Productivity for All Nine Express Bus Routes
20
18riders onboard
each bus trip
46%full
(seats occupied)
7.2boardings per
hour
5%farebox
recovery
$27.95cost per boarding
20.5
11% $7.63
VTA local bus
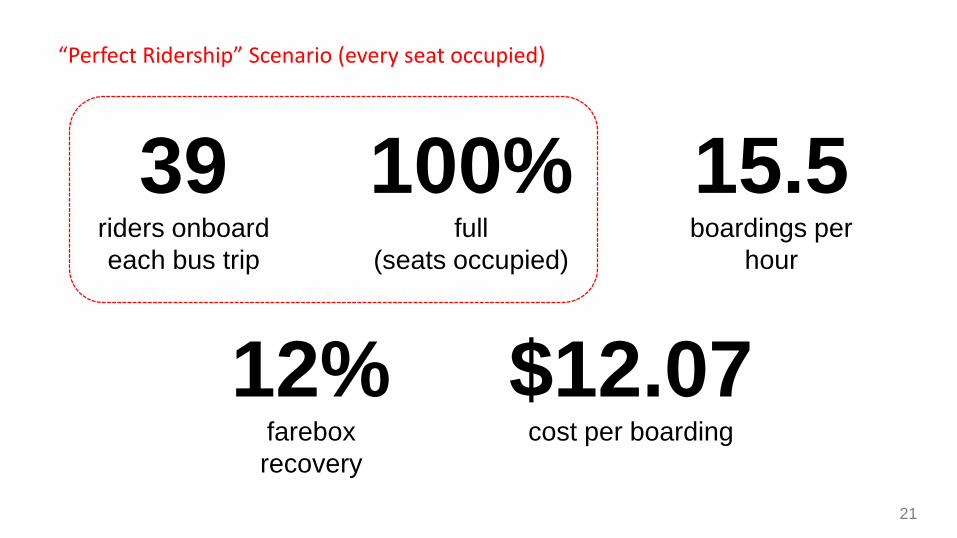
“Perfect Ridership” Scenario (every seat occupied)
21
39riders onboard
each bus trip
100%full
(seats occupied)
15.5boardings per
hour
12%farebox
recovery
$12.07cost per boarding


