
TRANSIENT LIFT-OFF TEST
RESULTS FOR AN EXPERIMENTAL
HYBRID BEARING IN AIR
A Thesis
by
DAVID GREGG KLOOSTER
Submitted to the Office of Graduate Studies of Texas A&M University
in partial fulfillment of the requirements for the degree of
MASTER OF SCIENCE
December 2009
Major Subject: Mechanical Engineering

TRANSIENT LIFT-OFF TEST
RESULTS FOR AN EXPERIMENTAL
HYBRID BEARING IN AIR
A Thesis
by
DAVID GREGG KLOOSTER
Submitted to the Office of Graduate Studies of Texas A&M University
in partial fulfillment of the requirements for the degree of
MASTER OF SCIENCE
Approved by: Chair of Committee, Dara Childs Committee Members, W. Lynn Beason
Alan Palazzolo Head of Department, Dennis O’Neal
December 2009
Major Subject: Mechanical Engineering

iii
ABSTRACT
Transient Lift-off Test Results for an Experimental
Hybrid Bearing in Air. (December 2009)
David Gregg Klooster, B.S., Kettering University
Chair of Advisory Committee: Dr. Dara Childs
A hybrid bearing designed for use in a next generation turbo-pump is evaluated
for the performance of initial lift-off, referred to as start-transient. The radial test rig
features a high-speed spindle motor capable of 20,000 rpm that drives a 718 Inconel rotor
attached via a high-speed coupling. The drive end is supported by ceramic ball bearings,
while the hybrid bearing supports the opposite end. A magnetic bearing delivers the
applied loading along the mid-span of the rotor. Many parameters, including ramp rate
[rpm/s] (drive torque), supply pressure at 15,000 rpm, magnitude of the applied load, and
load orientation, are varied to simulate different start-transient scenarios. The data are
recorded in .dat files for future evaluation of transient predictions.
Analysis of the data includes an evaluation of hydrodynamic and hydrostatic lift-
off, an assessment of rub from passing through a lightly damped critical speed, and
observation of pneumatic hammer instability. Hydrodynamic lift-off occurs when the
hydrodynamic pressure, resulting from the relative motion of two surfaces, overcomes
the forces acting on the rotor; no indication of hydrodynamic lift-off is provided.
Hydrostatic lift-off results from the external supply pressure (which for this test rig is
speed dependent) overcoming the forces acting on the rotor as determined from rotor
centerline plots. With 0.263 bar applied unit load in the vertical direction, hydrostatic
lift-off occurs at 0 rpm and 2.08 bar supply pressure. With a much higher load of 1.53
bar, hydrostatic lift-off is at 12,337 rpm and 10.7 bar supply pressure.
The required supply pressure for hydrostatic lift-off is approximately a linear
function of the applied unit load. In a turbopump, hydrostatic lift-off depends on the
speed because the supply pressure is proportional to the speed squared. With the load in

iv
the horizontal direction, hydrostatic lift-off occurs at lower speeds and pressures. The
ramp rate did not affect the required supply pressure for hydrostatic lift-off. A lower
supply pressure at 15,000 rpm lowered the required supply pressure for hydrostatic lift-
off as well as the natural frequencies creating a rub. The hydrostatic lift-off speed should
be minimized to avoid damage to the rotor/bearing surfaces due to contact.

v
DEDICATION
To my parents, Gregg and Kathy Klooster, who taught me how to work hard, and
gave me all their support and encouragement. To my Lord and Savior, Jesus Christ, who
has given me new life and hope.

vi
ACKNOWLEDGEMENTS
I would like to thank all those who have helped me throughout this process.
Thank you to my friends and family whose advice and encouragement meant so much
when I needed someone to lean on. Thank you to my professors, both undergraduate and
graduate, who took the time to help me learn. A special thanks to those at the
Turbolmachinery Laboratory especially Paul Esser, Roston Elwell, David Mertz, Henry
Borchard, Eddy Denk, Stephen Phillips and many others who gave of their time and
energy to help me. Also, to my committee members Dr. Childs, Dr. Beason, and Dr.
Palazzolo, thank you for your patience and wisdom throughout.

vii
TABLE OF CONTENTS
Page ABSTRACT....................................................................................................................... iii DEDICATION.....................................................................................................................v ACKNOWLEDGEMENTS............................................................................................... vi LIST OF FIGURES ........................................................................................................... ix LIST OF TABLES........................................................................................................... xiii NOMENCLATURE ........................................................................................................ xiv INTRODUCTION ...............................................................................................................1 BACKGROUND .................................................................................................................2 TEST RIG AND HARDWARE ..........................................................................................7 Hybrid Bearing...............................................................................................................8 Fluid Supply Loop .......................................................................................................12 DAQ/Instrumentation ..................................................................................................13 PROPOSED TEST CASES ...............................................................................................15 Ramp Rate and Supply Pressure ..................................................................................15 Applied Load ...............................................................................................................17 EXPERIMENTAL PROCEDURE ....................................................................................20 Alignment Procedure ...................................................................................................20 Bump Test Procedure...................................................................................................20 Start-Transient Procedure ............................................................................................21 TEST RESULTS................................................................................................................22 Start-Transient Predictions...........................................................................................22 Hydrostatic Lift-off ......................................................................................................28 Comparing Forward and Backward 1X Synchronous Amplitudes..............................41 Ramp Rate....................................................................................................................43 Water Versus Air .........................................................................................................46 Bearing Before and After.............................................................................................50

viii
Page CONCLUSIONS................................................................................................................55 REFERENCES ..................................................................................................................57 APPENDIX........................................................................................................................60 VITA..................................................................................................................................75
ix
LIST OF FIGURES
Page
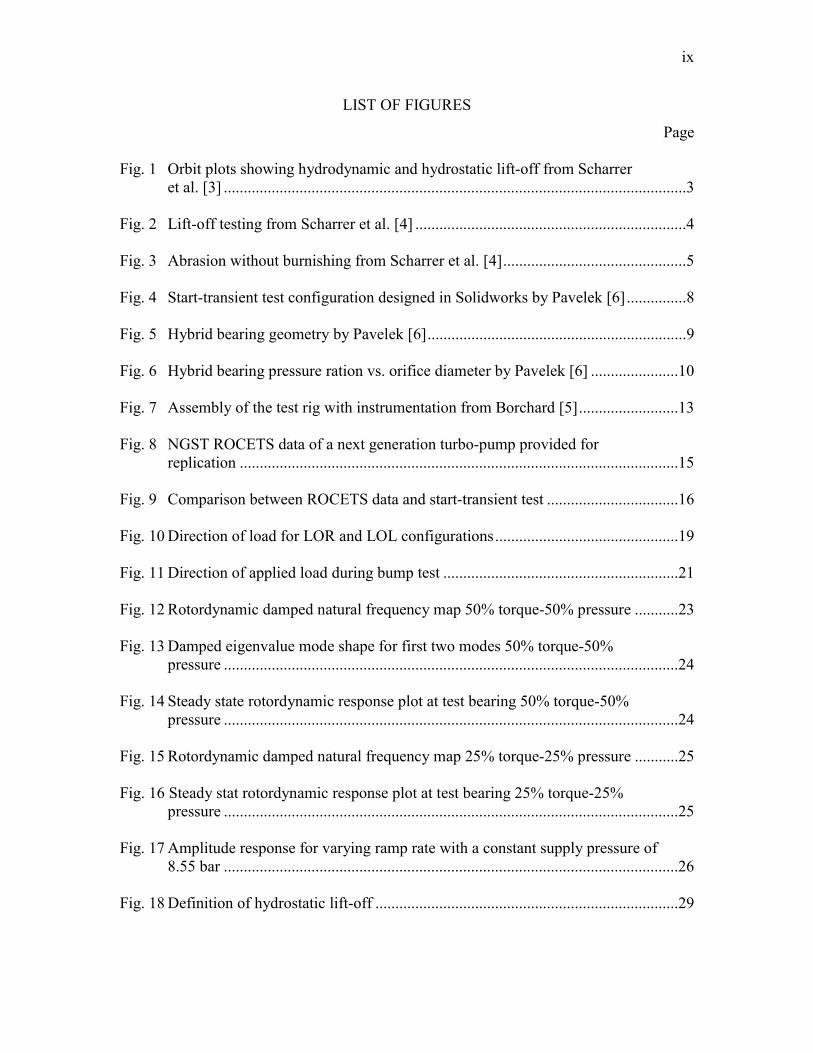
Fig. 1 Orbit plots showing hydrodynamic and hydrostatic lift-off from Scharrer et al. [3] ....................................................................................................................3 Fig. 2 Lift-off testing from Scharrer et al. [4] ....................................................................4 Fig. 3 Abrasion without burnishing from Scharrer et al. [4]..............................................5 Fig. 4 Start-transient test configuration designed in Solidworks by Pavelek [6]...............8 Fig. 5 Hybrid bearing geometry by Pavelek [6].................................................................9 Fig. 6 Hybrid bearing pressure ration vs. orifice diameter by Pavelek [6] ......................10 Fig. 7 Assembly of the test rig with instrumentation from Borchard [5].........................13 Fig. 8 NGST ROCETS data of a next generation turbo-pump provided for replication ..............................................................................................................15 Fig. 9 Comparison between ROCETS data and start-transient test .................................16 Fig. 10 Direction of load for LOR and LOL configurations..............................................19 Fig. 11 Direction of applied load during bump test ...........................................................21 Fig. 12 Rotordynamic damped natural frequency map 50% torque-50% pressure ...........23 Fig. 13 Damped eigenvalue mode shape for first two modes 50% torque-50% pressure ..................................................................................................................24 Fig. 14 Steady state rotordynamic response plot at test bearing 50% torque-50% pressure ..................................................................................................................24 Fig. 15 Rotordynamic damped natural frequency map 25% torque-25% pressure ...........25 Fig. 16 Steady stat rotordynamic response plot at test bearing 25% torque-25% pressure ..................................................................................................................25 Fig. 17 Amplitude response for varying ramp rate with a constant supply pressure of 8.55 bar ..................................................................................................................26 Fig. 18 Definition of hydrostatic lift-off ............................................................................29
x
Page
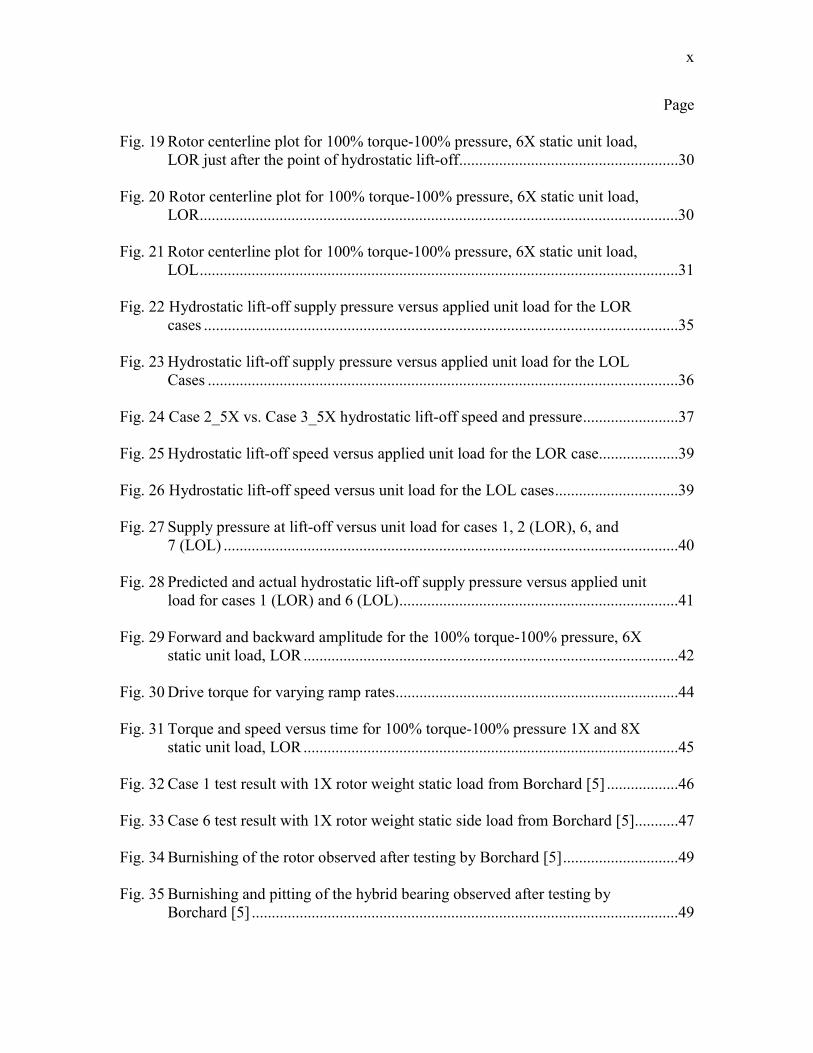
Fig. 19 Rotor centerline plot for 100% torque-100% pressure, 6X static unit load, LOR just after the point of hydrostatic lift-off.......................................................30 Fig. 20 Rotor centerline plot for 100% torque-100% pressure, 6X static unit load, LOR........................................................................................................................30 Fig. 21 Rotor centerline plot for 100% torque-100% pressure, 6X static unit load, LOL........................................................................................................................31 Fig. 22 Hydrostatic lift-off supply pressure versus applied unit load for the LOR cases .......................................................................................................................35 Fig. 23 Hydrostatic lift-off supply pressure versus applied unit load for the LOL Cases ......................................................................................................................36 Fig. 24 Case 2_5X vs. Case 3_5X hydrostatic lift-off speed and pressure........................37 Fig. 25 Hydrostatic lift-off speed versus applied unit load for the LOR case....................39 Fig. 26 Hydrostatic lift-off speed versus unit load for the LOL cases...............................39 Fig. 27 Supply pressure at lift-off versus unit load for cases 1, 2 (LOR), 6, and 7 (LOL) ..................................................................................................................40 Fig. 28 Predicted and actual hydrostatic lift-off supply pressure versus applied unit load for cases 1 (LOR) and 6 (LOL)......................................................................41 Fig. 29 Forward and backward amplitude for the 100% torque-100% pressure, 6X static unit load, LOR..............................................................................................42 Fig. 30 Drive torque for varying ramp rates.......................................................................44 Fig. 31 Torque and speed versus time for 100% torque-100% pressure 1X and 8X static unit load, LOR..............................................................................................45 Fig. 32 Case 1 test result with 1X rotor weight static load from Borchard [5] ..................46 Fig. 33 Case 6 test result with 1X rotor weight static side load from Borchard [5]...........47 Fig. 34 Burnishing of the rotor observed after testing by Borchard [5].............................49 Fig. 35 Burnishing and pitting of the hybrid bearing observed after testing by Borchard [5] ...........................................................................................................49

xi
Page Fig. 36 Rotor before start-transient testing.........................................................................51 Fig. 37 Burnishing of the rotor after start-transient testing................................................51 Fig. 38 Bearing before start-transient testing with applied unit LOR direction.................52 Fig. 39 Burnishing of the bearing with applied unit LOR direction ..................................52 Fig. 40 Bearing before start-transient testing with applied unit LOL direction.................53 Fig. 41 Burnishing of the bearing with applied unit load LOL direction...........................53 Fig. 42 Burnishing of the bearing in the direction of applied unit load after start-transient testing..............................................................................................54 Fig. 43 Comparison between ROCETS data and start-transient test 100% torque- 100% pressure........................................................................................................61 Fig. 44 Comparison between ROCETS data and start-transient test 50% torque- 100% pressure........................................................................................................62 Fig. 45 Comparison between ROCETS data and start-transient test 25% torque- 50% pressure..........................................................................................................62 Fig. 46 Comparison between ROCETS data and start-transient test 25% torque- 25% pressure..........................................................................................................63 Fig. 47 Plot of model used in rotordynamic analysis.........................................................67 Fig. 48 Rotordynamic damped natural frequency map 100% torque-100% pressure .......68 Fig. 49 Damped eigen value mode shape for first two modes 100% torque-100% pressure ..................................................................................................................68 Fig. 50 Steady stat rotordynamic response plot at test bearing 100% torque-100% pressure ..................................................................................................................69 Fig. 51 Rotordynamic damped natural frequency map 50% torque-100% pressure .........69 Fig. 52 Damped eigenvalue mode shape for first two modes 50% torque-100% pressure ..................................................................................................................70 Fig. 53 Steady state rotordynamic response plot at test bearing 50% torque-100% pressure ..................................................................................................................70

xii
Page Fig. 54 Rotordynamic damped natural frequency map 25% torque-50% pressure ...........71 Fig. 55 Damped eigenvalue mode shape for first two modes 25% torque-50% pressure ..................................................................................................................71 Fig. 56 Steady state rotordynamic response plot at test bearing 25% torque-50% pressure ..................................................................................................................72 Fig. 57 Damped eigenvalue mode shape for first two modes 25% torque-25% pressure ..................................................................................................................72 Fig. 58 Double sided waterfall plot for outboard proximity probes for 50% torque- 50% pressure 4X applied unit load ........................................................................74
xiii
LIST OF TABLES
Page
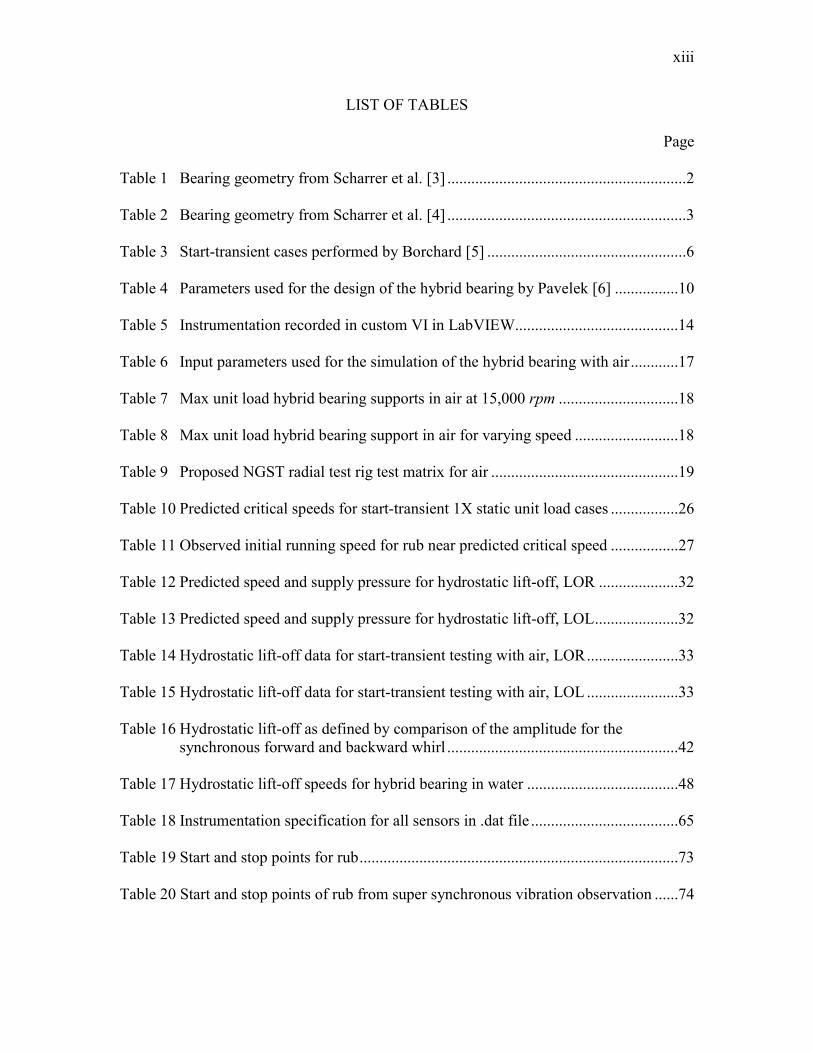
Table 1 Bearing geometry from Scharrer et al. [3] ............................................................2 Table 2 Bearing geometry from Scharrer et al. [4] ............................................................3 Table 3 Start-transient cases performed by Borchard [5] ..................................................6 Table 4 Parameters used for the design of the hybrid bearing by Pavelek [6] ................10 Table 5 Instrumentation recorded in custom VI in LabVIEW.........................................14 Table 6 Input parameters used for the simulation of the hybrid bearing with air............17 Table 7 Max unit load hybrid bearing supports in air at 15,000 rpm ..............................18 Table 8 Max unit load hybrid bearing support in air for varying speed ..........................18 Table 9 Proposed NGST radial test rig test matrix for air ...............................................19 Table 10 Predicted critical speeds for start-transient 1X static unit load cases .................26 Table 11 Observed initial running speed for rub near predicted critical speed .................27 Table 12 Predicted speed and supply pressure for hydrostatic lift-off, LOR ....................32 Table 13 Predicted speed and supply pressure for hydrostatic lift-off, LOL.....................32 Table 14 Hydrostatic lift-off data for start-transient testing with air, LOR.......................33 Table 15 Hydrostatic lift-off data for start-transient testing with air, LOL .......................33 Table 16 Hydrostatic lift-off as defined by comparison of the amplitude for the synchronous forward and backward whirl ..........................................................42 Table 17 Hydrostatic lift-off speeds for hybrid bearing in water ......................................48 Table 18 Instrumentation specification for all sensors in .dat file .....................................65 Table 19 Start and stop points for rub................................................................................73 Table 20 Start and stop points of rub from super synchronous vibration observation ......74

xiv
NOMENCLATURE
C Calibration factor, see Eq. (9) [F L2 L-4]
Cr Bearing radial clearance [L]
Cxx, Cxy, Cyx, Cyy Damping coefficients [F T L-1]
Cxxo Damping coefficient in the absence of fluid compressibility
[F T L-1]
D Diameter [L]
ex, ey Distance from bearing center [L]
F Force [F]
bxf , byf Force coefficients [F]
Fo Tare [F]
g Effective gap [L]
Kxx, Kxy, Kyx, Kyy Stiffness coefficients [F L-1]
L Length [L]
Mxx, Mxy, Myx, Myy Mass coefficients [M]
N Number of recesses on the bearing [dim]
Pa Ambient pressure [F L-2]
Pr Recess pressure [F L-1]
Ps Supply pressure [F L-1]
Prc Pressure ratio [dim]
Vr Total recess volume [L3]
W Load [F]
Wunit Unit load [F L-2]
x Offset [L]
z Restrictor control parameter [dim]
x∆ , y∆ Relative rotor-stator displacement in x or y direction [L]
cα Reduced damping factor due to compressibility, see Eq. (3) [dim]
β Fluid compressibility factor [L2 F-1]
γ Circumferential flow factor [dim]
e Bearing eccentricity, see Eq. (7) [L]

xv
0ε Bearing eccentricity ratio, see Eq. (8) [dim]
Ω Excitation or whirl frequency [T-1]
LOL Load on land
LOR Load on recess

INTRODUCTION
Turbo-pump applications that use ball bearings in cryogenic fluids can experience
rapid wear when the pump is at full power, limiting the life of the bearing. Hybrid
bearings have been proposed for use in next-generation turbo-pumps because of their
Diameter X Speed (DN) life, low friction factor, and application in low-viscosity fluids
[1]. Hybrid bearings use an external pressure supplied through a flow restrictor (orifice)
to create pressure that supports the rotor (shaft) without rotation. The pressure generated
by the flow through an orifice gives the hybrid bearing a theoretical infinite DN life. The
direct stiffness and load capacity of a hybrid bearing are independent of the fluid
viscosity making a cryogenic application ideal [1].
The cryogenic applications proposed for the next-generation of turbo-pumps
utilize the pump-discharge fluid as the external pressure supplied to the bearing.
Therefore, during start-up the bearings are flooded but unpressurized, at which point wear
can occur due to rubbing between the rotor and the bearing. The time, speed, and supply
pressure when rubbing during start-up ceases is referred to as “lift-off”. Currently, there
is a lack of available data to validate the theoretical predictions for the initial start-up,
referred to as start-transient, of hybrid bearings. This report will present the transient lift-
off results of a radial hybrid bearing with air as the supply medium, including the effects
of varying the ramp rate (drive torque), the supply pressure at 15,000 rpm, the applied
unit load, and load orientation. Air is compressible as is liquid hydrogen.
____________ This thesis follows the style and format of the ASME Journal of Tribology.

2
BACKGROUND
Steady-state operation and rotordynamic coefficients of hybrid bearings have
been well documented with good comparisons between predictions and experimental
results for eccentricities up to 0.5 [1]. While the steady-state performance of hybrid
bearings is predictable, little data exists to verify predictions for start-transients of hybrid
bearings.
Scharrer et al. [2] designed a test apparatus to simulate a bearing for the Space
Shuttle Main Engine (SSME) High Pressure Oxidizer Turbo-pump (HPOTP) and
performed start-transients of hydrostatic bearings in liquid nitrogen. An analog servo
controller matched speed, load, and pressure characteristics to data taken from an SSME
HPOTP.
The main objective of the start-transients performed by Scharrer et al. [3] was to
determine the influence of the load magnitude and speed profile on lift-off speed. Also
investigated were the influence of different bearing and journal material characteristics
on the transient behavior. Table 1 shows the two different bearing geometries that were
tested; the carbon P5N bearing had a different geometry than the nickel-chromium alloy
and silver plated nickel-copper alloy bearings. Five different test conditions were
performed; the first with no load applied. The remaining four had two different peak
loads and varied the load profile linearly with speed and a speed squared relationship.
For each material combination, all five-test conditions were run four times. The silver
plated NiCu bearing was tested using the higher peak load and the linear load profile an
additional 60 times.
Table 1 Bearing geometry from Scharrer et al. [3]
Carbon P5N bearingNiCr alloy bearing, and Ag-
plated NiCu alloyBearing length 31.75 mm (1.25 in) 31.75 mm (1.25 in)Bearing diameter 76.2 mm (3.0 in) 76.2 mm (3.0 in)Number of Recesses 6 8Recess area ratio 0.12 0.2Recess axial length 11.1 mm (0.438 in) 13.8 mm (0.544 in)Recess circ. Length 13.3 mm (0.524 in) 13.8 mm (0.544 in)Recess depth 0.254 mm (0.01 in) 0.254 mm (0.01 in)Operating radial clearance 0.084 mm (0.0033 in) 0.079 mm (0.0031 in)Orifice diameter 1.3 mm (0.051 in) 1.27 mm (0.05 in)
3
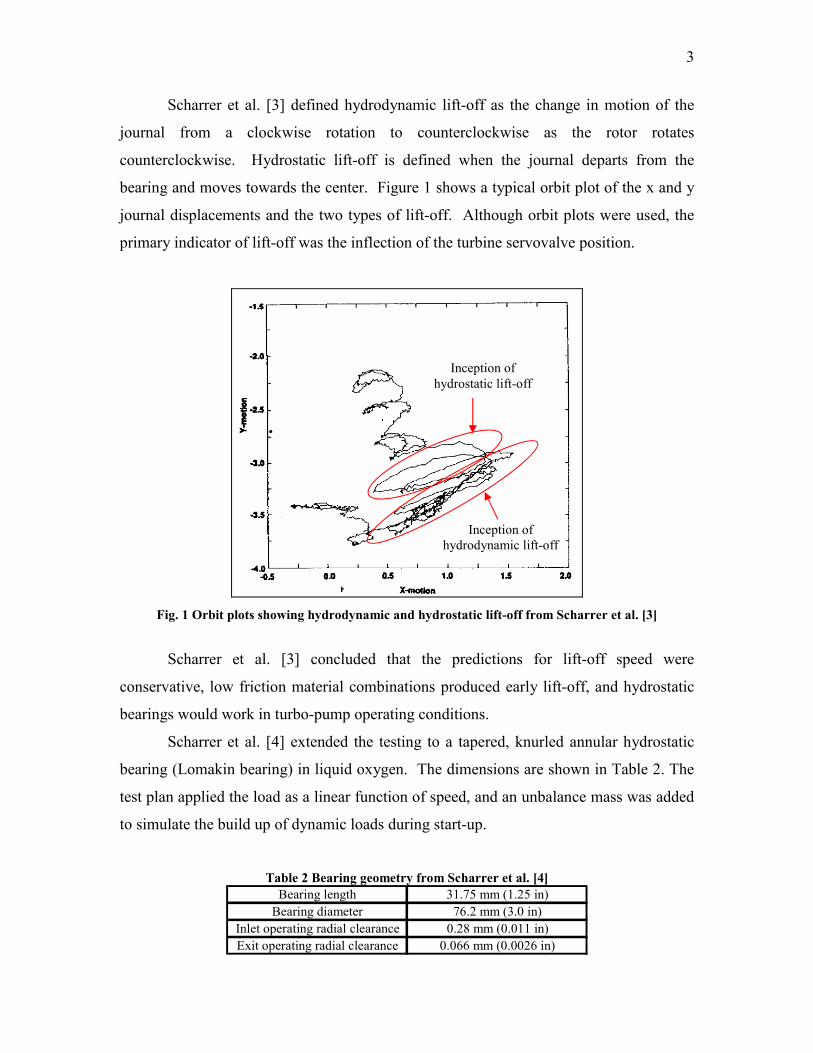
Scharrer et al. [3] defined hydrodynamic lift-off as the change in motion of the
journal from a clockwise rotation to counterclockwise as the rotor rotates
counterclockwise. Hydrostatic lift-off is defined when the journal departs from the
bearing and moves towards the center. Figure 1 shows a typical orbit plot of the x and y
journal displacements and the two types of lift-off. Although orbit plots were used, the
primary indicator of lift-off was the inflection of the turbine servovalve position.
Fig. 1 Orbit plots showing hydrodynamic and hydrostatic lift-off from Scharrer et al. [3]
Scharrer et al. [3] concluded that the predictions for lift-off speed were
conservative, low friction material combinations produced early lift-off, and hydrostatic
bearings would work in turbo-pump operating conditions.
Scharrer et al. [4] extended the testing to a tapered, knurled annular hydrostatic
bearing (Lomakin bearing) in liquid oxygen. The dimensions are shown in Table 2. The
test plan applied the load as a linear function of speed, and an unbalance mass was added
to simulate the build up of dynamic loads during start-up.
Table 2 Bearing geometry from Scharrer et al. [4]
Bearing length 31.75 mm (1.25 in)Bearing diameter 76.2 mm (3.0 in)
Inlet operating radial clearance 0.28 mm (0.011 in)Exit operating radial clearance 0.066 mm (0.0026 in)
Inception of hydrostatic lift-off
Inception of hydrodynamic lift-off

4
Transient behavior was observed during 61 start-ups. Contrary to Scharrer et al.
[3], Scharrer et al. [4] defined lift-off as a correlation between the orbit plots and
inflections in the speed profile. The change in the definition of lift-off was due to the lag
present in the turbine servovalve position relative to the event of lift-off. Figure 2 shows
the hydrodynamic and hydrostatic lift-off speed for each of the start-transients.
Fig. 2 Lift-off testing from Scharrer et al. [4]
Very little change in the orbit size and complete transient between the first and
last test were observed, indicating the bearing stiffness and damping was unaffected.
Post inspection of the bearing revealed wear in the direction of the load at approximately
an 80° arc. Two different regions of wear were present; the first had burnishing and
debris formation while the second as shown in Figure 3 was characterized by abrasion.
Scharrer et al. [4] concluded that the bearing performance did not degrade during the 61
tests, and the bearing is a viable replacement to the ball bearings in use at the time.

5
Fig. 3 Abrasion without burnishing from Scharrer et al. [4]
While Scharrer et al. [2,3,4] looked at the transient behavior of hydrostatic
bearings in liquid nitrogen, and an annular hydrostatic bearing in liquid oxygen the focus
was material selection. Not enough data are available from the study to calibrate start-
transient predictions.
Borchard [5] performed many start-transients of a hybrid (hydrostatic and
hydrodynamic) bearing in water. The hybrid bearing was designed by Pavelek [6] using
XLHydroJet® [7]; the design features and geometry are detailed later. Table 3 shows
several parameters including; the ramp rate (drive torque), supply pressure, applied load,
and load orientation that were varied to simulate different start-transient scenarios. Data
from each test was recorded in a .dat file to calibrate start-transient predictions. For each
case tested, Borchard [5] simulated the speed, pressure, and load profile to data from a
next-generation turbo-pump through a custom LabVIEW program, called Transient.VI.

6
Table 3 Start-transient cases performed by Borchard [5]
Ramp Rate (rpm/s)
Pressure @ 15,000 rpm
Type of Loading
Load Cases (Multiples of Rotor Weight) Load Orientation
Case 1 8824 18.25 bar (264.7 psia) Static 1X, 2X, 3X, 4X, 5X, 6X, 7X, 8X Load on Pad (Vertical)Case 2 4412 18.25 bar (264.7 psia) Static 1X, 2X, 3X, 4X, 5X, 6X, 7X, 8X Load on Pad (Vertical)Case 3 4412 9.63 bar (139.7 psia) Static 1X, 2X, 3X, 4X, 5X, 6X, 7X, 8X Load on Pad (Vertical)Case 4 2206 9.63 bar (139.7 psia) Static 1X, 2X, 3X, 4X, 5X, 6X, 7X, 8X Load on Pad (Vertical)Case 5 2206 5.32 bar (77.2 psia) Static 1X, 2X, 3X, 4X, 5X, 6X, 7X, 8X Load on Pad (Vertical)Case 6 8824 18.25 bar (264.7 psia) Static 1X, 2X, 3X, 4X, 5X, 6X, 7X, 8X Load on Land (Horizontal)Case 7 4412 18.25 bar (264.7 psia) Static 1X, 2X, 3X, 4X, 5X, 6X, 7X, 8X Load on Land (Horizontal)Case 8 4412 9.63 bar (139.7 psia) Static 1X, 2X, 3X, 4X, 5X, 6X, 7X, 8X Load on Land (Horizontal)Case 9 2206 9.63 bar (139.7 psia) Static 1X, 2X, 3X, 4X, 5X, 6X, 7X, 8X Load on Land (Horizontal)Case 10 2206 5.32 bar (77.2 psia) Static 1X, 2X, 3X, 4X, 5X, 6X, 7X, 8X Load on Land (Horizontal)
Texas A&M Test Matrix (NGST Radial Test Rig)
Like Scharrer et al. [3,4], Borchard [5] defined hydrostatic lift-off as the point of
departure towards the center of the bearing. Hydrodynamic lift-off could not be
determined from the data. Upon removal of the bearing after an excess of 100 start-
transients, Borchard [5] observed that burnishing was present on the rotor surface, and
the bearing surface showed signs of burnishing and pitting.
Borchard’s [5] main objective was to gather data to validate predictions of a start-
transient for a hybrid bearing in water. In addition to the successful completion of the
main objective, Borchard [5] was able to make the following conclusions.
Hydrodynamic lift-off could not be accurately predicted by the orbit plots. Hydrostatic
lift-off is predictable, highly pressure dependent, and increases to a higher speed with
increasing load and ramp rate. Hybrid bearings are susceptible to damage during start-
transients in which the supply medium is a process fluid.
The data that Borchard [5] gathered gives a good indication of the start-transient
performance of a hybrid bearing in a non-compressible supply medium. Liquid hydrogen
is a compressible fluid commonly used in cryogenic applications; therefore, data using a
similar fluid is necessary to validate the start-transient predictions for a hybrid bearing in
a compressible supply medium.
7
TEST RIG AND HARDWARE
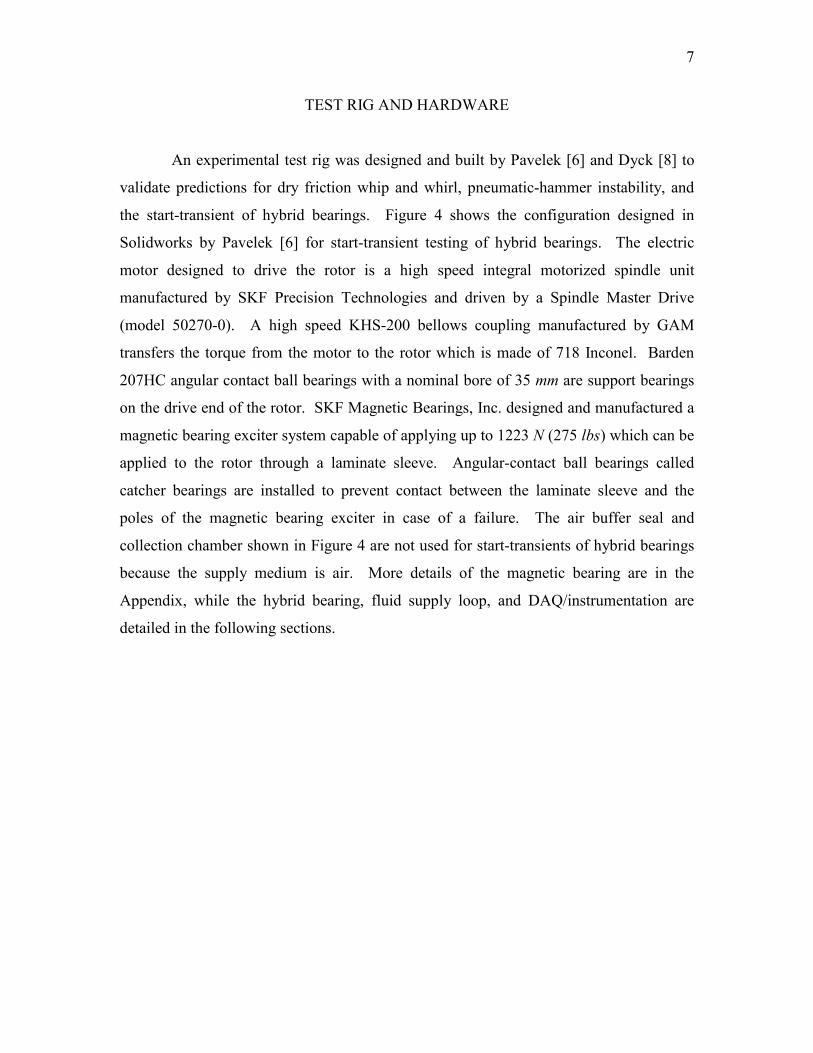
An experimental test rig was designed and built by Pavelek [6] and Dyck [8] to
validate predictions for dry friction whip and whirl, pneumatic-hammer instability, and
the start-transient of hybrid bearings. Figure 4 shows the configuration designed in
Solidworks by Pavelek [6] for start-transient testing of hybrid bearings. The electric
motor designed to drive the rotor is a high speed integral motorized spindle unit
manufactured by SKF Precision Technologies and driven by a Spindle Master Drive
(model 50270-0). A high speed KHS-200 bellows coupling manufactured by GAM
transfers the torque from the motor to the rotor which is made of 718 Inconel. Barden
207HC angular contact ball bearings with a nominal bore of 35 mm are support bearings
on the drive end of the rotor. SKF Magnetic Bearings, Inc. designed and manufactured a
magnetic bearing exciter system capable of applying up to 1223 N (275 lbs) which can be
applied to the rotor through a laminate sleeve. Angular-contact ball bearings called
catcher bearings are installed to prevent contact between the laminate sleeve and the
poles of the magnetic bearing exciter in case of a failure. The air buffer seal and
collection chamber shown in Figure 4 are not used for start-transients of hybrid bearings
because the supply medium is air. More details of the magnetic bearing are in the
Appendix, while the hybrid bearing, fluid supply loop, and DAQ/instrumentation are
detailed in the following sections.

8
Fig. 4 Start-transient test configuration designed in Solidworks by Pavelek [6]
Hybrid Bearing
The hybrid bearing was designed by Pavelek [6] to be consistent with a proposed
next-generation turbo-pump in terms of clearance, diameter, number of recesses, etc. The
bearing geometry as designed by Pavelek [6] is shown in Figure 5. The hybrid bearing
features a supply annulus where the supply medium will flow into. Two o-ring grooves
are machined on either side of the annulus to prevent leakage. There are six bearing
recesses (pockets) with an orifice in the center of the recess which supply fluid to the
bearing. Two recess pressure-measurement ports for dynamic and static pressure-
measurements are in the bottom pocket. A bolt flange secures the bearing to the housing
while a taper machined on the outer surface aids in alignment.

9
Fig. 5 Hybrid bearing geometry by Pavelek [6]
The major feature to be considered in the design was the orifice diameter.
Mosher and Childs [9] found the optimum pressure ratio for hybrid bearings is between
0.45-0.50. The pressure ratio ( rcP ) is the recess pressure divided by the supply pressure
as shown in Eq. (1).
as
arrc PP
PPP
−−
= (1)
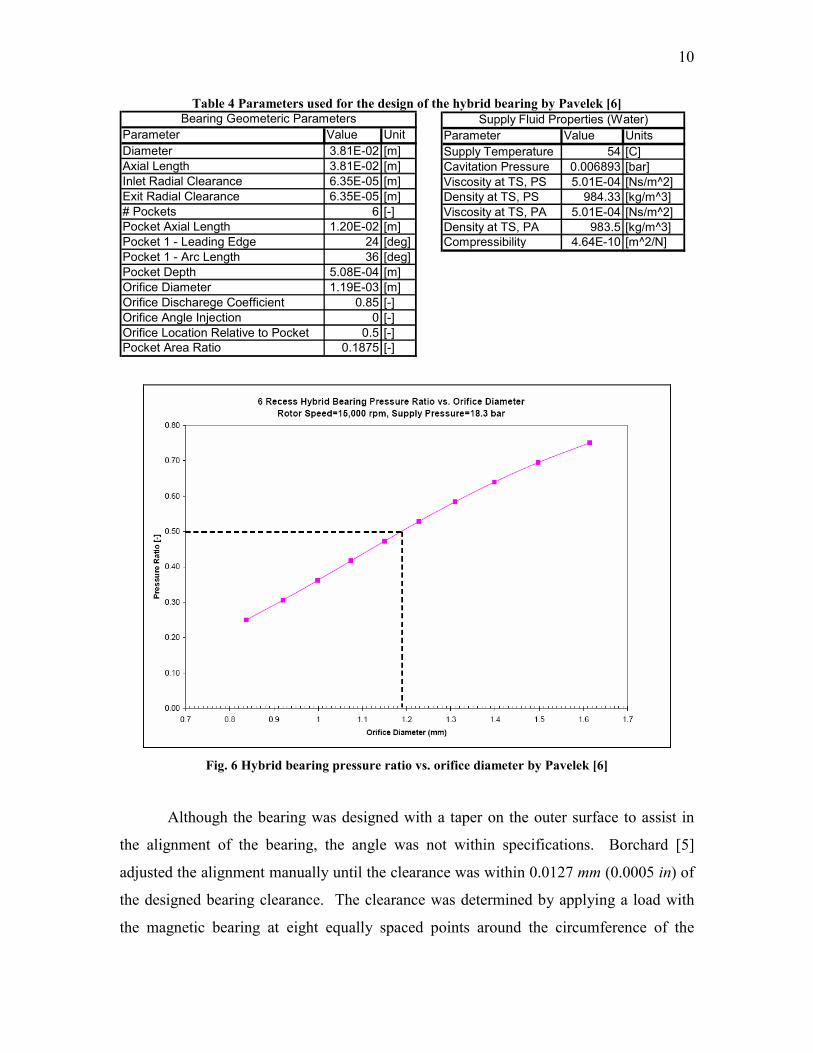
Pavelek [6] used the data from Table 4 in XLHydroJet®, varying the orifice
diameter to find the optimum pressure ratio of 0.5. An orifice diameter of 1.19 mm
(0.047 in) was selected because the predicted pressure ratio with the bearing in the
centered position at 15,000 rpm and a nominal supply pressure of 18.25 bar (265.4 psia)
is approximately 0.50 as seen in Figure 6. With air as the fluid medium the predicted
pressure ratio is 0.71, the actual pressure ratio is 0.67.
10
Table 4 Parameters used for the design of the hybrid bearing by Pavelek [6]
Parameter Value UnitDiameter 3.81E-02 [m]Axial Length 3.81E-02 [m]Inlet Radial Clearance 6.35E-05 [m]Exit Radial Clearance 6.35E-05 [m]# Pockets 6 [-]Pocket Axial Length 1.20E-02 [m]Pocket 1 - Leading Edge 24 [deg]Pocket 1 - Arc Length 36 [deg]Pocket Depth 5.08E-04 [m]Orifice Diameter 1.19E-03 [m]Orifice Discharege Coefficient 0.85 [-]Orifice Angle Injection 0 [-]Orifice Location Relative to Pocket 0.5 [-]Pocket Area Ratio 0.1875 [-]
Bearing Geometeric Parameters
Parameter Value UnitsSupply Temperature 54 [C]Cavitation Pressure 0.006893 [bar]Viscosity at TS, PS 5.01E-04 [Ns/m^2]Density at TS, PS 984.33 [kg/m^3]Viscosity at TS, PA 5.01E-04 [Ns/m^2]Density at TS, PA 983.5 [kg/m^3]Compressibility 4.64E-10 [m^2/N]
Supply Fluid Properties (Water)
Fig. 6 Hybrid bearing pressure ratio vs. orifice diameter by Pavelek [6]
Although the bearing was designed with a taper on the outer surface to assist in
the alignment of the bearing, the angle was not within specifications. Borchard [5]
adjusted the alignment manually until the clearance was within 0.0127 mm (0.0005 in) of
the designed bearing clearance. The clearance was determined by applying a load with
the magnetic bearing at eight equally spaced points around the circumference of the

11
bearing. Any small misalignment of the bearing results in an increased pressure ratio and
premature contact between the rotor and bearing [5]. For the present testing, the bearing
will be manually aligned, and the clearance will be verified by a bump test. The
alignment and bump test procedure is detailed in the experimental procedure section.
Hybrid bearings with compressible fluid media are subject to pneumatic-hammer
instabilities. Pneumatic-hammer occurs at low frequencies and has negative values of the
direct damping coefficients. San Andrés [10] discusses the cause of pneumatic hammer
instability and the important design features of a hybrid bearing to avoid pneumatic
hammer. San Andrés [10] defines the value of direct damping in Eq. (2). Where cα is
the reduced damping factor due to compressibility at zero frequency and given by Eq. (3).
( )cxxoxx CC α−= 1 (2)
( )
( )[ ]NzLDCPPNV
b
arrc /sin21
32 πγπβα
++−
= (3)
The direct damping will be positive if cα << 1, which implies that the recess
volume ( rV ) to film land volume ( LDcπ ) ratio remains small, and the compressibility
factor ( β ) is small.
Next generation turbo-pumps operate with the fluid-discharge as the supply
medium for the hybrid bearing, commonly a cryogenic fluid such as liquid hydrogen is
utilized. Liquid hydrogen is susceptible to pneumatic hammer instability and low break
frequencies due to its low viscosity and compressibility factor (β = 8.88x10⁻⁸ [m2 N-1])
[10]. The break frequency is the frequency at which there is a brisk increase in direct
stiffness accompanied by a rapid decrease in damping. The susceptibility to pneumatic
hammer instability and a low break frequency with liquid hydrogen as the supply
medium limits the application of hybrid bearings in turbo-pump applications.
Application of a hybrid bearing in a cryogenic application such as liquid hydrogen
requires careful attention to the possibility of pneumatic-hammer instability as well as the
value of the break frequency.

12
Borchard [11] performed two tests to verify the predictions of pneumatic-hammer
for the hybrid bearing. Each test measured the damping at varying pressures for a static
(non-rotating) rap test. In the first test the recess pressure-measurement ports as shown in
Figure 5 were filled with wax. No pneumatic-hammer instability was predicted, and
none was observed. The wax was removed, and a screw was inserted in the recess
pressure-measurement ports and backed out to add volume to the recess. With the added
volume pneumatic-hammer instability was predicted and observed. To prevent
pneumatic-hammer instability Borchard [11] recommends that the ratio of recess pocket
area to land area should be 20-25%, the pocket depth should be minimized, and the
orifices should not have a pressure recovery zone.
The hybrid bearing is held in place by the bolt flange to the test bearing housing,
but is also connected to the ground by o-rings. Prior to start-transient testing pneumatic-
hammer instability was observed in the hybrid bearing at the same recess volume
Borchard [11] predicted the absence of pneumatic-hammer instability. Inspection of the
o-rings revealed worn areas with noticeable hardening in some areas. The o-rings were
replaced and, for the same recess volume and supply pressure, no pneumatic-hammer
instability was observed. As o-rings wear, localized hardening can occur; the observation
that changing o-rings eliminated the pneumatic-hammer instability verifies that the o-
rings add damping to the system.
Fluid Supply Loop
A compressor supplies compressed air at 20.32 bar (294.7 psia) to the test rig to
serve as the fluid medium for start-transients of the hybrid bearing. A FT-10NEE1-
GEAH4 flow meter from Flow Technology is installed in the piping to the test rig, with
pressure and temperature sensors upstream and downstream, to record the mass flow rate.
The pressure transducers are manufactured by Omega Engineering, Inc., model PX209-
300G10V. The temperature sensors and signal conditioners are manufactured by Omega
Engineering, Inc. model RTD-NPT-72-E-DUAL-1/4-MPT and DRF-RTD-24VDC-
0/200C-0/10.

13
Downstream of the flow meter and upstream of the radial test rig, a Baumann 3/4"
32-24588SVF valve is used to control the supply pressure to the test rig. The air will exit
the bearing at atmospheric pressure.
DAQ/Instrumentation
Design and assembly of the test rig was completed by Pavelek [6], Dyck [8] and
Borchard [5], with modifications to the fluid supply loop and static recess pressure
measurement made by the author for start-transient testing with air. Figure 7 shows the
assembly of the test rig with instrumentation. For each start-transient, a custom virtual
instrument (VI) was created in LabVIEW to record the data as listed in Table 5. The data
are recorded at 5000 Hz to decrease data saturation. The data output are recorded to a
.dat file during testing for later use. The instrumentation specification for all sensors in
recorded order is in the appendix.
Fig. 7 Assembly of the test rig with instrumentation from Borchard [5]

14
Table 5 Instrumentation recorded in custom VI in LabVIEW Number Location Number Location
Speed Pressure Transducers1 Mounted Tachometer 1 Exhaust Pressure1 Encoder Speed (Mounted after test bearing)
(Via motor controller software) 1 Supply Pressure1 Scaled Tachometer (Mounted before test bearing)
(Via motor controller software) 1 Recess PressureProximity Probes (Mounted in recess of test bearing)
2 Test Bearing Housing (Outboard) 1 Flow Meter Pressure (Inlet)(2 probes mounted at 90 degrees) (Mounted before flow meter)
2 Test Bearing Housing (Inboard) 1 Flow Meter Pressure (Outlet)(2 probes mounted at 90 degrees) (Mounted after flow meter)
2 Support Bearing Housing Temperature Sensors(2 probes mounted at 90 degrees) 1 Supply Temperature Accelerometers (Mounted before test bearing)
2 Support Bearing Housing 1 Flow Meter Temperature (Inlet)(2 probes mounted at 90 degrees) (Mounted before flow meter)
2 Test Bearing Housing 1 Flow Meter Temperature (Outlet)(2 probes mounted at 90 degrees) (Mounted after flow meter)
2 Drive Motor Casing Voltage(1 probe mounted by support bearing) 1 Force VoltageFlow Meter (W 24 vertical displacement)
1 Flow Meter 1 Force Voltage(Mounted before test bearing) (V 24 horizontal displacement)Torque 1 Valve Voltage
1 Load (Voltage applied to valve, converted to 4-20 mA signal)(Via motor controller software)

15
PROPOSED TEST CASES
This section explains the rationale behind the design of start-transient tests. First,
variation in ramp rate and supply pressure of the provided data is outlined. Second, the
maximum applied load for each case is given, and finally, the start-transient predictions
including rotordynamic analysis is detailed.
Ramp Rate and Supply Pressure
Northrop Grumman Space Technology (NGST) provided ROCETS predictions of
a next generation turbo-pump to be replicated on the radial test rig that is shown in Figure
8. The pump-discharge fluid is used to pressurize the bearing; therefore, the supply
pressure is proportional to the speed (ω ) squared. The target supply pressure for the
start-transients is 18.25 bar (265.4 psia), which is 1.7 seconds after the turbo-pump starts.
The SKF motor will accelerate to 15,000 rpm over the 1.7 seconds as it closely follows
the speed profile provide in the ROCETS predictions. Figure 9 shows a comparison of a
start-transient compared to the ROCETS predictions.
Fig. 8 NGST ROCETS data of a next generation turbo-pump provided for replication

16
Fig. 9 Comparison between ROCETS data and start-transient test
The ramp rate (drive torque) and the supply pressure at 15,000 rpm are two
variables for different start-transient cases. The ROCETS predictions that we are trying
to replicate has an acceleration of the rotor from zero to 15,000 rpm over 1.7 seconds
with a 18.3 bar (265.4 psia) supply pressure, referred to as 100% torque-100% pressure.
If the ramp rate is twice as long, the torque is 50% and four times as long the torque is
25%. If the supply pressure at 15,000 rpm is half of target supply pressure, 9.63 bar
(139.7 psia), the pressure is 50% and one fourth, 5.32 bar (77.2 psia), the pressure is
25%.
Five start-transient test cases are used to simulate various ramp rates and supply
pressures. Figure 9 displays the 50% torque-50% pressure case. The four other cases are
100% torque-100% pressure, 50% torque-100% pressure, 25% torque-50% pressure, and
25% torque-25% pressure. The speed and supply pressure are matched to the ROCETS
predictions and shown in the appendix. For the 100% torque-100% pressure and 50%
torque-100% pressure cases, the supply pressure does not match the ROCETS predictions
perfectly as the rate the supply pressure can increase is limited; therefore, the supply
17
pressure started to increase before the ROCETS predictions to supply 18.25 bar (265.4
psia) at 1.7 seconds.
Applied Load
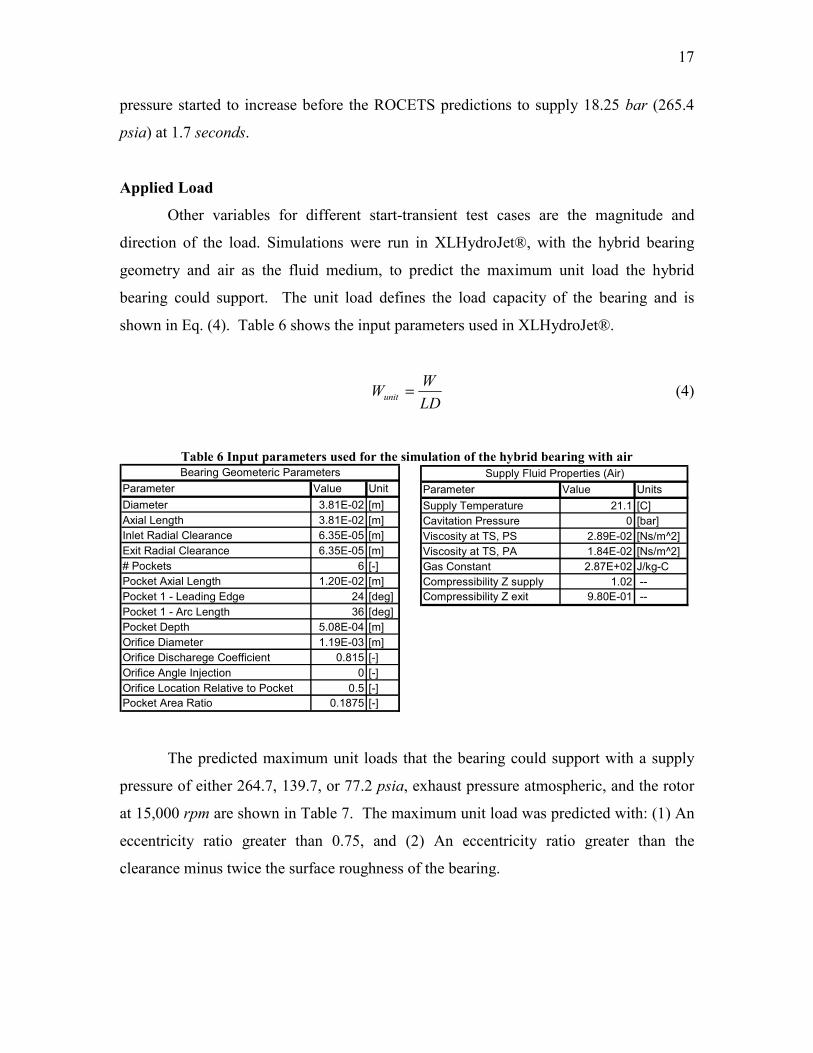
Other variables for different start-transient test cases are the magnitude and
direction of the load. Simulations were run in XLHydroJet®, with the hybrid bearing
geometry and air as the fluid medium, to predict the maximum unit load the hybrid
bearing could support. The unit load defines the load capacity of the bearing and is
shown in Eq. (4). Table 6 shows the input parameters used in XLHydroJet®.
LDWWunit = (4)
Table 6 Input parameters used for the simulation of the hybrid bearing with air
Parameter Value UnitDiameter 3.81E-02 [m]Axial Length 3.81E-02 [m]Inlet Radial Clearance 6.35E-05 [m]Exit Radial Clearance 6.35E-05 [m]# Pockets 6 [-]Pocket Axial Length 1.20E-02 [m]Pocket 1 - Leading Edge 24 [deg]Pocket 1 - Arc Length 36 [deg]Pocket Depth 5.08E-04 [m]Orifice Diameter 1.19E-03 [m]Orifice Discharege Coefficient 0.815 [-]Orifice Angle Injection 0 [-]Orifice Location Relative to Pocket 0.5 [-]Pocket Area Ratio 0.1875 [-]
Bearing Geometeric Parameters
Parameter Value UnitsSupply Temperature 21.1 [C]Cavitation Pressure 0 [bar]Viscosity at TS, PS 2.89E-02 [Ns/m^2]Viscosity at TS, PA 1.84E-02 [Ns/m^2]Gas Constant 2.87E+02 J/kg-CCompressibility Z supply 1.02 --Compressibility Z exit 9.80E-01 --
Supply Fluid Properties (Air)
The predicted maximum unit loads that the bearing could support with a supply
pressure of either 264.7, 139.7, or 77.2 psia, exhaust pressure atmospheric, and the rotor
at 15,000 rpm are shown in Table 7. The maximum unit load was predicted with: (1) An
eccentricity ratio greater than 0.75, and (2) An eccentricity ratio greater than the
clearance minus twice the surface roughness of the bearing.

18
Table 7 Max unit load hybrid bearing supports in air at 15,000 rpm
Supply Pressure [bar (psia)] 0.75 eccentricity 2x Surface roughness18.25 (264.7) 3.85 (55.8) 4.45 (64.5)9.63 (139.7) 2.18 (31.6) 2.52 (36.6)5.32 (77.2) 1.25 (18.1) 1.51 (21.9)
Max Unit Load [bar (psi)]
To calculate the hydrodynamic effect, the maximum unit load the bearing can
support with a constant pressure, while reducing the speed, and with an eccentricity less
than twice the surface roughness is shown in Table 8. As the speed decreases the
hydrodynamic effect is calculated to decrease noted by the reduction in maximum unit
load. With no hydrodynamic effect or zero speed, the bearing will support a very high
unit load indicating that lift-off is highly pressure dependent.
Table 8 Max unit load hybrid bearing supports in air for varying speed
Lift-off Speed [rpm]
Max Unit Load [bar (psi)]
Lift-off Speed [rpm]
Max Unit Load [bar (psi)]
Lift-off Speed [rpm]
Max Unit Load [bar (psi)]
15000 1.51 (21.9) 15000 2.52 (36.6) 15000 4.45 (64.5)12000 1.46 (21.2) 12000 2.49 (36.1) 12000 4.44 (64.4)
9000 1.42 (20.6) 9000 2.45 (35.6) 9000 4.42 (64.0)6000 1.39 (20.1) 6000 2.42 (35.2) 6000 4.42 (64.1)3000 1.36 (19.8) 3000 2.41 (35.0) 3000 4.42 (64.0)
100 1.35 (19.6) 100 2.41 (35.0) 100 4.43 (64.2)
Supply Pressure 5.32 [bar ] (77.2 [psia ])
Supply Pressure 9.63 [bar ] (139.7 [psia ])
Supply Pressure 18.25 [bar ] (264.7 [psia ])
For a turbopump start-transient, supply pressure is proportional to speed squared.
Therefore, if the supply pressure at 15,000 rpm is 18.25 bar (264.7 psia), the supply
pressure will remain below 9.63 bar (139.7 psia) or half until around 12,000 rpm. To
limit the duration of rubbing, the maximum unit load applied will be roughly half the
predicted maximum unit load the bearing will support for an eccentricity less than 0.75.
Table 9 shows how much load will be applied for each test case.

19
Table 9 Proposed NGST radial test rig test matrix for air
Ramp Rate [rpm /s ]
Pressure @ 15,000 rpm
Load Cases (Multiples of Rotor Weight) Load Orientation
Case 1 8824 18.25 bar (264.7 psia) 1X, 2X, 3X, 4X, 5X, 6X, 7X, 8X Load on Recess (Vertical)Case 2 4412 18.25 bar (264.7 psia) 1X, 2X, 3X, 4X, 5X, 6X, 7X Load on Recess (Vertical)Case 3 4412 9.63 bar (139.7 psia) 1X, 2X, 3X, 4X, 5X Load on Recess (Vertical)Case 4 2206 9.63 bar (139.7 psia) 1X, 2X, 3X, 4X Load on Recess (Vertical)Case 5 2206 5.32 bar (77.2 psia) 1X, 2X, 3X Load on Recess (Vertical)Case 6 8824 18.25 bar (264.7 psia) 1X, 2X, 3X, 4X, 5X, 6X, 7X, 8X Load on Land (Horizontal)Case 7 4412 18.25 bar (264.7 psia) 1X, 2X, 3X, 4X, 5X, 6X, 7X Load on Land (Horizontal)Case 8 4412 9.63 bar (139.7 psia) 1X, 2X, 3X, 4X, 5X Load on Land (Horizontal)Case 9 2206 9.63 bar (139.7 psia) 1X, 2X, 3X, 4X Load on Land (Horizontal)Case 10 2206 5.32 bar (77.2 psia) 1X, 2X, 3X Load on Land (Horizontal)
DefinitionsStatic - Load is calculated at the bearing and is applied before test remaining constant throughout test.Linear - Load is time dependant starting from zero at beging of test and reaching max load at final speed (15,000 rpm).Ramp Rate - Time in seconds taken to reach 15,000 rpm during start-up.Vertical - Load is being applied downward in the vertical direction.Horizontal - Load is side load in the horizontal direction.Rotor Weight - This is 31 N (7 lbs .) at the test bearing.
Texas A&M Test Matrix (NGST Radial Test Rig)
Figure 10 shows the intended direction of load for the load on recess (LOR) and
load on land (LOL) start-transient cases as well as the x-y axis for orientation of the load
from the magnetic bearing. The load from the magnetic bearing in the LOR case is
applied directly on a recess while, in the LOL case, the load is applied on the land of the
bearing.
Fig. 10 Direction of load for LOR and LOL configurations
LOL
LOR
y axis
x axis
20
EXPERIMENTAL PROCEDURE
This section details the experimental procedure for the start-transient testing.
First, the manual alignment to ensure the measured clearance of the hybrid bearing is
outlined. Second, the bump test procedure to record the clearance before and after start-
transient testing is detailed. Finally, the procedure for start-transient testing in LabVIEW
through custom VI’s is given.
Alignment Procedure
The hybrid bearing was designed with a matching taper to that of the test bearing
pedestal [6]. However, experience showed that the taper is not correct and can lead to
misalignment of the hybrid bearing [5]. To ensure proper alignment, the hybrid bearing
is bolted to the test bearing pedestal. The (non-rotating) rotor is displaced around the
outside of the bearing by hand while recording the displacement. The data are analyzed,
and if the clearance in any direction from the center is less than 0.0127 mm (0.5 mils) of
the measured clearance, the bearing is adjusted. This method allows for almost instant
feedback and for iterative changes in alignment until the desired clearance is achieved.
The properly aligned bearing is then secured to the test bearing pedestal for start-transient
testing.
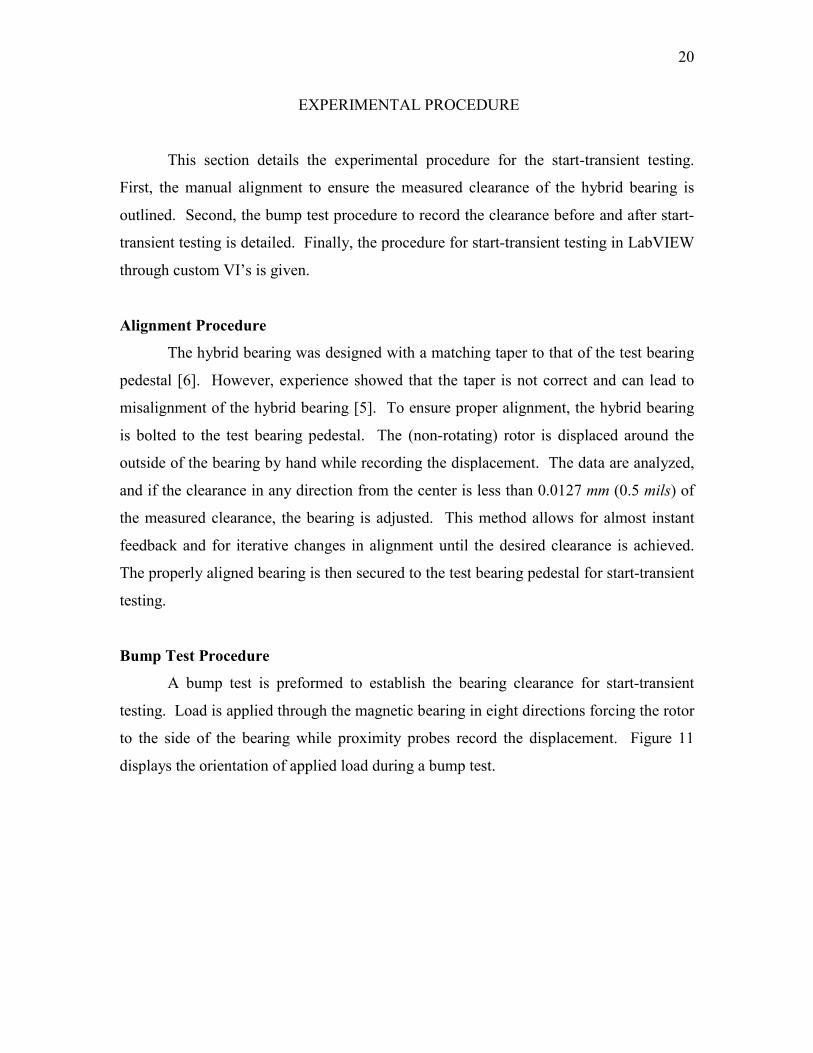
Bump Test Procedure
A bump test is preformed to establish the bearing clearance for start-transient
testing. Load is applied through the magnetic bearing in eight directions forcing the rotor
to the side of the bearing while proximity probes record the displacement. Figure 11
displays the orientation of applied load during a bump test.

21
Fig. 11 Direction of applied load during bump test
The difference between the rotor’s displacement in one direction and 180 degrees
from that direction gives a diametral clearance. The average diametral clearance
establishes the bearing clearance for start-transient testing. This is a final check to verify
the average diametral clearance is within 0.0127 mm (0.5 mils), or nearly 80%, of the
measured clearance and that the bearing is secure in the test bearing pedestal. Also, the
center of the bearing relative to the proximity probe positions is established; therefore,
the data taken during the start-transients can be adjusted so the center of the bearing is at
(0, 0).
Start-Transient Procedure
For each start-transient test case, a custom virtual VI was created in LabVIEW.
Besides recording the instrumentation data as listed in Table 5 at 5000 Hz, the custom VI
coordinates the start and acceleration rate of the motor, timing for the opening of the
valve, and application of the direction and magnitude of the load. The timing and
application of the motor, valve, and load for each case were determined through
extensive experiments prior to the start-transient testing.
Hybrid Bearing
Rotor

22
TEST RESULTS
Many start-transients were performed, each varying different parameters
including ramp rate (drive torque), supply pressure, applied unit load, and load
orientation. Table catalogs each start-transient test that was completed. The following
sections detail the results including: (1) steady-state predictions of the start-transient test
cases including passing through a critical speed with a comparison to test results, (2)
hydrostatic lift-off defined by rotor centerline plots and waterfall plots, (3) an evaluation
of torque, (4) a comparison to the results from Borchard [5] using water, and (5) a look at
the bearing before and after start-transient testing.
Start-Transient Predictions
The model for small motion about an equilibrium position for a hybrid bearing is
shown in Eq. (5), [12].
⎭⎬⎫
⎩⎨⎧∆∆
⎥⎥⎦
⎤⎢⎣
⎡−
⎭⎬⎫
⎩⎨⎧∆∆
⎥⎥⎦
⎤⎢⎣
⎡−
⎭⎬⎫
⎩⎨⎧∆∆
⎥⎥⎦
⎤⎢⎣
⎡−=
⎭⎬⎫
⎩⎨⎧
yx
MM
MM
yx
CC
CC
yx
KK
KK
ff
yy
xy
yx
xx
yy
xy
yx
xx
yy
xy
yx
xx
by
bx
&&
&&
&
& (5)
XLHydroJet® calculates the stiffness, damping, and added mass coefficients of
the hybrid bearing for a given supply and exhaust pressure, load, and speed. The bearing
coefficients are used in XLTRCTM Rotordynamics Suite (XLTRC2) [13] to perform a
rotordynamic analysis. The original analysis performed by Pavelek [6] is modified to
include the updated bearing coefficients. For each of the five start-transient test cases
due to the varying ramp rate and supply pressure, a steady-state rotordynamic analysis
using XLTRC2 is performed. The steady-state rotordynamic analysis produces the
damped natural frequency map showing predicted critical speeds in some cases, damped
eigenvalue mode shapes, and steady-state rotordynamic response plot.
The rotordynamic damped natural frequency map plots the first, second, third, and
higher natural frequencies of the rotor versus rotor speed. The synchronous line
represents the running speed, and the coincidence of the shaft’s natural frequency and the
synchronous line is a critical speed (CS). A forward CS refers to the whirling motion of

23
the rotor in the direction of rotation and can be excited by many factors including
imbalance. A CS with a whirling motion in the direction opposite of rotation is a
backward CS. Unless significant bearing orthotropy is present, backward CSs are not
excited by imbalance.
The 100% torque-100% pressure and 50% torque-100% pressure cases predict no
CSs below 15,000 rpm. The maximum amplitude in the 100% torque-100% pressure
case is 0.017 mm (0.67 mils) while in the 50% torque-100% pressure case it is 0.022 mm
(0.87 mils).
Figure 12 displays the rotordynamic damped natural frequency map for the 50%
torque-50% pressure case. The 25% torque-50% pressure case is very similar and shown
in the appendix. The similarity is expected because the bearing coefficients and rotor
natural frequencies are calculated independent of the ramp rate, the major difference
between the two cases.
Rotordynamic Damped Natural Frequency Map
1x
0
5000
10000
15000
20000
25000
30000
35000
40000
45000
0. 2000. 4000. 6000. 8000. 10000. 12000. 14000. 16000. 18000.
Rotor Speed, rpm
Nat
ural
Fre
quen
cy,
cpm
Transient Bearing Performance Rotordynamic Analysisby David Klooster
Fig. 12 Rotordynamic damped natural frequency map 50% torque-50% pressure
Note the first forward and first backward natural frequencies increase along the
synchronous line. This is a potentially disastrous problem as running near a CS for an
extended period of time can lead to a large amplitude response especially with little to no
damping. Figure 13 shows that the first backward CS is near 8,000 rpm while the first
forward CS is near 12,000 rpm.
24
Fig. 13 Damped eigenvalue mode shape for first two modes 50% torque-50% pressure
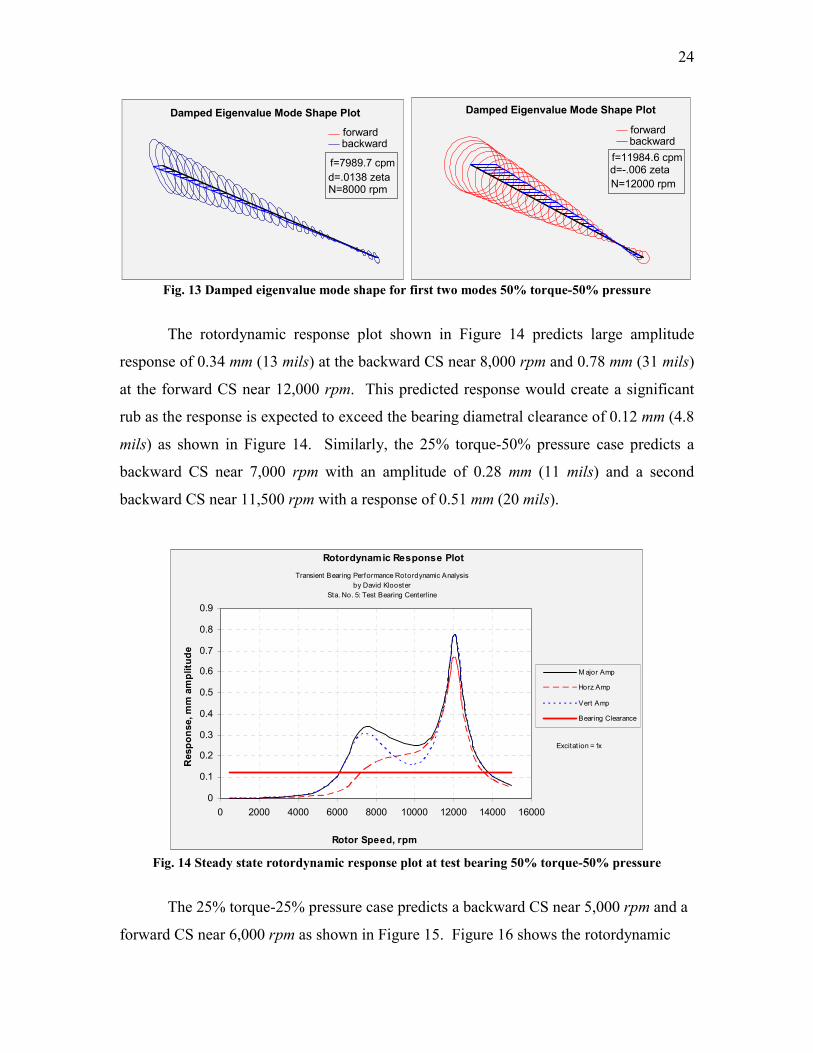
The rotordynamic response plot shown in Figure 14 predicts large amplitude
response of 0.34 mm (13 mils) at the backward CS near 8,000 rpm and 0.78 mm (31 mils)
at the forward CS near 12,000 rpm. This predicted response would create a significant
rub as the response is expected to exceed the bearing diametral clearance of 0.12 mm (4.8
mils) as shown in Figure 14. Similarly, the 25% torque-50% pressure case predicts a
backward CS near 7,000 rpm with an amplitude of 0.28 mm (11 mils) and a second
backward CS near 11,500 rpm with a response of 0.51 mm (20 mils).
Rotordynamic Response Plot
0
0.1
0.2
0.3
0.4
0.5
0.6
0.7
0.8
0.9
0 2000 4000 6000 8000 10000 12000 14000 16000
Rotor Speed, rpm
Res
pons
e, m
m a
mpl
itude
M ajor Amp
Horz Amp
Vert Amp
Bearing Clearance
Transient Bearing Performance Rotordynamic Analysisby David Klooster
Sta. No. 5: Test Bearing Centerline
Excitation = 1x
Fig. 14 Steady state rotordynamic response plot at test bearing 50% torque-50% pressure
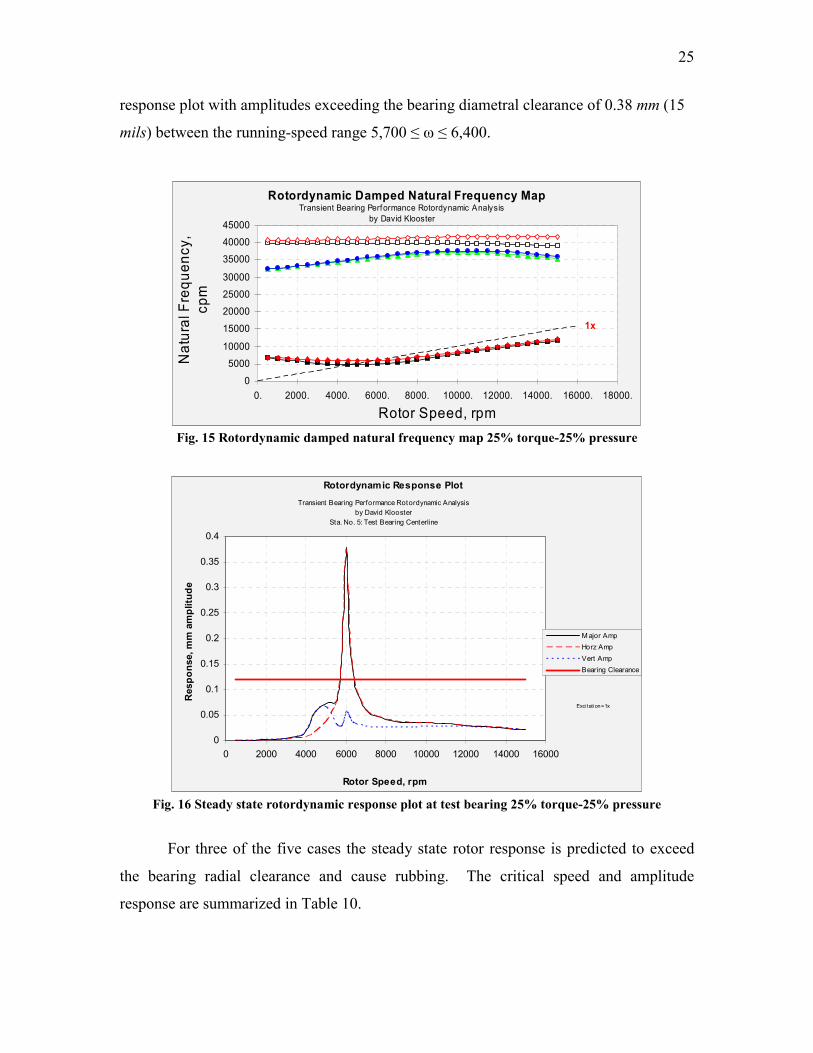
The 25% torque-25% pressure case predicts a backward CS near 5,000 rpm and a
forward CS near 6,000 rpm as shown in Figure 15. Figure 16 shows the rotordynamic
Damped Eigenvalue Mode Shape Plot
f=7989.7 cpmd=.0138 zetaN=8000 rpm
forwardbackward
Damped Eigenvalue Mode Shape Plot
f=11984.6 cpmd=-.006 zeta N=12000 rpm
forward backward
25
response plot with amplitudes exceeding the bearing diametral clearance of 0.38 mm (15
mils) between the running-speed range 5,700 ≤ ω ≤ 6,400.
Rotordynamic Damped Natural Frequency Map
1x
0
5000
10000
15000
20000
25000
30000
35000
40000
45000
0. 2000. 4000. 6000. 8000. 10000. 12000. 14000. 16000. 18000.
Rotor Speed, rpm
Nat
ural
Fre
quen
cy,
cpm
Transient Bearing Performance Rotordynamic Analysisby David Klooster
Fig. 15 Rotordynamic damped natural frequency map 25% torque-25% pressure
Rotordynamic Response Plot
0
0.05
0.1
0.15
0.2
0.25
0.3
0.35
0.4
0 2000 4000 6000 8000 10000 12000 14000 16000
Rotor Speed, rpm
Res
pons
e, m
m a
mpl
itude
M ajor AmpHorz AmpVert AmpBearing Clearance
Transient Bearing Performance Rotordynamic Analysisby David Klooster
Sta. No. 5: Test Bearing Centerline
Exci tation = 1x
Fig. 16 Steady state rotordynamic response plot at test bearing 25% torque-25% pressure
For three of the five cases the steady state rotor response is predicted to exceed
the bearing radial clearance and cause rubbing. The critical speed and amplitude
response are summarized in Table 10.

26
Table 10 Predicted critical speeds for start-transient 1X static unit load cases Order Direction Critical Speed [rpm] Amplitude [mm (mils)]
1st Backward 8,000 0.34 (13)2nd Forward 12,000 0.78 (31)1st Backward 7,000 0.28 (11)2nd Backward 11,500 0.51 (20)1st Backward 5,000 0.07 (2.9)2nd Forward 6,000 0.38 (15)
50% Torque 50% Pressure
25% Torque 50% Pressure
25% Torque 25% Pressure
There are two reasons the proposed test cases in Table 9 will be followed despite
the prediction to rub while passing through a critical speed. The predictions in
XLHydroJet® and XLTRC2 are steady state not transient. A fast acceleration to 15,000
rpm may reduce the predicted response. The author found this to be true. While
maintaining a supply pressure of 8.55 bar (124 psia) the motor was accelerated to 15,000
rpm while the ramp rate was varied between 8824 rpm/s, 4412 rpm/s, and 2206 rpm/s.
Figure 17 shows that with a quick acceleration of 8842 rpm/s and 4412 rpm/s the
amplitude response was much lower than an acceleration of 2206 rpm/s.
0
0.02
0.04
0.06
0.08
0.1
0.12
0.14
0 2000 4000 6000 8000 10000 12000 14000 16000
Speed [rpm]
Am
pli
tud
e [
mm
]
2206 rpm/s
2206 rpm/s
4412 rpm/s
8824 rpm/s
Fig. 17 Amplitude response for varying ramp rate with a constant supply pressure of 8.55 bar

27
The second reason the proposed test cases in Table 9 will be followed is that with
increased unit load the speed at which lift-off occurs is predicted to increase. At very
high unit loads, lift-off is predicted at speeds higher than the critical speeds. Therefore,
since the start-transient testing has a fast acceleration to 15,000 rpm, and at higher unit
loads the lift-off speed is predicted to be higher than the critical speed, the proposed start-
transient test cases in Table 9 were followed.
In each of the 1X and 2X static unit load, for the 50% torque-50% pressure, 25%
torque-50% pressure, and 25% torque-25% pressure start-transient cases, the rotor
hydrostatically lifted-off at the beginning of the start-transient because the initial supply
pressure was greater the applied load. As the speed approached a CS, the rotor’s
amplitude increased, and contact with the bearing occurred causing rubbing. With a
static unit load of 3X or higher, hydrostatic lift-off occurred near or after the predicted
CS, and there was no observation of rub. The data at which the start-transient test began
to rub is shown in Table 11.
Table 11 Observed initial running speed for rub near predicted critical speed
Ramp Rate [rpm/s]
Supply Pressure at 15,000 rpm [bar (psia)]
Unit Load [bar (psi)]
Load Direction Speed [rpm]
Predict Critical Speed [rpm]
Supply Pressure [bar (psia)]
Recess Pressure [bar (psia)]
Pressure Ratio
Case 3 4412 9.63 bar (139.7 psia) 0.263 (3.81) LOR 8916 8000 2.87 (41.6) 1.79 (26.0) 0.62Case 3 4412 9.63 bar (139.7 psia) 0.311 (4.51) LOR 2059 8000 1.98 (28.7) 2.14 (31.0) 1.08Case 4 2206 9.63 bar (139.7 psia) 0.263 (3.81) LOR 5454 7000 1.77 (25.7) 1.90 (27.5) 1.07Case 4 2206 9.63 bar (139.7 psia) 0.311 (4.51) LOR 4557 7000 2.05 (29.8) 2.12 (30.7) 1.03Case 5 2206 5.32 bar (77.2 psia) 0.263 (3.81) LOR 7023 5000 2.11 (30.7) 2.03 (29.4) 0.96Case 5 2206 5.32 bar (77.2 psia) 0.311 (4.51) LOR 5897 5000 2.11 (30.6) 2.19 (31.8) 1.04Case 8 4412 9.63 bar (139.7 psia) 0.282 (4.09) LOL 7555 8000 2.27 (32.9) 1.99 (28.9) 0.88Case 8 4412 9.63 bar (139.7 psia) 0.443 (6.42) LOL 26 8000 2.10 (30.5) 1.91 (27.6) 0.91Case 9 2206 9.63 bar (139.7 psia) 0.282 (4.09) LOL 1172 7000 1.54 (22.3) 1.63 (23.6) 1.06Case 9 2206 9.63 bar (139.7 psia) 0.443 (6.42) LOL 3079 7000 2.06 (29.8) 1.97 (28.6) 0.96
Case 10 2206 5.32 bar (77.2 psia) 0.282 (4.09) LOL 6491 5000 1.91 (27.7) 1.98 (28.7) 1.04Case 10 2206 5.32 bar (77.2 psia) 0.443 (6.42) LOL 1699 5000 2.11 (30.6) 2.12 (30.8) 1.00
For each of the 1X cases the speed at which rub occurs is near the predicted
critical speed. With the exception of one condition the 2X cases begins to rub at a lower
speed than the similar 1X case. This is expected, because at a higher load, the
eccentricity is higher. Therefore, the amplitude response required to cause rub is less
because it is closer to the side of the bearing. The predicted critical speeds are for the 1X
rotor cases and do not match as well. Regardless, even though the start of rubbing is
close to the predicted critical speed it may not matter. The prediction of a critical speed
assumes small motion about an equilibrium point. The predicted amplitudes in Table 10
are large, and that assumption appears to be violated.

28
The condition that the rotor starts and stops rubbing with the bearing for each test
case is presented in the appendix. Childs [14] discusses the rotor-housing response
across an annular clearance. Two models are given for continuous contact between the
rotor and bearing. The first is a synchronous forwardly preccessing motion and the
second is “dry-friction” whip or whirl. The synchronous response model applies here. In
this model the response while the rotor is in contact with the bearing depends on the
interaction between the rotor and stator, and comparison to the predicted speed range the
rotor exceeds the bearing clearance may not be applicable. Nonetheless, the speed and
supply pressure that the rotor starts and stops rubbing is presented in the appendix.
Rub occurring in the present start-transient testing is similar to the first model
discussed by Childs [14], which is a synchronous forwardly preccessing motion. Wilkes
et al. [15] however produced dry-friction whip and whirl on the test rig used here using
impulse excitation. The absence of dry-friction whip and whirl in the present test
program suggests that an external impulse is needed for initiation of this potentially
destructive type of motion.
Hydrostatic Lift-off
Scharrer et al [3,4] and Borchard [5] defined hydrostatic lift-off in terms of the
rotor centerline plot, as the point of departure towards the center of the bearing.
Similarly, hydrostatic lift-off is defined as the point the eccentricity remains 0.00254 mm
(0.1 mils) less than the Cr established by the bump test; this is represented by Eq. (6).
The 0.00254 mm (0.1 mils) distance was selected as it is greater than the assumed surface
roughness of 0.002 mm (0.079 mils). Equation (7) defines the eccentricity while Eq. (8)
defines the eccentricity ratio.
])[1.0(00254.0 milsmmCe r −≤ (6)
22yx eee += (7)
rC
e=0ε (8)

29
Figure 18 displays the definition of hydrostatic lift-off. The eccentricity must be
less than the bearing clearance minus 0.00254 mm (0.1 mils). If the eccentricity is less
than the difference between the Cr and 0.00254 mm (0.1 mils) but increases to a value
greater than this difference, then hydrostatic lift-off has not yet occurred. This
circumstance may happen near the point of hydrostatic lift-off when the supply pressure
is in balance with the applied unit load and the rotor may depart towards the center of the
bearing and then return to the side. Also, a distinction is made between a rub due to
excessive synchronous response and hydrostatic lift-off. If the rotor is hydrostatically
lifted-off and in passing through a critical speed creates a rub with an eccentricity equal
to Cr, this does not negate the prior event of hydrostatic lift-off.
Fig. 18 Definition of hydrostatic lift-off
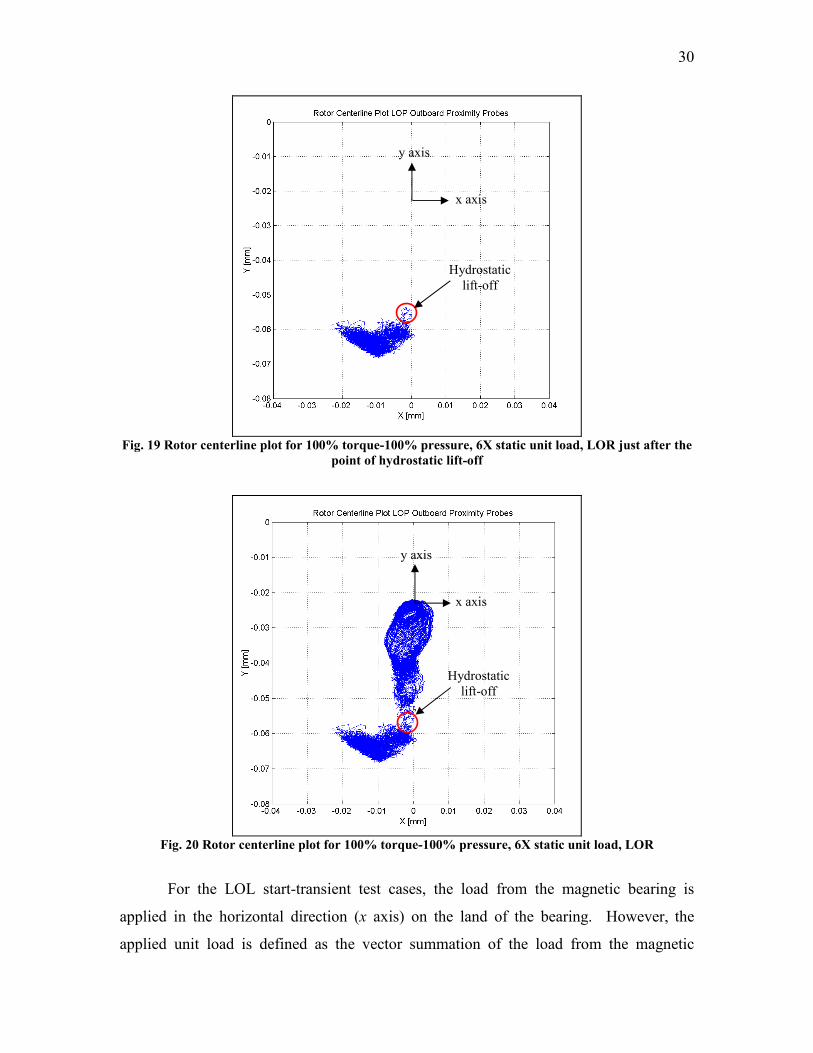
Hydrostatic lift-off is shown graphically in Figure 19 for the 100% torque-100%
pressure, 6X static unit load, LOR start-transient. The rotor rotates along the bottom of
the bearing until the point of hydrostatic lift-off, denoted by the red circle. The rotor
remains above the difference between the Cr and 0.00254 mm (0.1 mils) for the remainder
of the start-transient as shown in Figure 20. For all rotor centerline plots, the bearing
center is located at point (0, 0).
.01 mils
Cr
e
ex
ey
30
Fig. 19 Rotor centerline plot for 100% torque-100% pressure, 6X static unit load, LOR just after the
point of hydrostatic lift-off
Fig. 20 Rotor centerline plot for 100% torque-100% pressure, 6X static unit load, LOR
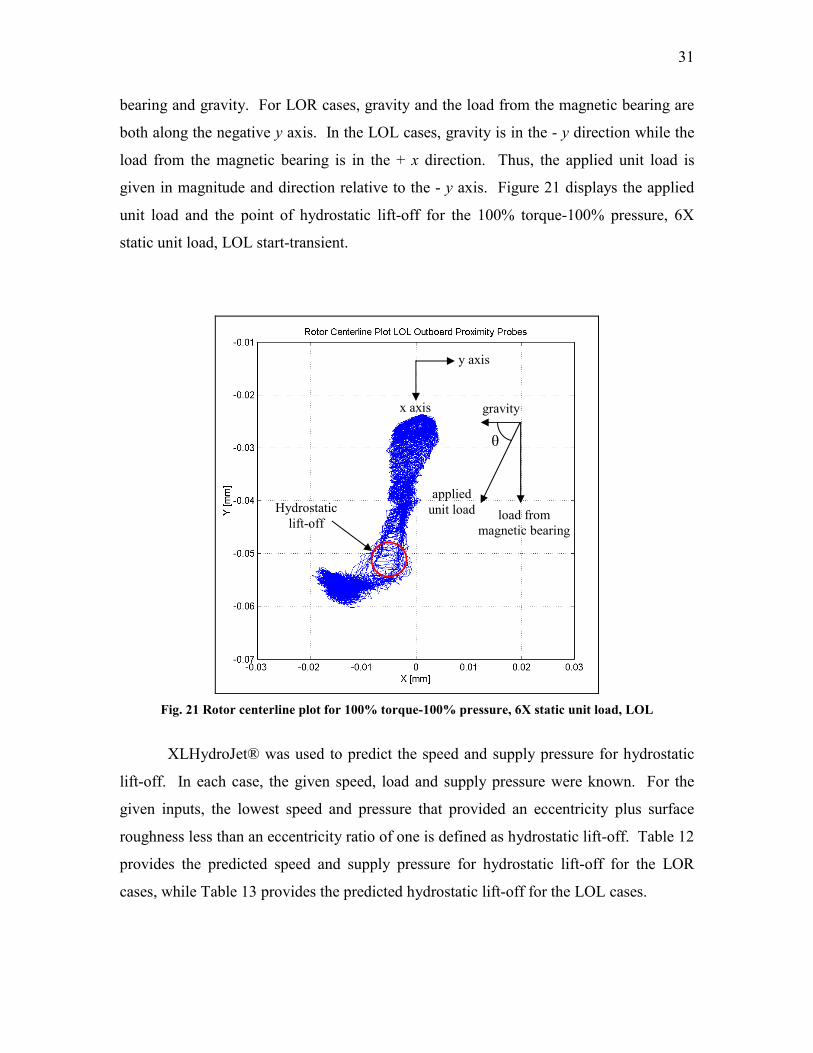
For the LOL start-transient test cases, the load from the magnetic bearing is
applied in the horizontal direction (x axis) on the land of the bearing. However, the
applied unit load is defined as the vector summation of the load from the magnetic
Hydrostatic lift-off
Hydrostatic lift-off
y axis
y axis
x axis
x axis
31
bearing and gravity. For LOR cases, gravity and the load from the magnetic bearing are
both along the negative y axis. In the LOL cases, gravity is in the - y direction while the
load from the magnetic bearing is in the + x direction. Thus, the applied unit load is
given in magnitude and direction relative to the - y axis. Figure 21 displays the applied
unit load and the point of hydrostatic lift-off for the 100% torque-100% pressure, 6X
static unit load, LOL start-transient.
Fig. 21 Rotor centerline plot for 100% torque-100% pressure, 6X static unit load, LOL
XLHydroJet® was used to predict the speed and supply pressure for hydrostatic
lift-off. In each case, the given speed, load and supply pressure were known. For the
given inputs, the lowest speed and pressure that provided an eccentricity plus surface
roughness less than an eccentricity ratio of one is defined as hydrostatic lift-off. Table 12
provides the predicted speed and supply pressure for hydrostatic lift-off for the LOR
cases, while Table 13 provides the predicted hydrostatic lift-off for the LOL cases.
Hydrostatic lift-off
y axis
x axis gravity
load from magnetic bearing
applied unit load
θ

32
Table 12 Predicted speed and supply pressure for hydrostatic lift-off, LOR Ramp Rate
[rpm/s]Supply Pressure at 15,000
rpm [bar (psia)]Load [N
(lbf )]Lift-off speed
[rpm]Lift-off supply
pressure [bar (psia)]Case 1 8824 18.25 bar (264.7 psia) 31.1 (7) 0 1.98 (28.7)Case 1 8824 18.25 bar (264.7 psia) 62.3 (14) 4500 2.19 (31.8)Case 1 8824 18.25 bar (264.7 psia) 93.4 (21) 5500 2.81 (40.8)Case 1 8824 18.25 bar (264.7 psia) 125 (28) 6500 3.70 (53.7)Case 1 8824 18.25 bar (264.7 psia) 156 (35) 7000 4.12 (59.8)Case 1 8824 18.25 bar (264.7 psia) 187 (42) 8000 5.22 (75.7)Case 1 8824 18.25 bar (264.7 psia) 218 (49) 8500 5.84 (84.7)Case 1 8824 18.25 bar (264.7 psia) 249 (56) 9000 6.46 (93.7)Case 2 4412 18.25 bar (264.7 psia) 31.1 (7) 0 1.98 (28.7)Case 2 4412 18.25 bar (264.7 psia) 62.3 (14) 500 2.25 (32.6)Case 2 4412 18.25 bar (264.7 psia) 93.4 (21) 3500 2.74 (39.7)Case 2 4412 18.25 bar (264.7 psia) 125 (28) 6500 3.22 (46.7)Case 2 4412 18.25 bar (264.7 psia) 156 (35) 9000 4.12 (59.8)Case 2 4412 18.25 bar (264.7 psia) 187 (42) 10500 5.36 (77.7)Case 2 4412 18.25 bar (264.7 psia) 218 (49) 11000 6.05 (87.7)Case 3 4412 9.63 bar (139.7 psia) 31.1 (7) 0 1.98 (28.7)Case 3 4412 9.63 bar (139.7 psia) 62.3 (14) 8500 2.25 (32.6)Case 3 4412 9.63 bar (139.7 psia) 93.4 (21) 9500 2.60 (37.7)Case 3 4412 9.63 bar (139.7 psia) 125 (28) 11500 3.43 (49.7)Case 3 4412 9.63 bar (139.7 psia) 156 (35) 12500 4.19 (60.8)Case 4 2206 9.63 bar (139.7 psia) 31.1 (7) 0 1.98 (28.7)Case 4 2206 9.63 bar (139.7 psia) 62.3 (14) 8500 2.25 (32.6)Case 4 2206 9.63 bar (139.7 psia) 93.4 (21) 10000 2.81 (40.8)Case 4 2206 9.63 bar (139.7 psia) 125 (28) 11500 3.56 (51.6)Case 5 2206 5.32 bar (77.2 psia) 31.1 (7) 0 1.98 (28.7)Case 5 2206 5.32 bar (77.2 psia) 62.3 (14) 12000 2.32 (33.6)Case 5 2206 5.32 bar (77.2 psia) 93.4 (21) 13000 2.88 (41.8)
Table 13 Predicted speed and supply pressure for hydrostatic lift-off, LOL
Ramp Rate [rpm/s]Supply Pressure at 15,000
rpm [bar (psia)] Load [N (lbf )] Lift-off speed [rpm]Lift-off supply
pressure [bar (psia)]Case 6 8824 18.25 bar (264.7 psia) 31.1 (7) 0 1.98 (28.7)Case 6 8824 18.25 bar (264.7 psia) 62.3 (14) 5000 2.46 (35.7)Case 6 8824 18.25 bar (264.7 psia) 93.4 (21) 5500 2.81 (40.8)Case 6 8824 18.25 bar (264.7 psia) 125 (28) 6500 3.70 (53.7)Case 6 8824 18.25 bar (264.7 psia) 156 (35) 7000 4.12 (59.8)Case 6 8824 18.25 bar (264.7 psia) 187 (42) 8000 5.22 (75.7)Case 6 8824 18.25 bar (264.7 psia) 218 (49) 8500 5.84 (84.7)Case 6 8824 18.25 bar (264.7 psia) 249 (56) 9000 6.46 (93.7)Case 7 4412 18.25 bar (264.7 psia) 31.1 (7) 0 1.98 (28.7)Case 7 4412 18.25 bar (264.7 psia) 62.3 (14) 500 2.25 (32.6)Case 7 4412 18.25 bar (264.7 psia) 93.4 (21) 4000 2.81 (40.8)Case 7 4412 18.25 bar (264.7 psia) 125 (28) 7500 3.43 (49.7)Case 7 4412 18.25 bar (264.7 psia) 156 (35) 9000 4.12 (59.8)Case 7 4412 18.25 bar (264.7 psia) 187 (42) 10000 4.67 (67.7)Case 7 4412 18.25 bar (264.7 psia) 218 (49) 11000 6.05 (87.7)Case 8 4412 9.63 bar (139.7 psia) 31.1 (7) 0 1.98 (28.7)Case 8 4412 9.63 bar (139.7 psia) 62.3 (14) 8500 2.25 (32.6)Case 8 4412 9.63 bar (139.7 psia) 93.4 (21) 9500 2.60 (37.7)Case 8 4412 9.63 bar (139.7 psia) 125 (28) 11500 3.43 (49.7)Case 8 4412 9.63 bar (139.7 psia) 156 (35) 12500 4.19 (60.8)Case 9 2206 9.63 bar (139.7 psia) 31.1 (7) 0 1.98 (28.7)Case 9 2206 9.63 bar (139.7 psia) 62.3 (14) 9000 2.25 (32.6)Case 9 2206 9.63 bar (139.7 psia) 93.4 (21) 10000 2.81 (40.8)Case 9 2206 9.63 bar (139.7 psia) 125 (28) 11500 3.56 (51.6)Case 10 2206 5.32 bar (77.2 psia) 31.1 (7) 0 1.98 (28.7)Case 10 2206 5.32 bar (77.2 psia) 62.3 (14) 12000 2.32 (33.6)Case 10 2206 5.32 bar (77.2 psia) 93.4 (21) 13000 2.88 (41.8)
By the current definition of hydrostatic lift-off, Table 14 provides the observed
speed, supply and recess pressure, pressure ratio, supply temperature, and flow rate at the
point of hydrostatic lift-off for the LOR start-transient cases, which correspond to cases

33
1-5 in Table 9. The data for the LOL start-transient cases are in Table 15, which
correspond to cases 6-10 in Table 9. Hydrodynamic lift-off occurs when the rotation of
the rotor relative to the static bearing surface drags fluid into the film creating a wedge
effect generating hydrodynamic pressures that overcome the forces acting on the rotor
[16]. As with Borchard [5], no clear indication of hydrodynamic lift-off was observed.
Table 14 Hydrostatic lift-off data for start-transient testing with air, LOR Ramp Rate
[rpm/s]Supply Pressure at
15,000 rpm [bar (psia)]Unit Load [bar (psi)]
Direction of load [rad (deg)]
Speed [rpm]
Supply Pressure [bar (psia)]
Recess Pressure [bar (psia)]
Pressure Ratio
Supply Temperature [°C (°F)]
Flow Rate [kg/s]
8824 18.25 bar (264.7 psia) 0.263 (3.81) 0 (0) 0 2.08 (30.2) 1.98 (28.7) 0.95 19.8 (67.7) 0.00228824 18.25 bar (264.7 psia) 0.311 (4.51) 0 (0) 0 2.30 (33.4) 2.33 (33.8) 1.01 20.8 (69.4) 0.00258824 18.25 bar (264.7 psia) 0.433 (6.27) 0 (0) 5159 2.71 (39.3) 2.74 (39.8) 1.01 20.4 (68.7) 0.00508824 18.25 bar (264.7 psia) 0.614 (8.91) 0 (0) 5587 3.09 (44.8) 3.02 (43.9) 0.98 21.3 (70.3) 0.00658824 18.25 bar (264.7 psia) 0.823 (11.9) 0 (0) 7803 5.42 (78.6) 5.47 (79.3) 1.01 19.6 (67.2) 0.01258824 18.25 bar (264.7 psia) 1.05 (15.2) 0 (0) 8798 6.41 (92.9) 6.35 (92.1) 0.99 19.5 (67.0) 0.01428824 18.25 bar (264.7 psia) 1.28 (18.5) 0 (0) 10387 9.08 (132) 9.05 (131) 1.00 19.4 (67.0) 0.01838824 18.25 bar (264.7 psia) 1.53 (22.2) 0 (0) 12337 10.7 (155) 10.5 (152) 0.98 19.4 (66.9) 0.02054412 18.25 bar (264.7 psia) 0.263 (3.81) 0 (0) 0 2.01 (29.2) 1.90 (27.6) 0.95 20.8 (69.4) 0.00214412 18.25 bar (264.7 psia) 0.311 (4.51) 0 (0) 0 2.29 (33.3) 2.45 (35.5) 1.07 20.6 (69.1) 0.00234412 18.25 bar (264.7 psia) 0.433 (6.27) 0 (0) 2154 2.50 (36.2) 2.64 (38.2) 1.06 19.7 (67.4) 0.00334412 18.25 bar (264.7 psia) 0.614 (8.91) 0 (0) 7808 3.76 (54.5) 3.72 (54.0) 0.99 19.5 (67.1) 0.00574412 18.25 bar (264.7 psia) 0.823 (11.9) 0 (0) 7907 4.18 (60.7) 4.28 (62.0) 1.02 21.7 (71.7) 0.00624412 18.25 bar (264.7 psia) 1.05 (15.2) 0 (0) 11062 6.44 (93.5) 6.38 (92.5) 0.99 20.2 (68.3) 0.01144412 18.25 bar (264.7 psia) 1.28 (18.5) 0 (0) 12642 9.52 (138) 9.54 (138) 1.00 20.5 (68.8) 0.01824412 9.63 bar (139.7 psia) 0.263 (3.81) 0 (0) 0 1.67 (24.2) 1.77 (25.6) 1.06 20.7 (69.3) 0.00234412 9.63 bar (139.7 psia) 0.311 (4.51) 0 (0) 0 2.00 (29.0) 2.08 (30.2) 1.04 20.3 (68.6) 0.00214412 9.63 bar (139.7 psia) 0.433 (6.27) 0 (0) 7737 2.51 (36.4) 2.68 (38.9) 1.07 20.6 (69.1) 0.00294412 9.63 bar (139.7 psia) 0.614 (8.91) 0 (0) 10842 3.34 (48.5) 3.49 (50.6) 1.04 21.4 (70.6) 0.00474412 9.63 bar (139.7 psia) 0.823 (11.9) 0 (0) 11665 3.85 (55.8) 3.92 (56.8) 1.02 21.8 (71.3) 0.00572206 9.63 bar (139.7 psia) 0.263 (3.81) 0 (0) 0 1.92 (27.9) 1.89 (27.4) 0.98 18.6 (65.4) 0.00212206 9.63 bar (139.7 psia) 0.311 (4.51) 0 (0) 0 2.06 (29.9) 2.16 (31.4) 1.05 20.8 (69.4) 0.00222206 9.63 bar (139.7 psia) 0.433 (6.27) 0 (0) 10330 3.33 (48.2) 3.52 (51.0) 1.06 21.2 (70.1) 0.00412206 9.63 bar (139.7 psia) 0.614 (8.91) 0 (0) 10845 3.36 (48.7) 3.44 (49.9) 1.02 20.7 (69.3) 0.00442206 5.32 bar (77.2 psia) 0.263 (3.81) 0 (0) 0 2.08 (30.1) 2.00 (29.0) 0.96 20.9 (69.6) 0.00232206 5.32 bar (77.2 psia) 0.311 (4.51) 0 (0) 0 2.11 (30.6) 2.12 (30.7) 1.00 19.7 (67.5) 0.00242206 5.32 bar (77.2 psia) 0.433 (6.27) 0 (0) 9043 2.44 (35.4) 2.50 (36.2) 1.02 19.8 (67.7) 0.0026
Table 15 Hydrostatic lift-off data for start-transient testing with air, LOL
Ramp Rate [rpm/s]
Supply Pressure at 15,000 rpm [bar (psia)]
Unit Load [bar (psi)]
Direction of load [rad (deg)]
Speed [rpm]
Supply Pressure [bar (psia)]
Recess Pressure [bar (psia)]
Pressure Ratio
Supply Temperature [°C (°F)]
Flow Rate [kg/s]
8824 18.25 bar (264.7 psia) 0.282 (4.09) 0.705 (40.4) 0 1.70 (24.7) 1.78 (25.8) 1.05 20.6 (69.0) 0.00178824 18.25 bar (264.7 psia) 0.443 (6.42) 1.07 (61.0) 0 2.38 (34.6) 2.26 (32.7) 0.95 20.8 (69.4) 0.00338824 18.25 bar (264.7 psia) 0.659 (9.56) 1.24 (71.0) 4910 2.97 (43.1) 2.30 (33.4) 0.77 20.4 (68.7) 0.00688824 18.25 bar (264.7 psia) 0.898 (13.0) 1.33 (76.2) 6450 4.62 (67.0) 3.40 (49.2) 0.74 21.3 (70.4) 0.01068824 18.25 bar (264.7 psia) 1.15 (16.6) 1.38 (79.2) 8061 6.10 (88.5) 4.14 (60.1) 0.68 21.7 (71.0) 0.01398824 18.25 bar (264.7 psia) 1.41 (20.4) 1.42 (81.2) 8939 7.49 (109) 4.90 (71.1) 0.65 19.9 (67.8) 0.01648824 18.25 bar (264.7 psia) 1.68 (24.3) 1.44 (82.7) 9232 7.55 (110) 4.80 (69.6) 0.64 19.4 (67.0) 0.01578824 18.25 bar (264.7 psia) 1.97 (28.6) 1.46 (83.7) 10614 9.18 (133) 5.62 (81.5) 0.61 19.4 (67.0) 0.01824412 18.25 bar (264.7 psia) 0.282 (4.09) 0.705 (40.4) 0 2.26 (32.8) 2.12 (30.8) 0.94 20.8 (69.4) 0.00264412 18.25 bar (264.7 psia) 0.443 (6.42) 1.07 (61.0) 3236 2.45 (35.5) 2.12 (30.8) 0.87 20.5 (68.9) 0.00354412 18.25 bar (264.7 psia) 0.659 (9.56) 1.24 (71.0) 6747 3.52 (51.0) 2.71 (39.4) 0.77 20.3 (68.6) 0.00474412 18.25 bar (264.7 psia) 0.898 (13.0) 1.33 (76.2) 10263 5.13 (74.5) 3.58 (51.9) 0.70 21.5 (70.7) 0.00754412 18.25 bar (264.7 psia) 1.15 (16.6) 1.38 (79.2) 10835 5.81 (84.2) 3.95 (57.3) 0.68 19.8 (67.6) 0.01024412 18.25 bar (264.7 psia) 1.41 (20.4) 1.42 (81.2) 11282 6.89 (99.9) 4.36 (63.2) 0.63 19.7 (67.5) 0.01254412 18.25 bar (264.7 psia) 1.68 (24.3) 1.44 (82.7) 12920 9.64 (140) 6.36 (92.2) 0.66 19.7 (67.5) 0.01764412 9.63 bar (139.7 psia) 0.282 (4.09) 0.705 (40.4) 0 2.22 (32.1) 2.11 (30.6) 0.95 20.7 (69.3) 0.00254412 9.63 bar (139.7 psia) 0.443 (6.42) 1.07 (61.0) 0 2.05 (29.8) 1.83 (26.6) 0.89 18.2 (61.0) 0.00214412 9.63 bar (139.7 psia) 0.659 (9.56) 1.24 (71.0) 9885 2.89 (42.0) 2.20 (31.9) 0.76 20.8 (69.5) 0.00354412 9.63 bar (139.7 psia) 0.898 (13.0) 1.33 (76.2) 11989 4.12 (59.8) 3.03 (44.0) 0.74 21.5 (70.7) 0.00674412 9.63 bar (139.7 psia) 1.15 (16.6) 1.38 (79.2) 12980 5.00 (72.5) 3.25 (47.1) 0.65 17.9 (64.3) 0.00922206 9.63 bar (139.7 psia) 0.282 (4.09) 0.705 (40.4) 0 1.53 (22.1) 1.57(22.8) 1.03 19.2 (66.5) 0.00122206 9.63 bar (139.7 psia) 0.443 (6.42) 1.07 (61.0) 0 2.22 (32.2) 2.00 (29.0) 0.90 19.6 (67.2) 0.00282206 9.63 bar (139.7 psia) 0.659 (9.56) 1.24 (71.0) 10151 3.30 (47.9) 3.04 (44.1) 0.92 19.9 (67.9) 0.00402206 9.63 bar (139.7 psia) 0.898 (13.0) 1.33 (76.2) 11376 3.69 (53.5) 2.57 (37.2) 0.70 19.9 (67.9) 0.00452206 5.32 bar (77.2 psia) 0.282 (4.09) 0.705 (40.4) 0 2.49 (36.1) 2.22 (32.1) 0.89 19.5(67.2) 0.00312206 5.32 bar (77.2 psia) 0.443 (6.42) 1.07 (61.0) 0 2.25 (32.7) 2.12 (30.8) 0.94 21.0 (69.8) 0.00252206 5.32 bar (77.2 psia) 0.659 (9.56) 1.24 (71.0) 12688 2.84 (41.2) 2.41 (35.0) 0.85 21.2 (70.1) 0.0037

34
The pressure ratio for the LOR cases in Table 14 are nearly one; this is because
the rotor is covering the recess where the recess pressure measurement is being taken.
Since there is very little flow while the rotor is covering the recess, the recess pressure
should equal the supply pressure. In the LOL case the rotor is forced to the side of the
bearing on the land allowing for flow out of the bottom recess while the rotor is still in
contact with the bearing and a pressure ratio less than one at hydrostatic lift-off. Also, as
the applied unit load increases the pressure ratio at hydrostatic lift-off decreases. Even
though the applied unit load is towards the side, gravity is forcing the rotor towards the
bottom recess where the recess pressure measurement is being taken. Thus, a lower
applied unit load results in a lower attitude angle, which may restrict flow out of the
bottom recess and account for the higher pressure ratio in the LOL start-transient cases.
The start transient cases were conducted to see how hydrostatic lift-off (the speed
and supply pressure that occur at hydrostatic lift-off) depends on the applied unit load,
the final supply pressure at 15,000 rpm, and the ramp rate. Figure 22 shows the supply
pressure at hydrostatic lift-off versus the applied unit load for the LOR start-transient test
cases. The increasing applied unit load in Figure 22 for case 1 correspond to the
proposed 1X - 8X applied unit loads in Table 9, while the applied unit loads for case 2
correspond to the 1X - 7X cases. Cases 1 and 2 have the same supply pressure of 18.25
bar (264.7 psia) at 15,000 rpm but differ in that the ramp rate in case 2 is half of case 1 at
4412 rpm/s.

35
0.0
2.0
4.0
6.0
8.0
10.0
12.0
0 0.2 0.4 0.6 0.8 1 1.2 1.4 1.6 1.8
Applied Unit Load [bar]
Supp
ly P
ress
ure
[bar
]
Case 1Case 2Case 3Case 4Case 5Linear (Case 1Linear (Case 2Linear (Case 3Linear (Case 4Linear (Case 5
Fig. 22 Hydrostatic lift-off supply pressure versus applied unit load for the LOR cases
The increasing applied unit load for cases 3, 4, and 5 in Figure 22 correspond to
the 1X – 5X, 1X – 4X, and 1X – 3X applied unit loads in Table 9, respectively. The
ramp rate in case 3 is the same as case 2 but the supply pressure at 15,000 rpm is 9.63 bar
(139.7 psia). The supply pressure in case 4 is the same as case 3 but the ramp rate is
2206 rpm/s. Case 4 and 5 have the same ramp rate but the supply pressure in case 5 is
5.32 bar (77.2 psia).
Figure 23 shows the supply pressure at hydrostatic lift-off versus the applied unit
load for the LOL start-transient test cases. Similar to Figure 22, the increasing applied
unit load in Figure 23 correspond to the increasing applied unit loads for cases 6-10 in
Table 9. Also, the previously described similarities and differences between cases 1-5
are the same as cases 6-10, respectively. Note that the 1X cases in Figure 23 have a
higher hydrostatic lift-off supply pressure than the trend lines. This is because
hydrostatic lift-off occurred before the start of the start transient test, and the lowest
recorded supply pressure is the hydrostatic lift-off supply pressure. Figure 22 and Figure

36
23 both support the following conclusion; the required supply pressure for hydrostatic
lift-off is approximately a linear function of the applied unit load.
0.0
2.0
4.0
6.0
8.0
10.0
12.0
0 0.5 1 1.5 2 2.5
Applied Unit Load [bar]
Supp
ly P
ress
ure
[bar
]
Case 6
Case 7
Case 8
Case 9
Case 10
Linear (Case 6
Linear (Case 7
Linear (Case 8
Fig. 23 Hydrostatic lift-off supply pressure versus applied unit load for the LOL cases
To understand how the supply pressure at 15,000 rpm affects hydrostatic lift-off,
cases with similar ramp rates and direction of the applied unit load but different supply
pressures at 15,000 rpm are compared. Case 2 and case 3 are both LOR start-transient
cases and have the same ramp rate of 4412 rpm/s. However, the supply pressure at
15,000 rpm in case 2 is 18.25 bar (264.7 psia) and 9.63 bar (139.7 psia) in case 3. As the
supply pressure drops from case 2 to case 3, the required supply pressure for hydrostatic
lift-off in Figure 22 appears to decreases. This conclusion is supported by comparing
cases 7 to 8 in Figure 23, which are both LOL start-transient cases. Both have the same
ramp rate but, as with cases 2 and 3, differ in supply pressure at 15,000 rpm. Comparing
cases 4 to 5, or cases 9 to 10 does not support this conclusion, the change in supply
pressure at 15,000 rpm shows no change in hydrostatic lift-off supply pressure.
However, this may be due to the small sample size due to the limit in applied unit load.
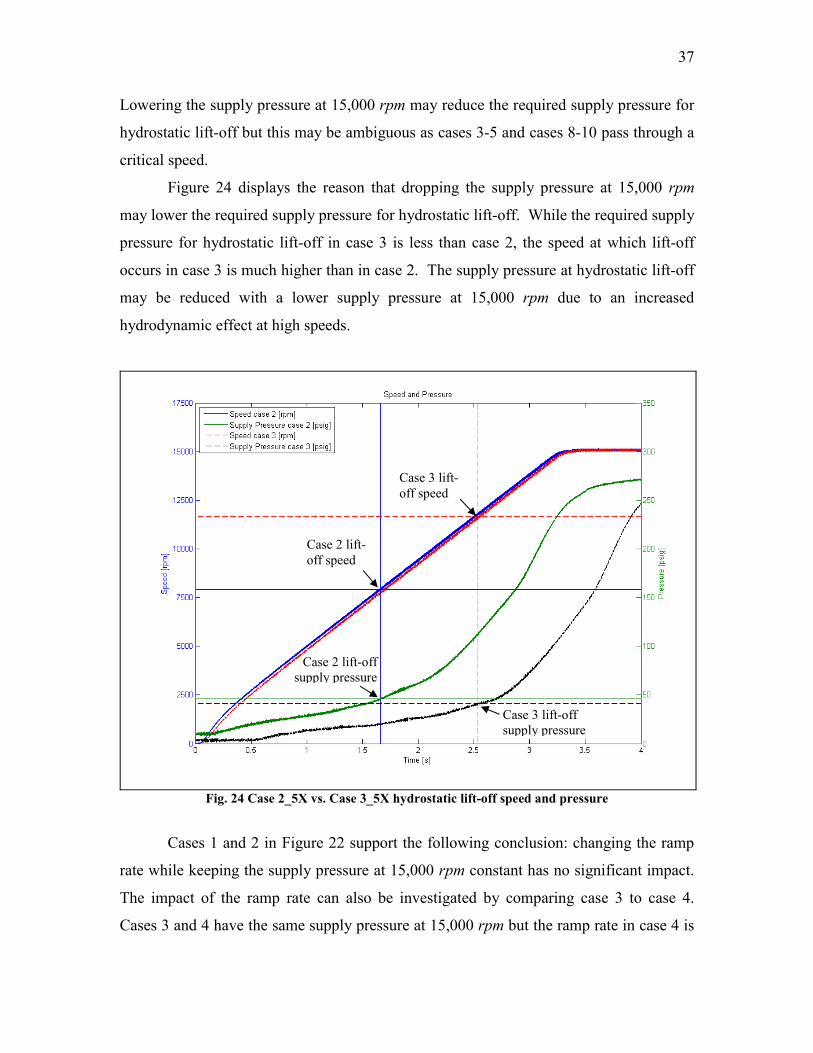
37
Lowering the supply pressure at 15,000 rpm may reduce the required supply pressure for
hydrostatic lift-off but this may be ambiguous as cases 3-5 and cases 8-10 pass through a
critical speed.
Figure 24 displays the reason that dropping the supply pressure at 15,000 rpm
may lower the required supply pressure for hydrostatic lift-off. While the required supply
pressure for hydrostatic lift-off in case 3 is less than case 2, the speed at which lift-off
occurs in case 3 is much higher than in case 2. The supply pressure at hydrostatic lift-off
may be reduced with a lower supply pressure at 15,000 rpm due to an increased
hydrodynamic effect at high speeds.
Fig. 24 Case 2_5X vs. Case 3_5X hydrostatic lift-off speed and pressure
Cases 1 and 2 in Figure 22 support the following conclusion: changing the ramp
rate while keeping the supply pressure at 15,000 rpm constant has no significant impact.
The impact of the ramp rate can also be investigated by comparing case 3 to case 4.
Cases 3 and 4 have the same supply pressure at 15,000 rpm but the ramp rate in case 4 is
Case 2 lift-off speed
Case 3 lift-off speed
Case 2 lift-off supply pressure
Case 3 lift-off supply pressure

38
half that of case 3 at 2206 rpm/s. Here it appears that decreasing the ramp rate from 4412
rpm/s to 2206 rpm/s increases the required supply pressure for hydrostatic lift-off.
Similar to the comparison of case 1 and 2, case 6 has the same supply pressure at 15,000
rpm as case 7 but the ramp rate for case 7 is half that of case 6 at 4412 rpm/s. This
comparison supports the same conclusion as case 1 and 2. The comparison of case 8 to
case 9 also supports this conclusion. The similarities of supply pressure at 15,000 rpm
and the difference in ramp rate between cases 8 and 9 are the same as cases 3 and 4. It
appears that the ramp rate while keeping the supply pressure constant has no significant
impact.
As described previously, the supply pressure depends on the speed squared.
Figure 25 displays the hydrostatic lift-off speed versus the applied unit load for the LOR
start-transient test cases. The increasing applied unit loads correspond to the increasing
unit loads in Table 9. In the 1X and 2X cases in Figure 25, the event of hydrostatic lift-
off occurs before the motor starts at 0 rpm. Hydrostatic lift-off speed in Figure 25
increases from case 1 to 2, case 2 to 3, 3 to 4, but decreases from case 4 to 5. Making any
clear conclusions from the hydrostatic lift-off speed is futile. Since hydrostatic lift-off
occurs in the 1X and 2X applied unit load cases at 0 rpm and the hydrostatic lift-off
supply pressure does not appear to have any significant change due to the change in
supply pressure at 15,000 rpm or ramp rate, the event of hydrostatic lift-off does not
depend on speed. Any appearance of a trend is due to the dependence of speed on the
supply pressure at lift-off. These conclusions are similar for the LOL start-transient test
cases as seen in Figure 26.

39
0
2000
4000
6000
8000
10000
12000
14000
0 0.2 0.4 0.6 0.8 1 1.2 1.4 1.6 1.8
Applied Unit Load [bar]
Spee
d [r
pm] Case 1
Case 2Case 3Case 4Case 5
Fig. 25 Hydrostatic lift-off speed versus applied unit load for the LOR cases
0
2000
4000
6000
8000
10000
12000
14000
0 0.5 1 1.5 2 2.5
Applied Unit Load [bar]
Spee
d [r
pm] Case 6
Case 7Case 8Case 9Case 10
Fig. 26 Hydrostatic lift-off speed versus unit load for the LOL cases

40
Figure 27 shows the hydrostatic lift-off supply pressure versus the applied unit
load for cases 1 and 2 and cases 6 and 7 in Table 9. Cases 1 and 2 are LOR start-transient
cases, while cases 6 and 7 are LOL start-transient cases. Figure 27 supports the
conclusion that the required supply pressure for hydrostatic lift-off is approximately a
linear function of the applied unit load. Figure 27 also supports the following conclusion;
the required hydrostatic lift-off supply pressure is less for the LOL start-transient test
cases.
0.0
2.0
4.0
6.0
8.0
10.0
12.0
0 0.5 1 1.5 2 2.5
Applied Unit Load [bar]
Supp
ly P
ress
ure
[bar
] Case 1 - LORCase 2 - LOLCase 6 - LOLCase 7 - LOLLinear (Case 1 - LORLinear (Case 2 - LOLLinear (Case 6 - LOLLinear (Case 7 - LOL
Fig. 27 Supply pressure at lift-off versus unit load for cases 1, 2 (LOR), 6, and 7 (LOL)
Table 12 and Table 13 detailed the predicted speed and supply pressure at
hydrostatic lift-off. Contrary to Figure 27, which shows hydrostatic lift-off for the LOL
cases occurring at a lower supply pressure for a given applied unit load than the LOR, the
predicted results for the LOR and LOL cases do not show a difference between the two in
Figure 28. Figure 28 shows the supply pressure at hydrostatic lift-off versus the applied
unit load for the predicted and actual results in the 100% torque-100% pressure 1X LOR

41
and LOL cases. The supply pressure required for hydrostatic lift-off is predicted to
increase with increasing applied unit load, but the LOR test cases show a higher supply
pressure required for hydrostatic lift-off. The predicted supply pressure for hydrostatic
lift-off in the LOL cases follows the test results rather closely. XLHydroJet® predicts
each input as a steady state; therefore the ramp rate is not taken into account.
0
2
4
6
8
10
12
0 0.5 1 1.5 2 2.5
Applied Unit Load [bar]
Supp
ly P
ress
ure
[bar
]
Case 1 Predicted - LORCase 1 - LORCase 6 Predicted - LOLCase 6 - LOLLinear (Case 1 Predicted - LORLinear (Case 1 - LORLinear (Case 6 Predicted - LOLLinear (Case 6 - LOL
Fig. 28 Predicted and actual hydrostatic lift-off supply pressure versus applied unit load for cases 1
(LOR) and 6 (LOL)
Comparing Forward and Backward 1X Synchronous Amplitudes
A second approach to determine hydrostatic lift-off is to compare the amplitude of
the backward 1X synchronous line to the trend of the forward 1X synchronous line. If
the rotor is forced to the side of the bearing and constrained to move back and forth along
the outside of the bearing, similar to Figure 19, the forward and backward whirl should
be similar. Figure 29 displays the amplitudes of the forward and backward 1X
synchronous lines in the 100% torque-100% pressure, 6X static unit load, LOR case.
Near 9,204 rpm the amplitude of the backward whirl decreases while the amplitude of the
forward whirl increases, indicating hydrostatic lift-off. This compares to the value in

42
Table 14 of 8,798 rpm for the graphical method. Table 16 details the speed of hydrostatic
lift-off using this alternate procedure.
Fig. 29 Forward and backward amplitude for the 100% torque-100% pressure, 6X static unit load,
LOR
Table 16 Hydrostatic lift-off as defined by comparison of the amplitude for the synchronous forward and backward whirl
Ramp Rate [rpm/s]
Supply Pressure at 15,000 rpm [bar (psia)]
Unit Load [bar (psi)]
Lift-off forward vs. backward [rpm]
Ramp Rate [rpm/s]
Supply Pressure at 15,000 rpm [bar (psia)]
Unit Load [bar (psi)]
Lift-off forward vs. backward [rpm]
Case 1 8824 18.25 bar (264.7 psia) 0.263 (3.81) 0 Case 6 8824 18.25 bar (264.7 psia) 0.282 (4.09) 0Case 1 8824 18.25 bar (264.7 psia) 0.311 (4.51) 0 Case 6 8824 18.25 bar (264.7 psia) 0.443 (6.42) 0Case 1 8824 18.25 bar (264.7 psia) 0.433 (6.27) 4338 Case 6 8824 18.25 bar (264.7 psia) 0.659 (9.56) 5023Case 1 8824 18.25 bar (264.7 psia) 0.614 (8.91) 5912 Case 6 8824 18.25 bar (264.7 psia) 0.898 (13.0) 6462Case 1 8824 18.25 bar (264.7 psia) 0.823 (11.9) 9116 Case 6 8824 18.25 bar (264.7 psia) 1.15 (16.6) 6455Case 1 8824 18.25 bar (264.7 psia) 1.05 (15.2) 9204 Case 6 8824 18.25 bar (264.7 psia) 1.41 (20.4) 8302Case 1 8824 18.25 bar (264.7 psia) 1.28 (18.5) 9665 Case 6 8824 18.25 bar (264.7 psia) 1.68 (24.3) 8014Case 1 8824 18.25 bar (264.7 psia) 1.53 (22.2) 11020 Case 6 8824 18.25 bar (264.7 psia) 1.97 (28.6) 8827Case 2 4412 18.25 bar (264.7 psia) 0.263 (3.81) 0 Case 7 4412 18.25 bar (264.7 psia) 0.282 (4.09) 0Case 2 4412 18.25 bar (264.7 psia) 0.311 (4.51) 0 Case 7 4412 18.25 bar (264.7 psia) 0.443 (6.42) 0Case 2 4412 18.25 bar (264.7 psia) 0.433 (6.27) 4422 Case 7 4412 18.25 bar (264.7 psia) 0.659 (9.56) 4868Case 2 4412 18.25 bar (264.7 psia) 0.614 (8.91) 5605 Case 7 4412 18.25 bar (264.7 psia) 0.898 (13.0) 7583Case 2 4412 18.25 bar (264.7 psia) 0.823 (11.9) 8514 Case 7 4412 18.25 bar (264.7 psia) 1.15 (16.6) 8081Case 2 4412 18.25 bar (264.7 psia) 1.05 (15.2) 10590 Case 7 4412 18.25 bar (264.7 psia) 1.41 (20.4) 8645Case 2 4412 18.25 bar (264.7 psia) 1.28 (18.5) 11850 Case 7 4412 18.25 bar (264.7 psia) 1.68 (24.3) 12620Case 3 4412 9.63 bar (139.7 psia) 0.263 (3.81) 0 Case 8 4412 9.63 bar (139.7 psia) 0.282 (4.09) 0Case 3 4412 9.63 bar (139.7 psia) 0.311 (4.51) 0 Case 8 4412 9.63 bar (139.7 psia) 0.443 (6.42) 0Case 3 4412 9.63 bar (139.7 psia) 0.433 (6.27) 5575 Case 8 4412 9.63 bar (139.7 psia) 0.659 (9.56) 7636Case 3 4412 9.63 bar (139.7 psia) 0.614 (8.91) 9637 Case 8 4412 9.63 bar (139.7 psia) 0.898 (13.0) 10670Case 3 4412 9.63 bar (139.7 psia) 0.823 (11.9) 12620 Case 8 4412 9.63 bar (139.7 psia) 1.15 (16.6) 11570Case 4 2206 9.63 bar (139.7 psia) 0.263 (3.81) 0 Case 9 2206 9.63 bar (139.7 psia) 0.282 (4.09) 0Case 4 2206 9.63 bar (139.7 psia) 0.311 (4.51) 0 Case 9 2206 9.63 bar (139.7 psia) 0.443 (6.42) 0Case 4 2206 9.63 bar (139.7 psia) 0.433 (6.27) 7400 Case 9 2206 9.63 bar (139.7 psia) 0.659 (9.56) 7910Case 4 2206 9.63 bar (139.7 psia) 0.614 (8.91) 10080 Case 9 2206 9.63 bar (139.7 psia) 0.898 (13.0) 10410Case 5 2206 5.32 bar (77.2 psia) 0.263 (3.81) 0 Case 10 2206 5.32 bar (77.2 psia) 0.282 (4.09) 0Case 5 2206 5.32 bar (77.2 psia) 0.311 (4.51) 0 Case 10 2206 5.32 bar (77.2 psia) 0.443 (6.42) 0Case 5 2206 5.32 bar (77.2 psia) 0.433 (6.27) 10050 Case 10 2206 5.32 bar (77.2 psia) 0.659 (9.56) 11830

43
Both methods for determining hydrostatic lift-off reveal similar trends. However,
a comparison of the amplitude for the forward and backward whirl is limited by the steps
between each point, and there is not always a clear distinction when the forward and
backward whirl deviate.
Ramp Rate
The ramp rate (drive torque) parameter is varied for different start-transient test
cases. The ROCETS predictions accelerated from zero to 15,000 rpm over 1.7 seconds,
which is referred to as 100% torque. If the acceleration to 15,000 rpm takes 3.4 seconds
or 6.8 seconds, it is referred to as 50% torque or 25% torque, respectively. Figure 30
confirms that the acceleration to 15,000 rpm takes twice or four times as long, but also
that there is a reduction in torque of 50 and 25%. The percent difference between the
maximum drive torque for the 100% torque and 50% torque or 25% torque cases is not
50 and 25 percent, because the maximum drive torque for the 100% torque case is limited
by the motor at 11 N-m (8.1 ft-lbs). However, a comparison of the drive torque before the
drop to 0.30 N-m (0.22 ft-lbs) at a steady 15,000 rpm does confirm the reduction in drive
torque of 50 and 25 percent, respectively.

44
Fig. 30 Drive torque for varying ramp rates
Hydrostatic lift-off may also be estimated by a comparison in drive torque for a
1X case to a higher load case. Figure 31 shows the 100% torque-100% pressure, 1X
static weight case compared to the similar 8X case. Hydrostatic lift-off was determined
graphically by the rotor centerline plot at the point the eccentricity remained 0.00254 mm
(0.1 mils) above Cr. The point of hydrostatic lift-off for the 8X case is shown in Figure
31.

45
Fig. 31 Torque and speed versus time for 100% torque-100% pressure 1X and 8X static unit load,
LOR
Note how the torque for the 8X case follows the 1X case after the point of
hydrostatic lift-off, yet before requires more drive torque to maintain the same speed.
The similarity in drive torque after the point of hydrostatic lift-off is due to the absence of
metal-to-metal contact in both cases, an indication that both have hydrostatically lifted-
off.
This method may only be used in comparing similar cases; for instance, cases
with the same ramp rate and supply pressures at 15,000 rpm. Also, careful attention must
be made that the rotor in the baseline (1X case) is not in contact with the bearing
throughout the start-transient. Metal-to-metal contact due to rubbing before hydrostatic
lift-off or a rub while passing through a critical speed will result in a higher torque. Also,
comparing cases with a similar applied unit load, such as a 1X and 4X cases, makes the
determination of hydrostatic lift-off difficult as the drive torque in each case is similar.
Therefore, comparison of the drive torque only confirms the method for determining
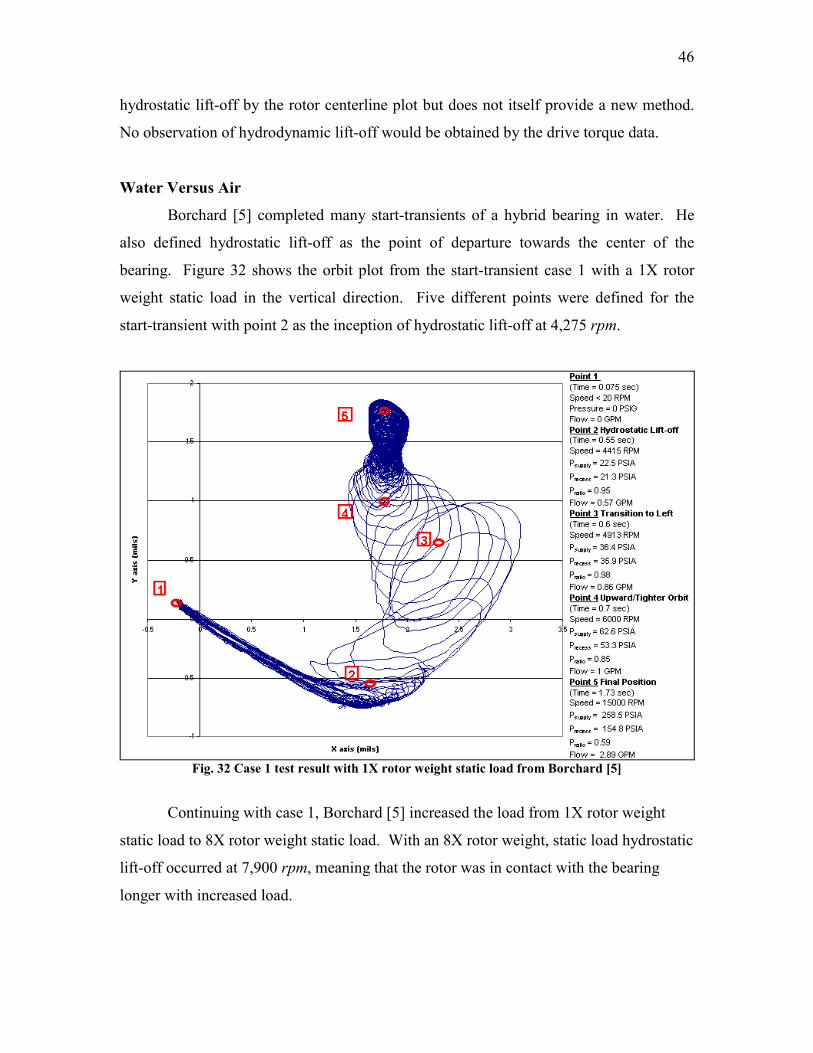
46
hydrostatic lift-off by the rotor centerline plot but does not itself provide a new method.
No observation of hydrodynamic lift-off would be obtained by the drive torque data.
Water Versus Air
Borchard [5] completed many start-transients of a hybrid bearing in water. He
also defined hydrostatic lift-off as the point of departure towards the center of the
bearing. Figure 32 shows the orbit plot from the start-transient case 1 with a 1X rotor
weight static load in the vertical direction. Five different points were defined for the
start-transient with point 2 as the inception of hydrostatic lift-off at 4,275 rpm.
Fig. 32 Case 1 test result with 1X rotor weight static load from Borchard [5]
Continuing with case 1, Borchard [5] increased the load from 1X rotor weight
static load to 8X rotor weight static load. With an 8X rotor weight, static load hydrostatic
lift-off occurred at 7,900 rpm, meaning that the rotor was in contact with the bearing
longer with increased load.

47
In cases 6-10, the static load was applied in the horizontal direction (side)
between two pockets (on land). Figure 33 shows the orbit plot from the start-transient
case 6 with a 1X rotor weight static side load. Hydrostatic lift-off occurred at 8,700 rpm
for the 1X rotor weight static side load, and at 12,640 rpm for the 8X rotor weight static
side load. Again, more load applied to the rotor results in a greater lift-off speed.
Fig. 33 Case 6 test result with 1X rotor weight static side load from Borchard [5]
Table 17 shows the speed at which hydrostatic lift-off occurred for each start-
transient. A more compelling comparison would be to include the supply and recess
pressure as hydrostatic lift-off is highly pressure dependent.
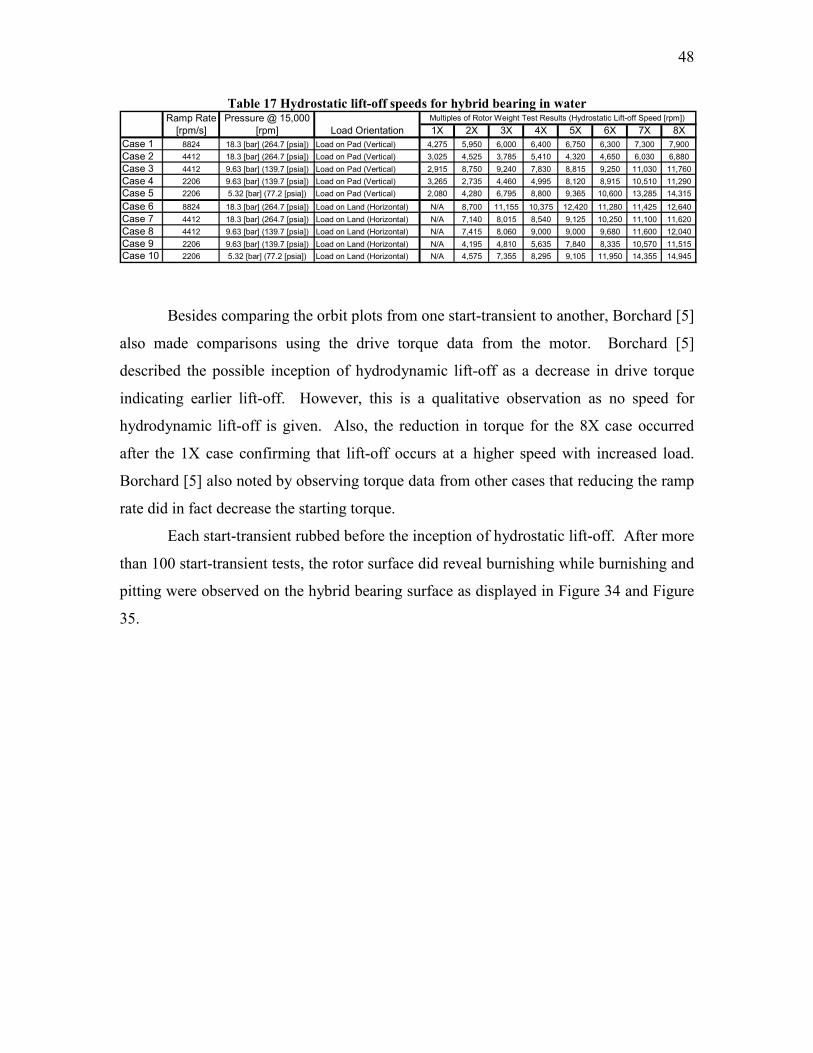
48
Table 17 Hydrostatic lift-off speeds for hybrid bearing in water
1X 2X 3X 4X 5X 6X 7X 8XCase 1 8824 18.3 [bar] (264.7 [psia]) Load on Pad (Vertical) 4,275 5,950 6,000 6,400 6,750 6,300 7,300 7,900Case 2 4412 18.3 [bar] (264.7 [psia]) Load on Pad (Vertical) 3,025 4,525 3,785 5,410 4,320 4,650 6,030 6,880Case 3 4412 9.63 [bar] (139.7 [psia]) Load on Pad (Vertical) 2,915 8,750 9,240 7,830 8,815 9,250 11,030 11,760Case 4 2206 9.63 [bar] (139.7 [psia]) Load on Pad (Vertical) 3,265 2,735 4,460 4,995 8,120 8,915 10,510 11,290Case 5 2206 5.32 [bar] (77.2 [psia]) Load on Pad (Vertical) 2,080 4,280 6,795 8,800 9,365 10,600 13,285 14,315
Case 6 8824 18.3 [bar] (264.7 [psia]) Load on Land (Horizontal) N/A 8,700 11,155 10,375 12,420 11,280 11,425 12,640Case 7 4412 18.3 [bar] (264.7 [psia]) Load on Land (Horizontal) N/A 7,140 8,015 8,540 9,125 10,250 11,100 11,620Case 8 4412 9.63 [bar] (139.7 [psia]) Load on Land (Horizontal) N/A 7,415 8,060 9,000 9,000 9,680 11,600 12,040Case 9 2206 9.63 [bar] (139.7 [psia]) Load on Land (Horizontal) N/A 4,195 4,810 5,635 7,840 8,335 10,570 11,515Case 10 2206 5.32 [bar] (77.2 [psia]) Load on Land (Horizontal) N/A 4,575 7,355 8,295 9,105 11,950 14,355 14,945
Multiples of Rotor Weight Test Results (Hydrostatic Lift-off Speed [rpm]) Ramp Rate [rpm/s]
Pressure @ 15,000 [rpm] Load Orientation
Besides comparing the orbit plots from one start-transient to another, Borchard [5]
also made comparisons using the drive torque data from the motor. Borchard [5]
described the possible inception of hydrodynamic lift-off as a decrease in drive torque
indicating earlier lift-off. However, this is a qualitative observation as no speed for
hydrodynamic lift-off is given. Also, the reduction in torque for the 8X case occurred
after the 1X case confirming that lift-off occurs at a higher speed with increased load.
Borchard [5] also noted by observing torque data from other cases that reducing the ramp
rate did in fact decrease the starting torque.
Each start-transient rubbed before the inception of hydrostatic lift-off. After more
than 100 start-transient tests, the rotor surface did reveal burnishing while burnishing and
pitting were observed on the hybrid bearing surface as displayed in Figure 34 and Figure
35.
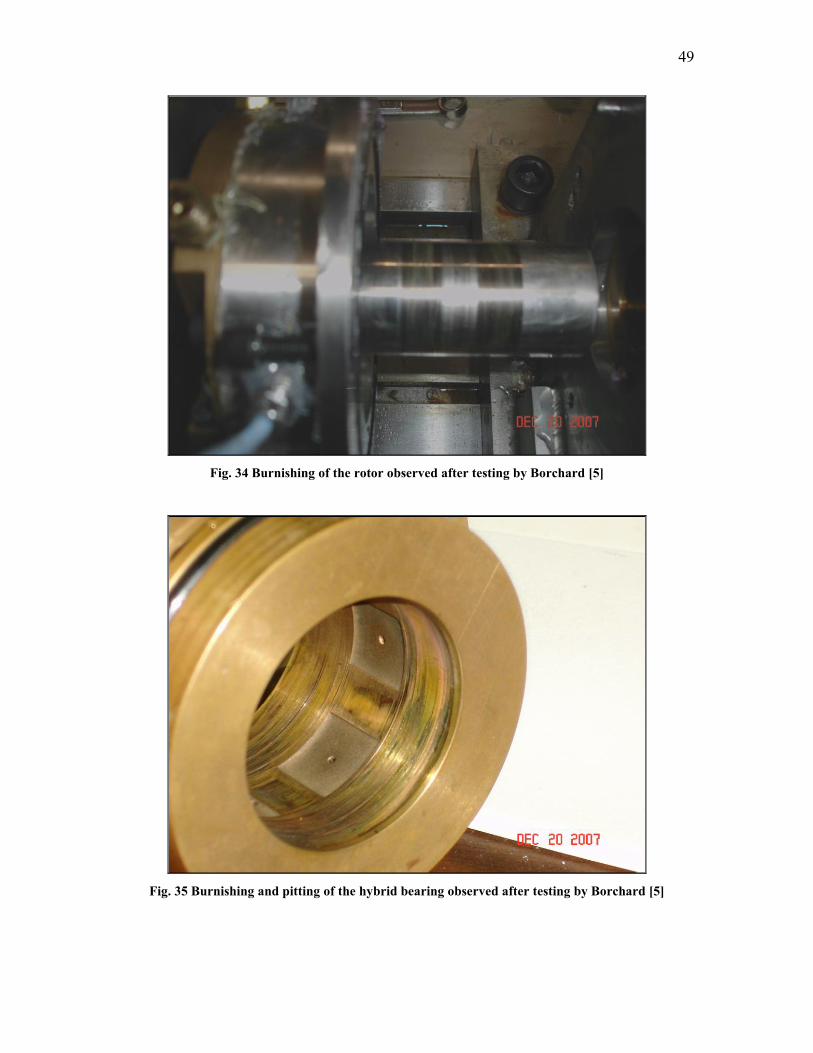
49
Fig. 34 Burnishing of the rotor observed after testing by Borchard [5]
Fig. 35 Burnishing and pitting of the hybrid bearing observed after testing by Borchard [5]

50
Similar trends between the start-transient testing with water and air exist.
Hydrostatic lift-off was determined using a graphical method and is highly pressure
dependent, hydrostatic lift-off speed (thus pressure required for hydrostatic lift-off)
increased with increasing load, and damage to the rotor and bearing surface incurred due
to rubbing. Because hydrostatic lift-off is highly pressure dependent, and the pressure to
speed squared is not in the same proportion between each test, no further comparisons are
made.
Differences in the start-transient testing with water and air are that pneumatic
hammer instability was observed with air and must be predicted and avoided during
testing. Very little damping is present with air, and there is a significant drop in the first
and second natural frequencies. Therefore, passing through a critical speed was
completed successfully but not without rubbing.
Bearing Before and After
During start-transient testing of a hybrid bearing with air, wear occurs due to
metal-to-metal contact before hydrostatic lift-off or rubbing while passing through a
critical speed. This section briefly compares the rotor and bearing surfaces before and
after excess of 100 start-transient tests. Figures 36 and 37 show the rotor before start-
transient testing and burnishing of the rotor following testing.

51
Fig. 36 Rotor before start-transient testing
Fig. 37 Burnishing of the rotor after start-transient testing
Figures 38 and 39 show the bearing surface in the direction of the LOR applied
unit load before and after start-transient testing. While Figures 40 and 41 show a similar
comparison in the direction of the LOL applied unit load. Figure 42 displays the
burnishing of the bearing surface in both direction of applied unit load.

52
Fig. 38 Bearing before start-transient testing with applied unit LOR direction
Fig. 39 Burnishing of the bearing with applied unit load LOR direction
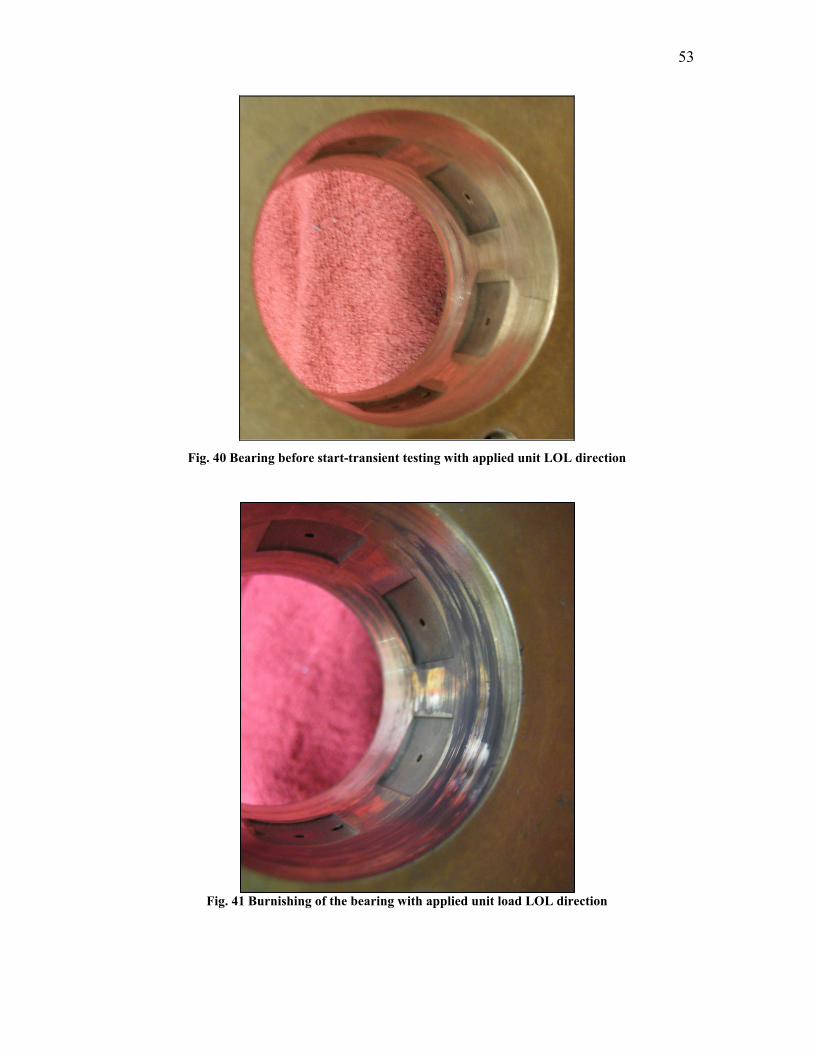
53
Fig. 40 Bearing before start-transient testing with applied unit LOL direction
Fig. 41 Burnishing of the bearing with applied unit load LOL direction

54
Fig. 42 Burnishing of the bearing in the direction of applied unit load after start-transient testing

55
CONCLUSIONS
Start-transient testing of a hybrid bearing with air was successfully completed,
providing an indication of the performance of a hybrid bearing operating in a
compressible fluid medium. Several parameters including the ramp rate, supply pressure
at 15,000 rpm, magnitude of the load, and load orientation were varied. Data are stored
in a .dat file for access by various computer programs for future evaluation of transient
predictions. The current analysis investigates several topics including hydrodynamic and
hydrostatic lift-off with comparisons to steady state predictions and previously acquired
data from start-transient testing with water, rub due to passing through a lightly damped
critical speed, and pneumatic hammer instability.
Hydrodynamic lift-off occurs due to the relative motion of the rotor to bearing
surface in a wedge shape creating a hydrodynamic pressure effect. Hydrodynamic lift-off
could not be confirmed from any of the three methods used to determine hydrostatic lift-
off.
Hydrostatic lift-off occurs due to the increase in external supply pressure (speed
dependent) and defined as the point of departure towards the center of the bearing while
remaining 0.00254 mm (0.1 mils) above the bearing clearance as determined from the
rotor centerline plots. Similar values of hydrostatic lift-off were also determined when
differences in the amplitude of the 1X synchronous forward and backward whirl were
observed as well as variations in the motor torque. Analysis of the rotor centerline plots
are the most reliable way to determine hydrostatic lift-off. Even so, this method is
limited by the inability to accurately measure an established bearing clearance.
Hydrodynamic and hydrostatic lift-off are important quantities to reduce the damage
caused by metal to metal contact between the rotor and bearing surface.
Evaluation of the hydrostatic lift-off supply pressure versus applied unit load
support the following conclusions: (1) the required supply pressure for hydrostatic lift-off
is approximately a linear function of the applied unit load (2) changing the ramp rate
while keeping the supply pressure at 15,000 rpm constant has no significant impact (3)
lowering the supply pressure at 15,000 rpm may reduce the required supply pressure for
hydrostatic lift-off and (4) the LOR start-transient cases required a higher hydrostatic lift-

56
off speed and supply pressure than the corresponding LOL start-transient cases. The
dependence of speed on hydrostatic lift-off is only because the supply pressure is
proportional to the speed squared.
In cases 3-5 and cases 8-10 in Table 9, the start-transient test case passed through
a critical speed, in some cases causing a rub in the start-transient tests that hydrostatically
lifted-off before passing through the critical speed. Yu et al. [17] generated dry-friction
whip caused by rubbing contact while transitioning through a critical speed. Wilkes et al.
[15] produced dry-friction whip and whirl on the same test rig used in the start-transient
testing by impulse excitation. However, during start-transient tests rubbing while
accelerating the rotor through a critical speed produced a synchronous forwardly
preccessing motion.
Steady state predictions for hydrostatic lift-off using XLHydroJet® did well for
the LOL cases but was low for the LOR cases. The ramp rate can not be taken into
account in a steady state prediction. Given these facts and a poor relationship between
the start of rubbing and the critical speed prediction, transient predictions for a hybrid
bearing in air should be completed.
Pneumatic-hammer instability is observed in the hybrid bearing with air as the
fluid medium, and careful attention is required in adaptation to cryogenic applications
such as liquid hydrogen due to it being highly compressible.

57
REFERENCES
[1] Childs, D., and Hale, K., 1994, “A Test Apparatus and Facility to Identify the
Rotordynamic Coefficients of High-Speed Hydrostatic Bearings,” ASME Journal
of Tribology, 116(2), pp. 337-344.
[2] Scharrer, J.K., Tellier, J. and Hibbs, R., 1991, “A Study of the Transient Performance
of Hydrostatic Journal Bearings: Part I-Test Apparatus and Facility,” STLE Paper
91-TC-3B-1.
[3] Scharrer, J.K., Tellier, J. and Hibbs, R., 1991, “A Study of the Transient Performance
of Hydrostatic Journal Bearings: Part II-Experimental Results,” STLE Paper 91-
TC-3B-2.
[4] Sharrer, J., Tellier, J. and Hibbs, R., 1992, “Start Transient Testing of an Annular
Hydrostatic Bearing in Liquid Oxygen,” AIAA Paper 92-3404.
[5] Borchard, R.H., 2008, “Transient Testing Results for an Experimental Hybrid
Bearing,” Texas A&M University Master’s Project Report, Department of
Mechanical Engineering
[6] Pavelek, D., 2006, “Development of a Test Apparatus for Validating Predictions of (i)
Dry-Friction Whirl/Whip and (ii) Transient Hybrid Bearing Performance,” Texas
A&M University Master’s Project Report, Department of Mechanical
Engineering.
[7] “XLHYDROJET: Computational Analyses of Hydrostatic/Hydrodynamic Bearings,”
Texas A&M University. http://phn.tamu.edu/TRIBGroup/Soft_hydrojet_1.htm.
Access date: May 2009.

58
[8] Dyck, B.J., 2007, “Experimental Study of Dry-Friction Whirl and Whip for a Rotor
Supported by an Aannular Rub Surface.” Texas A&M University Master’s
Project Report, Department of Mechanical Engineering.
[9] Mosher, P., and Childs, D., 1998, “Theory Versus Experiment for the Effects of
Pressure Ratio on the Performance of an Orifice-Compensated Hybrid Bearing,”
ASME Journal of Vibration and Acoustics, 120(4), pp. 930-936.
[10] San Andrés, L., 1991, “Fluid Compressibility Effects on the Dynamic Response of
Hydrostatic Journal Bearings,” WEAR, 146, pp.269-283.
[11] Borchard, H., 2007, “Draft: A Report on Pneumatic Hammer Tests,” Texas A&M
University Master’s Project Report, Department of Mechanical Engineering.
[12] Childs, D., 2001 “Stability Insights from Hybrid-Bearing Research at the Texas
A&M University Turbomachinery Laboratory.” Proc. ISCORMA–1, August 22,
Lake Tahoe, CA.
[13] “XLTRC2: Rotordynamics Software Suite,” The Turbomachinery Laboratory,
Texas A&M University. http://turbolab.tamu.edu/research/trc/
XLTRC%202002.pdf. Access date: May 2009.
[14] Childs, D., 1993, Turbomachinery Rotordynamics: Phenomena, Modeling, and
Analysis, John Wiley and Sons, New York.
[15] Wilkes, J., Dyck, B.J., Childs, D., and Phillips, S., 2009, “Measurements Versus
Predictions For Multi-Mode Dry-Friction Whip and Whirl,” Proceedings of IGTI
Turbo Expo, Paper # GT2009-59459, Orlando, FL June.

59
[16] San Andrés, L., 2008, MEEN 626 Course Notes: Introduction to Hydrodynamic
Lubrication, http://phn.tamu.edu/me626/Notes_pdf/Introduction.pdf. Access
date: May, 2009.
[17] Yu, J. J., Goldman, P., and Bently, D., 2000, “Rotor/Seal Experimental and
Analytical Study of Full Annular Rub,” Proc. of ASME IGTI Turboexpo 2000,
ASME, New York, Vol. 2000-GT-389, pp. 1–9.

60
APPENDIX
Magnetic Bearing
SKF manufactures the magnetic bearing exciter that applies the static and
dynamic load to the rotor through a laminated sleeve. To prevent damage to the magnetic
bearing during a power loss, catcher bearings are installed. A controller converts a zero
to five voltage signal to a current which is sent to two axis channels, V24 (horizontal
plane) and W24 (vertical plane). The axes have two degrees of freedom 180 degrees
apart (referred to as Itop and Ibottom). Eq. (9) is used to calculate the force that is applied
by the magnetic bearing.
( ) ( ) obottomtop F
xgI
xgI
CF −⎥⎥⎦
⎤
⎢⎢⎣
⎡⎟⎟⎠
⎞⎜⎜⎝
⎛−
−⎟⎟⎠
⎞⎜⎜⎝
⎛−
=22
22 (9)
The calibrated magnetic bearing has a calibration factor and effective gap that are
constant for both axes (C = 11.341 and g = 535.01). The rotor is centered during
calibration so the offset (x) is assumed to be zero. The calibrated tare is Fo = 0.184 for
the vertical axis while the tare is Fo = -0.06 for the horizontal axis.
Borchard [5] calculated the force required from the magnetic bearing to provide
the correct unit load for each start-transient. Using Eq. (9) Borchard [5] calculated the
correct amp required by the magnetic bearing to apply the correct force to the rotor. The
same method is used for this testing including control of the magnetic bearing in
LabVIEW.
The desired load was to increase by multiples of the rotor weight, 0.263 bar (3.81
psi). However, a reevaluation of the applied load through custom VIs in LabVIEW
revealed an incorrect calculation of load supported by the bearing. The recalculated unit
load is presented in Table 14, Table 15 and Table 19, although not exactly multiples of
the rotor weight.

61
Start-Transient Test Cases
Figure 9 displays the speed, supply and recess pressures for the 50% torque-50%
pressure case against the ROCETS data. The 100% torque-100% pressure, 50% torque-
100% pressure, 25% torque-50% pressure, and 25% torque-25% pressure cases are
compared to the equivalent ROCETS data in Figures 43-46, respectively.
Fig. 43 Comparison between ROCETS data and start-transient test 100% torque-100% pressure

62
Fig. 44 Comparison between ROCETS data and start-transient test 50% torque-100% pressure
Fig. 45 Comparison between ROCETS data and start-transient test 25% torque-50% pressure

63
Fig. 46 Comparison between ROCETS data and start-transient test 25% torque-25% pressure

64
Instrumentation Specification
For start-transient testing of the hybrid bearing with air the data are recorded in a
.dat file for later use. Table 18 details the instrumentation specifications for each sensor.
For start-transient testing with air, some channels recorded in the .dat file are not utilized.
The lift-off voltage recorded in channel seven is not used while channel eight is left
blank. A new flow meter was installed in the modified fluid supply loop; therefore, the
flow meter for water in channel fourteen is not needed. To limit the recess volume added
to the bottom pocket due to the recess pressure-measurement ports, the dynamic pressure
transducer in channel nineteen is removed and filled with wax. The exhaust air exits the
bearing to the room; therefore the exhaust pressure and temperature in channels sixteen
and twenty-one are measuring room temperature and pressure and not needed.

65 Ta
ble
18 In
stru
men
tatio
n sp
ecifi
catio
n fo
r al
l sen
sors
in .d
at fi
le
.dat
file
Loca
tion
Man
ufac
ture
rM
odel
Sens
itivi
tyM
easu
rem
ent R
ange
Fequ
ency
Ran
geSp
eed
1M
ount
ed T
acho
met
erN
IDEC
-SH
IMPO
MC
S-65
5O
nce
per R
ev P
ulse
(Bla
ck/W
hite
)N
/AN
/APr
oxim
ity P
robe
s2-
3Te
st B
earin
g H
ousin
g (O
utbo
ard)
Ben
tly N
evad
a33
00 R
EBA
M®
78.7
mV
/mm
(200
mV
/mil)
0-0.
2 m
m (0
-8 m
il) (±
6.4µ
m, ±
0.25
mil )
0-10
,000
Hz
+5%
, -10
%(2
pro
bes m
ount
ed a
t 90
degr
ees)
3-4
Test
Bea
ring
Hou
sing
(Inb
oard
)B
ently
Nev
ada
3300
REB
AM
®78
.7 m
V/m
m (2
00 m
V/m
il)0-
0.2
mm
(0-8
mil)
(±6.
4µm
, ±0.
25m
il )0-
10,0
00 H
z +5
%, -
10%
(2 p
robe
s mou
nted
at 9
0 de
gree
s)5-
6Su
ppor
t Bea
ring
Hou
sing
Ben
tly N
evad
a33
00 R
EBA
M®
78.7
mV
/mm
(200
mV
/mil)
0-0.
2 m
m (0
-8 m
il) (±
6.4µ
m, ±
0.25
mil )
0-10
,000
Hz
+5%
, -10
%(2
pro
bes m
ount
ed a
t 90
degr
ees)
7Li
ft-of
f Vol
tage
N/A
N/A
N/A
N/A
N/A
8B
lank
2N
/AN
/AN
/AN
/AN
/AA
ccel
erom
eter
s9-
10Su
ppor
t Bea
ring
Hou
sing
PCB
Pie
zotro
nics
352C
3410
mV
/g (±
10%
)±5
0 g
pk0.
5-10
,000
Hz
(±5%
)(2
pro
bes m
ount
ed a
t 90
degr
ees)
0.3-
15,0
00 H
z (±
10%
)11
-12
Test
Bea
ring
Hou
sing
PCB
Pie
zotro
nics
352C
3410
mV
/g (±
10%
)±5
0 g
pk0.
5-10
,000
Hz
(±5%
)(2
pro
bes m
ount
ed a
t 90
degr
ees)
0.3-
15,0
00 H
z (±
10%
)13
Driv
e M
otor
Cas
ing
PCB
Pie
zotro
nics
393A
0310
00 m
V/g
(±5%
)±5
g p
k0.
5-2,
000
Hz
(±5%
)(1
pro
be m
ount
ed b
y su
ppor
t bea
ring)
0.3-
4,00
0 H
z (±
10%
)Fl
ow M
eter
(Wat
er)
14Fl
ow M
eter
Flow
Tec
hnol
ogy
FT-0
8AEX
W-L
EG-5
N/A
0.06
6-2.
64 L
iters
/min
(0.2
5-10
gpm
)N
/A(M
ount
ed b
efor
e te
st b
earin
g)Sp
eed
15En
code
r Spe
edN
/AN
/AN
/AN
/AN
/A(V
ia m
otor
con
trolle
r sof
twar
e)Pr
essu
re T
rans
duce
rs16
Exha
ust P
ress
ure
PCB
Pie
zotro
nics
1501
B01
FB -
1000
psig
/20
72.5
mV
/bar
(5 m
V/p
si) (
± 2%
)0-
68.9
bar
(0-1
000
psig
) (±0
.25%
)5-
2,00
0 H
z(M
ount
ed a
fter t
est b
earin
g)17
Supp
ly P
ress
ure
PCB
Pie
zotro
nics
1501
B01
FB -
1000
psig
/20
72.5
mV
/bar
(5 m
V/p
si) (
± 2%
)0-
68.9
bar
(0-1
000
psig
) (±0
.25%
)5-
2,00
0 H
z(M
ount
ed b
efor
e te
st b
earin
g)18
Rec
ess P
ress
ure
Kul
ite S
emic
ondu
ctor
XCQ
-093
-250
A0.
406
mV
/psia
0-17
.2 b
ar (0
-250
psia
) (±5
%)
N/A
(Mou
nted
in re
cess
of t
est b
earin
g)19
Dyn
amic
Pre
ssur
ePC
B P
iezo
troni
cs10
5C12
72.5
mV
/bar
(5 m
V/p
si) (
±15%
)0-
68.9
bar
(0-1
000
psig
)0.
5-25
0,00
0 H
z(M
ount
ed in
rece
ss o
f tes
t bea
ring)

66 T
able
18.
Con
tinue
d .d
at fi
leLo
catio
nM
anuf
actu
rer
Mod
elSe
nsiti
vity
Mea
sure
men
t Ran
geFe
quen
cy R
ange
Tem
pera
ture
Sen
sors
20Su
pply
Tem
pera
ture
O
meg
aR
TD-N
PT-3
60-E
0.00
385 Ω
/Ω/°
C(0
-230
°C) 0
-450
°FN
/A(M
ount
ed b
efor
e te
st b
earin
g)21
Exha
ust T
empe
ratu
reO
meg
aR
TD-N
PT-3
60-E
0.00
385 Ω
/Ω/°
C(0
-230
°C) 0
-450
°FN
/A(M
ount
ed a
fter t
est b
earin
g)Sp
eed
22Sc
aled
Tac
hom
eter
N/A
N/A
N/A
N/A
N/A
(Via
mot
or c
ontro
ller s
oftw
are)
Torq
ue23
Load
N/A
N/A
N/A
N/A
N/A
(Via
mot
or c
ontro
ller s
oftw
are)
24Fo
rce
Vol
tage
N/A
N/A
N/A
N/A
N/A
(W 2
4 ve
rtica
l dis
plac
emen
t)Te
mpe
ratu
re S
enso
rs25
Flow
Met
er T
empe
ratu
re (I
nlet
)O
meg
aR
TD-N
PT-7
2-E-
DU
AL-
1/4-
MPT
0.00
385 Ω
/Ω/°
C(0
-230
°C) 0
-450
°FN
/A(M
ount
ed b
efor
e flo
w m
eter
)26
Flow
Met
er T
empe
ratu
re (O
utle
t)O
meg
aR
TD-N
PT-7
2-E-
DU
AL-
1/4-
MPT
0.00
385 Ω
/Ω/°
C(0
-230
°C) 0
-450
°FN
/A(M
ount
ed a
fter f
low
met
er)
Pres
sure
Tra
nsdu
cers
27Fl
ow M
eter
Pre
ssur
e (I
nlet
)O
meg
aPX
209-
300G
10V
483.
6 m
V/b
ar (3
3.3
mV
/psi
g) (1
.5%
)0-
10.7
bar
(0-3
00 p
sig)
(0.2
5%)
N/A
(Mou
nted
bef
ore
flow
met
er)
28Fl
ow M
eter
Pre
ssur
e (O
utle
t)O
meg
aPX
209-
300G
10V
483.
6 m
V/b
ar (3
3.3
mV
/psi
g) (1
.5%
)0-
10.7
bar
(0-3
00 p
sig)
(0.2
5%)
N/A
(Mou
nted
afte
r flo
w m
eter
)29
Forc
e V
olta
geN
/AN
/AN
/AN
/AN
/A(V
24
horiz
onta
l dis
plac
emen
t)Fl
ow M
eter
(Air
)30
Flow
Met
erFl
ow T
echn
olog
yFT
8-8N
EE1-
GEA
H4
N/A
0.40
- 8.
0 A
CFM
N/A
(Mou
nted
bef
ore
test
bea
ring)
31V
alve
Vol
tage
N/A
N/A
N/A
N/A
N/A
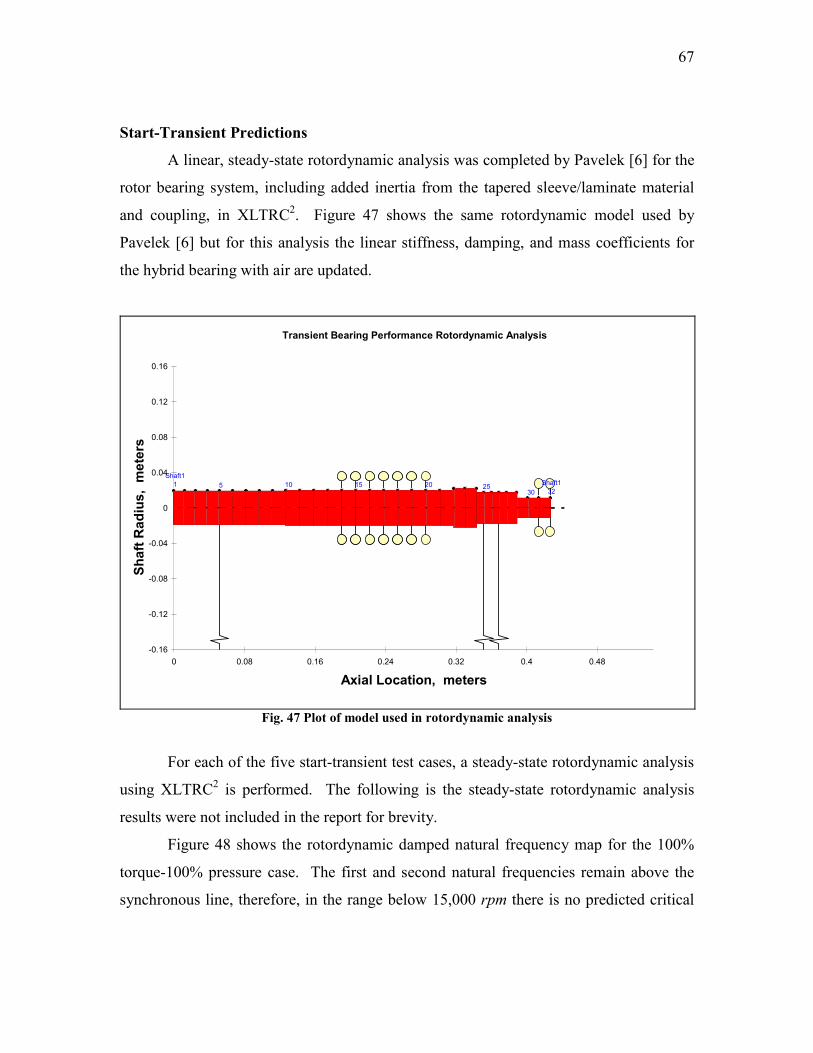
67
Start-Transient Predictions
A linear, steady-state rotordynamic analysis was completed by Pavelek [6] for the
rotor bearing system, including added inertia from the tapered sleeve/laminate material
and coupling, in XLTRC2. Figure 47 shows the same rotordynamic model used by
Pavelek [6] but for this analysis the linear stiffness, damping, and mass coefficients for
the hybrid bearing with air are updated.
Shaft13230
252015105Shaft1
1
-0.16
-0.12
-0.08
-0.04
0
0.04
0.08
0.12
0.16
0 0.08 0.16 0.24 0.32 0.4 0.48
Axial Location, meters
Shaf
t Rad
ius,
met
ers
Transient Bearing Performance Rotordynamic Analysis
by David Klooster
Fig. 47 Plot of model used in rotordynamic analysis
For each of the five start-transient test cases, a steady-state rotordynamic analysis
using XLTRC2 is performed. The following is the steady-state rotordynamic analysis
results were not included in the report for brevity.
Figure 48 shows the rotordynamic damped natural frequency map for the 100%
torque-100% pressure case. The first and second natural frequencies remain above the
synchronous line, therefore, in the range below 15,000 rpm there is no predicted critical

68
speed. Figure 49 shows the mode shape for the first two natural frequencies at 15,000
rpm while Figure 50 shows the response at the hybrid bearing.
Rotordynamic Damped Natural Frequency Map
1x
0
5000
10000
15000
20000
25000
30000
35000
40000
45000
0. 2000. 4000. 6000. 8000. 10000. 12000. 14000. 16000. 18000.
Rotor Speed, rpm
Nat
ural
Fre
quen
cy,
cpm
Transient Bearing Performance Rotordynamic Analysisby David Klooster
Fig. 48 Rotordynamic damped natural frequency map 100% torque-100% pressure
Fig. 49 Damped eigenvalue mode shape for first two modes 100% torque-100% pressure
Damped Eigenvalue Mode Shape Plot
f=17274.9 cpmd=.0342 zetaN=15000 rpm
forward backward
Damped Eigenvalue Mode Shape Plot
f=17620.4 cpmd=.0325 zeta N=15000 rpm
forward backward

69
Rotordynam ic Response Plot
0
0.002
0.004
0.006
0.008
0.01
0.012
0.014
0.016
0.018
0 5000 10000 15000 20000Rotor Speed, rpm
Res
pons
e, m
m p
k-pk
M ajor AmpHorz A mpVert A mp
Transient Bearing Performance Rotordynamic Analysisby David Klooster
Sta. No . 5: Test Bearing Centerline
Excitat ion = 1x
Fig. 50 Steady state rotordynamic response plot at test bearing 100% torque-100% pressure
Similar to the 100% torque-100% pressure case the 50% torque-100% pressure
rotordynamic analysis is presented in Figures 51-53.
Rotordynamic Damped Natural Frequency Map
1x
0
5000
10000
15000
20000
25000
30000
35000
40000
45000
0. 2000. 4000. 6000. 8000. 10000. 12000. 14000. 16000. 18000.
Rotor Speed, rpm
Nat
ural
Fre
quen
cy,
cpm
Transient Bearing Performance Rotordynamic Analysisby David Klooster
Fig. 51 Rotordynamic damped natural frequency map 50% torque-100% pressure

70
Fig. 52 Damped eigenvalue mode shape for first two modes 50% torque-100% pressure
Rotordynam ic Response Plot
0
0.005
0.01
0.015
0.02
0.025
0 5000 10000 15000 20000Rotor Speed, rpm
Res
pons
e, m
m p
k-pk
M ajor AmpHorz A mpVert A mp
Transient Bearing Performance Rotordynamic Analysisby David Klooster
Sta. No . 5: Test Bearing Centerline
Excitat ion = 1x
Fig. 53 Steady state rotordynamic response plot at test bearing 50% torque-100% pressure
The 50% torque-50% pressure case was detailed in the report, while the 25%
torque-50% pressure case is detailed in Figures 54-56. Figure 57 shows the mode shapes
for the two critical speeds in the 25% torque-25% pressure case that are detailed in the
report.
Damped Eigenvalue Mode Shape Plot
d=.0339 zeta N=15000 rpm
forwardbackward
Damped Eigenvalue Mode Shape Plot
f=16798.6 cpmd=.0299 zeta N=15000 rpm
forward backward
f=17227.3 cpm

71
Rotordynamic Damped Natural Frequency Map
1x
0
5000
10000
15000
20000
25000
30000
35000
40000
45000
0. 2000. 4000. 6000. 8000. 10000. 12000. 14000. 16000. 18000.
Rotor Speed, rpm
Nat
ural
Fre
quen
cy,
cpm
Transient Bearing Performance Rotordynamic Analysisby David Klooster
Fig. 54 Rotordynamic damped natural frequency map 25% torque-50% pressure
Fig. 55 Damped eigenvalue mode shape for first two modes 25% torque-50% pressure
Damped Eigenvalue Mode Shape Plot
f=6955.4 cpmd=.0151 zeta N=7000 rpm
forward backward
Damped Eigenvalue Mode Shape Plot
f=11493.5 cpmd=-.0095 zeta N=11500 rpm
forward backward

72
Rotordynamic Response Plot
0
0.1
0.2
0.3
0.4
0.5
0.6
0 2000 4000 6000 8000 10000 12000 14000 16000
Rotor Speed, rpm
Res
pons
e, m
m a
mpl
itude
M ajor AmpHorz AmpVert AmpBearing Clearance
Transient Bearing Performance Rotordynamic Analysisby David Klooster
Sta. No. 5: Test Bearing Centerline
Excitation = 1x
Fig. 56 Steady state rotordynamic response plot at test bearing 25% torque-50% pressure
Fig. 57 Damped eigenvalue mode shape for first two modes 25% torque-25% pressure
Damped Eigenvalue Mode Shape Plot
f=4733.5 cpm d=.0442 zeta N=5000 rpm
forwardbackward
Damped Eigenvalue Mode Shape Plot
f=6011.3 cpmd=.0144 zetaN=6000 rpm
forward backward

73
Rub
Rub was determined from the rotor centerline plots when the rotor equaled or
exceeded the established bearing clearance. Table 19 presents the start and stopping
point of rub for each start-transient in which a rubbing occurred.
Table 19 Start and stop points for rub
Ramp Rate [rpm/s]
Supply Pressure at 15,000 rpm [bar (psia)]
Start/Stop of intermittent rub
Speed [rpm]
Supply Pressure [bar (psia)]
Recess Pressure [bar (psia)]
Pressure Ratio
Temperature [°C (°F)]
Rate [kg/s]
Unit Load [bar (psi)]
load [rad (deg)]
4412 9.63 bar (139.7 psia) Start 8916 2.87 (41.6) 1.79 (26.0) 0.62 20.8 (69.4) 0.0037 0.263 (3.81) 0 (0)4412 9.63 bar (139.7 psia) Stop 10358 3.11 (45.1) 2.40 (34.8) 0.77 20.7 (69.3) 0.0039 0.263 (3.81) 0 (0)4412 9.63 bar (139.7 psia) Start 2059 1.98 (28.7) 2.14 (31.0) 1.08 20.3 (68.6) 0.0018 0.311 (4.51) 0 (0)4412 9.63 bar (139.7 psia) Stop 8937 2.54 (36.8) 2.74 (39.7) 1.08 20.3 (68.6) 0.0033 0.311 (4.51) 0 (0)2206 9.63 bar (139.7 psia) Start 5454 1.77 (25.7) 1.90 (27.5) 1.07 18.6 (65.4) 0.0018 0.263 (3.81) 0 (0)2206 9.63 bar (139.7 psia) Stop 10591 3.46 (50.2) 3.02 (43.8) 0.87 18.6 (65.4) 0.0044 0.263 (3.81) 0 (0)2206 9.63 bar (139.7 psia) Start 4557 2.05 (29.8) 2.12 (30.7) 1.03 20.8 (69.4) 0.0021 0.311 (4.51) 0 (0)2206 9.63 bar (139.7 psia) Stop 10446 3.20 (46.4) 3.37 (48.8) 1.05 20.8 (69.4) 0.0042 0.311 (4.51) 0 (0)2206 5.32 bar (77.2 psia) Start 7023 2.11 (30.7) 2.03 (29.4) 0.96 20.9 (69.7) 0.0023 0.263 (3.81) 0 (0)2206 5.32 bar (77.2 psia) Stop 8508 2.10 (30.5) 2.25 (32.7) 1.07 20.9 (69.6) 0.0021 0.263 (3.81) 0 (0)2206 5.32 bar (77.2 psia) Start 5897 2.11 (30.6) 2.19 (31.8) 1.04 19.7 (67.5) 0.0023 0.311 (4.51) 0 (0)2206 5.32 bar (77.2 psia) Stop 8414 1.96 (28.5) 2.12 (30.7) 1.08 19.7 (67.5) 0.0020 0.311 (4.51) 0 (0)4412 9.63 bar (139.7 psia) Start 7555 2.27 (32.9) 1.99 (28.9) 0.88 20.7 (69.3 0.0026 0.282 (4.09) 0.705 (40.4)4412 9.63 bar (139.7 psia) Stop 9294 2.73 (39.6) 2.83 (41.1) 1.04 20.7 (69.2) 0.0035 0.282 (4.09) 0.705 (40.4)4412 9.63 bar (139.7 psia) Start 26 2.10 (30.5) 1.91 (27.6) 0.91 18.2 (64.7) 0.0021 0.443 (6.42) 1.07 (61.0)4412 9.63 bar (139.7 psia) Stop 9009 2.73 (39.6) 2.86 (41.5) 1.05 18.2 (64.8) 0.0037 0.443 (6.42) 1.07 (61.0)2206 9.63 bar (139.7 psia) Start 1172 1.54 (22.3) 1.63 (23.6) 1.06 19.2 (66.5) 0.0012 0.282 (4.09) 0.705 (40.4)2206 9.63 bar (139.7 psia) Stop 9752 3.01 (43.6) 2.84 (41.2) 0.94 19.2 (66.6) 0.0038 0.282 (4.09) 0.705 (40.4)2206 9.63 bar (139.7 psia) Start 3079 2.06 (29.8) 1.97 (28.6) 0.96 19.6 (67.2) 0.0024 0.443 (6.42) 1.07 (61.0)2206 9.63 bar (139.7 psia) Stop 9729 3.13 (45.4) 3.13 (45.5) 1.00 19.6 (67.2) 0.0040 0.443 (6.42) 1.07 (61.0)2206 5.32 bar (77.2 psia) Start 6491 1.91 (27.7) 1.98 (28.7) 1.04 19.5 (67.1) 0.0019 0.282 (4.09) 0.705 (40.4)2206 5.32 bar (77.2 psia) Stop 8023 1.98 (28.7) 2.09 (30.4) 1.06 19.5 (67.2) 0.0021 0.282 (4.09) 0.705 (40.4)2206 5.32 bar (77.2 psia) Start 1699 2.11 (30.6) 2.12 (30.8) 1.00 21.0 (69.8) 0.0024 0.443 (6.42) 1.07 (61.0)2206 5.32 bar (77.2 psia) Stop 8659 2.31 (33.5) 1.55 (22.4) 0.67 21.0 (69.8) 0.0029 0.443 (6.42) 1.07 (61.0)
Another method for determining what speeds rubbing occurs is to look for super
synchronous vibration in a double sided waterfall plot. A particular area of interest is
near 615 Hz which is the natural frequency of the test bearing housing in the x direction.
Figure 58 shows a super synchronous vibration at about 680 Hz from 4,212 rpm to
10,460 rpm. The range using the rotor centerline plot for this case is 5,454 rpm to 10,591
rpm. Table 20 details the start and stop points of rub from super synchronous vibration
observation.

74
Fig. 58 Double sided waterfall plot for outboard proximity probes for 50% torque-50% pressure 4X
applied unit load
Table 20 Start and stop points of rub from super synchronous vibration observation
Start Rub Stop RubCase 3 4412 9.63 bar (139.7 psia) 7243 9278Case 3 4412 9.63 bar (139.7 psia) 7802 10510Case 4 2206 9.63 bar (139.7 psia) 4418 10540Case 4 2206 9.63 bar (139.7 psia) 4291 10190Case 5 2206 5.32 bar (77.2 psia) 8400 10070Case 5 2206 5.32 bar (77.2 psia) 8459 10460Case 8 4412 9.63 bar (139.7 psia) 6263 10500Case 8 4412 9.63 bar (139.7 psia) 4698 10280Case 9 2206 9.63 bar (139.7 psia) 6865 7981Case 9 2206 9.63 bar (139.7 psia) 7716 8607Case 10 2206 5.32 bar (77.2 psia) 4562 9027Case 10 2206 5.32 bar (77.2 psia) 4698 8495
Ramp Rate [rpm/s]
Supply Pressure at 15,000 rpm [bar (psia)]
Speed [rpm]
Super synchronous vibration at 700 Hz from 4307 rpm to 10010 rpm

75
VITA
Name: David Gregg Klooster Address: DRS Technologies 13544 North Central Expressway Dallas, TX 75243 Email Address: [email protected] Education: B.S., Mechanical Engineering, Kettering University, 2007 M.S., Mechanical Engineering, Texas A&M University, 2009


