
Chris K. Jones
Director of Strategic Initiatives Tourism PEIOctober 24, 2019

Global Tourism Economy (2018)
2
Source: (1) UNWTO, Tourism Highlights, 2019 Edition , (2) World Travel and Tourism Council, and (3) UNWTO, January 21, 2019 Press Release
Region Arrivals Receipts (US$)
Americas 216M (+2%) 334 billion (+0%)
Europe 710M (+5%) 570 billion (+5%)
Asia and the Pacific 348M (+7%) 435 billion (+7%)
Africa 67M (+7%) 36 billion (+2%)
Middle East 60M (+5%) 73 billion (+4%)
• 1.401 billion international tourist arrivals (+5%).1
• USD $1.451 trillion in international tourism receipts (+4.4%).1
• The worlds 3rd largest exporter.1
• 10.4% of global GDP.2
• 319 million jobs (one in ten of all jobs).2
• Tourism (+3.9%) is the second fastest growing sector in the world.2

Global Travel Purpose
3
Source: UNWTO, Tourism Highlights, 2019 Edition
Consumer Travel Trends
• Travel “to change”Live like a local, quest for authenticity and transformation.
• Travel ‘”to show”Instagramable moments, experiences and destinations.
• Pursuit of a healthy lifeWalking, wellness and sports tourism.
• Rise of the “access” economy
• Solo travel & multigenerational travelAs a result of aging population and single households.
• Rising awareness of sustainabilityZero plastic and climate change.

Canadian Tourism Economy (2018)
4
Sources: (1) Statistics Canada, Frontier Counts;(2) Statistics Canada National Tourism Indicators 2018;(3) Statistics Canada, Table 36-10-0230-01 Tourism demand in Canada; (4) Statistics Canada, Table 36-10-0232-01 Employment generated by tourism; (5) Conference Board of Canada, Travel Markets Outlook Autumn 2018/Winter 2019.
Top Markets (1) Arrivals
US 14.4M (+1.4%)
UK 791.6K (-3.3%)
China 737.4K (+6.1%)
France 604.2K (+4.7%)
Germany 405.9K (+1.1%)
Mexico 404.4K (4.9%)
Australia 348.9K (-2.5%)
India 287.4K (+14.7%)
Japan 251.2K (-14.9%)
• 21.13M International arrivals (+1.2%) – all-time high1
• 14.4M US arrivals (+1.4%)1
• +3.7% growth in air arrivals direct from overseas1
• 2.1% of Canada’s GDP2
• +0.5% growth in the number of tourism jobs2
• $95.32 billion in tourism expenditures (+2.8%)3
• +1.7% growth in visits forecasted for 20204

Atlantic Tourism Outlook
5
Short Term Outlook % Growth
2019 2020 2021
CanadaVisits
$
1.8%
5.0%
1.7%
4.6%
1.7%
4.7%
NLVisits
$
2.2%
4.8%
0.9%
3.9%
0.5%
3.4%
NSVisits
$
1.4%
4.9%
1.2%
4.1%
1.3%
4.1%
NBVisits
$
1.3%
3.4%
1.2%
3.5%
1.2%
3.5%
PEVisits
$
2.3%
5.3%
1.7%
4.4%
1.7%
4.3%
Source: Conference Board of Canada. Travel Markets Outlook Autumn 2018/Winter 2019
The Conference Board of Canada’s short to mid-term outlook for tourism is positive, but growth is expected to slow:
• Nationally, visitation is expected to grow by more than 1.7% a year until 2021.
• Revenues are expected to grow by 4.6% annually.
• All of Atlantic Canada is expected to grow at a slower pace than country as a whole.
• Growth rates for PEI are forecast to be comparable to national growth rates.


PEI Visitation and Revenue Estimates
7
Source: PEI Tourism Value and Volume Model Estimates
2018Forecast
% Change
Tourism Volume (Total Non-Resident Visits: Persons)
1,578,400 + 0.7%
Tourism Value (Total Revenue: $ million)
$486.2(f) + 5.7%

Tourism Visitation on PEI
8
1.23M
1.30M1.33M
1.41M
1.48M
1.57M 1.58M
2012 2013 2014 2015 2016 2017 2018
Average Annual Growth Rate = 4.3%
+28.7%
Source: Department of Economic Growth, Tourism and Culture. PEI Tourism Volume Model

Tourism Revenues (CAD Millions)
9
$380.4 $381.6
$401.1 $405.6
$432.9
$460.1
$486.2 (F)
2012 2013 2014 2015 2016 2017 2018
+27.8%Average Annual Growth Rate = 4.2%
Source: Department of Economic Growth, Tourism and Culture, PEI Tourism Value Model
$486.2(f)

Tourism Visitation by Origin (2018)
10
83.1%
7.0%
2.0%1.7%
6.2%
Canada Total (1,312,949)
US Total (110,251)
Overseas (31,631)
Motor Coach (26,961)
Cruise Ship Passengers (97,570)
Source: Department of Economic Growth, Tourism and Culture. PEI Tourism Volume Model

Tourism Visitation by Origin (2018), cont’d
11
28%
29%8%
13%
1%4%
2% 5%
2.0%1.7%
6.2%
NB (449,498)
NS (451,692)
QC (131,790)
ON (206,149)
Nfld (13,662)
Rest of Can (60,158)
New England (35,709)
Rest of US (74,542)
Source: Department of Economic Growth, Tourism and Culture. PEI Tourism Volume Model
Target Markets (78% of total)

2019 PEI Tourism Traffic Indicators
12
YTD September 30, 2019
+3.3% Airport*
+ 1.6% Bridge*
-3.3% Ferry
-15.0% Motorcoach Overnight Stays
(YTD to Aug - Preliminary)
+23.8%Cruise Ships*
(Passengers and Crew)
Sources: Strait Crossing Ltd (Bridge); Charlottetown Airport Authority (Air); Northumberland Ferries Ltd (Ferry); Charlottetown Harbour Authority (Cruise); and Tourism PEI –ITS (Motorcoach).

2019 Overnight Stays
13
Preliminary YTD August 31, 2019
Combined814,066 ONS
+2.8%
Source: Tourism PEI , ITS (Occupancy Reporting System). August compliance at 94%.
2014 2019 2014 2019
Room-Nights Sold Trend Site-Nights Sold Trend
-2.1%11.7% 4.6% -1.7% 4.3%
516,498297,568
3.6%11.2%
9.5% -1.1% 0.3%

Target Markets Change in ONS (2019)
14
Preliminary YTD August 31, 2019
Source: Tourism PEI , ITS (Occupancy Reporting System). August compliance at 94%.
+7.5%+2.2%-4.4%
+0.3%
+8.7%
New England Mid-Atlantic
+8.7%

Growth in Number of Licensed Establishments
15
52% growth from 2012-2018Average annual growth rate 15%
Source: Tourism PEI
1,200
1,400
1,588
1,834
2005-2016 2017 2018 2019

2018 Atlantic Tourism Economy
17
Sources: (1) Statistics Canada 2016 Census; NLTCR, NSTA, NBTHC, PEIEDT
Tourism is of strategic importance to Atlantic Canada:
• With a population of just 2.3 million1, Atlantic Canada hosted in 2018 in excess of 62 million visitors (24% growth since 2012).
• These visitors spent an estimated $5.5 billion while vacationing in Atlantic Canada (22% growth since 2012).
• Tourism generates upwards of 62,900 (FTEs) jobs for Atlantic Canadians.
• Domestic markets account for more than 85% of non-resident, tourism-related visits.
• The Northeastern region of the USA & the UK are Atlantic Canada’s most lucrative international markets.

Trends in Non-Resident Visits & Revenues
18
5.1 5.2 5.25.0 5.1
5.45.2
5.0 5.0 5.15.4
5.86.2 6.3
$3.67 $3.74 $3.85 $4.02 $4.15$4.38
$4.70$4.50 $4.50
$4.69$4.89
$5.25$5.50
$5.72
2005 2006 2007 2008 2009 2010 2011 2012 2013 2014 2015 2016 2017 2018F
Arrivals (Millions) Revenues ($Billions)
• 24% growth in non-resident visitation since 2005• 56% growth in revenues since 2005
Source: NLTCR, NSTA, NBTHC, PEIEDT
Atlantic Canada

Non-Resident Visits by Province
19
0.47 0.49 0.48 0.46 0.49 0.51 0.50 0.54 0.55 0.53
2.11 2.14 2.091.95
1.79 1.80
2.072.24
2.43 2.41
1.31 1.351.24
1.551.36 1.38 1.40
1.50 1.62 1.62
1.22 1.24 1.28 1.23 1.30 1.33 1.41 1.49 1.57 1.58
2005 2006 2007 2008 2009 2010 2011 2012 2013 2014 2015 2016 2017 2018
NL NS NB PE
1.62(f)
NS + 14%
NB + 24%
NL + 13%
PE + 30%
Source: NLTCR, NSTA, NBTHC, PEIEDT
(in millions)

Room-Nights Sold by Province
20
Source: NLTCR, NSTA, NBTHC, PEIEDT
Annual Growth or Decrease (%)
-2%
0.5%
2.1%
4.2%
-7.5%
3.7%4.4%
2%3%
3%
5%4.3%
-1.1%
4.2%
9.6%
2019YTD 2018 2017 2016
NS NFLD NB PEI
• Total RNS growth 2016-2018:• NS +2.6%• NFLD -4.1%• NB +6.4%• PEI +3.1%

Site-Nights Sold by Province
21
Source: NLTCR, NSTA, NBTHC, PEIEDT
• Total RSNS growth 2016-2018:• NS +10.5%• NFLD -8.5%• NB +5.6%• PEI +9.9%
Annual Growth or Decrease (%)
-1%
2.2%
8.1%
14.0%
6%
-0.3%
5.9%
9.0%
-7.3%
-1.2% -1.6%
0.3%
-1.5%
11.6%10.7%
2019YTD 2018 2017 2016
NS NB NFLD PEI

Confederation Bridge
22
Source: Strait Crossing Ltd.
• 17.5% growth vs 2012
• Record traffic YTD
• 2.8% average annual growth rate
Traffic (2-axles and motorcycles). YTD September 30, 2019
2012 2013 2014 2015 2016 2017 2018 2019

Charlottetown Airport
13
Source: Charlottetown Airport Authority
Non-Resident Air Traffic. YTD September 30, 2019
• 24.4% growth vs 2012
• Record traffic YTD
• 4.2% average annual growth rate
2012 2013 2014 2015 2016 2017 2018 2019

Wood Island Ferry
24
Source: Northumberland Ferries Ltd
Traffic (Personal Recreational Vehicles). YTD September 30, 2019
• 11.9% growth vs 2012
• 2.6% average annual growth rate
2012 2013 2014 2015 2016 2017 2018 2019
Mechanical issues in 2014
2016 one ferry under repair

Cruise – Charlottetown Port
25
Source: Charlottetown Harbour Authority
Cruise Ship Passengers and Crew Traffic. YTD September 30, 2019
• 82.4% growth vs 2012
• 10.2% average annual growth rate
2012 2013 2014 2015 2016 2017 2018 2019
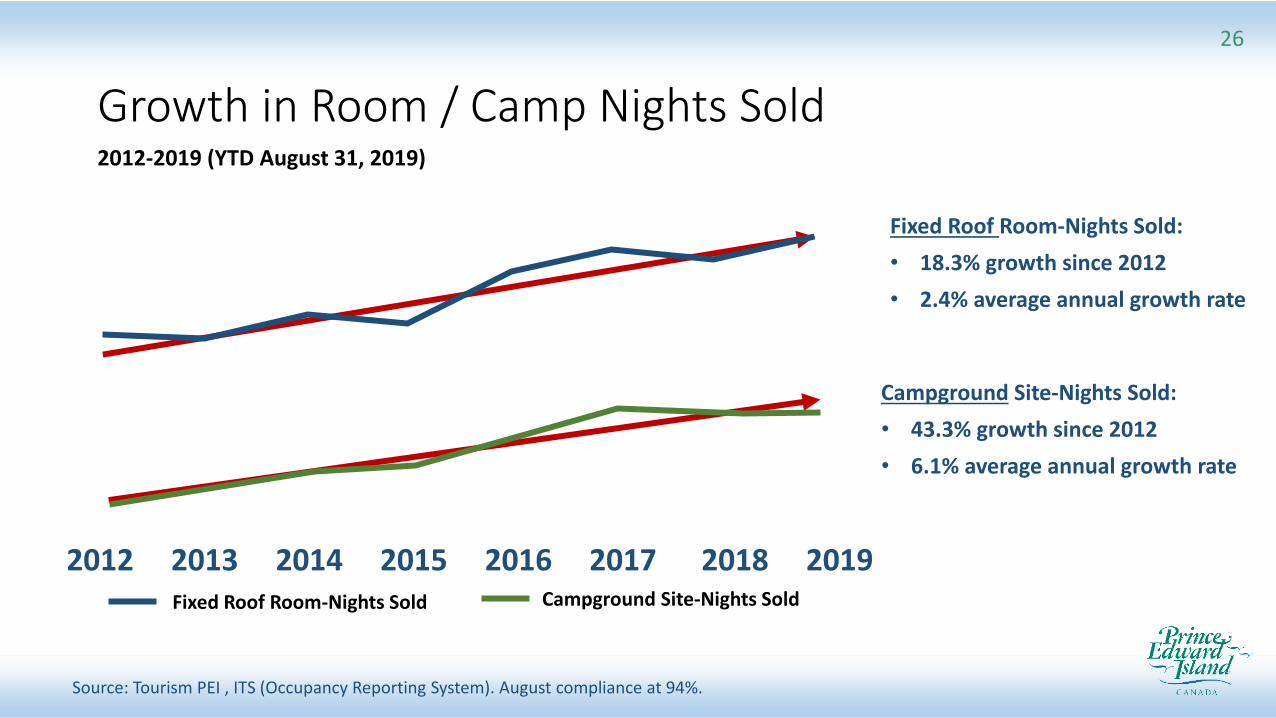
Growth in Room / Camp Nights Sold
26
2012-2019 (YTD August 31, 2019)
Fixed Roof Room-Nights Sold:
• 18.3% growth since 2012
• 2.4% average annual growth rate
Campground Site-Nights Sold:
• 43.3% growth since 2012
• 6.1% average annual growth rate
2012 2013 2014 2015 2016 2017 2018 2019Fixed Roof Room-Nights Sold Campground Site-Nights Sold
Source: Tourism PEI , ITS (Occupancy Reporting System). August compliance at 94%.

Volume – Non-Resident Visits to PEI
27
1,221
1,225 1,240
1,192
1,2811,299
1,230 1,228
1,298
1,332
1,410
1,485
1,5681,578
2005 2006 2007 2008 2009 2010 2011 2012 2013 2014 2015 2016 2017 2018
• Strong upward trend in non-residents visits• Average annual growth rate of 2.1%• 29% growth since 2005
Source: PEI Tourism Volume Model
Preliminary – in thousands of visits

PEI Tourism Revenues
28
342.3 346.4360.5 359.5
359.1
378.6
381.7 380.4 381.6
401.1405.6
432.9
459.9
486.2
2005 2006 2007 2008 2009 2010 2011 2012 2013 2014 2015 2016 2017 2018F
• Strong upward trend in tourism revenues• Average annual growth rate of 2.8% • 42% in revenues since 2005
Source: PEI Tourism Value Model
Preliminary – in millions CAD


New Brunswick Visits
30
344348 353
367 369 373363
351
370
400
417
402
449 449
2005 2006 2007 2008 2009 2010 2011 2012 2013 2014 2015 2016 2017 2018
• Strong upward trend in visitation• 31% of total growth vs 2005 • Average annual growth rate 2.2%• Flat growth 2018 vs 2017
(in 000’s)
Source: PEI Tourism Volume ModelNote: These numbers exclude cruise ship travellers and motor coach tourists.

Fast Facts – New Brunswick
31
Market Overview
PEI’s second largest tourism market in 2018
Accounted for 28% of all non-resident visits to PEI in 2018
Average spending per person per visit was $319.92 in 2018
Strong adult couples (47%) & family (29%) market
Strong (95%) repeat visitor market
Average length of stay – 4.0 nights
Average travel party size – 3.44
Primary travel motivators include outdoor activities & festivals/events
Primary activities include sightseeing, visiting friends/relatives & beaches
Source: PEI Exit Surveys

Nova Scotia Visits
32
426435
443
416
440 443
419
362
380390
400
434
447 452
2005 2006 2007 2008 2009 2010 2011 2012 2013 2014 2015 2016 2017 2018
• 15% decline between 2005 & 2012• 25% growth since 2012• 1% growth 2018 vs 2017
Source: PEI Tourism Volume ModelNote: These numbers exclude cruise ship travellers and motor coach tourists.
(in 000’s)
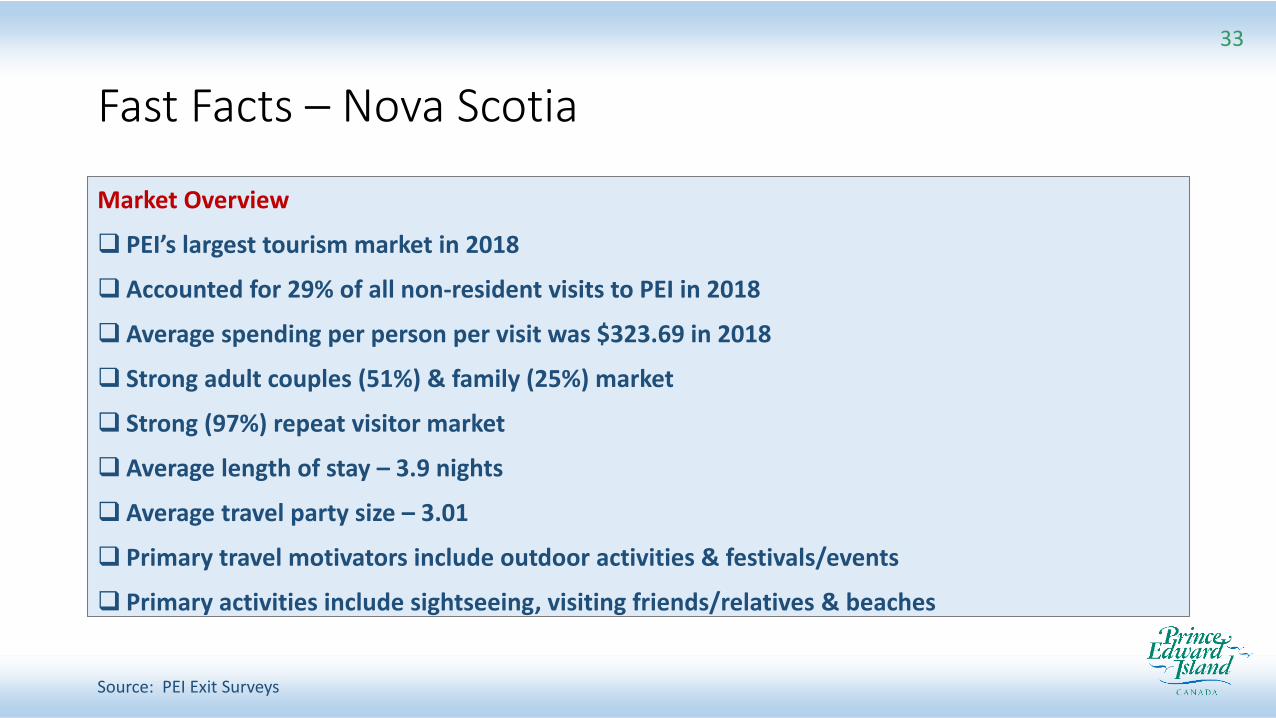
Fast Facts – Nova Scotia
33
Market Overview
PEI’s largest tourism market in 2018
Accounted for 29% of all non-resident visits to PEI in 2018
Average spending per person per visit was $323.69 in 2018
Strong adult couples (51%) & family (25%) market
Strong (97%) repeat visitor market
Average length of stay – 3.9 nights
Average travel party size – 3.01
Primary travel motivators include outdoor activities & festivals/events
Primary activities include sightseeing, visiting friends/relatives & beaches
Source: PEI Exit Surveys

Ontario Visits
34
Source: PEI Tourism Volume ModelNote: These numbers exclude cruise ship travellers and motor coach tourists.
144 146
155
132
148158
149
157 158
146
187
216
206 206
2005 2006 2007 2008 2009 2010 2011 2012 2013 2014 2015 2016 2017 2018
• Strong upward trend in visitation• 43% growth vs 2005• Average annual growth rate of 3.3%• Flat growth, 2018 vs 2017
(in 000’s)

Fast Facts – Ontario
35
Source: PEI Exit Surveys
Market Overview
PEI’s 3rd largest tourism market in 2018
13% of all non-resident visits to PEI in 2018
Average spending per person per visit was $645.34 in 2018
Strong adult couples (51%) & family (25%) market
Good (64%) repeat visitor market
Average length of stay – 6.4 nights
Average travel party size is 2.91
Primary travel motivators include natural beauty and pastoral settings, beaches and coastlines
Primary activities include sightseeing, culinary, beaches, history/culture, shopping & national parks

Quebec Visits
36
Source: PEI Tourism Volume ModelNote: These numbers exclude cruise ship travellers and motor coach tourists.
122
118 118
105
128
133
119
113
115118
123
141
132 132
2005 2006 2007 2008 2009 2010 2011 2012 2013 2014 2015 2016 2017 2018
• Upward trend in visitation • 8% growth vs 2005• Average annual growth rate 1%• Flat growth, 2018 vs 2017
(in 000’s)

Fast Facts – Quebec
37
Source: PEI Exit Surveys
Market Overview
PEI’s 4th largest tourism market in 2018
8% of all PEI visitation
Average spending per person per visit was $538.84 in 2018
Strong adult couples (54%) & family (21%) market
Good (63%) repeat visitor market
Average length of stay – 5.7 nights
Primary travel motivators include beaches and coastlines, natural beauty and pastoral settings
Primary activities include sightseeing, culinary, history/culture, beaches, shopping and national parks


PEI Visitation and Revenue Estimates
39
Source: PEI Tourism Value and Volume Model Estimates
20182019
Forecast% Change
Tourism Volume (Total Non-Resident Visits: Persons)
1,579,400 1,602,600 + 1.5%
Tourism Value (Total Revenue: $ million)
$486.2 (f) $505.7 + 4.0%

For more about PRINCE EDWARD ISLAND TOURISM
CHECK US OUT!WWW.TOURISMPEI.COM
Chris K. JonesDirector, Strategic InitiativesTourism PEI


