Download - Topological approaches in machine learning
MotivationsSeparability
Topological GraphsSeparability of Classes
Some IllustrationsEvaluation of Kernel Matrix
Topological approaches in machine learning
D. A. Zighed
University of Lyon (Lumière Lyon 2)
Recife - Brazil - 5..7 May 2009
Topological approaches in machine learning 1/ 36

MotivationsSeparability
Topological GraphsSeparability of Classes
Some IllustrationsEvaluation of Kernel Matrix
1 Motivations
2 Separability
3 Topological Graphs
4 Separability of Classes
5 Some Illustrations
6 Evaluation of Kernel Matrix
Topological approaches in machine learning 2/ 36
MotivationsSeparability
Topological GraphsSeparability of Classes
Some IllustrationsEvaluation of Kernel Matrix
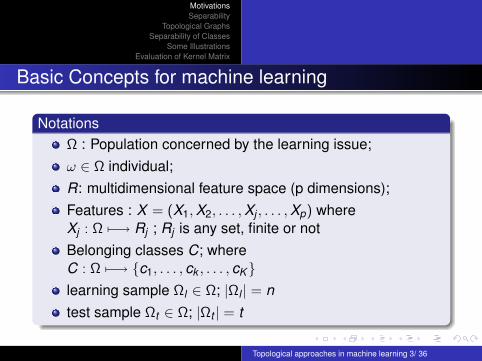
Basic Concepts for machine learning
NotationsΩ : Population concerned by the learning issue;ω ∈ Ω individual;R: multidimensional feature space (p dimensions);Features : X = (X1, X2, . . . , Xj , . . . , Xp) whereXj : Ω 7−→ Rj ; Rj is any set, finite or notBelonging classes C; whereC : Ω 7−→ c1, . . . , ck , . . . , cKlearning sample Ωl ∈ Ω; |Ωl | = ntest sample Ωt ∈ Ω; |Ωt | = t
Topological approaches in machine learning 3/ 36
MotivationsSeparability
Topological GraphsSeparability of Classes
Some IllustrationsEvaluation of Kernel Matrix
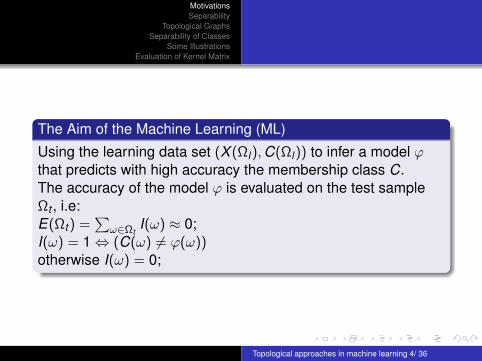
The Aim of the Machine Learning (ML)
Using the learning data set (X (Ωl), C(Ωl)) to infer a model ϕthat predicts with high accuracy the membership class C.The accuracy of the model ϕ is evaluated on the test sampleΩt , i.e:E(Ωt) =
∑ω∈Ωt
I(ω) ≈ 0;I(ω) = 1 ⇔ (C(ω) 6= ϕ(ω))otherwise I(ω) = 0;
Topological approaches in machine learning 4/ 36

MotivationsSeparability
Topological GraphsSeparability of Classes
Some IllustrationsEvaluation of Kernel Matrix
Learning process
70 1 4 130 322 0 2 109 0 2.40 2 3 3 2
67 0 3 115 564 0 2 160 0 1.60 2 0 7 1
57 1 2 124 261 0 0 141 0 0.30 1 0 7 2
64 1 4 128 263 0 0 105 1 0.20 2 1 7 1
74 0 2 120 269 0 2 121 1 0.20 1 1 3 1
65 1 4 120 177 0 0 140 0 0.40 1 0 7 1
56 1 3 130 256 1 2 142 1 0.60 2 1 6 2
59 1 4 110 239 0 2 142 1 1.20 2 1 7 2
60 1 4 140 293 0 2 170 0 1.20 2 2 7 2
Class attribute
(categorical)Predictive attributes(X1, X2, X3, …, Xp) C
Feature space
Machine
Learning
algorithm
j
e
• Neural Net
• Induction Graph
• Disc. Analysis
• SVM…
(Learning data set,
any type data, labeled)
Topological approaches in machine learning 5/ 36
MotivationsSeparability
Topological GraphsSeparability of Classes
Some IllustrationsEvaluation of Kernel Matrix
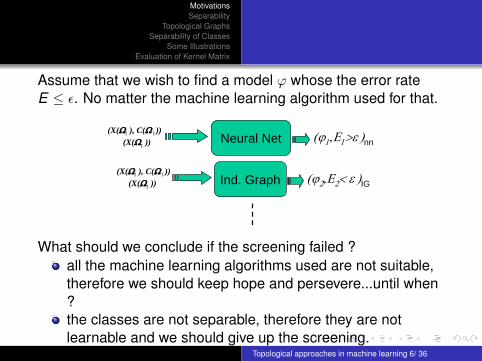
Assume that we wish to find a model ϕ whose the error rateE ≤ ε. No matter the machine learning algorithm used for that.
Neural Net (j1,E1>e )nn
Ind. Graph (j2,E2< e )IG
(X(Wt ))
(X(Wt ))
(X(Wl ), C(W l ))
(X(Wl ), C(W l ))
What should we conclude if the screening failed ?all the machine learning algorithms used are not suitable,therefore we should keep hope and persevere...until when?the classes are not separable, therefore they are notlearnable and we should give up the screening.
Topological approaches in machine learning 6/ 36
MotivationsSeparability
Topological GraphsSeparability of Classes
Some IllustrationsEvaluation of Kernel Matrix
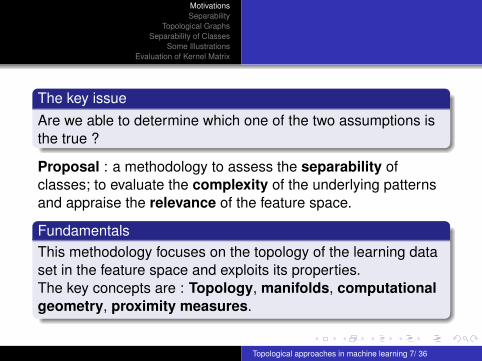
The key issueAre we able to determine which one of the two assumptions isthe true ?
Proposal : a methodology to assess the separability ofclasses; to evaluate the complexity of the underlying patternsand appraise the relevance of the feature space.
FundamentalsThis methodology focuses on the topology of the learning dataset in the feature space and exploits its properties.The key concepts are : Topology, manifolds, computationalgeometry, proximity measures.
Topological approaches in machine learning 7/ 36

MotivationsSeparability
Topological GraphsSeparability of Classes
Some IllustrationsEvaluation of Kernel Matrix
Separability
PropositionThe classes are not SEPARABLE if the learning data set in thefeature space have been randomly labeled: P(ci/X ) = P(ci)Example :
X1
Xi Xp
the classes are not
easily separable
it will be difficult to
find a method that
can produce a reliable
model
In such case, the underlying problem of machine learning is notlearnable.
Topological approaches in machine learning 8/ 36
MotivationsSeparability
Topological GraphsSeparability of Classes
Some IllustrationsEvaluation of Kernel Matrix
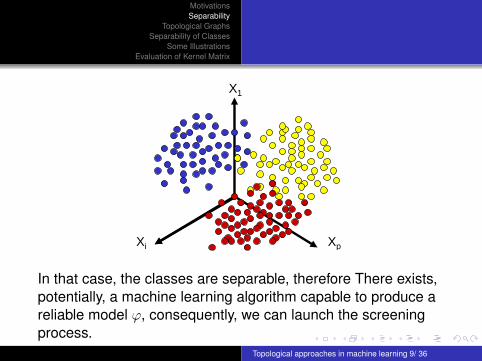
X1
Xi Xp
the classes seem to
be well separable
a machine learning
method can probably
find a model of these data
In that case, the classes are separable, therefore There exists,potentially, a machine learning algorithm capable to produce areliable model ϕ, consequently, we can launch the screeningprocess.
Topological approaches in machine learning 9/ 36
MotivationsSeparability
Topological GraphsSeparability of Classes
Some IllustrationsEvaluation of Kernel Matrix
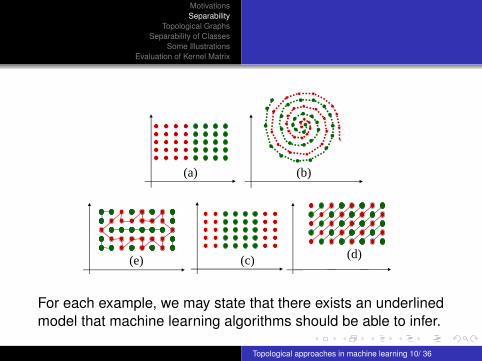
(a)
(c)
(b)
(d)(e)
For each example, we may state that there exists an underlinedmodel that machine learning algorithms should be able to infer.
Topological approaches in machine learning 10/ 36

MotivationsSeparability
Topological GraphsSeparability of Classes
Some IllustrationsEvaluation of Kernel Matrix
Topological Graphs
Feature space is multidimensional: Euclidien space R = IRp.There are plenty of ways to define the topology of learning thedata set.
Topological approaches in machine learning 11/ 36

MotivationsSeparability
Topological GraphsSeparability of Classes
Some IllustrationsEvaluation of Kernel Matrix
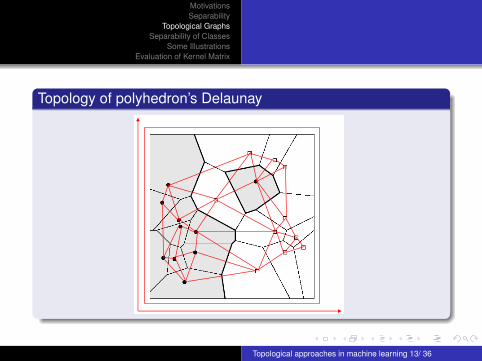
Diagram’s Voronoi Topology
Feature space is partitioned by the data set; each partdefines the area of influence;Two points are neighbors if they share a common border;the graph brought about by the links between neighbors isthe Polyhedron’s Delaunay.
Topological approaches in machine learning 12/ 36
MotivationsSeparability
Topological GraphsSeparability of Classes
Some IllustrationsEvaluation of Kernel Matrix
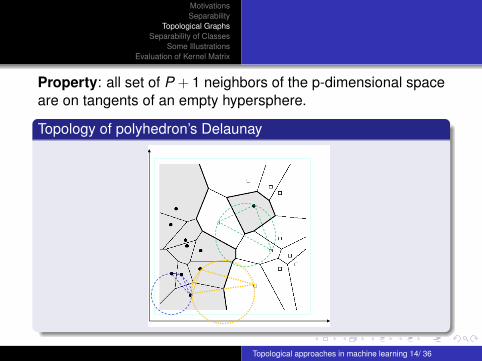
Topology of polyhedron’s Delaunay
Topological approaches in machine learning 13/ 36
MotivationsSeparability
Topological GraphsSeparability of Classes
Some IllustrationsEvaluation of Kernel Matrix
Property: all set of P + 1 neighbors of the p-dimensional spaceare on tangents of an empty hypersphere.
Topology of polyhedron’s Delaunay
Topological approaches in machine learning 14/ 36

MotivationsSeparability
Topological GraphsSeparability of Classes
Some IllustrationsEvaluation of Kernel Matrix
Building Graph’s Delaunay or Diagram’s Vornoi isintractable in high dimension feature spaceGraph’s Delaunay is a related graph
Topological approaches in machine learning 15/ 36

MotivationsSeparability
Topological GraphsSeparability of Classes
Some IllustrationsEvaluation of Kernel Matrix
Gabriel Graph (GG)
X1
X2
Gabriel Graph is a related graphIt feasible O(n2) even in high dimension space
Topological approaches in machine learning 16/ 36

MotivationsSeparability
Topological GraphsSeparability of Classes
Some IllustrationsEvaluation of Kernel Matrix
Relative Neighborhood Graph (RNG)
X1
X2
Relative Neighborhood Graph is a related graphRNG ⊂ GG ⊂ DG
Topological approaches in machine learning 17/ 36

MotivationsSeparability
Topological GraphsSeparability of Classes
Some IllustrationsEvaluation of Kernel Matrix
Minimum Spanning Tree (MST)
X1
X2
MST is a related graphMST ⊂ RNG ⊂ GG ⊂ DG
Topological approaches in machine learning 18/ 36

MotivationsSeparability
Topological GraphsSeparability of Classes
Some IllustrationsEvaluation of Kernel Matrix
Separability of Classes
6 M.L.P. of 2 classes in IR2 and their associated RNG.
(c)(b)
(d) (e) (f)
(a)
Are those vertices of each graph have been labeled randomly ?
if yes, stop there is nothing to learn !if not, it means that there is an underlying pattern.
Topological approaches in machine learning 19/ 36
MotivationsSeparability
Topological GraphsSeparability of Classes
Some IllustrationsEvaluation of Kernel Matrix
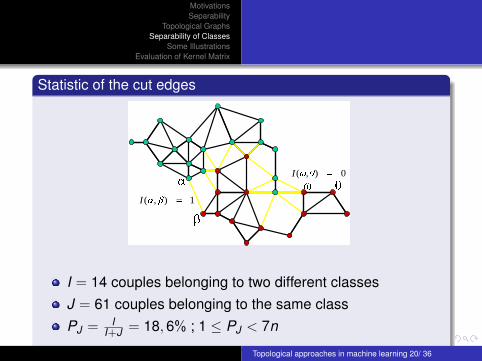
Statistic of the cut edges
1),(I
0),(I
I = 14 couples belonging to two different classesJ = 61 couples belonging to the same classPJ = I
I+J = 18, 6% ; 1 ≤ PJ < 7n
What would be this proportion in random labeling ?Topological approaches in machine learning 20/ 36

MotivationsSeparability
Topological GraphsSeparability of Classes
Some IllustrationsEvaluation of Kernel Matrix
Statistic of the cut edges
1),(I
0),(I
PJ = II+J = 18, 6% ; 1 ≤ PJ < 7n
What would be this proportion in case of random labeling ?
Topological approaches in machine learning 21/ 36
MotivationsSeparability
Topological GraphsSeparability of Classes
Some IllustrationsEvaluation of Kernel Matrix
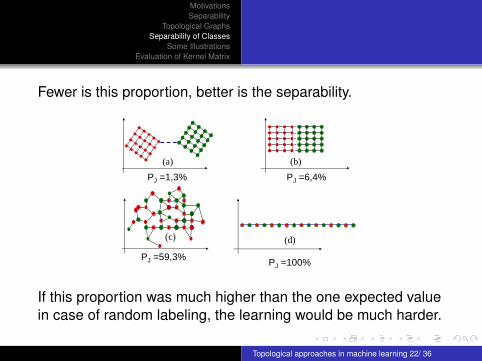
Fewer is this proportion, better is the separability.
(b)
(c)
PJ =59,3%
(a)
PJ =1,3% PJ =6,4%
(d)
PJ =100%
If this proportion was much higher than the one expected valuein case of random labeling, the learning would be much harder.
Topological approaches in machine learning 22/ 36

MotivationsSeparability
Topological GraphsSeparability of Classes
Some IllustrationsEvaluation of Kernel Matrix
Distribution of I and J under the null hypothesis
H0: The vertices of the graph are randomly labeled accordingto the same probability πk for the class k , k = 1, . . . , K . Wehave established in
Zighed et al. (2002) "Separability Index in SupervisedLearning", LNAI 2431, pp. 475-487, .Zighed et al. (2005) "A statistical approach of classseparability", App. Stochastic Models in Bus. and Ind., Vol.21, No. 2, , pp. 187-197.
the law of I and J for K classes.
Topological approaches in machine learning 23/ 36

MotivationsSeparability
Topological GraphsSeparability of Classes
Some IllustrationsEvaluation of Kernel Matrix
Boolean case
Two classes: c1 with proportion π1 and c2 with π2Under H0
Mean: mJ = S0π1π2
Variance: VJ = S1π12π2
2 + S2π1π2(14 − π1π2)
WhereS0 =
∑ni=1
∑nj=1;j 6=i wij
S1 = 12
∑ni=1
∑nj=1;j 6=i(wij + wji)
2
S2 =∑
i=1 n(wi+ + w+i)2
wi+ =∑n
j wij and w+i =∑n
i wijwij is the weight of the edge (i , j) connecting vertices i and j ;
Topological approaches in machine learning 24/ 36

MotivationsSeparability
Topological GraphsSeparability of Classes
Some IllustrationsEvaluation of Kernel Matrix
Critical values of J for a threshold α0
Jα0/2 = S0π1π2 − u1−α0/2
√S1π
21π2
2 + S2π1π2(14 − π1π2)
J1−α0/2 = S0π1π2 + u1−α0/2
√S1π
21π2
2 + S2π1π2(14 − π1π2)
The p-value is calculated from the normal distribution afterstandardisation.
Topological approaches in machine learning 25/ 36

MotivationsSeparability
Topological GraphsSeparability of Classes
Some IllustrationsEvaluation of Kernel Matrix
Some illustrations
Breiman et al. Waves problem
Domain name n p k J / (I + J) J s p-value
Waves-20 20 21 3 0.400 -0.44 0.6635
Waves-50 50 21 3 0.375 -4.05 5.0E-05
Waves-100 100 21 3 0.301 -8.44 3.3E-17
Waves-1000 1000 21 3 0.255 -42.75 0
Topological approaches in machine learning 26/ 36

MotivationsSeparability
Topological GraphsSeparability of Classes
Some IllustrationsEvaluation of Kernel Matrix
On 13 benchmarks
13 benchmarks of the UCI Machine Learning RepositoryGraph: Relative Neighborhood Graph of ToussaintWeights: connection, distance and rank
•13 benchmarks of the UCI Machine Learning Repository
•Graph: Relative Neighborhood Graph of Toussaint
•Weights: connection, distance and rank
Domain name n p k error r. J / (I + J) J s p-value J / (I + J) J s p-value J / (I + J) J s p-value
Wine recognition 178 13 3 0.0389 0.093 -19.32 0 0.054 -19.40 0 0.074 -19.27 0
Breast Cancer 683 9 2 0.0409 0.008 -25.29 0 0.003 -24.38 0 0.014 -25.02 0
Iris (Bezdek) 150 4 3 0.0533 0.090 -16.82 0 0.077 -17.01 0 0.078 -16.78 0
Iris plants 150 4 3 0.0600 0.087 -17.22 0 0.074 -17.41 0 0.076 -17.14 0
Musk "Clean1" 476 166 2 0.0650 0.167 -17.53 0 0.115 -7.69 2E-14 0.143 -18.10 0
Image seg. 210 19 7 0.1238 0.224 -29.63 0 0.141 -29.31 0 0.201 -29.88 0
Ionosphere 351 34 2 0.1397 0.137 -11.34 0 0.046 -11.07 0 0.136 -11.33 0
Waveform 1000 21 3 0.1860 0.255 -42.75 0 0.248 -42.55 0 0.248 -42.55 0
Pima Indians 768 8 2 0.2877 0.310 -8.74 2E-18 0.282 -9.86 0 0.305 -8.93 4E-19
Glass Ident. 214 9 6 0.3169 0.356 -12.63 0 0.315 -12.90 0 0.342 -12.93 0
Haberman 306 3 2 0.3263 0.331 -1.92 0.054 0.321 -2.20 0.028 0.331 -1.90 0.058
Bupa 345 6 2 0.3632 0.401 -3.89 1E-04 0.385 -4.33 1E-05 0.394 -4.08 5E-05
Yeast 1484 8 10 0.4549 0.524 -27.03 0 0.512 -27.18 0 0.509 -28.06 0
weighting: distance weighting: rankGeneral information weighting: connection
Nb cases
Nb variables
Nb of classeserror rate on a 1-NN
(in a 10-fold cross validation)
J/(I+J): relative cut edge weight
Js: standardized cut edge weight
Topological approaches in machine learning 27/ 36

MotivationsSeparability
Topological GraphsSeparability of Classes
Some IllustrationsEvaluation of Kernel Matrix
On 13 benchmarks•13 benchmarks of the UCI Machine Learning Repository
•Graph: Relative Neighborhood Graph of Toussaint
•Weights: connection, distance and rank
Domain name n p k error r. J / (I + J) J s p-value J / (I + J) J s p-value J / (I + J) J s p-value
Wine recognition 178 13 3 0.0389 0.093 -19.32 0 0.054 -19.40 0 0.074 -19.27 0
Breast Cancer 683 9 2 0.0409 0.008 -25.29 0 0.003 -24.38 0 0.014 -25.02 0
Iris (Bezdek) 150 4 3 0.0533 0.090 -16.82 0 0.077 -17.01 0 0.078 -16.78 0
Iris plants 150 4 3 0.0600 0.087 -17.22 0 0.074 -17.41 0 0.076 -17.14 0
Musk "Clean1" 476 166 2 0.0650 0.167 -17.53 0 0.115 -7.69 2E-14 0.143 -18.10 0
Image seg. 210 19 7 0.1238 0.224 -29.63 0 0.141 -29.31 0 0.201 -29.88 0
Ionosphere 351 34 2 0.1397 0.137 -11.34 0 0.046 -11.07 0 0.136 -11.33 0
Waveform 1000 21 3 0.1860 0.255 -42.75 0 0.248 -42.55 0 0.248 -42.55 0
Pima Indians 768 8 2 0.2877 0.310 -8.74 2E-18 0.282 -9.86 0 0.305 -8.93 4E-19
Glass Ident. 214 9 6 0.3169 0.356 -12.63 0 0.315 -12.90 0 0.342 -12.93 0
Haberman 306 3 2 0.3263 0.331 -1.92 0.054 0.321 -2.20 0.028 0.331 -1.90 0.058
Bupa 345 6 2 0.3632 0.401 -3.89 1E-04 0.385 -4.33 1E-05 0.394 -4.08 5E-05
Yeast 1484 8 10 0.4549 0.524 -27.03 0 0.512 -27.18 0 0.509 -28.06 0
weighting: distance weighting: rankGeneral information weighting: connection
Nb cases
Nb variables
Nb of classeserror rate on a 1-NN
(in a 10-fold cross validation)
J/(I+J): relative cut edge weight
Js: standardized cut edge weight
Topological approaches in machine learning 28/ 36
MotivationsSeparability
Topological GraphsSeparability of Classes
Some IllustrationsEvaluation of Kernel Matrix
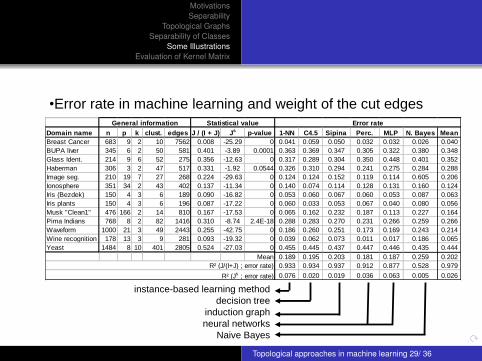
•Error rate in machine learning and weight of the cut edges
Domain name n p k clust. edges J / (I + J) Js p-value 1-NN C4.5 Sipina Perc. MLP N. Bayes Mean
Breast Cancer 683 9 2 10 7562 0.008 -25.29 0 0.041 0.059 0.050 0.032 0.032 0.026 0.040
BUPA liver 345 6 2 50 581 0.401 -3.89 0.0001 0.363 0.369 0.347 0.305 0.322 0.380 0.348
Glass Ident. 214 9 6 52 275 0.356 -12.63 0 0.317 0.289 0.304 0.350 0.448 0.401 0.352
Haberman 306 3 2 47 517 0.331 -1.92 0.0544 0.326 0.310 0.294 0.241 0.275 0.284 0.288
Image seg. 210 19 7 27 268 0.224 -29.63 0 0.124 0.124 0.152 0.119 0.114 0.605 0.206
Ionosphere 351 34 2 43 402 0.137 -11.34 0 0.140 0.074 0.114 0.128 0.131 0.160 0.124
Iris (Bezdek) 150 4 3 6 189 0.090 -16.82 0 0.053 0.060 0.067 0.060 0.053 0.087 0.063
Iris plants 150 4 3 6 196 0.087 -17.22 0 0.060 0.033 0.053 0.067 0.040 0.080 0.056
Musk "Clean1" 476 166 2 14 810 0.167 -17.53 0 0.065 0.162 0.232 0.187 0.113 0.227 0.164
Pima Indians 768 8 2 82 1416 0.310 -8.74 2.4E-18 0.288 0.283 0.270 0.231 0.266 0.259 0.266
Waveform 1000 21 3 49 2443 0.255 -42.75 0 0.186 0.260 0.251 0.173 0.169 0.243 0.214
Wine recognition 178 13 3 9 281 0.093 -19.32 0 0.039 0.062 0.073 0.011 0.017 0.186 0.065
Yeast 1484 8 10 401 2805 0.524 -27.03 0 0.455 0.445 0.437 0.447 0.446 0.435 0.444
Mean 0.189 0.195 0.203 0.181 0.187 0.259 0.202
0.933 0.934 0.937 0.912 0.877 0.528 0.979
0.076 0.020 0.019 0.036 0.063 0.005 0.026
Error rate
R² (J/(I+J) ; error rate)
R² (Js ; error rate)
General information Statistical value
instance-based learning method
decision tree
induction graph
neural networks
Naive Bayes
Topological approaches in machine learning 29/ 36

MotivationsSeparability
Topological GraphsSeparability of Classes
Some IllustrationsEvaluation of Kernel Matrix
•Relative cut edge weight and mean of the error rates
y = 0,8663x + 0,0036
R2 = 0,979
0.00
0.10
0.20
0.30
0.40
0.50
0.00 0.20 0.40 0.60
J/(I+J)
Err
or
rate
Topological approaches in machine learning 30/ 36
MotivationsSeparability
Topological GraphsSeparability of Classes
Some IllustrationsEvaluation of Kernel Matrix
Evaluation of Kernel Matrix
Kernel methods are based onmapping data into high dimension feature spaceusing linear separator in the new feature space
The kernelisation process plays a major role in the success oflearning.
Topological approaches in machine learning 31/ 36
MotivationsSeparability
Topological GraphsSeparability of Classes
Some IllustrationsEvaluation of Kernel Matrix
kernelisation
ϕ : X 7−→ H where X is the initial feature space and H the newone. The kernel matrix K is defined by :K = < ϕ(xi), ϕ(xj) >i=1,...,n;j=1,...,n For instance :
K (xi , xj) = exp(−γ∥∥xi − xj
∥∥2); γ > 0
K (xi , xj) = (xixj + 1)p; p ∈ IN∗
...Which kernel is the best for a specific application ?
Topological approaches in machine learning 32/ 36
MotivationsSeparability
Topological GraphsSeparability of Classes
Some IllustrationsEvaluation of Kernel Matrix
From the Kermal matrix to topological graph
Let’s denote by D(xi , xj) the original distance matrix in theoriginal space X and K (xi , xj) in the new feature space. Tobuild one of the topological graphs cited previously, we justneed to Know the distance matrix.
GGD is the Gabriel Graph derived from the distance matrixD(xi , xj)
GGK is the Gabriel Graph derived from the kernel MatrixK (xi , xj)
Using the statistical test of separability we have introducedbefore, we can assess if the kernel K leads to better featurespace than the kernel K’.
Topological approaches in machine learning 33/ 36

MotivationsSeparability
Topological GraphsSeparability of Classes
Some IllustrationsEvaluation of Kernel Matrix
Experiments
Experiment design
Ionosphere X 2 1 3 1
Heart X 1 3 2 1
Diabetes X 1 2 3 2
German X 3 1 2 2
Mushrooms X 1 3 2 1
Vehicle X 2 1 3 1
Breast-Cancer X 1 2 3 2
Australian X 2 1 3 2
12
Score
RBF K
J index of separability with GG
Data Sets Result : GG
Identification of the best Kernal Rank of each Kernal
Linear KPolynomial K
° 4RBF K Linear K
Polynomial K
° 4
Error rate SVM 5 folds cross validatios
Gold Standard
• J index of separability with Gabriel Graph (GG)
• J index of separability with MST Graph (MST)
• Kernal Target Alignment (KTA)*
• Feature Space Measure (FSM)*
(*) Cristianini et al. (2001)
Topological approaches in machine learning 34/ 36
MotivationsSeparability
Topological GraphsSeparability of Classes
Some IllustrationsEvaluation of Kernel Matrix
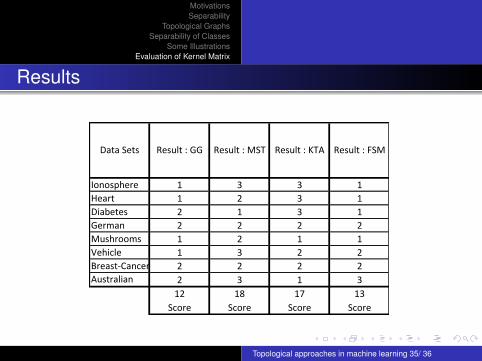
Results
Ionosphere 1 3 3 1
Heart 1 2 3 1
Diabetes 2 1 3 1
German 2 2 2 2
Mushrooms 1 2 1 1
Vehicle 1 3 2 2
Breast-Cancer 2 2 2 2
Australian 2 3 1 3
12 18 17 13
Score Score Score Score
Result : MST Result : KTA Result : FSMData Sets Result : GG
Topological approaches in machine learning 35/ 36
MotivationsSeparability
Topological GraphsSeparability of Classes
Some IllustrationsEvaluation of Kernel Matrix
We have applied this approach in various application domains :
Muhlenbach et al. “Outlier Handling in the Neighbourhood-based Learning of a Continuous
Class", LNAI Springer-Verlag, pp pp 314-321 (2004).
Lallich et al. "Improving classification by removing or relabeling mislabeled instances", LNAI
2366 Springer-Verlag , pp.5-15,(2002).
Scuturici et al., "Topological Query in Image Databases", Proceedings of 8th Ibero-American
Congres on Pattern Recognition (CIARP 2003), Havana, Cuba. pp.144-151(2003).
Scuturici et al., "Topological Query in Image Databases", LNCS Springer Verlag, Vol. 2905,
2004, 145-152.
Scuturici M. et al. "Topological representation model for image databases query", Journal of
Experimental and Theoretical Artificial Intelligence, Vol. 17, No. 1-2, (2005), 145-160.
Muhlenbach F. et al., "Identifying and Handling Mislabelled Instances", Journal of Intelligent
Information Systems, Vol. 22, No. 1, January (2004), 89-109.
Topological approaches in machine learning 36/ 36


