
Tobacco Taxation andPublic Health
Frank J. ChaloupkaUniversity of Illinois at Chicago
www.uic.edu/~fjc
Tobacco Taxation andPublic Health
Frank J. ChaloupkaUniversity of Illinois at Chicago
www.uic.edu/~fjc
Tobacco Control inDeveloping CountriesTobacco Control in
Developing Countries
The World Bank World Health Organization
Curbing the EpidemicGovernments and the Economics of
Tobacco Control
Curbing the EpidemicGovernments and the Economics of
Tobacco Control

Historically, tobacco taxes used togenerate revenues
Historically, tobacco taxes used togenerate revenues
Adam Smith on tobacco tax: Adam Smith on tobacco tax: "Sugar, rum, andtobacco, are commodities which are no wherenecessaries of life, which are become objectsof almost universal consumption, and whichare therefore extremely proper subjects oftaxation”
Source: An Inquiry into the Nature and Causes of TheWealth of Nations, Book V, Chapter III, pages 474-476,1776;

More recently, tobacco taxesused to improve health
More recently, tobacco taxesused to improve health
nn Reductions in tobacco consumption lead toReductions in tobacco consumption lead toreductions in morbidity and mortalityreductions in morbidity and mortalitycaused by tobacco usecaused by tobacco use
nn Improved economic efficiency from “userImproved economic efficiency from “userfees” that cover the social costs of tobaccofees” that cover the social costs of tobaccouse and its consequencesuse and its consequences

Per capita cigarette consumptionhas increased in developing
countries
Per capita cigarette consumptionhas increased in developing
countries
0
500
1000
1500
2000
2500
3000
3500
1970-72 1980-82 1990-92
Year
Ann
ual p
er a
dult
ciga
rett
e co
nsum
ptio
n
Developed
Developing
World
Source: WHO 1997

Large and growing number of deathsfrom smoking
Large and growing number of deathsfrom smoking
Source: Peto and Lopez, 2000
Past and future tobacco deaths (in millions)
Time Millions of deaths1901-2000 100 (mostly in developed
countries)
2001-2100 1,000 (mostly in developingcountries)
u 500 M among people alive todayu1 in 2 of long-term smokers killed by their addictionu1/2 of deaths in middle age (35-69)
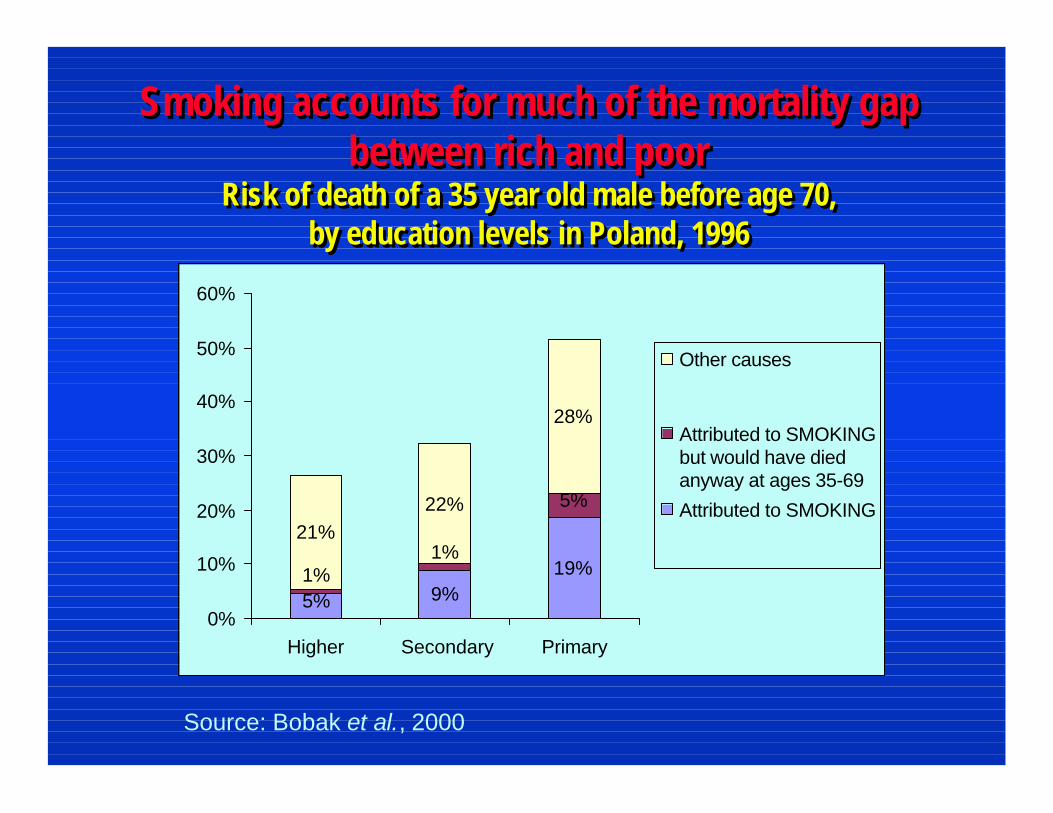
Smoking accounts for much of the mortality gapbetween rich and poor
Risk of death of a 35 year old male before age 70,by education levels in Poland, 1996
Smoking accounts for much of the mortality gapbetween rich and poor
Risk of death of a 35 year old male before age 70,by education levels in Poland, 1996
Source: Bobak et al., 2000
5% 9%19%1%
1%
5%
21%22%
28%
0%
10%
20%
30%
40%
50%
60%
Higher Secondary Primary
Other causes
Attributed to SMOKINGbut would have diedanyway at ages 35-69
Attributed to SMOKING

Tobacco addiction starts early in lifeTobacco addiction starts early in life
Source: Chinese Academy of Preventive Medicine 1997, Gupta 1996, US SurgeonGeneral Reports, 1989
nn Every day 80,000 to 100,000 youthsEvery day 80,000 to 100,000 youthsbecome regular smokersbecome regular smokers
C h i n a
(males,1996)
I n d i a
(males, 1995)
U S
(both sexes,
born 1952-61)
U S
(both sexes,
born 1910-14)
0
20
40
60
80
100
15 20 25
Age
Cu
mu
lati
ve u
pta
ke in
per
cen
t

Why should governments intervene?Economic rationale or “market failures”
Why should governments intervene?Economic rationale or “market failures”
nn Smokers do not know their risksSmokers do not know their risksnn Addiction and youth onset of smokingAddiction and youth onset of smoking
uu Lack of information and unwillingness toLack of information and unwillingness toact on informationact on information
uu Regret habit later, but many addictedRegret habit later, but many addicted
nn Costs imposed on othersCosts imposed on othersuu Costs of environmental tobacco smokeCosts of environmental tobacco smoke
and health costsand health costs
Source: Jha et al., 2000
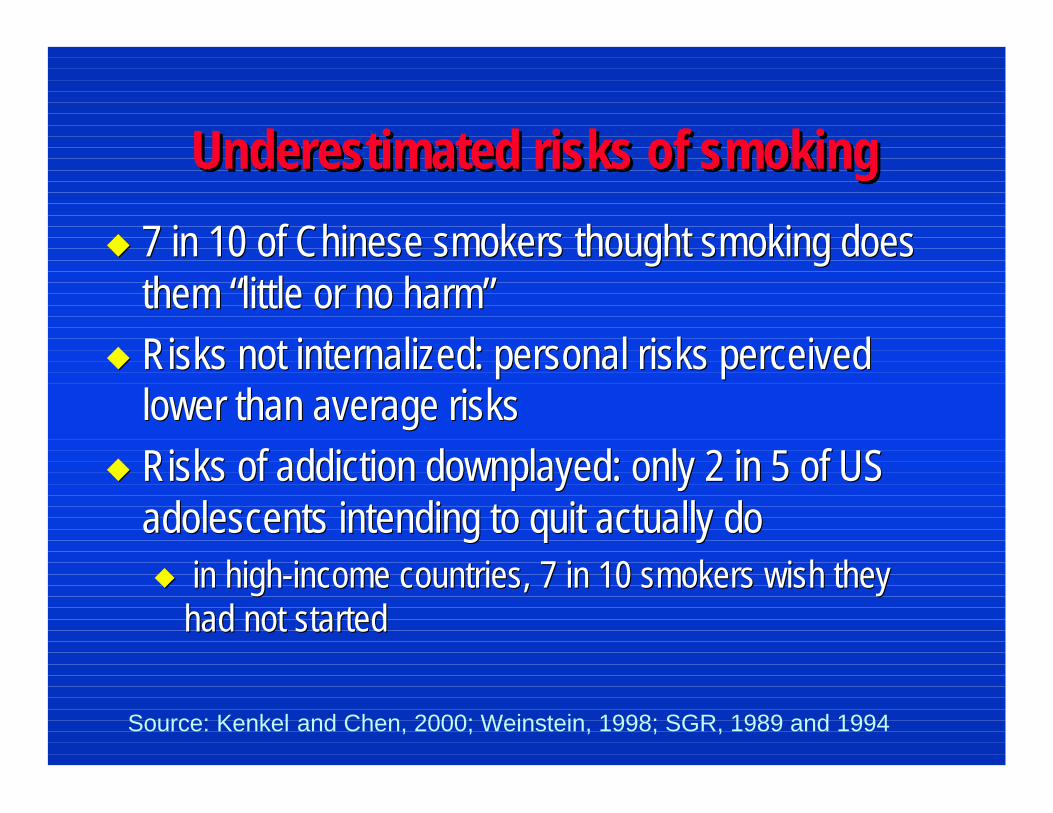
Underestimated risks of smokingUnderestimated risks of smoking
uu 7 in 10 of Chinese smokers thought smoking does7 in 10 of Chinese smokers thought smoking doesthem “little or no harm”them “little or no harm”
uu Risks not Risks not internalizedinternalized: personal risks perceived: personal risks perceivedlower than average riskslower than average risks
uu Risks of addiction downplayed: only 2 in 5 of USRisks of addiction downplayed: only 2 in 5 of USadolescents intending to quit actually doadolescents intending to quit actually douu in high-income countries, 7 in 10 smokers wish they in high-income countries, 7 in 10 smokers wish they
had not startedhad not started
Source: Kenkel and Chen, 2000; Weinstein, 1998; SGR, 1989 and 1994

Healthcare costs from smokingHealthcare costs from smoking
nn Annual (gross) healthcare costs:Annual (gross) healthcare costs:uu 0.1-1.1% of GDP, or 0.1-1.1% of GDP, or 6 -15% of total health costs 6 -15% of total health costs in high-in high-
income countriesincome countriesuu proportionally similar in lower-income countriesproportionally similar in lower-income countries
nn Net (lifetime) healthcare costs:Net (lifetime) healthcare costs:uu Differences in lifetime costs are smaller than annualDifferences in lifetime costs are smaller than annual
costscostsuu Best studies do suggest there are net lifetime costsBest studies do suggest there are net lifetime costsuu Pension or “smokers pay their way” arguments are Pension or “smokers pay their way” arguments are
complexcomplexSource: Lightwood et al., 2000

Government roles in interveningGovernment roles in intervening
nn To deter children from smokingTo deter children from smokingnn To protect non-smokers from others’ smokeTo protect non-smokers from others’ smokenn To provide adults with necessary information toTo provide adults with necessary information to
make an informed choicemake an informed choice
uu First-best instrument, such as youth restrictions, areFirst-best instrument, such as youth restrictions, areusually ineffective. Thus, tax increases are justified,usually ineffective. Thus, tax increases are justified,and are effective.and are effective.
uu Tax increases are blunt instruments.Tax increases are blunt instruments.Source: Jha et al., 2000

Unless current smokers quit, smoking deathswill rise dramatically over the next 50 years
Unless current smokers quit, smoking deathswill rise dramatically over the next 50 years
0
340
520
70
500
220
190
0
100
200
300
400
500
1950 2000 2025 2050
Year
Toba
cco
deat
hs (m
illio
n)
Baseline
If proportion ofyoung adultstaking up smokinghalves by 2020
If adultconsumptionhalves by 2020
Source: Peto and Lopez, 2000

Which interventions are effective?Measures to reduce demand
Which interventions are effective?Measures to reduce demand
nn Higher cigarette taxesHigher cigarette taxesnn Non-price measuresNon-price measures: consumer: consumer
information, research, cigarette advertisinginformation, research, cigarette advertisingand promotion bans, warning labels andand promotion bans, warning labels andrestrictions on public smokingrestrictions on public smoking
nn Increased access to nicotine replacementIncreased access to nicotine replacement(NRT) and other cessation therapies(NRT) and other cessation therapies

Taxation is the most effective measureTaxation is the most effective measure
nn Higher taxes induce quitting, preventHigher taxes induce quitting, preventrelapse, reduce consumption and preventrelapse, reduce consumption and preventstartingstarting
nn A 10% price increase reduces demand by:A 10% price increase reduces demand by:uu 4% in high-income countries4% in high-income countriesuu 8% in low or middle-income countries8% in low or middle-income countries
Source: Chaloupka et al., 2000
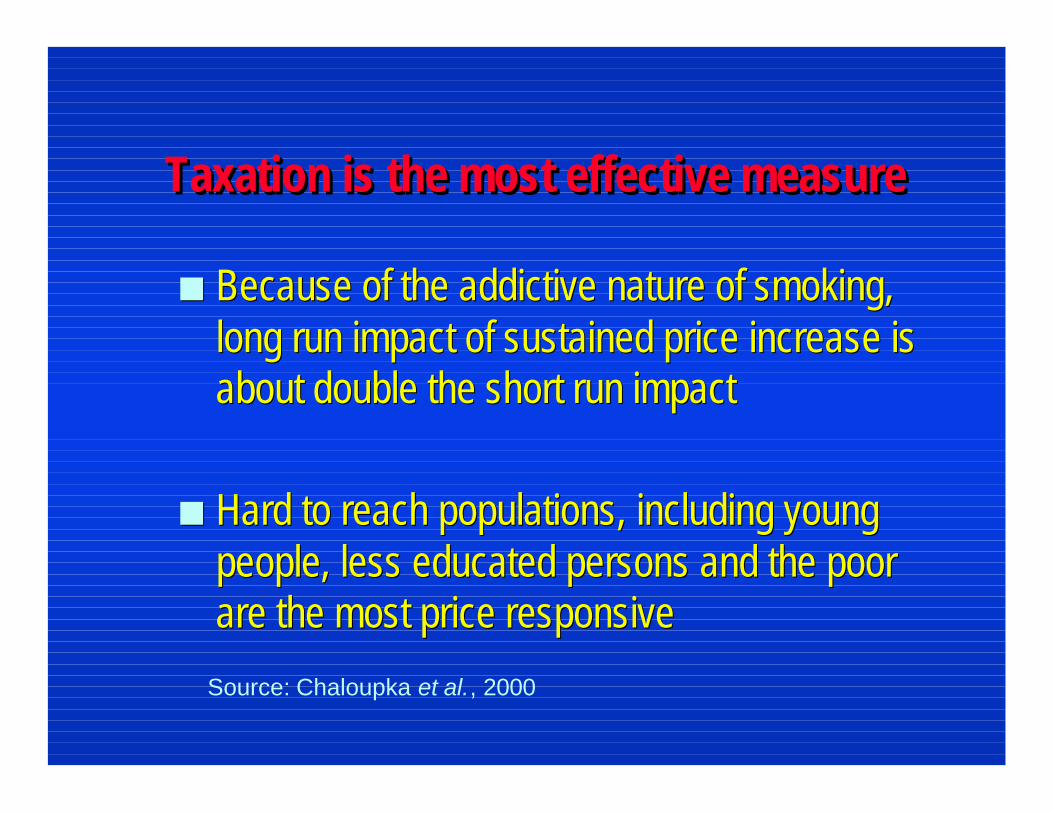
Taxation is the most effective measureTaxation is the most effective measure
nn Because of the addictive nature of smoking,Because of the addictive nature of smoking,long run impact of sustained price increase islong run impact of sustained price increase isabout double the short run impactabout double the short run impact
nn Hard to reach populations, including youngHard to reach populations, including youngpeople, less educated persons and the poorpeople, less educated persons and the poorare the most price responsiveare the most price responsive
Source: Chaloupka et al., 2000

Cigarette price and consumption showopposite trends (1)
Real price of cigarettes and annual per adult cigarette consumption inSouth Africa 1970-1989
Cigarette price and consumption showopposite trends (1)
Real price of cigarettes and annual per adult cigarette consumption inSouth Africa 1970-1989
Source: Saloojee 1995
0.05
0.06
0.07
0.08
0.09
1970 1972 1974 1976 1978 1980 1982 1984 1986 1988
Year
Cig
aret
te c
on
sum
ptio
n p
er a
du
lt (in
pac
ks)
0.7
0.8
0.9
1
1.1
1.2
1.3
Rea
l Pri
ce
Real price
Consumptionper adult

Cigarette price and consumption showopposite trends (2)
Real price of cigarettes and cigarette consumption in the UK, 1971-96
Cigarette price and consumption showopposite trends (2)
Real price of cigarettes and cigarette consumption in the UK, 1971-96
Source: Townsend 1998
9000
10000
11000
12000
13000
14000
15000
16000
17000
1971 1974 1977 1980 1983 1986 1989 1992 1995
Year
£ 1.25
£ 1.45
£ 1.65
£ 1.85
£ 2.05
£ 2.25
£ 2.45
£ 2.65
Pric
e (£
) 199
4 va
lue
PRICE
CONSUMPTION

What is the “right” level of tax?What is the “right” level of tax?
nn Complex questionComplex questionuu Depends on various factors, such as degree toDepends on various factors, such as degree to
which society wishes to protect children,which society wishes to protect children,revenue considerations, etc.revenue considerations, etc.
nn Useful yardstick: where comprehensiveUseful yardstick: where comprehensiveprograms used, tax is at least 2/3 to 4/5 ofprograms used, tax is at least 2/3 to 4/5 ofretail price.retail price.
Source: Chaloupka et al., 2000

There is still ample room, especially in lower-income countries, to raise cigarette taxes
There is still ample room, especially in lower-income countries, to raise cigarette taxes
0.00
0.50
1.00
1.50
2.00
2.50
3.00
3.50
High Income Upper MiddleIncome
Lower MiddleIncome
Low Income
Countries by income
Aver
age
pric
e or
tax
per p
ack
(US$
)
0
10
20
30
40
50
60
70
80
Tax
as a
per
cent
age
of p
rice
Average price in US$Average tax in US$Tax as a percentage of price
Source: Chaloupka et al., 2000

Earmarked/Dedicated Tobacco Taxes GenerateAdditional Public Health Benefits (1)
Earmarked/Dedicated Tobacco Taxes GenerateAdditional Public Health Benefits (1)
nn Used for Used for countermarketing countermarketing and other tobaccoand other tobaccocontrol efforts (California, Massachusetts,control efforts (California, Massachusetts,Chongquing Chongquing and several others)and several others)uu These efforts lead to further reductions in tobacco useThese efforts lead to further reductions in tobacco use
and its consequencesand its consequences
nn Replace tobacco industry funding of sporting andReplace tobacco industry funding of sporting andartistic events (the Vic-Health model; Newartistic events (the Vic-Health model; NewZealand, Australian states, othersZealand, Australian states, others

Earmarked/Dedicated Tobacco Taxes GenerateAdditional Public Health Benefits (2)
Earmarked/Dedicated Tobacco Taxes GenerateAdditional Public Health Benefits (2)
nn Used to fund health care for under-insuredUsed to fund health care for under-insuredpopulations, cancer control research, and otherpopulations, cancer control research, and otherpublic health efforts (California, Canada,public health efforts (California, Canada,Ecuador, Finland, Guam, Malaysia, Peru,Ecuador, Finland, Guam, Malaysia, Peru,Portugal, the US, and many others)Portugal, the US, and many others)
nn Used to help tobacco farmers and manufacturingUsed to help tobacco farmers and manufacturingemployees move into other crops and industriesemployees move into other crops and industries(relatively uncommon)(relatively uncommon)

Potential impact of a price increase of10% and a package of non-price measures
Potential impact of a price increase of10% and a package of non-price measures
Region Change in numberof smokers(millions)
Change in number ofdeaths (millions)
Priceincreases
Non-pricemeasures
Priceincreases
Non-pricemeasures
Low/MiddleIncome
-38 -19 -9 -4
HighIncome
-4 -4 -1 -1
World -42 -23 -10 -5
Source: Ranson et al., 2000

What are the costs of tobaccotaxation?
What are the costs of tobaccotaxation?
nn Revenue lossRevenue loss: : likely to have revenue gainslikely to have revenue gainsuu a 10% tax increase would raise revenue by 7%a 10% tax increase would raise revenue by 7%
nn Job lossJob loss: : temporary, minimal, and gradualtemporary, minimal, and gradual
nn Possible smugglingPossible smuggling: : crack down on criminalcrack down on criminalactivity, not lower taxesactivity, not lower taxes
nn Cost to individuals, especially the poor:Cost to individuals, especially the poor:partially offset by lower consumptionpartially offset by lower consumption

Cigarette tax increases result inhigher tax revenues (1)
Real cigarette tax rate and real cigarette tax revenue inthe US 1960-95
Cigarette tax increases result inhigher tax revenues (1)
Real cigarette tax rate and real cigarette tax revenue inthe US 1960-95
0
0.1
0.2
0.3
0.4
0.5
0.6
1960
1962
1964
1966
1968
1970
1972
1974
1976
1978
1980
1982
1984
1986
1988
1990
1992
1994
Year
Rea
l cig
aret
te t
ax r
ate
per
pac
k (a
veag
e fo
r al
l sta
tes)
0
10
20
30
40
50
60
70
80
Rea
l cig
aret
te t
ax r
even
ue
in m
illio
ns
of
US
$
real cigarette tax ratereal cigarette tax revenue
Source: Sunley et al., 2000

Cigarette tax increases result inhigher tax revenues (2)
Real cigarette tax rate and real cigarette tax revenue inSouth Africa 1960-97
Cigarette tax increases result inhigher tax revenues (2)
Real cigarette tax rate and real cigarette tax revenue inSouth Africa 1960-97
0
0.001
0.002
0.003
0.004
0.005
0.006
0.007
0.008
1970
1972
1974
1976
1978
1980
1982
1984
1986
1988
1990
1992
1994
1996
Year
Rea
l ciga
rette tax
rates
per pa
ck in con
stant 19
90 Zim
babw
e
dollars
0
100000
200000
300000
400000
500000
600000
700000
Rea
l ciga
rette tax
rates
per pa
ck in con
stant 19
90 Zim
babw
e
dollars
Real tax per pack
Real tax revenue
Source: Sunley et al., 2000

Studies on the employment effects of dramaticallyreduced or eliminated tobacco consumption
Studies on the employment effects of dramaticallyreduced or eliminated tobacco consumption
Type of country Name and year Net change as % ofeconomy in base
year givenNet Exporters US (1993) 0%
UK (1990) +0.5%
Zimbabwe (1980) -12.4%
Balanced TobaccoEconomies
South Africa (1995) +0.4%
Scotland (1989) +0.3%
Net Importers Bangladesh (1994) +18.7%
Source:Buck and others, 1995; Irvine and Sims, 1997; McNicoll and Boyle 1992, van der Merwe and others, background paper; Warner and others 1996

Smuggling of CigarettesSmuggling of Cigarettes
nn Industry has economic incentive to smuggleIndustry has economic incentive to smuggleuu Increase market share and decrease tax ratesIncrease market share and decrease tax rates
nn Best estimate: 6 to 8.5% of total consumptionBest estimate: 6 to 8.5% of total consumptionnn Non-price variables importantNon-price variables important
uu Perceived level of corruption more important than cigarettePerceived level of corruption more important than cigarettepricesprices
nn Tax increase will lead to revenue increase, even in theTax increase will lead to revenue increase, even in theevent of increased smugglingevent of increased smuggling
Source: Merrriman et al. 2000; Joosens, 2000; BAT,1998

Control of SmugglingControl of Smugglingnn Countries need not make a choice between higherCountries need not make a choice between higher
cigarette tax revenues and lower cigarettecigarette tax revenues and lower cigaretteconsumptionconsumptionuu Higher tax rates can achieve bothHigher tax rates can achieve both
nn Effective control measures of smuggling existEffective control measures of smuggling existuu Focus on large container smugglingFocus on large container smugglinguu Prominent local language warnings and tax stampsProminent local language warnings and tax stampsuu Increase penaltiesIncrease penaltiesuu Licensing and tracking of containersLicensing and tracking of containersuu Increase export duties or bondsIncrease export duties or bonds
nn Multilateral tax increases help combat smugglingMultilateral tax increases help combat smuggling
Source: Merrriman Source: Merrriman et al.et al. 2000;Joosens, 2000; BAT, 1998 2000;Joosens, 2000; BAT, 1998

How cost-effective is tobacco taxation?US dollars per healthy year life gained
How cost-effective is tobacco taxation?US dollars per healthy year life gained
Note: 3% discount rate, costs for non-price measures and all benefits projected over 30 years
Source: Ranson et al., 2000
Region Priceincreases of
10%
Non-pricemeasures
witheffectiveness
of 5%
NRT (publiclyprovided) with
25%coverage
Low / middleincome
4 to 34 68 to 272 276 to 297
High Income 165 to 1,370 1,347 to5,388
746 to 1,160

SummarySummarynn Tobacco deaths worldwide are large and growing,Tobacco deaths worldwide are large and growing,
and have higher burdens among the poorand have higher burdens among the poor
nn Specific market failures support governmentSpecific market failures support governmentinterventionintervention
nn Tax increases are most effective to reduceTax increases are most effective to reduceconsumptionconsumption
nn Other demand reduction strategies are also effectiveOther demand reduction strategies are also effective
nn Control of smuggling is the major supply-sideControl of smuggling is the major supply-sideinterventionintervention
nn Tobacco taxation and other tobacco control effortsTobacco taxation and other tobacco control effortsare cost-effectiveare cost-effective


