Map-Based Modeling of
People’s Knowledge, Perceptions and Willingness
to Participate in Green Infrastructure Alternatives
to Traditional Storm-Water Management:
A Case Study in Syracuse
Wanjun Peng1, A. Karen Baptiste2 and Lindsay Speer3
1. Master Candidate
State University of New York College of Environmental Science and Forestry
2. Assistant Professor , Colgate University 3. The Partnership for Onondaga Creek
November 17th, 2010

A voice for the Midland Community and the environment
advocating for better, nonpolluting solutions
for Onondaga Creek – Since 2000
Partnership for Onondaga Creek
2009 - [email protected]
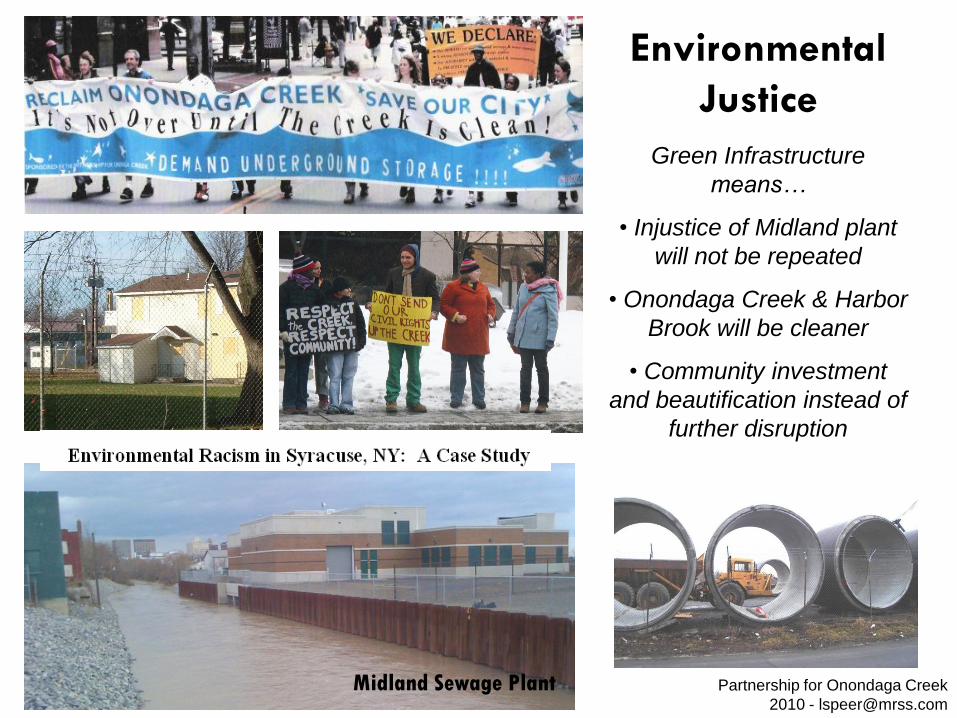
Environmental
Justice
Partnership for Onondaga Creek
2010 - [email protected]
Midland Sewage Plant
Green Infrastructure
means…
• Injustice of Midland plant
will not be repeated
• Onondaga Creek & Harbor
Brook will be cleaner
• Community investment
and beautification instead of
further disruption
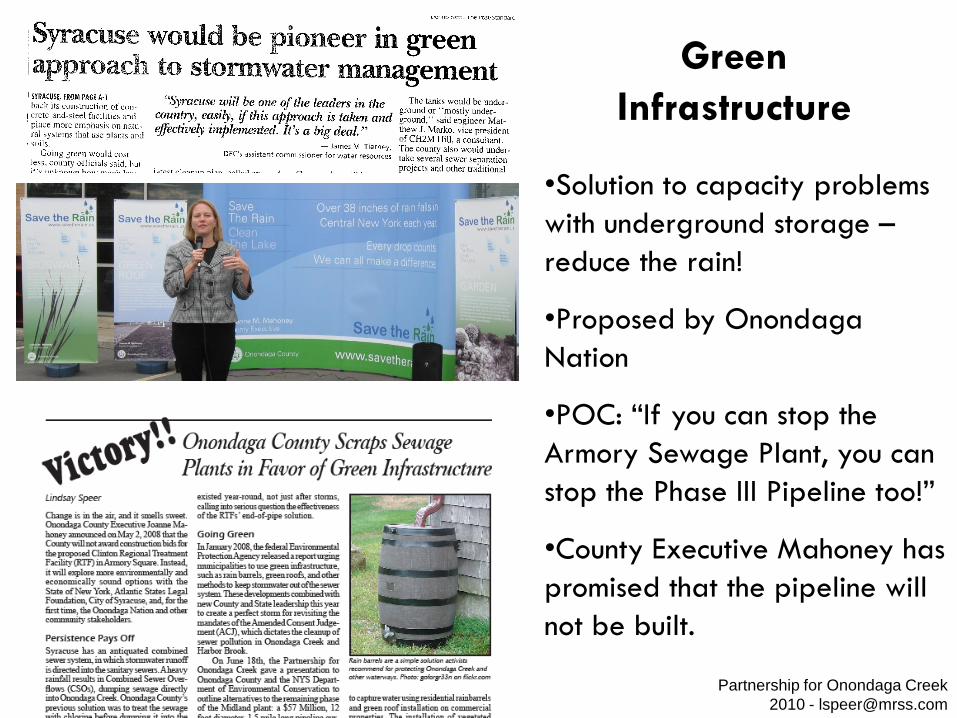
Green
Infrastructure
•Solution to capacity problems
with underground storage –
reduce the rain!
•Proposed by Onondaga
Nation
•POC: “If you can stop the
Armory Sewage Plant, you can
stop the Phase III Pipeline too!”
•County Executive Mahoney has
promised that the pipeline will
not be built.
Partnership for Onondaga Creek
2010 - [email protected]

Partnership for Onondaga Creek
2010 - [email protected]
Map of land use / GI possibilities in the
077 sewershed, including University
Neighborhood. Part of presentation by
POC to DEC & Onondaga County, 2008.
Engaging
Community
Dr. April Baptiste
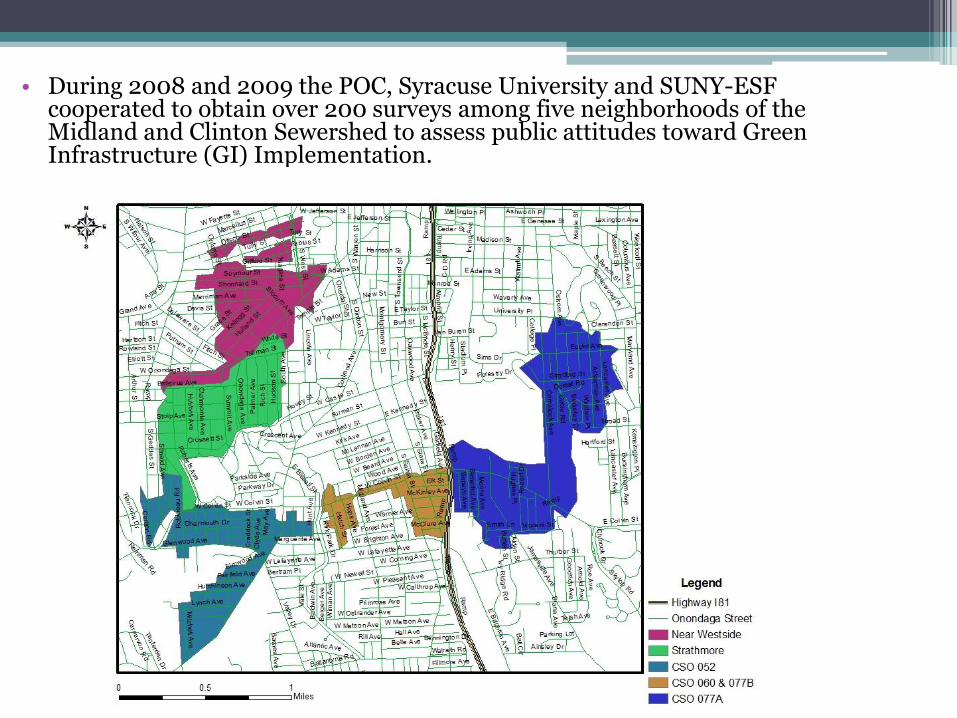
• During 2008 and 2009 the POC, Syracuse University and SUNY-ESF cooperated to obtain over 200 surveys among five neighborhoods of the Midland and Clinton Sewershed to assess public attitudes toward Green Infrastructure (GI) Implementation.

• Explore to what extent individual demographics influence environmental attitudes toward GI
• Explore at what level neighborhood contexts are statistically related to environmental attitudes toward GI
• Use maps to visualize environmental attitudes toward GI implementation across neighborhoods
* Three building blocks of environmental attitudes: Environmental knowledge
Environmental perception
Environmental behavioral intention.
Objective
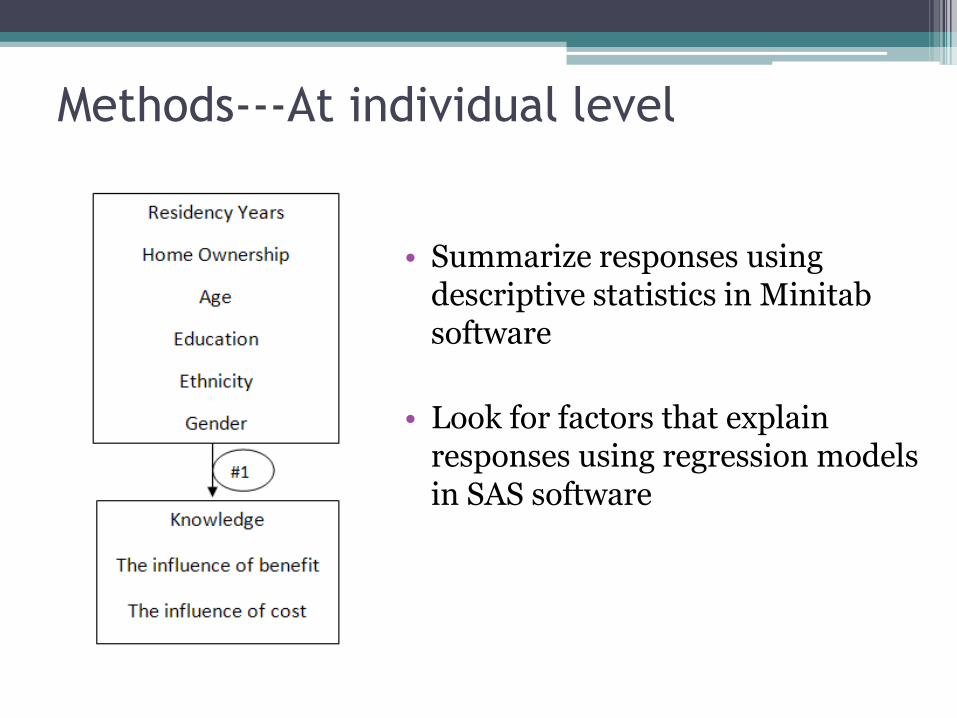
Methods---At individual level
• Summarize responses using descriptive statistics in Minitab software
• Look for factors that explain responses using regression models in SAS software

Methods---At individual level
• Summarize responses using Descriptive Statistics in Minitab software
• Look for influence of demographics, knowledge, perception of benefits and cost on responses using Regression Models in SAS software
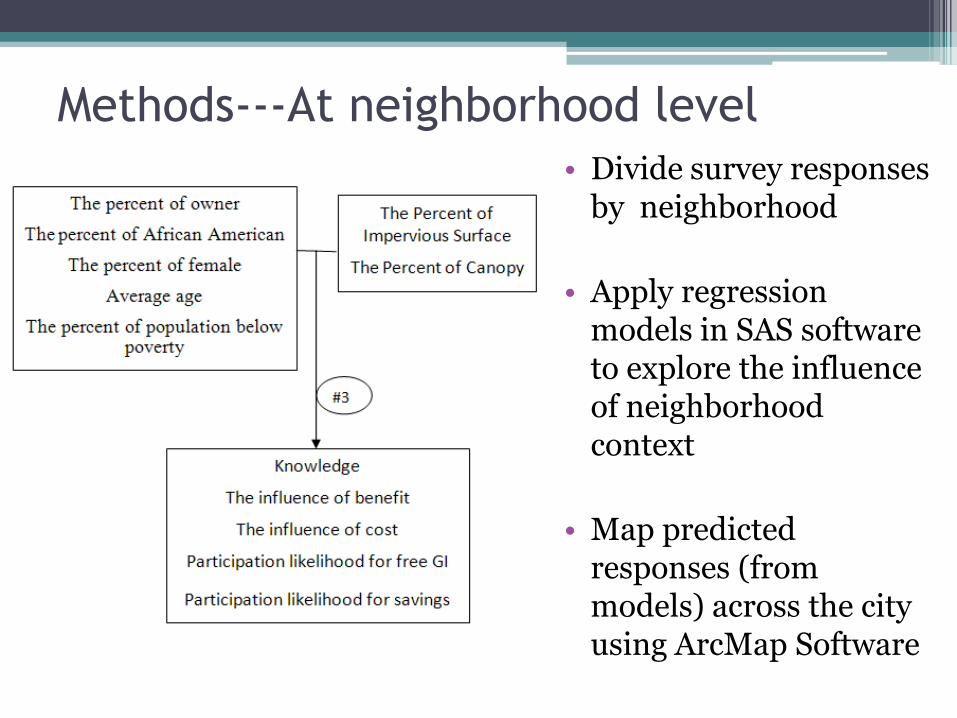
• Divide survey responses by neighborhood
• Apply regression models in SAS software to explore the influence of neighborhood context
• Map predicted responses (from models) across the city using ArcMap Software
Methods---At neighborhood level

RESULTS at the Individual Level: The effect of demographic background and perception of benefits and cost on behavioral intention to implement GI if provided for free(216 Individual Surveys)
Overall GI (All), rain barrels (RB), trees (T), rain garden (RG),
porous driveway/sidewalks (P) and curbside extensions (CE).
Participation likelihood for free GI
All RB T RG P CE
Residency
Ownership
Age
Education
Ethnicity * *
Gender * *
Knowledge + + + + + +
The influence of benefit + + + + + +
The influence of cost - -

RESULTS at the Individual Level:
The effect of demographic background and perception of benefits and cost
on behavioral intention to implement GI if savings on water bills ensued
(216 Individual Surveys)
Overall GI (All), rain barrels (RB), trees (T), rain garden (RG),
porous driveway/sidewalks (P) and curbside extensions (CE).
Participation likelihood for savings
All RB T RG P CE
Residency
Ownership
Age - - -
Education
Ethnicity
Gender
Knowledge + + + + +
The influence of benefit + + + + +
The influence of cost -

RESULTS at the Neighborhood Level: The effect of neighborhood context on respondents’ behavioral intention to implement GI if provided for free(17 block groups with 136 Individual Surveys)
Overall GI (All), rain barrels (RB), trees (T), rain garden (RG),
porous driveway/sidewalks (P) and curbside extensions (CE).
Participation likelihood for free GI
All RB T RG P CE
Neighborhood Canopy Cover (%) + +
Neighborhood Imp. Surface (%)
The percent of houses
occupied by owner+
The percent of African Americans
The percent of females +
Average age of neighbors + + +
The percent below poverty level
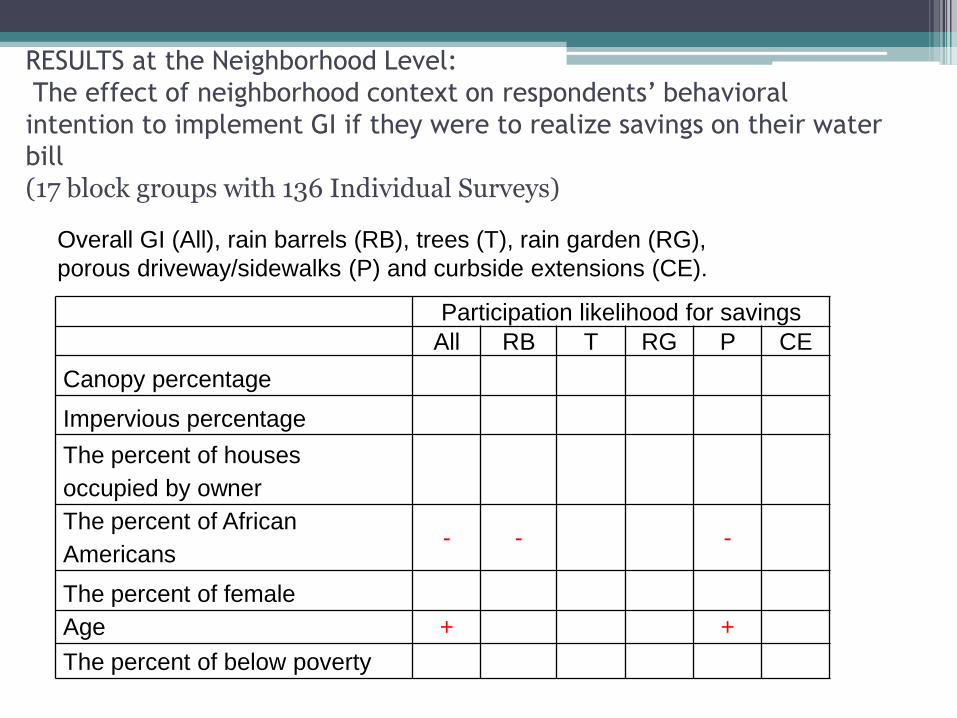
RESULTS at the Neighborhood Level:
The effect of neighborhood context on respondents’ behavioral
intention to implement GI if they were to realize savings on their water
bill
(17 block groups with 136 Individual Surveys)
Overall GI (All), rain barrels (RB), trees (T), rain garden (RG),
porous driveway/sidewalks (P) and curbside extensions (CE).
Participation likelihood for savings
All RB T RG P CE
Canopy percentage
Impervious percentage
The percent of houses
occupied by owner
The percent of African
Americans- - -
The percent of female
Age + +
The percent of below poverty
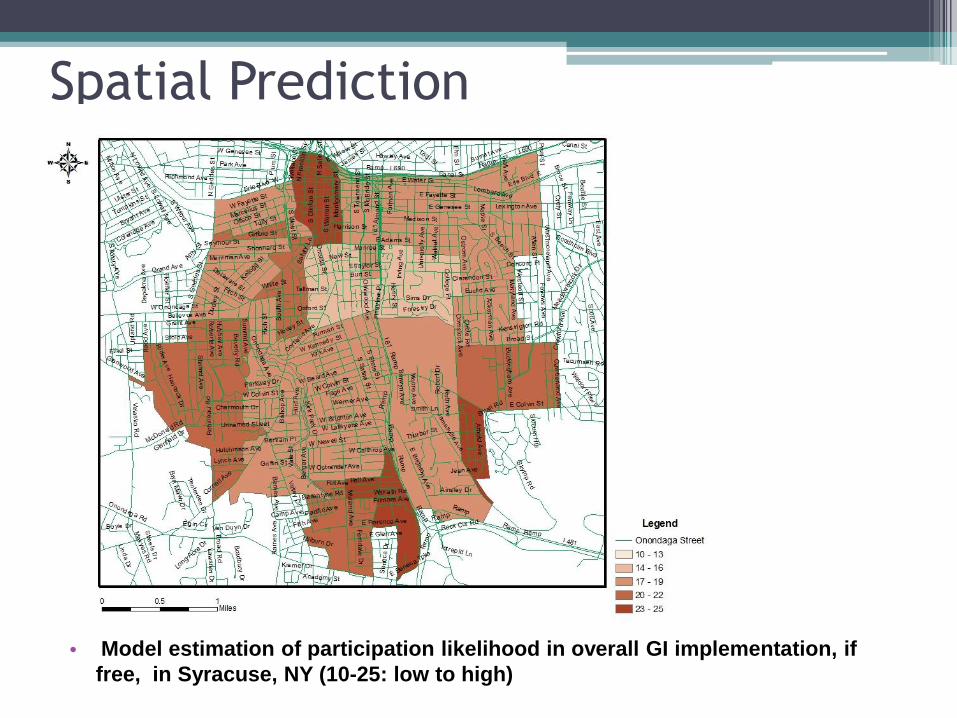
Spatial Prediction
• Model estimation of participation likelihood in overall GI implementation, if
free, in Syracuse, NY (10-25: low to high)

Spatial Prediction
• Model estimation of participation likelihood in overall GI implementation, if
savings on water bills were to occur, in Syracuse, NY (10-25: low to high)
Conclusion• At the individual level, the likelihood of participation is
significantly related to knowledge and perceived benefit of GI.
• At the neighborhood scale, the variation in willingness to implement any GI, with the exception of curbside extension, can be explained primarily by a higher existing tree canopy cover, a lower percent of African American population, and an older population.
• The findings can provide valuable information to government officials working to find cheaper, publically acceptable, and environmentally friendly ways to control storm water management.
Acknowledge
I would like to thank Myrna Hall and Stephen V. Stehman from SUNY ESF for their guidance and expertise during my research in spite of their tight schedule.