
Title The Role of Granule Size on the Kinetics of ElectrochemicalReduction of SiO2 Granules in Molten CaCl2
Author(s) Yang, Xiao; Yasuda, Kouji; Nohira, Toshiyuki; Hagiwara,Rika; Homma, Takayuki
CitationMetallurgical and Materials Transactions B: ProcessMetallurgy and Materials Processing Science (2016), 47(1):788-797
Issue Date 2016-02
URL http://hdl.handle.net/2433/230381
Right
This is a post-peer-review, pre-copyedit version of an articlepublished in 'Metallurgical and Materials Transactions B'. Thefinal authenticated version is available online at:https://doi.org/10.1007/s11663-015-0456-1; The full-text filewill be made open to the public on 1 February 2017 inaccordance with publisher's 'Terms and Conditions for Self-Archiving'.; This is not the published version. Please cite onlythe published version. この論文は出版社版でありません。引用の際には出版社版をご確認ご利用ください。
Type Journal Article
Textversion author
Kyoto University

1
The Role of Granule Size on the Kinetics of Electrochemical Reduction 1
of SiO2 Granules in Molten CaCl2 2
3
Xiao Yanga, Kouji Yasuda
b,c, Toshiyuki Nohira
a, Rika Hagiwara
b, and Takayuki Homma
d 4
5
aInstitute of Advanced Energy, Kyoto University, Gokasho, Uji, Kyoto 611-0011, Japan 6
bGraduate School of Energy Science, Kyoto University, Yoshida-honmachi, Sakyo-ku, Kyoto 606-7
8501, Japan 8
cEnvironment, Safety and Health Organization, Kyoto University, Yoshida-honmachi, Sakyo-ku, 9
Kyoto 606-8501, Japan 10
dFaculty of Science and Engineering, Waseda University, 3-4-1 Okubo, Shinjuku-ku, Tokyo 169-11
8555, Japan 12
13
Corresponding authors: 14
X. Yang ([email protected]) 15
T. Nohira ([email protected]) 16
17
18

2
Abstract 19
As a fundamental study to develop a new process for producing solar-grade silicon, the effect of 20
granule size on the kinetics of the electrochemical reduction of SiO2 granules in molten CaCl2 was 21
investigated. SiO2 granules with different size ranges were electrolyzed in molten CaCl2 at 1123 K 22
(850 °C). The reduction kinetics was evaluated on the basis of the growth rate of the reduced Si layer 23
and the behavior of the current during electrolysis. The results indicated that finer SiO2 granules are 24
more favorable for a high reduction rate because the contact resistance between the bottom Si plate 25
and the reduced Si particles is small and the diffusion of O2-
ions in CaCl2 inside the porous Si shell 26
is easy. Electrolysis using SiO2 granules less than 0.1 mm in size maintained a current density of no 27
less than 0.4 A cm-2
within 20 min, indicating that the electrochemical reduction of fine SiO2 28
granules in molten CaCl2 has the potential of becoming a high-yield production process for solar-29
grade silicon. 30
31
3
I. INTRODUCTION 32
The global photovoltaic (PV) market has been growing rapidly in recent years. In 2013, the annual 33
installation of PV systems in the world reached 37 GW,[1]
which was a 60-fold increase as compared 34
to 2003. Yet the power globally generated from solar energy was less than 0.5 pct of the total power 35
generation in 2012.[2]
According to a study by the German Advisory Council on Global Change 36
(WBGU), solar energy is expected to become a major energy source, reaching 20 pct of the total 37
world energy by 2050 and 70 pct by 2100.[3]
Presently, the dominant material for solar cells is 38
silicon, particularly crystalline silicon. Crystalline silicon solar cells represented 90.1 pct of the 39
global production of all types of solar cells in 2013.[4]
Because they offers advantages in terms of 40
high conversion efficiency, high durability, non-toxicity, and abundant resources, silicon solar cells 41
are the only candidate to meet the market demand in the future when PV installation could climb to 42
several hundred GW per year. 43
The increasing demand for PV systems boosts the production of high-purity polycrystalline Si 44
dramatically. The global production of polycrystalline Si in 2013 saw a 10-fold increase since 2003 45
to 233,800 t,[5]
more than 90 pct of which was supplied to the PV industry. Such growth is expected 46
to continue over the long term. For PV applications, the purity of Si must be at least 6N (99.9999 47
pct), and this product is called solar-grade Si (SOG-Si). The dominant technology for SOG-Si 48
production is the Siemens process,[6-8]
which represents approximately 90 pct of the global 49

4
production. In spite of the ability to produce Si at purity levels above 9N, the Siemens process, 50
which utilizes chemical vapor deposition using trichlorosilane (SiHCl3), requires high energy 51
consumption and results in low productivity. Production of SOG-Si based on pyrolysis of 52
monosilane (SiH4) in a fluidized bed reactor (FBR) is the main competitor to the Siemens process 53
and represents about 10 pct of the market.[8-10]
FBR consumes less energy and it is more economical 54
than the Siemens process, yet limitations in terms of purity control and productivity inhibit its 55
commercial application. Upgrading metallurgical-grade silicon (UMG) is an emerging process for 56
SOG-Si production. The aim of this process is to cost-effectively refine metallurgical-grade Si by 57
slag treatment, acid leaching, and directional solidification.[11-13]
However, UMG has a relatively 58
small market share at present because of problems with purity control.[8,14]
Various attempts have 59
been made to optimize the present technologies to improve energy efficiency and productivity and to 60
reduce cost.[15-20]
Meanwhile, new SOG-Si production processes[21-22]
such as the carbothermic 61
reduction of silica using high-purity raw materials,[23]
refining of metallurgical-grade Si by different 62
approaches,[24-32]
metallothermic reduction of silicon compounds,[33-40]
and electrochemical 63
processes,[41-48]
are being developed to challenge the existing technologies. 64
Electrochemical reduction of solid oxides in molten salt has been widely studied since it was 65
firstly reported by Fray and his colleagues.[49-57]
We originally demonstrated that solid silica (SiO2) 66
can be electrochemically reduced to solid Si in molten salts via the solid-to-solid reaction: [58-71]
67

5
SiO2 (s) + 4e- → Si (s) + 2O
2- (1) 68
Similar works have been reported by other researchers.[72-84]
Chen and his colleagues[72-75]
studied 69
the reduction behavior of SiO2 plates or pellets in molten CaCl2 based on electrochemical 70
measurements. We came up with a novel idea for SOG-Si production by combining direct 71
electrochemical reduction with the use of high-purity silica, acid leaching, and directional 72
solidification.[64]
Impurities in the Si produced by this method were experimentally demonstrated to 73
be at a low level.[68]
A semi-continuous electrochemical reduction process was thus proposed,[69]
in 74
which SiO2 granules as the raw material supplied from the top side of the electrolysis cell are 75
reduced at the cathode placed at the bottom and recovered as slurry containing molten CaCl2. The 76
kinetic characteristics of the reducing process of SiO2 granules were clarified by measuring the 77
weight change of the samples during electrolysis.[70]
The apparent current density was 0.7 A cm-2
at 78
the initial stage of electrolysis, which indicates the promise of this process in terms of productivity. 79
An integrated understanding of the mechanism and kinetics of the direct electrochemical reduction 80
of solid SiO2 in a molten salt is crucial for upscaling of the laboratory experiment to commercial 81
production. In our previous study, we systematically investigated the reduction behavior of SiO2 82
granules on a bottom cathode in molten CaCl2 at 1123 K (850 °C) by visually observing changes to 83
the reaction interfaces after different electrolysis durations.[71]
The overall reduction was found to 84

6
proceed via two different routes: (1) from the SiO2 granules near the conductor to the distant 85
granules along the granule surfaces and (2) from the surface to the core in each partly reduced 86
granule. Formation of a core (SiO2)–shell (Si) structure for partly reduced SiO2 granules indicated 87
that the reduction along the granule surfaces was faster than that from the surface to the core. On the 88
basis of such findings, finer SiO2 granules are expected to be more favorable for a high reduction 89
rate owing to the larger surface area. However, this expectation needs to be experimentally 90
confirmed. 91
High productivity is crucial for every practical production process for SOG-Si, including molten 92
salt electrolysis. In this process, the size of SiO2 granules is considered to be one of the key 93
parameters that strongly affects the reduction kinetics and thus determines the productivity. 94
Therefore, the purpose of the present study was to clarify the effect of granule size on the kinetics of 95
the electrochemical reduction of SiO2 granules in molten CaCl2. SiO2 granules with different size 96
ranges were electrolyzed in molten CaCl2 at 1123 K (850 °C). The reduction kinetics was 97
quantitatively evaluated in terms of both the growth rate of the reduced layer and the behavior of the 98
current during electrolysis. A reaction model that illustrates the reduction process and the 99
dependence of reduction kinetics on granule size is proposed. 100

7
II. EXPERIMENTAL 101
A. Materials and Apparatus 102
Approximately 400 g of CaCl2 (Kojundo Chemical Lab. Co., Ltd., 99 pct) was used as the 103
electrolyte bath. Prior to use, the CaCl2 was dried under vacuum at 453 K (180 °C) for 72 h and 773 104
K (500 °C) for 24 h to remove the residual moisture. Approximately 0.13 g of SiO2 granules 105
(Kojundo Chemical Lab. Co., Ltd., 99 pct) in four size ranges (less than 0.1 mm, 0.10–0.25 mm, 106
0.5–1.0 mm, and 1.0–2.0 mm), shown in Figure 1, were used in this study. These granules were 107
obtained from large granules (2.0–5.0 mm) after grinding and screening. 108
*********** Figure 1 *********** 109
Figure 2(a) shows a schematic of the electrolysis cell. An Al2O3 crucible (Nikkato Corp., o.d. 90 × 110
i.d. 80 × height 100 mm) charged with CaCl2 was set inside a SiO2 vessel and heated to 1123 K 111
(850 °C) in a dry Ar atmosphere (100 mL min-1
). The working electrode (WE) comprised an Al2O3 112
tube (Nikkato Corp., o.d. 8 × i.d. 5 × height 15 mm) and a Si plate [Nilaco Corp., diameter 10.0 × 113
thickness 0.5 mm, n-type, (100) plane], which served as a container and a current collector 114
respectively, as shown in Figure 2(b). SiO2 granules were charged in the Al2O3 tube. A nickel wire 115
(Nilaco Corp., diameter 1.0 mm, 99 pct) used as the current lead was connected to the Si plate by 116
threading it into a drilled hole (diameter 1.1 mm). With this setup, electrical contact to the SiO2 117
occurred only through the Si plate at the bottom of the Al2O3 tube. 118

8
*********** Figure 2 *********** 119
The counter electrode (CE) was a glassy carbon rod (Tokai Carbon Co., Ltd., diameter 5.2 mm). 120
The reference electrode (RE) was an Ag+/Ag electrode prepared by immersing a silver wire (Nilaco 121
Corp., diameter 1.0 mm, 99 pct) into CaCl2 containing 0.5 mol pct AgCl (Wako Pure Chemical Co., 122
Ltd., 99.5 pct) in a mullite tube (Nikkato Corp., o.d. 6 × i.d. 4 × height 450 mm).[63]
A molybdenum 123
wire (Nilaco Corp., diameter 1.0 mm, 99 pct) was used to conduct the cyclic voltammetry to 124
calibrate the Ca2+
/Ca potential and check the potential of the Ag+/Ag reference electrode. 125
B. Procedure 126
After conducting the cyclic voltammetry using the Mo wire to calibrate the Ca2+
/Ca potential, the 127
potential of the working electrode was set at 0.5 V vs. Ca2+
/Ca for the potentiostatic electrolysis for 128
10–100 min. The working electrode was immediately taken out from the melt after electrolysis and a 129
new one was immersed for another run. The post-electrolysis working electrode was cut vertically 130
into two halves to observe the cross section. In some cases, the post-electrolysis working electrode 131
was washed in 10 M HCl (aq.) for 3 h to disassemble the Si plate at the bottom. The upper surface of 132
the Si plate in contact with the SiO2 granules was observed. 133
134
III. RESULTS 135
A. Contact of SiO2 Granules with the Bottom Si Plate 136

9
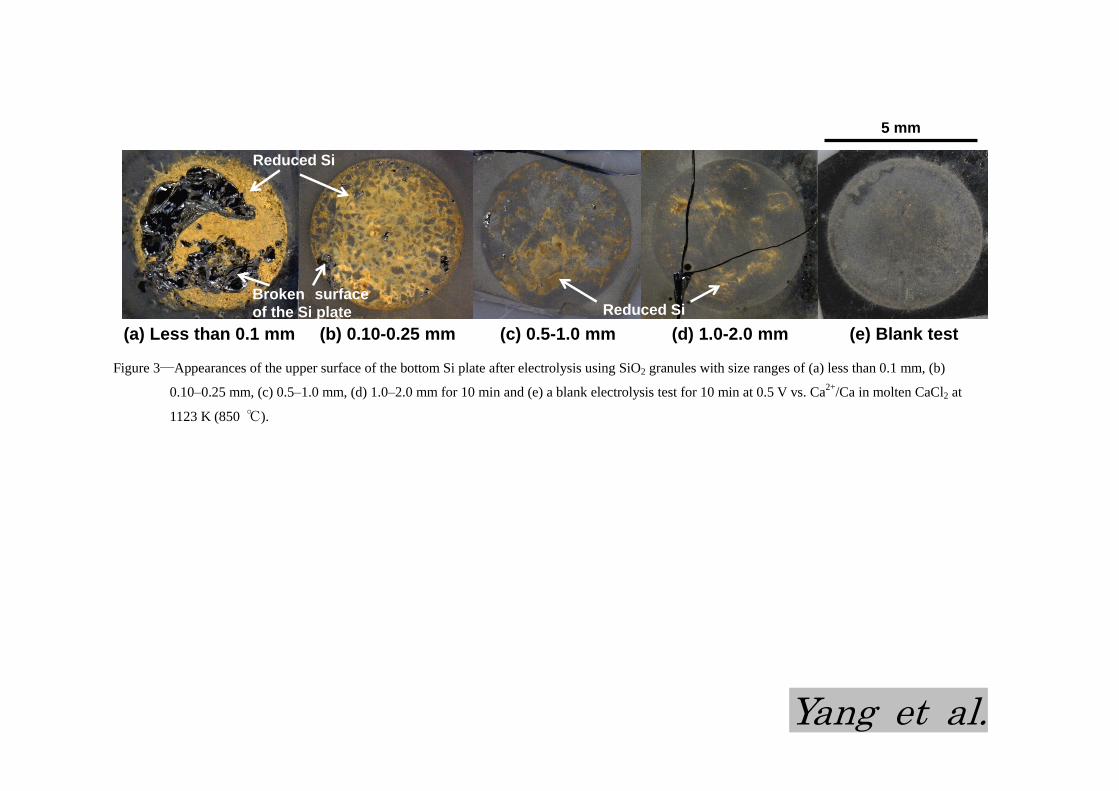
Figure 3 compares the appearance of the upper surface of the bottom Si plate after electrolysis for 137
10 min using SiO2 granules of different size ranges, as well as that of a blank test with no SiO2 138
granules. In the case of the blank test [Figure 3(e)], the surface was essentially smooth and integrated. 139
When using SiO2 granules less than 0.1 mm in size [Figure 3(a)], some parts of the surface were 140
broken, and a large amount of reduced Si, which appears brown in the figure, was attached to the 141
surface. This result indicates that the reduced Si and the bottom Si plate were in close contact with 142
each other during electrolysis. The broken surface was caused by disassembling the Si plate from the 143
post-electrolysis electrode. Since the crystallization rate for amorphous Si increases with increasing 144
temperature and reaches 1 μm s-1
at 1123 K (850 °C),[85]
the reduced Si, which was amorphous 145
immediately after its formation, might have rapidly crystallized and sintered to have the same 146
orientation as the bottom Si plate. In the case of SiO2 granules 1.0–2.0 mm in size [Figure 3(d)], only 147
a small amount of reduced Si was found on the surface. In Figures 3(a)–(d), it can be noticed that the 148
quantity of attached Si and broken areas are decreasing and the surface becomes more integrated 149
with increasing SiO2 granule size. This trend indicates that the contact of SiO2 granules with the 150
bottom Si plate was improved by decreasing the granule size. 151
*********** Figure 3 *********** 152
B. Growth of the Reduced Si Layer 153
Figure 4 shows the cross sections of the working electrodes using SiO2 granules with different 154

10
size ranges after electrolysis for (I) 20 min and (II) 60 min at 0.5 V vs. Ca2+
/Ca in molten CaCl2 at 155
1123 K (850 °C). For each sample, a dark brown layer is observed above the Si plate at the bottom. 156
Formation of crystalline Si in this layer was confirmed by X-ray diffraction (XRD) and scanning 157
electron microscopy/energy dispersive X-ray spectroscopy (SEM/EDX). A downward shift of 158
unreduced SiO2 granules was not observed in Figure 4, indicating that the granules piled on the Si 159
plate as a whole did not apparently shrink downward after reduction. The thickness of the dark layer 160
at three positions in each cross section was measured using a ruler. The average thicknesses of the 161
reduced layers are plotted against electrolysis time in Figure 5. The increased thickness from 20 min 162
to 100 min indicates the propagation of the reduction from the bottom of the SiO2 layer to the top. 163
Faster growth of the reduced layer was observed for the smaller granules, indicating a larger 164
reduction rate. 165
*********** Figure 4 *********** 166
*********** Figure 5 *********** 167
C. Behavior of the Current 168
Figure 6 shows typical current transient curves during electrolysis for 20 min using SiO2 granules 169
in the various size ranges. The current was larger at the beginning, and it gradually decreased as the 170
electrolysis progressed. A larger current was observed for the smaller granules, indicating a faster 171
reduction rate. Figure 6(e) shows the current of a blank electrolysis test for 10 min using the same 172

11
working electrode without a charge of SiO2 granules. The detected background current is probably 173
due to the side electrochemical reactions of the residual moisture in the molten salt. In this study, the 174
background current was assumed to be independent of the electrolysis time and charge of SiO2 175
granules. The effective current corresponding to SiO2 reduction was considered to be the difference 176
between the measured current and the background current, as indicated in Figure 6. 177
*********** Figure 6 *********** 178
179
IV. DISCUSSION 180
A. Effect of Granule Size on Contact Resistance 181
Figure 3 shows that contact between the SiO2 granules and the bottom Si plate can be improved 182
by decreasing the granule size. Such a difference is schematically illustrated in Figure 7. Assuming 183
the granules are perfectly spherical in shape, the number of contact points equals the number of 184
granules in direct contact with the Si plate ( ), which can be calculated by 185
(2) 186
where Aplate is the geometrical area of the Si plate and r0 is the granule radius. Apparently, small 187
granules guarantee a larger number of contact points and thus a greater total contact area as 188
compared with the large granules. 189
*********** Figure 7 *********** 190

12
As reduction proceeds along the granule surface and from the granule surface to the core, the 191
reduction front gradually moves away from the initial point and spreads along the unreduced part of 192
the SiO2 granule.[71]
The effective potential at the reduction front is determined by the contact 193
resistance between the bottom Si plate and the reduced part of the SiO2 granules.[73]
Because the 194
reduction kinetics is favored at more negative potentials,[61]
the usage of small granules guarantees a 195
lower potential drop, thus improving the reduction kinetics. 196
B. Reaction Model for the Reduction during Electrolysis 197
Figure 8 illustrates the reduction of the SiO2 granules piled on the Si plate based on our previous 198
study.[71]
A reaction model is proposed to explain the reduction at three stages of electrolysis with 199
the following assumptions: the SiO2 granules are perfectly spherical in shape; the effective area for 200
each contact point between SiO2 granule and Si plate is the same and independent of granule size; 201
the granules never expand or shrink during electrolysis; the Si shell formed at the beginning of 202
electrolysis is of an infinitesimal thickness that remains constant over short time periods; the 203
diffusion coefficients of O2-
ions in CaCl2 at the granule surface and inside the granule are 204
independent of granule size; partly reduced granules after electrolysis for large time t have an 205
identical geometry; and the concentration of O2-
ions changes linearly in CaCl2 in the crevices of the 206
Si shells from inside to outside. 207
*********** Figure 8 *********** 208

13
At the start of the electrolysis (infinitesimal time t), reduction occurs at the contact points between 209
SiO2 granules and the Si plate, as shown in Figure 8(a). Since diffusion of O2-
ions in CaCl2 is the 210
rate-determining step for the reduction, from Fick’s first law of diffusion, the reduction rate at this 211
moment ( ) can be described by 212
-
-
-
(3) 213
Where - is the formation rate of O
2- ions at the start of the electrolysis, is the effective area 214
for each contact point, and and
-
are the diffusion coefficient and concentration 215
gradient of O2-
ions in CaCl2 at the granule surface, respectively. Since is constant and , 216
, and
-
are considered to be independent of granule size, Eq. [3] indicates that the 217
reduction rate at the start of electrolysis decreases with increasing granule radius. 218
With increasing t, reduction proceeds upward along the granule surface and from surface to core 219
with the formation of a Si shell, as shown in Figure 8(b-1). The overall reduction rate ( ) can 220
be expressed as 221
(4) 222
where
and are the reduction rate along the surface and from the surface to the core, 223
respectively. Since the reduction from the surface to the core is much slower than the reduction 224
along the surface after electrolysis of small time t, only the latter is considered. As illustrated in 225
Figure 8(b-2), the Si shell with a thickness of and the center of the granule form a spherical sector 226

14
ACD, the cone angle of which is 2
. The area of the reduction interface
can 227
be calculated as the difference of the lateral area between the spherical sectors ACD and ABE. 228
(5) 229
The reduction rate at small t can be described as 230
-
-
(6) 231
where - is the formation rate of O
2- ions after electrolysis of small time t. Since the volume 232
difference between the spherical sectors ACD and ABE is regarded as the volume of the reduced 233
part of a single SiO2 granule (
), given as 234
(7) 235
the reduction rate can also be calculated by 236
(8) 237
where is the number of moles of the reduced Si, and
are the density and molar weight of 238
SiO2, respectively. Combining Eqs. [6] and [8] gives 239
-
-
(9) 240
The solution of Eq. [9] with the boundary condition = 0 when t = 0 gives 241
-
(10) 242
The substitution of Eq. [10] into Eq. [6] gives 243

15
-
-
(11) 244
Equation [11] clearly indicates that reduction rate after electrolysis of small time t decreases with 245
increasing granule radius. It is also understood from Eq. [11] that the reduction rate at the beginning 246
of electrolysis would increase with increasing time t. Even though this tendency is not clearly 247
observed in the current experiments because the amount of SiO2 granules is too small (0.13 g), it was 248
presented in previous experiments on a larger scale (more than 10 g of SiO2 granules).[69]
249
After electrolysis of large time t, a core (SiO2)–shell (Si) structure forms for all granules, as shown 250
in Figure 8(c-1). At this moment, the whole granule surface is reduced, and thus only the reduction 251
from the surface to the core continues. The reaction interface is the surface of the unreacted SiO2 252
core. The reduction rate (
) can be calculated as 253
-
-
(12) 254
where -
is the formation rate of O
2- ions after electrolysis of large time t, ri is the radius of the 255
unreduced SiO2 core as shown in Figure 8(c-2), NII is the number of granules reduced after large 256
time t, and Dins. and
-
are the diffusion coefficient and concentration gradient of O2-
ions in 257
CaCl2 in the crevices of the porous Si shells, respectively. Assuming a linear concentration gradient 258
of O2-
ions,
-
, where C0 and Ci are the concentrations of O
2- ions at the outer and 259
inner surfaces of the Si shell, respectively, Eq. [12] becomes 260

16
(13) 261
Since the volume of the reduced part of a single SiO2 granule (
) can be calculated as 262
(14) 263
the reduction rate can also be described by 264
(15) 265
Combining Eqs. [13] and [15] yields 266
(16) 267
Assuming , C0, and Ci are independent of time, the solution of Eq. [16] with the boundary 268
condition when t = 0 gives 269
(17) 270
Since the granule number can be described as 271
(18) 272
where is the total weight of SiO2, the substitution of Eqs. [17] and [18] into Eq. [13] yields 273
(19) 274
Equation [19] is a monotonically decreasing function of r0, which indicates that the reduction rate at 275
an electrolysis time of large t decreases with increasing granule radius. Moreover, the reduction rate 276
also decreases with increasing electrolysis time. These tendencies are in accordance with the 277
experimental results shown in Figure 6. 278

17
C. Apparent Current Density 279
Based on the current transient curves during electrolysis (Figure 6), the apparent current density 280
was evaluated. In the case of the blank test without charging with SiO2 granules, only the current 281
(Iblank) contributed by the side electrochemical reactions (Iside) is obtained 282
(20) 283
For the electrolysis after charging with SiO2 granules, the overall current (Iall) is the result of both the 284
SiO2 reduction ( ) and the side reactions. 285
(21) 286
Assuming the current corresponding to side reactions is independent of the electrolysis time and 287
charge of SiO2 granules, the apparent current density corresponding to SiO2 reduction ( ) can be 288
calculated by 289
(22) 290
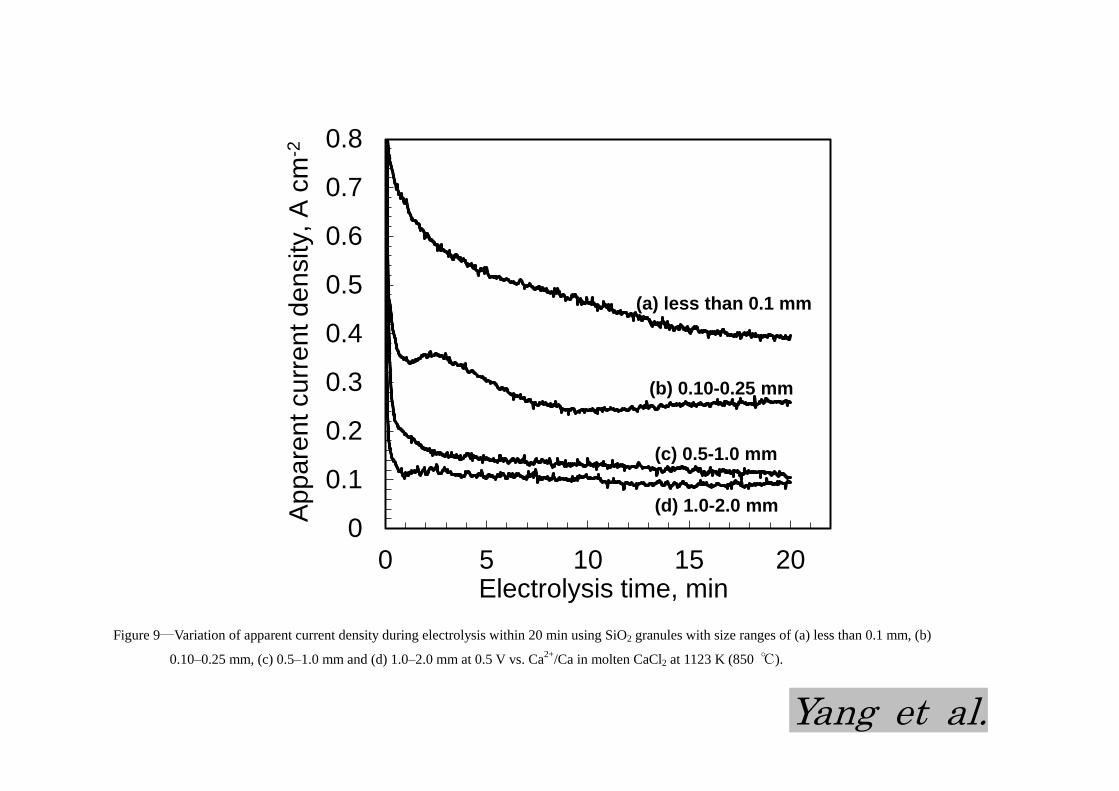
Using the data in Figure 6 and taking , the apparent current densities during 291
electrolysis for 20 min using SiO2 granules with various size ranges were calculated and the results 292
are shown in Figure 9. It is clear that the current density gradually decreases with increasing 293
electrolysis time and that smaller SiO2 granules results in a larger current density. In the case of 294
using SiO2 granules less than 0.1 mm in size, electrolysis within 20 min maintained a current density 295
of no less than 0.4 A cm-2
. This result basically agrees with those of a previous study, in which the 296

18
current density was obtained by calculating from the weight change of the sample before and after 297
electrolysis.[70]
These results indicate that the productivity would be improved by using fine SiO2 298
granules as the raw materials for a new SOG-Si production process in the future. 299
*********** Figure 9 *********** 300
301
IV. CONCLUSIONS 302
The effect of granule size on the kinetics of electrochemical reduction of SiO2 granules in molten 303
CaCl2 at 1123 K (850 °C) was clarified. Fine SiO2 granules are favorable for a high reduction rate by 304
lowering the contact potential drop between the bottom Si plate and the reduced Si. The use of fine 305
granules also improves the diffusion of O2-
ions in CaCl2 inside the porous Si shell formed on the 306
SiO2 core. The electrolysis using SiO2 granules less than 0.1 mm in size maintained a current density 307
of no less than 0.4 A cm-2
within 20 min, indicating that electrochemical reduction of fine SiO2 308
granules in molten CaCl2 has the potential to become a high-yield solar-grade silicon production 309
process. 310
ACKNOWLEDGMENTS 311
This study was partly supported by Core Research for Evolutionary Science and Technology 312

19
(CREST), Japan Science and Technology Agency (JST) and Grants-in-Aid for Scientific Research A 313
from the Japan Society for the Promotion of Science (JSPS). 314
315
316
NOMENCLATURE 317
Acont.
Aplate
Ci
C0
Dins.
Dsurf.
NI
NII
-
r0
ri
t
Effective area for each contact point between SiO2 granules and the Si plate
Geometrical area of the bottom Si plate
Area of the reduction interface after electrolysis of small time t
Concentration of O2-
ions at the inner surface of the Si shell of the partly reduced
SiO2 granules after electrolysis of large time t Concentration of O
2- ions at the outer surface of the Si shell of the partly reduced
SiO2 granules after electrolysis of large time t Diffusion coefficient of O
2- ions in CaCl2 in the crevice of the porous Si shell of the
partly reduced SiO2 granules after electrolysis of large time t
Diffusion coefficient of O2-
ions in CaCl2 at the SiO2 granule surface
Concentration gradient of O2-
ions in CaCl2 in the crevice of the porous Si shell of
the partly reduced SiO2 granules after electrolysis of large time t Concentration gradient of O
2- ions in CaCl2 at the SiO2 granule surface
Current obtained in the case of a test with charging SiO2
Current obtained in the case of a blank test without charging SiO2
Current contributed by the side electrochemical reactions
Current contributed by SiO2 reduction
Apparent current density corresponding to SiO2 reduction
Molar weight of SiO2
Number of SiO2 granules directly neighboring the Si plate
Total number of SiO2 granules
Number of moles of the reduced Si
Reduction rate of SiO2 granules at the start moment of the electrolysis
Overall reduction rate of SiO2 granules
Reduction rate of SiO2 granules along surface
Reduction rate of SiO2 granules from surface to core
Reduction rate of SiO2 granules after electrolysis of small time t Reduction rate of SiO2 granules after electrolysis of large time t
Formation rate of O2-
ions at the start moment of the electrolysis
Formation rate of O2-
ions after electrolysis of small time t Formation rate of O
2- ions after electrolysis of large time t
Radius of the SiO2 granule in Figure 8(b-2)
Radius of the unreduced core of the partly reduced SiO2 granule in Figure 8(c-2)
Electrolysis time
Volume of the reduced part of a SiO2 granule after electrolysis of small time t Volume of the reduced part of a SiO2 granule after electrolysis of large time t
Total weight of SiO2 granules
Thickness of the reduced Si shell after electrolysis of small time t in Figure 8(b-2)

20
Half of the cone angle of the spherical sector ACD in Figure 8(b-2)
Density of SiO2
318
319
320
321
REFERENCES 322
1. European Photovoltaic Industry Association: Market Report 2013, European Photovoltaic 323
Industry Association, Brussels, March, 2014. 324
2. Observ’ER: Fifteenth Inventory 2013 Edition–Worldwide Electricity Production from 325
Renewable Energy Sources, Observ’ER, Paris, June, 2013. 326
3. German Advisory Council on Global Change: World in Transition–Towards Sustainable 327
Energy Systems, Earthscan, London, 2003. 328
4. Arumu Publishing Co.: Rare Metal News, Arumu Publishing Co., Tokyo, August, 2014. 329
5. Arumu Publishing Co.: Rare Metal News, Arumu Publishing Co., Tokyo, April, 2014. 330
6. H. Schweickert, K. Reuschel, and H. Gutsche: U.S. patent, US3,011,877, 1961. 331
7. H. Gutsche: U.S. patent, US3,042,494, 1962. 332
8. G. Bye and B. Ceccaroli: Sol. Energy Mater. Sol. Cells, 2014, vol. 130, pp.634-46. 333
9. H. W. Ling: U.S. Patent, US3,012,861, 1961. 334
10. L. Bertrand, N. Star, and C. M. Olson: U.S. Patent, US3,012,862, 1961. 335

21
11. K. Morita and T. Miki: Intermetallics, 2003, vol. 11, pp. 1111–17. 336
12. V. Hoffmann, K. Petter, J. Djordjevic-Reiss, E. Enebakk, J. T. Håkedal, R. Tronstad, T. 337
Vlasenko, I. Buchovskaja, S. Beringov, and M. Bauer: Proc. 23rd EU PVSEC, Valencia, Spain, 338
1-5 Sept. 2008, pp. 1117–20. 339
13. Y. V. Meteleva-Fischer, Y. Yang, R. Boom, B. Kraaijveld and H. Kuntzel: JOM, 2012, vol. 64, 340
pp. 957–967. 341
14. IHS Technology: PV Manufacturing Technology Report - 2014, IHS Technology, El Segundo 342
Feb., 2014. 343
15. S. Wakamatsu and H. Oda: PCT International Patent, WO2001/085613, 2001. 344
16. A. Søiland, M. G. Dolmen, J. Heide, U. Thisted, G. Halvorsen, G. Ausland, K. Friestad, P. 345
Preis, K. Peter, O. Graf, T. Bartel, and R. Tronstad: Sol. Energy Mater. Sol. Cells, 2014, vol. 346
130, pp. 661-67. 347
17. K. Yasuda, K. Morita, and T. H. Okabe: Energy Technology, 2014, vol. 2, pp. 141–54. 348
18. W. O. Filtvedt, M. Javidi, A. Holt, M. C. Melaaen, E. Marstein, H. Tathgar, and P. A. 349
Ramachandran: Sol. Energy Mater. Sol. Cells, 2010, vol. 94, pp. 1980–95. 350
19. B. G. Gribov and K. V. Zinov'ev: Inorg. Mater., 2003, vol. 39, pp. 653–62. 351
20. H. Oda: Kogyo Zairyo, 2007, vol. 55, pp. 30–34. 352
21. A. F. B. Braga, S. P. Moreira, P. R. Zampieri, J. M. G. Bacchin, and P. R. Mei: Sol. Energy 353

22
Mater. Sol. Cells, 2008, vol. 92, pp. 418–24. 354
22. M. D. Johnston, L. T. Khajavi, M. Li, S. Sokhanvaran, and M. Barati, JOM, 2012, vol. 64, pp. 355
935–45. 356
23. Y. Sakaguchi, M. Ishizaki, T. Kawahara, M. Fukai, M. Yoshiyagawa, and F. Aratani, ISIJ Int., 357
1992, vol. 32, pp. 643–49. 358
24. K. Suzuki, T. Kumagai, and N. Sano: ISIJ Int., 1992, vol. 32, pp. 630–34. 359
25. T. Ikeda and M. Maeda: ISIJ Int., 1992, vol. 32, pp. 635–42. 360
26. J. C. S. Pires, J. Otubo, A. F. B. Braga, and P. R. Mei: J. Mater. Processing Tech. 2005, vol. 361
169, pp. 16–20. 362
27. J. L. Gumaste, B. C. Mohanty, R. K. Galgali, U. Syamaprasad, B. Nayak, S. K. Singh, and P. K. 363
Jena: Sol. Energy Mater., 1987, vol. 16, pp. 289–96. 364
28. T. Yoshikawa and K. Morita: JOM, 2012, vol. 64, pp. 946–51. 365
29. I. C. Santos, A. P. Goncalves, C. S. Santos, M. Almeida, M. H. Afonso, and M. J. Cruz: 366
Hydrometallurgy, 1990, vol. 23, pp. 237–246. 367
30. Y. Sun, Q. Ye, C. Guo, H. Chen, X. Lang, F. David, Q. Luo, and C. Yang: Hydrometallurgy, 368
2013, vol. 139, pp. 64–72. 369
31. J. Safarian and M. Tangstad: Metall. Mater. Trans. B, 2012, vol. 43, pp. 1427–45. 370
32. M. A. Martorano, J. B. F. Neto, T. S. Oliveira, and T. O. Tsubaki: Mater. Sci. Eng. B, 2011, vol. 371

23
176, pp. 217–26. 372
33. S. Honda, M. Yasueda, S. Hayashida, and M. Yamaguchi: Japanese Patent Application, 373
JP2007145663, 2007. 374
34. K. Saegusa and T. Yamabayashi: PCT International Patent WO2007/001093, 2007. 375
35. K. Yasuda and T. H. Okabe: JOM, 2010, vol. 62, pp 94–101. 376
36. K. Yasuda, K. Saegusa, and T. H. Okabe: Metall. Mater. Trans. B, 2011, vol. 42, pp. 37–49. 377
37. E. Robert and T. Zijlema: PCT International Patent WO2006/100114, 2006. 378
38. C. Rosenkilde: PCT International Patent WO2008/120994, 2008. 379
39. H. Tezuka: PCT International Patent WO2008/153181, 2008. 380
40. K. Saito, H. Munakata, and T. Mizoguchi: PCT International Patent WO2011/071030, 2011. 381
41. R. Monnier, D. Barakat, and J. Giacometti: U.S. Patent, US3,254,010, 1966. 382
42. J. Olson and K. Carleton: J. Electrochem. Soc., 1981, vol. 128, pp. 2698–99. 383
43. J. Cai, X. Luo, G. M. Haarberg, O. E. Kongstein, and S. Wang: J. Electrochem. Soc., 2012, vol. 384
159, pp. D155–58. 385
44. D. Elwell and R. S. Feigelson: Sol. Energy Mater., 1982, vol. 6, pp. 123–45. 386
45. D. Elwell and G. M. Rao: J. Appl. Electrochem., 1988, vol. 18, pp. 15–22. 387
46. T. Oishi, M. Watanabe, K. Koyama, M. Tanaka, and K. Saegusa: J. Electrochem. Soc., 2011, 388
vol. 158, pp. E93–99. 389

24
47. J. Xu and G. M. Haarberg: High Temperature Materials and Processes, 2013, vol. 32, pp. 97–390
105. 391
48. Y. Jiang, J. Xu, X. Guan, U.B. Pal, and S.N. Basu: MRS Proceedings, 2013, vol. 1493, pp. 231–392
35. 393
49. G. Z. Chen, D. J. Fray, and T. W. Farthing: Nat., 2000, vol. 407, pp. 361-64. 394
50. X. Y. Yan and D. J. Fray: Metall. Mater. Trans. B, 2002, vol. 33, pp. 685–93. 395
51. G. Z. Chen, E. Gordo, and D. J. Fray: Metall. Mater. Trans. B, 2004, vol. 35, pp. 223–33. 396
52. K. S. Mohandas and D. J. Fray: Metall. Mater. Trans. B, 2009, vol. 40, pp. 685–99. 397
53. X. Y. Yan and D. J. Fray: J. Appl. Electrochem., 2009, vol. 39, pp. 1349–60. 398
54. Q. Song, Q. Xu, X. Kang, J. Du, and Z. Xi: J. Alloy. Compd., 2010, vol. 490, pp. 241–46. 399
55. M. Erdoğan and I. Karakaya: Metall. Mater. Trans. B, 2010, vol. 41, pp. 798–804. 400
56. A. M. Abdelkader and D. J. Fray: Electrochim. Acta, 2012, vol. 64, pp. 10-16. 401
57. W. Xiao and D. Wang: Chem. Soc. Rev., 2014, vol. 43, pp. 3215-28. 402
58. T. Nohira, K. Yasuda, and Y. Ito: Nat. Mater., 2003, vol. 2, pp. 397–401. 403
59. K. Yasuda, T. Nohira, K. Amezawa, Y. H. Ogata, and Y. Ito: J. Electrochem. Soc., 2005, vol. 404
152, pp. D69–74. 405
60. K. Yasuda, T. Nohira, Y. H. Ogata, and Y. Ito: Electrochim. Acta, 2005, vol. 51, pp. 561–65. 406
61. K. Yasuda, T. Nohira, and Y. Ito: J. Phys. Chem. Solids, 2005, vol. 66, pp. 443–47. 407

25
62. K. Yasuda, T. Nohira, Y. H. Ogata, and Y. Ito: J. Electrochem. Soc., 2005, vol. 152, pp. D208–408
12. 409
63. K. Yasuda, T. Nohira, R. Hagiwara, and Y. H. Ogata: J. Electrochem. Soc., 2007, vol. 154, pp. 410
E95–E101. 411
64. K. Yasuda, T. Nohira, R. Hagiwara, and Y. H. Ogata: Electrochim. Acta,. 2007, vol. 53, pp. 412
106–10. 413
65. K. Yasuda, T. Nohira, K. Takahashi, R. Hagiwara, and Y. H. Ogata: J. Electrochem. Soc., 2005, 414
vol. 152, pp. D232–37. 415
66. Y. Nishimura, T. Nohira, K. Yasuda, Y. Fukunaka, and R. Hagiwara: Trans. Mater. Res. Soc. 416
Jpn., 2010, vol. 35, pp. 47-49. 417
67. Y. Nishimura, T. Nohira, K. Kobayashi, and R. Hagiwara: J. Electrochem. Soc., 2011, vol.158, 418
pp. E55–59. 419
68. K. Yasuda, T. Nohira, K. Kobayashi, N. Kani, T. Tsuda, and R. Hagiwara: Energy Technology, 420
2013, vol. 1, pp. 245–52. 421
69. T. Toba, K. Yasuda, T. Nohira, X. Yang, R. Hagiwara, K. Ichitsubo, K. Masuda, and T. 422
Homma: Electrochemistry, 2013, vol. 81, pp. 559–65. 423
70. X. Yang, K. Yasuda, T. Nohira, R. Hagiwara, and T. Homma: J. Electrochem. Soc., 2014, vol. 424
161, pp. D3116–19. 425

26
71. X. Yang, K. Yasuda, T. Nohira, R. Hagiwara, and T. Homma: Metall. Mater. Trans. B, 2014, 426
vol. 45, pp. 1337-44. 427
72. X. Jin, P. Gao, D. Wang, X. Hu, and G. Z. Chen: Angew. Chem., 2004, vol. 116, pp. 751–54. 428
73. W. Xiao, X. Jin, Y. Deng, D. Wang, X. Hu, and G. Z. Chen: ChemPhysChem., 2006, vol. 7, pp. 429
1750–58. 430
74. W. Xiao, X. Jin, Y. Deng, D. Wang, X. Hu, and G. Z. Chen: J. Electroanal. Chem., 2010, vol. 431
639, pp. 130–40. 432
75. W. Xiao, X. Jin, and G. Z. Chen: J. Mater. Chem. A., 2013, vol. 1, pp. 10243–50. 433
76. W. Xiao, X. Wang, H. Yin, H. Zhu, X. Mao, and D. Wang: RSC Advances, 2012, vol. 2, pp. 434
7588–93. 435
77. P. C. Pistorius and D. J. Fray: J. S. Afr. Inst. Min. Metall., 2006, vol. 106, pp. 31–41. 436
78. S. Lee, J. Hur, and C. Seo: J. Ind. Eng. Chem., 2008, vol. 14, pp. 651–54. 437
79. E. Juzeliunas, A. Cox, and D. J. Fray: Electrochem. Comm., 2010, vol. 12, pp. 1270–74. 438
80. E. Ergül, İ. Karakaya, and M. Erdoğan: J. Alloy. Compd., 2011, vol. 509, pp. 899–903. 439
81. S. K. Cho, F. F. Fan, and A. J. Bard: Electrochim. Acta, 2012, vol. 65, pp. 57–63. 440
82. J. Zhao, S. Lu, L. Hu, and C. Li: J. Energy Chem., 2013, vol. 22, pp. 819-25. 441
83. J. Zhao, J. Li, P. Ying, W. Zhang, L. Meng, and C. Li: ChemCom., 2013, vol. 49, pp. 4477-79. 442
84. H. Nishihara, T. Suzuki, H. Itoi, B. An, S. Iwamura, R. Berenguer, and T. Kyotani: Nanoscale, 443

27
2014, vol. 6, pp. 10574-83. 444
85. G. Olson and J. Roth: Mater. Sci. Rep., 1988, vol. 3, pp. 1-77. 445
446

28
Caption list 447
Figure 1―Appearances of the SiO2 granules with size ranges of (a) less than 0.1 mm, (b) 0.10–0.25 448
mm, (c) 0.5–1.0 mm and (d) 1.0–2.0 mm. 449
Figure 2―A schematic of (a) the electrolysis cell and (b) the working electrode. 450
Figure 3―Appearances of the upper surface of the bottom Si plate after electrolysis using SiO2 451
granules with size ranges of (a) less than 0.1 mm, (b) 0.10–0.25 mm, (c) 0.5–1.0 mm, (d) 452
1.0–2.0 mm for 10 min and (e) a blank electrolysis test for 10 min at 0.5 V vs. Ca2+
/Ca in 453
molten CaCl2 at 1123 K (850 °C). 454
Figure 4―Cross sections of the working electrodes using SiO2 granules with size ranges of (a) less 455
than 0.1 mm, (b) 0.10–0.25 mm, (c) 0.5–1.0 mm and (d) 1.0–2.0 mm after electrolysis for 456
(I) 20 min and (II) 60 min at 0.5 V vs. Ca2+
/Ca in molten CaCl2 at 1123 K (850 °C). 457
Figure 5―Thickness of the reduced layers after electrolysis for 20, 60 and 100 min using SiO2 458
granules with different size ranges at 0.5 V vs. Ca2+
/Ca in molten CaCl2 at 1123 K 459
(850 °C). 460
Figure 6―Current transient curves during electrolysis using SiO2 granules with size ranges of (a) 461
less than 0.1 mm, (b) 0.10–0.25 mm, (c) 0.5–1.0 mm and (d) 1.0–2.0 mm for 20 min and 462
(e) during a blank electrolysis test for 10 min at 0.5 V vs. Ca2+
/Ca in molten CaCl2 at 1123 463
K (850 °C). 464
Figure 7―Schematics of the contact between SiO2 granules and the bottom current collector (Si 465
plate). 466
Figure 8―Schematics of the reduction of the SiO2 granules during electrolysis. 467
Figure 9―Variation of apparent current density during electrolysis within 20 min using SiO2 468
granules with size ranges of (a) less than 0.1 mm, (b) 0.10–0.25 mm, (c) 0.5–1.0 mm and 469
(d) 1.0–2.0 mm at 0.5 V vs. Ca2+
/Ca in molten CaCl2 at 1123 K (850 °C). 470

Yang et al.
Figure 1―Appearances of the SiO2 granules with size ranges of (a) less than 0.1 mm, (b) 0.10–0.25 mm, (c) 0.5–1.0 mm and (d) 1.0–2.0 mm.
5 mm
(a) Less than 0.1 mm (b) 0.10-0.25 mm
(c) 0.5-1.0 mm (d) 1.0-2.0 mm

Yang et al.
Figure 2―A schematic of (a) the electrolysis cell and (b) the working electrode.
Ar
CE(Glassy
carbon)
WE
CaCl2(l)
Ar
SiO2 vessel Al2O3 crucible
RE(Ag+/Ag) Mo
Ni wire
Si plate
SiO2 granules
Al2O3
tube
(a) Electrolysis cell (b) Working electrode
Yang et al.
Figure 3―Appearances of the upper surface of the bottom Si plate after electrolysis using SiO2 granules with size ranges of (a) less than 0.1 mm, (b)
0.10–0.25 mm, (c) 0.5–1.0 mm, (d) 1.0–2.0 mm for 10 min and (e) a blank electrolysis test for 10 min at 0.5 V vs. Ca2+
/Ca in molten CaCl2 at
1123 K (850 ℃).
Broken surface
of the Si plate
5 mm
Reduced Si
(a) Less than 0.1 mm (b) 0.10-0.25 mm (c) 0.5-1.0 mm (d) 1.0-2.0 mm (e) Blank test
Reduced Si

Yang et al.
Figure 4―Cross sections of the working electrodes using SiO2 granules with size ranges of (a) less than 0.1 mm, (b) 0.10–0.25 mm, (c) 0.5–1.0 mm and (d)
1.0–2.0 mm after electrolysis for (I) 20 min and (II) 60 min at 0.5 V vs. Ca2+
/Ca in molten CaCl2 at 1123 K (850 ℃).
5 mm
(a) Less than 0.1 mm (b) 0.10-0.25 mm (c) 0.5-1.0 mm (d) 1.0-2.0 mm
Reduced
Si plate
(II) Electrolysis for 60 min
(I) Electrolysis for 20 min
SiO2

Yang et al.
Figure 5―Thickness of the reduced layers after electrolysis for 20, 60 and 100 min using SiO2 granules with different size ranges at 0.5 V vs. Ca2+
/Ca in
molten CaCl2 at 1123 K (850 ℃).
0
2
4
6
8
10
20 60 100
less than 0.1
0.10-0.25
0.5-1.0
1.0-2.0
Electrolysis time, min
Thic
kne
ss o
f th
e r
edu
ced
laye
r,m
m
Granule size range, mm

Yang et al.
Figure 6―Current transient curves during electrolysis using SiO2 granules with size ranges of (a) less than 0.1 mm, (b) 0.10–0.25 mm, (c) 0.5–1.0 mm and
(d) 1.0–2.0 mm for 20 min and (e) during a blank electrolysis test for 10 min at 0.5 V vs. Ca2+
/Ca in molten CaCl2 at 1123 K (850 ℃).
-200
-150
-100
-50
0
0 5 10 15 20Electrolysis time, min
Cu
rre
nt,
mA
(a) less than 0.1 mm
(b) 0.10-0.25 mm
(c) 0.5-1.0 mm
(d) 1.0-2.0 mm
(e) blank test
Background
current
Reduction
current
Geometrical area of the bottom Si plate: 0.2 cm2

Yang et al.
Figure 7―Schematics of the contact between SiO2 granules and the bottom current collector (Si plate).
(a) Small granules
Current collector
Contact
point
Current collector
Contact
point
SiO2
SiO2
(b) Large granules

Yang et al.
Figure 8―Schematics of the reduction of the SiO2 granules during electrolysis.
(a) t 0
Contact point
Current collector
SiO2
Current collector
A
B
D
E
SiO2
Si
r0ri
Ci
C0
Current collector
(b-1) small t
(c-1) large t
r0
Porous Si shell
Core-shell structure
SiO2
C
(b-2)
(c-2)
Yang et al.
Figure 9―Variation of apparent current density during electrolysis within 20 min using SiO2 granules with size ranges of (a) less than 0.1 mm, (b)
0.10–0.25 mm, (c) 0.5–1.0 mm and (d) 1.0–2.0 mm at 0.5 V vs. Ca2+
/Ca in molten CaCl2 at 1123 K (850 ℃).
0
0.1
0.2
0.3
0.4
0.5
0.6
0.7
0.8
0 5 10 15 20Electrolysis time, min
Ap
pa
ren
t cu
rre
nt d
en
sity,A
cm
-2(a) less than 0.1 mm
(b) 0.10-0.25 mm
(c) 0.5-1.0 mm
(d) 1.0-2.0 mm


