
i
UNIVERSITY OF KWAZULU-NATAL
Title Page
THE LINK BETWEEN KEY PERFORMANCE AREAS AND ORGANISATIONAL STRATEGY
By Laurette Naidu
9301461
A dissertation submitted in partial fulfilment of the requirements for the degree of
Master of Business Administration
Graduate School of Business and Leadership College of Law and Management Studies
Supervisor: Prof. Anesh Maniraj Singh
2011

ii
DECLARATION
I, Laurette Naidu, declare that
(i) The research reported in this dissertation/thesis, except where otherwise indicated, is my original research.
(ii) This dissertation/thesis has not been submitted for any degree or examination at any other
university.
(iii) This dissertation/thesis does not contain other persons’ data, pictures, graphs or other information, unless specifically acknowledged as being sourced from other persons.
(iv) This dissertation/thesis does not contain other persons’ writing, unless specifically
acknowledged as being sourced from other researchers. Where other written sources have been quoted, then:
a) their words have been re-written but the general information attributed to
them has been referenced: b) where their exact words have been used, their writing has been placed
inside quotation marks, and referenced.
(v) This dissertation/thesis does not contain text, graphics or tables copied and pasted from the Internet, unless specifically acknowledged, and the source being detailed in the dissertation/thesis and in the References sections.
Signature:

iii
Acknowledgements
I wish to express my sincere appreciation and gratitude to the following individuals,
without whose assistance, this study would not have been possible:
My husband Clive and daughter Kaitlyn Leah for their support, patience, assistance and encouragement
My supervisor for his support and guidance
Every respondent for taking the time to participate in this research study
My employer and colleagues for motivation and encouragement

iv
Abstract
In the global market, the lines between pioneers and followers are immensely blurred,
industries are fraught with intense competition and products versus price have since
lost the competitive edge. These trends have made it difficult for organisations to
meet their strategic goals and have made it necessary for organisations to revisit their
strategies far more regularly than in the past. In this economic era, people have
become the focal point of differentiation – organisations have come to realise that it is
the calibre of people employed that will assist in the efficient realisation of long and
short term strategies. Accordingly, organisations have spent exorbitant amounts of
money investing in performance management systems that promise to utilise the
organisations human capital to the maximum in order that the strategic goals of an
organisation are met. The aim of the study is to investigate the link between key
performance areas and organisational strategy, to evaluate whether performance
management systems are utilised as optimally as it should be to create competitive
edge in changing market conditions. The sample comprised 155 respondents, of
which 51 were valid responses. The research study showed that South African
organisations, more specifically in KZN, make use of performance management
systems to implement the corporate strategy. Some of the responses indicate that
these performance management systems are not correctly implemented and the
measurement of key performance areas is a mere formality in certain organisations
as opposed to a sincere measurement of whether employees are meeting the
objectives of the workplace. It has also been found that the strategy of the
organisations remains at top of the hierarchy and does not filter down to the base.
Based on these findings it is recommended that managers redress their view of
performance management systems and key performance areas to ensure successful
strategy implementation and execution.

v
Table of Contents
Title Page ................................................................................................................... i Acknowledgements .................................................................................................. iii Abstract .................................................................................................................... iv Table of Contents ...................................................................................................... v List of Figures ......................................................................................................... viii List of Tables ............................................................................................................ ix CHAPTER ONE ....................................................................................................... 1 Introduction to Research .......................................................................................... 1 1.1 Introduction..................................................................................................... 1 1.2 Motivation for the Study .................................................................................. 1 1.3 Focus of the Study ......................................................................................... 2 1.4 Problem Statement ......................................................................................... 4 1.5 Objectives....................................................................................................... 5 1.6 Research Questions ....................................................................................... 6 1.7 Limitations of the Study .................................................................................. 7 1.8 Chapter Structure ........................................................................................... 7 1.9 Summary ........................................................................................................ 8 CHAPTER TWO ....................................................................................................... 9 The Literature on Performance Management ........................................................... 9 2.1 Introduction..................................................................................................... 9 2.2 A few definitions ............................................................................................. 9 2.3 The Company Strategy ................................................................................ 11 2.4 Human Resources Strategy ......................................................................... 13 2.4.1 How can HR Strategy add value to an organisation? ................................... 14 2.5 Performance Management and Key Performance Areas ............................. 16 2.6 An organisational model of Performance Management ................................ 26 2.7 Vision & Strategy .......................................................................................... 28 2.8 Summary ...................................................................................................... 30 CHAPTER THREE ................................................................................................. 31 Research Methodology........................................................................................... 31 3.1 Introduction................................................................................................... 31
vi
3.2 What is Research? ....................................................................................... 31 3.3 Types of Research ....................................................................................... 32 3.3.1 Qualitative Research .................................................................................... 32 3.3.1.1 The qualitative research process .............................................................. 34 3.3.1.2 Qualitative Research Methods .................................................................. 34 3.3.1.3 Reliability and Validity of Qualitative Research ......................................... 37 3.3.1.4 Analysis of the data ................................................................................... 37 3.3.1.5 The critique of qualitative research ........................................................... 38 3.3.2 Quantitative Research .................................................................................. 39 3.3.2.1 The quantitative research process ............................................................ 40 3.3.2.2 The main elements of quantitative analysis .............................................. 40 3.3.2.3 Reliability and validation of Quantitative Research ................................... 41 3.3.2.4 Collection of data in quantitative analysis ................................................. 43 3.3.2.5 Data Analysis ............................................................................................ 44 3.3.2.6 Critique of quantitative analysis ................................................................ 44 3.4 Aim and Objectives of this Study .................................................................. 45 3.5 Data Collection Strategies ............................................................................ 46 3.6 Research Design and Methods .................................................................... 46 3.6.1 Description and Purpose .............................................................................. 46 3.6.1.1 Construction of the Instrument .................................................................. 47 3.6.1.2 Recruitment of Study Participants ............................................................. 49 3.6.2 Pretesting and Validation ............................................................................. 51 3.6.3 Administration of the Questionnaire ............................................................. 51 3.7 Analysis of the Data ..................................................................................... 52 3.8 Summary ...................................................................................................... 52 CHAPTER FOUR ................................................................................................... 54 Presentation of Results .......................................................................................... 54 4.1 Introduction................................................................................................... 54 4.2 Descriptive Statistics of the Independent Variables...................................... 54 4.3 Descriptive Statistics of the Dependent Variables ........................................ 61 4.4 Summary ...................................................................................................... 80 CHAPTER FIVE ..................................................................................................... 81 Discussion .............................................................................................................. 81 5.1 Introduction................................................................................................... 81

vii
5.2 Demographics .............................................................................................. 81 5.3 Findings of the Study .................................................................................... 81 5.4 Summary ...................................................................................................... 87 CHAPTER SIX ....................................................................................................... 88 Recommendations and Conclusions ...................................................................... 88 6.1 Introduction................................................................................................... 88 6.2 Has the problem been solved? ..................................................................... 88 6.3 Implications of this Research........................................................................ 89 6.4 Limitations and Recommendations for Future Studies ................................. 89 6.5 Specific recommendations for this study ...................................................... 91 6.6 Conclusion.................................................................................................... 93 References: ............................................................................................................ 94 APPENDIX 1 .......................................................................................................... 98 APPENDIX 2 ........................................................................................................ 108

viii
List of Figures
Number Description Page
Figure 2. 1 The Hierarchy Model .................................................................................. 18
Figure 2. 2The Performance Pyramid............................................................................ 20
Figure 2. 3The Balanced Scorecard .............................................................................. 22
Figure 2. 4The integral Framework for Performance Management ............................... 25
Figure 2. 5 Model of Performance Management in Organisations ................................ 27
Figure 2. 6 Vision-Strategy-Performance Measurement Link ....................................... 28
Figure 4. 1 Responses per Age Group ........................................................................ 55 Figure 4. 2 Responses by Gender ................................................................................. 56 Figure 4. 3 Percentage of respondents by Race Group ................................................ 58 Figure 4. 4 Ownership of Organisation .......................................................................... 59 Figure 4. 5 Employees familiar with the mission and vision of their organisation .......... 61 Figure 4. 6 Employee understanding of the meaning and relevance of KPAs ............... 62 Figure 4. 7 Employee perceptions on whether their Key Performance Areas
contribute to realising the strategy of the organisation .................................................. 65 Figure 4. 8 Employee perceptions on whether their KPAs make valuable contributions
to the organisation ......................................................................................................... 66 Figure 4. 9 Employees informed of the Performance Management process ................. 74 Figure 4. 10 Line Manager discusses individual’s strengths during KPA sessions ........ 76 Figure 4. 11 Line Manager discusses weaknesses during KPA sessions ..................... 77 Figure 4. 12 Negative employee attitudes toward Performance Management System . 78 Figure 4. 13 Employee perceptions on fairness of KPA PM System at their
organisations ................................................................................................................. 79 Figure 4. 14 Employee perceptions on whether KPA assessments have impacted
positive on their work performance ................................................................................ 80

ix
List of Tables
No. Description Page Table 4. 1 Educational Qualification .............................................................................. 57 Table 4. 2 Positions in the Organisation ........................................................................ 60 Table 4. 3 Employee understanding of the concepts of Key Performance Areas .......... 63 Table 4. 4 Employee understanding of the reasons for KPA reviews ............................ 64 Table 4. 5 Perceptions of rank in the organisation in terms of KPAs making a valuable
contribution to the organisation ..................................................................................... 67 Table 4. 6 Perceptions of rank in the organisation with respect to achieving the
objectives of the organisation ........................................................................................ 68 Table 4. 7 Age group contribution to the realisation of the strategy of the organisation 69 Table 4. 8 Gender contribution to the realisation of the strategy of the organisation ..... 70 Table 4. 9 Race group contribution to the realisation of the strategy of the
organisation ................................................................................................................... 71 Table 4. 10 Academic contribution to the realisation of the strategy of the organisation72 Table 4. 11 Contribution of rank to the strategy of the organisation .............................. 73 Table 4. 12 Employee perceptions on the reasons that KPA sessions are conducted .. 75 Table 4. 13 Manager’s role in KPA session ................................................................... 75

1
CHAPTER ONE
Introduction to Research
1.1 Introduction The working world is in a state of ongoing transition. The technological era has
transformed an eight hour working day into a day of multitasking, meetings and
mergers. The impact of more advanced and efficient human resource systems,
technological progress, increasingly regular mergers and developments means that
the average human resource department needs to think more strategically in order to
keep up with the overall business pace. Globally, human resources must now factor
in a wider variety of modern issues, including cultural variations and changing
workplace demographics to make a positive difference to the business. Technology
has impacted the markets so much so that the global arena has widened to online
shopping and price wars. The global economy is a knowledge economy and
knowledge workers exist at all levels of the global workforce. To succeed in such a
workforce, human resource management needs to direct policies and practices that
recognise the requirements of individuals and that create fluid boundaries between
organisations. As technology remains at the forefront of the era, people have
become the focal point. Organisations have shifted from being “product driven” to
“market driven” and as a result the focus is on people – within the organisation, as
employees and outside the organisation, as customers.
This chapter will provide a brief overview of this research study illustrating the
motivation, focus and objectives this study. 1.2 Motivation for the Study
Many organisations, successful as they might be, fall short in ultimately achieving
their long term goals in a far more efficient manner and instead of assessing the

2
internal environment of the organisation and the factors that may influence these
inefficiencies, management focuses on the external environment and continuously
redress their short term strategies (Altman: 1979). A major oversight is the fact that
the majority of employees in organisations are not familiar with the company’s
mission and vision, and the fact that in performing their individual tasks, they are
actually contributing to the accomplishment of the company’s mission and vision.
The primary motivation of this study is to determine whether the goals of employees
are aligned with the company’s strategic goals, and if so, are employees aware of this
alignment and of the company’s strategy.
This study is aimed at benefiting organisations by illustrating that a workforce that is
more cohesive in respect of organisational objectives will assist in meeting those
objectives far more effectively and efficiently. It will also benefit organisations by
illustrating that the performance management system and key performance areas are
not merely the function of the HR department, but should be the primary concern of
each and every manager and employee as these are ultimately the functions that give
life to the company strategy. In addition, this study aims to highlight that key
performance reviews and appraisals should not be seen as a mere formality to simply
meet the organisations requirements.
This study will also benefit academia with respect to students who have an interest in
conducting research in the same field.
1.3 Focus of the Study
According to Misselhorn (2005: 172), “Organisational structure and design has grown
out of the issues that arise when we have many people coming together with different
jobs to be done to achieve a common purpose”. “Strategy refers to the long term
plans developed by top management, usually for periods of two to ten years or even

3
longer. These plans are used to evaluate and seize opportunities, as well as to
allocate resources. Strategy includes plans to create new products, to purchase
other organisations, to sell unprofitable sections of the business, to make shares
available and to enter international markets” (Nel et al: 2004:524).
Human resources practices can only be effective if they are aligned with the strategic
direction of the organisation. Dessler (2006) states that most companies have or are
gaining access to the same technologies, therefore technology is not enough to set
companies apart. It is usually the employees and the management system that
makes a difference. In general, companies emulate one another, offer similar
products with the only point of differentiation being price. Once the information on
price becomes public knowledge, competing companies respond by reducing their
prices. This therefore weakens the competitive advantage of companies. In
essence, the generic strategy of organisations is to be different from the competition,
i.e. what it does relative to the competition (Dessler: 2006).
HR Strategy can add value to an organisation by identifying, analysing and balancing
the company’s external opportunities on the one hand and its internal strengths and
weaknesses on the other. The results thereof initiate strategic plans to capitalise on
the organisations strengths and opportunities and minimise its threats and
weaknesses (Cummings: 2005).
Human resource management plays a pivotal role in the organisations strategy
formulation because they are able to supply competitive intelligence that may be
useful in the strategic planning process. They also supply information on the
organisations internal human strengths and weaknesses (Nel et al: 2004).
HR Strategy implies the development of the human capital pool which gives an
organisation “the unique ability to adapt to an ever changing environment” (Noe,
Hollenbeck, Gerhart and Wright: 2006: 61). The development also entails the
changeover in the organisation to a learning or knowledge organisation in which
4
employees continually expand their capacity to achieve the results they desire. The
organisation therefore is in a constant state of learning and therefore gains
competitive advantage.
The focus of this study is to identify whether the HR function in an organisation is
using their human capital to meet the objectives of that organisation and if so,
whether the key performance areas allocated to the human capital are an integral part
of the process in achieving the goals of the organisation.
Misselhorn (2005:173) stated: “Unfortunately, human organisations don’t function well
on pure instinct. Without careful thought being given to how to organise the people
doing the work, we would have chaos”. He stated further that “Key performance
areas are the priority outcomes we hope to achieve expressed as broad
headings……They usually come from a careful examination of the internal and
external forces affecting the achievement of the overall goal”. Misselhorn reinforced
the objectives of this research and that is to illustrate that employees need direction to
deliver on the grand plan of the organisation and that direction will arise out of a
carefully thought out, well implemented performance management system.
1.4 Problem Statement
Performance management is the process of measuring the performance required to
meet strategic goals, convert them into team and individual goals, and manage them
through reward and recognition (Nel et al: 2004). Performance management
therefore seeks to ensure consistency and achievement of the overall strategy of the
business and to ensure that the necessary objectives are met within the business.
Traditionally, the formal performance appraisal system was viewed as the primary
means for managing employee performance (Otley: 1999). Performance appraisal
was an administrative duty performed by managers and was the primary

5
responsibility of the human resource function (Noe et al: 2006: 329). The role of the
human resource function has evolved over time to become that of a strategic partner,
whose strategies are aligned with the business strategies of the organisation.
Strategic Human Resources means formulating and executing human resources
systems, i.e. policies and practices that produce employee competencies and
behaviour the company needs to achieve its strategic aims. In short, it refers to
specific human resources courses of action a company pursues to achieve its
strategic goals. “Strategic HR management entails synchronising and integrating the
organisations strategic business needs and plans with all those aspects stemming
from and relating to the management of its employees” (Nel, Van Dyk, Haasbroek,
Schultz, Sono and Werner: 2004:531).
It is therefore imperative that organisations have good performance appraisal
systems in place and ensure that employee goals are aligned with the company’s
strategic goals. However, it has been recently observed that in several organisations,
the performance appraisal process is practised as a mere formality, not as a
significant tool to meet the objectives of the organisation. This is supported by Noe et
al: 2006: 329) who state that “Managers now view performance appraisal as an
annual ritual”. This ritual, however, is practised only at the base of the hierarchy,
while the organisation’s strategic business needs and plans are synchronised with the
key performance areas of those individuals that occupy the upper echelons of the
hierarchy.
1.5 Objectives
The purpose of this study is to ascertain whether the performance management
systems in place within corporations form part of the integral process in meeting the
organisations objectives. It also aims to examine whether employees are familiar with
the organisation’s mission and vision, the significance of their KPAs and how it
contributes to achieving the organisations goals. This study is aimed at benefiting the

6
organisations by illustrating the benefits of a well implemented performance
management system and students who want to pursue research in this field in the
academic arena.
Objectives:
1. To establish whether employees are familiar with the vision and mission of the
company.
2. To determine whether employees understand what are KPAs.
3. To determine whether employees are aware of the significance of their KPAs
in achieving the company's objectives.
4. To draw a comparison between different levels of employees’ awareness of
their KPA’s and its impact on the company objectives. 5. To determine whether demographics (age, gender, race, level of education
and rank) impacts on employees’ awareness of KPA’s and company
objectives.
6. To determine employee perceptions of the performance management process.
1.6 Research Questions The following questions will be answered by this study:
Are the key performance areas of employees aligned with the mission and vision of
their organisations?
Are employees aware that their key performance areas are linked to the company
strategy?
Do employees know that they individually contribute to meeting the objectives of their
organisations?

7
Do employees know the significance of having a performance management system in
place at their workplaces?
Are employees aware on the significance on KPA reviews and contracting with their
line managers?
1.7 Limitations of the Study
The possible limitations of this study include:
Time constraints,
Lack of response from respondents,
The chosen sample size
1.8 Chapter Structure This research study will be presented in six chapters. Chapter 1 provides the
background to the research, highlighting the motivation for this study as well as the
aim and objectives of this study. The research problem and possible limitations of
this study will also be discussed here. This study was purely quantitative and not
qualitative.
Chapter 2 will present the literature reviewed for this study. This chapter will highlight
the definitions of performance management, present different models of performance
management and discuss the link between key performance areas and organisational
strategy.

8
Chapter 3 provides a discussion of the research methodology that was adopted for
this study. The research design and instruments, data collection methods, sampling
techniques and use of questionnaires will also be discussed.
Chapter 4 presents the findings of this study on the basis of the research objectives
and the empirical data collected. The data from this research is statistically analysed,
interpreted and presented in the form of tables and graphs.
Chapter 4 is the interpretation of the findings linking the empirical data with the
literature reviewed for this study.
Chapter 6 presents the conclusions of this research study. This chapter provides a
critical assessment of this study as well as recommendations for future studies.
1.9 Summary
This chapter outlined the intent and purpose of this study as well as the motivation
and focus of the study. It also briefly described the possible limitations of the study as
well as benefactors of this study.
The next chapter will provide a review of the literature used for this research more
specifically research done in the same area.

9
CHAPTER TWO
The Literature on Performance Management
2.1 Introduction This chapter explores the literature available on performance management systems,
key performance areas and the link to organisational strategy. The chapter will
present the past research that has been done on this subject as well as findings and
recommendations. The literature will also present the various performance
management frameworks and models that are available to organisations.
2.2 A few definitions Performance measurement systems are formal devices for control and for the
formulation and communication of strategy (Wouters 2009) – they are used as a
management tool to ensure that employees perform the tasks that really matter to the
organisation.
“Performance management is the process of defining clear objectives and targets for
individuals and teams, and the regular review of actual achievement and eventual
rewarding for target achievement” (Lowe and Jones, 2004, p. 1314); a process that
should ensure that individual and team effort support the organisational objectives
and that key stakeholder expectations are realised.
Grobler, Warnich, Carrell, Elbert and Hatfield (2002, p. 260) define performance
appraisal as “the ongoing process of evaluating and managing both the behaviour
and outcomes in the workplace”, while Noe, Hollenbeck, Gerhart and Wright (2006, p.
330) define performance appraisal as “the process through which an organisation
gets information on how well an employee is doing his or her job”. None of the
preceding definitions have embedded in them the association on the performance
appraisal system to the long-term objectives of organisations.

10
Just as performance management has been defined as “the means through which
managers ensure that employees’ activities and outputs are congruent with the
organisation’s goals” (Noe et al, 2006, p. 330), so too should the definition of
performance appraisal clearly and explicitly illustrate the link between an employee’s
performance and the organisation’s goals. Performance management must be used
as a strategic tool for it to be truly effective in the organisation, i.e. the organisation’s
strategy must be linked with its performance management system.
Traditionally, performance management was viewed from a pure accounting
perspective i.e. overheads were allocated on the basis of direct labour, “which up to
the 1960’s was a reasonable method, direct labour being a significant proportion of
cost of goods sold (Rouse & Putterill 2003, p. 792). In the 1920s, the Du Pont
pyramid of financial measures was a framework used to measure performance –
“The pyramid of financial ratios had an explicit hierarchical structure, linking measures
at different organisational levels” (Rouse & Putterill 2003, p. 792). A major
shortcoming of the Du Pont pyramid, albeit a relatively sophisticated method of
analysing financial performance, is it sole focus on financial performance.
Technological advancement in the 1980’s brought substantial introductions of
automation and computer controlled processing, reducing the proportion of direct
labour in the cost of goods sold to a much lower level” (McAdam and Bailie, 2002, p.
973). The traditional method of measuring performance led to misleading information
and consequently wrong decisions where continuous improvement and innovation
were concerned. Letza (1996) highlighted that the financial and accounting measures
were an “insensitive and inadequate” tool for decision-making with regard to
alignment with business strategy. Performance measures must reflect the strategies
and capabilities of the organisation, not just the financial results, as supported by
Kaplan and Norton (1996) who state that “an organisation’s measurement system
affect the behaviour of people inside and outside the organisation”.
According to Rouse and Putterill (2003, p.75) business today is highly integrated,
data is generated in large volumes, and processes are in many instances continuous.

11
Above all else competition is intense and the environment dynamic. To make
progress on the performance measurement front requires researchers to explicitly
recognise the business world as it now is, and to be prepared to experiment with
permutations other than the single perspective that has been the dominant paradigm.
The fundamental shift in business is that organisations have transcended their cost
phase and entered a value phase, i.e. businesses today operate in an environment
where value is paramount and have to continuously strive to deliver products and
services which are of greater value to their customers at lower costs. To do so, they
have been compelled to adopt a variety of performance improvement programmes,
the vast majority of which demand that they upgrade their business performance
measure systems (Neely 1999, p. 214).
2.3 The Company Strategy
Strategy refers to the long term plans developed by top management, usually for
periods of two to ten years or even longer. These plans are used to evaluate and
seize opportunities, as well as to allocate resources. Strategy includes plans to
create new products, to purchase other organisations, to sell unprofitable sections of
the business, to make shares available and to enter international markets (Nel et al
2004, p. 524).
Mintzberg (2001, p.11) states “Human nature insists on a definition for every concept.
The field of strategic management cannot afford to rely on a single definition of
strategy”. He describes strategy as some sort of consciously intended course of
action, a guideline to deal with a situation, comprising of five pillars i.e. a plan, ploy,
pattern, position and perspective. This definition illustrates some of the most
fundamental issues about organisations as instruments for collective perception and
action.
Porter (1991, p.96) describes strategy as a way of integrating the activities of the
diverse functional departments within a firm, including marketing, production,

12
research and development, procurement, finance and the like. He stated further that
“an explicit and mutually reinforcing set of goals and functional policies is needed to
counter the centrifugal forces that lead functional departments in separate directions”.
Porter stated that success of a strategy depends on three essential conditions –
firstly, the strategy must be well understood throughout the organisation and
secondly, the strategy must align the organisation with its environment. The third
condition for success is that a company’s strategy must be centrally concerned with
the creation and exploitation of its distinctive competences.
Dessler (2006) states that most companies have or are gaining access to the same
technologies, therefore technology is not enough to set companies apart. It is usually
the employees and the management system that makes a difference. In general,
companies emulate one another; offer similar products with the only point of
differentiation being price. Once the information on price becomes public knowledge,
competing companies respond by reducing their prices. Neely (1999, p. 211) states
further that “many organisations now actively seek to differentiate themselves from
their competitor in terms of quality of service, flexibility, customisation, innovation and
rapid response. They have been forced to do so because they now find themselves
competing in markets where value rather than cost is the primary driver”. This
therefore weakens the competitive advantage of companies. In essence, the generic
strategy of organisations is to be different from the competition, i.e. what it does
relative to the competition.
A well thought out competitively advantageous strategy is futile if it cannot be
successfully executed in an organisation. “The strategy must be translated in
concrete action and that action must be carefully implemented” (Pearce and
Robinson 1995, p. 323). The implementation of strategies in organisations is
tremendously challenging especially if the organisation operates in a rapidly changing
industry and it is therefore critical for organisations to ensure that their entire human
capital is a dynamic workforce, well versed in the strategy of the organisation and is
committed to the implementation of their company’s strategy. In their article, Kaplan

13
and Norton (2005, p. 27) state “The gap arises, we believe, from a disconnect in most
companies between strategy formulation and strategy execution”. Their research
reveals that 95% of a company’s employees who are closest to customers and who
operate processes are unaware of, or do not understand, its strategy. They further
state that if the processes that create value are unaware of the strategy, they surely
cannot help the organisation implement it effectively. Communication is vital to the
strategic implementation process. Kaplan and Norton (2005, p. 72) further state that
“Effective strategy execution requires communicating corporate strategy, ensuring
that enterprise-level plans are translated into the plans of various units and
departments, executing strategic initiatives to deliver on the grand plan; and aligning
employees’ competency development plans and their personal goals and incentives
with strategic objectives”. Employees must be properly informed on exactly why they
are commissioned to perform the tasks require for successful strategy
implementation, because if they are uninformed then they are merely working towards
purpose-less objectives. Collis and Rukstad (2008, p. 9) purport that circulating the
strategy statement throughout the company, with the value proposition and the
activity system map attached thereto, is the starting point for incorporating strategy
into everyone’s behaviour.
2.4 Human Resources Strategy Human resource practices can only be effective if they are aligned with the strategic
direction of the organisation; hence strategic human resources management means
formulating and executing Human Resources (hereafter referred to as HR) systems,
which comprise policies and practices that produce employee competencies and
behaviour the company needs to achieve its strategic aims (Redman and Wilkinson,
2001, p.10). In short, it refers to specific human resource courses of action a
company pursues to achieve its strategic goals. “Strategic HR management entails
synchronising and integrating the organisations strategic business needs and plans
with all those aspects stemming from and relating to the management of its
employees” (Nel et al 2004, p. 531). Strategic human resource management is a

14
pattern of planned human resource deployments and activities intended to enable an
organization to achieve its goals. Miller (1987 cited in Redman and Wilkinson 2001,
p. 10) defines strategic human resources management as “those decisions and
actions which concern the management of employees at all levels in the business and
which are directed towards creating and sustaining competitive advantage”.
According to Sparrow and Hiltrop (1994, p.629) the underlying assumption is that
organisational effectiveness depends on there being a tight ‘fit’ between human
resource practice and business strategies. They further state that different HRM
practices serve to elicit and reinforce appropriate behaviours in the organisation.
These ‘role’ behaviours cut across the specific skills, knowledge and abilities that are
required to perform particular tasks. They are considered to be instrumental in the
implementation of competitive strategies. HRM strategies are, therefore, all about
making business strategies work.
Strategic human resource theory posits that an organisation’s human resources
assets are potentially the sole source of competitive advantage, where competitive
advantage depends solely on the organisation having “superior, valuable, rare, non-
substitutable resources at its disposal and such resources are not easily imitated by
others” (Redman & Wilkinson 2001, p. 10). Pivotal to this is the non-imitable aspect
of the organisation’s resources, as competitors would soon follow suit through
replication and the competitive advantage of that organisation would soon be lost. A
significant point to note is that human capital is not an easy to imitate concept
considering the complexities of personalities and emotions, more especially if the
organisation has subtly implemented a human resource value creation process.
2.4.1 How can HR Strategy add value to an organisation? HR Strategy can add value to an organisation by identifying, analysing and balancing
the company’s external opportunities on the one hand and its internal strengths and
weaknesses on the other. The results thereof initiate strategic plans to capitalise on

15
the organisations strengths and opportunities and minimise its threats and
weaknesses with regard to human resources. Human resource management plays a
pivotal role in the organisations strategy formulation because it is able to supply
competitive intelligence that may be useful in the strategic planning process. They
also supply information on the organisations internal human strengths and
weaknesses (Dessler 2006).
HR Strategy implies the development of the human capital pool that gives an
organisation “the unique ability to adapt to an ever changing environment” (Noe et al
2006, p. 61). The development also entails the changeover in the organisation to a
learning or knowledge organisation in which employees continually expand their
capacity to achieve the results they desire. Senge (1990) stated “Through learning
we re-create ourselves. Through learning we become able to do something we never
were able to do. Through learning we re-perceive the world and our relationship to it.
Through learning we extend our capacity to create, to be part of the generative
process of life”. The organisation is in a constant state of learning and thereby gains
a competitive advantage. “Hiring competent employees and developing those
competencies through effective human resource practices, underpins organisational
capability” (Hiltrop 1996, p. 629).
Competitive advantage is defined as the factors that allow an organisation to
differentiate its products and services from those of its competitors to increase market
share (Dessler 2006, p. 10). In his article, Cummings (2005, p. 28) purports that the
main difference between competing organisations is the attitude and quality of its
people. According to Cummings (2005, p. 28) the concepts of risk management, best
practice and benchmarking have closed the gap between organisations competing in
the same industry; “you cannot, by definition, be a leader by following best practice”.
In his opinion, human resources can be strategic by motivating employees to see a
benchmark as challenge to go one better, rather than the norm to copy and to identify
“next practice” as opposed to settling for best practice.

16
2.5 Performance Management and Key Performance Areas
The performance appraisal initiative should be the platform that managers use to
communicate and give life to the long and short-term strategic goals of the
organisation. According to Neely (1999) a company must use relevant performance
measures to achieve sustainable business success in the demanding world
marketplace. Letza (1996, cited in McAdam and Bailie: 2002) purports that the main
function of performance management in a strategic context is to provide the means of
control to achieve the objectives required to fulfil the company’s mission or strategy
statement. Neely et al (1994) support this view by stating that performance
measurement is a key part of strategic control; and together with Fawcett et al (1997,
cited in McAdam and Bailie 2002, p. 974) develop this argument by stating the need
for performance measurement to exercise this control through:
Helping managers to identify good performance
Setting targets
Demonstrating success or failure
Neely (1999, p. 211) states further that many organisations have realised that one of
the hidden benefits of matching measures and strategies is namely that measures
can encourage the implementation of strategy. Measures that are aligned with the
strategy not only provide information on whether the strategy is being implemented,
but also encourages behaviour that is consistent with the strategy. Neely (1999)
further advocates the acceptance of Mintzberg’s (1978) thesis that when an
organisation realises that the strategy is a function of the “pattern of decisions and
actions” it takes, then it becomes clear that the appropriately designed performance
measures can encourage the implementation of strategy. Companies often fail to
turn strategy into action due to inadequate or inappropriate measures.
Redman and Wilkinson (2001) cite Bevan and Thompson (1991) who describe
performance management as:

17
A shared vision of the organisations’ objectives communicated via a mission
statement to all employees
Individuals performance targets which are related to the operating unit and
wider organisational objectives
Regular formal reviews of progress towards targets
A review process which identifies training and development needs and rewards
outcomes
An evaluation of the effectiveness of the whole process and its contribution to
the overall organisational performance to allow changes and improvements to
be made.
According to Neely (1999, p. 210), there are seven main reasons for performance
management being necessary in the current business environment namely, the
changing nature of work, increasing competition, specific improvement initiatives,
national and international awards, changing organisational goals, changing external
demands, and the power of information technology.
“Increasing competition and globalisation of markets has led to organisations striving
to differentiate themselves from their competitors. Markets are driven more by value
than cost, forcing organisations to consider quality, customer service response and
other such attributes” (McAdam and Bailie 2002, p. 974). Bourne et al (2000, cited in
McAdam and Bailie, 2002, p. 974) advocate that this change of focus has generated
the need for performance measures to facilitate the control of these attributes.
The aforementioned literature provides compelling reasons why performance
measurement assumes a more strategic outlook. In view of this, models and
mechanisms must be developed to address the need for appropriate supporting
performance measures for business strategy in a rapidly changing environment
(McAdam and Bailie 2002, p. 974).
18
2.5.1 Performance Management Frameworks
The review of literature presents frameworks and models that are recommended for
efficient performance management systems
2.5.1.1 Hierarchy Model
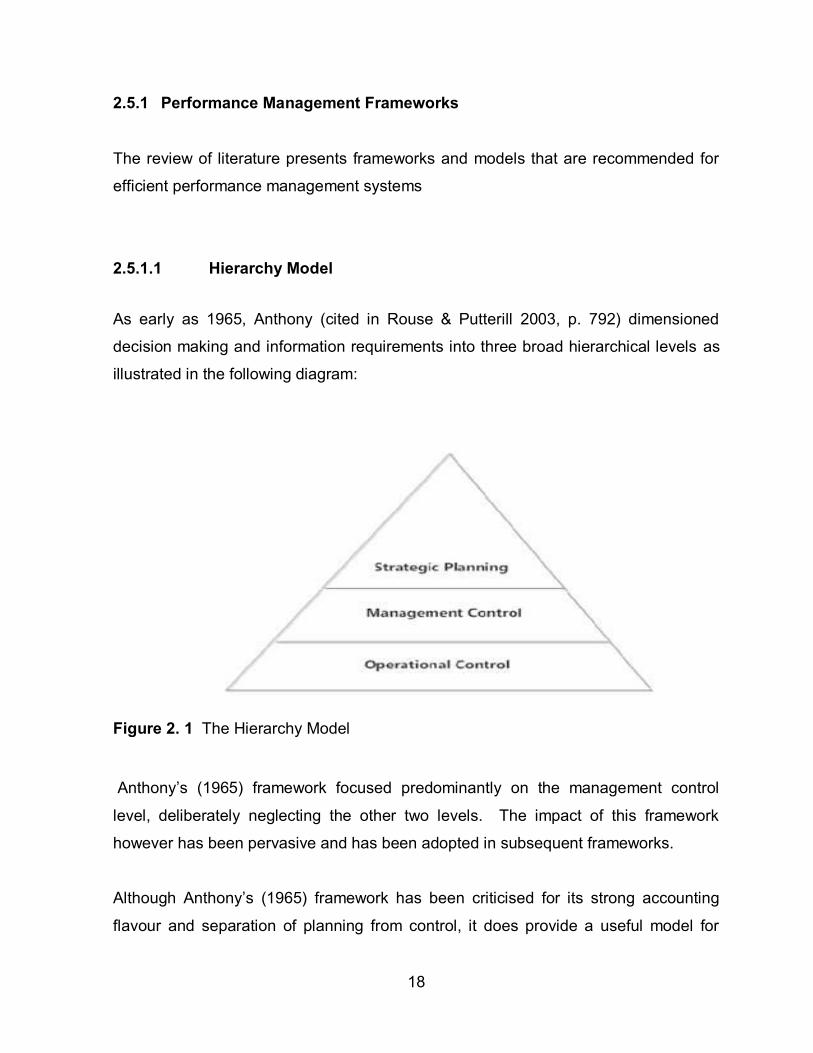
As early as 1965, Anthony (cited in Rouse & Putterill 2003, p. 792) dimensioned
decision making and information requirements into three broad hierarchical levels as
illustrated in the following diagram:
Figure 2. 1 The Hierarchy Model
Anthony’s (1965) framework focused predominantly on the management control
level, deliberately neglecting the other two levels. The impact of this framework
however has been pervasive and has been adopted in subsequent frameworks.
Although Anthony’s (1965) framework has been criticised for its strong accounting
flavour and separation of planning from control, it does provide a useful model for

19
depicting the notion of managerial measures linking strategic objectives to operational
control activities (Rouse and Putterill 2003, p. 792).
2.5.1.2 Three Components of Performance Monitoring Model
This model designed by Altman (1979) was built on three desirable components of
performance monitoring systems in the public sector, i.e. a data component which
captures and processes data, an analysis component which translates data into
information, and an action component which refers to management’s use of this
information.
Altman (1979, p. 32) states “Whereas organisational goals are general statements of
desired social or organisational outcome and are usually not time limited, programme
objectives are quantifiable, time-limited statements of planned results” - this means
that the three components prescribed by Altman’s (1979) model are programme
objectives which reflect the organisation’s goals.
2.5.1.3 Performance Pyramid
In 1989, Cross and Lynch (cited in Rouse and Putterill 2003, p. 792) devised a
performance pyramid where strategic objectives flow down the hierarchy through the
organisation with a reverse flow of information flowing upwards. The pyramid
comprises four levels that embody the corporate vision, accountability of the business
units, competitive dimensions for business operating systems and specific operational
criteria.

20
Figure 2. 2 The Performance Pyramid
2.5.1.4 Multi-dimensional Approach Azzone, Masella and Bertele (1991 cited in Rouse and Putterill 2003, p. 792)
provided a multi-dimensional approach to performance measurement comprising four
dimensions of an organisation’s competitiveness i.e. cost, quality, innovation and
time. The focus on time and measures to assist firms competing on this dimension,
organisational learning is realised by the importance placed on human resources as a
critical success factor for time based competition.
2.5.1.5 Linked Structure Model Beischel and Smith (1991, cited in Rouse and Putterill 2003, p. 792) proposed the link
structure model explicitly focusing on the structure of the measures linking critical
success factors to process levels. Every measure must meet two criteria, namely, it
must be linked to a critical success factor at the top of the organisation and it must be
21
linked to the manufacturing process.
The rationale behind this is that measures that cannot be linked in these two ways are
either not indicating movement towards the achievement of the strategic goals or
cannot be explained in terms of process drivers, implying that no control response
can be taken (Rouse & Putterill 2003, p. 792).
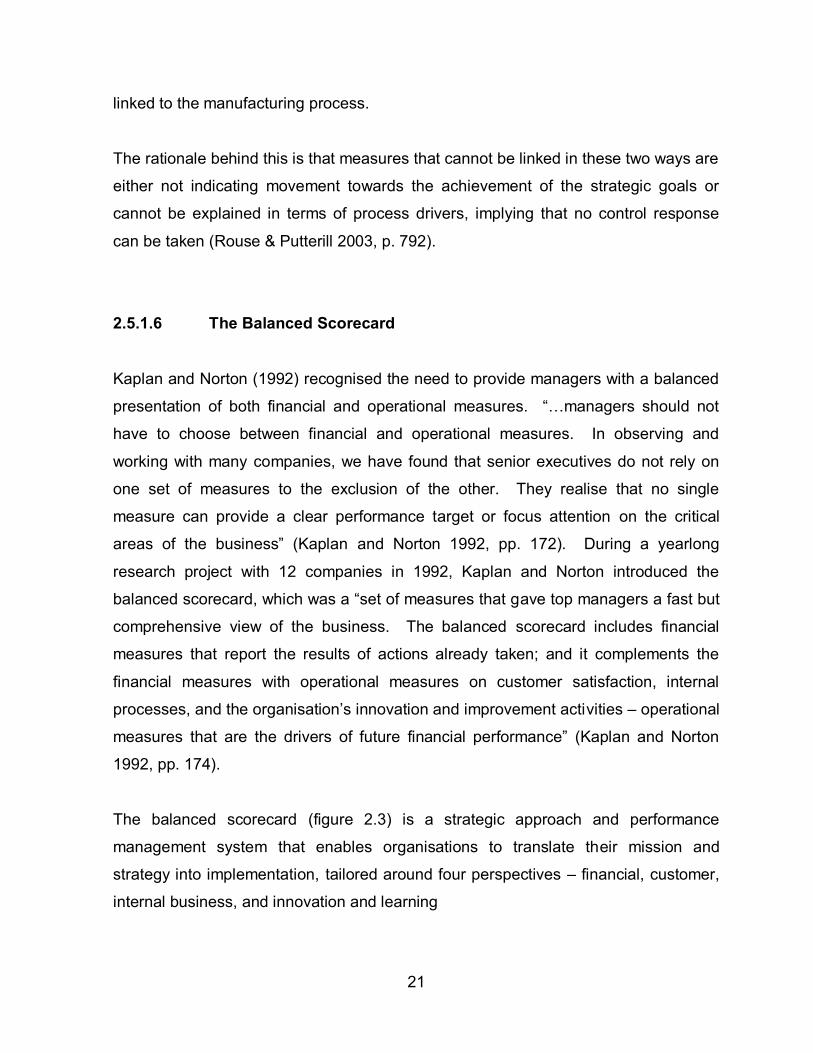
2.5.1.6 The Balanced Scorecard
Kaplan and Norton (1992) recognised the need to provide managers with a balanced
presentation of both financial and operational measures. “…managers should not
have to choose between financial and operational measures. In observing and
working with many companies, we have found that senior executives do not rely on
one set of measures to the exclusion of the other. They realise that no single
measure can provide a clear performance target or focus attention on the critical
areas of the business” (Kaplan and Norton 1992, pp. 172). During a yearlong
research project with 12 companies in 1992, Kaplan and Norton introduced the
balanced scorecard, which was a “set of measures that gave top managers a fast but
comprehensive view of the business. The balanced scorecard includes financial
measures that report the results of actions already taken; and it complements the
financial measures with operational measures on customer satisfaction, internal
processes, and the organisation’s innovation and improvement activities – operational
measures that are the drivers of future financial performance” (Kaplan and Norton
1992, pp. 174).
The balanced scorecard (figure 2.3) is a strategic approach and performance
management system that enables organisations to translate their mission and
strategy into implementation, tailored around four perspectives – financial, customer,
internal business, and innovation and learning

22
Figure 2. 3 The Balanced Scorecard
Adapted from: http://www.businessintelligence.com
The financial and customer perspectives of the balanced scorecard are intended to
reflect the needs of stakeholders and target groups, which include measures such as
sales, profitability, market share and customer satisfaction. The internal business
perspective focuses on the internal operations that are necessary for customer
satisfaction and efficiency; and includes measures of cycle time, and unit cost data.
The innovation and learning perspective reflects the ability of the organisation to
continue to improve and create value for its customers and stakeholders. The
measures under this perspective include the period of inception of a new product to
its introduction onto the market i.e. “time to market”, rates of improvement in reducing
defect rates, and the half-life measure.
The balanced scorecard sets out to provide the answers to four basic questions
(Kaplan and Norton 1992, pp. 174) i.e. how do customers see us, what must we excel

23
at, can we continue to improve and create value, and how do we look at
shareholders?
The balanced scorecard forces managers to focus on a handful of measures that are
most critical to an organisation. It also meets several managerial needs, such as
bringing together, in a single managerial report, many of the seemingly disparate
elements of a company’s competitive agenda: becoming customer oriented,
shortening response time, improving quality, emphasising teamwork, reducing new
product launch times and managing for the long term. The scorecard also guards
against suboptimisation, by compelling senior managers to consider all the important
operational measures together, granting them the ability to see whether improvement
in one area may have been achieved at the expense of another (Kaplan and Norton
1992, pp. 174).
Kennerly and Neely (2000 cited in Rouse and Putterill 2003, p. 793) point out a
number of shortcomings of the balanced scorecard namely the absence of a
competitive dimension, failure to recognise the importance of aspects such as human
resources, supplier performance, and no specification of the dimensions of
performance that determine success.
2.5.1.7 The Otley Framework In 1999 Otley proposed a framework with a strong emphasis on management control
purposes that is organised around five main sets of issues: organisation objectives
and their evaluation, strategies and plans, their implementation and ongoing
appraisal, performance targets, incentive arrangements, and information and
knowledge management.

24
2.5.1.8 The Performance Prism
Kennerley and Neely (2002) provided a performance prism that is organised around
five distinct but linked perspectives of performance: stakeholder satisfaction,
strategies, processes, capabilities, and stakeholder contributions. 2.5.2 An integral framework for Performance Management
According to Rouse & Putterill (2003, p. 791) the integral framework for performance
management has two parts: “a macro view of the organisation that recognises the
general themes; and second, three separate but interrelated dimensions of
performance that emerge from the first component”. McAdam & Bailie (2002, p. 972)
state that it is important to establish a comprehensive view of performance measures
that indicate the overall health of a business, which can then be more fully aligned
with business strategy. Nanni et al (1992, cited in McAdam and Bailie 2002, p. 972)
described this approach as moving towards “integrated performance measures”.
An important characteristic of the integral framework for performance management is
the systematic structure of measures, methods of analysis and process of evaluation
that form the core of sustained planning and control practice. The integral approach
to performance management incorporates the broader evaluation processes relating
to the organisation’s mission and objectives and recognises that performance
appraisal encompasses a multitude of processes and tools, requiring a systems view
that may not be tractable to a single framework focussed solely on performance
measurement (Rouse and Putterill, 2003).
Rouse and Putterill (2003) state further that the flexibility of contemporary business
with global ramifications and wide ranging just in time interdependencies promoted by
computer facilitated connectivity is beyond the scope of a traditional, single, all
encompassing approach. The task today is to match contemporary business and
25
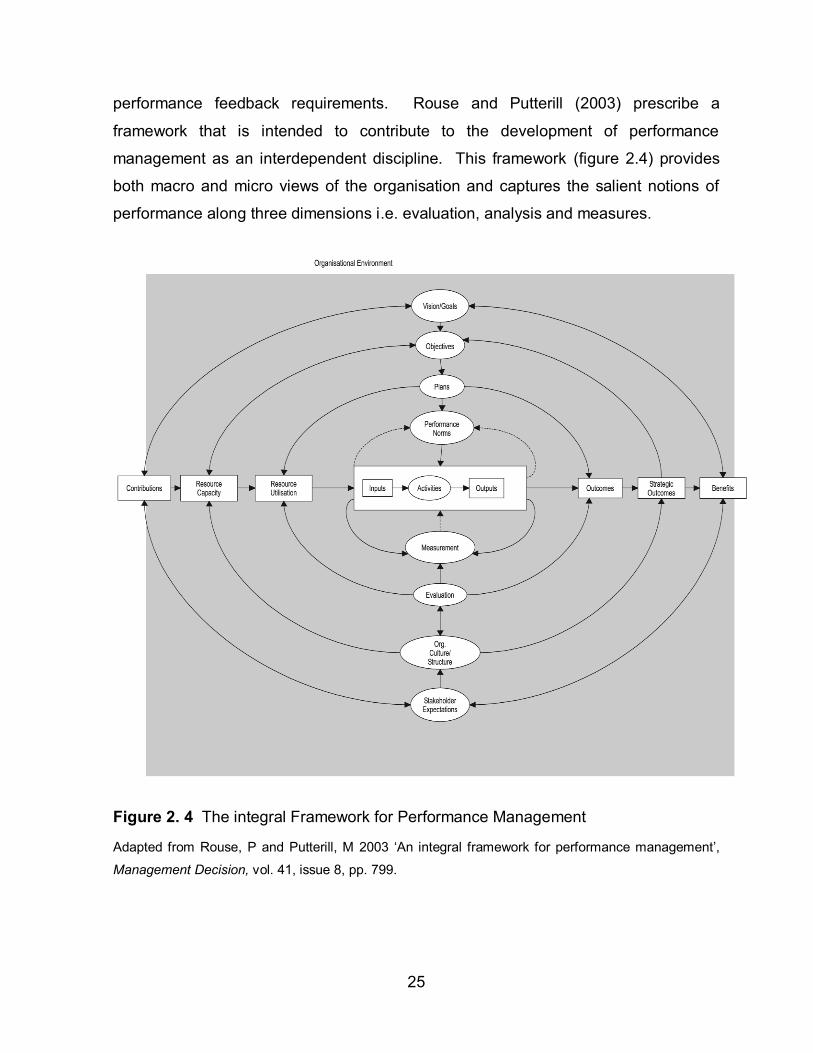
performance feedback requirements. Rouse and Putterill (2003) prescribe a
framework that is intended to contribute to the development of performance
management as an interdependent discipline. This framework (figure 2.4) provides
both macro and micro views of the organisation and captures the salient notions of
performance along three dimensions i.e. evaluation, analysis and measures.
Figure 2. 4 The integral Framework for Performance Management
Adapted from Rouse, P and Putterill, M 2003 ‘An integral framework for performance management’,
Management Decision, vol. 41, issue 8, pp. 799.

26
Rouse and Putterill’s (2003, p.799) framework provides the following contributions:
A sense of balance is conveyed between the macro and micro views of the
organisation and their interactions.
Planning and evaluation control processes are combined with resource and
achievement management considerations i.e. integrated performance
management should manage work rather than cost.
Performance is viewed in an holistic organisational sense that facilitates an
open system interpretation, while allowing for dynamic flows between the
various levels (the concentric circles) as well as for the entire system.
These contributions provide an integral approach to performance management
illustrating an holistic approach to managing the performance of the workforce or
organisations
2.6 An organisational model of Performance Management
Noe et al (2006, p. 331) advocate a performance management system that has three
parts i.e. defining performance, measuring performance and feeding back
performance information. According to these authors the performance management
system must first specify which aspects of performance are relevant to the
organisation, primarily through job analysis. Second, it measures those aspects of
performance through performance appraisal and third, it provides feedback to
employees through performance feedback sessions so they can adjust their
performance in line with the organisation’s goals. The major purposes of a
performance management system must be looked at from an organisational rather
than a measurement perspective as illustrated in Figure 2.5.
According to Noe et al (2006), individuals’ attribute – their skills, abilities and so on-
are the raw materials of performance. These raw materials are transformed into
objective results through the employees’ behaviour. However, these behaviours can

27
only be exhibited if the employees have the necessary knowledge, skills and abilities.
Employees with little product knowledge or indifferent interpersonal skills cannot
effectively display those behaviours. “The objective results are measurable, tangible
outputs of work, and they are a consequence of the employee’s or the work group’s
behaviour” (Noe et al 2006, p. 331).
Figure 2. 5 Model of Performance Management in Organisations
Adapted from Noe, R.A; Hollenbeck, J.R; Gerhart, B; Wright, P.M. 2006. Human Resource
Management. Gaining a Competitive Advantage, Fifth Edition, McGraw Hill, New York. Page 331
Important component in this organisational model of the performance management
system is the organisation’s strategy. “Divisions, departments, work groups and
individuals within the company must align their activities with these strategies and
goals” (Noe et al 2006, p. 331). The link between performance management and the

28
strategies and goals of organisations is often neglected; and this lack of alignment
makes the possibility of achieving the goals very small. The performance planning
and evaluation (PPE) systems, which seek to tie the formal performance appraisal
process to the company’s strategies by specifying at the beginning of the evaluation
period the types and level of performance that must be accomplished to achieve the
strategy (Noe et al 2006, p. 331).
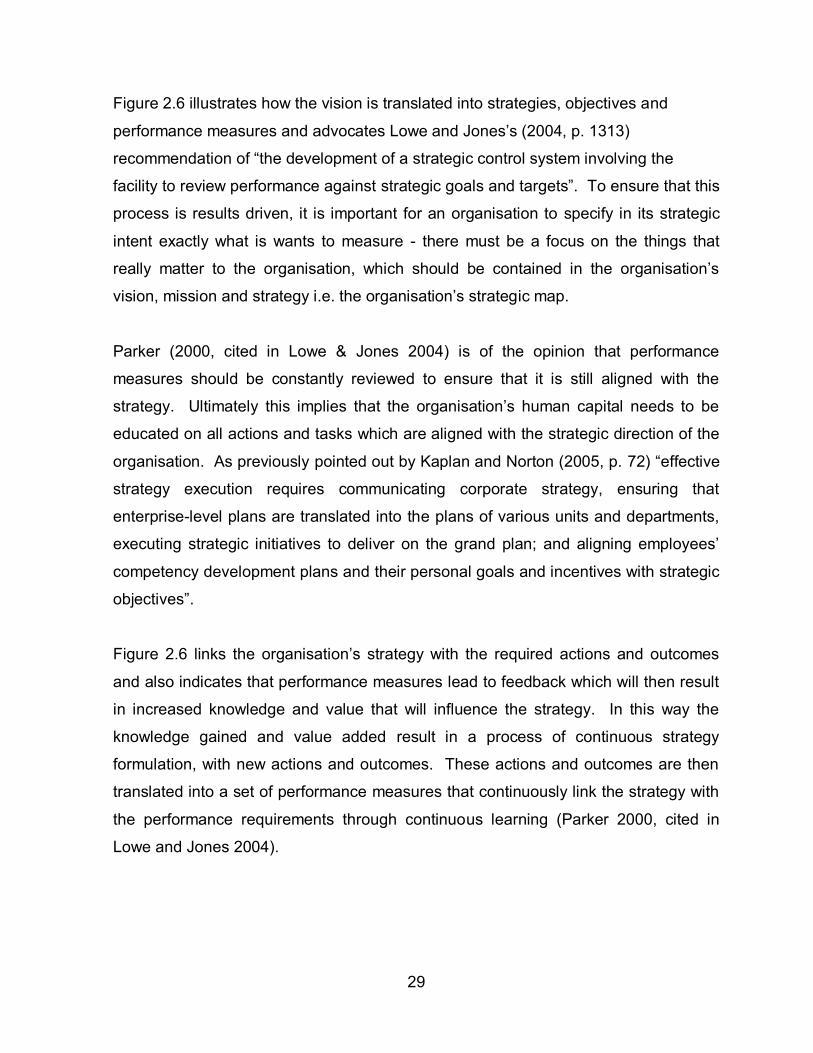
2.7 Vision & Strategy
An organisation’s shared vision provides clear direction to its desired future position
and its strategies define or determine the manner in which this shared vision will be
accomplished. It is imperative that an organisation’s vision be translated into
strategies and actions, which is quantified by performance measures that determine
whether the vision is accomplished.
Figure 2. 6 Vision-Strategy-Performance Measurement Link
Adapted from Letza, S 1996 ‘The design and implementation of the balanced
scorecard – an analysis of three companies in practice’, Business Process
Management Journal, vol. 2, no. 3, pp. 54 – 76.
Control
Performance Measures
VISION
Mission/strategy statement
Objectives
Stepping
Cascading
29
Figure 2.6 illustrates how the vision is translated into strategies, objectives and performance measures and advocates Lowe and Jones’s (2004, p. 1313)
recommendation of “the development of a strategic control system involving the
facility to review performance against strategic goals and targets”. To ensure that this
process is results driven, it is important for an organisation to specify in its strategic
intent exactly what is wants to measure - there must be a focus on the things that
really matter to the organisation, which should be contained in the organisation’s
vision, mission and strategy i.e. the organisation’s strategic map.
Parker (2000, cited in Lowe & Jones 2004) is of the opinion that performance
measures should be constantly reviewed to ensure that it is still aligned with the
strategy. Ultimately this implies that the organisation’s human capital needs to be
educated on all actions and tasks which are aligned with the strategic direction of the
organisation. As previously pointed out by Kaplan and Norton (2005, p. 72) “effective
strategy execution requires communicating corporate strategy, ensuring that
enterprise-level plans are translated into the plans of various units and departments,
executing strategic initiatives to deliver on the grand plan; and aligning employees’
competency development plans and their personal goals and incentives with strategic
objectives”. Figure 2.6 links the organisation’s strategy with the required actions and outcomes
and also indicates that performance measures lead to feedback which will then result
in increased knowledge and value that will influence the strategy. In this way the
knowledge gained and value added result in a process of continuous strategy
formulation, with new actions and outcomes. These actions and outcomes are then
translated into a set of performance measures that continuously link the strategy with
the performance requirements through continuous learning (Parker 2000, cited in
Lowe and Jones 2004).

30
2.8 Summary An organisation’s capability is underpinned by the competence of the employees it
hires and its ability to develop those competencies through effective human resource
practices. This chapter has highlighted the importance of performance management
in modern organisations. The more recent models have shown that performance
management of individuals must be aligned with the organisations strategy. In
essence, if alignment between performances measures and business strategy is to
be meaningful and effective, then there must be more consistency of both decision
making and action. This consistency and hence alignment can only be achieved in
rapidly changing and complex environments by developing a more comprehensive
range of performance measures (McAdam and Bailie 2002, p. 976). The literature
reviewed suggests that the strategies of organisations are translated into action
through accurate and effective performance management systems that are put into
place. Measures that are aligned with strategy not only provide information on
whether the strategy is being implemented, but also encourage behaviours consistent
with the strategy (Neely 1999, p. 212). Performance management is a key process in
any organisation that focuses on key issues and business objectives to ensure
sustainability. After conducting numerous searches through academic literature it
was evident that no literature existed on this topic from a South African perspective.
Due to the paucity of South African literature the empirical study will attempt to add to
the literature on the link between KPA’s and strategy.

31
CHAPTER THREE
Research Methodology
3.1 Introduction This chapter presents a description of the methods followed in undertaking this
research study. The definitions of research as well as research instruments and
analysis are discussed in this chapter illustrating the many options there are in
conducting an empirical study. In this chapter, the research problem, the objectives,
sampling, research tools, approach and instrument to investigate the link between
Key Performance Areas and Organisational Strategy will be discussed.
3.2 What is Research?
“Research methodology is the general approach the researcher takes in carrying out
a research project, to some extent, this approach dictates the particular tools the
researcher selects” (Leedy and Ormrod 2005, p. 12). A research method is simply a
method for collecting data. Leedy and Ormrod (2005, p. 2) define research as “a
systematic process of collecting, analysing, and interpreting information (data) in
order to increase our understanding of the phenomenon about which we are
interested or concerned”, they propose that formal research typically has eight distinct
characteristics:
1. Research originates with a problem or question.
2. Research requires clear articulation of a goal.
3. Research requires a specific plan for proceeding.
4. Research usually divides the principal problem into more manageable sub
problems.
5. Research is guided by the specific research problem, question or hypothesis.
6. Research accepts certain critical assumptions.
7. Research requires the collection and interpretation of data in an attempt to

32
resolve the problem that initiated the research.
8. Research is, by its nature, cyclical or, more exactly helical.
What Leedy and Ormrod (2005) offer is that research occurs in a format, a
chronological path of inquiry, in search of empirical evidence to prove or disprove the
problem or question that initiated the research process; and research involves the
application of various methods and techniques in order to create scientifically
obtained knowledge by using objective methods and procedures.
3.3 Types of Research
The different types of research, their processes, methods and analysis are explained
below.
3.3.1 Qualitative Research
According to Leedy (2005, p. 133) qualitative research focuses on phenomena that
occur in natural settings, that is, in the “real world”; and they involve studying those
phenomena in all their complexity. The emphasis in qualitative research is on words
rather than on numbers or quantification in the collection and analysis of data
(Bryman & Bell 2007, p. 402).
Bryman and Bell (2007, p. 16-22) state that qualitative and quantitative originate from
two predominant positions:
The epistemological position, wherein the key question is whether or not the social
world can or should be studied according to the same principles, procedures and
ethos as the natural sciences, and
The ontological position is centred on the question of whether social entities can
and should be considered objective entities that have a reality external to social

33
actors, or whether these social entities are built from the perceptions and actions
of those social factors.
In qualitative research, the epistemological position is described as interpretivist. This
means that the emphasis on the understanding and interpretation of the social world
is through examination of that world’s participants.
The ontological position is described as constructionist. This implies that the social
make-up of the world is a result of the interactions between individuals, as opposed to
being derived from phenomena, which are just ‘out there’ (Bryman & Bell 2007, p.
402).
Gubrium and Holstein (1997, cited in Bryman and Bell 2007, p. 403) illustrate the four
traditions that arise from the epistemological and ontological positions:
Naturalism:
Provides rich descriptions of people and their interactions in the natural world by
seeking to understand social reality in its own terms, ‘as it really is’.
Ethnomethodology:
Has a naturalistic orientation where researchers attempt to interpret how social
order is created through talk and social interaction.
Emotionalism:
This tradition exhibits a concern of subjectivity and the inner reality on humans,
i.e. gaining access to an inside experience.
Postmodernism:
The emphasis in this tradition is on method talk, sensitive to the different ways
social reality can be constructed - reality is accessed through narratives.

34
3.3.1.1 The qualitative research process Bryman and Bell (2007, p. 406) illustrate the main steps of qualitative research:
Step 1 – General research questions
Step 2 – Selecting relevant sites and subjects
Step 3 – Collection of relevant data
Step 4 – Interpretation of data
Step 5 - Conceptual and theoretical work
Step 6 – Writing up findings and conclusions.
It should be noted that steps four and five may become iterative processes, in that it
may be necessary to develop a tighter specification of the research questions
following step five. This follows with the collection of further data and repeated
interpretation of the data (step four).
3.3.1.2 Qualitative Research Methods The key methods of qualitative research designs are outlined below:
Case Study
Leedy and Ormrod (2005, p. 135) explain that in a case study, a particular individual,
programme or event is studied in depth for a defined period of time. In some
instances, researchers focus on a single case because it is unique or exceptional
qualities can promote understanding or inform practice for similar situations. In other
instances, researchers focus on two or more cases, often cases that are very different
in significant ways, to make comparison, build theories or propose generalisations. A
case study may be useful to investigate how an individual or programme changes
over time, perhaps as the result of certain circumstances or interventions. Either way,
the case study is useful for generating or providing preliminary support for

35
hypotheses. A major disadvantage of the case study method, especially where a
single case is concerned, researchers can’t be sure that the findings are
generalisable to other situations.
Ethnography / Participant observation
In ethnography, the researcher conducts an in depth study of an entire group –
more specifically a group that shares a common culture – in depth. The
researcher studies the group in its natural setting for a lengthy period of time,
often several months or years (Leedy & Ormrod 2005, p. 137). In ethnography
also known as participant observation, the researcher does not observe the
experiences of the individuals involved as a detached outsider, but experiences
them first-hand as an insider. The participant observer thus becomes a member
of the inner circle of the group or event that is being studied (Welman & Kruger
1999, p. 192). Observation includes the daily experiences of the members of a
group, community or organisation. The observer must remain close enough to
see the detail, yet distant enough to remain objective. The focus of this
investigation is on the everyday behaviours e.g. language, interactions, rituals of
the people in the group, with the intention of identifying cultural norms, beliefs,
social structures, and other cultural patterns (Leedy & Ormrod 2005, p. 137).
Qualitative interviewing:
According to Bryman & Bell (2007, p. 472), this method is probably the most
widely employed method in qualitative research, which usually takes the form of
either semi-structured or unstructured interviews. The respondent is afforded the
liberty of discussing reactions, opinions and behaviour in relation to a particular
issue. The role of the interviewer is to provide lead questions and to record the
responses in order to later understand the respondents’ reactions, opinions and
behaviour.
Semi-structured interviews usually begin with a relatively clear focus, where
the researcher has a list of questions on a specific topic to be covered and

36
the interviewee has a large amount of leeway on how to reply (Bryman &
Bell 2007, p. 474).
Unstructured interviews are usually employed in explorative research. The
researcher tries to identify important variables in the particular area. As the
area is generally unfamiliar, it is usually difficult to compile or begin with a
preconceived schedule (Welman & Kruger 1999, p. 196), hence the need to
adopt a less-prescriptive, more iterative approach.
Focus groups
Focus groups typically emphasise a specific theme which is to be explored in
depth. The researcher is concerned with the way in which participants discuss
issues as a group, rather than as individuals i.e. how people will react and
respond to one another’s views and to build a holistic view from these joint
engagements and interactions within the group (Bryman & Bell 2007, p. 510).
Language-based approaches – Conversation and Discourse Analysis:
Conversation Analysis is the fine-grained analysis of talk as it occurs in interaction
in naturally occurring situations. The analysis is concerned with uncovering the
underlying structures of talk during the course of interaction (Bryman & Bell 2007,
p. 531).
Discourse Analysis - This is based on the way we say things, our phrases, our
emphases and rhetoric which all impact on the way in which people perceive and
understand their own and our reality (Bryman & Bell 2007, p. 536).
Qualitative analysis through review of texts and documents:
This method is best suited to situations where the researcher wishes to gain an
impression of the how a program operates without interrupting the programme
itself. The disadvantages of this method are that it is time-consuming, the
information may be incomplete, the researcher needs to be specific about what
they are looking for; and the data is restricted to what is available and is therefore
37
inflexible.
3.3.1.3 Reliability and Validity of Qualitative Research Reliability and validity are important criteria in establishing and assessing the quality
of research as explained below (Bryman & Bell 2007, p. 410):
External reliability
This is the extent or degree to which the study can be replicated. This can be
difficult in qualitative studies since it is impossible to ‘freeze’ a social setting and
the circumstances which exist during the initial study by virtue of the dynamic
nature of the subject matter as well as the participants.
Internal reliability:
This refers to the extent to which more than one observer or member of a
research team agree about what they see and hear, and how they interpret the
results – a similar notion to inter-observer consistency
Internal validity:
This refers to whether or not there is a good match between a researcher’s
observations and the theoretical ideas they develop.
External validity:
This refers to the extent to which findings can be generalized across social
settings.
3.3.1.4 Analysis of the data
One of the main difficulties with qualitative research is that it very rapidly generates a
large, cumbersome database because of its reliance on prose in the form of such
media as field notes, interview transcripts, or documents (Bryman & Bell 2007, p.
579). Researchers become overwhelmed by the sheer volume and richness of the
data and many researchers become captivated by this richness and fail to carry out a
true and reflective analysis of this data.
38
The process of analysis of data is dependent on the method that the researcher
adopts in qualitative research for e.g. the steps involved in the analysis of data in a
case study are organisation of details about the case, categorisation of data,
interpretation of single stances, identification of patterns and synthesis and
generalisations (Welman & Kruger 1999, p. 136).
One of the most notable developments in qualitative research in recent years is the
arrival of computer software that facilitates the analysis of qualitative data. Computer-
Assisted Qualitative Data Analysis Software (‘CAQDAS’) such as NVivo, analyses,
appraises and evaluates the efficacy of qualitative research projects.
3.3.1.5 The critique of qualitative research Bryman and Bell (2007, p. 423) highlight four main areas of criticism of qualitative
approaches:
Qualitative research is too subjective and impressionistic This means that the qualitative findings rely too much on the researcher’s often
unsystematic views about what is significant and important; as well as on the
close personal relationships that are often formed between the researcher and
respondents.
Difficult to replicate
Qualitative research is generally unstructured and often reliant on the researcher’s
ingenuity. As a result thereof, this type of research can be difficult to replicate.
Problems of generalization
This problem relates to the fact that the scope of findings of qualitative
investigations is often restricted for example when research is conducted through
participant observation or unstructured interviews, particularly in the case of small

39
numbers or individuals within a certain organisation or locality, it is difficult to know
how the findings can be generalized to other settings.
Lack of transparency
It is often difficult to establish exactly what the researcher did and how conclusions
were arrived at or inferences drawn.
Qualitative research methods are most useful in allowing the researcher to build
hypotheses and derive explanations for inductive and exploratory research. The
emphasis on qualitative research is on understanding and interpretation, a more
explorative orientation, with a subjective ‘insider view’ where the researcher finds
themselves close to the data. Therefore researchers employ a limited number of
generally more detailed observations, the outcomes of which provide a more in-depth
explanation of the problem (Bryman & Bell 2007, pp. 436-437).
3.3.2 Quantitative Research
Bryman & Bell (2007, p. 28) propose that quantitative research can be construed as a
research strategy that emphasises quantification in the collection and analysis of data
and that it:
entails a deductive approach to the relationship between theory and research, in
which the emphasis is on testing theories;
incorporates the practices and norms of the natural scientific model of positivism
in particular; and
embodies a view of social reality as an external, objective reality.
The deductive process works on the basis of what is already known about a particular
domain and the theoretical considerations of that domain. Theory and the hypothesis
which is deduced from this theory come first and drive the process of gathering data
(Bryman & Bell 2007, p.11).
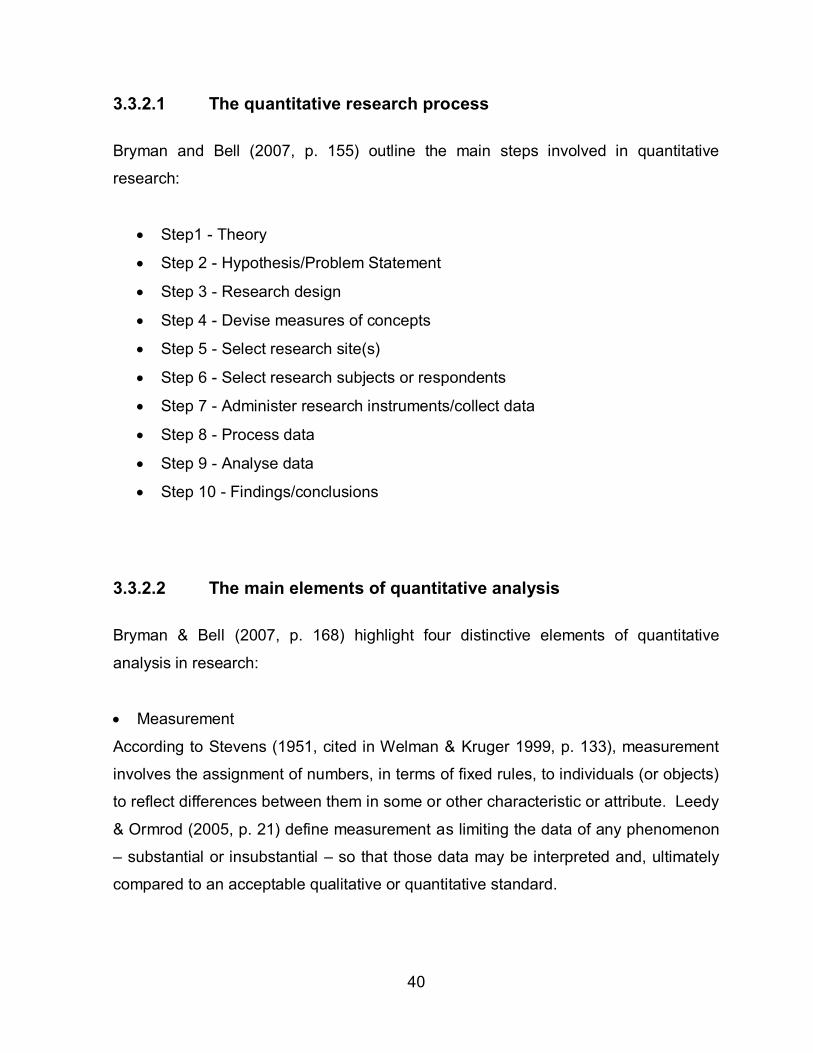
40
3.3.2.1 The quantitative research process Bryman and Bell (2007, p. 155) outline the main steps involved in quantitative
research:
Step1 - Theory
Step 2 - Hypothesis/Problem Statement
Step 3 - Research design
Step 4 - Devise measures of concepts
Step 5 - Select research site(s)
Step 6 - Select research subjects or respondents
Step 7 - Administer research instruments/collect data
Step 8 - Process data
Step 9 - Analyse data
Step 10 - Findings/conclusions
3.3.2.2 The main elements of quantitative analysis
Bryman & Bell (2007, p. 168) highlight four distinctive elements of quantitative
analysis in research:
Measurement
According to Stevens (1951, cited in Welman & Kruger 1999, p. 133), measurement
involves the assignment of numbers, in terms of fixed rules, to individuals (or objects)
to reflect differences between them in some or other characteristic or attribute. Leedy
& Ormrod (2005, p. 21) define measurement as limiting the data of any phenomenon
– substantial or insubstantial – so that those data may be interpreted and, ultimately
compared to an acceptable qualitative or quantitative standard.

41
Causality
Bryman & Bell (2007, p. 168-169) state that quantitative researchers are rarely
concerned about describing how things are, but are keen to explain why things are
the way they are. In search of such explanations, researchers are required to
examine the underlying causes more carefully. In such research the idea of the
dependent and independent variables emerge, which reflect the tendency to think in
terms of cause and effect that is a change in the independent variable will cause an
effect to occur on a dependent variable, or conversely, a change in the dependent
variable takes place as a result of a change in the independent variable.
Generalization
In quantitative research, researchers are concerned with being able to generalise the
findings of their research beyond the confines of the particular contexts in which the
research was conducted. The sample will therefore need to be as representative as
possible in order to infer that the results are not unique to the particular group upon
whom the research was conducted. Probability sampling is the main way through
which researchers seek to generate a representative sample. Probability sampling
allows a researcher to employ tests of statistical significance that allows inferences to
be made about the population from which the sample was selected (Bryman and Bell,
2007).
Replication
Replication refers to the concept of reproducing or repeating a study to see if the
same or comparably similar results are obtained. If there is a failure to replicate a
study, then serious questions will be raised about the validity of those findings.
3.3.2.3 Reliability and validation of Quantitative Research
Reliability is fundamentally concerned with issues of consistency of measures
(Bryman & Bell 2005, pp. 162- 164). The authors further illustrate three prominent
factors involved when considering whether a measure is reliable:

42
Stability
This involves checking whether the measure is stable over time, so that the
researcher can be confident that the results relating to the measure for a
sample of respondents do not fluctuate.
Internal reliability
The key issue with internal reliability is whether or not the indicators that make
up the scale or index are consistent.
Inter-observer consistency:
This refers to activities such as recordings of observations, where more that
one observer is involved. There is the possibility that there is a lack of
consistency of their decisions.
According to Leedy & Ormrod (2005, p. 28) the validity of a measurement instrument,
is the extent to which the instrument measures what it is supposed to measure.
Measurement validity is concerned with whether or not a concept really measures
that concept (Bryman & Bell 2007, p. 164). The authors outline five ways of
assessing validity (pp. 165-166):
Face Validity
With this type of validity, the researcher ensures that the measure reflects the
content of the concept in question.
Concurrent Validity
The researcher seeks to gauge the concurrent validity of the measure, by
using a criterion in which cases are known to differ and that is relevant to the
concept in question. If a lack of correspondence is found, doubt may be cast
on whether or not the measure is really addressing the concept in question.

43
Predictive Validity
Predictive validity is similar to concurrent validity; however in this case, a
researcher uses a future criterion as opposed to a contemporary one.
Construct Validity
With construct validity, the researcher deduces hypotheses from a theory that
is relevant to the concept.
Convergent Validity
The validity of a measure should be gauged by comparing it to measures of
the same concept developed through other methods. The example provided by
the authors Bryman & Bell (2007, p. 165) collecting data through a self-
completion questionnaire and then carrying out a structured interview to
compare the results. This is the running of two data-collection methods
concurrently.
3.3.2.4 Collection of data in quantitative analysis Bryman & Bell (2007, pp. 208-347) offer four main methods of data collection in
quantitative analysis:
Sampling
Sampling is the process of selecting a limited number of respondents from a
population to represent that population. If the sample is chosen by using the
appropriate sampling techniques, and the results are subjected to the proper
statistical validation tests, then the conclusions reached from the sample may be
viewed as being representative of the population as a whole.
Self-Completion questionnaires
In a self-administered questionnaire, the respondents read the written instructions
and provide their answers to the questions on a standard response sheet which forms

44
part of the questionnaire. The data is then retrieved from the questionnaire
responses, recorded and analysed using mathematical and/or statistical techniques.
Structured interviewing
A standard format of an interview is used, with an emphasis on fixed or pre-defined
response categories, using systematic sampling and loading procedures combined
with quantitative measures and statistical analysis. The structured interview is similar
to the self-completion questionnaire, except that the research medium is verbal and is
executed by the researcher in discussion with the respondent.
Structured observation
Structured observation is a method of systematically observing the behaviour of
individuals in terms of a schedule of categories. This allows the behaviour to be
observed and recorded directly in natural surroundings, based on real-life events.
3.3.2.5 Data Analysis Data is collected from respondents using the abovementioned methods and is
subjected to rigorous statistical analysis in order to assess its validity, the correlation
between relationships tested and the extent to which the sample can be relied upon
as a reasonable representation of the population as a whole. Statistical analysis is
conducted using software packages such as the Statistical Package for the Social
Sciences (SPSS).
3.3.2.6 Critique of quantitative analysis
Quantitative analysis has endured a great deal of criticism over the years. The
authors Bryman & Bell (2005, pp. 174-175) provide some insight on this:
Researchers fail to distinguish people and social institutions from the ‘world of
nature’.

45
The measurement process possesses an artificial and spurious sense of
precision and accuracy.
The reliance on data-collection instruments hinders the connection between
research and everyday life.
The analysis of relationships between variables creates a static view of social
life that is independent of people’s lives.
Quantitative analysis can be characterised as a linear series of steps moving from
theory to conclusions through the use of samples that adequately represent a
population. It fundamentally entails the collection of numerical data from respondents
or observations which are analysed statistically or mathematically to draw inferences
on the broader population based on the results obtained from the sample.
3.4 Aim and Objectives of this Study
The aim of this study is to ascertain whether the performance appraisal systems in
place in South African organisations are aligned with the companies’ long term
strategies and whether these performance appraisal systems form part of the integral
process in meeting the organisations’ objectives.
This research study will be examine whether employees are familiar with the
organisation’s mission and vision, whether employees are aware of the significance of
their KPAs in the organisations in which they work and how their KPAs contribute to
the achieving the organisations’ goals.
The objectives of this study are to:
1. Establish whether employees are familiar with the vision and mission of their
company;
2. Determine whether employees understand what are KPA’s;

46
3. Determine whether employees are aware of the significance of their KPAs in
achieving the company's objectives;
4. Draw a comparison between different levels of employees’ awareness of their
KPA’s and its impact on the company objectives; and
5. Determine whether demographics (age, gender, race, level of education and
rank) impacts on employees awareness of KPA’s and company objectives
6. To determine employee perceptions of the performance management process
3.5 Data Collection Strategies
For the purpose of this study, a quantitative research method was used. This took
place in the form of a self-administered questionnaire comprising both open and close
ended questions to be completed by a random sample from different South African
organisations located in KZN, that being employees belonging to different levels of
the organisations. The questions were structured in a manner that did not prejudice
the organisations in any way and respondents were assured of the confidentiality of
this study.
3.6 Research Design and Methods
3.6.1 Description and Purpose
A research design provides a framework for the collection and the analysis of data
(Bryman and Bell 2007, p. 40). Cooper and Schindler (2003) define research design
as the strategy for a study and the plan by which the strategy is to be carried out.
The research design provides the overall structure for the procedures the researcher
follows, the data the researcher collects, and the data analyses the researcher
conducts. Simply put, research design is planning (Leedy and Ormrod 2005, p. 85).
A good research design forms an essential framework for research action and
minimises the risk of collecting irrelevant data. It also ensures that the data collected
meet the research objectives.
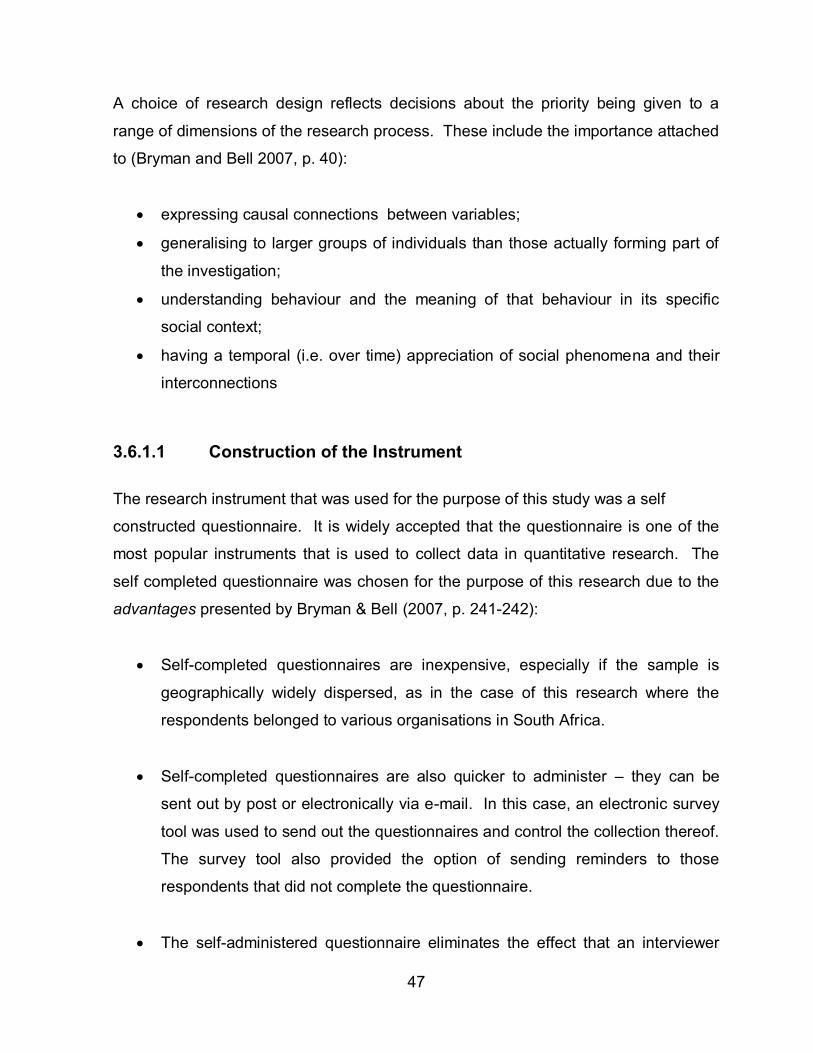
47
A choice of research design reflects decisions about the priority being given to a
range of dimensions of the research process. These include the importance attached
to (Bryman and Bell 2007, p. 40):
expressing causal connections between variables;
generalising to larger groups of individuals than those actually forming part of
the investigation;
understanding behaviour and the meaning of that behaviour in its specific
social context;
having a temporal (i.e. over time) appreciation of social phenomena and their
interconnections
3.6.1.1 Construction of the Instrument
The research instrument that was used for the purpose of this study was a self
constructed questionnaire. It is widely accepted that the questionnaire is one of the
most popular instruments that is used to collect data in quantitative research. The
self completed questionnaire was chosen for the purpose of this research due to the
advantages presented by Bryman & Bell (2007, p. 241-242):
Self-completed questionnaires are inexpensive, especially if the sample is
geographically widely dispersed, as in the case of this research where the
respondents belonged to various organisations in South Africa.
Self-completed questionnaires are also quicker to administer – they can be
sent out by post or electronically via e-mail. In this case, an electronic survey
tool was used to send out the questionnaires and control the collection thereof.
The survey tool also provided the option of sending reminders to those
respondents that did not complete the questionnaire.
The self-administered questionnaire eliminates the effect that an interviewer
48
may have on the answers that respondents provide. This type of questionnaire
also eliminates the problem of interviewers asking questions in a different
order or different ways and is more convenient for respondents as they can
complete the questionnaire at a convenient time and pace.
Although questionnaires seem simple, they can be tricky to construct and administer.
Leedy & Ormrod (2005, p. 190) provide the following twelve guidelines for
constructing a questionnaire:
1. The questionnaire must be concise
2. Simple, clear, unambiguous language must be used
3. Check for unwarranted assumptions implicit in research questions
4. Word questions in ways that do not give clues about preferred or more
desirable responses
5. Check for consistency
6. Determine in advance how responses will be coded
7. Keep the respondents task simple
8. Provide clear instructions
9. Give a rationale for any items whose purpose may be unclear
10. Make the questionnaire attractive and professional looking
11. Conduct a pilot test
12. Scrutinise the almost-final product carefully to make sure it addresses the
research needs
In addition to Leedy and Ormrod’s (2005) guidelines a researcher should also ensure
that the questionnaire is free of spelling errors, is grammatically correct and that a list
of abbreviations is provided should the questionnaire contain any.
The questionnaire for this research was measured against the recommendations
made by Leedy and Omrod (2005) to ensure that is was concise, easy to understand,
clear instructions were provided and a pilot test was conducted. The research

49
questionnaire comprised four sections, the first of which requested consent from the
respondent; the second provided a brief explanation of the purpose of the research
the respondent’s role in the research and to thank the respondent for their
participation in the research. The third section contained demographic questions and
the fourth section contained detailed questions pertaining to the objectives of the
research.
The questionnaire comprised thirty one questions which contained “simple,
unambiguous language” as recommended by Leedy & Ormrod (2005, p. 190). There
were twenty eight closed ended questions and three were open ended. This was
done with the purpose of easing the burden of a self completed questionnaire.
The disadvantages of using a self-completed questionnaire in research as presented
by Bryman & Bell (2007, p. 242 – 243) are:
Some of the disadvantages of a self-administered questionnaire are that it
cannot prompt the respondent for an answer if the respondent is experiencing
difficulty answering a particular question/s.
There is also no opportunity to probe respondents to elaborate on an answer.
Probing can be very important when open-ended questions are asked and
interviewers are often trained to get more information from respondents. It is
difficult to ask a lot of questions in a self-administered questionnaire, there is a
greater risk of missing data and the response rate is much lower.
3.6.1.2 Recruitment of Study Participants
The quality of the population and representatives of the samples are important
determinants for the results of a survey. Leedy & Ormrod (2005, p. 198) state that
the results obtained from a sample can be used to make generalisations on the

50
population only if the sample is truly representative of the population.
For the purposes of this study, the randomly chosen participants occupied different
levels in their organisational hierarchies. It was necessary to extend this research to
the different levels in the hierarchy as one of the objectives of this research was to
ascertain the whether the employees at different levels in the organisation were
familiar with the long-term strategy/ies of the organisation. The sample was truly
representative of the population as this research was only extended to those
organisations in South Africa that make use of a Performance Management System
and the respondents were actually undergoing performance appraisal in their
organisations.
The basic rule to the sample size is “the larger the sample, the better” (Leedy &
Ormrod 2005, p. 207). Welman & Kruger (1999, p. 64) provide a few guidelines when
calculating the sample size:
When determining the sample size, the researcher must bear in mind the size
of the population;
The desired sample size does not depend on the population only, but also on
the variance (heterogeneity of the variable). As a general rule, the larger the
variance of the variable, the larger the sample which is required;
If each stratum of a highly heterogeneous population is relatively homogenous,
a relatively smaller stratified sample than that required for a random sample
may be sufficient. If the population is markedly heterogeneous, a larger
sample will be necessary than if the population is fairly homogenous; and
In determining sample size, the researcher must bear in mind the number of
units of analysis from whom he/she eventually obtain usable data may be
much smaller than the number which was originally drawn.
The questionnaires for this research were submitted to 155 respondents. A total of
51 completed questionnaires were returned over a period of 8 weeks. Only 33% of

51
the sample completed the questionnaires – this reinforces the low response rate
disadvantage of administering a self-completed questionnaire as stipulated earlier
(Bryman and Bell, 2007).
3.6.2 Pretesting and Validation
Pretesting of the research questionnaire is recommended to test for errors, ambiguity,
accuracy and to identify the average time taken to complete the questionnaire.
Pretesting also allows the researcher to determine whether the questions actually
provide answers to the objectives of the research. Reliability is fundamentally
concerned with issues of consistency of measures and the question of whether the
results of a study are repeatable and “validity is concerned with the integrity of the
conclusions that are generated from a piece of research” (Bryman and Bell 2007, p.
41).
Due to the fact that this research was extended to employees working at different
organisations, it was not possible to conduct a pilot study on a very small sample.
The questionnaire comprised questions that were fairly simple and easy to
understand – it was therefore not necessary to have the questionnaire tested on
many respondents. The test questionnaires were sent to two MBA students, who
pointed out spelling errors, ambiguity of questions and lack of clarity on certain
abbreviations used in the questionnaire. They also confirmed that the questions were
directly seeking answers to the objectives and that the average time taken to
complete the questionnaire was fifteen minutes. Spelling errors, ambiguity of
questions and abbreviations were corrected on the research questionnaire.
3.6.3 Administration of the Questionnaire
The questionnaire was administered to respondents electronically using Survey
Monkey, which is survey software that enables the user to create professional online
surveys easily and quickly. Survey Monkey allows the user to design surveys, collect
52
responses and analyse data. The questionnaire comprised the consent letter, a
covering letter illustrating the purpose of the research and the respondents’ role in
this research; as well as the research questions. This electronic method provided
confirmation that the questionnaire was delivered to the respondents; and where
questionnaires were not answered, reminders were sent to the respondents.
3.7 Analysis of the Data
The questionnaires were collected on Survey Monkey, where a database was
constructed and then exported to the SPSS software where the data was cleaned and
analysed. The data was analysed using the following tests: Factor Analysis,
Cronbach’s Alpha, One sample Chi Square, Normality Test , Mann-Whitney T Test,
Kruskal-Wallis Analysis of Variance (ANOVA).
3.8 Summary
The quantitative method of research was adopted for this study as it is a deductive
approach to research. The aim of this study was to test the theory that performance
management systems that are correctly implemented enable organisations to meet
their strategic objectives. The quantitative method was also beneficial to this study in
that it reached a wider audience from different companies using different performance
management systems. The qualitative approach would have been a more focussed
one therefore limiting the number of respondents participating in this study.
This specific methodology was adopted with the intention of completing the research
in the simplest, uncomplicated manner; and in the quickest possible time. The
questionnaire was used to ease the burden of interviewing respondents face to face,
as well as to allow the respondents the luxury of completing the questionnaire within a
time frame and to complete it in the comfort of privacy. The use of the questionnaire
also ensured the speed of data collection, and eased the process of collating and
analysing the data.

53
The next chapter presents the data collected and a detailed analysis of the results
obtained.
.

54
CHAPTER FOUR
Presentation of Results
4.1 Introduction This chapter is the summary of the findings of this study presented in the form of
descriptive and inferential statistics. The data collected from the respondents as per
the research methodology discussed in the previous chapter is presented statistically
to provide a description of the sample used in this research and to illustrate whether
the objectives of this research study have been met by analysing the responses to the
research questions.
4.2 Descriptive Statistics of the Independent Variables
The demographic details collected from the questionnaire were age, gender, level of
education, race, ownership of organisation and role in the organisation. The total
number of completed questionnaires received was 51, out of 155 that were distributed
electronically. The return rate for questionnaires was 33%. All tests were conducted
at a significance level of 95%.
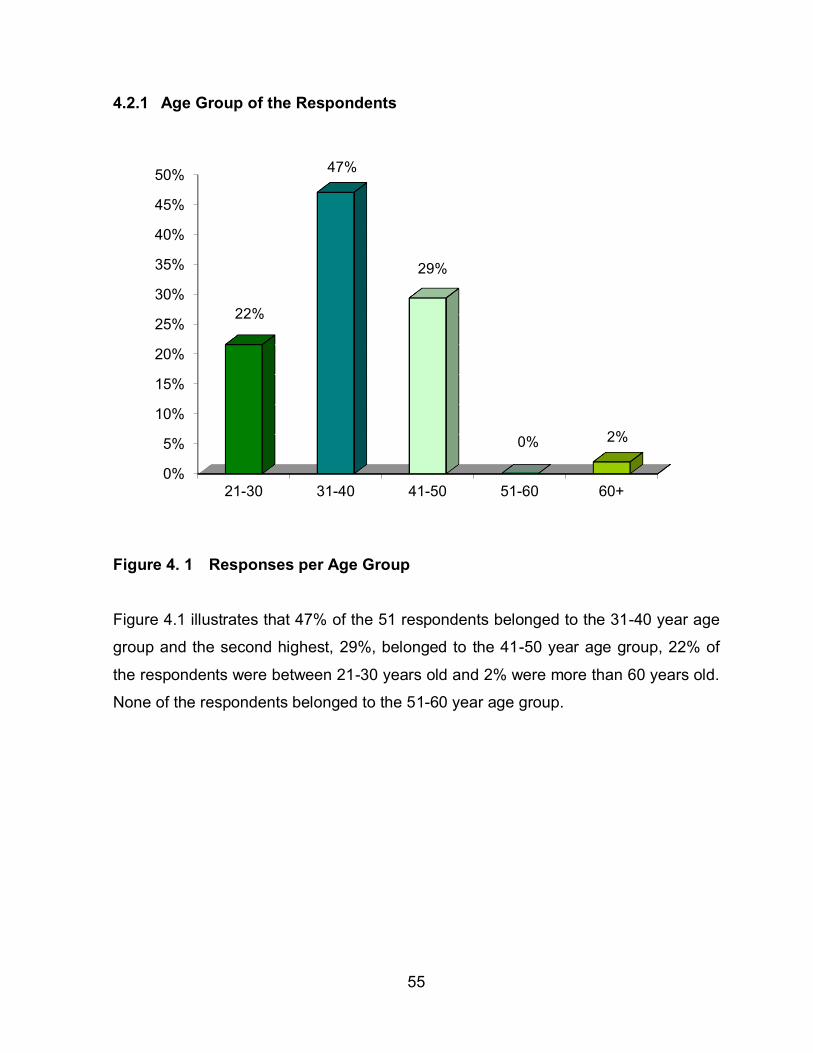
55
4.2.1 Age Group of the Respondents
Figure 4. 1 Responses per Age Group
Figure 4.1 illustrates that 47% of the 51 respondents belonged to the 31-40 year age
group and the second highest, 29%, belonged to the 41-50 year age group, 22% of
the respondents were between 21-30 years old and 2% were more than 60 years old.
None of the respondents belonged to the 51-60 year age group.
0%
5%
10%
15%
20%
25%
30%
35%
40%
45%
50%
21-30 31-40 41-50 51-60 60+
22%
47%
29%
0% 2%

56
4.2.2 Gender of the Respondents
Figure 4. 2 Responses by Gender
There was no significant difference between the number of male and female
respondents; male being in the majority, 55%; and females comprising 45% of the
respondents.
0%
10%
20%
30%
40%
50%
60%
Male Female
55%
45%

57
4.2.3 Level of Education of the Respondents
Level of Education
Percentage of Respondents
Matric (Grade 12)
18%
Diploma
27%
Degree
24%
Post Graduate Qualification
31%
Table 4. 1 Educational Qualification
It is evident from Table 4.1 that the majority of respondents, 31%, had a post
graduate qualification, 27% had diplomas, 24% had degrees and 18% possessed a
grade 12 qualification. It is significant to note that, in total, 82% of the respondents
had a tertiary qualification.

58
4.2.4 Race Group of the Respondents
Figure 4. 3 Percentage of respondents by Race Group
It is evident from Figure 4.3 that the least number of respondents were Coloured
(8%), while the highest were Indian (59%), 20% of the respondents were White and
14% were Black.
0%
10%
20%
30%
40%
50%
60%
Black Coloured Indian White Other
14%
8%
59%
20%
0%
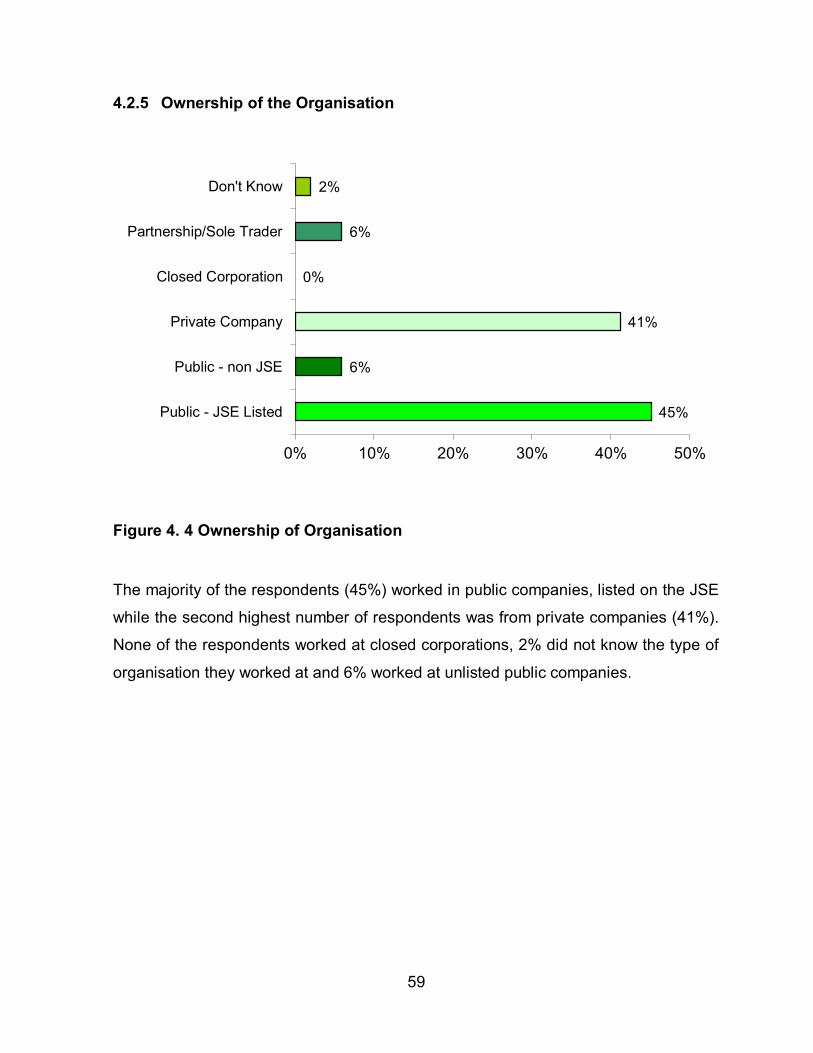
59
4.2.5 Ownership of the Organisation
Figure 4. 4 Ownership of Organisation
The majority of the respondents (45%) worked in public companies, listed on the JSE
while the second highest number of respondents was from private companies (41%).
None of the respondents worked at closed corporations, 2% did not know the type of
organisation they worked at and 6% worked at unlisted public companies.
45%
6%
41%
0%
6%
2%
0% 10% 20% 30% 40% 50%
Public - JSE Listed
Public - non JSE
Private Company
Closed Corporation
Partnership/Sole Trader
Don't Know

60
4.2.6 Role in the Organisation
Role in the Organisation
Percentage of Respondents
Executive Management
10%
Senior Management
23%
Middle Management
37%
Administration
12%
Operational
18%
Table 4. 2 Positions in the Organisation
Table 4.2 illustrates that 37% of the respondents belonged to Middle Management,
while the least (10%) were Executive Managers. Only 12% of the respondents
performed Administrative duties and 18% worked in an Operational capacity.

61
4.3 Descriptive Statistics of the Dependent Variables Descriptive statistics is concerned with the presentation of data using frequency and
central tendency techniques. A four-point Likert scale was used to measure the
responses to the questions, i.e. Strongly Disagree, Agree, Disagree and Strongly
Disagree. One-sample chi-square was computed to compare the differences
between observed and expected proportions for relevant questions for the likert scale
questions. The purpose was to determine whether the proportion of responses in
each category differed significantly. The data will be presented in the form of tables
and graphs. 4.3.1 Objective 1: To establish whether employees are familiar with the vision and
mission of the company.
4.3.1.1 Familiarity with the mission and vision of organisation
Figure 4. 5 Employees familiar with the mission and vision of their organisation
0%
10%
20%
30%
40%
50%
60%
Strongly Agree Agree Disagree StronglyDisagree
40%
52%
4% 4%

62
Figure 4.5 reflects that a large proportion of the respondents indicated that they
strongly agreed or agreed that they were familiar with the mission and vision of their
organisations as compared with those who disagreed or strongly disagreed - The
figure clearly illustrates that 92% of the respondents were in agreement (40%
Strongly Agree and 52% Agree), while 8% were in disagreement (4% Disagree and
4% Strongly Disagree).
4.3.2 Objective 2: To determine whether employees understand what are KPAs.
4.3.2.1 Information and understanding of the meaning and relevance of KPAs
Figure 4. 6 Employee understanding of the meaning and relevance of KPAs
Sixty one percent of the respondents agreed that they were clearly informed of, and
understood the meaning and relevance of their key performance areas the first time it
was introduced to them. Twenty two percent of the respondents disagreed (14%
Disagree and 8% Strongly Disagree) with this statement.
0%
10%
20%
30%
40%
50%
60%
70%
StronglyAgree
Agree Disagree StronglyDisagree
18%
61%
14%
8%

63
4.3.2.2 Importance of Key Performance Areas concepts
KPA concepts Percentage
KPAs are goals of the organisation based on predefined criteria
78%
KPAs add value to aspects of the business that cannot be quantified, such as employee satisfaction and development
65%
KPAs allows goals to be observed, met and exceeded
61%
KPAs are used to evaluate the success of the business and plan for the future
49%
KPAs are critical to the realisation of the long term strategy of the business
4%
Table 4. 3 Employee understanding of the concepts of Key Performance Areas
Table 4.3 illustrates the respondents’ multiple responses to their understanding of the
important concepts of Key Performance Areas. The majority of the respondents opted
for the first, second and third statements as important concepts of KPAs, while only
49% of the respondents believed that KPAs are used to evaluate the success of the
business and plan for the future. It is significant to note that only 4% of the
respondents felt that KPAs are critical to the realisation of the long-term strategy of
the business.

64
4.3.2.3 Need for KPA reviews
Reason for KPA reviews Percentage Measure my performance over a stipulated period of time
61%
To measure my performance and discuss my Individual Development Plan
61%
To measure my performance and determine my annual increase
55%
To measure my performance in relation to the performance of my business unit
2%
Table 4. 4 Employee understanding of the reasons for KPA reviews
The above table indicates that the majority of the respondents were in agreement with
the first three options to this multiple response question. A minor 2% were in
agreement that KPA reviews were conducted to measure performance in relation to
the performance of their business units.

65
4.3.3 Objective 3 To determine whether employees are aware of the significance of
their KPAs in achieving the company's objectives.
4.3.3.1 Contribution of individual KPAs to achieving the short and long-term objectives of the organisation
Figure 4. 7 Employee perceptions on whether their Key Performance Areas contribute to realising the strategy of the organisation
Figure 4.7 illustrates that 66% of the respondents agreed that their KPAs were
significant to the realisation of the strategy of their organisations. Twenty eight
percent of the respondents strongly agreed to this, while 6% of the respondents
disagreed that their KPAs contributed to the realisation of the strategy of the
organisation.
0%
10%
20%
30%
40%
50%
60%
70%
Strongly Agree Agree Disagree StronglyDisagree
28%
66%
4% 2%
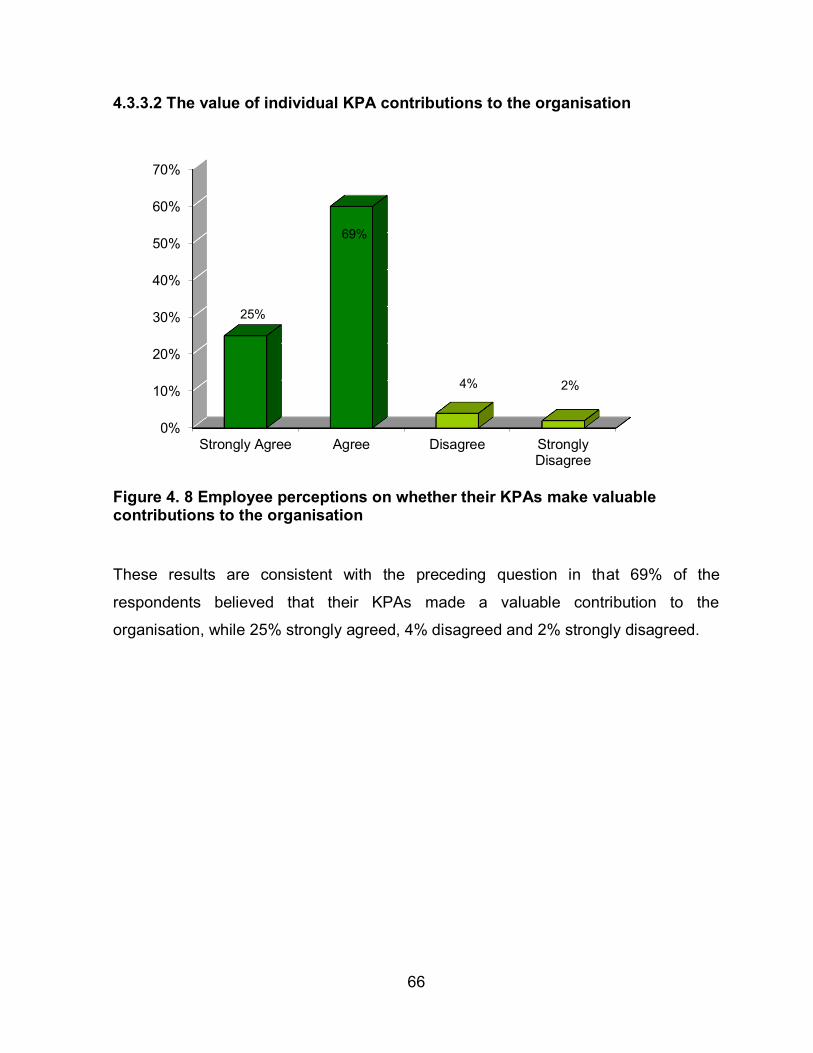
66
4.3.3.2 The value of individual KPA contributions to the organisation
Figure 4. 8 Employee perceptions on whether their KPAs make valuable contributions to the organisation
These results are consistent with the preceding question in that 69% of the
respondents believed that their KPAs made a valuable contribution to the
organisation, while 25% strongly agreed, 4% disagreed and 2% strongly disagreed.
0%
10%
20%
30%
40%
50%
60%
70%
Strongly Agree Agree Disagree StronglyDisagree
25%
69%
4% 2%
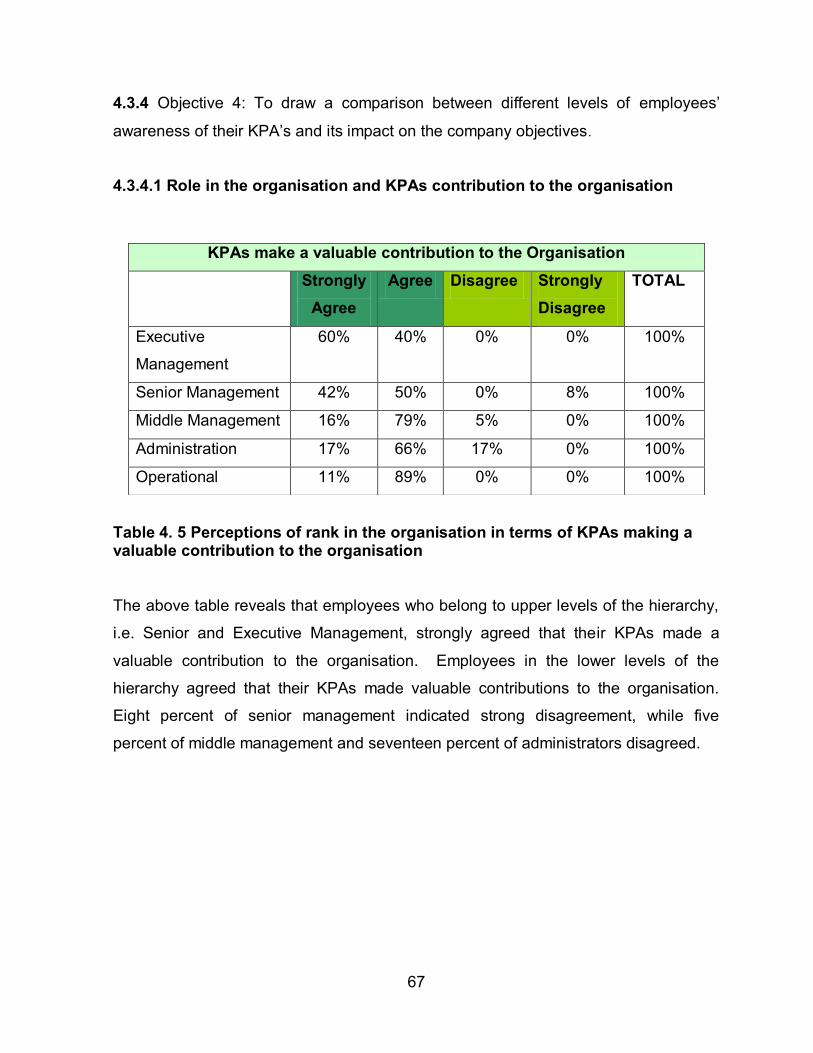
67
4.3.4 Objective 4: To draw a comparison between different levels of employees’
awareness of their KPA’s and its impact on the company objectives.
4.3.4.1 Role in the organisation and KPAs contribution to the organisation
Table 4. 5 Perceptions of rank in the organisation in terms of KPAs making a valuable contribution to the organisation
The above table reveals that employees who belong to upper levels of the hierarchy,
i.e. Senior and Executive Management, strongly agreed that their KPAs made a
valuable contribution to the organisation. Employees in the lower levels of the
hierarchy agreed that their KPAs made valuable contributions to the organisation.
Eight percent of senior management indicated strong disagreement, while five
percent of middle management and seventeen percent of administrators disagreed.
KPAs make a valuable contribution to the Organisation
Strongly Agree
Agree Disagree Strongly Disagree
TOTAL
Executive
Management
60% 40% 0% 0% 100%
Senior Management 42% 50% 0% 8% 100%
Middle Management 16% 79% 5% 0% 100%
Administration 17% 66% 17% 0% 100%
Operational 11% 89% 0% 0% 100%

68
4.3.4.2 Role in the organisation and KPAs contribution to achieving the short and long-term objectives of the organisation.
Table 4. 6 Perceptions of rank in the organisation with respect to achieving the objectives of the organisation
The results in the Table 4.6 are skewed heavily towards agreement. None of the
respondents from any of the ranks disagreed that their KPAs contributed to achieving
the goals of the organisation.
KPAs contribute to achieving the goals of the Organisation
Strongly Agree
Agree Disagree Strongly Disagree
TOTAL
Executive Management 60% 40% 0% 0% 100%
Senior Management 50% 50% 0% 0% 100%
Middle Management 26% 74% 0% 0% 100%
Administration 50% 50% 0% 0% 100%
Operational 0% 100% 0% 0% 100%
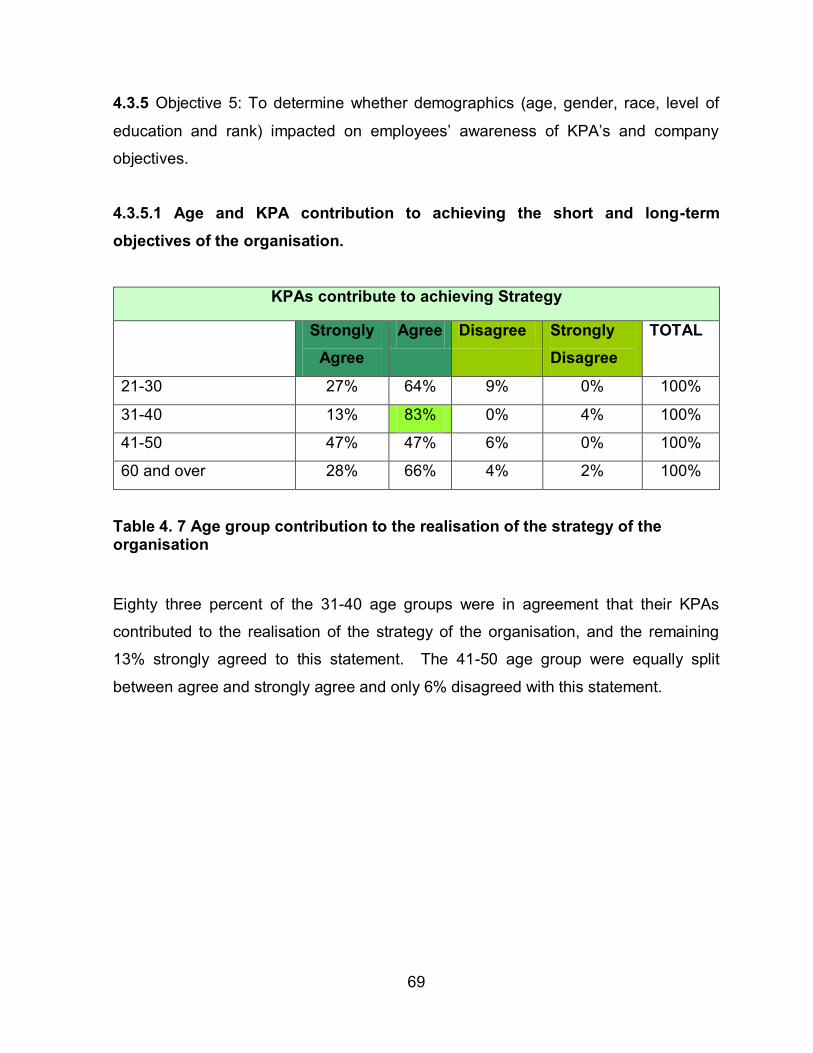
69
4.3.5 Objective 5: To determine whether demographics (age, gender, race, level of
education and rank) impacted on employees’ awareness of KPA’s and company
objectives.
4.3.5.1 Age and KPA contribution to achieving the short and long-term objectives of the organisation.
KPAs contribute to achieving Strategy
Strongly Agree
Agree Disagree Strongly Disagree
TOTAL
21-30 27% 64% 9% 0% 100%
31-40 13% 83% 0% 4% 100%
41-50 47% 47% 6% 0% 100%
60 and over 28% 66% 4% 2% 100%
Table 4. 7 Age group contribution to the realisation of the strategy of the organisation
Eighty three percent of the 31-40 age groups were in agreement that their KPAs
contributed to the realisation of the strategy of the organisation, and the remaining
13% strongly agreed to this statement. The 41-50 age group were equally split
between agree and strongly agree and only 6% disagreed with this statement.

70
4.3.5.2 Gender and KPA contribution to achieving the short and long-term objectives of the organisation
KPAs contribute to Strategy
Strongly Agree
Agree Disagree Strongly Disagree
TOTAL
Male 22% 70% 4% 4% 100%
Female 35% 61% 4% 0% 100%
Table 4.8 Gender contribution to the realisation of the strategy of the organisation
The table reveals that 92% of the male respondents were in agreement (22% strongly
agreed and 70% agreed) and the remaining 8% were split equally between disagree
and strongly disagree. The female respondents exhibited much more confidence that
their KPAs contributed to the organisations’ strategy – 96% of female respondents
were in agreement (35% strongly agreed and 61% agreed) while a minor 4%
disagreed with this statement.

71
4.3.5.3 Race and KPA contribution to achieving the short and long-term objectives of the organisation.
KPAs contribute to achieving Strategy
Strongly Agree
Agree Disagree Strongly Disagree
TOTAL
Black 14% 72% 14% 0% 100%
Coloured 25% 75% 0% 0% 100%
Indian 32% 62% 3% 3% 100%
White 30% 70% 0% 0% 100%
Table 4.9 Race group contribution to the realisation of the strategy of the organisation
Seventy five percent Coloured, seventy two percent Black, seventy percent white and
sixty two percent Indian respondents agreed that their KPAs contributed to the
company strategy. The results revealed that Black (14%) and Indian (3%)
respondents indicated disagreement while a further 3% Indian strongly disagreed.

72
4.3.5.4 Level of Education and KPA contribution to achieving the short and long-term objectives of the organisation.
KPAs contribute to achieving Strategy
Strongly Agree
Agree Disagree Strongly Disagree
TOTAL
Matric (Grade 12) 11% 78% 11% 0% 100%
Diploma 15% 77% 8% 0% 100%
Degree 17% 75% 0% 8% 100%
Post graduate
qualification
56% 44% 0% 0% 100%
Table 4. 10 Academic contribution to the realisation of the strategy of the organisation
There were no disagreements from the Post Graduate respondents. A minor 27% of
respondents indicated disagreement with this question. The majority of the
respondents, 78% Grade 12, 77% Diploma, 75% degree and 44% Post Graduates
agreed that their Key Performance Areas contributed to the strategy of the
organisation.

73
4.3.5.5 Role in the organisation and KPAs contribution to achieving the short and long-term objectives of the organisation.
KPAs contribute to achieving the goals of the Organisation
Strongly Agree
Agree Disagree Strongly Disagree
TOTAL
Executive Management 80% 20% 0% 0% 100%
Senior Management 50% 50% 0% 0% 100%
Middle Management 17% 78% 5% 0% 100%
Administration 0% 83% 0% 17% 100%
Operational 11% 78% 11% 0% 100%
Table 4. 11 Contribution of rank to the strategy of the organisation
Table 4.11 indicates that the responses of the Executive Management were split
between 80% who strongly agreed and 20% who agreed. There was no
disagreement from the Senior Managers – 50% strongly agreed and 50% agreed.
Disagreement with this question came from respondents who belonged to the lower
ranks –17% of Administrators strongly disagreed, while 5% Middle Management and
11% Operations disagreed.

74
4.3.6 Objective 6: To determine employee perceptions of the performance
management process.
4.3.6.1 Understanding the meaning and relevance of KPAs.
Figure 4. 9 Employees informed of the Performance Management process
Forty nine percent of the respondents agreed that they were adequately informed of
and understood the performance management system the first time it was introduced
to them. Twenty nine percent strongly agreed to this. Twenty two percent of the
respondents disagreed that they were adequately informed of and understood the PM
process the first time it was introduced to them.
0%
10%
20%
30%
40%
50%
StronglyAgree
Agree Disagree StronglyDisagree
29%
49%
16%
6%
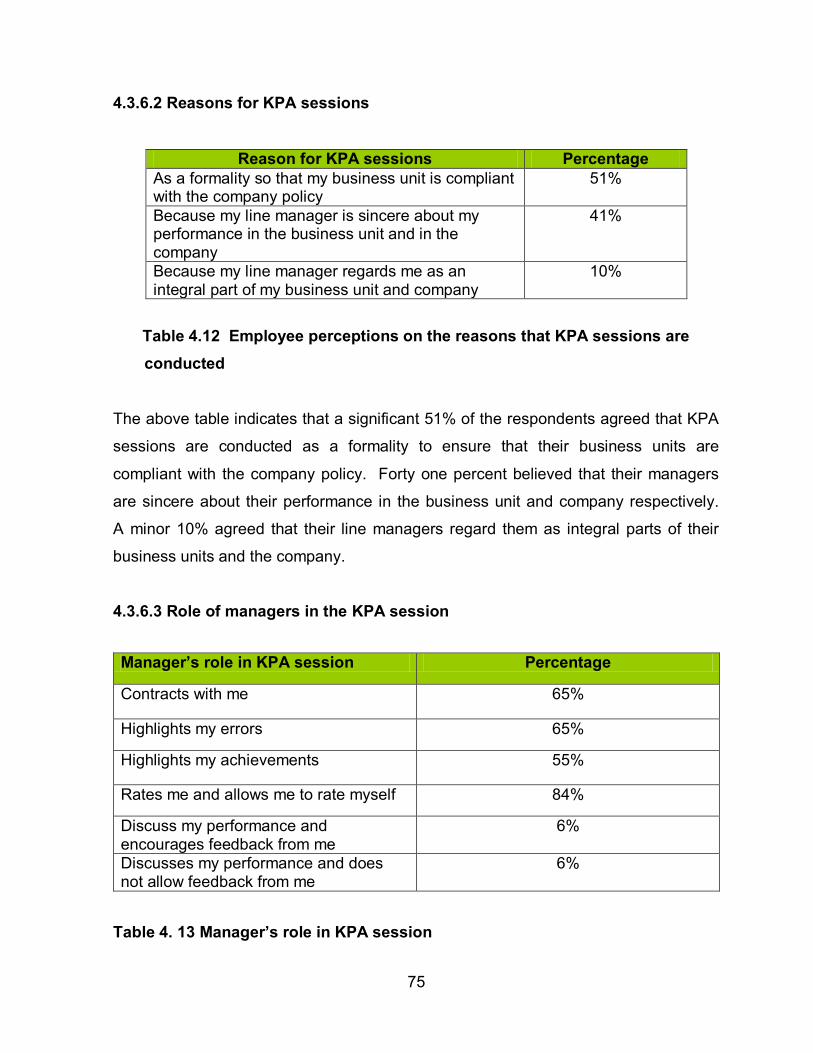
75
4.3.6.2 Reasons for KPA sessions
Reason for KPA sessions Percentage As a formality so that my business unit is compliant with the company policy
51%
Because my line manager is sincere about my performance in the business unit and in the company
41%
Because my line manager regards me as an integral part of my business unit and company
10%
Table 4.12 Employee perceptions on the reasons that KPA sessions are conducted The above table indicates that a significant 51% of the respondents agreed that KPA
sessions are conducted as a formality to ensure that their business units are
compliant with the company policy. Forty one percent believed that their managers
are sincere about their performance in the business unit and company respectively.
A minor 10% agreed that their line managers regard them as integral parts of their
business units and the company.
4.3.6.3 Role of managers in the KPA session
Manager’s role in KPA session Percentage
Contracts with me 65%
Highlights my errors 65%
Highlights my achievements 55%
Rates me and allows me to rate myself 84%
Discuss my performance and encourages feedback from me
6%
Discusses my performance and does not allow feedback from me
6%
Table 4. 13 Manager’s role in KPA session

76
Responses to the above question placed managers in a positive light in respect of
their roles in KPA sessions. It is significant to note that 55% of respondents agreed
that their managers highlighted their achievements while 65% of the respondents
agreed that their managers highlighted their errors.
4.3.6.4 Managers discuss individual strengths that contribute to achieving the objectives of the organisation
Figure 4.10 Line Manager discusses individual’s strengths during KPA sessions
The results as illustrated in Figure 4.10 reveal that the majority of Line Managers
(78%) discussed their subordinates’ strengths during KPA sessions.
0%
10%
20%
30%
40%
50%
60%
70%
80%
Yes No
78%
22%

77
4.3.6.5 Manager discussion of weaknesses that inhibit the organisation from achieving its objectives
Figure 4. 11 Line Manager discusses weaknesses during KPA sessions
Figure 4.11 indicates that 80% of the respondents agreed that their Line Managers
discussed their weaknesses during their KPA sessions.
0%
10%
20%
30%
40%
50%
60%
70%
80%
Yes No
80%
20%

78
4.3.6.6 Attitudes of employees toward KPAs and the Performance Management system
Figure 4. 12 Employee attitudes toward Performance Management Systems are negative
Thirty five percent of the respondents agreed that employees had a negative attitude
toward Key Performance Areas and the Performance Management System in their
organisations, while 65% of the respondents disagreed that employees had a
negative attitude.
0%
10%
20%
30%
40%
50%
60%
70%
True False
35%
65%

79
4.3.6.7 KPAs and Performance Management systems are a fair method of assessing performance
Figure 4. 13 Employee perceptions on fairness of KPA PM System at their organisations
The majority of the respondents, 80% in total, agreed that the Performance
Management Systems at their workplaces were a fair method of assessment. Twenty
percent of respondents disagreed with the Performance Management systems at
their workplaces.
0%
10%
20%
30%
40%
50%
60%
70%
StronglyAgree
Agree Disagree StronglyDisagree
18%
62%
16%
4%

80
4.3.6.8 KPA assessments have impacted positively on individuals’ performance at work
Figure 4. 14 Employee perceptions on whether KPA assessments have impacted positive on their work performance
Nineteen percent of the respondents disagree that their KPA Assessments have a
positive impact on their work performance.
4.4 Summary This chapter presented the findings of the research on the basis of the analysed data.
The next chapter will present a discussion as well as critique on these findings.
0%
10%
20%
30%
40%
50%
60%
70%
StronglyAgree
Agree Disagree StronglyDisagree
18%
63%
12% 7%
Perc
enta
ge

81
CHAPTER FIVE
Discussion
5.1 Introduction
This chapter provides a discussion of the empirical findings presented in Chapter
Four, linking them to the literature review in Chapter Two. The empirical results for
the six objectives will be looked at, examining commonalities, analogies and
differences. The primary objective of this study was to determine employee
perceptions of the link between key performance areas and the organisational
strategy. The results for each objective based on the answers from the questionnaire
will be discussed.
5.2 Demographics
The frequency analysis of the independent variables in Section 4.2 of chapter four,
indicates that the majority of respondents were Indian (59%), followed by White
(20%). Males accounted for fifty five percent of the population, and the majority of the
respondents belonged to the 31-40 age group.
The highest number of respondents worked in public companies listed on the JSE,
belonged to middle management in their organisational hierarchy and were in
possession of post graduate qualifications.
5.3 Findings of the Study
The objective of this study is to illustrate the collective effect that employees’
individual Key Performance Areas have on realising the strategy of organisations.
The literature review presents this case through a series of studies affirming that the
Performance Appraisal process is key to the strategic drive of the organisation and if
properly implemented will result in a synergetic entity. The review of literature states

82
further that when implementing a process of this calibre it must be directly aligned to
the strategy of the organisation and key performance areas, objectives and targets
must be clearly defined. In addition, the performance management system must be
heavily consulted with the employees in the company as it is only through buy-in that
the performance management system will be sustainable (Cummings: 2005).
5.3.1 Objective 1: To establish whether employees are familiar with the vision and mission of the company
As previously indicated in Chapter Two, an organisation’s shared vision provides
clear direction to its desired future position and its strategies define or determine the
manner in which this shared vision will be accomplished. It is imperative that an
organisation’s vision be translated into strategies and actions, which is quantified by
performance measures that determine whether the vision is accomplished. Ninety-
two percent of the respondents positively responded to this question, which means
that this sample was well versed on the strategic direction of their organisations. The
inference here is consistent with Kaplan and Nortons’ (2005, p. 72) position that
effective strategy execution requires communicating corporate strategy, ensuring that
enterprise-level plans are translated into the plans of various units and departments,
executing strategic initiatives to deliver on the grand plan; and aligning employees’
competency development plans and their personal goals and incentives with strategic
objectives.
5.3.2 Objective 2: To determine whether employees understand what are KPAs.
The data for the questions relating to whether employees understand what Key
Performance Areas are, indicate that sixty one percent of the sample agreed that they
were clearly informed of and understood the meaning and relevance of key
performance areas the first time it was introduced to them. Redman and Wilkinson

83
(2001), cite Bevan and Thompson (1991), who describe performance management
as a shared vision of the organisations’ strategy communicated via a mission
statement to all employees. The response to this statement indicates a gap of thirty
nine percent meaning that not all organisations are clearly communicating their
strategic drive as it is recommended.
Seventy eight percent of the respondents agreed that KPAs are goals of the
organisation based on predefined criteria and sixty one percent of the respondents
agreed that KPAs allow goals to be observed, met and exceeded. The responses
here reveal a gap in the implementation of the performance management systems at
the different organisations and that the objectives of these organisations were not as
transparent and communicated effectively. According to Arnold (1987, cited in Letza,
1996), establishing a link between corporate objectives and the personal objectives of
managers and staff is vital. Measures must be used in context and they must be
compared against a standard of expected performance.
Only forty nine percent of the respondents agreed that KPAs are used to evaluate the
success of the business and plans for the future. Lynch and Cross (1991, cited in
Neely 1999) stated that the problem with performance measures used in many
organisations is that they are rarely integrated with one another or aligned to the
business processes.
Further analysis indicates that only four percent of the respondents believed that
KPAs are critical to the realisation of the long-term strategy of the business. These
responses are inconsistent with the responses to Objective 1, where ninety five
percent of the respondents indicated that they are well informed of and clearly
understood the strategy of their organisations and the role it plays in assisting the
organisation to meet its goals. This is also in contrast with question 19 where a
collective of ninety four percent of the respondents believed that their KPAs contribute
to the short & long term strategies of the organisation.

84
5.3.3 Objective 3: To determine whether employees are aware of the significance of their KPAs in achieving the company's objectives
The analysis of the data for the questions relating to this objective illustrate that sixty
six percent of the respondents agreed and twenty eight percent of the respondents
strongly agreed that their KPAs contributed to achieving the short and long term
objectives of their organisations. Sixty nine percent of the respondents agreed and
twenty five percent strongly agreed that their KPAs made a valuable contribution to
the organisation. The results show that these employees are confident that they
individually contribute to achieving the long and short term objectives of the
organisation and they were fully aware that their contribution is a valuable one.
These responses correspond with the responses to objective 1 which confirmed that
the respondents are well versed on their organisations’ strategic goals. Kaplan and
Norton (2005, p. 72) posited that effective strategy execution requires the alignment
of employees’ competency development plans, their personal goals and incentives
with the strategic objectives of their organisations.
5.3.4 Objective 4: To draw a comparison between different levels of employees’ awareness of their KPA’s and its impact on the company objectives.
The data for the questions relating to this objective revealed that those respondents
that belonged to Senior and Executive Management strongly agreed that their key
performance areas made a valuable contribution. There was no disagreement from
Executive Management and Operational Roles.’ There was, however, a significant 30
percent disagreement to the statement that “KPAs make a valuable contribution to the
organisation”, particularly amongst the administrators (17%), middle management
(5%) and some senior management who strongly disagreed to this (8%).
The disagreement that is evident among the administrators and middle management
is in contrast with the Cross and Lynch’s (1989, cited in Rouse and Putterill: 2003)

85
performance prism framework that strategic objectives must flow from the top of the
hierarchy to the base. This means that every employee, right down to those that
occupy the base of the hierarchy, must be clearly informed of and understand fully
what their key performance areas are and how they help a company to realise its
objectives.
5.3.5 Objective 5: To determine whether demographics (age, gender, race, level of education and rank) impacts on employees’ awareness of KPA’s and company objectives.
The analysis of the demographic details revealed the following:
Age: The 31-40 (83%) age group were most confident that they contributed to the
organisations goals.
Gender: Collectively females (96%) were most confident that they contributed to the
organisations strategic goals. Men were not too far behind (92%).
Race: There was confidence across all race groups that they made a meaningful
contribution to their organisations, the White race group (100%) however exhibiting
the most confidence.
Level of Education: The post graduates (100%) were the only respondents that
agreed completely that they contributed to the long and short term objectives of the
organisation. The respondents who held degrees and diplomas reflected unanimity in
the responses, while that grade 12 displayed the highest disagreement.
The results to these questions reveal that demographics and employee awareness of
Key Performance Areas and their contribution to the strategy are well correlated.
There is not enough research on the impact that demographic factors have on the link
between key performance areas and organisational strategy. The results from this

86
study however reveal there is no significant impact.
5.3.6 Objective 6: To determine employee perceptions of the performance management process
Analysis of this objective reveals that only forty nine percent of the respondents
understood the meaning and relevance of the performance management system the
first time it was introduced to them. This contrasts with the response to the statement
“I was clearly informed of and understood the meaning and relevance of key
performance areas the first time it was introduced to me” to which seventy nine
percent of the respondents agreed.
Secondly, fifty one percent of the respondents agreed that their KPA discussions
were a formality that is conducted to ensure that their business units are compliant
with company policy. Only forty one percent believed that their managers are
sincere about their performance in the business unit and a mere ten percent agreed
that their line managers regarded them as an integral part of the business unit and
company. Six percent of the respondents agreed that their manager discussed their
performance and encouraged them.
These responses deviate from the earlier responses where the respondents indicated
confidence in their performance management systems. The effectiveness of
measures in place contributes to the successful achievement of the company strategy
(McAdam and Bailie, 2002). McAdam and Bailie (2002) found the performance
management programme a significant contributor to the achievement of the strategy
when companies saw the performance management programme as a strategic
management process, and when they recognised the importance of people in
achieving their strategies.
Thirdly, a significant thirty five percent agreed that employees had a negative attitude
towards the performance management systems in their organisations. Twenty

87
percent of the respondents felt that their performance management systems were a
fair method of assessment and nineteen percent of the respondents disagreed that
their KPA assessments had a positive impact on their work performance.
5.4 Summary
This chapter presented the discussion on the analysis of the empirical data based on
the objectives of this research. The objectives of the study were discussed in
comparison with the literature review. The next chapter will present a summary of the
research, limitations of the study, recommendations, and conclusions.

88
CHAPTER SIX
Recommendations and Conclusions
6.1 Introduction This chapter will conclude and summarise the key findings of this research as well
as present recommendations for the focus on key performance areas when
implementing performance management systems in organisations. This chapter will
also present the limitations experienced during this research and recommendations
for future research.
6.2 Has the problem been solved? The objective of this study was to investigate the link between key performance areas
and organisational strategy. Analysis of the data revealed that most employees were
confident that their key performance areas were aligned to the strategy of their
organisations. However, further analysis illustrated inconsistencies in responses
which indicate that the research problem has not been solved in its entirety.
The literature reviewed defined performance management systems as formal devices
for control and for the formulation and communication of strategy that are used as a
management tool to ensure that employees perform the tasks that really matter to the
organisation, i.e. to meet the objectives of the organisation. The literature stated
further that the corporate strategy must be translated into the plans of the various
departments and units right down to the individual employee. Employees must be
properly informed as to why they are commissioned to perform the tasks they are
required to perform else they will be working toward purposeless goals. In essence,
the entire hierarchical structure must be well versed with corporate strategy – what
the goals of the organisations are, what is important to the organisations, the
organisations culture and climate.

89
6.3 Implications of this Research The findings of this research will benefit organisations that have a formal performance
management system in place, highlighting the significance of clarity and
comprehensive understanding of key performance areas across the hierarchy to
ensure that strategic objectives are met. The literature presented here will also place
emphasis on the significance of focussing on human capital as competitive
advantage as opposed to the traditional perspective of products and services.
This research will also benefit those organisations that do not have a performance
management system in place. The review of the literature as well as the analysis of
data has provided insights on the benefits of having a performance management
system in place where individual key performance areas are linked to the strategy.
Government entities such as the South African Police Services (SAPS) will also
benefit from this research as it illustrates the dire need for strategic objectives to be
clarified and most significantly that these objectives should be understood and be
accepted by the workforce. In addition, a performance management system, if
implemented correctly, will allow controls to be in place thereby creating more
efficiencies in SAPS service to the public
6.4 Limitations and Recommendations for Future Studies
The sample size used in this research was too small. There total number of
respondents was 51 yielding a response rate of 33 percent. Future research
should aim for a larger heterogeneous sample. This sample revealed too
many similarities in demographics such as level of education and occupation.
This research was initially intended to be conducted at a single corporate
organisation, where the link between key performance areas an organisational

90
strategy would have been compared between the base and the apex of the
hierarchy. This did not materialise as the organisations approached were
apprehensive about allowing external research to be conducted amongst their
employees. A study of this calibre will illustrate whether the employees that
constitute the base of the hierarchy are familiar with organisational strategy
and whether they fully understand the relevance of their key performance
areas in relation to the organisational strategy as compared to those
employees that occupy the upper echelons of the hierarchy. In this instance a
homogenous sample would be beneficial to this research.
A comparative study of the performance management systems at two separate
organisations will highlight the trends adopted by organisations as well as
differences in the way they implement their performance management systems
and whether each company is utilising the performance management system
to its full potential.
A study of employees that only occupy the base of the hierarchy may generate
a different view on what key performance areas and whether they feel their key
performance areas are linked to the organisations strategy.
The results in objective 1 and objective 2 are inconsistent, which could be
attributed to the scepticism of some respondents to the confidentiality of
surveys. It could also be attributed to the fact that based on the preamble to
the questionnaire, the respondents answered in a manner that would satisfy
the research objectives

91
6.5 Specific recommendations for this study
Dessler (2006) state that technology is not enough to set companies apart, it is
the managers and employees that make a difference. Management have
finally accepted that people are the only sustainable competitive advantage of
an organisation (Nel, Van Dyk, Haasbroek, Schultz, Sono and Werner: 2004).
Unlike products, systems, technology and strategy, human behaviour,
personality and relationships cannot be engineered and copied. While good
strategies are the pivot on which the organisation rotates, such strategies are
only as good and successful as the animations felt by the organisations people
to achieve and exceed these objectives. Organisations need to view their
human capital as a competitive advantage as opposed to focussing on
products, services and financial results. In an economy that is fraught with
intense competition, where there are no clear distinctions between leaders and
followers, and where generic strategies abound, the need for ultimate
differentiation is imperative. This can only be achieved by maximising the
potential of the people that are employed in the organisation.
The results of this study revealed that the strategic direction of organisations is
not as clearly defined to employees as it should be. It is very important for
organisations to clearly define their objectives, their goals and exactly how
these are going to be achieved. Nel et al (2004) describe strategy as the long
term plans developed by top management, usually for periods of two to ten
years or even longer, that are used to evaluate and seize opportunities, as well
as to allocate resources. In view of this definition, the grand plan of the
organisation must be well thought out.
This study has revealed that the strategic direction of the organisation is not
communicated to all employees. It is imperative for successful execution of
company strategy which will allow the company to meet its objectives that
employees buy in to the company’s grand plan. Cummings (2005) purports

92
that the main difference between competing organisations is the attitude and
quality of its people. Kaplan and Norton (2005) state the effective strategy
execution requires communicating corporate strategy to employees while
Collis and Rukstad (2008) purport that circulating the strategy statement
throughout the company, with the value proposition and the activity system
map attached thereto, is the starting point for incorporating strategy into
everyone’s behaviour. Employees must be properly informed on exactly why
they are commissioned to perform the tasks required for successful strategy
implementation.
A good performance management system must be in place in order for the
strategy to be clearly defined, for it to be correctly communicated to all
employees and for measures and controls to be in place to ensure successful
implementation of the strategy. The performance appraisal initiative should be
the platform that managers use to communicate and give life the long and
short-term strategic goals of the organisation. Performance management has
been defined as the means through which managers ensure that employees’
activities and outputs are congruent with the organisation’s goals (Noe et al,
2006) and must be used as a strategic tool for it to be truly effective in the
organisation, i.e. every employee’s key performance areas must be clearly and
explicitly linked to the organisation’s strategy. The results of this study
revealed that not all performance management systems are being optimally
used in their organisations and that some respondents viewed their KPA
reviews as a mere formality as opposed to strategic contracting between line
manager and employee to determine whether the strategic objectives of that
department and the organisation are being met.

93
6.6 Conclusion
The research question which was raised in chapter one has been partially met.
While the research question may have been answered by respondents, deeper
analysis of data revealed inconsistencies that did not satisfy the research question
and certainly does not resolve the research problem. However, a significant number
of employees felt that their key performance areas were not linked to the
organisational strategy and that their KPA reviews were a mere formality conducted
by their line managers to be compliant with company policy.
Performance management systems serve different functions – as formal devices for
control, formulation and communication of strategy and most importantly enablers of
performance. Organisations will achieve sustainable competitive advantage by
investing in their employees through the successful implementation of a good
performance management system.
94
References:
Altman, S 1979. Performance monitoring systems for public managers, Public
Administration Review, vol. 39, no. 1, pp. 31-35.
Bryman, A. and Bell, E. 2007. Business Research Methods. 2nd edn. Oxford
University Press Inc. New York.
Collis, D.J. and Rukstad, M.G. 2008. Can you say what your Strategy is? Harvard
Business Review.
Cooper, D.R. and Schindler, P.S. 2002. Business Research Methods. 8th edn,
McGraw-Hill Irwin, Boston.
Cummings, S. 2005. Why HR is increasingly seen as “strategic”? Human Resources
Magazine, pp. 28-29.
Dessler, G. 2006. A Framework for Human Resource Management. 4th edn. Pearson
Prentice Hall, New Jersey.
Grobler, P.A., Warnich, S., Carell, M.R., Elbert, N.F. and Hatfield, R.D. 2002. Human
Resource Management in South Africa. 2nd edn. Thomson Learning, London.
Hiltrop, J.M. 1996. The Impact of Human Resource Management on Organisational
Performance: Theory and Research. European Management Journal, vol. 14, no. 6,
pp. 628 - 637.
Kaplan, R.S. and Norton, D.P. 2005. The Office of Strategic Management. Harvard
Business Review, pp. 72
Kennerley, M and Neely, A. 2003. A framework of the factors affecting the evolution

95
of performance management systems. International Journal of Operations &
Production Management, vol. 22, no. 11, pp. 1222 – 1245.
Leedy, P.D. and Ormrod, J.E. 2005. Practical Research: Planning and Design. 8th
edition. Pearson Merrill Prentice Hall, New Jersey.
Letza, S. 1996. The design and implementation of the balanced scorecard – an
analysis of three companies in practice. Business Process Management Journal, vol.
2, no. 3, pp. 54 – 76.
Lowe, A and Jones, A. 2004. Emergent strategy and the Measurement of
Performance: The Formulation of Performance Indicators at the Microlevel.
Organisation Studies, vol. 25, no. 8, pp. 1313 – 1337.
McAdam, R and Bailie, B. 2002. Business performance measures and alignment
impact on strategy. The role of business improvement models. International Journal
of Operations and Production Management, vol. 22, no. 9, 2002, pp. 972 -996.
Mintzberg, H. 1987. The Strategy Concept 1: Five Ps for Strategy. California
Management Review, vol. 30, no. 1, pp 11 – 24.
Misselhorn, H. 2005. Understanding and managing your organisation. 5th edn, MOD
Consulting, KZN
Neely, A. 1999. The performance measurement revolution: why now and what next?
International Journal of Operations & Production Management, vol. 19, pp. 205 – 228.
Nel, P.S., Van Dyk, P.S., Haasbroek, G.D., Schultz, H.B., Sono, T and Werner, A.
2004. Human Resources Management. 6th edn, Oxford, Cape Town.

96
Noe, R.A., Hollenbeck, J.R., Gerhart, B and Wright, P.A. 2006. Human Resource
Management: gaining a competitive advantage. McGraw-Hill, New York.
Otley, D. 1999. Performance management: a framework for management control
systems research. Management Accounting Research, vol. 10, pp. 363 – 382.
Pearce, J.A II and Robinson, R.B Jr. 1995. Strategic Management. 3rd edn. Laxman
Chand Arya, Delhi.
Porter, M.E. 1991. Towards a dynamic theory of strategy. Strategic Management
Journal, vol. 12, pp. 95-117.
Redman, T and Wilkinson, A. 2001. Contemporary Human Resource Management.
Text and Cases. 1st edn, Pearson Education Prentice Hall.
Rouse, P and Putterill, M. 2003. An integral framework for performance management.
Management Decision, vol. 41, issue 8, pp. 791 – 805.
Senge, P.M. 1990. The Fifth Discipline: The Art and Practice of the Learning
Organisation. Currency Doubleday, New York.
Sparrow, P and Hiltrop, J. 1994. European Human Resources Management in
Transition. Prentice Hall, London
Welman, J.C. and Kruger, S.J. 1999. Research Methodology for the Business and
Administrative Sciences. Oxford University Press, Southern Africa
Wouters, M. 2009. A developmental approach to performance measures – Results
from a longitudinal case study. European Management Journal, vol. 27, issue 1, pp.
64 – 78.

97
Websites:
http://www.surveymonkey.com
http://www.businessintelligence.com

98
APPENDIX 1
Employee Perceptions of Key Performance Areas (KPAs)/Key Performance Indicators (KPIs)/Critical Performance Areas (CPAs)
INSTRUCTIONS TO RESPONDENTS Please tick () your response in the relevant blocks for each of the questions and provide a short answer where relevant.
A. DEMOGRAPHICS: Age
21-30 31- 40
41-50 51- 60
60 and over
Gender
Male Female
Level of Education
Matric (Grade 12) Diploma
Degree Post graduate qualification
Race
Black Coloured Indian White
Other
Graduate School of Business

99
Ownership of your organization:
Public – listed on JSE Public – not listed on JSE
Private company Closed corporation
Partnership / sole trader Don’t know
Your role in the organization:
Executive Management Senior management
Middle management Administrator
Operational
B. DETAILED QUESTIONNAIRE:
I am very familiar with the mission and vision of my organisation
Strongly Agree
Agree
Disagree
Strongly disagree
The mission and vision of my organisation are communicated to me on a regular
basis
Strongly Agree
Agree
Disagree
Strongly disagree

100
I am very familiar with my organisation’s strategy
Strongly Agree
Agree
Disagree
Strongly disagree
The strategy of my organisation unit is communicated to me on a regular basis
Strongly Agree
Agree
Disagree
Strongly disagree
The following are important concepts of Key Performance Areas/Key
Performance Indicators/Critical Performance Areas to me
(Please tick ALL the relevant blocks):
KPAs are goals of my organisation based on pre-defined criteria
KPAs allow goals to be observed, met and exceeded
KPAs are used to evaluate the success of the business and plan
for the future
KPAs add value to aspects of the business that cannot be
quantified, such as employee satisfaction and development
KPAs are critical to the realisation of the long term strategy of the
business
101
I have been adequately informed of the Performance Management process in my
organisation
Strongly Agree
Agree
Disagree
Strongly disagree
I was clearly informed of, and understood the meaning and relevance of
KPAs/CPAs/KPIs the first time it was introduced to me
Strongly Agree
Agree
Disagree
Strongly disagree
The reasons for KPA/CPA/KPI reviews are
(Please tick ALL the relevant blocks):
To measure my performance over a stipulated period
To measure my performance and determine my annual increase
To measure my performance and discuss my Individual
Development Plan
To measure my performance in relation to the performance of
my business unit To waste my time

102
My line manager understands the concept of KPAs/CPAs/KPIs
Strongly Agree
Agree
Disagree
Strongly disagree
The number of KPA/CPA/KPI sessions I have in a year is
None
One
Two
Three
Four
On average, the duration of my KPA/ CPA/KPI sessions are
30 minutes or less
31–60 minutes
61 – 90 minutes
91 – 120 minutes
120 minutes and over

103
My KPA/CPA/KPI sessions are conducted (Please tick ALL relevant blocks):
As a formality so that my business unit/department is compliant
with the company policy?
Because my line manager is sincere about my performance in
the business unit and in the company?
Because my line manager regards me as an
integral part of my business unit and company?
My KPAs /CPAs/KPIs contribute to achieving the short and long-term objectives of
the organisation
Strongly Agree
Agree
Disagree
Strongly disagree
My line manager is aware of the necessity of KPAs/ CPAs/KPIs in my organisation
Strongly Agree
Agree
Disagree
Strongly disagree
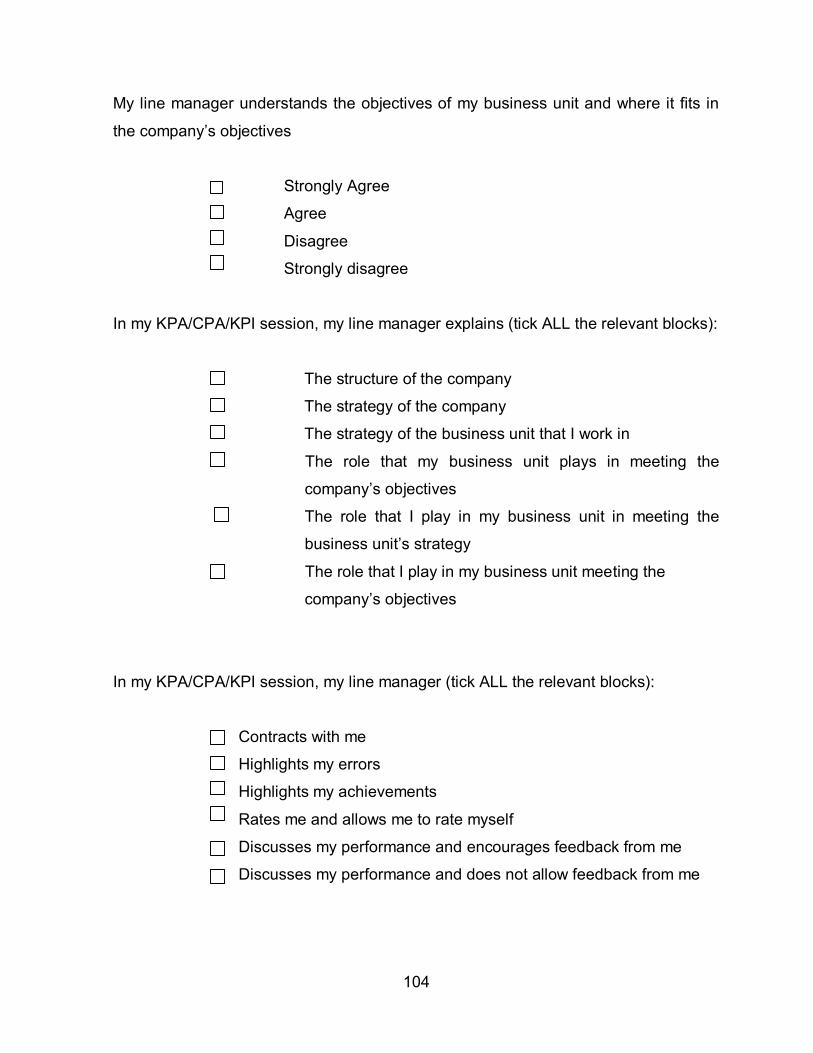
104
My line manager understands the objectives of my business unit and where it fits in
the company’s objectives
Strongly Agree
Agree
Disagree
Strongly disagree In my KPA/CPA/KPI session, my line manager explains (tick ALL the relevant blocks):
The structure of the company
The strategy of the company
The strategy of the business unit that I work in
The role that my business unit plays in meeting the
company’s objectives
The role that I play in my business unit in meeting the
business unit’s strategy
The role that I play in my business unit meeting the
company’s objectives
In my KPA/CPA/KPI session, my line manager (tick ALL the relevant blocks):
Contracts with me
Highlights my errors
Highlights my achievements
Rates me and allows me to rate myself
Discusses my performance and encourages feedback from me
Discusses my performance and does not allow feedback from me

105
The rating on my KPAs/ CPAs/KPIs determine my annual remuneration review
Strongly Agree
Agree
Disagree
Strongly disagree
My KPAs/CPAs/KPIs make a valuable contribution to the organisation
Strongly Agree
Agree
Disagree
Strongly disagree My manager discusses my individual strengths that contribute to achieving the
objectives of the organisation
Yes
No
If no, please explain:
____________________________________________________________
____________________________________________________________
____________________________________________________________
____________________________________________________________
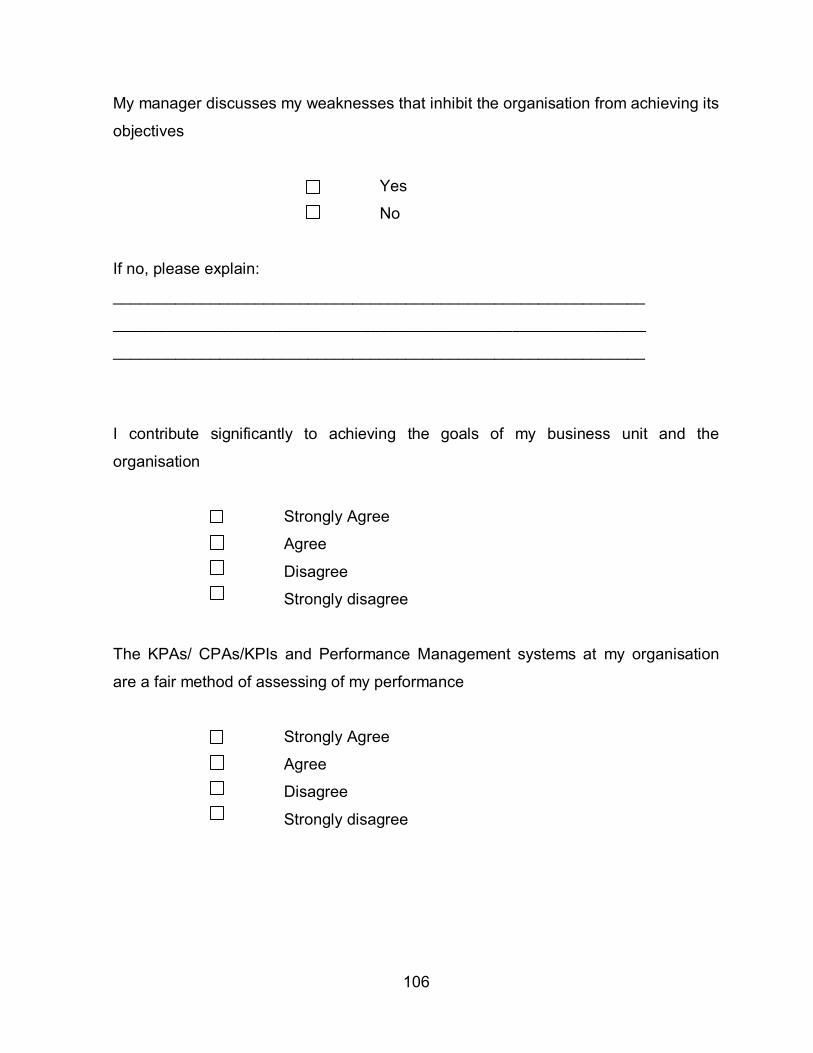
106
My manager discusses my weaknesses that inhibit the organisation from achieving its
objectives
Yes
No
If no, please explain:
____________________________________________________________
____________________________________________________________
____________________________________________________________
I contribute significantly to achieving the goals of my business unit and the
organisation
Strongly Agree
Agree
Disagree
Strongly disagree The KPAs/ CPAs/KPIs and Performance Management systems at my organisation
are a fair method of assessing of my performance
Strongly Agree
Agree
Disagree
Strongly disagree
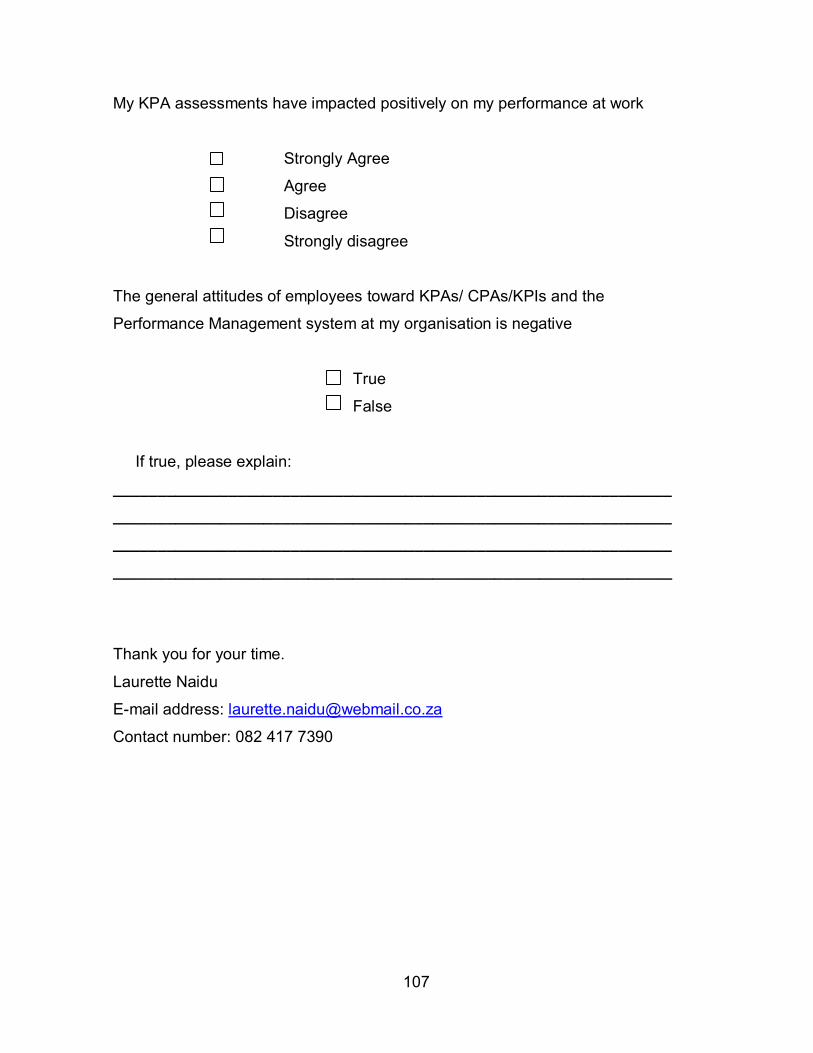
107
My KPA assessments have impacted positively on my performance at work
Strongly Agree
Agree
Disagree
Strongly disagree
The general attitudes of employees toward KPAs/ CPAs/KPIs and the
Performance Management system at my organisation is negative
True
False
If true, please explain:
_______________________________________________________________
_______________________________________________________________
_______________________________________________________________ _______________________________________________________________
Thank you for your time.
Laurette Naidu
E-mail address: [email protected]
Contact number: 082 417 7390

108
APPENDIX 2


