
Mieloma MultiploMichele Cavo18 SETTEMBRE 2015

Phase 2 Study of Daratumumab (DARA) in
Patients with ≥3 Lines of Prior Therapy or
Double Refractory Multiple Myeloma:
54767414MMY2002 (Sirius)*
Sagar Lonial,1 Brendan Weiss,2 Saad Usmani,3 Seema Singhal,4 Ajai Chari,5 Nizar Bahlis,6 Andrew Belch,7 Amrita Krishnan,8 Robert Vescio,9 Maria Victoria Mateos,10 Amitabha Mazumder,11 Robert Z. Orlowski,12 Heather Sutherland,13 Joan Blade,14 Emma C. Scott,15 Huaibao Feng,16 Clarissa Uhlar,17
Imran Khan,16 Tahamtan Ahmadi,17 Peter Voorhees,18.
1Department of Hematology and Medical Oncology, Winship Cancer Institute, Emory University, Atlanta, GA; 2Division of Hematology & Oncology, Department of Medicine, Abramson Cancer Center and Perelman School of Medicine, University of Pennsylvania, Philadelphia, PA; 3Levine Cancer Institute/Carolinas Healthcare System, Charlotte, NC; 4Robert H. Lurie Comprehensive Cancer Center, Division of Hem./Onc.,
Northwestern University Feinberg School of Medicine, Chicago, IL; 5Tisch Cancer Institute, Mount Sinai School of Medicine, New York, NY; 6Tom Baker Cancer Center - University of Calgary, Calgary, AB, Canada; 7Cross Cancer Institute, Edmonton, AB, Canada; 8Department Hematology and Hematopoietic Stem Cell Transplant, City of Hope, Duarte, CA; 9Cedars-Sinai Outpatient Cancer Center at the Samuel
Oschin Comprehensive Cancer Institute, Los Angeles, CA; 10University Hospital of Salamanca/IBSAL, Salamanca, Spain; 11NYU PerlmutterCancer Center, New York, NY; 12Department of Lymphoma/Myeloma, The University of Texas MD Anderson Cancer Center, Houston, TX;
13Leukemia/Bone Marrow Transplant Program, University of British Columbia, Vancouver, BC, Canada; 14IDIBAPS, Hospital Clinic de Barcelona, Barcelona, Spain; 15Knight Cancer Institute, Oregon Health and Science University, Portland, OR; 16Janssen Research & Development, Raritan, NJ; 17Janssen Research & Development, Spring House, PA; 18Division of Hematology/Oncology, Lineberger
Comprehensive Cancer Center, University of North Carolina at Chapel Hill, Chapel Hill, NC
*NCT01985126
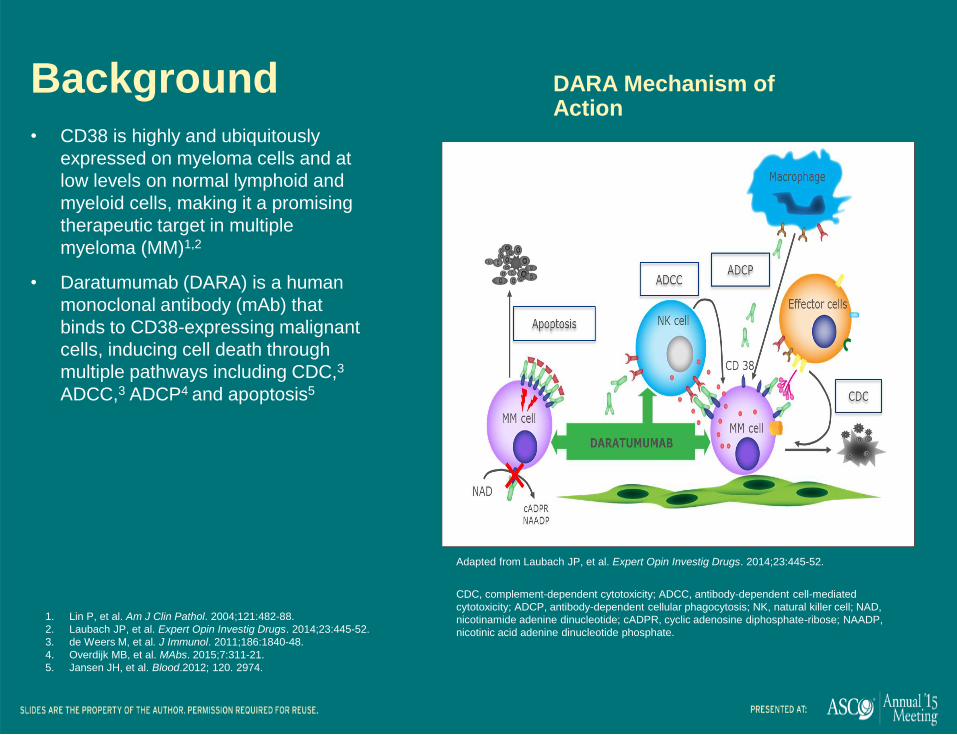
Background• CD38 is highly and ubiquitously
expressed on myeloma cells and at
low levels on normal lymphoid and
myeloid cells, making it a promising
therapeutic target in multiple
myeloma (MM)1,2
• Daratumumab (DARA) is a human
monoclonal antibody (mAb) that
binds to CD38-expressing malignant
cells, inducing cell death through
multiple pathways including CDC,3
ADCC,3 ADCP4 and apoptosis5
1. Lin P, et al. Am J Clin Pathol. 2004;121:482-88.
2. Laubach JP, et al. Expert Opin Investig Drugs. 2014;23:445-52.
3. de Weers M, et al. J Immunol. 2011;186:1840-48.
4. Overdijk MB, et al. MAbs. 2015;7:311-21.
5. Jansen JH, et al. Blood.2012; 120. 2974.
DARA Mechanism of Action
CDC, complement-dependent cytotoxicity; ADCC, antibody-dependent cell-mediated
cytotoxicity; ADCP, antibody-dependent cellular phagocytosis; NK, natural killer cell; NAD,
nicotinamide adenine dinucleotide; cADPR, cyclic adenosine diphosphate-ribose; NAADP,
nicotinic acid adenine dinucleotide phosphate.
Adapted from Laubach JP, et al. Expert Opin Investig Drugs. 2014;23:445-52.

GEN501: First in Human Study
Cohort A 8 mg/kg
Cohort B 8 mg/kg
Cohort C 8 mg/kg
Cohort D 16 mg/kg
Change in Paraprotein From Baseline
100
–100
80
60
40
20
0
–20
–40
–60
–80
4
• During ASCO 2014, data from a
first-in-human, Phase 1/2 study
were presented that demonstrated
single-agent DARA activity in
relapsed/refractory MM patients1
– No maximum tolerated dose was
reached (up to 24 mg/kg DARA)
– Overall response rate (ORR) was
35% in the 16 mg/kg DARA cohort
• FDA Breakthrough Therapy
designation in May 2013M
axim
um
ch
an
ge
fro
m b
ase
line
(%
)
1. Lokhorst HM, et al. J Clin Oncol. 2014;32(suppl):5s. Abstract 8513.

MMY2002 SIRIUS: Objectives and Eligibility
Primary objective
•Overall response rate of DARA monotherapy in patients with MM who had received ≥3 prior lines of therapy or had disease refractory to both a proteasome inhibitor (PI) and an immunomodulatory drug (IMiD)
•Responses assessed by an independent review committee (IRC)
Secondary objectives
•Progression-free survival (PFS), overall survival (OS), duration of and time to response, and clinical benefit rate (ORR + minimal response [MR])
•Safety
Eligibility
•Documented MM with disease progression on the most recent treatment regimen
•Received ≥3 prior lines of therapy including a PI and an IMiD, or refractory to their most recent PI and IMiD irrespective of number of prior lines of therapy
•Eastern Cooperative Oncology Group (ECOG) performance status of ≤2
•Absolute neutrophil count >1 x 10⁹/L
•Hemoglobin >7.5 g/dL
•Platelet count ≥50 x 109/L
•Creatinine clearance >20 mL/min/1.73 m2

Baseline Refractory Status
Refractory to, n (%) n = 106
Last prior therapy 103 (97)
PI and IMiD 101 (95)
BORT 95 (90)
CARF 51 (48)
LEN 93 (88)
POM 67 (63)
Alkylating agent 82 (77)
BORT+LEN 87 (82)
BORT+LEN+CARF 42 (40)
BORT+LEN+POM 57 (54)
BORT+LEN+CARF+POM 33 (31)
BORT+LEN+CARF+POM+THAL 12 (11)
• Patients were heavily pretreated, and
most patients were refractory to multiple
lines of PI and IMiD treatment
– 97% were refractory to their last
line of therapy
– 77% were refractory to alkylating
agents
– 95% were double refractory
– 66% were refractory to 3 of 4
therapies (BORT, LEN, CARF, and
POM)
– 63% were refractory to POM
– 48% were refractory to CARF
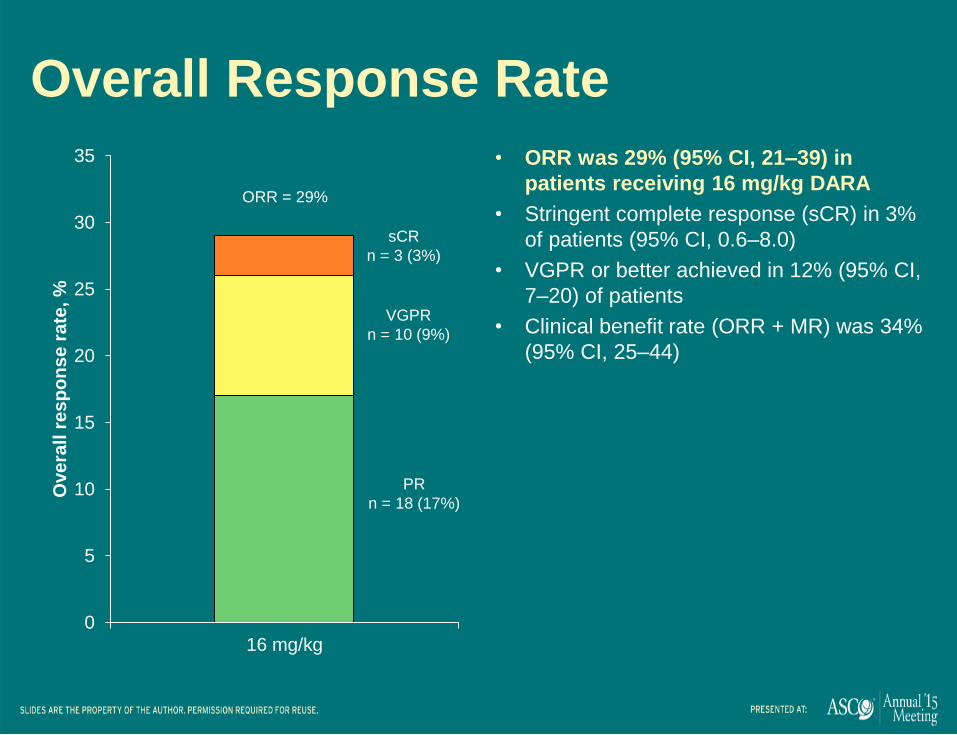
Overall Response Rate
• ORR was 29% (95% CI, 21–39) in
patients receiving 16 mg/kg DARA
• Stringent complete response (sCR) in 3%
of patients (95% CI, 0.6–8.0)
• VGPR or better achieved in 12% (95% CI,
7–20) of patients
• Clinical benefit rate (ORR + MR) was 34%
(95% CI, 25–44)
0
5
10
15
20
25
30
35
16 mg/kg
Ove
rall
re
sp
on
se
ra
te, %
ORR = 29%
sCR
n = 3 (3%)
VGPR
n = 10 (9%)
PR
n = 18 (17%)

Treatment-emergent AEs >20%
Term Any Grade
n (%)
Grade 3
n (%)
Grade 4
n (%)
Fatigue 42 (40) 3 (3) -
Anemia 35 (33) 25 (24) -
Nausea 31 (29) - -
Thrombocytopenia 27 (26) 18 (17) 8 (8)
Neutropenia 24 (23) 12 (11) 3 (3)
Back pain 23 (22) 3 (3) -
Cough 22 (21) - -
• Serious treatment-emergent AEs
(TEAEs) in 32 (30%) patients and 24
(23%) had Grade 3/4 serious TEAEs
• No discontinuations due to DARA-
related AEs
• No febrile neutropenia reported
• Few required additional supportive care
‒ Red blood cell transfusion (38%)
‒ Platelet transfusion (13%)
‒ Granulocyte colony stimulating
factor (8%)• Grade 3 or higher anemia and thrombocytopenia occurred
more frequently in nonresponders (32% and 24%,
respectively) than responders (3% and 7%, respectively)
• Grade 3 or higher neutropenia rates were similar in
nonresponders (12%) and responders (13%)
9
ELOQUENT-2: a phase 3, randomized, open-
label study of lenalidomide/dexamethasone
with/without elotuzumab in patients with
relapsed/refractory multiple myeloma
Meletios Dimopoulos*†1, Sagar Lonial†2, Antonio Palumbo3, Darrell White4, Sebastian Grosicki5,
Ivan Spicka6, Adam Walter-Croneck7, Philippe Moreau8, Maria-Victoria Mateos9, Hila Magen10,
Andrew Belch11, Donna Reece12, Meral Beksac13, Andrew Spencer14, Heather Oakervee15, Masafumi
Taniwaki16, Christoph Röllig17, Ka Lung Wu18, Anil Singhal19, Jesus San Miguel20, Morio
Matsumoto21, Jessica Katz22, Eric Bleickardt23, Valerie Poulart24 and Paul Richardson25 on behalf of
the ELOQUENT-2 Investigators
1National and Kapodistrian University of Athens, Athens, Greece; 2Winship Cancer Institute, Emory University School of Medicine, Atlanta, USA; 3A.O.U. San Giovanni Battista di Torino - Ospedale Molinette, Torino, Italy; 4QEII Health Science Center and Dalhousie University, Halifax, Canada; 5Silesian Medical University, Katowice, Poland; 6Charles University Hospital, Prague, Czech Republic; 7Medical University of Lublin, Lublin, Poland;
8University Hospital, Nantes, France; 9University Hospital of Salamanca-IBSAL, Salamanca, Spain; 10Davidoff Cancer Center, Rabin Medical Center,
Petah Tikva, and Tel Aviv University, Ramat Aviv, Israel; 11Cross Cancer Institute and University of Alberta, Edmonton, Canada; 12Princess Margaret
Hospital, Toronto, Canada; 13Ankara University, Ankara, Turkey; 14Alfred Health-Monash University, Melbourne, Australia; 15Barts and the London
NHS Trust, London, UK; 16Kyoto Prefectural University of Medicine, Kyoto, Japan; 17Universitatsklinikum der TU, Dresden, Germany; 18ZNA
Stuivenberg, Antwerp, Belgium; 19AbbVie Biotherapeutics Inc. (ABR), Redwood City, USA; 20Clinical Universidad de Navarra, Pamplona, Spain; 21Nishigunma National Hospital, Shibukawa, Japan; 22Bristol-Myers Squibb, Princeton, USA; 23Bristol-Myers Squibb, Wallingford, USA; 24Bristol-
Myers Squibb, Braine-l'Alleud, Belgium; 25Dana-Farber Cancer Institute, Boston, USA
Presented at the European Hematology Association (EHA) 20th Congress; Vienna, Austria; June 11–14, 2015
S471

Dual Mechanism of Action of Elotuzumab
Humanized IgG1 immunostimulatory monoclonal antibody targeted
against SLAMF7, a glycoprotein highly expressed on myeloma and natural
killer cells but not on normal tissues1
A: Direct activation
Binding to SLAMF7 directly
activates natural killer cells,2
but not myeloma cells3
B: Tagging for recognition
Elotuzumab activates
natural killer cells via CD16,
enabling selective killing of
myeloma cells via antibody-
dependent cellular
cytotoxicity (ADCC) with
minimal effects on normal
tissue2
1. Hsi ED et al. Clin Cancer Res 2008;14:2775–84
2. Collins SM et al. Cancer Immunol Immunother 2013;62:1841–9
3. Guo H et al. Mol Cell Biol 2015;35:41–51
SLAMF7 = Signaling Lymphocyte Activation Molecule-F7
Direct activationA
B Tagging for
recognition
Elotuzumab
SLAMF7
Elotuzumab
SLAMF7
Myeloma
cell
Myeloma
cell death
Degranulation
Perforin,
granzyme B
release
Downstream
activating
signaling
cascade
Natural killer cell
Granule synthesis
Polarization
EAT-2

ELOQUENT-2 Study Design
Open-label, international, randomized, multicenter, phase 3 trial
(168 global sites)
Key inclusion criteria
RRMM
1–3 prior lines of therapy
Prior Len exposure permitted in 10% of study population (patients not refractory to Len)
Elo plus Len/Dex (E-Ld) schedule (n=321)
Elo (10 mg/kg IV): Cycle 1 and 2: weekly; Cycles 3+: every other week
Len (25 mg PO): Days 1–21Dex: weekly equivalent, 40 mg
Len/Dex (Ld) schedule (n=325)
Len (25 mg PO): Days 1–21;
Dex: 40 mg PO Days 1, 8, 15, 22
Repeat every 28 days
Assessment
Tumor response: every 4 weeks until progressive disease
Survival: every 12 weeks after disease progression
Endpoints:
– Co-primary: PFS and ORR
– Other: overall survival (data not yet mature), duration of response,
quality of life, safety
All patients received premedication to mitigate infusion reactions prior to
elotuzumab administration
Elotuzumab IV infusion administered ~ 2–3 hours

Baseline Demographics and
Disease Characteristics
Characteristic E-Ld (n=321) Ld (n=325)
Prior regimens, median (range) 2 (1–4) 2 (1–4)
Prior therapies, %
Bortezomib 68 71
Melphalan* 69 61
Thalidomide 48 48
Lenalidomide† 5 7
Response to most recent line of therapy, %‡
Refractory 35 35
Bortezomib refractory 22 21
Thalidomide refractory 9 11
Relapsed 65 65
Prior stem cell transplantation, % 52 57
*Oral or intravenous. †Prior lenalidomide was permitted if best response was ≥partial response and patients were not refractory to prior lenalidomide
treatment; patients could not receive more than 9 cycles of lenalidomide and had at least 9 months between the last dose of lenalidomide and
progression. ‡One patient in the elotuzumab group had an unknown response to the most recent line of therapy
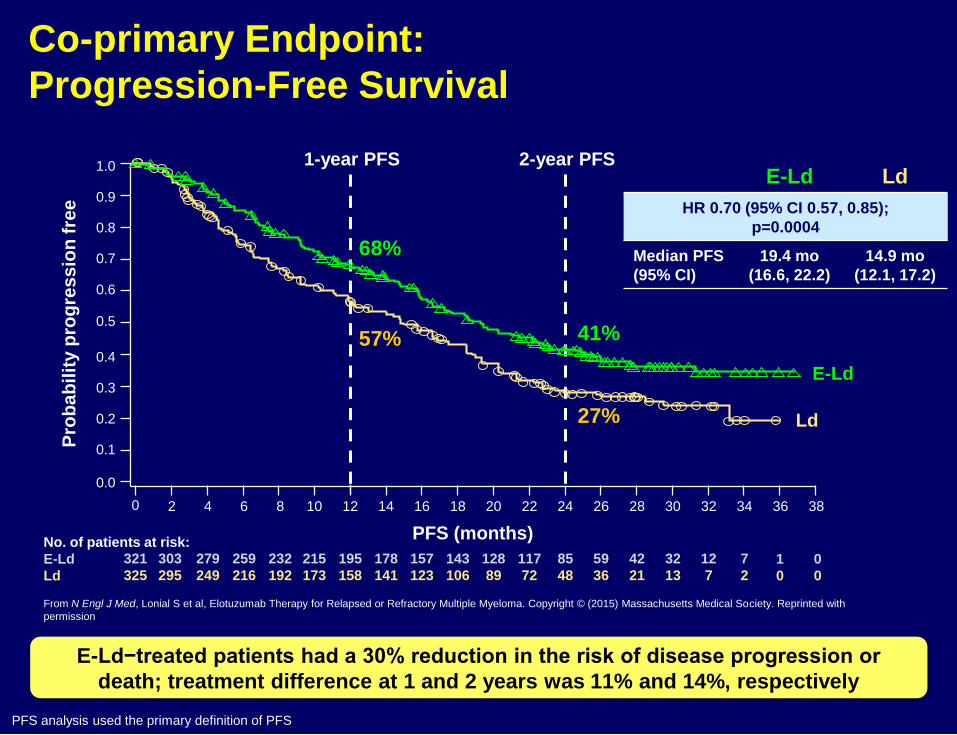
Co-primary Endpoint:
Progression-Free Survival
PFS analysis used the primary definition of PFS
E-Ld−treated patients had a 30% reduction in the risk of disease progression or
death; treatment difference at 1 and 2 years was 11% and 14%, respectively
0.0
0.1
0.2
0.3
0.4
0.5
0.6
0.7
0.8
0.9
1.0
380 2 4 6 8 10 12 14 16 18 20 22 24 26 28 30 32 34 36
No. of patients at risk:
E-Ld
Ld
321
325
303
295
279
249
259
216
232
192
215
173
195
158
178
141
157
123
143
106
128
89
117
72
85
48
59
36
42
21
32
13
12
7
7
2
57%
68%
27%
41%
1-year PFS 2-year PFS
PFS (months)
Pro
ba
bil
ity p
rog
res
sio
n f
ree
From N Engl J Med, Lonial S et al, Elotuzumab Therapy for Relapsed or Refractory Multiple Myeloma. Copyright © (2015) Massachusetts Medical Society. Reprinted with
permission
E-Ld Ld
HR 0.70 (95% CI 0.57, 0.85);
p=0.0004
Median PFS
(95% CI)
19.4 mo
(16.6, 22.2)
14.9 mo
(12.1, 17.2)
E-Ld
Ld
1
0
0
0

Subgroup Hazard ratio (95% CI)
Age (<75 years) 0.73 (0.59–0.92)
Age (≥75 years) 0.56 (0.35–0.89)
Age (<65 years) 0.75 (0.55–1.02)
Age (≥65 years) 0.65 (0.50–0.85)
ISS stage (I) 0.63 (0.46–0.87)
ISS stage (II) 0.86 (0.61–1.22)
ISS stage (III) 0.70 (0.47–1.04)
Response to most recent therapy (refractory) 0.56 (0.40–0.78)
Response to most recent therapy (relapsed) 0.77 (0.60–1.00)
Lines of prior therapy (1) 0.75 (0.56–1.00)
Lines prior therapy (2 or 3) 0.65 (0.49–0.87)
Prior IMiD (prior thalidomide only) 0.64 (0.48–0.85)
Prior IMiD (other) 0.59 (0.25–1.40)
Prior bortezomib (yes) 0.68 (0.54–0.86)
Prior bortezomib (no) 0.72 (0.49–1.07)
Prior SCT (yes) 0.75 (0.58–0.99)
Prior SCT (no) 0.63 (0.46–0.86)
del(17p) (yes) 0.65 (0.45–0.94)
1q21 (yes) 0.75 (0.56–0.99)
t(4;14) (yes) 0.53 (0.29–0.95)
Progression-Free Survival: Subgroup Analysis
IMiD = immunomodulatory drug; ISS = International Staging System
0.25 0.5 0.8 1.251 2 4
E-Ld better Ld alone better
From N Engl J Med, Lonial S et al, Elotuzumab Therapy for Relapsed or Refractory Multiple Myeloma. Copyright © (2015) Massachusetts Medical Society. Reprinted with permission
PFS benefit in E-Ld group was consistently better across key subgroups

Infusion Reactions
Infusion reactions occurred in 10% of patients
70% of infusion reactions occurred with the first dose
No Grade 4 or 5 infusion reactions
Elotuzumab infusion was interrupted in 15 (5%) patients due to an
infusion reaction (median interruption duration 25 minutes)
2 (1%) patients discontinued the study due to an infusion reaction
Events, n (%)E-Ld (n=318)
Grade 1/2 Grade 3 Grade 4/5
Infusion reaction 29 (9) 4 (1) 0
Pyrexia 10 (3) 0 0
Chills 4 (1) 0 0
Hypertension 3 (1) 1 (<1) 0

Subgroup Analysis by Prior Treatment Among Patients With Relapsed or Relapsed and
Refractory Multiple Myeloma in the PANORAMA 1 Study of Panobinostat or
Placebo Plus Bortezomib and Dexamethasone
Hermann Einsele, Paul G. Richardson, Vânia T.M. Hungria,
Sung-Soo Yoon, Meral Beksac, Meletios Athanasios
Dimopoulos, Ashraf Elghandour, Wieslaw W. Jedrzejczak,
Andreas Guenther, Thanyaphong Na Nakorn, Noppadol
Siritanaratkul, Robert L. Schlossman, Jian Hou, Philippe
Moreau, Sagar Lonial, Jae Hoon Lee, Monika Sopala,
Bourras-Rezki Bengoudifa, Claudia Corrado
and Jesús F. San-Miguel

Pan-DACi, such as panobinostat, inhibit a broad range of deacetylase enzymes that target both histone and nonhistone
proteins involved in oncogenesis1
Pan-DACi inhibit growth and promote death of myeloma cells through inhibition of HDAC enzymes:
• Histone proteins, which are implicated in epigenetic dysregulation, resulting in activation of tumor suppressor genes2-4
• Nonhistone proteins, which promote toxic accumulation of misfolded proteins, leading to cell stress2,5,6
1. Farydak (panobinostat) [package insert]. East Hanover, NJ: Novartis; 2014. 2. Atadja P, et al. Cancer Lett. 2009;280:233-241. 3. Mannava S, et al. Blood.
2012;119:1450-1458. 4. Kalushkova A, et al. PloS One. 2010;5:e11483. 5. Catley L, et al. Blood. 2006;108:3441-3449. 6. Glozak MA and Seto E. Oncogene.
2007;26:5420-5432.
Pan-DAC Inhibitors: Mechanism of Action
3

18
Follow-up
Treatment Phase 1 Treatment Phase 2
Eight 21-Day cycles (24 wks) Four 42-Day cycles (24 wks)
Panobinostat +
bortezomib +
dexamethasone
Placebo + bortezomib + dexamethasone
Panobinostat + bortezomib + dexamethasone
Placebo + bortezomib + dexamethasone
Pts with clinical benefita in Treatment
Phase I, can proceed to Treatment Phase II
• Primary endpoint: PFS (per modified EBMT criteria per investigator)1,2
• Key secondary endpoint: OS
• Other secondary endpoints: ORR, nCR/CR rate, DOR, TTR, TTP, QoL, and safety
Study conducted at 215 centers across 34 countries3
Pts(N = 768)
• Rel or Rel/Ref MM (BTZ-ref excluded)
• 1-3 prior lines of therapy
• Stratification factors
–Prior lines of therapy
–Prior BTZ
a Achieving ≥ no change according to
modified EBMT criteria (NC or better)
1. Blade J, et al. Br J Haematol. 1998;102:1115-11232. Richardson PG, et al. N Engl J Med. 2003; 348:2609-26173. San-Miguel JF, et al. Lancet Oncol. 2014;15:1195-1206
PANORAMA 1 Study Design Randomized, Double-Blind, Phase 3 Study in
Relapsed or Relapsed and Refractory MM
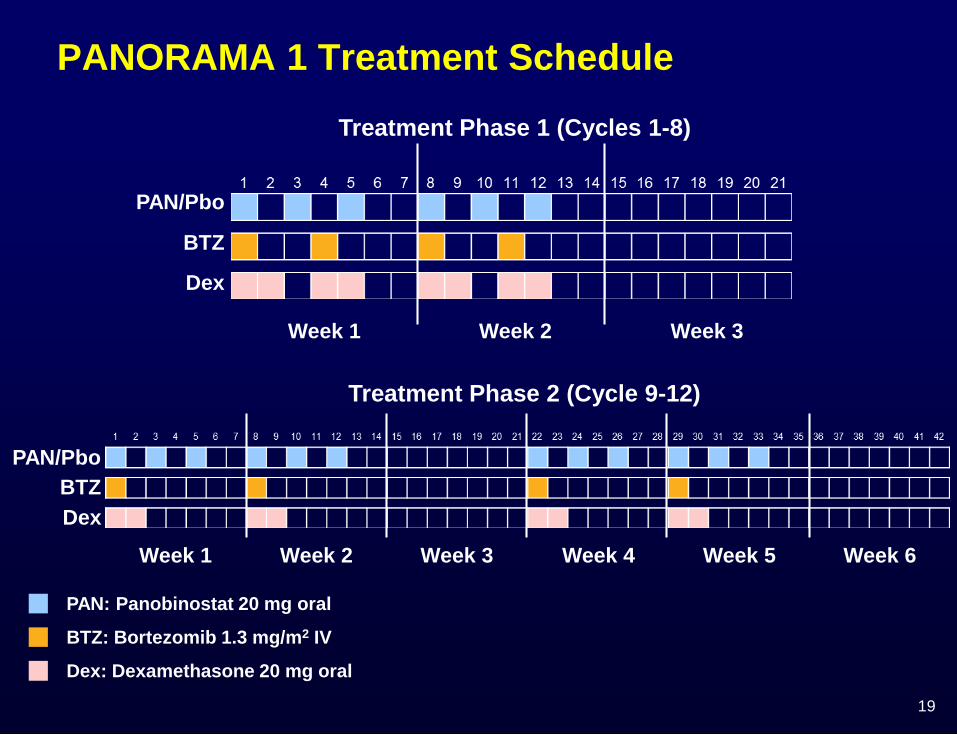
19
Week 1 Week 2 Week 3
Treatment Phase 1 (Cycles 1-8)
PAN/Pbo
BTZ
Dex
Week 1 Week 2 Week 3
Treatment Phase 2 (Cycle 9-12)
PAN/Pbo
BTZ
Dex
Week 4 Week 5 Week 6
PAN: Panobinostat 20 mg oral
BTZ: Bortezomib 1.3 mg/m2 IV
Dex: Dexamethasone 20 mg oral
PANORAMA 1 Treatment Schedule

20
PANORAMA 1: Primary Endpoint Met (PFS)
Primary endpoint was met (P < .0001), with clinically relevant increase
in median PFS of 3.9 months for PAN-BTZ-Dex arm
100
80
60
40
20
0
0 2 4 6 8 10 12 14 16 18 20 22 24 26 28 30 32 34 36
387 288 241 202 171 143 113 89 69 52 44 35 26 18 13 10 5 3 0
381 296 235 185 143 114 89 64 42 32 24 18 12 5 5 3 2 0 0
MonthsNumber of patients at risk
PAN-BTZ-Dex
Pbo-BTZ-Dex
Pro
gre
ss
ion
-fre
e s
urv
iva
l P
rob
ab
ilit
y (
%)
Events
Median PFS
(95% CI)
months
HR
(95% CI)P value
PAN-BTZ-Dex 207/38712.0
(10.3, 12.9) 0.63 (0.52-0.76)
< .0001Pbo-BTZ-Dex
260/3818.1
(7.6, 9.2)
PAN-BTZ-Dex
Pbo-BTZ-Dex
San-Miguel JF, et al. Lancet Oncol. 2014;15:1195-1206

Subgroup Analysis by Prior Treatment:PFS ≥ 2 Prior Regimens Including BTZ and an IMiD
• Among the subgroup of patients with ≥ 2 prior regimens including
BTZ and an IMiD the difference in median PFS benefit was 7.8
months
73 57 42 36 32 25 20 15 10 6 4 3 2 2 1
74 54 37 23 11 9 5 4 2 2 2 2 2 0 0
Number of Patients at Risk
PAN-BTZ-Dex
Pbo-BTZ-Dex
PF
S P
rob
ab
ilit
y, %
100
80
60
40
20
0
0 2 4 6 8 10 12 14 16 18 20 22 24 26 28
Months
Events
Median PFS
(95% CI),
months
HR
(95% CI)
PAN-BTZ-Dex 44/7312.5
(7.3-14.0) 0.47
(0.31-0.72)Pbo-BTZ-Dex 54/74
4.7(3.7-6.1)
Censoring times
PAN-BTZ-Dex (n/N = 44/73)
Pbo-BTZ-Dex (n/N = 54/74)

1National and Kapodistrian University of Athens, Athens, Greece; 2Mayo Clinic, Scottsdale, AZ; 3Division of Hematology, Mayo Clinic, Rochester, MN; 4St István and St Laszlo Hospital, Budapest, Hungary; 5Institut Català
d’Oncologia, Hospital Germans Trias i Pujol, Barcelona, Spain; 6University Hospital Brno and Faculty of Medicine, University of Ostrava, Ostrava, Czech Republic; 7Hospital Clínic de Barcelona, Barcelona, Spain; 8John Theurer
Cancer Center at Hackensack University, Hackensack, New Jersey; 9Queen Joanna University Hospital, Sofia, Bulgaria; 10Hematology Clinic University Multiprofile Hospital for Active Treatment, Plovdiv, Bulgaria; 11Department
of Hematology, Mór Kaposi Teaching Hospital, Kaposvár, Hungary; 12Weill Cornell Medical College, New York, New York; 13University of Chicago Medical Center, Chicago, IL; 14Clinica Universidad de Navarra, Spain;15Wilhelminen Cancer Research Institute, Wilhelminenspital, Vienna, Austria; 16Onyx Pharmaceuticals, Inc., an Amgen subsidiary, South San Francisco, CA, USA; 17University of Nantes, Nantes, France; 18University of Torino,
Torino, Italy
Effect of Carfilzomib, Lenalidomide, and Dexamethasone vs Lenalidomide and Dexamethasone in Patients With Relapsed Multiple Myeloma by Line of Therapy: Interim Results From the Phase 3 ASPIRE Study
Meletios A. Dimopoulos,1 A. Keith Stewart, 2 S. Vincent Rajkumar,3
Tamás Masszi,4 Albert Oriol,5 Roman Hájek,6 Laura Rosiñol,7 David Siegel,8
Georgi G. Mihaylov,9 Vesselina Goranova-Marinova,10 Péter Rajnics,11
Ruben Niesvizky,12 Andrzej Jakubowiak,13 Jesus San-Miguel,14
Heinz Ludwig,15 Naseem Zojwalla,16 Margaret Tonda,16 Xinqun Yang,16
Philippe Moreau,17 Antonio Palumbo18
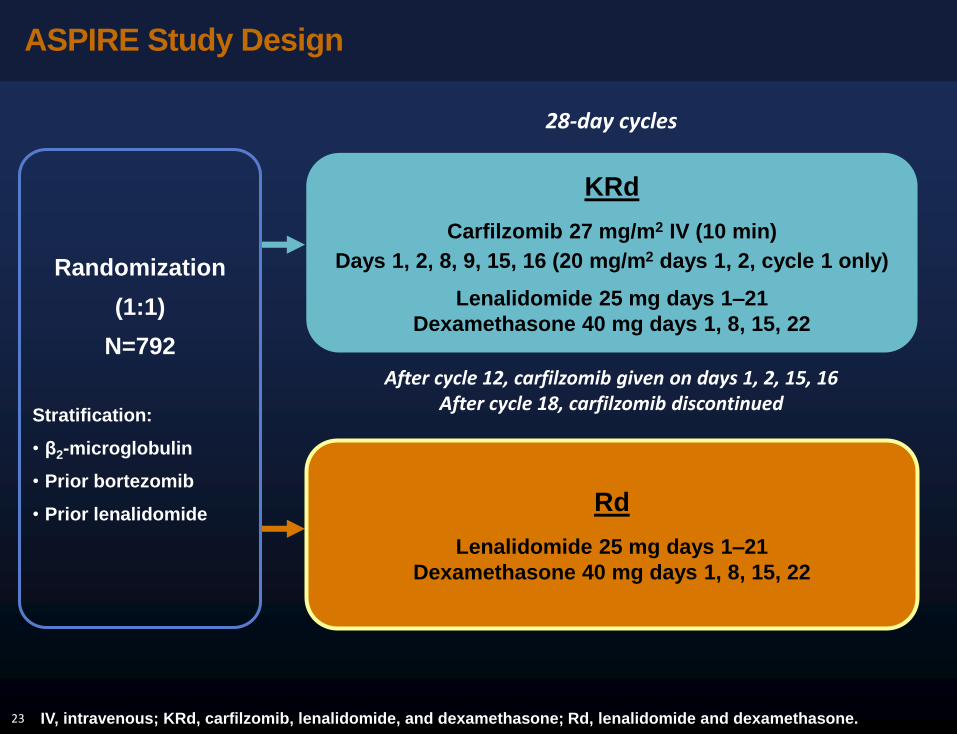
ASPIRE Study Design
23 IV, intravenous; KRd, carfilzomib, lenalidomide, and dexamethasone; Rd, lenalidomide and dexamethasone.
Rd
Lenalidomide 25 mg days 1–21
Dexamethasone 40 mg days 1, 8, 15, 22
KRd
Carfilzomib 27 mg/m2 IV (10 min)
Days 1, 2, 8, 9, 15, 16 (20 mg/m2 days 1, 2, cycle 1 only)
Lenalidomide 25 mg days 1–21
Dexamethasone 40 mg days 1, 8, 15, 22
Randomization
(1:1)
N=792
Stratification:
• β2-microglobulin
• Prior bortezomib
• Prior lenalidomide
28-day cycles
After cycle 12, carfilzomib given on days 1, 2, 15, 16After cycle 18, carfilzomib discontinued

Progression-Free Survival (PFS)Intent-to-Treat Population (N=792)
24
1.0
0.8
0.6
0.4
0.2
0.0
Pro
po
rtio
n S
urv
ivin
g
With
out
Pro
gre
ssio
n
KRd
Rd
0 6 12 18 24 30 36 42 48
Months Since Randomization
KRd Rd
(n=396) (n=396)
PFS, median months 26.3 17.6
Hazard ratio (KRd/Rd) (95% CI) 0.69 (0.57–0.83)
P value (one-sided) <.0001
No. at Risk:
KRd
Rd396 332 279 222 179 112 24 1
396 287 206 151 117 72 18 1
CI, confidence interval; KRd, carfilzomib, lenalidomide, and dexamethasone; Rd, lenalidomide and dexamethasone.

PFS by Prior Line of Therapy (1 vs ≥2)
25
1 prior line of therapy ≥2 prior lines of therapy
CI, confidence interval; KRd, carfilzomib, lenalidomide, and dexamethasone; PFS, progression-free survival; Rd,
lenalidomide and dexamethasone.
KRd
(n=184)
Rd
(n=157)
KRd
(n=212)
Rd
(n=239)
PFS, median
months29.6 17.6
PFS, median
months25.8 16.7
Hazard ratio
(95% CI)
0.69
(0.52–0.94)
Hazard ratio
(95% CI)
0.69
(0.54–0.89)
P value
(one-sided).008
P value
(one-sided).002
1.0
0.8
0.6
0.2
0.0Pro
po
rtio
n S
urv
ivin
g W
ith
ou
t P
rog
ressio
n
0 6 12 18 24 30 36 42 48
Months from Randomization
0.4
KRd
Rd
1.0
0.8
0.6
0.2
0.0Pro
po
rtio
n S
urv
ivin
g W
ith
ou
t P
rog
ressio
n
0 6 12 18 24 30 36 42 48
Months from Randomization
0.4
KRd
Rd

Impact of Stable Disease as a Response to
Pomalidomide Plus Low-Dose Dexamethasone on
Survival Outcomes in Patients With Refractory or
Relapsed and Refractory Multiple Myeloma in the
MM-003 Trial
Philippe Moreau, Katja Weisel, Kevin Song,
Craig J. Gibson, Owain Saunders, Lars Sternas,
Kevin Hong, Mohamed H. Zaki, Meletios A. Dimopoulos
EHA 2015_Oral presentation # S788
Abstract S788
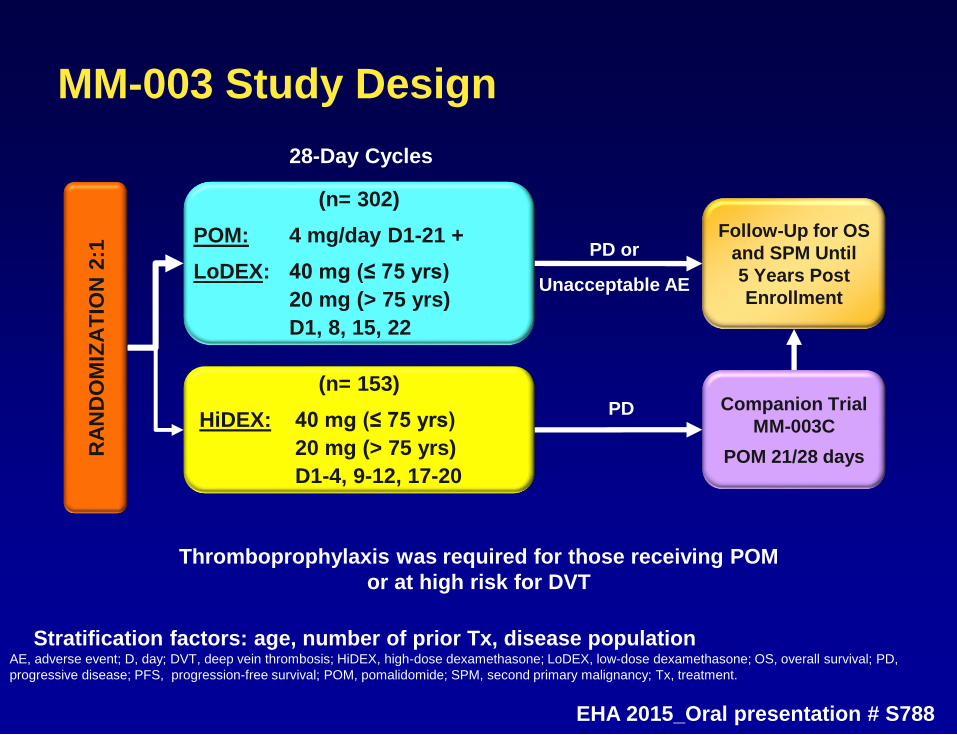
MM-003 Study Design
Thromboprophylaxis was required for those receiving POM
or at high risk for DVT
PD or
Unacceptable AE
(n= 302)
POM: 4 mg/day D1-21 +
LoDEX: 40 mg (≤ 75 yrs)
20 mg (> 75 yrs)
D1, 8, 15, 22
RA
ND
OM
IZA
TIO
N 2
:1
Follow-Up for OS
and SPM Until
5 Years Post
Enrollment
(n= 153)
HiDEX: 40 mg (≤ 75 yrs)
20 mg (> 75 yrs)
D1-4, 9-12, 17-20
28-Day Cycles
Companion Trial
MM-003C
POM 21/28 days
PD
AE, adverse event; D, day; DVT, deep vein thrombosis; HiDEX, high-dose dexamethasone; LoDEX, low-dose dexamethasone; OS, overall survival; PD,
progressive disease; PFS, progression-free survival; POM, pomalidomide; SPM, second primary malignancy; Tx, treatment.
Stratification factors: age, number of prior Tx, disease population
EHA 2015_Oral presentation # S788

Objective
• To determine the survival benefit with POM + LoDEX
Tx in pts with RRMM achieving SD in MM-003
Landmark Analyses
• Median follow-up: 15.4 mos
– Last pt enrolled: August 2012
– Data cutoff: September 1, 2013
• Landmark analyses were performed for the POM +
LoDEX arm on D1 of C3, 5, and 7
– Pts with SD were compared with pts who
achieved an overall response ≥ PR or had PD at
the same landmark point in time
C, cycle; LoDEX, low-dose dexamethasone; PD, progressive disease; POM, pomalidomide; PR, partial response; pt, patient; SD, stable disease.
EHA 2015_Oral presentation # S788
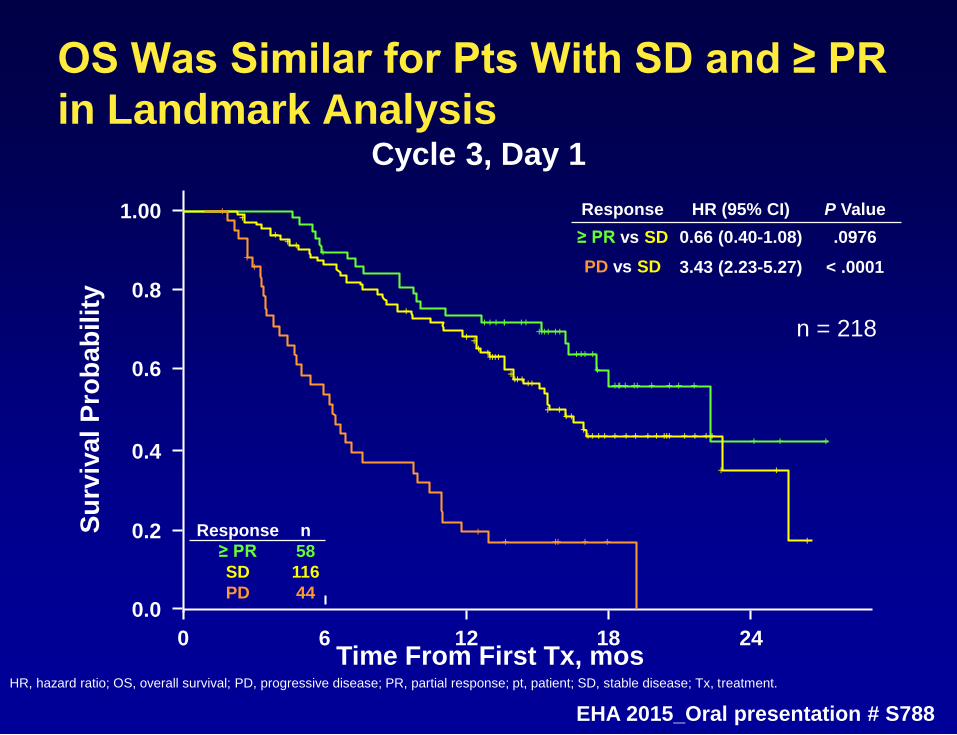
OS Was Similar for Pts With SD and ≥ PR
in Landmark Analysis
Response n
≥ PR 58
SD 116
PD 44
HR, hazard ratio; OS, overall survival; PD, progressive disease; PR, partial response; pt, patient; SD, stable disease; Tx, treatment.
Response HR (95% CI) P Value
≥ PR vs SD 0.66 (0.40-1.08) .0976
PD vs SD 3.43 (2.23-5.27) < .0001
Cycle 3, Day 1
Time From First Tx, mos
1.00
0.6
0.2
6 12 24
0.8
0.4
0.0
0
Su
rviv
al
Pro
ba
bilit
y
18
+++
+
+
+++
+++++
+ +++ +
+
+
++
++
++++++++++++++++
+ +
+
+
+++++++
++++++
++++
+
+
+++++++++
+++
+
++
++++++
n = 218
EHA 2015_Oral presentation # S788

Similar OS for Pts With SD and ≥ PR Was
Also Seen at Later Landmark Analyses
Response n
≥ PR 56
SD 57
PD 31
HR, hazard ratio; OS, overall survival; PD, progressive disease; PR, partial response; SD, stable disease; Tx, treatment.
Response HR (95% CI) P Value
≥ PR vs SD 0.75 (0.38-1.47) .3997
PD vs SD 2.91 (1.56-5.42) .0008
Cycle 5, Day 1
Time From First Tx, mos
1.00
0.6
0.2
0.8
0.4
0.00
Su
rviv
al
Pro
bab
ilit
y
+
++ ++++ ++ ++++
+++++++
++++++
+++ +++++++++ +
+++
++ ++++ ++++
+++
+++
++++++
+
+
++++
+ +
++
+
+++
+
+ ++
6 12 2418
1.00
0.6
0.2
0.8
0.4
0.00
+
+++++++
++
+++
+
++++++++ +
++
+ ++++ +++
++
++
++
++
++
+
++++++++++
++
+
++++
+++
6 12 2418
Cycle 7, Day 1
Response n
≥ PR 47
SD 40
PD 18
Response HR (95% CI) P Value
≥ PR vs SD 0.79 (0.34-1.83) .5807
PD vs SD 2.68 (1.11-6.46) .0283
n = 144 n = 105
EHA 2015_Oral presentation # S788
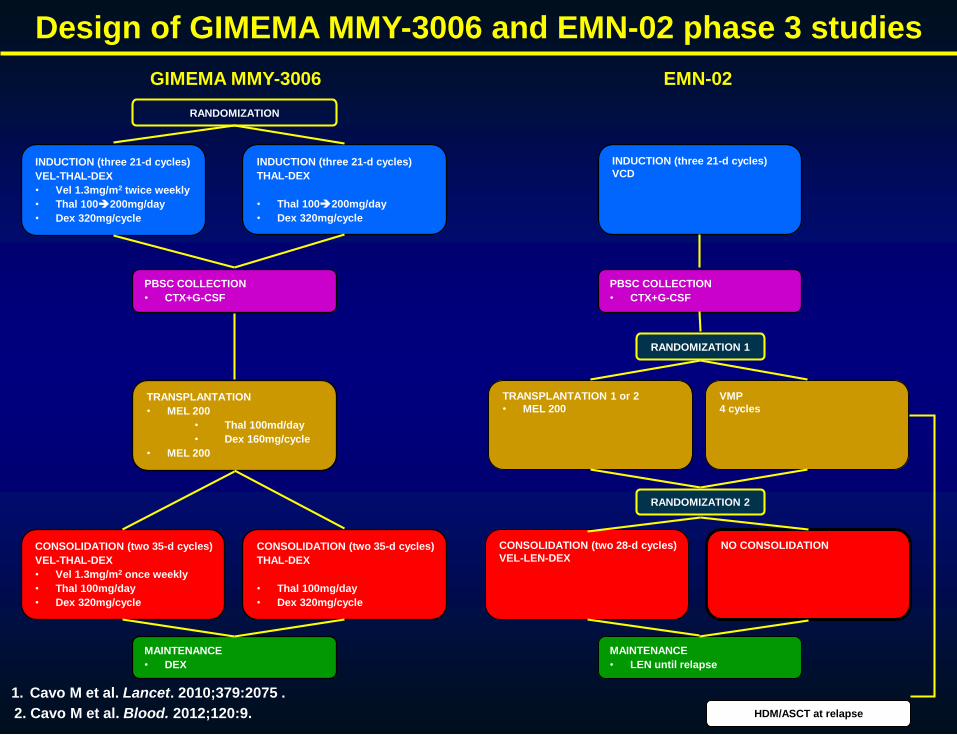
RANDOMIZATION
INDUCTION (three 21-d cycles)
VEL-THAL-DEX
• Vel 1.3mg/m2 twice weekly
• Thal 100200mg/day
• Dex 320mg/cycle
TRANSPLANTATION
• MEL 200
• Thal 100md/day
• Dex 160mg/cycle
• MEL 200
MAINTENANCE
• DEX
PBSC COLLECTION
• CTX+G-CSF
INDUCTION (three 21-d cycles)
THAL-DEX
• Thal 100200mg/day
• Dex 320mg/cycle
CONSOLIDATION (two 35-d cycles)
VEL-THAL-DEX
• Vel 1.3mg/m2 once weekly
• Thal 100mg/day
• Dex 320mg/cycle
CONSOLIDATION (two 35-d cycles)
THAL-DEX
• Thal 100mg/day
• Dex 320mg/cycle
RANDOMIZATION 1
INDUCTION (three 21-d cycles)
VCD
VMP
4 cycles
TRANSPLANTATION 1 or 2
• MEL 200
CONSOLIDATION (two 28-d cycles)
VEL-LEN-DEX
NO CONSOLIDATION
MAINTENANCE
• LEN until relapse
HDM/ASCT at relapse
RANDOMIZATION 2
Design of GIMEMA MMY-3006 and EMN-02 phase 3 studies
GIMEMA MMY-3006 EMN-02
PBSC COLLECTION
• CTX+G-CSF
1. Cavo M et al. Lancet. 2010;379:2075 .
2. Cavo M et al. Blood. 2012;120:9.

1 8 15 21
Induction: 3 x 21-day treatment cycles
VEL VEL VEL
Dex Dex Dex
THALIDOMIDE
VEL
Dex
4 112 5 9 12
Schema of VTD and VCD regimens
Bortezomib 1.3 mg/sm i.v. Dexamethasone 40 mg Thalidomide 100 → 200 mg/day
1 8 15 21
Induction: 3 x 21-day treatment cycles
VEL VEL VEL
Dex Dex Dex
CTX
VEL
Dex
4 112 5 9 12
Bortezomib 1.3 mg/sm i.v. Dexamethasone 40 mg Cyclophosphamide 500 mg/sm i.v.
CTX

VTD
(n=236)
VCD
(n=236)
Age (years) 58 (52-62) 57 (52-62)
Male vs Female 58% vs 42% 56% vs 44%
Β2m (mg/L) 3.00 (2.30-4.40) 3.18 (2.32-4.60)
Alb (g/dL) 3.83 (3.40-4.32) 3.81 (3.45-4.20)
ISS I vs II vs III 45% vs 39% vs 16% 45% vs 39% vs 16%
Hb (g/dL) 11.15 (9.60-12.50) 11.20 (9.80-12.60)
Plts (109/L) 231 (187-287) 233 (183-277)
Creat (mg/dL) 0.85 (0.70-0.97) 0.85 (0.70-1.02)
IgG vs IgA vs BJ vs Others 65% vs 17% vs 17% vs 1% 64% vs 19% vs12% vs 5%
Del(17p) and/or t(4;14) 24% 24%
Del(13q) with or without del(17p)
and/or t(4;14)47% 49%
Continuous variables are expressed as median (IQR) and categorical variables are expressed as %
Patient demographics and baseline characteristics
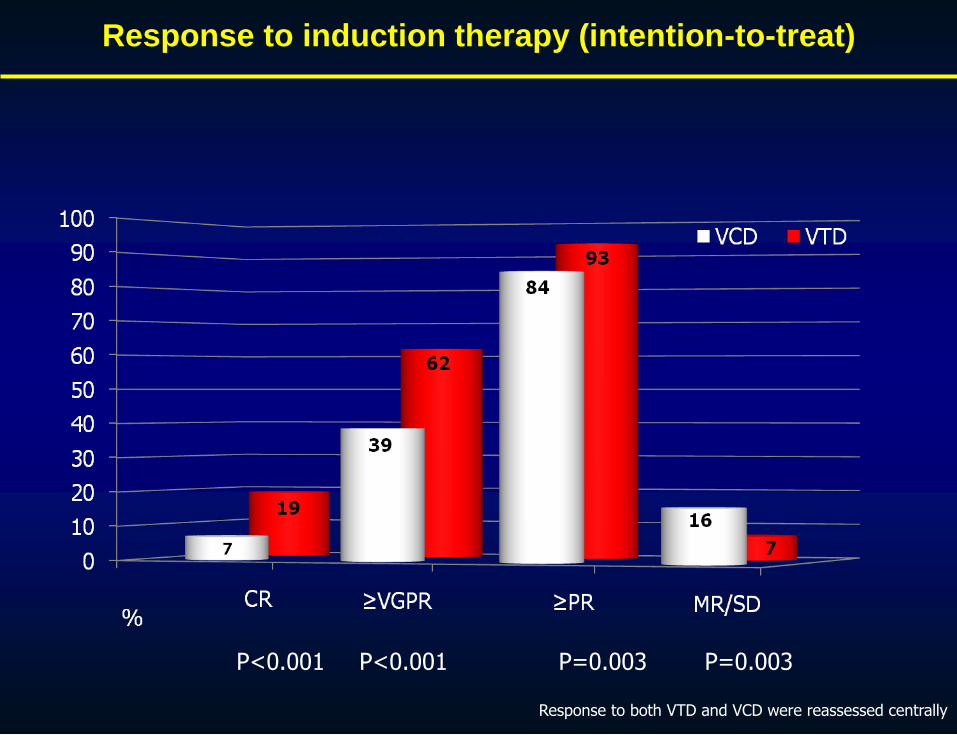
Response to induction therapy (intention-to-treat)
P<0.001 P<0.001 P=0.003 P=0.003
Response to both VTD and VCD were reassessed centrally

CR and ≥ VGPR rates in high risk subgroups of patients
P<0.001 P<0.001 P=0.155 P<0.001
Response to both VTD and VCD were reassessed centrally

IMPROVED OVERALL SURVIVAL WITH
AUTOLOGOUS TRANSPLANT VS
CYCLOPHOSPHAMIDE-LENALIDOMIDE-
DEXAMETHASONE IN NEWLY DIAGNOSED
MYELOMA: A PHASE 3 TRIAL
Gay F,1 Genuardi M, 1 Hajek R,2 Petrucci MT,3 Pour L,4 Falcone AP, 3 Offidani M, 3 Patriarca F,3 Corradini P, 3 Gilestro M,1 Pescosta N, 3 Carella AM, 3 Finsinger P, 3 Liberati AM, 3 Petrò D, 3
Pulini S, 3 Oliva S, 1 Di Raimondo F, 3 Spencer A,5 Boccadoro M, 1 Palumbo A. 1
1 Myeloma Unit, Division of Hematology, University of Torino, Torino, Italy; 2 Faculty of
Medicine, University of Ostrava and Department of Haematooncology, University Hospital
Ostrava, Ostrava, Czech Republic; 3 Italian Multiple Myeloma Network, GIMEMA, Italy; 4
Department of Hematology and Oncology, University Hospital Brno, Brno, Czech Republic;
5 Alfred Health-Monash University, Melbourne, Australia.

l 389 patients (younger than 65 years) randomized from 59 centers
l Patients: Symptomatic disease, organ damage (CRAB),measurable disease
Treatment schedule
Rdfour 28-day courses
R: 25 mg/d, days 1-21
d: 40 mg/d, days
1,8,15,22
CRDsix 28-day courses
C: 300 mg/sqm, days 1,8,15
R: 25 mg/d, days 1-21
D: 40 mg days 1,8,15,22
MEL200-ASCTtwo courses
M: 200 mg/m2 day -2
Stem cell support day 0
RP MAINTENANCE 28-day courses until relapse
R: 10 mg/day, days 1-21
P: 50 mg every other day
R MAINTENANCE28-day courses until relapse
R: 10 mg/day, days 1-21
R
A
N
D
O
M
I
Z
A
T
I
O
N
1°
R
A
N
D
O
M
I
Z
A
T
I
O
N
2°
R, lenalidomide; D, dexamethasone; C, cyclophosphamide; P, prednisone; Rd, lenalidomide-dexamethasone; CRD, cyclophosphamide-lenalidomide-
dexamethasone; MEL200-ASCT, melphalan 200 mg/m2 followed by autologous stem cell transplantation; RP lenalidomide-prednisone,

MEL200-ASCT vs CRD
CRDsix 28-day courses
C: 300 mg/m2/d, days 1,8,15
R: 25 mg/d, days 1-21
D: 40 mg/d days 1,8,15,22
MEL200-ASCTtwo courses
M: 200 mg/m2 day -2
Stem cell support day 0
R
A
N
D
O
M
I
Z
A
T
I
O
N
1°
CRD, cyclophosphamide-lenalidomide-dexamethasone; C, cyclophosphamide; D, dexamethasone; R, lenalidomide; MEL200-ASCT, melphalan 200 mg/m2
followed by autologous stem-cell transplantation

MEL200-ASCT vs CRD
Progression-free survival
Median follow-up : 55 months
Median PFS
MEL200-ASCT 43.3 months
CRD 28.6 months
MEL200–ASCT, melphalan 200 mg/m2 followed by autologous stem cell transplantation; CRD cyclophosphamide lenalidomide dexamethasone; PFS,
progression-free survival.
MEL200-ASCT
CRD
HR 0.40 95% CI 0.25-0.63 P< 0.001
% o
f p
ati
en
ts
Months0 10 20 30 40 50 60 70
0.0
0.2
0.4
0.6
0.8
1.0

MEL200-ASCT vs CRD
Second-line therapy
MEL200 –ASCT, melphalan 200 mg/m2 followed by autologous stem cell transplantation; CRD, chyclophosphamide lenalidomide dexamethasone; IMIDs, immunomodulatory
agents
No Transplant at relapse
8%
39%
68%
49%
15%
7%
9%
5%
0% 20% 40% 60% 80% 100%
MEL200-ASCT
CRD
Transplant at relapse Bortezomib IMIDs Other

MEL200-ASCT vs CRD
Overall survival
Median follow-up : 55 months
MEL200-ASCT
CRD
4-year OS
MEL200-ASCT 86%
CRD 71%
HR 0.42 95% CI 0.23-0.76 P= 0.004
MEL200–ASCT, melphalan 200 mg/m2 followed by autologous stem cell transplantation; CRD cyclophosphamide lenalidomide dexamethasone; OS,
overall survival.
Months
% o
f p
ati
en
ts
0 10 20 30 40 50 60 70
0.0
0.2
0.4
0.6
0.8
1.0

Abstract S105
UPDATED OVERALL SURVIVAL ANALYSIS OF THE
FIRST STUDY: CONTINUOUS LENALIDOMIDE PLUS
LOW-DOSE DEXAMETHASONE VS MELPHALAN,
PREDNISONE, AND THALIDOMIDE IN PATIENTS
WITH NEWLY DIAGNOSED MULTIPLE MYELOMA
Thierry Facon , Meletios A Dimopoulos , Cyrille Hulin , Lotfi Benboubker,
Andrew Belch , Heinz Ludwig , Antonio Pinto , Michel Attal , Michele Cavo ,
Philippe Moreau , Rik Schots , Nathalie Meuleman , Katia Weisel , Mourad
Tiab , Je-Jung Lee , Andrew Butler , Jennifer Marek , Guang Chen , Annette
Ervin-Haynes , Jean Paul Fermand
EHA 2015_Oral presentation #S105

FIRST: Trial Design
EHA 2015_Oral presentation #S105

FIRST: Updated OS
• Updated 4-year survival: 60% with Rd continuous vs 57% with Rd18 and 51% with
MPT
EHA 2015_Oral presentation #S105
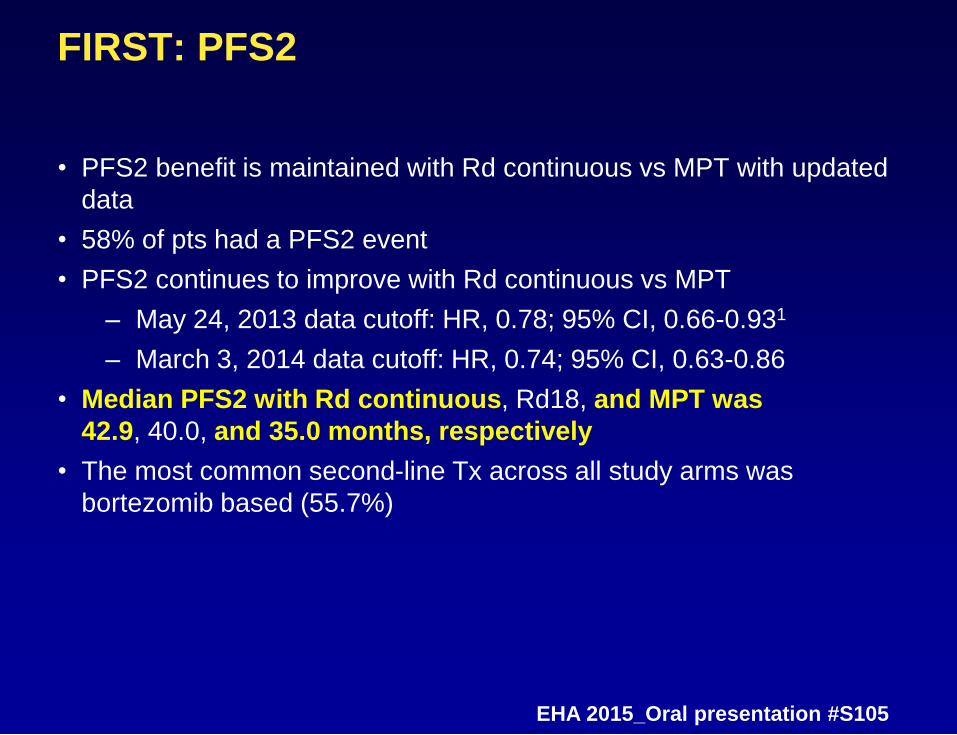
FIRST: PFS2
• PFS2 benefit is maintained with Rd continuous vs MPT with updated
data
• 58% of pts had a PFS2 event
• PFS2 continues to improve with Rd continuous vs MPT
– May 24, 2013 data cutoff: HR, 0.78; 95% CI, 0.66-0.931
– March 3, 2014 data cutoff: HR, 0.74; 95% CI, 0.63-0.86
• Median PFS2 with Rd continuous, Rd18, and MPT was
42.9, 40.0, and 35.0 months, respectively
• The most common second-line Tx across all study arms was
bortezomib based (55.7%)
EHA 2015_Oral presentation #S105


