Timing of Mergers and Acquisitions: Evidence from the Canadian Stock Market
Imen Tebourbi* CEREG
Université Paris Dauphine
First Version: October 2004 This version : May 2005
JEL classification: G14, G34 Keywords: mergers and acquisitions, market efficiency, timing
* Cereg, Université Paris IX Dauphine, Place du Maréchal de Lattre de Tassigny, 75776 Paris Cedex 16. Tel : +33 1 44 05 44 05. E-mail : [email protected]

Timing of Mergers and Acquisitions: Evidence from the Canadian Stock Market
Abstract: This paper provides evidence of merger timing induced by investors’ overoptimism. The aggregate number of mergers is used to search for periods that could be more favourable for acquisitions and thus to distinguish between hot and cold merger markets. We examine the movements of bidding firms’ stock prices, around, before and after mergers and acquisitions announcements. Our results provide strong evidence that mergers are driven by stock market valuation and that these events occur during periods when investors are highly overoptimistic and react irrationally to a merger announcement. Using, firm, transaction and market specific variables, we find evidence that bidders’ managers manipulate the market by timing their mergers and paying with stock. The market can however, correct itself when merger results start to appear, that is one year after the event.
1

The literature has defined a number of motives behind mergers and acquisitions,
including for example, efficiency, agency costs, regulation and diversification.
This literature sustains that mergers and acquisitions create value. In practice
these synergies are not reflected in the long-term post-merger stock returns,
especially for those firms making stock acquisitions.
An idea dating back to Nelson (1959) could probably better explain the
underperformance of acquirers in the long run. Nelson (1959) studies the merger
waves in the U.S and proposes that: “merger expansion was not only a
phenomenon of prosperity, but that it was also closely related to the state of the
capital market. Two reference cycle expansions, unaccompanied by a strong
upswing in stock prices were marked by the absence of merger revival.” In other
words, the author suggests that stock market valuation is a key driver of the
market for corporate control. This theory has not been among the leading
theories of mergers.
More recently, academics have turned to this hypothesis and considered
the role of investors’ misvaluation in the acquisition process. Dong, Hishleifer,
Richardson and Teoh (2003) show that when the stock market is overvalued,
stock is more likely to be used as a means of payment rather than cash. If
managers do think that the market misvalues their firms, then the informational
and allocative role of equity markets is distorted. For example, Baker and
Wurgler (2000) suggest that the initial public offerings and capital structure
changes may not be motivated by investment opportunities and need for funds,
but instead by the opportunity to take advantage of misvaluation. Shleifer and
Vishny (2003) analyze how irrational shifts in investor sentiment can affect the
takeover market. They argue that mergers and acquisitions may occur for the
sole reason that overpriced equity can be used as means of payment. Negative
2

net present value projects may be undertaken when equity is perceived as
"cheap" and positive net present value projects may be foregone when equity is
perceived as "expensive". This mispricing is suggested as an explanation of the
long-run performance of acquiring firms. Rau and Vermaelen (1998) find that the
long-run underperformance of acquirers is driven by the post-acquisition
performance of low book-to-market acquirers. These acquirers earn superior
returns around the announcement, however, their long-run performance is
worse than the high book-to-market acquirers. Loughran and Vijh (1997) also
suggest that the long-run underperformance of stock acquisitions reflects the
overvaluation of the acquirers around the acquisition announcement.
Our goal is to study if there is a form of merger timing. We aim to examine the
reasons why and when acquisitions occur and to understand the sources of
merger timing. We test three competing theories that could explain the merger
timing: (1) investors’ sentiment, (2) managerial motivations and hubris
hypothesis, and (3) economic shocks.
Our analysis has the originality to distinguish between the different merger
market status: hot and cold and focus on the stock patterns during each market
status. To understand the merger timing process, we control for the acquirer
performance in the periods of one year before and one year after the merger
announcement, and over the three days surrounding the announcement. This
procedure allows us to control for the information dissemination that could
occur before and even after a merger announcement and completion. We use
firm, transaction and market specific variables to come up with a set of common
variables that could be associated to hot and cold cycles.
We base our empirical analysis on a data set of acquisitions made by publicly
traded Canadian acquirers. The sample includes 462 transactions involving
3

public and non-public targets, between January 1988 and December 2002. The
data are drawn from the SDC Mergers and Acquisitions database.
Our results provide strong evidence on the existence of merger timing. Our
results demonstrate that investors’ overoptimism is a key driver of the
acquisition process. These transactions occur during periods when investors are
highly overoptimistic and react irrationally to a merger announcement.
Consistent with Shleifer and Vishny (2003) arguments, we find evidence that the
bidders’ managers are aware of the overvaluation of their firms and act
rationally by timing their mergers and paying with stock.
During hot merger markets, acquirers significantly outperform the market
benchmarks during the pre-merger year. The outperformance is even higher for
firms paying with majority stock (more than 50% stock is used in payment).
Moreover, there is a dramatic reversion in performances in the year following the
announcement, especially for majority stock payers. This reversion is high
enough to wipe out the prior gains for this category of acquirers.
Another finding is that in hot markets and even when stock is used in payment,
the announcement stock reaction is positive. This result suggests that in hot
markets investors have unrealistic expectations about the synergies from the
merger.
The remainder of this work is structured as follows. Section I summarises the
literature on the possible origins of merger timing and expose the assumptions
on which we build our study. Section II presents our data, methodology and
results, the final section concludes.
4

Section I: Literature Review on the possible sources of mergers and
acquisitions timing
The timing of a merger could have three causes: investors’ sentiment and
asymmetric information, economic shocks, and managerial motivations.
1- Investors’ sentiment and asymmetric information
This concept dates back to Hickman (1953), and was more developed by the
literature on initial public offerings (IPOs) and seasoned equity offerings (SEOs),
which suggests that in hot markets1, investors may be overly optimistic. Choe,
Masulis and Nanda (1993) discuss the clustering of equity issues in certain time
periods. They also suggest that certain periods offer “windows of opportunity” 2
in which capital raising can be done at a lower cost. In the same context, Myers
and Majluf (1984) argue that managers can time their equity issues for periods
when the level of asymmetric information is low. This is the best way to reduce
the information costs. Bayless and Chaplinsky (1996) suggest that periods of
relatively high issue volume should correspond to periods of reduced
information costs and find evidence of over-optimism in hot markets. Loughran,
Ritter and Rydqvist (1994) report that issuing in hot markets may be worse than
average for the investors. Since managers are able to time their issues, they
profit from investors ‘optimism3.
1 Hot markets are defined by Bayless and Chaplinsky (1996) as periods of high equity volume. 2 Bayless and Chaplinsky (1996) define windows of opportunity to be “time periods when
information costs are reduced for all firms. Therefore, hot issue markets constitute windows of
opportunities only to the extent that the observed variations in announcement date prediction
errors are independent of the characteristics of the issuing firm.”
3 Loughran and Ritter (1995) suggest that high returns on SEOs are also due to investors’ over-optimism.
5
In line with the arguments on SEOs/IPOs, mergers and acquisitions are likely to
be financed with equity in hot periods. Recently, literature turned to these
arguments. A small and growing literature started applying the timing concept
to M&As. In the context of mergers and acquisitions, Shleifer and Vishny (SV)
(2003) argue that stock market valuation drives mergers and acquisitions. Since a
special story was developed to explain different takeover waves, SV proposed
that the theory of stock market valuation can be a unified theory for these
different stories. The authors propose a model based on the financial market
inefficiencies, in the sense that some firms are misvalued. They suggest that
“managers are completely rational, informed, understand stock market
inefficiencies and take advantage of them in part through merger decisions”
(page 296). In a way, their main idea is the opposite of the hubris hypothesis
developed by Roll (1986) who suggests that in corporate takeovers, stock markets
are rational while managers are not.
Since managers are rational, informed and operate in a less rational market, they
understand the stock market mechanism and can evaluate the deviation, from
efficiency in the short run, of their stock and the target’s. They are also able to
estimate the perceived synergies and they employ their knowledge to maximize
their own wealth. The markets can correct themselves in the long-run but in the
short-run, investors can be fooled and do not react to manipulation. SV argue
that when market or industry inefficiencies are high, most of the acquisitions are
made for stock. They suggest that earning manipulation and insider selling are
some of the operations done by the bidders in stock acquisitions, which provide
support for the overvaluation of these bidders. In other words, investor’s
sentiment affects stock market valuation. This misvaluation can be attributed to
entire industries, sectors or group of firms with the same characteristics.
According to SV (2003), the perceived synergy is “just the lubricant that greases
the wheels of the mergers and acquisitions (M&A) process – it might be invented
6

by investment bankers or academics and have little to do with the reality of what
drives actual acquisitions” (page 298).
SV suggest that short-run market perceptions may lead at least in part, the
takeover activity. In fact, they argue that if the market believes that the
acquisition can drive positive synergy without being over-optimistic, bidding
shareholders can realise some gain from its higher valuation. These gains will be
diluted in the long-run, when the long-run prices return to efficiency.
SV also suggest that in the long-run, bidding firms can gain, even when the
observed stock returns are negative, if the price they pay to the target is lower
than the perceived synergy from the acquisition. They argue that without the
acquisition, returns would have been more negative. This result will especially
prevail when the initial returns observed are important.
Rhodes-Kropf and Viswanathan (RKV) (2002) also propose that high market
valuations (period of time when average book-to-market ratios are at their
highest) drive stock mergers and cause intense merger activity. SV derive the
same conclusion by assuming that acquirer managers are rational evolving in an
irrational stock market. However, RKV put a link between valuation errors and
stock merger activity and attribute this correlation to a rational theory based on a
process in which the target and the acquirer have private information that tells
them whether they are under- or over-valued, but they are not able to
distinguish the sources of this misvaluation. RKV propose that if the market-
wide overvaluation is high, managers will be able to estimate the synergies that
could result from the merger. With this reasoning, RKV theory can be
distinguished from SV’s, since in the latter proposition there is no place for
synergies. However, both SV and RKV theories of misvaluation agree that the
7

valuation error can be attributed to adverse selection, behavioural bias or to
asymmetric information.
RKV also consider the two components of misvaluations: a firm-specific
component and a market-wide component. Moreover, they consider the
possibility of a sector specific mispricing and suggest that this component could
explain the diversifying mergers. This idea supposes the existence of one or more
mispriced factors that are common to firms in the same industry. RKV suggest in
this context, that mergers are more likely to cluster in overvalued markets
industries/sectors. They propose that bidders in overvalued industries buy firms
in less overvalued industries and this could provide an explanation to the
diversifying mergers.
Jensen (2004) suggests that high equity valuations may cause suboptimal action,
that could take the form of mergers. In fact, CEOs take advantage in maintaining
unreasonably high stock prices, even if their strategies could destroy value, at the
end.
The foundation of these theories are in part rooted in the asymmetric information
arguments (Myers and Majluf, 1984), which suggest that informed managers will
use stock as a currency if they believe that their shares are over-valued and thus
may accomplish the takeover at a bargain price. Thus, if managers have
information not held by the market, mispricing could occur even in an efficient
market. This theory suggests that managers time their merger transactions in a
way that allows them to acquire with stock when the stock price is at its lowest.
RKV suggest that this will contaminate the B/M, which will not only reflect the
growth opportunities but also the mispricing.
8

Another possible foundation for SV and RKV theories is that the same
mechanism could arise from irrational markets, which suppose that financial
markets are inefficient and value firms incorrectly. Under this view, managers
manipulate inefficient markets by acquiring firms with an overvalued currency.
Rhodes-Kropf, Robinson and Viswanathan (RKRV) (2003) build on RKV and SV
models and model the misvaluation to explore the correlation between valuation,
merger activity and the method of payment in merger transactions. Using a
panel study and accounting variables, RKRV (2003) break down the market-to-
book (M/B) into firm specific error, time-series sector error and long-run value-
to-book. They find a strong support to the idea that mergers are caused by the
deviation from fundamental values which is captured by the two first
components that result from the decomposition of the M/B.
RKRV add a third explanation to the correlation above, that could compete with
the explanation provided by the asymmetric information theory and the
behavioural theory. In fact, they proposed that from a q-theory perspective,
mergers occur when firm-specific discount rates are low or when expected
growth opportunities are high. This result supports Martin (1996) and
demonstrates that high q-firms use stock.
Dong et al (2002) also provide evidence that irrational market misvaluation
influences different aspects of the takeover market. They argue that stock market
misvaluation affects the volume and characteristics of takeover transactions.
Moreover, they report that the misvaluation of bidders and targets influences the
method of payment, the bid premium, hostility of the target to the offer, the offer
success, the announcement and the long-run abnormal returns. They build their
hypothesis on the behavioural model discussed by SV (2003) and supported by
Brealy and Myers (2000) who discuss what they call “boostrap game”; they
consider that the bidder takes advantage of the tendency of investors to interpret
9

price/earnings ratio naively. Dong et al. (2002) use the analysts’ estimates of
future earnings and M/B to make their analysis. However, they find mixed
support for the idea that market misvaluation is a key driver to merger activity
since they did not address the fact that analysts’ estimates could reflect expected
future merger activity.
Ang and Cheng (2003) provide empirical evidence supporting the market-driven
acquisition theory proposed by SV (2003). In particular, their results suggest that
acquiring firms are more overvalued than non-acquiring firms, acquirers are
more overvalued than their targets, and successful acquirers are more
overvalued than unsuccessful acquirers. Moreover, their results show that the
overvaluation increases the probability of firms of becoming acquirers and using
their own stocks as a medium of exchange.
Friedman (2004) suggest that one of the consequences of the stock market driven
acquisitions hypothesis of SV, is that overvaluation increases the premium paid
to the target in equity mergers but not in cash mergers. This effect can be
obtained for two reasons. The first is that the acquiring firm gains from paying
with an overvalued currency to target in an equity deal. The second is that the
buyer is less patient since the deal must be concluded before the overvaluation
collapses. Friedman (2004) exploit this asymmetry to test SV hypothesis. His
methodology consists in regressing merger premia on proxies of overvaluation.
The author demonstrate that acquirer overvaluation, has a differentially positive
effect on target premia in equity mergers.
Hypothesis H1:
If managers are able to time their mergers when investors are over-optimistic, the
announcement abnormal returns should be higher than at other periods. If hot
10

markets are characterized by over-optimism and if investors’ optimism
encourages firms to make bad acquisitions, then post merger performance
should be worse in hot markets than in cold markets. The stock prices reaction
should reverse on a longer run, when the results of the merger will be evident.
This can be a proof that, periods of mergers clustering do not create more
synergies than mergers done in other periods. This correlation between merger
and over-optimism can be evidence of merger timing.
2- Managerial motivations
Managerial motivations can also be a source of merger timing. Some researchers
suggest that the fear of takeovers may drive managers to be short-sighted, to
behave myopically and to privilegiate short term benefits rather than long-run
benefits by making investments that undervalue future cash-flows while
overvaluing current cash-flows.
Jensen (1988) suggests that this phenomenon could occur for example, when
managers hold little stock in their companies and when their compensation
encourages them to make decisions to increase accounting earnings rather than
the value of the firm. This phenomenon could also occur when managers do not
understand the mechanisms that determine the stock values and therefore do not
make the right investment decisions.
Morck et al (1990) argue that if making an acquisition prevents a company from
being a target and being acquired, managers may make such investments to
preserve their positions and private benefits. These decisions are defensive
strategies and could occur even if the acquisition is not profitable.
11

Gorton (2000) argues that defensive mergers can result from economic shocks. If
this is the case, managers’ motivations can possibly be the key to timing the
mergers and drive bad acquisitions.
Managerial motivations are examined from two perspectives. First, the conflict of
interest hypothesis predicts that bidder managers knowingly engage in
acquisitions that will profit them personally even if their actions will result in
stock price decline and consequently decrease shareholders wealth. By making
such operations, managers can take advantages from greater job security.
Moreover, expanding the firm beyond its optimal size (size that maximizes
shareholder wealth), managers can benefit from greater power by increasing the
resources under their control, and changes in management compensation are
positively related to growth (as measured by sales growth).
Another factor that can give incentives to managers to have a bias toward
growth is the tendency of firms to reward middle managers through promotion
instead of year-to-year bonuses. Growth can afford these managers with better
positions that will make them benefit from the reward that goes with the
promotion.
Hubris hypothesis is a second hypothesis that can determine managers’
motivations. This hypothesis predicts that managers tend to overestimate their
ability to manage the target firm. Thus, they mistakenly believe that the takeover
will increase the stock price of the bidder firm. Therefore, they overpay the
target. Roll (1986) argues that the premium paid to the target is a transfer from
the bidder firm. Under a strong market efficiency hypothesis, Roll (1986)
suggests that the target market price reflect the full value of the firm. If the
bidder overestimates the target, this results from hubris, i.e. the excessive self-
confidence (arrogance, pride) of the managers. Hubris results in overpaying for
the target. In fact, acquirer managers make this mistake because they overrate the
12
synergistic gains from acquisition. This is due to their high confidence in their
own managerial abilities.
Some studies suggest that the potential competition can cause the winning
bidder to pay too much. However, Roll (1986) hypothesizes that even without
the competition, hubris managers, can commit errors due to their over-optimism
in evaluating merger opportunities. Roll (1986) assumes that the managers’
arrogance is linked to the fact that they are controlling a high valued, successful
firm, which is bidding for a lower-valued firm. If the target is poorly performing,
bidder managers can create value by improving the management quality and by
introducing new business projects, since they have already caused the success of
the bidder firm in the part. However, the past success they have realized may
cause high self-worth of managers in their abilities and the supremacy feeling
can lead them to overestimate the possible synergies created by the takeover and
result in overpayment.
Gulgler et al. (2004) build on Galbraith (1961, p. 8) to understand the link
between managerial motivations and merger waves. The authors suggest that
during stock market bubbles investors are overoptimistic, and tend to accept any
news as good news, which changes the cost to managers from announcing
unprofitable mergers. Gulgler at al. (2004) suggest that announcing the same
mergers in normal conditions would result in a fall in the acquiring firm’s share,
which is large enough to prevent the managers from undertaking the merger.
However, announcing the transaction during bubbles would result in a positive
stock market reaction. Investors’ overoptimism is combined with managers
incentives since this optimism frees managers to finance unprofitable mergers by
issuing shares and also frees their hands to use more a their cash-flows to finance
mergers.
13

Hypothesis H2: If mergers are driven by managers’ hubris, we should observe a
stock price increase in the year prior to the merger announcement.
If managerial discretion motivates mergers, we also would expect positive
announcement reaction (or at least not negative) since managers are supposed to
time their transaction in periods of investors’ overoptimism. The positive
reaction will be followed by a reversion after the merger completion.
3- Industry effects
The neoclassical theory suggests that mergers generate synergies. A recent strand
of literature builds on this theory. Mitchell and Mulherin (1996) analyze two
different issues observed in mergers in the last decade. The first is that mergers
occur in waves and the second is that there is an industry clustering within a
wave. Mitchell and Mulherin (1996) argue that the observation of industry-
specific merger waves occur as a response to regulatory, technological and
economic shocks. This gives support to the assumption that industries have a
tendency to restructure in concentrated periods of time. The authors studied
mergers during 1982-1989 and show that high merger activity can occur at an
industry level and are associated to economic shocks. Moreover, Mitchell and
Mulherin (1996) suggest that industry shocks are hard to predict which explains
the merger clustering within an industry and in a certain period of time. The
composition of industries, which are restructuring and showing high merger
level, change from one wave to another. This change is also unpredictable.
Mitchell and Mulherin show that takeover activity in the 1980’s can be explained
in a large proportion by deregulation, oil price shocks, foreign competition and
financial innovations.
14

Andrade, Mitchell and Stafford (2001) build on Mitchell and Mulherin (1996)
study and study merger waves from the 1970’s to the 1990’s. They conclude that
shocks involving deregulation played a determinant role in the creation of the
phenomenon of merger clustering within some industries, especially in the late
1980’s and in the 1990’s.
However, as mentioned by Gugler et al (2004) the industry shock hypothesis
ignores the correlation between merger waves and the stock market booms.
Gugler et al (2004) suggest two hypotheses to associate these events together.
Either a single exogenous event causes both series of industrial merger waves
and the stock market boom. The other suggestion is that the stock market itself
causes a series of industry merger waves.
Hypothesis H3: If shocks tend to increase the synergies from takeovers, then we
could expect bidder gains to increase. Consequently, mergers occurring in shock
periods should correspond to periods of hot markets and result in a positive
correlation between announcement returns and hot merger markets. In this case,
the increase in stock prices should not reverse over the subsequent periods. In
fact, if mergers are made to exploit synergies, then they should add value to the
firm. However, if mergers are motivated by managers’ objectives then mergers
occurring in hot periods will be worse than those occurring in cold periods. At
least after mergers that are completed in hot markets, we should observe weak
performance.
15
Section II: Data and methodology
1- Data
We obtain our data sets of mergers and acquisitions from the Securities Data
Corporation Worldwide Mergers and Acquisitions database (SDC). The data
meets the following criteria:
1- We consider only transactions made by Canadian firms;
2- The announcement date is from 1988 to 2002 inclusively;
3- The acquirer must be a public company traded on the Toronto Stock
Exchange (TSE);
4- The percent of shares acquired in the transaction should be greater than
50% of the target;
5- The deal must have been completed;
This selection gives us an initial sample of 3069 transactions. As a second step,
only the transactions classified as: mergers or acquisitions of majority interest are
kept. We exclude all the cases defined as an acquisition of assets, an acquisition
of certain assets, a buyback, or a recapitalization. This results in a sample of 1111
transactions.
Financial information and daily stock returns are extracted from Compustat and
the TSE Western Database respectively. We retain only the companies with data
in both databases. The final sample comprises 462 transactions involving 253
acquirers.
Please insert Table 1
16

Panel A of table 1 reports the annual numbers of acquisitions completed over the
1988-2002 period. Panel B categorizes the sample by different characteristics. 361
out of 462 transactions in our sample are mergers. We also note that the presence
of competing bidders is rare (only 4% of the cases). We classify the relatedness of
bidder and target activities by their SIC codes. More than 60% of the transactions
are between related businesses, i.e between firms having the same primary SIC
code (2-digit, 3-digit or 4-digit SIC codes in common).
Panel C gives the statistical properties of the transactions. Mergers and
acquisitions values vary highly; the average is 202.96 million USD, while the
median is 23.64 million USD. The mean percentage of shares acquired is 89.45%.
Panel D presents acquisitions by primary SIC code. In Canada, over 23% of the
462 transactions are in the resources industry (SIC 1000). The rest of the
transactions are distributed across several industries.
Finally, panel E presents the distribution of local and cross-sectional mergers and
acquisitions in our sample, and panel F gives the distribution by target nation.
We note the presence of 165 cross-border transactions, out of which, 96 involve a
U.S. target.
2- Methodology
2-1 Identification of hot, cold and normal markets:
We define hot and cold mergers and acquisitions (M&A) markets using the
aggregate number and value of M&A occurring during the period from January
1988 to December 2002 obtained from Crosbie and Cie monthly releases.
17
We use two definitions of aggregate value: nominal dollar and real dollar. Real
dollar value is monthly nominal value of M&A deflated by the monthly
Consumer Price Index (CPI).
We rank a three-month moving average of M&A value (number) into quartiles.
We define hot periods as at least three consecutive months where the value
(number) of M&A exceeds the upper quartile. The cold periods are at least three
consecutive months where the value (number) of M&A stands below the lower
quartile. The M&A that fall between the upper and the lower quartiles are
classified in the normal period4.
More than 78% of our sample receive the same classification into the hot, cold
and normal markets, whether we use a rank based on the number or value
(nominal and real) of the aggregate M&A in Canada. Consequently, the
remainder of this paper focuses on results using a classification based on the
aggregate number of M&A.
Please insert Figure 1 and Table 2
Figure I plots the classification of hot and cold merger markets as measured by a
three month moving average of the aggregate number of mergers and
acquisitions.
Table 2 shows that while hot markets are concentrated in a five-year period
(between 1996 and 2000), cold markets occur at both the beginning and the end
of the sample period. In our sample, 159 of 462 transactions occur during hot
markets and are concentrated in 36 months out of 168 months that compose the
4 This procedure was used by Bayless and Chaplinsky (1996)
18

total period of study. 53 mergers and acquisitions occur in cold markets during
34 months. The remaining 250 transactions take place in normal markets.
2-2 Abnormal returns for M&A in hot, cold and normal markets
Table 4 presents the average cumulative daily abnormal returns for the total
sample of M&A in hot, cold and normal markets, for the period of 1 year prior to
the announcement (-366, -2), the three days around the announcement (-1,1) and
a period of 1 year following the announcement (2, 366). We consider day t=0, as
the announcement date.
In fact, if we choose a short-window of study, around the announcement date, as
it is done in the existing literature (Fuller et al. (2002), Rosen (2003)), we will not
be able to capture the information dissemination prior to the announcement and
after the merger completion. In this context, Foerster and Karolyi (1998) report
that there may well be information dissemination (to the market participants),
prior to the announcement of an event, around an event and even after its
completion5. For that reason they don’t recommend the use of short-window
study around announcement dates and suggest the use of a window of one-year
prior and one year subsequent to the event. They argue that this methodology
allows deriving an overall picture that cannot emerge from a short-window
study.
The abnormal returns are computed using the market model, which assumes a
linear relationship between the return of any security to the return of the market:
Rit
= αi + βi Rmt + eit (1)
5 Foerster and Karolyi (1998) study non-US firms cross-listing shares on U.S. exchanges (American Depositary Receipts). They use a window of study one year prior to listing and one year following the listing.
19

where t is the time index, i=1,…,N stands for security, Rit , and Rmt are the
returns on security i, and the market respectively during period t, and is êit the
error term for security i.
The event windows are defined as the period from 1 day prior to 1 day after the
announcement, a second period, which runs between 2 and 366 days prior to the
announcement day, and a third period that runs between 2 and 366 days after
the announcement. Equation (1) is estimated over an interval of (-485; -120) days
before the beginning the each event period. With the estimates of αi and βi from
equation (1), we can predict a "normal" return. The prediction error referred to as
the abnormal return (AR), is then calculated:
ARit = Rit - âi -^βi Rmt (2)
In order to test for the persistence of the impact of the event during a period T2-
T1, the abnormal return is added to obtain the cumulated abnormal returns
(CARi (T2-T1 )) for security i over the period T2-T1 :
CARi (T1,T2) = ∑ ARit ; t= T1 …T2 (3)
This calculation is done for three event windows (-366 ; -2), (-1 ; 1), (2 , 366) and is
followed by a calculation of the mean cumulative abnormal returns6.
Moreover, for additional robustness, we estimate the abnormal returns using the
buy-and-hold abnormal returns. The index returns are used as a benchmark:
∑[∏ (1+Rt) - ∏ (1+Rindex, )] ; t= T1 …T2 (4) iinnddeexx,, ttt
6 Results of the tests conducted in the remaining paper are robust to the use of the capital asset pricing model and to the use of the equal-weighted and value-weighted market indexes.
20

Results of both models converge. In the remaining of this paper we comment the
results from the market model measured toward the equal-weighted market
index7.
Please insert Table 4
The observation of the bidder performance in the year preceding the
announcement shows that bidders in all markets register an important run-up in
prices that is significantly higher in hot markets compared to cold and normal
markets. The average CAR(-366 ; -2) is 22.99% for hot bidders, 6.82% for cold
bidders and 14.19% for the full sample. Dong et al. (2003), Rhodes-Kropf et al.
(2003) argue that firms have incentives to make acquisitions when their stocks
are overvalued. If this is the case, a rational stock market should react to a
merger announcement in a hot market as a sign of the bidder overvaluation. The
announcement stock movement should be negative in hot markets and positive
or at least less negative in cold markets.
Results in table 4 demonstrate that the opposite phenomenon occurs, the reaction
to mergers announced during the cold and hot markets are positive and higher
(but not significantly different) during hot markets compared to cold ones. On
average, the CAR (-1 ; 1) is 2.20% for hot market acquirers, 0.93% for cold market
acquirers and 0.41% for normal market acquirers. The announcement returns are
significantly different between hot and normal markets. These results indicate
that hot market acquirers receive a more favourable response on average to an
acquisition announcement.
The average CAR (-1 ; 1) for the full sample is consistent with the literature.
Eckbo (1983) finds positive and significant abnormal returns around merger 7 We report only results obtained with the market model and the equal weighted market index.
21

announcements. Our results show a significant and positive abnormal return of
1.20%, which is comparable to the results of Eckbo (1983).
In the post-announcement year, the returns reverse and hot market acquirers
underperform significantly cold market acquirers. CAR (2 ; 366) is significantly
different between hot and cold markets and hot and normal markets. CAR (2 ;
366) is –20.29% in hot markets compared to –1.66% in cold markets and –12.21%
in normal markets. The reversion of the post-announcement abnormal returns is
dramatic compared to those reported in studies that used US data.
The post-merger abnormal returns for the overall sample in our study are –
15.05% as a mean and –7.46% as a median. Ang and Cheng (2003) report one-
year abnormal returns of –3.76%. Bradley and Sundaran (2004) report one-year
abnormal returns of –2.48%. Our results are however, comparable to the one of
Friedman (2004) who found a one-year post merger abnormal return of –15.01%.
Moreover, the level of run-up in our sample (14.19%) is comparable to the results
of Bradley and Sundaram (2004) (the run-up is 19.01%).
The positive reaction to the merger announcement in hot market followed by a
high negative and significant performance corroborates the theory of investors’
overoptimism. This reversion phenomenon occurs when bidders’ results replace
optimism. This could shed light on stock overvaluation in hot cycles. Our results
are also consistent with the hubris hypothesis (Roll, 1986). Managers of firms that
registered good performance may believe that they can create value in situations
that the markets judges to be negative net present value, this should also lead to
the reversion observed. Moreover, since merger decisions are made by managers
who could have personal interests, the results could also be in favor of the
managerial motivations hypothesis. In fact, managerial motivations may
exacerbate the effect of investors’ overoptimism on the abnormal returns
22

following the announcement. Even if these theories give different explanations of
why mergers occur, they have the same predictions toward the stock price
movements.
To this point, our results allow rejecting only the neo-classical theory of mergers,
which predicts that hot merger markets occur following shocks and allow
creating common synergies. This theory suggests that mergers during hot
periods should be better than mergers at other times, which is not confirmed by
our results since post-merger performance is significantly worse in hot markets
compared to the cold ones (z-test significant at 1% level) and to what we called
‘normal’ periods (t-test and z-test significant at 1% level).
2-3 The means of payment
If hot markets are characterized by stock overvaluation then stock is more likely
to be used as a means of payment in these periods. Table 3 demonstrates a more
intensive use of equity as a transaction currency in hot markets, more than 40%
of the acquirers in hot periods pay the transaction value with more than 50%
stock, compared to 18% in cold markets.
To investigate properly the link between the bidders stock movements and the
mean of payment, we study the cumulative abnormal returns in each period. As
in table 3, we distinguish between firms that use stock to pay more than 50% of
the transaction (we define this category as paying with majority stock, for the
rest of the paper) and firms that pay with less than this percentage8.
8 Our results hold for any cut-off between 50% and 70% stock paid in the transaction since most observations are concentrated either between 0 and 30% or between 60% and up.
23

Results in table 5 confirm the reversion phenomenon that occurs in the post-
merger year compared to the pre-merger year. Results for the full sample do not
reveal any significant difference between the abnormal returns of firms paying
with majority of stock and firms paying with less stock. Bidders seem to register
highly significant positive abnormal returns in the pre-announcement period, the
mean CAR is higher than 8% whatever the proportion of stock used. This
performance reverses in the year following the announcement, the mean CAR is -
10.41% if majority stock is used and -10.15% if less than 50% stock is paid. These
underperformances are highly significant.
Results on the announcement reaction suggest that investors do not seem to
perceive better the transactions paid with less stock9. In fact, the mean
cumulative abnormal return surrounding the announcement is 1.26% in the case
of majority stock payment and 0.96% otherwise. There is no significant difference
between these performances.
This lack of difference in the performances of the full sample, according to the
proportion of stock used and since the results are robust to any cut-off in the
proportion of stock between 50% and 70%, proves the importance of
distinguishing between the hot and cold markets and to analyse the acquirers’
performances in each market separately. Therefore, to investigate the consistency
of this result, we consider each period individually.
The hot market reveals that acquirers paying with majority stock register higher
over-performances in the pre-announcement period (35.38%) compared with
acquirers paying with less stock (13.45%) and higher underperformances in the
9 Results hold for any cut-off in the proportion of stock used in payment, between 50% and 70% of the total amount of the transaction.
24

post-announcement year (-43.73% compared to -15.94%). These differences are
statistically significant10.
Surprisingly, average announcement abnormal returns do not vary with the
proportion of stock (average CAR (-1 ; 1) is 2.42% when majority stock is used
and 2.17% otherwise). There is no significant difference in the market reaction
based on the percentage of stock used and this result is robust to any variation in
the proportion of stock used in payment, between 50% and 70% of the total
amount of the transaction. For this reason, the Myers and Majluf (1984) signalling
hypothesis does not seem to hold in hot markets. Results for the cold market also
do not support Myers and Majluf (1984). The announcement reaction is much
higher when the payment is made with majority of stock (2.85% compared to
0.26% for the means and 4.78% compared to -0.15% for the medians).
While results in table 4 reveal that announcing acquisitions in cold markets leads
to lower price reactions, results in table 5 prove that paying with minority stock
drive low positive reactions not significantly different from 0 and even negative
reactions (the median is -0.15%). Results demonstrate that investors are more
sceptical in cold periods.
Results on the cold cycles indicate that abnormal returns in the pre-merger
announcement are much higher when the payment is made with stock, the mean
is 12.29% compared to 4.11%. The spread in the median is even higher, 20.35%
compared to 1.29%. However, the statistical tests do not reveal any significant
difference, which is due to the relatively small sample size.
10 Results hold for any cut-off in the proportion of stock used in payment, between 50% and 70% of the total amount of the transaction.
25

In the post-announcement year, stock market reacts in the same way to acquirers
paying with majority of stock in the cold period as to the ones in hot periods.
They register a high and significant underperformance (-16.88% as a mean and -
25.35% as a median). Acquirers paying with less that 50% stock register negative
abnormal returns, not significantly different from zero.
Comparing results for the two means of payment, within the cold period does
not reveal any statistical difference. The lack of significance in the cold period
tests is as mentioned above due to the small size of the sub-samples. Firms
paying with more than 50% stock register performances not significantly
different from bidders in hot markets paying with the same proportion of stock.
The presence of such a category of acquirers in the cold market could be due to
the presence of an overvalued industry in the cold market. In fact, 6 of the 8
companies that paid with more than 50% stock belong to the mining industry.
However, further exploration on industry valuation has to be done to allow
concluding, if all the industry is overvalued or if the firms are individually
overvalued. This test goes beyond the scope of this study.
While the results for the overall sample does not reveal any significant difference
when we compare the two means of payment, results for the hot market reveals
highly significant differences. The lack of difference inside the cold market is due
to the relatively small size of the sample. We also note a significant difference
between the run-up and the post-merger performance (mark-up), with the z-test,
when less than a proportion of 50% stock is used in payment. This evidence
proves that distinguishing only between the means of payment as it is done in
the literature is not enough, and proves that distinguishing between the merger
cycles is as much important.
26

Our results provide support for the investors’ overoptimism hypothesis since, in
hot markets, announcement abnormal returns do not differ with the proportion
of stock used to pay the transaction.
The previous tests document that Canadian acquirers time their acquisitions in
periods when investors’ overoptimism is high. Market and macroeconomic
conditions at the acquisition time can affect investors’ reaction to the
announcement, since they influence their estimates of the acquirer valuation. To
better explain the results of the previous section, we investigate the possible
determinants of the performances realised in the pre- and post-announcement
periods. We also try to find a characteristic set that could be associated with each
cold and hot market. For this purpose we introduce market, transaction and
firm-specific characteristics as explanative factors for the abnormal returns
measured.
2-4 Characteristics of hot and cold merger markets and determinants of bidder
performances
To determine the characteristics of hot and cold markets, we include the
variables defined below, related to bidder, target, transaction characteristics, and
macroeconomic variables, that might influence the market reaction to a merger.
Bidder specific variables:
An important characteristic that is present in our sample is that many bidders
make a series of acquisitions while others make only a single takeover. Some
researchers report that frequent acquirers are different from occasional acquirers
(Shipper and Thomson (1983) and Fuller et al. (2002)), for that reason we will
include a dummy for whether the bidder has made a single merger or if he has
made other mergers in the year prior to the announcement or in the year after.
27

Moreover, we control for certain events that could occur during our window of
study. Those events could be acquisitions of assets, acquisitions of certain assets
or buybacks that are reported in SDC database but are not defined as mergers or
acquisitions. However, as many bidders in our sample make such transactions in
the same period when they engage in mergers and acquisitions, these events
could bias our results. For this reason, we include a dummy variable to control
for those parallel events; this dummy will take a value of 1 if the bidder makes
acquisitions of certain assets or acquisitions of assets or buybacks during our
window of study. To our knowledge, most of the earlier studies that report
mergers and acquisitions short and/or long-run performance do not control for
the presence of those confounding events.
We also control for certain ratios that are of major importance in the
determination of the financial strength of the bidder. In fact, we will control for
the Tobin’s Q and the ratio of return on assets. Servaes (1991) among others has
proven that a low Tobin’s Q is associated with a high short-run reaction to the
merger announcement. The ratio of return on assets (ROA) proxies for the
financial performance of a firm. Morck et al. (1990) suggest that firms with better
prior performance make better acquisitions.
Transaction related variables:
We control for the forms of acquisition financing. We call financings made with
more than 50% stock as made with majority stock.
Many studies document that diversifying mergers result in lower returns to the
acquiring firm. For this reason, we control for merger is diversification by using a
dummy variable, which takes 1 if the acquirer and target have 3-digit sic code in
common.
28

We also control for the ratio of target size to acquirer size. In fact, when the target
involved in the acquisition is much smaller than the acquirer, we do not expect
the acquisition to have an important impact on the future earnings of the bidder,
and thus, the acquirer’s stock price movements should be small.
To measure the relative size, we use the ratio of total market equity of the target
to the total market equity of the acquirer. Wherever it is not available we use the
ratio of total assets instead.
Target specific variables:
Since the market reaction to a merger is different among the target type as
suggested by Fuller et al. (2002), we distinguish between two groups of targets:
public firms, in one hand, and private firms and subsidiaries, in the other hand.
Macroeconomic variables:
We control for whether the merger or acquisition occurred in hot, cold or normal
periods. Moreover, since reaction to a merger may be affected by the stock
market conditions, we proxy for the general level of stock prices in the market by
calculating and using the change in the TSE equal-weighted and value-weighted
indexes.
Univariate analysis
In table 6, we examine variables related to bidder-specific and market-specific
characteristics, in each of the individual hot and cold markets to try to uncover a
characteristic set among firm, transaction and market characteristics that can be
reliably associated with each type of merger market.
29
Table 6 gives strong support to the existence of merger timing. It indicates that
the market performance measured by the equal-weighted and value-weighted
index returns, in the year prior to announcements, are significantly higher in the
hot markets compared to the cold ones. The market equal-weighted performance
reverses in the year following the merger. The equal-weighted index
performance is significantly lower (at 5% level both in t-test and z-test) in hot
merger markets compared to the cold ones. The value-weighted index
performance is not significantly different between the two merger markets.
This result sheds light on the fact that mergers are affected by conditions in the
broader stock market and is consistent with the previous studies that tend to
associate hot investment markets to business cycle expansions and cold markets
to recessions (Hickman (1953), Moore (1980) and Choe, Masulis and Nanda
(1993)).
The percentage of shares acquired and the number of acquisitions announced in
the years prior and following the announcement are significantly higher in hot
markets. This is evidence that the hot periods are seen as favourable to larger
investments programs.
The number of acquisitions of assets in the years prior and following the
announcement are also higher in hot cycles although only the number of
acquisition of assets is significant (weakly) with the z-test. This is another
evidence confirming the idea that acquirers are more active in hot markets. The
sign of the statistical tests on the relative value of the target to the bidder even if
it is not significant, is also consistent with the same idea.
Concerning the variables controlling for the financial strength of the bidding
firm, Tobin’s Q and ROA in the pre-announcement year prove that acquirers are
30

not significantly overvalued and do not register better financial performances.
However, these factors become significantly higher during the year of the
announcement, a phenomenon that reverses in the post-announcement year11.
Since the Tobin’s Q does not only control for overvaluation, we calculate the
market-to-book equity ratio, for additional robustness. Our results on this ratio
confirm the previous conclusion12.
The choice of making an acquisition at a time when overvaluation and the
financial performance, are at their highest, is a strong evidence in favour of the
merger timing and is consistent with the theory proposed by Shleifer and Vishny
(SV) (2003) suggesting that during hot cycles, the financial market proves to be
inefficient and some firms are valued incorrectly. Their model predicts that
mergers are conducted by rational managers operating in less rational markets
(inefficient).
Even if our results are consisting with SV (2003), we cannot reject, to this point,
Roll’s (1986) hubris hypothesis, which proposes that managers are irrational
while the market is not, since in this case, we should also observe high
performance prior to a merger and a reversion after.
Tests on the percentage of stock used in payment show highly significant t-test
and z-test, which indicate a more intensive use of stock in hot markets. This
evidence confirm Martin (1996) and Rau and Vermaelen (1998) findings that
glamour bidders (firms with high market-to-book ratio) pay more frequently 11 T-tests and z-tests conducted on the difference between Qtobin (0) and Qtobin(-1) (not reported in table 5) are consecutively –0.44 and –0.51. The same tests conducted on the difference between Qtobin (0) and Qtobin(1) are consecutively 2.33 (significant at the 5% level) and 3.55 (significant at the 1% level) 12 T-tests and z-tests conducted on the difference between M/B (0) and M/B (-1) (not reported in table 5) are consecutively –0.21 and –0.42. The same tests conducted on the difference between Qtobin (0) and Qtobin(1) are consecutively 3.19 and 2.61 (both significant at the 1% level)
31

with stock than do value bidders (firms with low market-to-book ratio). Judging
by the statistical tests, we can add new evidence that the bidders’ managers are
aware of the overvaluation of their firms and act rationally by timing their
mergers and paying with stock. This new evidence allows rejecting the hubris
hypothesis with more confidence.
Multivariate analysis of the determinants of bidders performance
for the full sample and during the hot and cold merger markets
To investigate the possible determinants of bidders performance in our windows
of study, we conduct a multivariate cross-sectional analysis designed to explain
the cumulative abnormal returns around the announcement of an acquisition
and in the post-merger year, across the full sample, the hot and cold markets.
The regressions include as independent variables all the variables introduced in
the beginning of this section, with the exception of the variable percentage of
stock that we replace by a dichotomous variable that takes 0 if the percentage of
stock is comprised between 0 and 50, and 1 if it is over 50%.
We add the variable relatedness that we define as a dichotomous variable that
controls for the relatedness of the target and acquirer activities. Relatedness takes
the value 1 if the firms have 3-digit sic code in common and 0 otherwise. Target
public status takes the value of 1 if the target is private or subsidiary and 0 if it is
public. Hot is a dichotomous variable that equals 1 if the merger announcement
takes place in a hot market and 0 otherwise. Cold is a dichotomous variable that
equals 1 if the merger announcement takes place in a cold market and 0
otherwise.
Panel A of table 7 shows that announcing acquisitions in a rising market has a
positive effect on the announcement abnormal returns. The variable Mkt_ew is
32

positive even if it is not significant. In hot market, the CAR (-1 ; 1) is 4.507 basis
point higher, for each percentage point increase in the equally-weighted stock
market index in the year prior to the announcement. This result is consistent with
Michell and Mulherin (1996) who suggest that unexpected economic shocks lead
to higher stock performances in the whole market or in some industries, which
creates higher merger activity. This positive effect also supports investors’
overoptimism theory, which predicts a positive correlation between
announcement abnormal returns and recent returns in stock market. These two
theories explain also the positive and significant correlation between the CAR(-1
; 1) and the existence of program of mergers controlled for, by the variable
multi_acq.
During the announcement three-day window, we introduce the variable CAR(-
366; -2), as an explanative variable in our regression, to test the effect of the run-
up preceding the announcement, on the announcement abnormal returns. Our
results demonstrate that the coefficient on this variable is negatively related to
the announcement abnormal returns in the cold markets. The run-up on the
bidder stock is however, positively correlated with announcement abnormal
returns in hot markets and in for the overall sample. This result is also consistent
with the hot market overoptimism and with the irrationality in hot markets. The
higher the run-up is, the better is the announcement reaction. This is also
consistent with the finding of Bradley and Sundaram (2004) who suggest that
acquisitions are the cause of past good performance. This is especially true in our
case, for the hot market, since the coefficient is the highest at this period.
The negative coefficient associated with the use of stock in hot markets, is also
consistent with Myers and Majluf (1984) factors, but surprisingly, this factor is
not significant, in all markets, which suggests that during the announcement of a
merger the means of payment is not necessarily the most important factor that
33

allows valuing the merger. Moreover, a positive coefficient on the acquisitions of
private and subsidiaries is consistent with the literature (Fuller et al. (2002),
Bradley and Sundaram (2004)). In fact, this positive coefficient on non-public
targets can be explained by Rock (1996) arguments who suggests that since there
are greater information asymmetries between the buyer and the seller of a non-
public target, the buyer will seek to obtain an adverse selection discount, in order
to be compensated for information asymmetry.
Coefficients of hot and cold dummies are positive but not significantly different
from zero. The coefficient on hot is higher which proves that announcing in hot
markets leads to higher abnormal returns than announcing in other times. This
evidence is also consistent with the hot market attributes.
Surprisingly, the Q-ratio which proxy for firm quality is not significant in all
periods. Investors do not seem to place weight on this factor, even if it gives
certification of project quality and management competence. However, more
weight is placed on ROA in the hot markets. Investors seem to be more
interested in the earnings realised by the bidder than in the whole quality of the
firm. This result is consistent with the overoptimism in hot markets.
Panel B proves that the higher the stock market performances are, the worse the
firm post-acquisition performance is, all else equal. This is true especially for the
hot market since each percentage point increase in the equally-weighted stock
market index in the year prior to the announcement is followed by 33 basis
points of post-acquisition underperformance.
During the announcement window, the sign of the coefficient of the means of
payment is consistent with the literature, although it is not significant in all
markets. However, in the post-merger year, the coefficient on this variable
34

becomes negative and significant for the full market and during hot markets,
which proves that mergers where majority stock is used are worse, especially in
the hot markets since the coefficient is higher.
The observation of the payment dummy in the post-merger year gives another
evidence on the inability of the market to value the bidder and the transaction.
Investors are overoptimistic during the acquisition announcement especially in
hot cycles. However, the market is able to correct itself on a longer term.
Not surprisingly, coefficients on the number of acquisition of assets and on the
multiple acquisitions programs following the announcement are positive. This is
consistent with the literature that suggests that firms having good performances
make more acquisitions. Results demonstrate that firms acquiring public targets
perform better following the acquisition, which is also consistent with the
existing literature.
Coefficient of hot dummy is negative and significant, while the coefficient of cold
dummy is negative but not significantly different from zero. Consequently, the
post-merger underperformance is higher in hot markets compared to other
times.
35

Conclusion
Using a sample of 462 Canadian acquisitions between 1988 and 2002, we
investigate the existence of timing process for mergers and acquisitions. To
produce our results, we use the aggregate number of mergers to search for
periods that are more favourable for mergers (i.e. to distinguish between hot and
cold merger markets).
Our methodology consists on studying acquirer abnormal returns over three
windows, pre-, post- and around the announcement of the acquisitions, in each
market cycle (hot markets versus cold markets). Our results provide evidence
that mergers are driven by stock market valuation and that these events occur
during periods when investors are highly overoptimistic and react irrationally to
a merger announcement. In fact, acquirers in hot markets register significantly
higher abnormal performances than acquirers in cold markets; investors react
better to the acquisitions announced during the hot markets even if the payment
is made with stock. Our evidence suggests that short-run market perceptions
may lead to takeover activity. This evidence is consistent with SV arguments.
The evidence that the stock returns reverse in the post-merger announcement
year and the fact that the means of payment is highly explanatory variable of the
post-merger underperformance proves that the market can correct itself in the
longer term.
Our results allow rejecting the synergy hypothesis and the economy-wide
shocks, since these hypotheses do not predict the performance reversion that we
observe.
36

We also find evidence that the bidders’ managers are aware of the overvaluation
of their firms and act rationally by timing their mergers and paying with stock,
since they choose to announce their acquisition when the overvaluation is at its
highest. This evidence allows rejecting the hubris hypothesis.
However, if investors have unrealistic expectations about the synergies from a
merger, managers would not make these acquisitions unless they are rewarded
from the short-term performance. This proves that managerial motivations are
associated to investors’ sentiment to explain better the timing of mergers and
acquisitions.
37

References
Andrade G., Mitchell, M., Stafford, E., Spring 2001. New evidence and perspectives on mergers. Journal of Economic Perspectives 15 (2), 103–120. Ang, J. S. and Y. Cheng, 2003, “Direct Evidence on the Market Driven Acquisition Theory,” Working Paper Baker, M. P., J. C. Stein, and J. Wurgler, 2003, When does the market matter? stock prices and the investment of equity-dependent firms, Quarterly Journal of Economics 118, 969–1005. Baker, M. P. and J. Wurgler, 2002, Market timing and capital structure, Journal of Finance 57, 1–32. Baker, M. and J. Wurgler, 2000, The equity share in new issues and aggregate stock returns, Journal of Finance 55, 2219–2257. Bayless M., Chaplinsky S., 1996, Is There a Window of Opportunity for Seasoned Equity Issuance?, Journal of Finance 51(1). Bradley M. and A. Sundaram, 2004, Do acquisitions drive performance or does performance drive acquisitions?, Working Paper Brealey, R. A. and S. C. Myers, 2000, Principles of corporate finance (6th ed.).(McGraw-Hill, New York). Choe H., Masulis R., and Nanda V., 1993, Common stock offerings across the business cycle. Journal of Empirical Finance, 1, 3-31. Dong, M., Hirshleifer, D., Richardson, S., Teoh, S. H., September 2002. Does investor misvaluation drive the takeover market? Working Paper, Ohio State University. Erickson, M. and S. Wang, 1999, Earnings Management by Acquiring Firms in Stock for Stock Mergers, Journal of Accounting and Economics, 27(2), 149-176. Foerster S.R., Karolyi G.A., 1999, The Effects of Market Segmentation and Illiquidity on Asset Prices: Evidence from Foreign Stocks Listing in the US, Journal of Finance, 54(3), 981-1014.
38

Fuller, Kathleen, Jeffry Netter, and Michael Stegemoller, 2002, What Do Returns to Bidding firms Tell Us? Evidence from Firms That Make Many Acquisitions, Journal of Finance, 57(4), 1763-93. Gorton, G., Kahl, M., Rosen, R., 2000. Eat or be eaten: A theory of mergers and merger waves, Working Paper, Wharton School. Gulger K., D. Mueller and B. Yurtoglu, 2004, The determinants of merger waves, Working Paper. Harford, J. 2003, Efficient and Distortional Components to Industry Merger Waves, Working Paper. Holmstrom, B., Kaplan, S. N., 2001. Corporate governance and merger activity in the united states: Making sense of the 1980s and 1990s. Journal of Economic Perspectives 15, 121–144. Jensen, M., 1986. Agency costs of free cash flow, corporate finance, and takeovers. American Economic Review 76, 323–329. Jovanovic, B., Rousseau, P., 2001. Mergers and technological change: 1885-2001. Unpublished working paper, New York University. Jovanovic, B., Rousseau, P., Fall 2002. The q-theory of mergers. The American Economic Review, Papers and Proceedings 92 (2), 198–204. Loughran, Tim and Jay R. Ritter, 1995, The New Issues Puzzle, Journal of Finance 50(1), 23-51. Loughran, Tim, Jay R. Ritter, and Kristian Ryndqvist, 1994, Initial Public Offerings: International Insights, Pacific Basin Finance Journal 2, 165-199. Maksimovic, V., Phillips, G., December 2001. The market for corporate assets: Who engages in mergers and asset sales and are there efficiency gains? The Journal of Finance LVI (6), 2019–2065. Martin, K., 1996. The method of payment in corporate acquisitions, investment opportunities, and managerial ownership. Journal of Finance 51, 1227–1246. Mitchell, Mark L. and J. Harold Mulherin, 1996, The impact of industry shocks on takeover and restructuring activity, Journal of Financial Economics 41, 193-229.
39

Mitchell, Mark L. and Erik Stafford, 2000, Managerial Decision and Long-Term Stock Price Performance, Journal of Business 73(3), 287-329. Moeller, Sara, Frederik Schlingemann, and Rene Stulz, 2004a, Do shareholders of acquiring firms gain from acquisitions? Journal of Financial Economics (forthcoming). Moeller, Sara, Frederik Schlingemann, and Rene Stulz, 2004a, Wealth destruction on a massive scale? A study of acquiring firm returns in the recent merger wave, Journal of Finance (forthcoming). Morck, Randall, Andrei Shleifer, and Robert Vishny, 1990, Do Managerial Objectives Drive Bad Acquisitions?, Journal of Finance, 45, 31-48. Myers, Stewart C. and Nicholas S. Majluf, 1984, Corporate Financing and Investment Decisions When Firms Have Information That Investors Do Not Have, Journal of Financial Economics 13(2), 187-221. Nelson, Ralph L., 1959, Merger Movements in American Industry, Princeton University Press: Princeton, N.J., 1959. Rau, P. Raghavendra and Theo Vermaelen, 1998, Glamour, value and the post-acquisition performance of bidding firms, Journal of Financial Economics 49(3), 223-253. Rhodes-Kropf, Matthew, David T. Robinson, and S. Vishanathan, 2003, Valuation Waves and Merger Activity, The Empirical Evidence, working paper. Rhodes-Kropf, M., Viswanathan, S., forthcoming. Market valuation and merger waves. Journal of Finance. Ritter, J., Warr, R., March 2002. The decline of inflation and the bull market of 1982-1999. Journal of Financial and Quantitative Analysis 37 (1), 29–61. Roll, Richard, 1986, The Hubris Hypothesis Of Corporate Takeovers, Journal of Business 59, 197-216. Rosen, Richard J., 2003, Merger Momentum and Investor Sentiment: the Stock Market Reaction to Merger Announcements, working paper. Rossi, S. and P. Volpin, 2004, Cross-Country Determinants of Mergers and Acquisitions, Journal of Financial Economics 74, 277-304.
40

Schipper, Katherine and Rex Thompson, 1983, The Impact of Merger-Related Regulations on the Shareholders of Bidding firms, Journal of Accounting Research 21(1), 184-221. Servaes, Henri, 1991, Tobin's Q and the Gains from Takeovers, Journal of Finance 46(1), 409-419. Shleifer, Andrei and Robert W. Vishny, 2003, Stock Market Driven Acquisitions, Journal of Financial Economics, 70, 295-311. Schwert, G.W., 2000, Hostility in Takeovers: In the Eyes of the Beholder?, Journal of Finance, 55 (6), 2599-2640. Travlos, Nickolaos, 1987, Corporate Takeover Bids, Method of Payment, and Bidding Firms’ Stock Returns, Journal of Finance 42(4), 943-963. Weston, J. Fred, Kwang S. Chung, and Juan A. Siu, 1998, Takeovers, Restructuring, and Corporate Governance, Upper Saddle River, NJ, Prentice Hall.
41
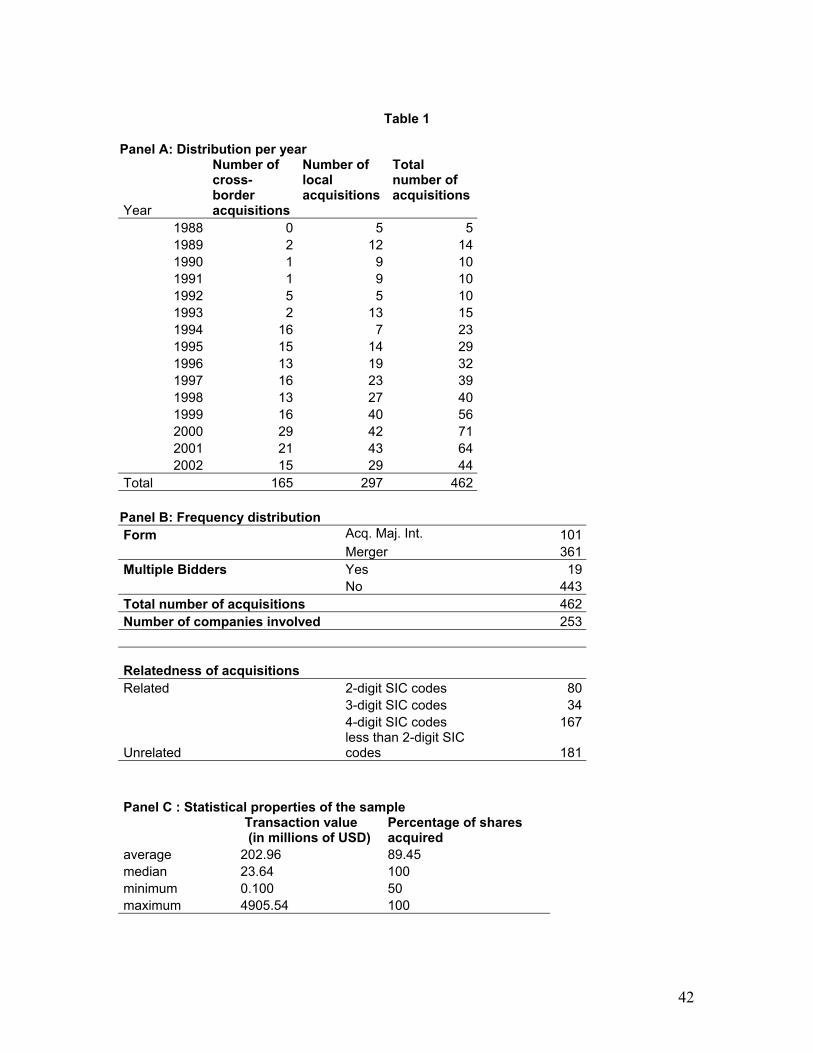
Table 1
Panel A: Distribution per year
Year
Number of cross-border acquisitions
Number of local acquisitions
Total number of acquisitions
1988 0 5 51989 2 12 141990 1 9 101991 1 9 101992 5 5 101993 2 13 151994 16 7 231995 15 14 291996 13 19 321997 16 23 391998 13 27 401999 16 40 562000 29 42 712001 21 43 642002 15 29 44
Total 165 297 462 Panel B: Frequency distribution Form Acq. Maj. Int. 101 Merger 361 Multiple Bidders Yes 19 No 443 Total number of acquisitions 462 Number of companies involved 253 Relatedness of acquisitions Related 2-digit SIC codes 80 3-digit SIC codes 34 4-digit SIC codes 167
Unrelated less than 2-digit SIC codes 181
Panel C : Statistical properties of the sample Transaction value (in millions of USD)
Percentage of shares acquired
average 202.96 89.45 median 23.64 100 minimum 0.100 50 maximum 4905.54 100
42

Panel D: Sample frequency of bidders by primary SIC code SIC Codes Number Percentage of total 10 Minerals 152 32.90%20-39 Manufacturing 112 24.24%40 Communications 53 11.47%50 Trade 14 3.03%60 Financial 53 11.47%70-89 Services 68 16.86% 462 100.00% Panel F: Distribution by Target Nation Nb. of acquisitions PercentageTarget country Canada 297 64.29%United States 96 20.78%Argentina 7 1.52%Chile 6 1.30%South Africa 6 1.30%United Kingdom 6 1.30%Germany 4 0.87%China 3 0.65%France 3 0.65%Sweden 3 0.65%Norway 2 0.43%Peru 2 0.43%Poland 2 0.43%Singapore 2 0.43%South Korea 2 0.43%Spain 2 0.43%Switzerland 2 0.43%Venezuela 2 0.43%Others (1 acq per country) 15 3.25% 462 100%
43

Figure 1 : Hot and Cold Markets classified by the number of transactions: Hot and Cold markets classifications are based on quartile ranking of a three-month moving average of the aggregate number of mergers and acquisitions in Canada, obtained from Crosbie and Cie. Hot markets are at least three contiguous months where the number of mergers and acquisitions exceeds the upper quartile. Cold markets are at least three contiguous months where the number of mergers and acquisitions falls below the lower quartile.
0.00
20.00
40.00
60.00
80.00
100.00
120.00
140.00
10/8
9
06/9
0
02/9
1
10/9
1
06/9
2
02/9
3
10/9
3
06/9
4
02/9
5
10/9
5
06/9
6
02/9
7
10/9
7
06/9
8
02/9
9
10/9
9
06/0
0
02/0
1
10/0
1
06/0
2
numberlower quartile upper quartile
Table 2: Market classification and duration (in months) based on the number of mergers and acquisitions Cold 09/90-06/91 9 10/91-04/93 19 12/01-05/02 6 Hot 09/96 - 01/98 17 06/99 - 12/00 19 Table 3: Summary statistics of the mean of payment in the cold and hot markets
Percentage of stock in payment
Less than 50% stock
More than 50% stock
Total
Period HOT Number of firms 94 65 159 Percentage 49.12% 40.88% 100.00% COLD Number of firms 43 10 53 Percentage 81.17% 18.83% 100.00%
44

Table 4 Abnormal returns, for mergers and acquisitions in Hot, Cold and Normal markets. The abnormal returns are computed for day t, as the return on stock I minus the return on the market, where day 0 is the announcement date of the merger or acquisition. Hot and Cold markets classifications are based on quartile ranking of a three moving average of the aggregate number of mergers and acquisitions in Canada, obtained from Crosbie and Cie. Hot markets are at least three contiguous months where the number of mergers and acquisitions exceeds the upper quartile. Cold markets are at least three contiguous months where the number of mergers and acquisitions falls below the lower quartile. Normal markets are defined as the periods that fall in between the upper and lower quartiles.
Panel A : Cumulative abnormal returns 01/88 - 12/02 Full Sample HOT COLD NORMAL
CAR (-366 ; -2) Mean 14.19% 22.99% 6.82% 9.72%Median 8.67% 15.51% 1.55% 7.46%t: Mean=0 6.55*** 5.44*** 1.54 3.50***t: Hot - Cold = 0 2.73*** Z: Hot - Cold =0 2.77*** t: Hot - Normal = 0 2.74***Z: Hot - Normal =0 2.55**N 439 154 46 239 CAR (-1 ; 1) Mean 1.20% 2.20% 0.93% 0.41%Median 0.28% 0.55% 0.06% 0.07%t: Mean=0 2.74*** 2.88*** 1.14 0.66t: Hot - Cold = 0 1.15 Z: Hot - Cold =0 0.67 t: Hot - Normal = 0 1.83*Z: Hot - Normal =0 1.42N 396 148 42 206 CAR (2 ; 366) Mean -15.05% -20.29% -1.66% -12.21%Median -7.46% -14.98% -0.05% -7.43%t: Mean=0 -8.12*** -6.10*** -0.54 -4.67***t: Hot - Cold = 0 -1.11 Z: Hot - Cold =0 -2.48*** t: Hot - Normal = 0 -2.93***Z: Hot - Normal =0 -2.33**N 462 159 53 250* significant at the 10% level ** significant at the5% level *** significant at the 1% level
45

Table 5 Abnormal returns, for mergers and acquisitions in Hot, Cold and Normal markets, decomposition based on the percentage of stock used in payment. The abnormal returns are computed for day t, as the return on stock I minus the return on the market, where day 0 is the announcement date of the merger or acquisition. Hot and Cold markets classifications are based on quartile ranking of a three moving average of the aggregate number of mergers and acquisitions in Canada, obtained from Crosbie and Cie. Hot markets are at least three contiguous months where the number of mergers and acquisitions exceeds the upper quartile. Cold markets are at least three contiguous months where the number of mergers and acquisitions falls below the lower quartile. Normal markets are defined as the periods that fall in between the upper and lower quartiles.
Panel A : Cumulative abnormal returns 01/88 - 12/02 Full Sample HOT COLD
CAR (-366 ; -2) Stock<50%
(1) Stock>=50%
(2) Stock<50%
(1) Stock>=50%
(2) Stock<50%
(1) Stock>=50%
(2) Mean 8.65% 11.12% 13.45% 35.38% 4.11% 12.29%Median 6.07% 9.61% 8.67% 22.99% 1.29% 20.35%t: Mean=0 3.91*** 3.35*** 3.25*** 4.49*** 0.78 1.00t: Hot - Cold = 0 1.31 0.71Z: Hot - Cold =0 1.87** 0.32t: (1)-(2) = 0 -0.68 -2.62*** -0.63Z: (1)-(2) = 0 -1.37 -2.20** -1.31N 283 140 87 67 39 8 CAR (-1 ; 1) Mean 0.96% 1.26% 2.17% 2.42% 0.26% 2.85%Median 0.33% -0.33% 0.64% -0.01% -0.15% 4.78%t: Mean=0 2.30** 1.33 2.56** 1.36 0.26 1.24t: Hot - Cold = 0 1.03 -0.10Z: Hot - Cold =0 1.11 -0.46t: (1)-(2) = 0 0.92 -0.16 -1.06Z: (1)-(2) = 0 0.44 0.53 -0.81N 248 138 83 60 35 7 CAR (2 ; 366) Mean -10.15% -10.41% -15.94 -43.73% -4.39% -16.88%Median -4.38% -12.58% -6.67 -25.70% -0.01 -25.35%t: Mean=0 -4.61*** -3.86*** -3.64*** -4.28*** -0.72 -2.28**t: Hot - Cold = 0 -1.34 -0.70Z: Hot - Cold =0 -1.96** -0.15t: (1)-(2) = 0 0.07 2.74*** -1.28Z: (1)-(2) = 0 1.41 2.48*** -1.45N 295 138 93 69 34 8* significant at the 10% level ** significant at the 5% level *** significant at the 1% level
46

Table 6 : Firm-specific and market-specific characteristics in the hot and cold markets and the full sample. Mkt_ew is the cumulative returns on the TSE equal-weighted index in the 366 days prior to the announcement (t-366) or post-announcement (t+366); t=0 is the announcement day. Mkt_vw is the cumulative returns on the TSE value-weighted index in the 366 days prior to the announcement (t-366) or post-announcement (t+366). Shares acquired is the percentage of target shares acquired in the transaction. Multi-acq is the number of mergers and acquisitions of majority interest made by the same acquirer in the year preceding the announcement (t-366) or following the announcement (t+366). Nb of acq of assets is the number of acquisition of assets made by the same acquirer in the years preceding and following the announcement ((t-366) and (t+366)). Relative value is the ratio of target-to-bidder size. QTobin is the sum of market value of equity, book value of debt and preferred stock by total assets. M/B is the market-to-book equity ratio. ROA is the ratio of the return on assets measured at the end of the year of the merger announcement (0), the end of the year prior to the announcement (-1) and the end of the year following the announcement (1). % stock is the percentage of stock used in the transaction payment.
ALL COLD HOT
t-test (hot-cold)
Z-test (hot-cold)
Mean Median Mean Median Mean Median t-stat Z-statVariable Mkt_ew (t-366) 0.5615 0.4856 0.6109 0.5305 0.8227 0.8487 6.34*** 6.19***Mkt_vw (t-366) 0.1231 0.1269 -0.0126 0.0022 0.3103 0.3185 17.8*** 10.37***Mkt_ew (t+366) 0.5141 0.4312 0.5851 0.4473 0.4621 0.3716 -2.52** -2.38**Mkt_vw (t-366) 0.0786 0.0649 0.0245 -0.0629 0.0393 -0.0108 0.38 -0.18shares acquired 89.4598 100 85.2517 100 92.3163 100 2.64*** 2.18**multi-acq (t-366) 0.3384 0 0.2264 0 0.4750 0 1.87* 1.37multi-acq (t+366) 0.3550 0 0.1509 0 0.5500 0 2.89*** 2.86***Nb of acq of assets (t-366) 0.5621 0 0.5660 0 0.7405 0 1.07 0.37Nb of acq of assets (t+366) 0.4314 0 0.3962 0 0.6076 0 1.21 1.85*relative value 24.9880 9.2608 18.0115 6.9747 26.2380 11.3474 1.42 1.08QTOBIN (-1) 1.5017 1.0669 1.4588 1.1221 1.8842 1.1952 1.21 0.24QTOBIN (0) 1.3725 1.0107 0.9360 0.9202 1.7773 1.0926 1.82* 2.78***QTOBIN (1) 1.1393 0.9463 1.0673 0.9516 1.0899 0.8624 0.14 -1.42M/B (-1) 2.0478 1.6688 2.0662 1.8085 2.2582 1.6693 0.78 0.70M/B (0) 1.9805 1.6492 1.6561 1.3838 2.3000 1.9553 2.75*** 2.97***M/B (1) 1.9540 1.7207 1.6603 1.7180 1.7347 1.5582 0.38 0.03ROA (-1) 0.0030 0.0369 -0.0049 0.0380 0.0042 0.0280 0.34 -0.40ROA (0) -0.0237 0.0284 -0.0725 0.0188 -0.0059 0.0288 2.17** 1.65*ROA (1) -0.0390 0.0214 -0.0178 0.0207 -0.0639 0.0216 -1.26 -0.48% stock 36.9921 0 23.0203 0 43.1592 37.5391 2.08*** 2.96***
* Significant at the 10% level ** Significant at the 5% level *** Significant at the 1% level 47
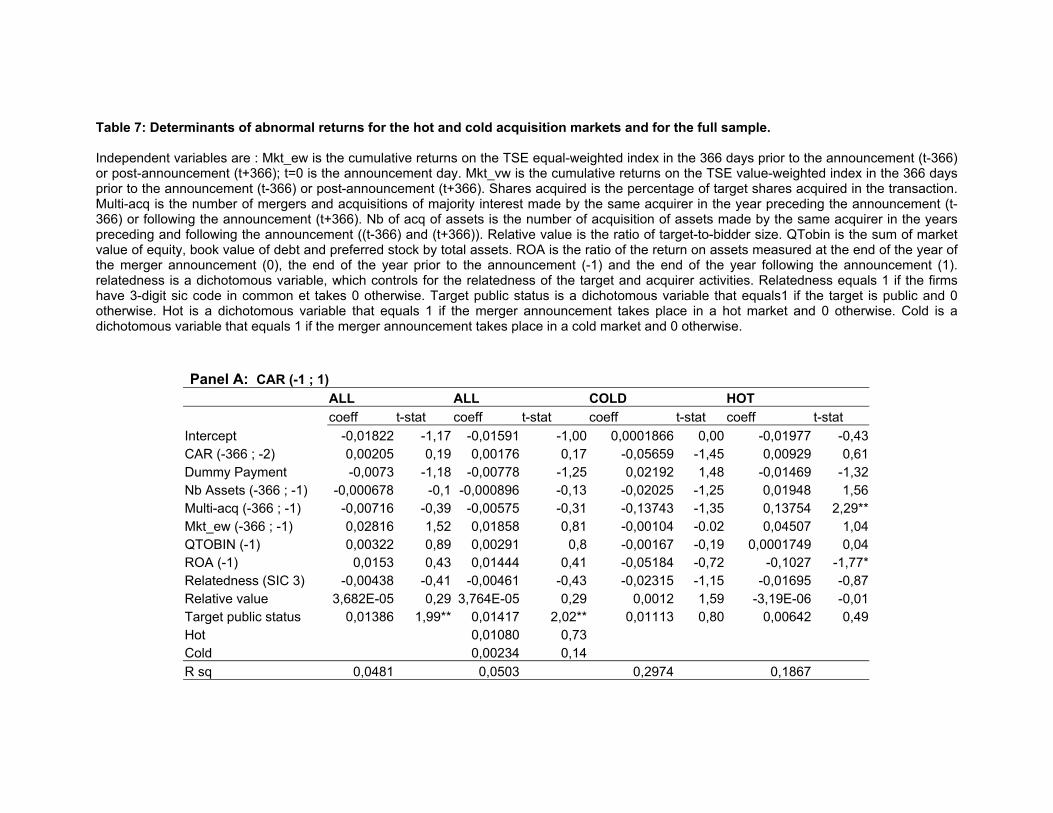
Table 7: Determinants of abnormal returns for the hot and cold acquisition markets and for the full sample. Independent variables are : Mkt_ew is the cumulative returns on the TSE equal-weighted index in the 366 days prior to the announcement (t-366) or post-announcement (t+366); t=0 is the announcement day. Mkt_vw is the cumulative returns on the TSE value-weighted index in the 366 days prior to the announcement (t-366) or post-announcement (t+366). Shares acquired is the percentage of target shares acquired in the transaction. Multi-acq is the number of mergers and acquisitions of majority interest made by the same acquirer in the year preceding the announcement (t-366) or following the announcement (t+366). Nb of acq of assets is the number of acquisition of assets made by the same acquirer in the years preceding and following the announcement ((t-366) and (t+366)). Relative value is the ratio of target-to-bidder size. QTobin is the sum of market value of equity, book value of debt and preferred stock by total assets. ROA is the ratio of the return on assets measured at the end of the year of the merger announcement (0), the end of the year prior to the announcement (-1) and the end of the year following the announcement (1). relatedness is a dichotomous variable, which controls for the relatedness of the target and acquirer activities. Relatedness equals 1 if the firms have 3-digit sic code in common et takes 0 otherwise. Target public status is a dichotomous variable that equals1 if the target is public and 0 otherwise. Hot is a dichotomous variable that equals 1 if the merger announcement takes place in a hot market and 0 otherwise. Cold is a dichotomous variable that equals 1 if the merger announcement takes place in a cold market and 0 otherwise. Panel A: CAR (-1 ; 1)
ALL ALL COLD HOT coeff t-stat coeff t-stat coeff t-stat coeff t-statIntercept -0,01822 -1,17 -0,01591 -1,00 0,0001866 0,00 -0,01977 -0,43CAR (-366 ; -2) 0,00205 0,19 0,00176 0,17 -0,05659 -1,45 0,00929 0,61Dummy Payment -0,0073 -1,18 -0,00778 -1,25 0,02192 1,48 -0,01469 -1,32Nb Assets (-366 ; -1) -0,000678 -0,1 -0,000896 -0,13 -0,02025 -1,25 0,01948 1,56Multi-acq (-366 ; -1) -0,00716 -0,39 -0,00575 -0,31 -0,13743 -1,35 0,13754 2,29**Mkt_ew (-366 ; -1) 0,02816 1,52 0,01858 0,81 -0,00104 -0.02 0,04507 1,04QTOBIN (-1) 0,00322 0,89 0,00291 0,8 -0,00167 -0,19 0,0001749 0,04ROA (-1) 0,0153 0,43 0,01444 0,41 -0,05184 -0,72 -0,1027 -1,77*Relatedness (SIC 3) -0,00438 -0,41 -0,00461 -0,43 -0,02315 -1,15 -0,01695 -0,87Relative value 3,682E-05 0,29 3,764E-05 0,29 0,0012 1,59 -3,19E-06 -0,01Target public status
0,01386
1,99**
0,01417 2,02** 0,01113
0,80
0,00642
0,49
Hot 0,01080 0,73Cold 0,00234 0,14R sq 0,0481 0,0503 0,2974 0,1867

Panel B: CAR (2 ; 365)
ALL ALL COLD HOT coeff t-stat coeff t-stat coeff t-stat coeff t-stat
Intercept 0,00225 0.03 -0,02943 -0,37 0,07323 0,3 0,04885 0,21Dummy payment -0,0798 -2,43** -0,07635 -2,32** -0,03417 -0,35 -0,13077 -2,16**Nb Assets (1 ; 366) 0,04886 1,57 0,05195 1,67 0,0514 1,09 0,07374 1,26Multi-acq (1 ; 366) 0,05335 1,35 0,05707 1,43 -0,30307 -1,69* 0,05456 0,89Mkt_ew (-366 ; -1) -0,23878 -2,44** -0,08331 -0,67 -0,02447 -0,07 -0,33754 -1,44QTOBIN (-1) -0,02266 -1,14 -0,01885 -0,95 -0,09537 -1,84* 0,0081 0,28ROA (-1) 0,24761 1,37 0,24452 1,35 -0,20929 -0,68 0,69306 1,89*Relatedness (SIC 3) -0,00378 -0,07 -0,0064 -0,11 0,15709 1,35 0,0001462 0,00Relative value 0,0009823 1,32 0,0009806 1,32 -0,00478 -1,61 0,00147 1,10Target public status
0,03657
1,01 0,03428 0,94 -0,00193
-0,02
-0,05144
-0,71
Hot -0,16052 -2,02**Cold -0,05312 -0,59R-sq 0,0864 0,098 0,3066 0,1545
* Significant at the 10% level ** Significant at the 5% level *** Significant at the 1% level
1


