
hddence dhdirectThxation
hhffaw:nrlRaja J. C_helliah
andRam N. Lal

Incidence of
Indirect Taxation
in India 1973-74

INCIDENCE OF
INDIRECT TAXATION
IN INDIA 1973-74
NATIONAL INSTITUTE OF PUBLIC FINANCE AND POLICY
NEW DELHI

Price: Rs. 10
Printed in India
at
Delhi Press
Jhandewalan Extension
New Delhi-110055
Published by V.S. Renganathan
National Institute of Public
Finance and Policy
12 Rajendra Place
New Delhi-110008

PREFACE
The National Institute of Public Finance and Policy is an autono
mous, non-profit organisation whose major functions are to carry out
research, do consultancy work and undertake training, in the area of
public finance and policy.
V
The policy of the Institute is to publish all of its important reports
and studies except those which are of a confidential nature. The Govern
ing Body of the Institute does not take responsibility for any of the views
expressed by the authors in the publications/studies brought out by the
Institute. The responsibility for the views expressed belongs to the
Director and the staff ofthe Institute, and more particularly, to the authors
of the concerned report.
The present study on The Incidence of Indirect Taxes in India, 1973-74
was undertaken at the instance of the Indirect Taxation Enquiry Commi
ttee appointed by the Government of India in July 1976 under the
chairmanship of Shri L.K. Jha. The findings of the study have already
been incorporated in Volume II of the report of the Jha Committee.
However, as the study is likely to be of general public interest, it has been
considered desirable to bring it out as a separate publication. This is
being done with the permission of Ministry of Finance, Government
of India.
R. J. CHELLIAH
New Delhi Director
November 23, 1978

ACKNOWLEDGMENT
The authors wish to thank Dr. A.K. Bagchi and Shii A.V.N. Iyenger
for their useful comments on the methodology employed in the
study as well as on parts of the first draft.
The authors would also like to acknowledge research assistance by
Shri B. Sathpathy, Shri Joseph Thachil and Miss Vijaya Devi.
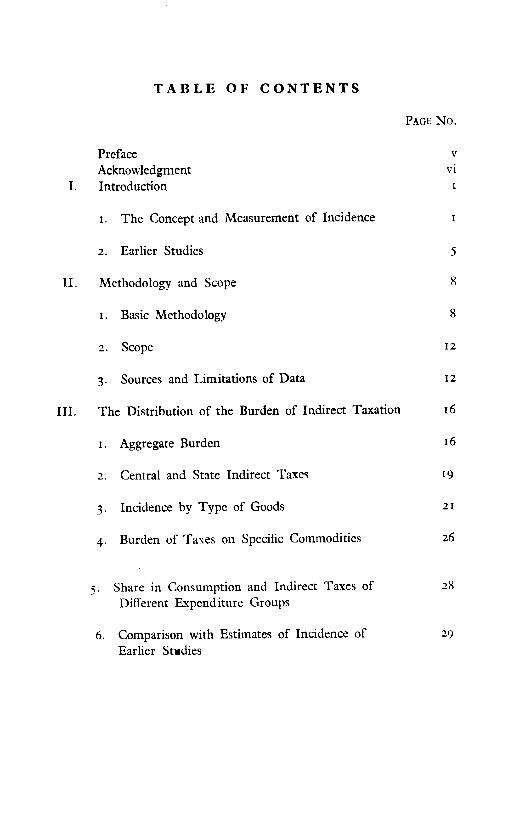
TABLE OF CONTENTS
Page No.
Preface v
Acknowledgment vi
I. Introduction i
1. The Concept and Measurement of Incidence i
2. Earlier Studies 5
II. Methodology and Scope 8
1. Basic Methodology 8
2. Scope 12
3. Sources and Limitations of Data 12
III. The Distribution of the Burden of Indirect Taxation 16
1. Aggregate Burden 16
2. Central and State Indirect Taxes 19
3. Incidence by Type of Goods 21
4. Burden of Taxes on Specific Commodities 26
5. Share in Consumption and Indirect Taxes of 28
Different Expenditure Groups
6. Comparison with Estimates of Incidence of 29
Earlier Studies

Appendix I
Appendix II
Statistical Appendix
Index
APPENDICES
Pagh No.
33
89
95
103
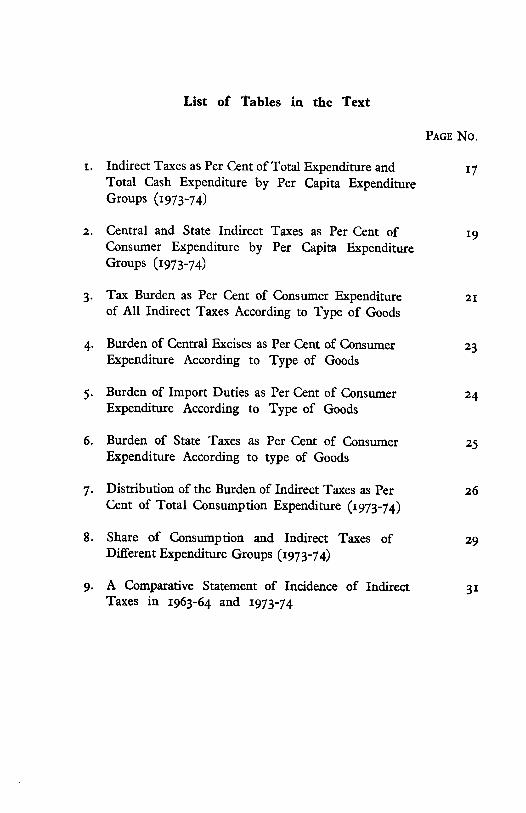
List of Tables in the Text
Page No.
1. Indirect Taxes as Per Cent of Total Expenditure and 17
Total Cash Expenditure by Per Capita Expenditure
Groups (1973-74)
2. Central and State Indirect Taxes as Per Cent of 19
Consumer Expenditure by Per Capita Expenditure
Groups (1973-74)
3. Tax Burden as Per Cent of Consumer Expenditure 21
of All Indirect Taxes According to Type of Goods
4. Burden of Central Excises as Per Cent of Consumer 23
Expenditure According to Type of Goods
5. Burden of Import Duties as Per Cent of Consumer 24
Expenditure According to Type of Goods
6. Burden of State Taxes as Per Cent of Consumer 25
Expenditure According to type of Goods
7. Distribution of the Burden of Indirect Taxes as Per 26
Cent of Total Consumption Expenditure (1973-74)
8. Share of Consumption and Indirect Taxes of 29
Different Expenditure Groups (1973-74)
9. A Comparative Statement of Incidence of Indirect 31
Taxes in 1963-64 and 1973-74
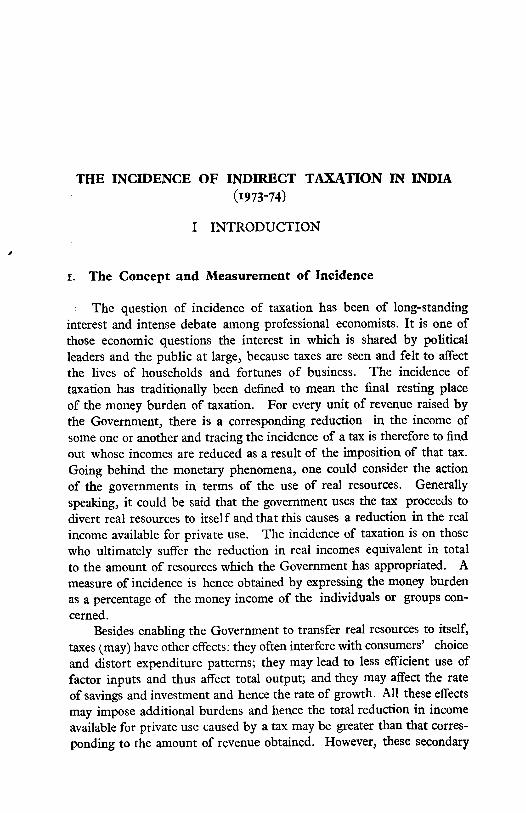
THE INCIDENCE OF INDIRECT TAXATION IN INDIA
(1973-74)
I INTRODUCTION
1. The Concept and Measurement of Incidence
The question of incidence of taxation has been of long-standing
interest and intense debate among professional economists. It is one of
those economic questions the interest in which is shared by political
leaders and the public at large, because taxes are seen and felt to affect
the lives of households and fortunes of business. The incidence of
taxation has traditionally been defined to mean the final resting place
of the money burden of taxation. For every unit of revenue raised by
the Government, there is a corresponding reduction in the income of
some one or another and tracing the incidence of a tax is therefore to find
out whose incomes are reduced as a result of the imposition of that tax.
Going behind the monetary phenomena, one could consider the action
of the governments in terms of the use of real resources. Generally
speaking, it could be said that the government uses the tax proceeds to
divert real resources to itself and that this causes a reduction in the real
income available for private use. The incidence of taxation is on those
who ultimately suffer the reduction in real incomes equivalent in total
to the amount of resources which the Government has appropriated. A
measure of incidence is hence obtained by expressing the money burden
as a percentage of the money income of the individuals or groups con
cerned.
Besides enabling the Government to transfer real resources to itself,
taxes (may) have other effects: they often interfere with consumers' choice
and distort expenditure patterns; they may lead to less efficient use of
factor inputs and thus affect total output; and they may affect the rate
of savings and investment and hence the rate of growth. All these effects
may impose additional burdens and hence the total reduction in income
available for private use caused by a tax may be greater than that corres
ponding to the amount of revenue obtained. However, these secondary

2 INCIDENCE OF INDIRECT TAXATION IN INDIA
effects are generally excluded from the concept and measurement of inci
dence of taxation and attention is concentrated on the direct money bur
den as being the most important aspect of the matter.
The traditional concept of incidence has been criticised in recent
years and new ways of looking at the question have been suggested. It
is pointed out that taxation by itself does not cause a reduction in real
income available for private use; it is public expenditure that absorbs
real resources. Taxes may be increased or reduced for any number of
reasons without changing the level of real public expenditure. It is
argued therefore that taxation only changes the distribution of income
and that the incidence of taxation should accordingly be defined as the
change in the distribution of real income available for private use.
The magnitude and nature of change in real income can only be stu
died by comparing two situations: the state of distribution before the tax
with that after the imposition of the tax (or situations without and with
the tax). The problem here is that if we assume that a tax is imposed
^or an existing tax increased), something else also changes; either public
expenditure increases or there will be a change in the budget balance.
In either case, the change in the distribution of real income will be due
to the combined effects of the tax and something else and not those
of the tax alone. Professor Musgrave has suggested that the combined
effect of an equal increase in tax and public expenditure might be termed
"budget incidence". If the effect on the distribution of a given tax is
to be isolated, other things must be held constant. This can only be
done by replacing one tax by another of equal yield. The distributional
consequence of substituting one tax for another of equal yield is termed
"differential incidence". Currently, most fiscal theorists seem to prefer
the concept of differential incidence.
However, the concept of differential incidence relates to a change
in the tax system. It cannot, strictly speaking, be applied to measure
the incidence of an existing structure of taxation. On the other hand,
if one wishes to apply the concept of budget incidence, one would have
to compare two situations—the state of distribution without a budget
and that with the existing budget. But it is impossible to wish away the
entire budget, for it would make no sense to make a comparison with a
state of the economy without a Government. Some writers try to get
out of this difficulty by assuming that the existing tax system is being
substituted for a hypothetical, neutral tax, sugh as a proportional income

INTRODUCTION 3
tax, of equal yield.1 But this conceptual device would make no differ
ence to the numerical results; one would get the same results if one
simply measured the absolute incidence of the system as such.2
Despite the theoretical arguments that several economists have ad
duced in favour of the concept of differential incidence, the fact remains
that the public are interested in knowing whether the existing tax system
distributes the burden in an equitable manner. While from the eco
nometric point of view, the concept of differential incidence lends itself
to more accurate measurement, it would by no means be illegitimate to
ask the question: "Who pays the existing taxes?", although there are
difficulties in providing an accurate, quantitative answer. In the present
exercise, according to our terms of reference, we shall be attempting to
measure the incidence of the existing system of indirect taxes in India
on the implicit assumption that the volume and pattern of government
expenditure is given and that all the tax revenue is spent.
The theory of incidence in economic literature is largely based on
deductive reasoning; it attempts to trace the direction and the relative
magnitude of shifting of particular taxes under different circumstances.
One way ofmeasuring the incidence of a given tax or a set of taxes is to
quantify the conclusion of such deductive reasoning. However, the
results of this reasoning are not always logically conclusive; and further
more, one would like to empirically test conclusions based on deductive
reasoning before applying them to real world situations. Ideally, there
fore, one should prefer the alternative method of specifying tentative
hypotheses regarding shifting and of econometrically testing them. The
results of the econometric exercise would provide the empirical basis
for working out the incidence of the tax system. While this might be
the conceptually perfect solution, formidable statistical and other diffi
culties arise in carrying out the needed econometric exercises. In fact,
in order to deal satisfactorily with broad-based taxes such as excises
and the general sales tax, we would need a full-fledged econometric model
of the economy. The formulation and estimation of such a model for
India lies in the future. Again, the econometric method is more rele
vant for the measurement of differential incidence than for estimating
the incidence of an existing tax system. For these reasons, we have to
1Pechman, Joseph A. and Okner, Benjamin A., Who Bears the Tax Burden?
Studies in Government Finance, The Brookings Institution, Washington, D.C.,
1975,
2Luc De Wulfj "Fiscal Incidence Studies in Developing Countries: Survey
and Critique", IMF Staff Papers, Vol. XXII, No. 3, March, 1975, p. 97-

4 INCIDENCE OF INDIRECT TAXATION IN INDIA
take recourse to the method of quantifying the conclusion of deductive
reasoning in the theory of incidence.
Commodity taxes could be selective or general. It is generally
argued that the incidence of a selective tax on a commodity would be
divided between the buyers and the producers (factor owners) in the
proportion of the (price) elasticity of the supply of the commodity to the
elasticity of the demand for it. Only if the supply were perfectly elastic,
the entire burden would be shifted to the consumers; conversely, only if
the demand were perfectly elastic, the entire burden would remain with
the factor owners. The elasticity of supply depends crucially upon
the capacity of, and the scope for, the factors of production in the taxed
industry to move to untaxed fields. If a factor of production is specific
to a particular industry, i.e., the industry that is taxed, then it would
have to stay there and accept a cut in earnings. On the other hand, if
the factor is capable of being employed in alternative industries, some
units of the factor would move out, the supply of that factor to the taxed
industry would be cut and the level of earnings would not be significantly
affected. The price of the product would correspondingly rise. Now,
in the short run, it may not be possible for several factors of production
to move out of a taxed industry. In the long run, however, new vistas
open up, old machines get worn out and need not be replaced, and simi
larly the existing work force is not fully replaced. As time passes, there
fore, supply can be expected to become more and more elastic. Hence
the assumption that in the long run supply is more or less perfectly
elastic and that the incidence of a selective commodity tax will be fully
shifted on to consumers.
Let us now consider a general excise or sales tax falling on all com
modities and services. One school of thought believes that if such a tax
were to be levied at one rate covering all goods and services, it would
be equivalent to a proportional income tax on all factor earnings. This
conclusion is based on the reasoning that since all industries are taxed,
there are no untaxed fields to which factors could migrate even in the
long run in an effort to avoid a cut in their earnings as a result of the tax.
This means that all factors will have to accept a proportionate reduction
in their incomes. One could even assume that prices rise as a result of
the general tax. But since the general tax applies to consumer goods as
well as capital goods, consumers as well as investors will be affected.
In other words, the tax will fall on consumption and saving, which is
equal to income. Thus, it is argued, whether the general price level
rises or not as a result of the tax, the burden of the tax will be distributed

INTRODUCTION 5
in proportion to incomes.
In examining the above view, one has to rule out the hypothetical
case in which prices do not rise as a result of the general tax. Since we
are assuming that all tax revenue is spent, the demand for factors and
factor incomes will not fall and prices will have to rise. The argument
of such writers as Professor Musgrave that even if prices rise, the burden
of the general tax is distributed in proportion to income and not con
sumption is based on the premise that the tax on capital goods rests on
the investors. A more plausible view is that in course of time the tax
on the capital goods also will be shifted to the consumers of the pro
ducts for whose manufacture the former are used. If this happens, the
burden of a general commodity tax will rest ultimately with the
consumers.
Even this last conclusion will be fully valid only on the assumption
of the existence of competition and long-run mobility of factors of pro
duction and of the absence of controlled markets and wholly specific
factors of production such as land that can be put to only one use. All
these assumptions and the reasoning given in the previous paragraph
are implicit in the view that all commodity taxes art, sooner or later,
fully shifted on to the consumers. Since every one of the needed assum
ptions will not always be fulfilled, this view of incidence will not turn
out to be entirely correct. Moreover, since considerable time may elapse
before certain factors can move out of various taxed industries, part of
the incidence of a number of taxes may be on the producers at any given
time. What may broadly be true, however, is that the major part of the
burden of commodity taxation as a whole will be on the consumers.
In the present exercise, we proceed on the assumption that the entire
burden of commodity taxes is shifted to consumers who bear it in pro
portion to their consumption of the various taxed commodities. Indeed,
in a sense, our empirical effort amounts to nothing more than working
out and applying techniques of quantifying that assumption. Most of
the earlier studies, referred to below, also had attempted to measure
incidence on the basis of the same assumption.
2. Earlier Studies
A number of attempts have been made over the last two decades or
so to estimate the incidence of taxes in India. Of these several relate to
taxes in particular States or to particular taxes in the country. Examples
of the former are the studies by the National Council of Applied Eco-
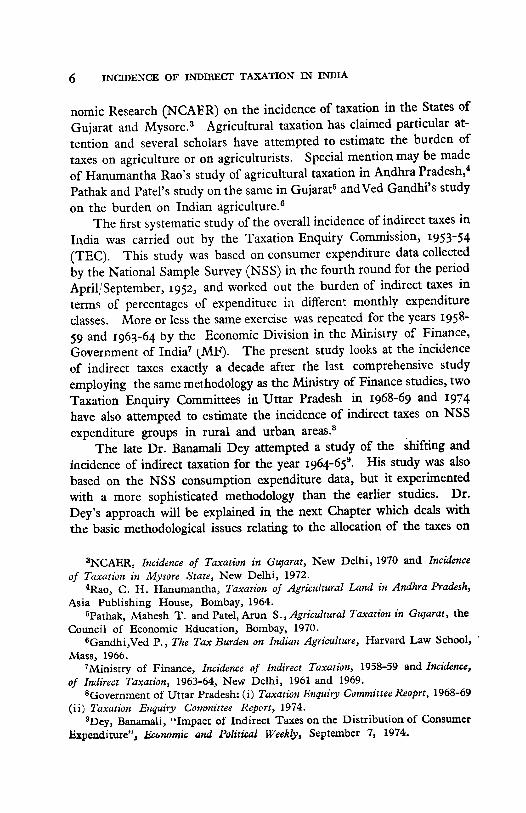
6 INCIDENCE OF INDIRECT TAXATION IN INDIA
nomic Research (NCABR) on the incidence of taxation in the States of
Gujarat and Mysore.3 Agricultural taxation has claimed particular at
tention and several scholars have attempted to estimate the burden of
taxes on agriculture or on agriculturists. Special mention may be made
of Hanumantha Rao's study of agricultural taxation in Andhra Pradesh,4
Pathak and Patel's study on the same in Gujarat5 andVed Gandhi's study
on the burden on Indian agriculture.6
The first systematic study of the overall incidence of indirect taxes in
India was carried out by the Taxation Enquiry Commission, 1953-54
(TEC). This study was based on consumer expenditure data collected
by the National Sample Survey (NSS) in the fourth round for the period
April/September, 1952, and worked out the burden of indirect taxes in
terms of percentages of expenditure in different monthly expenditure
classes. More or less the same exercise was repeated for the years 1958-
59 and 1963-64 by the Economic Division in the Ministry of Finance,
Government of India7 (MF). The present study looks at the incidence
of indirect taxes exactly a decade after the last comprehensive study
employing the same methodology as the Ministry of Finance studies, two
Taxation Enquiry Committees in Uttar Pradesh in 1968-69 and 1974
have also attempted to estimate the incidence of indirect taxes on NSS
expenditure groups in rural and urban areas.8
The late Dr. Banamali Dey attempted a study of the shifting and
incidence of indirect taxation for the year 1964-659. His study was also
based on the NSS consumption expenditure data, but it experimented
with a more sophisticated methodology than the earlier studies. Dr.
Dey's approach will be explained in the next Chapter which deals with
the basic methodological issues relating to the allocation of the taxes on
3NCAER, Incidence of Taxation in Gujarat, New Delhi, 1970 and Incidence
of Taxation in Mysore State, New Delhi, 1972.
4Rao, C. H. Hanumantha, Taxation of Agricultural Land in Andhra Pradesh,
Asia Publishing House, Bombay, 1964.
5Pathak, Mahesh T. and Patel, Arun S., Agricultural Taxation in Gujarat, the
Council of Economic Education, Bombay, 1970.
6Gandhi,Ved P., The Tax Burden on Indian Agriculture, Harvard Law School,
Mass, 1966.
'Ministry of Finance, Incidence of Indirect Taxation, 1958-59 and Incidence,
of Indirect Taxation, 1963-64, New Delhi, 1961 and 1969.
8Government of Uttar Pradesh: (i) Taxation Enquiry Committee Reoprt, 1968-69
(ii) Taxation Enquiry Committee Report, 1974.
8Dey, Banamali, "Impact of Indirect Taxes on the Distribution of Consumer
Expenditure", Economic and Political Weekly, September 7, 1974.

INTRODUCTION 7
different commodities.
We have defined incidence of taxation to mean the distribution of
the reduction in real income available for private use. Since incomes
are the most important indicators of the relative economic positions (in
terms of welfare) of different individuals, we are really interested in know
ing how taxes affect the incomes of different individuals, households,
or social groups. That is why, progression and regression are measured
with reference to income. If the percentage of taxes increases with
income, they are said to be progressive; and conversely, if the percentage
falls as income rises, the taxes are said to be regressive. Unfortunately,
however, we do not have for India adequate data on income distribution
nor expenditure data by income groups. NSS provides details of ex
penditure only by expenditure groups. Hence, most of the earlier studies
of the incidence of commodity taxation have had to be content with
working out the burden in terms of percentages of expenditure of house
holds in different total or per capita expenditure classes. Notable ex
ceptions to this general practice are a study of the incidence of taxation
undertaken by the Orissa Taxation Enquiry Committee, 196110 and an
attempt by Lydall and Ahmed (1961) to allocate all taxes among income
groups in urban and rural areas.11
In the former study, on the basis of certain assumed propensities
to save, the expenditure groups were converted into income groups.
In the Lydall and Ahmed study, income tax statistics, unsatisfactory
as they were, were combined with NSS data to derive estimates of income
distribution for 1955-56. The same distribution was assumed to exist
in 1965-66. While such attempts are valuable as experiments in metho
dology, it is doubtful if the results obtained could really be taken as being
reliable for policy formulation. Income tax revenue statistics them
selves are subject to several limitations and in their present form cannot
be combined with expenditure data for given years. It would seem that
much remains to be done before we obtain a satisfactory picture of income
distribution for our purpose. In the present exercise, therefore, we are
following the example of TEC and the MF studies in working out the
incidence only in terms of percentages of expenditure.
wGovernment of Orissa: Orissa Taxation Enquiry Committee Report, Bhuba-
neshwar, 1961.
uLydaH, H.F., and Ahmed M. "An Exercise in Forecasting Consumer De
mand and Taxation Yields in India in 1965-66", Indian Economic Review, August,
1961.

II METHODOLOGY AND SCOPE
i. Basic Methodology
As would have become clear from the earlier discussion, the pre
sent study aims at allocating only the money burden of indirect taxes
levied by the Central and State governments measured as equivalent to
tax revenues collected from the non-government sector12. Moreover,
it does not take into account the benefits accruing to different households
as a result of government services financed by tax revenues. It is assumed
that all commodity taxes are passed forward to the consumers except a
certain portion which is taken to be borne by the Government itself.13The basic problem is to ascertain the tax element in the expenditure of
households in different expenditure groups. NSS data provide details
of consumption expenditure of households classified according to ranges
of per capita monthly expenditure. Using these data, the taxes on differ
ent commodities could be allocated to different expenditure groups.
One way of doing this is to take the values or physical quantities
of consumption of different commodities by each expenditure group and
multiply them by the relevant tax rates. Apart from the fact that the
data on the physical amounts of consumption are not readily usable^
this method runs into a major difficulty, namely, that the total amount
of allocable tax on a particular commodity obtained by multiplying tax
rates with the value or volume of consumption is seldom equal to the
actual yield of the tax on that commodity. This discrepancy is partly due
to the concessions and exemptions granted, (for which proper allowance
cannot be made while using the consumption data) and partly due to
evasion. Moreover, it is not always possible to match the classifications in
the consumption data with that used in the tax laws. Because of these
reasons, an alternative method has been employed by us. We have
12For the purpose of the present study, the non-government sector is taken
to include, apart from households and private business, departmental and non-
departmental undertakings. The reason for this is explained later.
18In the case of taxes on capital goods, it is assumed that the relevant tax
burden is passed on over the period of their lives.

Methodology and scope
allocated the actual tax yield from a commodity among the expenditure
groups according to the proportions of their cash expenditure on the
consumption of that commodity. The same procedure was also followed
by the MF studies in relation to the allocation of Central taxes.
A number of problems arise in the apportionment of tax revenues
among the households in the different expenditure classes. We shall
deal with a few important ones here. The details of procedure adopted
for allocating taxes on major individual items that created special diffi
culties are described in Appendix I.
The task of allocation would have been fairly straight-forward if
only consumption goods and services were subjected to tax. As it is,
hot only consumer items, but also items of machinery, intermediate
products and services that enter into productive processes such as trans
port are also subject to various levies at different stages. We have as
sumed, as indicated earlier, that the taxes on capital goods and inputs
are also passed on to the consumers of the products for whose manu
facture they are used. A large number of inputs are each used in the
manufacture of several products. Also, many goods are used both
as inputs and as final products. Hence not only are taxes on two por
tions of several goods to be allocated differently, but also the proportions
in which the output of each input is used in the production of different
products have to be ascertained. What is ultimately to be done is to
add the proper fractions of taxes on the inputs to the taxes on the con
cerned final products in order to derive the cumulative burdens on the
latter. The cumulative burdens can then be apportioned on the basis
of expenditure on consumer or final goods. Theoretically, the most
satisfactory way of working out the cumulative burden on final products
would be to use an input-output model for the economy. Given the
tax rates on individual products and the input-output relations, a tax
"matrix" can be prepared which would enable one to allocate the taxes
to "final products", i.e., units of goods used for consumption. Dr.
Dey, in the study previously referred to, used the 144 sector input-
output table constructed by Saluja for the year 1964-65." His methodology marked a significant improvement over the approach of the MF
studies in which the entire proceeds of taxes on capital goods and inputs
were allocated on the basis of consumption of manufactured goods. The
reliability of the empirical results derived through the use of the input-
, M.rT, "Structure of the Indian Economy, 1964-65", Sankhya, Vol.
34, 1972, pp. 433-462.

10 INCIDENCE OF INDIRECT TAXATION IN INDIA
output model, however, depends on the reliability of the input-output
relations as well as on the degree of disaggregation of data. Tax cate
gories are usually more numerous than the commodity groupings in the
input-output matrix; certainly they are more than the 144 sectors in
Saluja's table.
For the present study, the original intention was to produce two
alternative estimates: one based on a larger input-output table for
1968-69 being then put together at the Planning Commission; and the
other to be derived through a more simple-minded, case by case alloca
tion of taxes on inputs and machinery to the different expenditure groups
on the basis of their pattern of consumption of final goods. As the con
struction of the input-output table was delayed for various reasons, we
were unable to proceed with the first alternative. We are, therefore,
presenting only one set of estimates, the manner of derivation of which
is discussed later on.
Taxes on current inputs may be expected to be passed on to con
sumers without any time-lag. Taxes on machinery items, on the other
hand, raise the cost of purchase of machinery and can only be passed
on to the consumers of their products through higher depreciation charges
over a period of time. In the MF studies, the entire taxes on machinery
items were allocated to consumers in the year in which they were collected.
By contrast, in the present study, the average life of plant and machinery
is taken to be 10 years and, accordingly, only i/ioth of the taxes collected
on machinery items in 1973-74 is assumed to be passed on to the con
sumers during that year.
Another major problem relates to the incidence of taxes on com
modities and services purchased by the Central and State governments.
If all government purchases are by law free of taxation, the government
sector could be said to be paying no indirect taxes. As no such exemp
tion has been provided for (except in certain cases such as the import of
defence equipment), when the government buys, or pays for the use
of, taxed materials, it may be said to be paying taxes to itself. In this
connection, the government sector has to be defined carefully. If a
governmental or public sector unit sells its services or goods to the public,
then it may be expected to pass on to the consumers any taxes it pays
on its inputs by charging correspondingly higher prices. It is only
when a unit acts as part of what is called general government whose ser
vices are given free that the taxes cannot be shifted. Hence depart
mental and non-departmental commercial undertakings in the public
sector should be excluded from the definition of the government sector

METHODOLOGY AND SCOPE 11
for this purpose, and the indirect taxes paid by them should be treated
on par with those paid by private sector enterprises. But the taxes paid
by the government sector proper should be excluded from the allocable
pool.
In the MF study of 1969, it was stated, "As for the tax element in
Governments' consumption expenditure, no adjustment could be made
due to absence of data. It was, however, ascertained that the amount
involved was not dimensionally significant and any adjustment on that
account, if possible, would have at best made a marginal difference to
the results of this study."15 Since the government sector had expanded
rapidly in the decade since 1963-64, we considered it important to make
the needed adjustment. It is true, however, that information on the
value of different kinds of goods bought by the Government is not readily
available, and in some cases not available at all. We explored several
possible sources of data. Ultimately, main reliance has been placed on
the information contained in A Technical Note on the Approaches to the
Fifth Plan of India, 1974-79, published by the Planning Commission
(1973). We have been able to make adjustments with respect to goods
bought for government consumption and the construction part of govern
ment capital formation. Details are given in Appendix II. We found
that nearly 5 per cent of total indirect taxes in 1973-74 were to be allo
cated to the government sector.
One further problem may be referred to. Subsidies are in a true
sense negative indirect taxes. Strictly speaking, they should be set off
against indirect taxes. Thus, while consumers of electricity may be paying
an electricity duty, the Government may be covering the loss of electricity
undertakings through subsidies out of general revenue. Not to take
into account the subsidies would mean overestimating the burden on the
consumers of electricity. However, one might raise the question if sub
sidies should be brought in when other types of beneficial expenditures
are not being considered. Moreover, subsidies are partly open and
partly hidden and a vast new area would have to be covered, with its own
several problems, if adequate note is to be taken of all subsidies granted
by the Centre and the States. We have confined our attention to positive
taxes.
"Ministry of Finance, Incidence of Indirect Taxation 1963-64, op. cit., p. 3.

12 INCIDENCE OF INDIRECT TAXATION IN INDIA
2. Scope
This study covers all the indirect taxes levied by the Central and
Stare governments, excluding taxes on exports. They are: import duties,
Union excise, sales taxes, State excise on liquor, tax on passengers and
goods, motor vehicles tax, entertainment tax, electricity duty and other
(minor) taxes and duties. Taxes levied by municipal and other local
bodies have been left out. The most serious omission is that of octroi,
on which the required data could not be obtained.
3. Sources and Limitations of Data
For carrying out this study, we need data on (i) collection of all
taxes on goods and services except taxes on exports; (ii) pattern of expen
diture of households in different per capita expenditure classes and (iii)
in certain cases, value or quantity of commodities subject to tax.
(a) Since the patterns of consumption as between expenditure
groups vary from commodity to commodity, the tax on each com
modity has to be allocated separately. We needed, therefore, to obtain
commodity-wise data on tax collections. Some indirect taxes fall on
specific goods or services, e.g., the tax on motor spirit or the enter
tainment tax. Problems arise only in the case of general taxes. As re
gards import duties and excises, commodity-wise collection of these taxes
is given in the Statistical Year Book-Central Excise. This source has been
used. But the State government budgets do not give commodity-wise
classification of sales tax yield. (The yield of sales tax on motor spirit
is separately available.) However, a number of State governments have
started collecting information on the yield of sales tax on different com
modities or commodity groupings. We were able to obtain this infor
mation for 13 major States. The proportions worked out for the 13
States were applied to derive estimates of commodity-wise breakdown
of total sales tax collections in India.
The figures of collections of other State taxes are taken from the
Budgets of the State governments and Union Territories.
(b) The 28th round of NSS, carried out during the period October
1973 to June 1974, is the latest comprehensive survey of household ex
penditure. An advance tabulation of the 28th round data was specially
carried out for this study at the request of the Ministry of Finance. In
this tabulation, households were divided into seven monthly per capita
expenditure classes, namely, Rs. 0-15, Rs. 15-28, Rs. 28-43, ^s- 43"55>

MI'TniODOLOGY AND SCOPE 13
rs. 55-75, Rs. 75-100 and Rs. ioo and above. Further, as in earlier ta
bulations, a vertical division of these expenditure groups into rural and
urban households was also given so that we could work out the incidence
of taxes on rural and urban households separately. Again, expenditures
on particular items were divided, wherever necessary, into cash and
non-cash expenditure. This division was essential because taxes on
many commodities are paid only if they are bought for cash.
The MF study of 1969 used NSS data of the 18th round for the
year 1963-64. The maximum number of items for which expenditure
data were collected during the 18th round was 187. The 28th round
of NSS canvassed information on 395 commodities and services including
sub-items. This vastly increased disaggregaiion of expenditure data
has made possible a more accurate allocation of the indirect tax burden
than in the earlier study.
The number of urban households covered in the sample for the 28th
round (the basis of the present study) was much higher than in the 18th
round, while the number of rural households was kept lower. The faster
rate of growth of urban population during the intervening period, raising
the proportion of urban population to total population, has warranted
this change. A comparative picture of the number of rural and urban
households covered in the 13th, 18th and 28th rounds of NSS is given
in the following table:
TABLE II. 1
Coverage of Rural and Urban Households
(Numbers)
NSS round and the reference year
(1)
1. 13th (1957-58)
2. 18th (1963-64)
3. 28th (1973-74)
Number of sample
Rural
(2)
6738
21572
15467
households
Urban
(3)
3583
4337
7881
covered
Total
(4)
10321
25909
23348
Sources: 1. Incidence of Indirect Taxation, 1957-58 (MF)
2. Incidence of Indirect Taxation, 1963-64 (MF)
3. 28th NSS round, 1973-74
(c) For estimates of production and clearance, where necessary, we
have used the Statistical Year Book-Central Excise.

14 INCIDENCE OF INDIRECT TAXATION IN INDIA
The main limitations of the data used may be briefly indicated here.
(i) Consumption data
NSS data suffer from several limitations. First, the NSS concept
of a household does not refer to a family unit, since a household is defined
to comprise all persons who share a common kitchen irrespective of
the number of earners. Domestic servants are also included if they eat
from the same kitchen. This tends to understate the per capita expen
diture of richer households. Second, the estimates of the non-cash com
ponent of expenditure are based on imputation. It is feared that in
many cases where comparable market prices are not available, imputa
tion is really based on rough guesses. To the extent that the consump
tion of home produced and home processed goods is wrongly estimated,
biases are introduced. Third, the survey is spread over a period of six
months during which prices of different commodities change, particularly
during times of inflation. These price changes introduce distortions to
some extent. Lastly, higher expenditure groups may tend to understate
their consumption. Moreover, the value of perquisites enjoyed by the
employees of private and public sector companies is not likely to be re
flected in the NSS consumption expenditure data. To the extent that
the consumption of richer employees is understated for this reason, the
incidence will be shown to be more progressive (or less regressive) thanit really is.
The aggregate value of consumption expenditure for the population
as a whole in I973"743 worked out on the basis of per capita NSS data
and the population figures obtained from the office of the Registrar Gene
ral, differs from the estimate of private consumption, derived from na
tional accounts (given by CSO) for the same year. The CSO's figure is
higher. Following earlier practice, we have raised the NSS estimate of
consumption expenditure for each expenditure group in the rural and
urban sectors so as to arrive at a total expenditure equal to the CSO esti
mate. The exact procedure of adjustment is as follows: First, the CSO
estimate of aggregate private consumption expenditure was split into
rural and urban households' expenditures on the basis of the proportions
between them in the NSS estimates. Secondly, ratios were workedout between consumption estimates according to the CSO and those
according to the NSS for the rural and urban sectors separately. And,
finally, the per capita expenditure figures for the different expenditure
groups in the rural and urban areas were multiplied by the relevant ratios
in order to raise them, so that the total consumption figure was madeequal to the CSO estimate.

METHODOLOGY AND SCOPE 15
(ii) Tax data
As stated earlier, an accurate classification of sales tax receipts by
commodity groups is not available. We are forced to make use of esti
mates of yield of sales tax on different commodities, based on information
furnished by 13 States. This would not have been a major limitation
in itself. But we understand that the figures given by some of the States
are themselves based on estimates. However, since the bulk of sales tax
revenue is derived from a fairly limited number of staple commodities,
the inaccuracies in the data furnished by the State governments are not
likely to bias the results to any significant extent.
The more basic problem is that the classification of goods given in
the consumer expenditure data does not often match the tax categories,
i.e., the classification of goods under which tax collections are shown.
Moreover, in cases where different varieties of the same goods are taxed
differently, information on the total yield of the tax on those goods is not
sufficient for our purpose. We need the breakdown of yield by varieties
as also information on how much of thedi fferent varieties was consumed
by each expenditure group. We cannot often get these details. Hence
several assumptions regarding the pattern of consumption have had to
be made in allocating these burdens in such cases. Appendix I describes
the procedures adopted in relation to major commodity groups.

Ill THE DISTRIBUTION OF THE BURDEN OF INDIRECT
TAXATION
i. Aggregate Burden
Indirect taxes levied by the Centre and the States rose from 8.9 per
cent of national income in 1963-64—the year of the last MF study of
incidence—to 11.2 per cent in 1973-74. Of this 11.2 per cent, 1.65 per
centage points could be said to have fallen on the government sector
and on the investors, and the rest to have been shifted to the consumers.
The portion falling on the consumers is estimated to have amounted to
10.54 per cent of household consumption expenditure. This is an aver
age of the burdens on the rural and the urban households, which differed
considerably in percentage terms. While the burden on the rural house
holds amounted only to 8.0 per cent of their consumption, that on the
urban households amounted to 18.0 per cent. The rural sector accounted
for 77 per cent of private consumption, and bore 57 per cent ofthe indirect
taxes allocable to consumers. The share of the rural sector in total
population is estimated to have been 80.1 per cent in that year. In the
MF study of 1968-69, it had been estimated that, as of 1963-64, the rural
sector, accounting for 81.5 per cent of the total population then, had paid
60 per cent of the indirect taxes. Thus the tax share of the rural sector
is seen to have fallen, while its share in populotion also fell margi
nally.
The per capita indirect tax payment per annum for the urban house
holds amounted to Rs. 174.5 in 1973-74 and was three times the per
capita payment of Rs. 57.3 estimated for the rural household. The pro
portion was nearly the same (2.9) in 1963-64:
Table I in the Statistical Appendix presents the details of the indirect
taxes paid by the different per capita expenditure groups in rural and
urban areas and also indicates the percentage of consumption expenditure
paid in taxes in each case. The information on the inter-group distri
bution of the burden of indirect taxation is abstracted from that table
and presented below.

DISTRIBUTION OF THE BURDEN OF INDIRECT TAXATION 17
TABLE III.l
Indirect Taxes as Per Cent of Total E-penditureand Total Cash Expenditure
by Per Capita Expenditure Groups
(1973-74)
Monthly per
capita
expenditure
group
(in rupees)
0-15
15-28
28-43
43-55
55-75
75-100
100 and
above
All house
holds
Rural
Tax as
percent
age of
total ex
penditure
2.91
3.33
4.45
6.18
6.71
10.02
16.17
8.03
Tax as
percent
age of
total cash
expendi
ture
4.55
5.25
7.27
10.32
11.40
16.43
22.46
12.87
Urban
Tax as
percent
age of
total ex
penditure
3.63
6.31
7.36
9.66
11.86
14.80
30.19
17.96
Tax as
percent
age of
total cash
expendi
ture
4.44
6.79
7.93
10.31
12.70
15.85
31.35
19.03
All
Tax as
percent
age of
total ex
penditure
2.96
3.63
4.89
6.85
7.92
11.40
21.96
10.54
India
Tax as
percent
age of
total cash
expendi
ture
4.56
5.46
7.41
10.31
11.82
16.21
26.77
14.96
The most important feature of the estimates presented is that they
indicate a progressive distribution of the tax burden in terms of per
cent ofexpenditure. Thus, taking rural and urban households together,
we find that the indirect tax burden as a proportion of expenditure
increases progressively from about 3 per cent for households with
per capita monthly expenditure not exceeding Rs. 15 to nearly 22 per
cent for those in the group with expenditure above Rs. 100. Even if
the highest expenditure group is left out, the percentage burden is
nearly four times on the next highest expenditure group (Rs. 75-100
per capita) as on the lowest expenditure group.
The progressive pattern ofdistribution of indirect tax burden is seen
to prevail also among rural and urban households takea separately,
except that the burden on the urban households is distinctly higher
than on the rural households in the corresponding expenditure classes.
This difference is partly due to the higher proportion of non-cash ex
penditures for the rural households and partly due to difierences in the
pattern of consumption between rural and urban households. The
former was the more important factor. This can be seen from the

18 INCIDENCE OF INDIRECT TAXATION IN INDIA
fact that tax burden as a percentage of cash expenditure is only margi
nally different as between rural and urban households in the same per
capita expenditure classes, except for the class having per capita ex-
penditurve of Rs. ioo and above. Table II in the Statistical Appendix
gives the percentages of cash expenditure to total expenditure for the
different per capita expenditure groups in rural and urban areas. In
the rural sector, the proportion of cash expenditure remains more or
less constant as one moves up the expenditure scale, except at the very
top; whereas in the urban sector the proportion of cash expenditure
rises with the level of per capita total expenditure. This is one of
the causes of the higher degree of progression in the urban sector.
It should be remembered that the progression that we have found
is only with reference to expenditure. One would like to know if the
distribution is progressive also in terms of percentages of incomes of
households, i.e., whether the upper income groups pay a higher pro
portion of their income as indirect taxes. As already indicated, we
are unable to provide an answer to this question as satisfactory data on
income distribution are not available. It is likely that at the upper
end of the income scale, consumption forms a lower proportion of
income than it is at the lower end. So indirect taxes may tend towards
reduced progression, or even regression, at the top. However, the
finding that the top expenditure group in urban areas (which would
also be the top income group in the country), pays as much as 30 per
cent of its expenditure as indirect taxes indicates that if the highly
progressive direct taxes which the more well-to-do in that group pay
(.or should be paying) are also taken into account, the tax structure as
a whole in India would be progressive with respect to income. Whether
that structure is made effective depends, of course, on the degree of
enforcement of the direct tax system. As far as the indirect taxes
alone are concerned, it is noteworthy that, in spite of the widespread
taxation of inputs, the tax structure turns out to be uniformly pro
gressive over the entire range of expenditure considered.
While the structure of indirect taxes is progressive with reference
to expenditure, it cannot be overlooked that indirect taxes fall even on
the poorest sections of society. Thus, urban households with monthly
per capita expenditure of Rs. 15 or less at 1973-74 prices (corresponding
to Rs. 19.5 or less at 1976-77 prices) pay 3.6 per cent of their meagre
expenditure, which is likely to equal or exceed their income, in taxes;
and those in the Rs. 15—Rs. 28 per capita expenditure group (Rs. 19.5

DISTRIBUTION OF THE BURDEN OF INDIRECT TAXATION 19
—Rs. 36.4 at 1976-77 prices) pay as much as 6.3 per cent of expenditure
in indirect taxes. In absolute terms, this means that an urban family
of five members spending Rs. 75 per month pays about Rs. 2.52 per
month as indirect taxes, whilst a similar family spending about Rs. 140
per month pays about Rs. 8.70 per month. As far as the first group is
concerned, the main contributors to the burden are: Central excise on
sugar, fertilisers (through consumption of agricultural products), tyres
and tubes (used by buses and trucks) and jute manufactures (used for
moving foodgrains), and sales taxation of foodgrains and atta. As far as the
latter group is concerned, the main contributors to the burden are: Central
excises on sugar, tobacco products, iron and steel, diesel oil (through use
of trucks and buses) and jute manufactures (for moving foodgrains);
and sales taxes on foodgrains and ana, vegetable oils and fats and jute
manufactures.
2. Central and State Indirect Taxes
The incidence of indirect taxation given above represents the com
bined burden of Central and State taxes. The incidence of the indi
vidual taxes included in the study, on the various per capita expenditure
classes, is shown separately in the following table :
TABLE III.2
Central and State Indirect Ta ;es as Per Cent of Consumer Expenditure
by per Capita Expenditure Groups (1973-74)
(In rupees)
1
Rural
Central taxes
Central excise
Import duty
State taxes
Monthly per capita expenditure
0-15
2
1.68
1.42
0.26
1.23
15-28
3
1.86
1.50
0.37
1,47
28-43
4
2.58
2.01
0.58
1,86
43-55
5
3.68
2.92
0.76
2.50
55-75
6
4.25
3.27
0.99
2.46
groups
75-
100
7
6.32
4.85
1.48
3.70
100
and 1
above
8
10.30
7.87
2.43
5.87
All
house
holds
9
4.99
3.85
1.14
3.04
{continued)

20 INCIDENCE OF INDIRECT TAXATION1 IN INDIA
Table III. 2 Contd)
1
Sales tax finclud:ng sales
tax on motor so;ritN'
State exc'se
Others
All indirect taxes
Urban
Central taxes
Central excise
Import duty
State taxes
Sales tax (including sales
tax on motor spirit)
State excise
Others
All indirect taxes
Rural and urban
combined
Central taxes
Central excise
Import duty
State taxes
Sales tax (including sales
tax on motor spirit)
State excise
Others
All indirect taxes
2
0.67
0.22
0.34
2.91
2.42
2.42
—
1.21
0.30
—
0.91
3.63
1.72
1.47
0.24
1.21
0.65
0.21
0.39
2.96
0.
0.
0.
3.
3.
3.
0.
2.
1.
0.
0.
6.
2
1
0
1
0
0
3
85
27
35
33
71
11
63
57
63
,13
.82
31
.05
.66
.39
.:>?>
.93
.25
0.41
3 .63
4
1.02
0.32
0.53
4.15
4.56
3.75
0.81
2.SO
1.86
0.02
0.92
7.36
2.88
2.27
0.61
2.01
1.16
0.27
0.59
4.89
1.
0.
0.
6.
5.
4.
1.
*> .
2.
0.
1.
9
4
3
0
2
1
0
0
6
5
23
63
64
i;;
97
94
03
69
35
20
14
.66
.13
.31
.81
.73
.44
.54
.74
. !>5
6
1.31
0.37
0.78
6.71
7.61
6.25
1.36
4.25
2.69
0.16
1.41
11.86
5.04
3.97
1.07
2 88
1.63
0.32
0.92
7.92
7
1.77
0.93
1.00
10.02
9.41
7.77
1.63
5.40
3.01
0.79
1.60
14.80
7.21
5.69
1.52
4.19
2.13
0.89
1.18
11.10
\
(
2.
1.
1.
16.
20.
16.
4.
9.
4.
2.
2.
30
14
11
3
7
3
2
1
21
S
60
82
44
17
99
.78
21
20
51
,27
.41
.19
.71
.55
.16
.21
.39
.01
.84
.96
9
1.49
0.73
0.83
a. 03
12.03
9.73
2.30
5.93
3.23
1.01
1.69
17.96
6.77
5.34
1.43
3.77
1.93
0.80
1.04
10.51
It will be observed that Central taxes account for the larger share of
incidence in both rural and urban sectors. But the difference is much
more substantial in relation to the urban sector (Central taxes accounting
for 12.0 per cent and State taxes for 5.9 per cent) than in relation to the
rural sector (Central taxes 5.0 per cent and State taxes 3.0 per cent).
Another important conclusion to be drawn from the table is that the
Central indirect taxes are more progressive than State indirect taxes.
Central excises, contributing about 50 per cent total incidence, is of
course the single most important tax and is also seen to be the most pro
gressive. However, the two taxes that fall more lightly on the lowest
two expenditure groups are import duties and State excise on liquor,
whereas Central excise and sales taxes account for 72 per cent of the
incidence on them.

DISTRIBUTION OF THE BURDEN OF INDIRECT TAXATION 2\
3. Incidence by Type of Goods
One of the novel features of this study is that an attempt has been
made for the first time in India to work out the incidence of tax on major
types of goods separately. Goods subject to tax have been classified
into three main groups according to the nature of use, namely, (i) mostly
in the nature of consumption goods ("hereafter called 'consumption goods'),
(ii) mostly in the nature of intermediate goods including raw materials
(hereafter called 'intermediate goods') and (iii) capital goods, partly
capital goods and parts thereof. The contribution of the indirect taxes
on each group of commodities to the aggregate incidence is brought out
in the following table :
TABLE III.3
Tax Burden as Per Cent of Consumer Expenditure on All Indirect Taxes
According to Type of Goads
Monthly per capita expenditure groups (in rupees)
0-15 15-28 28-43 43-55 55-75 75- 100 All
100 and house-
above holds
Rural
1. Consumption goods
2. Intermediate goods
3. Capital goods, partly
capital goods and parts
thereof
4. Total (all indirect
taxes)
Urban
1. Consumption goods
2. Intermediate goods
3. Capital goods, partly
capital goods and parts
thereof
4. Total (all indirect
taxes)
1.28 1.51 2.08 3.20 3.16 5.18
1.47 1.62 2.10 2.63 3.17 4.32
8.53 4.05
6.78 3.53
0.16 0.21 0.27 0.35 0.39 0.53 0.86 0.45
2.91 3.31 4.t3 6.18 6.72 10.03 16.17 8.03
1.82 3.06 3.62 5.16 6.36 8.38 14.78 9.17
1.81 2.90 3.38 4.10 5.00 5.80 12.57 7.48
— 0.35 0.36 0.40 0.50 0.62 2.84 1.31
3.63 6.31 7.36 9.66 11.86 14.80 30.19 17.96
(Continued)

22 INCIDENCE OF INDIRECT TAXATION IN INDIA
TABLE III.3 (Contd)
1
Rural and Urban
combined
1. Consumption goods
2. Intermediate goods
3. Capital goods, partly
capital goods and parts
thereof
4. Total (all indirect
taxes)
2
1.
1
0.
2.
32
.47
16
95
1.
1
0.
3
3
66
.75
22
.63
2.
2.
0.
4
4
31
.30
28
.89
5
3.58
2.91
0.36
6.85
6
3.91
3.59
0.42
7.92
7
6.
4.
0.
11.
10
,75
55
40
8
11.11
9.17
1.68
21.96
9
5.34
4.53
0.67
10.54
It is observed that of the total incidence of 10.54 per cent of con
sumption expenditure for all households, the share of consumption goods
is 5.34 percentage points, amounting to about 51 per cent of total inci
dence. 4.53 percentage points are accounted for by intermediate goods.
Only the remaining 0.63 percentage point is contributed by capital goods,
partly capital goods (^including capital goods which are also used as house
hold durables) and parts thereof. (This amounts to about 6 per cent
of total incidence.) More or less the same proportions are observed in
both the rural and urban sectors, even though the level of the incidence
on urban households is nearly double that on rural households. In
both the sectors, consumption goods account for around 50 per cent of the
total incidence and the share of capital goods, partly capital goods and
parts thereof amounts to about 6 to 7 per cent of the incidence. The
remaining portion of incidence is attributable to intermediate goods.
One point that deserves to be noted is that in the rural sector, the inci
dence of taxes on intermediate goods is higher than that of taxes on con
sumption goods for the lowest two per capita expenditure groups. For
all the groups above them, the incidence of taxes on consumption goods
is higher; whereas in the urban sector the incidence of taxes on inter
mediate goods is slightly lower for the same two lowest per capita ex
penditure groups.
When we look at the figures of incidence of Cenntral excise duties
and import duties according to types of goods as given in the two tables
below, we find a somewhat different story. In respect of excise as well
as import duties, intermediate goods claim the largest share of the inci
dence both in the rural and the urban sectors.

DISTRIBUTION OF THE BURDEN OF INDIRECT TAXATION 23
TABLE III.4
Burden of Central Excises as Per Cent ofConsumer Expenditure According
to Type of Goods
(In rupees)
Monthly per capita expenditure groups
0-15 15-28 28-43 43-55 55-75 75- 100 All
100 and house-
above holds
1 23456789
Rural
1. Consumption goods 0.39 0.39 0.61 1.16 1.21 2.11 3.64 1.57
2. Intermediate goods 1.03 1.10 1.39 1.74 2.04 2.70 4.13 2.24
3. Capital goods, partly
capital goods and parts
thereof — 0.01 0.01 0.02 0.02 0.04 0.10 0.04
4. Total central excise 1.42 1.50 2.01 2.92 3.27 4.85 7.87 3.85
Urban
1. Consumption goods 0.61 1.13 1.51 2.25 3.03 3.91 7.00 4.28
2. Intermediate goods 1.81 1.96 2.22 2.67 3.19 3.76 8.70 5.04
3. Capital goods, partly
capital goods and parts
thereof — 0.02 0.02 0.02 0.03 0.10 1.08 o-41
4. Total central excise 2.42 3.11 3.75 4.94 6.25 7.77 16.78 9.73
Rural and urban
combined
1. Consumption goods
2. Intermediate goods
3. Capital goods, partly
capital goods and parts
thereof
4. Total central excise
— indicates negligible.
0.41
1.06
1.47
0.46
1
0,
1.
.19
.01
,66
0
1
0
2
.74
.52
.01
.27
1
1
0
3
.37
.92
.02
.31
1.63
2.31
0.03
3.97
2.
3.
0.
5
62
01
06
.69
5.
6.
0.
11
03
01
51
.55
2.
2.
0.
5.
25
95
14
34

24 INCIDENCE OF INDIRECT TAXATION IN INDIA
TABLE III.5
Burden of Import Duties as Per Cent of Consumer Expenditure
According to Type of Goods
(In Rupees)
Monthly per capita expenditure groups
0-15 15-28 28-43 43-55 55-75 75-
100
100 All
and house-
above holds
Rural
1.
2.
3.
Consumption goods
Intermediate goods
Capital goods, partly
capital goods and parts
0.
0.
02
23
0.
0.
04
30
0.11
0.42
0.
0.
16
52
0.
0.
24
67
0
1
.34
.01
0.
1.
56
65
0.
0.
25
79
thereof
4. Total import duties
Urban
1. Consumption goods
2. Intermediate goods
3. Capital goods, partly
capital goods and parts
thereof
4. Total import duties
0.01 0.03 0.05 0.08 0.( 0.13 0.22 0.10
0.26 0.37 0.58 0.76 0.99 I.48 2.43 1.14
0.09 0.15 0.20 0.28
0.48 0.60 0.76 0.97
0.34 1.37 0.65
1.15 2.54 1.48
0.06 0.06 0.07 0.11 0.14 0.30 0.17
0.63 0.81 1.03 1.36 1.63 4.21 2.30
Rural and urban
combined
1.
2.
3.
4.
Consumption goods
Intermediate goods
Capital goods, partly
capital goods and parts
thereof
Total import duties
0.02
0.21
0.01
0.24
0.
0.
0.
0.
04
32
03
39
0.12
0.44
0.05
0.61
0.17
0.56
0.08
0.81
0.
0.
0.
1.
25
73
09
07
0.34
1.05
0.13
1.52
0.90
2.02
0.25
3.17
0.35
0.96
0.12
1.43
—■ indicates negligible.
If we take Central excises, we find that the incidence of taxes on
intermediate goods account for 2.95 percentage points, out of the total
5.34 per cent of consumption expenditure attributable to excises in res
pect of all households. In the case of import duties, the share of inter
mediate goods is 0.92 percentage points, out of 1.43 per cet of consump-
DISTRIBUTION OF THE BURDEN OF INDIRECT TAXATION 2$
tion expenditure attributable to total import duties. In other words,
55 per cent of the incidence of Central excise duties and 67 per cent of
the incidence of import duties are due to taxes on intermediate products.
It is also noteworthy that in respect of both taxes, the relative contri
bution of intermediate goods to incidence was higher for the rural sector
than for the urban sector. Taking into account this and the earlier con
clusion regarding the burden of taxes on intermediates falling on the
lowest expenditure groups, we can say that more reliance is placed on
the taxation of intermediate goods for reaching the poorer sections and
the rural sector.
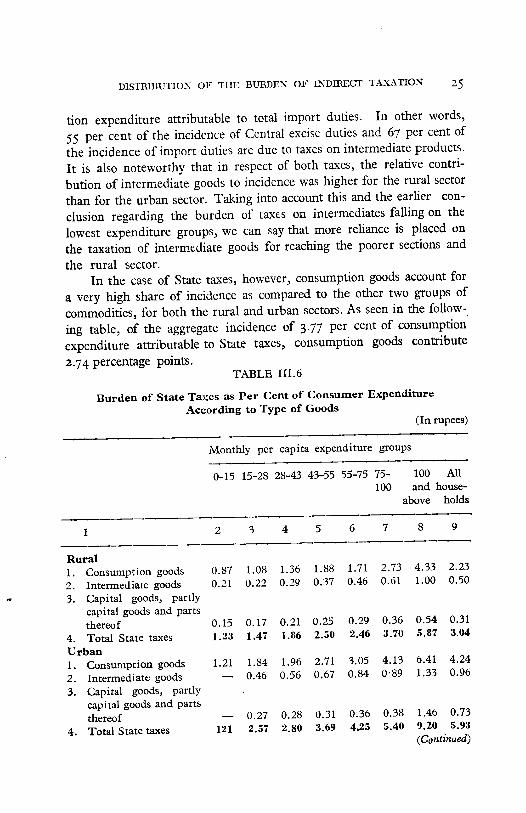
In the case of State taxes, however, consumption goods account for
a very high share of incidence as compared to the other two groups of
commodities, for both the rural and urban sectors. As seen in the follow
ing table, of the aggregate incidence of 3.77 per cent of consumption
expenditure attributable to State taxes, consumption goods contribute
2.74 percentage points.TABLE III.6
Burden of State Taxes as Per Cent of Consumer Expenditure
According to Type of Goods
(In rupees)
Monthly per capita expenditure groups
0-15 15-28 28-43 43-55 55-75 75- 100 All100 and house-
above holds
1
Rural
1. Consumption goods
2.
3.
4.
Intermediate goods
Capital goods, partly
capital goods and parts
thereof
Total State taxes
Uroan
1. Consumption goods
2.
3.
4.
Intermediate goods
Capital goods, partly
capital goods and parts
thereof
Total State taxes
2
0.87
0.21
0.15
1.23
1.21
—
—.
121
3
1.
0.
0.
1.
1.
08
22
17
.47
.84
0.46
0,
2
.27
.57
4
1.36
0.29
0.21
1.86
1.96
0.56
0.28
2.80
5
1.
0.
0.
2,
2.
0.
0
3
88
37
25
.50
.71
.67
.31
.69
6
1.71
0.46
0.29
2.46
3.05
0.84
0.36
4.25
7
2.
0.
0.
3
4,
0'
0
5
73
61
.36
.70
.13
89
.38
.40
8
4.33
1.00
0.54
5.87
6.41
1.33
1.46
9.20
9
2.23
0.50
0.31
3.04
4.24
0.96
0.73
5.93
(Continued)

26 INCIDENCE OF INDIRECT TAXATION IN INDIA
TABLE III-6 (Contd)
1
Rural and urban
combined
1. Consumption goods
2. Intermediate goods
3. Capital goods, partly
capital goods and parts
thereof
4. Total State taxes
2
0.89
0.20
0.15
1.24
3
1.16
0.24
0.18
1.58
4
1
0.
0,
.45
.34
.22
201
5
2.04
0.43
0.26
2.73
6
2.03
0.55
0.30
2.88
7
3.14
0.69
0.36
419
8
5.18
1.14
0.92
7.24
9
2.74
0.6?,
0.41
3.77
—■ indicates negligible.
4. Burden of Taxes on Specific Commodities
The following table gives a broad picture of the distribution of the
burden of taxes on selected consumer goods and intermediates among
urban households in different expenditure groups:
TABLE III.7
Distribution of the Burden of Indirect Taxes as Per Cent of Total
Consumption Expenditure (1973-74)
(In rupees)
Commoditv
1.
2.
3.
4.
5.
6.
7.
8.
9.
1
Foodgrains and atta*
Sugar
Tea & coffee
Vegetable products, oil
and fats
Kerosene oil
Drugs and medicines
Tobacco products
Liquor* *
Cotton fabrics
Monthly per capita expenditure groups
0-15 15-28
2 3
0.30 0.37
0.61 0.46
— 0.05
— 0.33
— 0.48
— 0.09
— 0.34
— 0.13
— 0.12
28-43
4
0.36
0.60
0.14
0.46
0.51
0.17
0.57
0.02
0.01
43-55
5
0.33
0.55
0.15
0.52
0.54
0.23
1.03
0.20
0.18
55-75
6
0.28
0.54
0.22
0.50
0.51
0.28
1.16
0.16
0.51
75-
100
i
7
0.24
0.51
0.33
0.50
0.50
0.36
1.55
0.74
0.59
100
and
ibove
8
0.18
0.38
0.28
0.40
0.45
0.52
3.12
2.46
1.68
*
All
urban
house
holds
9
0.26
0.47
0.23
0.47
0.50
0.36
1.80
1.03
0.81
(continued)

DISTRIBUTION OF THE BURDEN OF INDIRECT TAXATION
TABLE III .7 (Contd)
1
10. Art and rayon silk
11. Matches
12. Soap and detergents
13. Paper and paper
products
14. Motor spirit
15. Refined diesel oil
16. Tyres & tubes
17. Iron & steel
Total for 17 items
Total incidence for all
indirect taxes
2
—
—
—
—.
—
0.61
—i
1.52
3.63
3
__
0.05
0.08
0.03
0.18
0.33
0.10
0.48
3.62
6.31
4
—,
0.07
0.11
0.03
0.21
0.35
0.10
0.54
4.25
7.36
5
0.02
0.10
0.11
0.09
0.26
0.52
0.13
0.68
5.64
9.66
6
0.15
0.09
0.12
0.21
0.28
0.73
0.16
0.76
6.66
11.86
7
0.25
0.06
0.12
0.20
0-29
0.79
0.17
0.80
8.00
14.80
8
1.31
0.05
0.11
0.31
4.45
1.36
0.39
1.30
18.75
30.19
9
0.52
0.07
0.11
0.22
1.66
0.88
0.23
0.91
10.53
17.96
— indicates negligible.
*taxes on these commodities are levied only by the States.
**tax on this commodity is levied by the States.
From this one can see at what level of expenditure taxes on impor
tant consumer goods become significant and also whether the incidence
of taxes on particular goods is regressive or progressive. Among the
food products, the taxes on sugar and foodgrains and atta affect all ex
penditure groups. Even the lowest expenditure group pays nearly one
per cent of its total expenditure of less than Rs. 15 per capita per month,
as taxes on these products. As might be expected, taxes on these pro
ducts are regressive even with respect to total expenditure. However,
in the case of sugar it cannot be assumed with certainty that the entire
quantity of levy sugar purchased by the lower expenditure groups is
consumed by them. To the extent that such sugar gets diverted for
other uses, the regressiveness may be overstated. On the other hand,
the incidence in regard to cotton fabrics may be understated as the general
tendency is to purchase them during certain seasons and the study may
not have fully reflected such contingencies. The taxes on kerosene
become significant at the level of the second lowest expenditure group
(Rs. 15—Rs. 28 per capita per month), and its incidence tends to be
proportional with respect to expenditure. This is also broadly true
of the excise on matches, although the percentage burden is so low as to
be of no great consequence. Taxes on drugs and medicines also affect
the poorer classes, although in their cases the incidence is clearly pro
gressive. A broad conclusion that emerges from this analysis is that

28 INCIDENCE OF INDIRECT TAXATION IN INDIA
a reduction in the weightage of taxes on mass consumption goods such
as foodgrains, sugar and kerosene that tend to be regressive or propor
tional, would serve to increase the degree of progression of the indirect
tax system as a whole. As regards drugs and medicines, the same pur
pose could be served by reducing the weight of tax on the more widely
used varieties of drugs.
Another important fact brought out by the above table is that the
taxation of certain intermediate products such as iron and steel, diesel
oil and tyres and tube:;, has a pervasive effect. Thus, as pointed out
earlier, the tax on tyres and tubes is one of the impottant elements in the
tax burden on the lowest expenditure group; the tax on iron and steel
and refined diesel oil reaches all but the lowest expenditure groups.
However, the incidence of these taxes turns out to be progressive. But
when we look at the problem from the standpoint of equity and social
justice, the mere fact of progression is not enough and our aim must
be to have lower rates of taxation on what we regard as basic necessities
and articles whose consumption we want to promote raiher than dis
courage. From this angle, it would have to be examined whether the
level of the levies on certain product groups such as drugs and medi
cines or those which impinge on transport costs, would need some reconsideration.
5. Share in Consumption and Indirect Taxes of Different Expenditure Groups
The shares of the different expenditure groups in total consumptionexpenditure and their respective shares of indirect taxes have also been
worked out. The information presented in Table III. 8 also gives
the percentage of the population in different expenditure groups.
It is seen that the highest expenditure group, forming about 8 per
cent of the population, accounts for 22 per cent of consumption expen
diture inclusive of taxes and contributes about 45 per cent to indirect
taxes. These taxes have the effect of reducing the share of this group
in consumption expenditure from 22 per cent to about 19 per cent (See
column 4). At the other end of the scale, the lowest two expenditure
groups, forming about 12 per cent of the population, account for only
4.7 per cent of expenditure and contribute 1.6 per cent of indirect taxes.
As might be expected, there is quite an unequal distribution of consumption expenditure with the share in population of the lowest three
expenditure groups (41.6 per cent) being higher than their share in con-

DISTRIBUTION OF THE BURDEN OF INDIRECT TAXATION 29
Share in Consumption
Per capita consumption
expenditure (in rupees'
per month)
(1)
Upto 15
15-28
28-43
43-55
55-75
75-100
Above 100
Total
TABLE
and Indirect
III.8
Taxes of
Groups (1973-74)
Population
of
households
(2)
0.64
11.19
29.80
20.31
19.63
10.16
8.27
100.00
Different Expenditures
(Percentage of total)
Share of
Consump
tion expen
diture of
households
0)
0.14
4.58
18.75
17.42
22.08
15.35
21.68
100.00
Consump
tion expen
diture of
households
less indirect
taxes
(4)
0.15
4.93
19.93
18.14
22.73
15.20
18.92
100.00
Indirect
taxes
(5)
0.04
1.58
8.70
11.33
16.58
16.61
45.16
100.00
sumption expenditure (23.5 per cent). At the upper end of the scale
the two highest expenditure groups account for 37 per cent of expendi
ture while their share in population is only around 18 per cent.
But the most important conclusion from this analysis is that households
having per capita monthly expenditure not exceeding Rs. 100 pay 55
per cent of all indirect taxes allocable to households.
6. Comparison with Estimates of Incidence of Earlier Studies
As already indicated, at the all India level, there have been 3 earlier
studies of incidence of indirect taxes: one by the Taxation Enquiry Com
mission (for 1953-54) and the other two by the Ministry of Finance, Go
vernment of India (for 1958-59 and 1963-64J. The results of the earlier
studies, however, are not strictly comparable with those of the present
study. There are three main reasons for this. First, all the earlier
studies used NSS data on consumption expenditure according to house
hold monthly expenditure groups. The expenditure groups considered
in the first two studies were: Rs. i-i5,Rs. 51-100, Rs. 101-150, Rs. 151-300

30 INCIDENCE OF INDIRECT TAXATION IN INDIA
and above Rs. 300; in the study of 1963-64, the household expenditure
groups considered were: Rs. 0-50, Rs. 51-100, Rs. 101-150, Rs. 151-300
Rs. 301-500 and Rs 501 and above. In the present study, households
have been divided into monthly per capita expenditure groups because
the relative economic positions of different households are more accu
rately reflected by per capita expenditure levels. This difference in the
classification of households between the present study and the earlier
studies makes the results strictly not comparable. Second, as we have
already indicated, indirect taxes estimated to have been collected on the
purchases of goods by government administrative departments have
been excluded from the total taxes allocable to households, whereas no
such adjustment was carried out in the earlier studies. Again in the
present study only i/ioth of the taxes on capital goods has been assumed
to be shifted to consumers in the year of levy whereas the total tax col
lections from capital goods were allocated to different consumer groups
in the earlier studies. Third, owing to the availability of more disag
gregated data, it has been possible to apportion tax burdens more accu
rately. In this connection, special mention may be made of the fact that
we were able to obtain data on commodity-wise sales tax collections from
13 major States, which have been used in the allocation of sales taxes. More
over, we have also been able to use information obtained from the ma
terial balances given in A Technical Note on the Approaches to the Fifth
Plan of India 1974-79 for purposes of allocating the taxes on inputs.
Subiect to these qualifications, we might make a rough comparison
between the results of the present study with those of the Ministry of
Finance for the year 1963-64 in respect of only two expenditure groups.On the assumption that an average family consists of five persons, the
per capita expenditure group of Rs. 100 and above in the present study
can be converted into the household expenditure group with an expen
diture of Rs. 500 and above. The incidence of taxes on this group and
on all households can then be compared as between the two studies.

DISTRIBUTION OF THE BURDEN OF INDIRECT TAXATION 31
TABLE III.9
A Comparative Statement of Incidence of Indirect Taxes in 1963-64
and 1973-74
Indirect taxes
Rural Urban All India
Rs. 500 All Rs. 500 All Rs. 500 All
and house- and house- and house-
above holds above holds above holds
1
1963-64
1. Central taxes
(a) Central excise
(b) Import duty
2. State taxes
(a) State excise
(b) Sales tax*
(c) Others
3. All indirect taxes
1973-74
1. Central taxes
(a) Central excise
(b) Import duty
2. State taxes
(a) State excise
(b) Sales tax*
(c) Others
3. All indirect taxes
2
10.47
7.47
3.01
4.22
0.67
2.59
1.41
14.69
10.30
7.87
2.43
5.87
1.82
2.60
1.45
16.17
3
5.76
3.95
1.81
2.26
0.52
1.24
0.82
8.02
4.99
3.85
1.14
3.04
0.73
1.49
0.82
8.03
4
23.16
16.10
7.06
10.12
0.94
7.02
2.16
33.28
20.99
16.78
4.21
9.20
2.27
4.51
2.41
30.19
5
11.07
7.70
3.37
5.53
0.48
3.67
1.38
16.60
12.03
9.73
2.30
5.93
1.01
3.23
1.69
17.96
6
15.65
10.99
4.66
6.62
0.78
4.39
1.45
22.27
14.71
11.55
3.16
7.24
2.01
3.39
1.84
21.95
7
7.08
4.89
2.19
307
0.49
1.88
0.70
10.15
6.77
5.34
1.43
3.77
0.80
1.93
1.04
10.54
Source: Incidence of Indirect Taxation, 1963-64 (MF) for 1963-64 figures.
♦ Includes Central sales tax and sales tax on motor spirit.
It is seen that there are only marginal differences in the level of
burden of total indirect taxes as between the two studies. The similarity
particularly is noticeable in respect of all households. One of the rea
sons why the level of burden is not shown to have risen since 1963-64 is
the fact that in the present study we have excluded as much as 15 Tper cent
of total indirect tax revenue from the allocable pool. Therefore/the si-

32 INCIDENCE OF INDIRECT TAXATION IN INDIA
milarity in the levels of incidence between the two studies should not be
taken at face value.
All the three earlier studies had also revealed a progressive distri
bution of indirect taxes with reference to consumer expenditure. The
present study indicates a much more progressive pattern of indirect taxa
tion than the earlier studies. In the Ministry of Finance study for 1963-
64, the incidence for the rural sector varied from 5.77 per cent for the
lowest expenditure group to 14.69 per cent for the highest expenditure
group; and for the urban sector the range was from 11.3 per cent to 13.28
per cent. In the present study for the rural sector the incidence varies
from 2.91 per cent to 16.17 per cent and for the urban sector from 3.63
per cent to 30.19 per cent. The more progressive distribution shown in
the study for I973~74 maY be partly attributed to changes in the pattern
of taxation. However, the difference in methodology would also have
contributed partly to the difference in results.

Appendix I
METHODOLOGY OF ESTIMATION OF INCIDENCE OF
INDIRECT TAXES IN INDIA 1973-74
As already explained, the study is confined to measuring the money
burden of indirect taxes in India on different expenditure classes in the
rural and urban sectors of the economy as a percentage of the aggregate
expenditure of each class. The entire amount of indirect taxes collected
has not been allocated to the households. The tax revenue attributable
to purchases made by government administrative departments has been
excluded from the total allocable yield from indirect taxes because it
has been considered that the taxes collected on the purchase of goods by
the Government represent only an accounting transfer within the govern
ment sector and not a transfer to the government sector from the private
sector. Purchases made by government departemental and non-depart
mental enterprises are, however, treated analogous to private sector
purchases. A brief note on the method of arriving at the share of tax
yield from government purchases is given in Appendix II.
For working out the incidence, two types of information are neces
sary: (i) data on total expenditure as well as expenditure on different
consumption goods by different expenditure groups; and (ii) commodity-
wise tax yield (exclusive of the share attributable to government pur
chases). We have already indicated in Section II the nature and sources
of information on taxes and expenditure.
National Sample Survey (NSS) data on consumption expenditure
are available in terms of quantity as well as value. Quantity data have
not been generally used for working out the incidence due to the fact
that in most cases while money expenditure data are given, quantity data
arc not given in the NSS report probably because sample households
could not give dependable information on the quantity of consumption.
Taxes are levied not only on consumer goods but also on intermediate
and capital goods. One of the major problems in the study of the inci
dence of indirect taxes is to trace the burden of taxes on these non-con
sumption goods. If we had a detailed input-output table for the eco-

34 INCIDENCE OF INDIRECT TAXATION IN INDIA
nomy we could have determined how different inputs are allocated for
use in the manufacture of various kinds of final goods. Unfortunately,
we could not get a detailed table and so we had to make use of the infor
mation obtained otherwise.
I CENTRAL EXCISES
For measuring the incidence of excise as well as import duties, we
have classified commodities into (A) mostly in the nature of consump
tion goods; (B) mostly in the nature of intermediate goods; (C) capital
and partly capital goods and (D) components of capital and partly capital
goods. We shall now proceed to indicate the methodology adopted in
the case of these four groups of commodities.
A. Commodities Mostly in the Nature of Consumption Goods
There are a number of commodities which are mostly in the nature
of consumption goods which bear Central excise duties and also appear
with more or less the same description as NSS items of consumer ex
penditure. In such cases, the methodology of estimation of incidence
is very simple. Tax yield (after allowing for government contribution)
has been allocated to different expenditure groups in rural and urban
sectors in proportion to their expenditure on such commodities. Diffi
culties arise, however, in cases where the commodities can be classified
into grades or types and are subject to different tax rates in view of differ
ences in quality, because tax categories often do not correspond to NSS
categories. These cases are taken up after dealing with the simpler
cases. The items for which the incidence can be worked out readily
on the basis of consumer expenditures as made available in the NSS
report are given below along with the NSS matching items :
Items bearing taxes NSS items of consumption
1. Khandsari (sugar) i. Khandsari (sugar)
2. Sugar 2. Sugar, Sugar candy, Sugar
(other)
3. Confectioneries and chocolate 3. Biscuit, confectioneries
4. Aerated water 4. Drinking beverages other
than tea and coffee
5. Glucose dextrose and prepara- 5. Baby food
tions thereof

APPENDIX I 35
6. Vegetable oils and fats
7. Patent and proprietary
medicines
8. Soap
9. Cosmetic and toilet preparations
10. Tooth paste
11. Safety razor, blades stainless
steel
12. Matches
13. Gramophone and parts
14. Pressure cookers
15. Playing cards
10
11
12
13
14
15
16. Domestic electrical appliances
17. Rayon and art silk fabrics
including synthetic fibres, nylon
yarn and clothes
18. Prepared or preserved food
6. Vanaspati, groundnut oil,
etc.
7. Allopathic medicine, Homeo
pathic medicine, Ayurvedic
medicine, Unani medicine,
other medicines
8. Toilet soap, washing soap
9. Powder, snow cream, hair oil,
hair cream, hair lotion and
other toilet requisites
10. Tooth paste
Shaving blades, other shaving
requisites
Matches (sticks)
Other musical instruments
(other than harmonium,
radio and tape recorders)
Pressure cookers
Amusement (other than
cinema, theatre, mela, fair,
sports goods, toys, etc.)
16. Electric fan, iron, electric
heater, etc.
17. Rayon and art silk fabrics
19. Food products
20. Paper
18. Bread
19. Salted refreshments, pre
pared sweets, jam and jellies,
processed food and others
20. Newspapers, journals, magaz
ines, books, etc., taken together
For each of the remaining consumer goods subjected to excise
taxes we have evolved a separate methodology for working out the inci
dence.
1. Coffee
Production, clearance and tax yield data are available from the
Statistical Year Book-Central Excise (1973-74), Vol. I (henceforth termed

36 INCIDENCE OF INDIRECT TAXATION IN INDIA
'Central Excise Year Booh?). NSS data on consumption of coffee in
quantity are available both in terms of number of cups consumed by
the households and the quantity purchased in kilograms. Estimates
of coffee powder purchased are given in terms of kilograms. From the
publication, Indian Customs and Central Excise Tariff (hereafter termed
'Excise Tariff Book'), we have the information on rates of duty in res
pect of different grades of coffee other than instant coffee.
Because of the difference in the price of coffee between the rural
and urban sectors and also between different parts of the urban and
rural sectors it has been considered desirable not to allocate the duty
on this item on the basis of total expenditure on coffee by the different
expenditure groups. Instead an attempt has been made in this case to
allocate the tax yield on the basis of quantity consumed. As data on
quantity are available in terms of both number of cups and kilograms,
it is necessary to convert them into one standard unit. For this pur
pose, the quantity of powder purchased in kilograms was converted into
quantity consumed in cups. On the basis of information available
directly from the Coffee Board, it was assumed that ioo cups of coffee
could be prepared from one kilogram of coffee powder. The tax yield
on coffee, other than instant coffee, has been allocated to different expen
diture groups in rural and urban areas on the basis of the total number
of cups consumed. The yield from instant coffee has been allocated
on the assumption that it is consumed exclusively by the groups with
per capita expenditure of Rs. ioo and above in the urban sector.
2. Tea
Information on production, clearance and tax yield is available
from Central Excise Year Book; rates of duty from Excise Tariff Book
and consumption data from the NSS. Production, clearance and tax
yield data are available separately for loose leaf tea and package tea.
Consumption data are available in terms of number of cups for tea and
in terms of kilograms for loose leaf tea. Tax rates are available sepa
rately for loose leaf tea, package tea and instant tea. Duty on package
tea is higher than on loose leaf tea. The rate of duty on instant tea is
still higher.
As in the case of coffee, we have first tried to work out consump
tion in terms of cups of tea. For this purpose, the quantity of tea leaves
has been converted into tea cups on the assumption that from one kilo
gram of tea 600 cups of tea could be prepared. This assumption is

APPENDIX I 37
based on the estimates supplied by the Tea Board. In the case of loose
leaf tea, we have assumed that the consumption proportions (tea cups)
found for urban and rural sectors and for different expenditure groups
will hold good for the allocation of tax yield also. A difficulty is faced,
however, in the allocation of yield from package tea. It is tea of a sup
erior quality. In a similar exercise done by the Ministry of Finance
{Incidence of Indirect Taxation, 1963-64, published in 1969), it was as
sumed that 57.2 per cent of the package tea was consumed in the rural
sector and 42.8 per cent in the urban sector. In the absence of any
statistical evidence it has been considered simpler to assume that the
rural and urban sectors consume 50 per cent each. The difficulty arises
in determining the proportions of package tea consumed by different
expenditure groups in the two sectors. We have made an assumpiion
here that the bottom four expenditure groups do not consume package
tea and the next three expenditure groups consume 20 per cent, 30 per
cent and 50 per cent, respectively, of total package tea. After this, the
incidence of the tax on Jea was worked out as follows.
First, the estimates of consumption of package tea (in cups) for
different expenditure groups in the rural and urban sectors were worked
out and, accordingly, the incidence of tax yield attributable to package
tea was estimated. Then, from the total number of cups of tea con
sumed by different expenditure groups in the rural and urban sectors,
the number of cups of tea prepared from package tea was deducted.
The remaining number of cups has been taken as tea prepared out of
loose leaf tea and, accordingly, the tax yield from it was distributed.
The tax yield from instant tea has been wholly allocated to groups
with per capita expenditure exceeding Rs. 100 per month in the urban
sector.
3. Art silky rayon and synthetic textiles
The data on consumption under this head relate to various items
like dhoti, saree, cloth for shirt, pyjama, salvar, coat, suit, trousers,
chaddar, headwear, lungi, bedsheet and knitted garments. There are
marginal differences in the rates of duty on these items and the tax yield
data are not available separately. The total tax yield therefore has been
allocated to different expenditure groups iu the urban and rural sectors
on the basis of total expenditure on all these items taken together for
each category.

38 INCIDENCE OF INDIRECT TAXATION IN INDIA.
4. Tobacco (unmanufactured and manufactured)
Data on tax yields and the rates of duty on different kinds of manu
factured tobacco are available from Central Excise Year Book and Excise
Tariff Book, respectively. Similarly, data on consumption of different
kinds of tobacco could be obtained from the NSS. Estimates of tax
yields by kind of tobacco are as follows :
1973-74
(Rs. lakh)
1. Cigarettes 23,826.0
2. Smoking mixtures 84.0
3. Unmanufactured tobacco 9>548-8
of which
(a) flue cured and used in the manufacture
of smoking mixtures for pipes and
cigarettes 7-7
(b) flue cured and used in the manufacture
of cigarettes 19878.5
(c) flue cured and not otherwise specified 201.9
(d) other than flue cured used for the manu
facture of cigarettes 867.0
fe) other than flue cured and not used for
the manufacture of cigarettes 6,593.7
of which
(i) Snuffs 93-2
(ii) Hukkahs 499-8
(iii) Chewing 1,129.9
(iv) Cigars and cheroots 299.6
(v) Biris 236^J.$
(vi) Goods of special
importance M99-8
(vii) Others 423-9
TOTAL 33*458-8
Sources : (i) Statistical Year Book-Central Excise
1973-74.
(ii) Indian Customs and Central Excise
Tariff

APPENDIX I 39
1. Cigarettes—In 1973-74, there was a uniform duty for all types
of cigarettes (200 per cent ad valorem plus an additional duty of 100
per cent ad valorem). Hence, the tax yield has been allocated to the
various expenditure groups in the rural and urban sectors on the basis
of their expenditure on cigarettes.
2. Smoking mixtures—Smoking mixtures are used by the urban
people and there is little use of them in the rural sector. The tax yield
from this item is therefore attributed to the group with per capita ex
penditure of Rs. 100 and above in the urban sector only.
3. Unmanufactured tobacco—In the case of item 3(a), for the same
reason as given above in (2) the entire revenue has been attributed to
the group with per capita expenditure of Rs. 100 and above in the urban
sector. This is one of the costlier products which is taken to be beyond
the pockets of people belonging to groups with per capita expenditure
of less than Rs. 100 in the urban sector. The rate of duty is as high as
Rs. 40 plus an additional duty of Rs. 5.50 per kilogram.
Tax yields from items 3(b), 3(0) and 3(d) are attributed to differ
ent expenditure groups in the rural and urban sectors on the basis of
their expenditure on cigarettes. The rates of duty in these three cases
do not vary much.
In the case of yields from items 3(e)(i)snuffs and 3 (e)(ii) hukkah,
the allocation has been done on the basis of NSS estimates ofconsumption
of snuffs and hukkah tobacco, respectively; yields from chewing tobacco
on the basis of expenditure on zarda, kamam andsurti. The yield from
tobacco used for cigars and cheroots of special importance has been
allocated to the group with per capita expenditure of Rs. 100 and above
in the urban sector. The yield from biris has been allocated to different
expenditure groups on the basis of proportions of expenditure on biris.
The yields from others have been allocated on the basis of household
expenditure on other tobacco products.
5. Cotton fabrics
There may be two methods of estimation :
1. We may work out the quantity of clearance of cloth and tax
yield according to fineness of cloth (superfine, fine, medium and coarse);
make certain assumptions about the proportions in which different grades
of cloth have been consumed (in quantity) by each expenditure group
in the urban and rural sectors; and accordingly, allocate tax yield to differ
ent expenditure groups.
40 INCIDENCE OF INDIRECT TAXATION IN INDIA
2. We may proceed from the expenditure side and work out the
aggregate amount of expenditure on cotton cloth for the rural as well as
urban sectors on the basis of NSS data; adjust the urban expenditures
for price differential in the two sectors; make assumption about the pro
portions of expenditure on different grades of cloth by different expen
diture groups in the rural and urban sectors; work out for each sector
the total expenditure on cloth of each quality; and accordingly allocate
the tax yield estimated to be derived from each type of cloth.
The second method has been adopted for mainly four reasons: (a)
Data on the quantity of cloth cleared by types of cloth (according to
fineness) are available for composite mill products but not for power-
loom products. All units which have less than 49 looms installed paid a
compounded levy based on the number of looms only and not on the
quantity and grades of cloth produced, (b) Indian Textile Bulletins
give data on the production of powerlooms and handlooms together.
But separate data on the production flowing from powerlooms according
to the quality of cloth are not available. Very crude etimates of cloth
produced by powerlooms according to fineness can be worked out on the
basis of yarn data but the conversion ratios of yarn into cloth may not be
dependable, (c) The total quantity of cloth consumed as worked
out on the basis of NSS data far exceeds the data on the total quantity
produced and released. It may be pointed out that for 1973-74, NSS
gives an estimate of 11410 million metres (exclusive of ready made cloth)
while Central ExdseYear Book and Indian Textile Bulletins give an estimate
of 7770 million metres only, (d) In many cases quantity data on con
sumption are not given in NSS tables while for the corresponding ex
penditure groups value data are available. Basic assumptions that have
been made can be explained as follows.
1. C=CR+CU
where C =» total consumption expenditure on cloth
CR = total expenditure for the rural sector on cloth
Cu = total expenditure for the urban sector on cloth2. C =CR + C? + CR + C*
where Cj = consumption expenditure for the group with per
capita expenditure of Rs. 0-28,
C2 = consumption expenditure for the group with per
capita expenditure of Rs. 28-55,
C, = consumption expenditure for the group with per
capita expenditure of Rs. 55-100,

APPENDIX I 41
C4 = consumption expenditure for the group with per
capita expenditure of Rs. 100 and above.
3. C? = C*c+C*m
where Cfc =consumption of coarse cloth in rural areas by the
group with per capita expenditure of Rs. 0-28,
Cfm=consumption of medium cloth in rural areas by the
group with per capita expenditure of Rs. 0-28.
Cfc is assumed to be equal to 0.5 Cf
and Cfm is assumed to be equal to 0.5 Cf
4. C* = C* + C*m
where C*c is assumed to be equal to 0.4 C^
and Cfm is assumed to be equal to 0.6 Cf
5. Cf = Cfm + C*f, subscript f representing fine cloth
where C*m is assumed to be equal to 0.6 Cf
and C^f is assumed to be equal to 0.4 Cf
6. Cf = C^,, + Cff+C*sf, subscript sf representing superfine cloth
where C^m is assumed to be equal to 0.2 C*
C^ is assumed to be equal to 0.2 Of
Cfsf is assumed to be equal to 0.6 Of
Similarly,
7. cu = cy + c? + c? + cy8/->U r>U _]_ /""U
where CYC is assumed to be equal to 0.5 C^
and Cj^, is assumed to be equal to 0.5 C^
where C^ is assumed to be equal to 0.3 C^
and C^ is assumed to be equal to 0.7 C^
10. Cf-CSL + Cg
where C^ is assumed to be equal to 0.5 C"
and Cg is assumed to be equal to 0.5 C
ix. cy-ci + cs + ck
where CYm is assumed to be equal to 0.4 C"
Cg is assumed to be equal to 0.3 C"
Cgf is assumed to be equal to 0.3 C

42 INCIDENCE OF INDIRECT TAXATION IN INDIA
It may be noted that a separate treatment of cotton yarn is not neces
sary. Collection of duty for cotton yarn is done along with the cloth
itself (according to fineness). Thus, the yield from yarn may be added
to the yield from cloth to work out the incidence. The methodology
adopted here (expenditure approach rather than quantity approach) takes
care of ready-made cotton garments also.
Data on cotton yarn and cotton fabrics are available from the fol
lowing sources: (i) Production and clearance data (in metres and square
metres) are available for composite mills according to fineness of cloth
(superfine, fine, medium and coarse) in Central Excise Year Book, 1973-74.(2) Yield from basic duty according to fineness of cloth is also availablefrom the same source. (3) Yield from additional duty and handloom
cess according to grades of cloth could be obtained from the Directorate
of Statistics and Intelligence (DSI).
In the following cases, information is not available in the needed
detail. (1) Information on the yields from differential duty, according
to fineness of cloth is not available but it was suggested by DSI that
they could be allocated to different grades of cloth in proportion to the
yields from the basic duty. (2) The breakdown of yield from miscel
laneous duties, according to fineness of cloth, is also not available; hence
their yield has been allocated in proportion to the yield from the basicduty. (3) Non-availability of similar breakdown in respect of tax yield
from embroidery in strips and motifs and embroidery impregnated withcellulose has necessitated its allocation also in the same manner.
6. Footwear
Footwear was exempted from duty in the following cases : (1) the
entire output of those factories (precincts) which employ less than 49
workers; (2) the output of those establishments in which the total of
power used in the process of manufacturing footwear does not exceed
the equivalent of two horse power; (3) footwear if made out of artificial
or synthetic resins or plastic materials or both; (4) footwear made in
Government Harness Factory and Saddlary Factory, Kanpur for consumption by the members of the armed forces, and (5) all samples (not ex
ceeding 3 pairs of each variety) for exports. Because of these exemp
tions, we have been forced to make certain assumptions on the basis of
subjective judgement. We have assumed that (a) in the rural areas all
the expenditure on footwear by groups with per capita expenditure not
exceeding Rs. 75 per month is incurred on the purchase of footwear

APPENDIX I 43
which is free of duty; (b) in the case of groups in the rural sector with
per capita expenditure of Rs. 75 and above per month, only 25 per cent
of the expenditure on footwear is on the kind which is free of duty; (c)
for the urban sector in the case of groups with per capita expenditure
not exceeding Rs. 75 per month, 50 per cent of the expenditure on foot
wear is on such footwear as is freefrom duty and(d) in the urban sector in
the case of groups with per capita expenditure exceedingRs. 75 per month,
75 per cent of the expenditure on footwear is on the kind which is
subject to duty. On the basis of the above assumptions, we have worked
out the expenditure on footwear by each expenditure group in the rural
and urban sectors which can be said to contain tax elements. These
figures form the basis of allocating the tax burden on footwear.
7. Woollen fabrics and knitting wool
The incidence in this case has been worked out on the basis of sepa
rate estimates of expenditure on woollen fabrics and knitting wools. It
might be indicated that the NSS records no expenditure on wool by groups
with per capita expenditure not exceeding Rs. 43 in the rural sector as
well as by groups with per capita expenditure not exceeding Rs. 55 in
the urban sector.
It has been assumed that even rural folk make most of their pur
chases of woollen fabric and knitting wool from urban shops and hence
the problem of price differential does not arise.
8. Mechanical lighters and vacuum flasks
The tax yield from vacuum flasks and mechanical lighters was Rs.
49 lakh and Rs. 1 lakh, respectively. In both cases it has been decided
to allocate the yield entirely to the group with per capita expenditure of
Rs. 100 and above in the urban sector only. The tax on vacuum flasks
is distributed in proportion to the expenditure on manufactured goods
and that on mechanical lighters in proportion to the expenditure on
cigarettes.
B. Commodities Mostly in the Nature of Intermediate Goods
As indicated earlier, more serious problems arise in estimating the
incidence of taxes on intermediate goods because these goods are not
directly used by consumers. One has therefore to find out into what

44 INCIDENCE OF INDIRECT TAXATION IN INDIA
final goods and in what proportions each of the taxed intermediate products gets embodied.
1. Jute manufactures and yarn
Data on production, clearance and tax yield are available from
Central Excise Year Book, Vol. I, 1973-74. The necessary breakdown
of yield, according to different jute manufactures and yarn, is available
only in respect of the basic duty. Hence the tax yield from auxiliary
and miscellaneous duties has been allocated to hessian and others in thesame proportions as the basic duty.
For working out the incidence we have made the following assump
tions: (i) hessian is used for packing, etc., of manufactured goods and
hence the tax yield from this item may be allocated to different expendi
ture groups on the basis of their expenditure on manufactured goods;
(ii) sacking is used for transporting foodgrains, etc., and can thereforebe allocated on the basis of expenditure on foodgrains by different ex
penditure groups in the urban sector; and (iii) tax yield from others may
be allocated to different expenditure groups on the basis of their expenditure on manufactured goods.
2. Fertilisers
Production, clearance and tax yield data are available in Central
Excise Year Book. We have data on consumption of fertiliser according
to type of crops for 1970-71 from the publication by National Council
ofApplied Economic Research (NCAER), entitled FertiliserUse on SelectedCrops in India (1974).
We have distributed the total quantity of clearance among the various
crops on the basis of proportions obtained in 1970-71, as given in the
NCAER publication mentioned above. The yield of tax on fertilisershas been attributed to the different crops on the basis of the above proportions, as shown in Table A-i.

APPENDDCI 45
TABLE A-i
Crop-wise Pattern of Use of Fertilisers—1970-71
Consumption Percentage of Yield from
of fertilisers total consump- excise tax
Crop during 1970- tion during 1973"
71 ('000 tonnes) 74 (Rs- '00°)
I.
2.
3-
4-
5-
6.
Rice
Wheat
Maize
Sugarcane
Cotton
Pulses
TOTAL
726.9
443-3
92.3
420.9
181.7
2314.1
4179.2
17.4
10.6
2.2
10.0
44
554
100.0
66193.4
49324-7
8369.3
38042.2
16738.6
210753.8
380422.0
Source : Fertiliser Use on Selected Crops in India (l974)> NCAER.
3. Petroleum-domestic production
Data on tax yield (Central excise) from different petroleum products
for 1973-74 are available from Central Excise Year Book.

46 INCIDENCE OF iNDIIttfCT TAXATION IN INDIA
TABLE A-2
Tax Yields from Petroleum Products (1973-74)
(Rs. lakh)
Tax yields
1. Furnace oil -00I
2. Refined diesel oil and vaporising oil, diesel oil not
otherwise specified 31406
3. Asphalt bitumen and coal tar X6O2
4. Petroleum products not otherwise specified 4684
5. Blended or compounded lubricating oils and greases 17376. Calcined petroleum coke I20
7. Motor spirit 3012s
8. Kerosene oil 14112
TOTAL 87387
Source: Statistical Year Book-Central Excise.
The publication Indian Petroleum and Petro-Chemicals Statistics,
(1973) issued by the Economics and Statistics Division of the Ministry
of Petroleum, New Delhi (1973) (hereafter referred to as Petroleum
Statistics), contains information on domestic production, imports, con
sumption and sales. It is possible to allocate the estimates of clearance
(quantity) of different types of petroleum production to different broad
uses on the basis of information contained in the above-mentioned publication.
The methodology used in each case is explained below.
(a) Furnace oil—We have obtained information about the broad
uses of furnace oil from the Ministry of Petroleum. The estimates of
the quantities used for different purposes in absolute terms as well as in
terms of percentages are indicated in the following table:

APPENDIX I 47
TABLE A-3
Uses of Furnace Oil in India
Sectors of use Quantity Per cent
('000 tonnes) of total
Transport 4_*7 7-Q
of which
Road transport
Railways
Waterways
Agriculture/plantation
Power generation
Other industries
of which
Iron and steel
Textile fibre
Cement
Ceramics and glass
Chemicals and allied
Fertilisers
Aluminium
Sugar
Mining and quarrying
Engineering
Other miscellaneous
TOTAL 5932 I00-°
Source: Indian Petroleum and Petro-Chemical Statistics (i974)-
In the NSS list of consumption items we have separate information
on the expenditure of the households on road transport, railways and
waterways. The tax yield attributable to transport has been distributed
among the different expenditure groups in rural and urban sectors accor
dingly. We recognise that transport is also used for the carrying of goods.
2
6i
354
222
1648
3138
438
65O
204
218
795
266
no
59
35
363
507
Neg.
1.0
6.0
3-7
27.8
53.0
74
II.O
34
3-7
134
4-5
19
1.0
0.6
6.1
8.5

48 INCIDENCE OF INDIRECT TAXATION IN INDIA
But since the amount involved is not large, the approximation we haveused may not significantly distort the total picture.
The tax yield attributable to agriculture/plantations can be allocated to different expenditure groups on the basis of their total expenditure on the following items indicated in the NSS list of consumptionitems: (i) total cereals, (ii) total pulses, (iii) total vegetables, (iv) freshfruits, (v) tea and tea leaves, and (vi) coffee and coffee powder.
For other items, the basis of allocation is as follows :
(i) Power generation—total expenditure on consumption ofelectricity and manufactured goods with equal weight.
(ii) Iron and steel—total expenditure on consumption of manu-facured goods.
(iii) Textile fibre—according to tax-yield from cotton and woollen fabrics allocated to different expenditure groups.
(iv) Cement ceramics and glasses—the total tax yield was dividedinto two broad categories:
(a) residential buildings, and
(b) others on the basis of the aggregate value of construction obtained in respect of each of the two groups
from the CSO. The share of residential building hasbeen distributed on the basis of household expenditureon house rent as given in the NSS and the share of
'others' on the basis of expenditure on manufacturedgoods.
(v) Chemicals—the method of allocation is the same as for thetax on chemicals to be discussed later,
(vi) Fertilisers—as in the case of tax on fertilisers.(V11) Aluminium engineering, mining and quarrying and other
miscellaneous—on the basis of total expenditure on manufactured goods.
(vni) Sugar—according to the methodology used for sugar,(b) Refined diesel oil, and vaporising oil, diesel oil, not otherwise
specified—This group of petroleum products mostly consists of highspeed diesel oil (H.S.D.) and light diesel oil(L.D.O.). The uess of thesetwo products have been worked out by the Ministry of Petroleum asfollows:

APPENDIX I 49
Quantity
High speed diesel ('000 tonnes)
(i) State transport 599
(ii) Other road transport (including agriculture) 3359
(iii) Railways 5%l
(iv) Bunkers 2&
(v) Miscellaneous 626
5193
Similarly, for LDO the distribution according to end uses has been
worked out as follows:
Quantity
Light diesel oil ('000 tonnes)
(i) Power 158
(ii) Bunkers 45
(iii) Rest (including agriculture H45
and small scale industries)
1348
As no separate tax yield is available in respect of HSD and LDO,
we have decided to club them together and classify their joint use as
follows:
Quantity of HSD and
LDO used
('000 tonnes)
(i) Road transport
(ii) Railways
(iii) Bunkers (steamship)
(iv) Power
(v) Others (agriculture and small scale)
The tax yield has been allocated to various uses in proportion to
the quantities consumed as given above. The yield attributed to items

50 INCIDENCE OF INDIRECT TAXATION IN INDIA
(i), (ii) and (iii) has been apportioned on the basis of expenditure on rail
ways, road and steamship fares, respectively; and the yield attributed to
item (iv) on the basis of consumption of electricty. In the case of the
yield attributed to item (v), 50 per cent is distributed on the basis of
expenditure on manufacturing products and the remaining 50 per cent
on that on agricultural products. The consumption of diesel oil for the
purpose of transport (road, railways and steamship) would not be entirely
for carrying passengers. A part would go also towards the transporta
tion of goods. Hence, we made an alternative assumption that 50
per cent of the diesel oil was consumed for the transportation of pas
sengers and the remaining 50 per cent for the transportation of goods.
The share of tax yield attributable to the transportation of goods was
allocated on the basis of household expenditure on manufactured goods.
Surprisingly, the results thus obtained were almost the same. Only
in the case of one or two expenditure groups the incidence came out to
be different, and only at the second decimal point.
(c) Asphalt, bitumen and coal tar—These materials are used mainly
in construction (including road making) activity. We can divide the
total value of construction into (i) government construction, (ii) resi
dential buildings (private), (iii) non-residential buildings, and (iv) roadsand bridges.
We have obtained estimates in respect of each of the above categories
of construction from CSO. The share of residential buildings can be
distributed on the basis of rent on dwellings as given in NSS. The
share of non-residential buildings is distributed on the basis of expen
diture on manufactured items and the share of roads and bridges is dis
tributed on the basis of expenditure on road transport.
(d) Petroleum products not otherwise specified—On the basis of
information contained in Central Excise Year Book this item is split into:
Quantity
('000 tonnes)
(i) Liquified petroleum gas 263
(ii) Waxes 47
(iii) Other mineral turpentine oil 699
1009

APPENDIX I 51
According to the information given by the Ministry of Petroleum,
liquified petroleum gas is used almost entirely for domestic purposes.
It is assumed that this is used entirely by the groups with per capita
expenditure of Rs. 100 and above in the urban sector. In the case of
waxes, about 50 per cent goes to candle manufacturing (c.f. Petroleum
Statistics) and the remaining 50 per cent to water proofing, match
industry, paper waxing and hard board industry. The latter part is
apportioned to manufacturing and the tax on it is allocated on the basis
of expenditure on manufactured goods.
(e) Blended or compounded lubricating oils and greases—From
the publication Petroleum Statistics (1973), the following breakdown of
the use of compounded lubricating oils and greases has been obtained
for the year 1972-73.
Quantity
(*ooo tonnes)
(i) Automotive oils (automotive) 211
(ii) Railways oil/axle oil 19
(iii) Industrial lubricating oil 643
873
The share of item (i) in the tax yield is attributed to road transport.
The share of item (ii) to railway transport and the remaining item (iii)
to manufactured items.
(f) Calcined petroleum coke—The whole of the tax yield has been
distributed on the basis of expenditure on manufactured items.
(g) Motor spirit—The use of motor spirit is split into
Quantity
('000 tonnes)
(i) ATF (aircraft turbine fuel) 798
(ii) Others (motor cars, etc.) 791
1589
First, we have divided the total tax yield from motor spirit into two
parts (i) 50 per cent is apportioned to use by aeroplanes, (ii) the remai
ning 50 per cent is apportioned to use in cars, motor-cycles, etc. Then,

52 INCIDENCE OF INDIRECT TAXATION IN INDIA
70 per cent of the share attributable to item (i) is taken to be from com
mercial use of aeroplanes and is distributed among various expenditure
groups on the basis of proportions of aggregate household expenditure;
of the remaining 30 per cent, 10 per cent is attributed to governmental
use of air-services, and 20 per cent is taken to be used by groups with
per capita expenditure exceeding Rs. 100 per month, in the urban sector.
The share of tax yield attributed to motor spirit used for cars, motor
cycles, etc., is distributed as follows : Estimates of Capital Formation in
India, 1969, published by the CSO, gives the percentage shares of the
number of cars used for industrial and commercial purposes and of those
used for private purposes. We have assumed the same proportions.
The share of tax on motor spirit assumed to be used for industrial and
commercial purposes is distributed on the basis of proportion of expen
diture on manufactured goods. The share attributable to private use
of cars is entirely allocated to groups with per capita expenditure ex
ceeding Rs. 100 per month in the urban sector.
(h) Kerosene oil—The estimates of use of kerosene oil have been
obtained from Petroleum Statistics. The uses in 1973-74 were as follows1
(i) Domestic
(ii) Industrial and commercial
The share attributable to domestic use is allocated on the basis of
expenditure on kerosene oil by the households. The share attributable
to industrial and commercial uses is distributed on the basis of total
expenditure on manufactured items.
4 Iron and steel
Central Excise Year Book gives the estimates of tax yield from the
various categories of iron and steel being produced in the country.
They are reproduced below:
(Rs. lakh)
(a) Iron and steel in any crude form 602
(b) Steel ingots 1141
Quantity
('000 tonnes)
3328
129
3457
Percentage
of the total
96-3
37
100.0

APPENDIX I 53
(c) Iron and steel products 15585
(d) Steel furniture 373
(e) Others (including slotted angles and channels of
steel wire-ropes) g2
17783
Item (c) iron and steel products can further be broken into thefollowing:
(Rs. lakh)
(i) Semi-finished steel (inclu
ding blooms, billets, etc.)
(ii) Bars and rods, wires, etc.
(iii) Plates and sheets
(iv) Flats, skelps and strips
(v) Pipes and tubes
(vi) Other steel castings
(vii) Rails and sleepers
(viii) Others
TOTAL 15585 8906 6679
On the use of steel, we were able to obtain two studies: (1) The
Iron and Steel Industry of India (1964) by Mr. Choudhuri, and (2) an
unpublished study by the Steel Authority of India (SAIL) for the year
1975. Choudhuri's book gives data on the demand for steel for the
years 1956-57 to 1960-61 by different Industrial sectors. The informa
tion obtained from the SAIL is more up-to-date and, therefore, wehave made use of the SAIL data.
SAIL have divided iron and steel products into eight major groups
as against five groups availble in Central Excise Year Book. These major
groups are (i) pig iron, (ii) semi-finished steel, (iii) railway materials,
(iv) structures, (v) bars and rods, (vi) plates, (vii) sheets and (viii)
skelp and H. R. strips. Each of the above iron and steel products has
been apportioned by SAIL among twenty-nine uses; namely, steel and
coal, defence, power, other government departments, railway wagon,
Total
yield
4742
3244
3453
3579
94
144
326
3
Basic
duty
2710
1854
1973
2045
54
82
186
2
Auxiliary
duty
2032
1390
1480
1534
40
62
140
1

54 INCIDENCE OF INDIRECT TAXATION IN INDIA
ports (ship yards), Posts and Telegraphs, Public Works Department,
auto-manufactures, bright bar electric manufactures, re-rollers, tube
manufactures, wire drawings, basic metals, main fabricators, furniture
makers, drum, barrel, fastner industries, foundry, corporate bodies and
agro-industries, trade, etc.
First, we have tried to match SAIL's eight major groups of iron
and steel with the five major groups of iron and steel given by Central
Excise Year Book indicated earlier. This has been done in the following
manner. Iron in any crude form given in Central Excise Year Book is
taken to represent pig iron. Similarly, steel ingots have been taken to
include plates and sheets structures and iron and steel products; the re
maining important groups given in Central Excise Year Book are taken
to include the remaining groups of items in the SAIL report.
The many uses for each of the above mentioned groups have then
been reclassified into seven major uses: (i) Government services, (ii)
furniture makers, (iii) irrigation, (iv) manufacturing, (v) power, (vi)
transport and communication and (vii) others.
The share attributable to government services has not been allo
cated to households. Furniture makers make steel furniture and struc-
turals partly for permanent fitting in the buildings. This part is to be
treated as capital formation and the remaining part as household con
sumption. Following the CSO estimates given in the Estimates of Capital
Formation, 1969, 50 per cent is treated as part of capital formation in
non-residential construction and 50 per cent as household consumption
of furniture. The share going to non-residential construction has been
distributed on the basis of household expenditure on manufactured
goods. The share going to household consumption of furniture is dis
tributed on the basis of expenditure on furniture by different expen
diture groups. The share going to irrigation has been allocated on the
basis of expenditure on agricultural goods. Similarly, shares of manu
facturing and power have been distributed on the basis of expenditure
on manufactured goods and electricity, respectively. Transport and
communication has been broken up into Posts and Telegraphs, auto-
manufacturers, railway wagons, trade and ports. The share of Posts and
Telegraphs has been allocated on the basis of household expenditure on
postage and telephone; the aggregate share of railway wagons, trade and
ports, on the basis of expenditure on manufactured goods; the share of
item (vii) 'others' on the basis of expenditure on manufactured goods.

APPENDIX I 55
5. Chemicals
(A) Paints and varnishes—On the basis of the information contained
in Input-Output Table For India, 1963 prepared at the Gokhale Institute
of Politics and Economics and published in Artha Vijnan, March 1972
(hereafter referred to as Input—output Table For India, (1963) and in
Draft Fourth Plan, Material and Financial Balances, published by the
Planning Commission in September 1966, (hereafter referred to as
Material and Financial Balances, 1966), we first allocated the total of
this item among different uses, in the following manner :
(Rs. crore)
(i) Construction 32.6
(ii) Electrical equipment 2.9
(iii) Non-electrical equipment 1.4
(iv) Transport 5.7
(v) Metal products 5.7
(vi) Glass and glass wares 2.4
(vii) Final consumption 1.1
TOTAL 51.8
For the purpose of estimating incidence, we had 10 compress the
above into a smaller number of groups as given below:
(Rs. crore)
(i) Construction 32.6
(ii) Transport 5.7
(iii) Manufacturing 7.0
(iv) Domestic 6.5
TOTAL 51.8
Construction is broken down into (a) Government (b) residential
and (c) others, on the basis ofinformation obtained from the CSO. The
tax yield from paints and varnishes attributable to government construc
tion has been excluded from the allocable pool. Residential construc
tion is broken into rural and urban on the basis of estimates obtained
from the CSO. The tax yield attributable to residential buildings in

56 INCIDENCE OF INDIRECT TAXATION IN INDIA
each sector is then apportioned among the different per capita expendi
ture groups in that sector in proportion to their expenditure on rent of
(owned and rented) residential buildings. The amounts of tax yield
attributable to 'others' is apportioned on the basis of expenditure on
manufactured goods.
The share of tax yield attributable to 'transport' is allocated in the
same manner as yield of other taxes attributable to transport (mentio
ned in earlier cases).
The share of manufacturing, item (iii), is allocated on the basis of
expenditure on manufactured goods; and the share of domestic uses,
item (iv), has been allocated on the basis of expenditure on furniture.
(B) Synthetic and organic dye stuffs—From the report of the Tariff
Commission on the Review of Dye Stuffs Industry for the year 1974, we
could get the following break-up of the uses of this chemical :
(i) Textile industry 80 per cent
(ii) Leather, plastic and printing ink for paper
and coir 20 per cent
The share of tax yield attributable to the textile industry has been
allocated to different expenditure groups in the urban and rural sectors
on the basis of their total expenditure on woollen, cotton and silk fabrics.
The tax yield attributable to leather, plastic, printing ink for paper and
coir has been allocated on the basis of total expenditure of the house
holds on (i) leather (ii) plastic articles (iii) books and periodicals and
(iv) coir ropes and coir mats.
(C) Caustic soda and caustic potash—We have information about
the end uses of these products from Indian Chemicals and Pharmaceutical
Industry—A Survey, 1963-64 published by Indian Chemical Manufac
turers Association.
The shares of the different end uses during the Third Five Year
Plan have been assumed for the year 1973-74.
Industry Demand
(percentage of total)
(1) Paper and paper board 28
(ii) Rayon and staple fibre 23
(iii) Textiles 15
(iv) Soap 14
(v) Aluminium 7

APPENDIX I 57
(vi) Petroleum refining 2
(vii) Vanaspati J
(viii) Dye stuffs I0
ioo
The share of tax yield on caustic soda and caustic potash attri
butable to paper and paper board has been allocated on the basis of
consumption expenditure on books and journals and newspapers and
periodicals; that attributable to rayon and staple fibre has been allocated
on the basis of expenditure on artificial silk. The shares of textiles and
dye stuffs have been allocated on the basis of expenditure on cotton and
woollen fabrics.
The shares of tax yield attributable to soap and vanaspati have been
allocated on the basis of NSS consumption expenditure on soap and
vegetable oil, respectively. The share of yield attributable to caustic
soda and caustic potash used in the production of aluminium has been
allocated in the same fashion as the tax on aluminium.
(D) Organic surface active agents—The yield from this item has
been allocated on the basis of expenditure on manufactured goods.
(E) Calcium carbide, bleaching powder and sodium hydrosulphate—
The yield from these items has been allocated on the basis of expen
diture on manufactured goods.
(F) Soda ash—Information about its uses is available from Indian
Chemical and Pharmaceutical Industry—A Survey, 1963-64. For the
Third Plan period, the uses have been indicated as follows :
(Percentage of total)
(i) Laundry, dhobi and miscellaneous 37
(ii) Glass 31
(iii) Chemicals, caustic soda I2
fiv) Silicate 8(v) Paper 4
(vi) Textiles 3
(vii) Sodium bicarbonate 3
(viii) Bichromate 2
100

58 INCIDENCE OF INDIRECT TAXATION IN INDIA
The shares of laundry, dhobi and miscellaneous have been allocated on the basis of expenditure by households on washermen, laundries,etc. Of the total share of glass, 50 per cent has been allocated on the
basis of expenditure of households on crockery and other utensils, andthe remaining 50 percent is attributed to construction. The distributionin regard to the tax yield of the share allocated to construction is the sameas in case of other construction inputs.
The shares attributable to chemicals, caustic soda, silicate, sodiumbicarbonate and bichromate have been allocated on the basis of expenditures on manufactured goods.
The share attributable to paper has been distributed on the basisof expenditure on books, journals and newspapers, etc., and that attributable to textiles on the basis of expenditure on cotton, silk and woollenfabrics.
(G) Rubber processing chemicals—The entire yield has been allocated on the basis of expenditure on road transport because most of the
consumption of rubber is used in the preparation of tubes, tyres, etc.,for motor vehicles.
(H) Carbon black—This is used mostly in the preparation of tyresand tubes and hence the whole of it has been distributed on the basisof expenditure on road transport.
(I) Optical bleaching agents—Expenditure of households on laundries has been taken as the basis of allocation.
(J) Other chemicals—the yields from the remaining chemical itemslike sodium silicate, cellophane, acids, camphor, menthol and glycerine,
etc., have been distributed on the basis of expenditure on manufacturedgoods.
6. Cement
Cement is used mainly for construction. Only a very smallpart of it goes to other uses like production of asbestos, whichis also used in construction. The total value of construction consists of(1) construction covered by the commodity-flow approach and (ii)construction not covered by the commodity-flow approach. Gement is
used only in construction works covered by the commodity-flow approach. The total value of construction covered by the commodity-flow approach and the break-up thereof in 1973-74 have been suppliedby the CSO. These are as follows:

APPENDIX I <j9
(Rs. crore)
Total value of construction covered by the commodity-
flow approach 47%°
of which
(i) construction by and for government
administration 1522
(ii) departmental enterprises 1162
(iii) non-departmental enterprises 816
(iv) construction in the private sector 1280
First, the total tax yield has been distributed among the shares of
construction of the items indicated above. The share going to govern
ment construction is excluded. The share attributable to departmental
enterprises relates mostly to railways, posts and telegraphs and road
transport. Hence, the share of the tax yield attributable to item (ii) can
be distributed among the expenditure groups on the basis of their total
expenditure on road and railway transport and communication. The
yield attributable to non-departmental enterprises has been allocated
on the basis of expenditure on manufactured goods. Private construc
tion can be broken up into private construction of residential buildings
and others. On the basis of data published by the CSO it has been
assumed that about 60 per cent of private construction goes for private
residential buildings and the remaining part goes for non-residential con
struction. Hence, 60 per cent of the share allotted to private construc
tion has been distributed among various expenditure groups on the basis
of expenditure on residential rents and the remaining 40 per cent on the
basis of expenditure on manufactured goods. No share has been allotted
to agricultural goods because it is assumed that the nature of construction
in the agricultural sector is mostly kutcha and that there is very little use
of cement in such construction works.
7. Coal and Coke
This item is used in a number of ways. On the basis of infor
mation available in Material and Financial Balances, 1966, we could
work out the percentage shares of different uses as follows: electricity
thermal 25 per cent; railways 23 percent; pig iron 12 per cent; soft coke
8 per cent; cement 7 per cent; brick burning 6 per cent; chemicals 2 per
cent; paper and paper board 3 per cent; foundries 2 per cent; fertilisers
2 per cent; cotton textiles 2 per cent; engineering works 1 per cent; cera
mics and potteries 1 per cent; glass 1 per cent; jute 1 per cent; others
4 per cent. The allocation of tax yield has been done in the following

60 INCIDENCE OF INDIRECT TAXATION IN INDIA
manner. In the case of electricity, 50 per cent on the basis of electricityconsumption by households and 50 per cent on the basis of expenditureon manufactured goods; for railways on the basis of expenditure on railwayfares; for pig iron on the basis of uses of pig iron discussed in the cas2 ofiron and steel; for soft coke on the basis of consumption of coke andcoal given in NSS consumption data; for cement, as discussed in thecase of cement; for brick burning, according to construction as discussedin the case of cement; for chemicals on the basis of expenditure on manufactured goods; for paper and paper board on the basis of expenditure onbooks, periodicals, papers, etc.; for foundries on the basis of expenditureon manufactured goods; for fertilisers on the basis of expenditure onagricultural goods; for cotton textiles on the basis of expenditure on
cotton fabrics; for engineering works on the basis of expenditure onmanufactured goods; for ceramics and potteries on the basis of expenditure on crockery; for glass, 50 per cent through construction as discussed in the case of cement and 50 per cent on the basis of householdexpenditure on "other utensils"; for jute, as in the case of jute manufactures; for others on the basis of expenditure on manufactured go^ds.
8. Tyres and Tubes
Production data in regard to automobiles are available in the annualreport of the Directorate General of Technical Development (DGTD)The figures for I973~74 are as follows:
Quantity
(nos)
a (i) Commercial vehicles (buses and trucks)(11) Passen( es (buses and trucks) 4^(11) Passenger cars 6 6
(m) JeepS 10015(iv) Three wheelers 12616
b. Motor cycles
c. Scooters 1* J
d. Mopeds and scooterettes J ^The Transport Research Unit of the Ministry of Shipping and
Transport supplied the figures of the total number of registered vehicleson March 1974, as follows : '
Quantity
(nos)(1) Motor cycles
(ii)
() y g^
(ii) Auto-rikshaws and scooters 66-l8

APPENDIX I 6l
(iii) Jeeps
(iv) Private motor cars
(v) Taxis
(vi) Buses
(vii) Goods vehicles
(viii) Scooters
79457573709
82524
97738
319856
220225
The prices of tyres and tubes have been obtained from the Index
Numbers of Wholesale Prices in India. The following were the-pricesin 1973. m . ..
J (Price per unit)
Dunlop C-49 giant (PV price)
Dunlop fort covers
Motor cycles
Scooters (two and three wheelers)
For the purpose of measurement, we have classified all the vehicles
given above into the following categories :
1050.
210.
93.
68
Tyres
(Rs.)
00
00
,00
.00
Tubes
95.00
30.00
16.00
11.00
Name of the vehicle Production Registration Price per unit
Tyres Tubes
Rs
[a) Buses, trucks, etc.
^b) Cars, taxis, jeeps,
etc.
'c) Motorcycles
[d) Three wheelers
'e) Scooter, two whee
lers including scoo-
terettes
40580
46771
54085
12646
114851
417594
7356690
827906
66718
220225
1050
210
93
68
95
30
16
11
For working out the incidence, we have to divide the total number
of registered vehicles into new and old. From the total number of re
gistered vehicles we deduct the production data to get the number of old
vehicles. The production data are taken to represent the number of
new vehicles.
We have assumed that new vehicles absorb tyres and tubes (includ
ing the additional ones provided with the new vehicles) at the following

62 INCIDENCE OF INDIRECT TAXATION IN INDIA
rates: buses and trucks—7, cars, taxis and jeeps—5, motor cycles—3,
three wheelers—4, scooters—3.
We take the total consumption of tubes and tyres from two sides
(i) production of new vehicles and (ii) demand for replacement for the
old vehicles. Looking at the stock and flow figures of vehicles and assum
ing that tubes and tyres have an average life of not more than two years
we deduce that 25 per cent ofthe tax yield can be attributed to new vehicles
and 75 per cent to old vehicles. On the basis of information available
about the number of new vehicles for each type, consumption of tubes and
tyres per vehicle and the prices of tubes and tyres, it has been possible to
work out the value of each type of tube and tyre absorbed during the
year by new vehicles. Similarly, we have worked out the value of total
consumption of each type of tube and tyre for replacement purposes.
We have assumed that all the four wheelers consume twice the number
of tyres and tubes as two wheelers and the number of old vehicles are
equal to the total stock minus the production of new vehicles. Then
for each type of tyre and tube we have worked out the total expenditure
in relation to new vehicles as well as that for replacement. The total tax
yield has been divided among different categories of tubes and tyres on
the basis of their share in total expenditure. The tax revenue shares
thus arrived at have been distributed on the basis of expenditures of
households on each type of transport services. The share attributable to
trucks, however, has been allocated on the basis of expenditure on manu
factured goods.
9. Copper and copper alloys
On the basis of information contained in Material and Financial
Balances, 1966, and Input-Output Table for India, 1963, the different
uses of copper and copper alloys have been classified into the following
categories:
Percentage of total
1. Electrical goods
(a) Refrigeration 1
(b) Telephone and Telegraphs 6
(c) Electric fans 2
(d) Others* 55
2. Non-electrical goods (including machinery and equipment)
(a) Automobiles 6
(b) Railway equipment
(c) Food processing machines
(d) Chemical industry equipment
(e) Utensils (domestic)
(f) Others**
APPENDIX I
Neg.
2
12
10
6
63
Grand Total ioo
*Includes electric motors, transformers, base copper conductors,
PVC and VIR cables, paper insulated wires and cables, switch and
control gear.
**Includes pumps and compressors, bolts, nuts, washers, diesel
engines and metal products.
For the allocation of tax burden in regard to electrical goods, the
methodology is as follows. According to proportions given in CSO's
Estimates of Capital Formation in India, 1969, about 80 per
cent of refrigeration products goes to households and the remaining
20 per cent to producer sectors. Thus 80 per cent of the total
yield of tax on copper attributed to this item can be allocated to
the group with per capita expenditure of Rs. 100 and above and the re
maining 20 per cent on the basis of total expenditure on (a) allopathic
medicines; (b) ice-cream and (c) jam and jellies. In the case of tele
phone and telegraphs, the tax yield has been distributed among various
expenditure groups on the basis of household expenditure on telephones.
The CSO assumes that 50 per cent electric fans are being used domes
tically and the remaining 50 per cent for commercial purposes. This
assumption has been used here. The domestic share can be distributed
on the basis of household expenditure on electric fans. The remaining
50 per cent can be allocated on the basis of expenditure on manufactured
goods. The share attributed to the item 'others' under electrical goods
has been allocated on the basis of expenditure on manufactured goods.
The share of non-electrical goods has been allocated in the following
manner: (a) automobiles—household expenditure on road transport;
(b) food processing machines—household expenditure on processed
food; (c) chemical industry equipment—in the same manner as for all
chemicals indicated above; (d) utensils—household expenditure on
manufactured goods.

64 INCIDENCE OF INDIRECT TAXATION IN INDIA
10. Aluminium
We have the estimates of the uses of this item from Material and
Financial Balances, 1966, and Input-Output Table for India, 1963.
I.
2.
3-
4-
5-
6.
7-
Electrical equipment
of which
(a) Fans
(b) Refrigeration
(c) Radios, etc.
(d) Others*
Automobiles
Food processing machinery
Textile machinery
Chemicals and pharmaceuticals
Building construction and furniture fixing
Domestic Utensils
TOTAL
Percentage of total
64
1
1
Neg.
62
11
8
2
1
5
9
100
'Includes ACSR conductors and accessories, A.A. conductors and
accessories, other electrical manufacturing, PVC and VIR cables,
paper insulated wires and cables.
Following the methodology of the CSO in regard to the esrimation
of capital formation, 50 per cent of the share attributable to fans and
80 per cent of the share attributable to refrigeration have been taken to
be accounted for by domestic use. These portions can be allocated on
the basis of expenditure on electric fans and on "other durable equip
ment".
The share of automobiles is allocated on the basis of expenditure
on road transport. For others we have used the following methodology :
food processing—expenditure on processed food by households; textile
machinery—on the basis of expenditure on textiles; chemicals—on the
same basis as the distribution of tax yield (aggregate) from chemicaL;
building construction and furniture fixing—on the same basis of alloca
tion as for tax yield from cement for building construction; domestic
utensils—expenditure on aluminium utensils.
APPENDIX I 65
11. Plywood
The pattern of use of plywood is not available separately. We
have, however, information on the consumption pattern of wood. Ac
cording to Material and Financial Balances, 1966, 78 per cent of the
wood is used in construction and 22 per cent of it is used for manufacture
of furniture and other purposes. Having no other basis, we have used
the following proportions in respect of plywood: (i) 75 per cent for con
struction; and fii) 25 per cent for furniture. Plywood is assumed to be
used for permanent fixing and fitting in the construction of buildings.
The share attributable to residential buildings is allocated to the con
struction of buildings for the group with per capita expenditure of Rs.
100 and above in the urban sector under the head "expenditure on rent
on dwellings." The share attributable to non-residential buildings has
been allocated on the basis of expenditure on manufactured goods. The
share of the remaining 25 per cent has been allocated to different expen
diture groups in the urban sector on the basis of expenditure on furniture.
12. Asbestos
The major part of this material is used in the construction of non-
residential buildings like factory buildings, sheds, etc. A small part
goes to the construction of residential buildings also. We assume that
75 per cent goes for non-residential buildings and 25 per cent for the
construction of residential buildings. The share of tax yield attri
butable to non-residential buildings can be allocated on the basis of ex
penditure on manufactured goods and the remaining 25 per cent on the
basis of expenditure on house rent by the households in the urban sector.
13. Mosaic tiles
These are taken to be used exclusively in the construction of resi
dential buildings for the group with per capita expenditure of Rs. 100
and above in the urban sector. Hence the tax yield has been entirely
allocated to this group.
14. Cinematograph films and projections
Allocation has been done on the basis of household expenditure
on cinemas.
66 INCIDENCE OF INDIRECT TAXATION IN INDIA
15. Crown corks and pilfer proof caps
Allocation has been done on the basis of household expenditure
on beverages (aerated water).
16. Lead unwrought
On the basis of information contained in Material and Financial
Balances, 1966, we have allocated this material to different uses in the
following manner: automobiles 35 per cent; electricity 30 per cent; paints
and varnishes 16 per cent; printing metals and alloys 13 per cent;
chemical plants and equipment 4 per cent; and construction 2 per cent.
Tax yield has been allocated in the following manner: (a) auto
mobiles—on the basis of expenditure on road transport; (b) electricity—
50 per cent on the basis of household expenditure on electricity and the
remaining 50 per cent on the basis of expenditure on manufactured goods;
(c) paints and varnishes—on the same basis as for paints and varnishes;
(d) printing metals and alloys—household expenditure on paper, perio
dicals and books; (e) chemical plants and equipment—on the basis of
the distribution ratios used for all chemicals; (f) construction—as in the
case of other construction inputs.
17. Electrical insulators, stamping wires, cables and others
50 per cent of the tax yield from these commodities has been allo
cated on the basis of expenditure on manufactured goods by households
and the remaining 50 per cent on the basis of consumption of electricity
by them.
18. Slides, zips and fasteners
The whole amount of tax yield from slides, zips and fasteners has
been allocated on the basis of household expenditure on suitcases, attache
and kitbag.
19. Rolling bearings, welding electrode and permanent magnet
The total yield from rolling bearings, welding electrodes and per
manent magnet has been allocated on the basis of total expenditure on
manufactured goods.

APPENDIX I 67
20. Safes, strong boxes, etc.
The tax yield from safes, strong boxes,etc, made of hard metals
has been allocated to the group with per capita expenditure of Rs. 100
and above in the urban sector.
21. Rubber products (including synthetic rubber) other than tyres and
tubes
There are three main uses of rubber products, namely, (i) leather
footwear (4 per cent); (ii) jute textiles (5 per cent); (iii) household con
sumption (91 per cent).
The share of household consumption, i.e., item (iii) has been allo
cated to different expenditure groups on the basis of total expenditure
on items like (a) rubber cushion and (b) footwear other than that of
leather. The share attributable to leather footwear has been allocated
on the basis of household expenditure on leather footwear which includes
leather boots and shoes, leather sandles and chappals, and other leather
footwear. In the case of jute textiles, the distribution has been made
on the same basis as in regard to jute fabrics.
22. Chinaware and porcelain
These items are purchased by households as well as hotels and res
taurants. As we do not have data on household expenditure on hotels
and restaurants, we have allocated the entire yield on the basis of NSS
household expenditure on crockery and chinaware.
23. Glass and glassware
Based on data contained in Material and Financial Balances, 1966,
and Input-Output Table for India, 1963, we have allocated the yield to
different uses in the following proportions: construction 17 per cent;
electrical equipment 8 per cent; domestic purpose 42 per cent; and drugs
and Pharmaceuticals 33 per cent. In the case of construction we have
first divided building construction into urban residential and urban non-
residential. The share allocated to urban residential has been distri
buted on the basis of rents (urban dwellings). In the case of the share of
non-residential buildings, the allocation has been done on the basis of
total expenditure on manufactured goods. The share of electrical equip-

68 INCIDENCE OF INDIRECT TAXATION IN INDIA
ment has been allocated on the basis of household expenditure on other
non-durable electrical goods. The share attributable to domestic uses
has been distributed on the basis of household expenditure on crockery
and chinaware assuming that those who spend on crockery and china-
ware spend on glassware also in more or less the same proportion. The
share of drugs and Pharmaceuticals has been allocated on the basis of
expenditure on all types of medicines.
24. Typewriter ribbons
We have taken 50 per cent a^ being used by the government sector
and the remaining 50 per cent by the private sector. The share of pri
vate use has been allocated on the basis of expenditure on manufactured
goods.
25. Gases
Fifty per cent of the share has been allocated on the basis of expen
diture of households on gases. The other 50 per cent has been allocated
on the basis of expenditure on manufactured goods.
26. Synthetic resins and plastic materials
The tax revenue collected from this item has been allocated on the
basis of household expenditure on plastic goods.
27. Linoleum
Allocation has been done on the basis of expenditure on manufactured goods.
28. Tin plates
Based on information contained in Material and Financial Balances,
1966 and Input-Output Table for India, 1963, the tax yields have been
distributed in the following manner: construction 44 per cent; electricity
12 per cent; manufactured goods 33 per cent; and domestic utensils 11
per cent.

APPENDIX I 69
29. Zinc
The allocation of the yield has been done on the basis of expen
diture on (i) manufactured goods 85 per cent; and (ii) domestic utensils15 per cent.
30. Iron ore
The same methodology as for iron and steel.
C. Capital Goods and Partly Capital Goods
1. Internal combustion engines
Information about the uses of this item could be obtained from the
Input-Output Table for India, 1963. It is used for (a) motor vehicles
80 per cent; (b) air and gas compressors, etc., 10 per cent; and (c) otherindustries 10 per cent.
The share of motor vehicles has been allocated in the same manner
as done in case of motor vehicles discussed later. The share of air and
gas compressors has been allocated on the same basis as for refrigera
tion because compressors are used mostly in the production of refrigerators. The share of other industries has been allocated on the basis of
expenditure on manufactured goods.
2. Electric motors
According to the information contained in Input-Output Table forIndia, 1963, the uses of this item are as follows: (i) agricultural use 89
per cent; (ii) textile machinery 2 per cent; (iii) machine tools 3 per cent;
(iv) air-conditioners 2 per cent; (v) photographic and optical goods 2
per cent; (vi) construction and machinery 1 per cent; (vi) ships andvessels 1 per cent.
The share of item (i) is allocated to different expenditure groups on
the basis of expenditure on agricultural goods; item (ii) on the same
basis as the allocation of tax yield from cotton textiles; item (iii) on thebasis of expenditure on manufactured goods; item (iv) on the basis of
household expenditure on air-conditioners; item (v) on the basis of ex
penditure on cinema; and items (vi) and (vii) on the basis of expendi-

70 INCIDENCE OF INDIRECT TAXATION IN INDIA
ture on manufactured goods.
3. Office machines
The yield is distributed among different expenditure groups on the
basis of expenditure on manufactured goods.
4. Power driven pumps
These pumps are used mostly in agriculture for the purpose of
irrigation. The yield has been distributed on the basis of household
expenditure on agricultural goods.
5. Fork lift trucks and platfrom trucks, coated abrassive and grinding
wheels
The aggregate yield from all these items has been allocated to differ
ent expenditure groups on the basis of expenditure on manufactured
goods.
6. Partly capital and partly household goods
A part of such goods is purchased by households and the remain
ing by entrepreneurs. The part attributable to entrepreneurial use in
each case has been distributed on the basis of expenditure of the house
holds on manufactured goods. For the remaining shares the metho
dology is indicated for each item separately.
7. Photographic cameras
According to the proportions in CSO's Estimates of Capital Forma
tion in India, 1969, 50 percent of this item is taken to be used for domestic
purposes and the remaining 50 per cent for entrepreneurial purposes.
Thus 50 per cent of the yield has been allocated on the basis of expen
diture on manufactured goods and the remaining 50 per cent has been
allocated on the basis of expenditure on "other durable goods".

APPENDIX I 71
8. Motor vehicles
50 per cent of the motor cars produced in the country have been
taken to go for entrepreneurial purposes and the remaining 50 per cent
for domestic use. This percentage is based on the information obtained
directly from car manufacturers. The share of domestic use has been
allocated to the households having monthly per capita expenditure of
Rs. 100 and above in the urban sector. The remaining 50 per cent has
been allocated on the basis of household expenditure on manufactured
goods.
9. Steel furniture
50 per cent of the steel furniture produced has been taken by the
CSO as going for household use. Thus 50 per cent of the yield has been
allocated to different expenditure groups on the basis of expenditure on
furniture. The remaining 50 per cent has been allocated on the basis
of expenditure on manufactured goods.
10. Wireless receiving sets
10 per cent of the total value of output is taken to represent capital
goods and 90 per cent to represent consumer durables. Thus 90 per
cent of the tax yield has been distributed among different expenditure
groups in the rural and urban sectors on the basis of expenditure on
radios; and the remaining 10 per cent on the basis of expenditure on
manufactured goods.
11. Refrigerating and air-conditioning appliances
According to the CSO, 20 per cent is used by the entrepreneurs and
80 per cent by the households. But the latest information obtained
directly from manufacturers like Kelvinator of India Ltd. and others
indicates that about 70 per cent goes to households and 30 per cent to
capital formation. We have used the latest information for working
out the incidence. The tax yield attributable to households has been
allocated to the group with per capita expenditure of Rs. 100 and above
in the urban sector. The share going to entrepreneurs has been distrL
buted on the basis of expenditure on manufactured goods.
72 INCIDENCE OF INDIRECT TAXATION IN INDIA
12. Electric fans
50 per cent of the expenditure on them is taken to be by house
holds. Thus 50 per cent of the yield has been distributed on the basis
of expenditure on electric fans and the remaining 50 per cent on the
basis of expenditure on manufactured goods.
13. Electric supply meters
It is assumed that 50 per cenr of the purchases is by households
and the remaining 50 per cent by entrepreneurs. The share attri
butable to households is distributed on the basis of consumption of ele
ctricity, and the remaining share on the basis of expenditure on manufactured goods.
D. Components of Capital and Partly Capital Goods
/. Motor vehicle part and accessories
70 per cent of the tax yield has been allocated to households and
has been distributed on the basis of expenditure on cars. The remaining
30 per cent of the tax yield is allocated to different expenditure groups
in the rural and urban sectors on the basis of their expenditure on manu
factured goods.
2. Electric batteries and parts thereof, tool tips, bolts, nuts, etc.
The total yield has been allocated to different expenditure groups
on the basis of expenditure on manufactured goods.
? Parts of wireless receiving sets
The same methodology as for wireless receiving sets.
II IMPORT DUTIES
Imported items have been classified into the following groups for
the purpose of working out the incidence :
A. Mostly in the nature of consumption goods;
B. Mostly in the nature of intermediate goods; and
C. Capital goods.
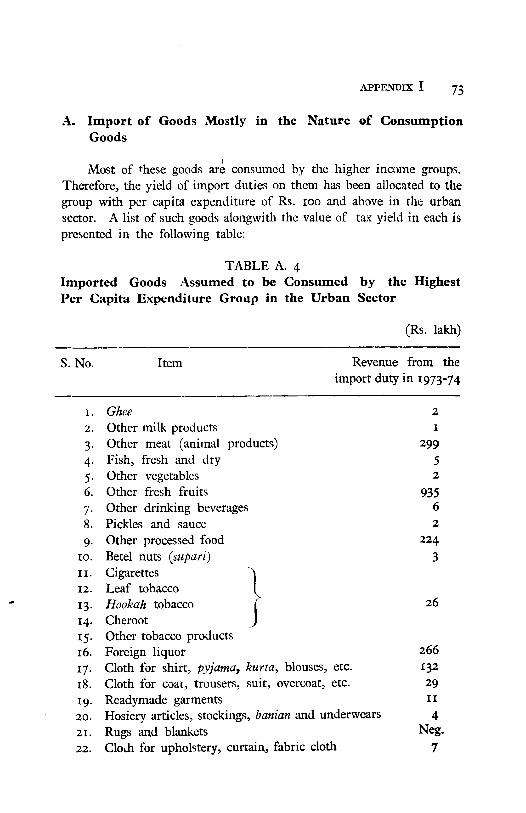
APPENDIX I 73
A. Import of Goods Mostly in the Nature of Consumption
Goods
Most of these goods are consumed by the higher income groups.
Therefore, the yield of import duties on them has been allocated to the
group with per capita expenditure of Rs. ioo and above in the urban
sector. A list of such goods alongwith the value of tax yield in each is
presented in the following table:
TABLE A. 4
Imported Goods Assumed to be Consumed by the Highest
Per Capita Expenditure Group in the Urban Sector
(Rs. lakh)
S. No.
i.
2.
3-
4-
5-
6.
7-
8.
9-
10.
ii.
12.
13-
14.
15-
16.
17-
18.
19.
20.
21.
Item Revenue from the
import duty in 1973-74
Ghee
Other milk products
Other meal (animal products)
Fish, fresh and dry
Other vegetables
Other fresh fruits
Other drinking beverages
Pickles and sauce
Other processed food
Betel nuts (supari)
Cigarettes ^j
Leaf tobacco I
Hookah tobacco j
Cheroot JOther tobacco products
Foreign liquor
Cloth for shirt, pyjama, kurta, blouses, etc.
Cloth for coat, trousers, suit, overcoat, etc.
Readymade garments
Hosiery articles, stockings, banian and underwears
Rugs and blankets
2
1
299
5
2
935
6
2
224
3
26
266
132
29
n
4
Neg.
22. Cloth for upholstery, curtain, fabric cloth

74 INCIDENCE OF INDIRECT TAXATION IN INDIA
23.
24.
25.
26.
27.
28.
29.
30.
3i-
32.
33-
34-
35-
36.
37-
38.
39-
40.
41.
42.
43-
44.
Cinematograph films
Sports goods, toys, etc.
Books and journals
Tooth paste and tooth powder
Electric bulbs and tube lights
Other toilet requisites
Toilet articles
Shaving blades
Other non-durable electrical goods
Umbrella and rain coats
Plastic goods
Suitcase, attache and kitbag
Foam rubber, cushion, (dunlop pillow type)
Other musical instruments
Jewels and pearls
Enamel utensils
Fountain pen
Spectacles
Clock and watch
Salt
Homeopathic medicines
Floor matting
There are some imported goods which cater for mass
The methodology for each of these is given below :
218
24
1
Neg.
48
19
13
Neg.
292
2
540
3
104
26
320
10
Neg.
3
106
1
20
n
consumption.
1. Foodgrains and products like flour and starch
Allocation has been done on the basis of expenditure on food-
grains (rice, wheat, barley, jowar, maize, bajra) in the urban sector.
2. Babyfood and milk powder
From the information given in Monthly Statistics of the Foreign Trade
of India, 1973-74 we find that most of the imports under this head are
in the form of milk powder. Out of an import of Rs. 525 lakh worth
of these goods, about Rs. 510 lakh were spent on dry milk powder and
the remaining on varieties of condensed milk. We have assumed there
fore that most of these imports are sold in the urban sector as under
government milk schemes. Thus, we have allocated the entire yield on
the basis of expenditure on milk by households in the urban sector.

APPENDIX I 75
3. Linseed oil, refined oil or essential oil (all sorts), edible oils and oil
seeds
We have allocated the tax yield from these items on the basis of
expenditure on these items by different expenditure groups in the rural
and urban sectors.
4. Pepper, dry chillies and other spices
Allocation has been done on the basis of household expenditure on
spices (pepper, dry chillies and other spices).
5. Paper—all sorts
The various types of paper that are imported can be broadly divided
into (i) news print and (ii) others. Others include all sorts of high stren
gth and special grade paper which are used mostly for packing and acc
ounting, machines card index systems and computers and include carbon
papers, etc. Out of the total value of imports of paper, news print paper
accounts for about one third. The remaining two thirds are accounted
for by all other kinds of paper. Having no other basis, we have allocated
two thirds of the total tax yield among different expenditure groups on
the basis of their expenditure on manufactured goods, while one third of
the yield is distributed on the basis of expenditure on periodicals and
newspapers.
6. Allopathic medicines, other drugs and patents
Allocation has been done on the basis of expenditure on allopathic
medicines.
B. Imports Mostly in the Nature of Intermediate Goods
There are a large number of intermediate consumption goods which
are imported from abroad but they are produced in the country also and
their uses are more or less the same. The allocation of the import duty
on all such imported intermediate goods as have supplementary domestic
production is the same as for the excises on intermediate goods domes
tically produced. A list of such goods is given below :

INCIDENCE OF INDIRECT TAXATION IN INDIA
Imports Domestic production
Chemical products
r. Manures, all sorts
i. Paints, colours and painters'
materials
j. Dyes and dye intermediaries
(i) Coupling dyes
(ii) Dye from coal for fast colours
(iii) Dye derived from coal tar
(iv) Dyeing and tanning sub
stances
\. Sodium compounds
;. Caustic soda
6. Soda ash and
nitrate of soda
7. Calcium carbide
8. Acids
(i) Acetyle salicylic acid
(ii) Acid olic
(iii) Betaoxy nephthoic acid
(iv) Acid phospheric
Petroleum products
9. Calcined petroleum coke
10. Asphalt, crude and refined coal
tar
11. All sorts of mineral and
industrial oils
12. Diesel oil
High speed diesel oil
13. Lubricating oil
14. Petroleum crude
15. Kerosene
16. Motor spirit
1. Fertilisers
2. Paints and varnishes
3. Synthetic organic dyestuff
4. Sodium silicate
5. Caustic soda and caustic
potash
6. Soda ash
7. Calcium carbide, bleaching
powder and sodium hydro-
sulphate
8. Acids
9- Coal, coke and patent fuel
10. Asphalt bitumen and coal
tar
11. Furnace oil
12. Refined diesel oil and disel
oil not otherwise specified
13. Blended or compounded
lubricating oils and greases
14. As in the case of petroleum
products
15. Kerosene oil
16. Motor spirit
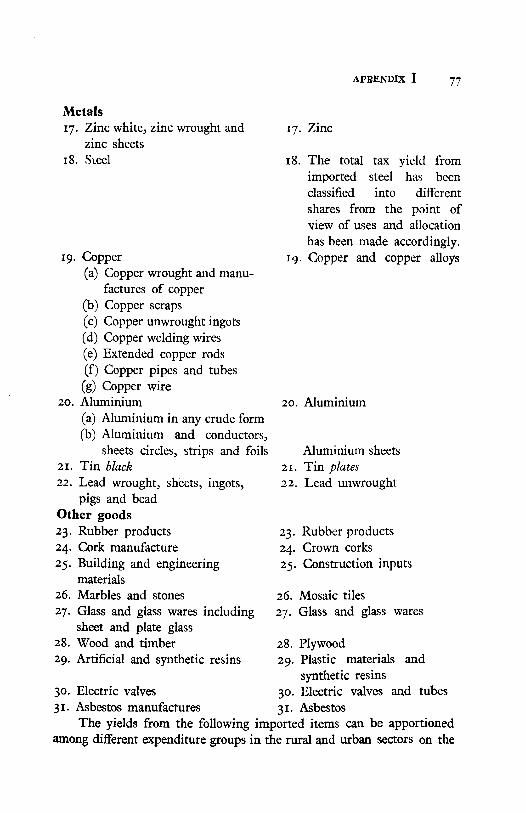
APBENDIX I 77
Metals
if. Zinc white, zinc wrought and
zinc sheets
18. Sieel
19. Copper
(a) Copper wrought and manu
factures of copper
(b) Copper scraps
(c) Copper unwrought ingots
(d) Copper welding wires
(e) Extended copper rods
(f) Copper pipes and tubes
(g) Copper wire
20. Aluminium
(a) Aluminium in any crude form
(b) Aluminium and conductors,
sheets circles, strips and foils
21. Tin black
22. Lead wrought, sheets, ingots,
pigs and bead
Other goods
23. Rubber products
24. Cork manufacture
25. Building and engineering
materials
26. Marbles and stones
27. Glass and glass wares including
sheet and plate glass
28. Wood and timber
29. Artificial and synthetic resins
17. Zinc
18. The total tax yield from
imported steel has been
classified into different
shares from the point of
view of uses and allocation
has been made accordingly.
19. Copper and copper alloys
20. Aluminium
Aluminium sheets
21. Tin plates
22. Lead unwrought
23. Rubber products
24. Crown corks
25. Construction inputs
26. Mosaic tiles
27. Glass and glass wares
28. Plywood
29. Plastic materials
synthetic resins
Electric valves and
Asbestos
and
30 tubes30. Electric valves
31. Asbestos manufactures
The yields from the following imported items can be apportioned
among different expenditure groups in the rural and urban sectors on the

78 INCIDENCE OF INDIRECT TAXATION IN INDIA
basis of expenditure on the relevant or related items as indicated in
each case. Where the treatment is different it is separately dealt with.
Imported goods NSS matching consumption
items
i. China clay
2. Chalk, lime (special kind)
3. Cement, not otherwise specified
4. Hides and skins (raw and salted)
5. Coral, cowries and shells
6. Ivory manufactured
7. Seeds not otherwise classified
8. Rubber seeds
9. Hops (agent for beer and
medicines)
10. Barks and tanning
11. Cutch and gambier material
(used by gold heaters)
12. Gums, resins and lac
13. Plumbago and graphite
14. Printers ink
15. Essential synthetic oil
16. Fur skins
1. China clay crockery—only in
the urban sector for the
groups with per capita mon
thly expenditure exceed
ing Rs. 55.
2. Tooth paste, tooth powder
3. House rent in the urban
sector only
4. Leather goods in the urban
sector only for the per
capita monthly expen
diture groups of Rs. 75 and
above
5. Ornaments
6. Ornaments
7. Agricultural goods
8. Rubber products
9. 50 per cent allopathic me
dicine and 50 per cent
foreign liquor
10. Leather goods
11. Ornaments
12. Plastic goods
13. Stationery articles
14. Books, periodicals and
newspapers
15. Refined oil
16. For the per capita monthly
expenditure group of Rs.
100 and above in the urban
sector under the head
woollen fabrics

APPENDIX 1 79
17. Wood pulp
18. Silk worm cocoon
19. Wool raw and wool tops
20. Raw cotton
21. Raw flax, jute, raw hemp
22. Sisal and aloe fibre
23. Staple fibre
24. Artificial silk yarn
25. Yarn (excluding cotton yarn)
26. Glass bead and false pearls
27. Gold and silver sheets and
plates
28. Brass rods brass wires
29. Yellow metal alloys
30. Plastic and rubber insulated
wires
31. Electrical accessories made of
plastics
32. Batteries
33. Molasses
34. Batteries for motor vehicles
35. Articles made of stone or
marble
36. Some othu: chemicals
37. Saccharine alkaloids of opium
and their derivatives and iodine
in any crude form
38. Paints, solutions and composi
tions containing petroleum
39. Silver wire, gold plates and
gold leaf
40. Stainless steel plates, sheets and
strips
41. Brass pipes, tubes and ingots
17. As in case of paper
18. Silk cloth
19. Woollen cloth
20. Cotton fabrics
21. Jute fabrics
22. Superfine cotton fabrics
23. Cotton superfine fabrics
24. Artificial silk
25. Artificial silk
26. Ornaments in th: urban
sector
27. Gold and silver ornaments
28. Brass utensils
29. Ornaments
30. Electricity
31. Electricity
32. 50 per cent radios and
50 per cent torches
33. Alcohol
34. Motor vehicles
35. House rent in urban area
in the per capita monthly
expenditure group of
Rs. 100 and above
36. As in the case of chemicals
as a whole for Central
excise
37. On the basis of expenditure
on allopathic medicines
38. Paints and varnishes
39. Gold and silver ornaments
40. Steel utensils
41. Fifty par cent on th? bisis

80 INCIDENCE OF INDIRECT TAXATION IN INDIA
of expenditure on manu
factured goods and fifty
pei cent on brass utensils
42, Earthenware pipes and sanitaryware 42. 50 per cent on earthenware
and 50 per cent on resi
dential rent both in the
urban sector for the groups
with per capita monthly
expenditure of Rs.75 and
above.
The yield from the following items has been allocated to different
expenditure groups on the basis of their expenditure on manufactured
goods.
Titanium dioxide; ball bearings; roller bearings; all articles other
wise not specified; sulphur; jute bailing hoops; gums and stick on seed
lac; batteries not otherwise specified; nickel pellets; covered crucibles
for glass making; all non-ferrous alloys not otherwise specified; hard
ware iron mongering; non-ferrous nickel alloys; packing engine; 'litho-
pone; metallic ores all sorts; twist and yarn of flax and jute; nichrome
and other electrical resistance wires; all non-ferrous metals; cobalt,
chromium, tungsten, etc., antimony oie in any form; paste board, milk
board and card board.
C. Imports of Capital Goods and Parts thereof
We can allocate only 10 per cent of the yield in 1973-74 assuming
the average life of the assets to be 10 years. The basis of allocation in
each case is indicated below:
Item Basis of allocation
1. Iron and steel-railway track 1. 50 per cent on the basis
of expenditure on manu
factured goods, and the
remaining 50 per cent on
the basis of passengers' rail
way fares
2. Cutlery all sorts (2) 2. Allocated to the groups in
the urban sector with per

APPENDIX I 81
3. Metal furnirure
4. Hurricane lanterns
5. Zip fasteners
6. Textile machinery
7. Printing and lithographic
presses
8. Agricultural implements
9. Dairy and poultry farming
appliances
10. Knitting machines
capita expenditure above
Rs. 75 on the basis of
their expenditure on cooked
food
3. 50 per cent on the basis
of expenditure on manu
factured goods, and the re
maining 50 per cent on the
basis of expenditure on
furniture
4. 15 per cent (CSO estimate)
is treated as capital for
mation and is allocated on
the basis of expenditure on
manufactured goods. The
remaining 85 per cent is
allocated to the per capita
expenditure group of
Rs. 100 and above in the
urban sector
5. As in the case of domestic
production but allocated
to the per capita expen
diture groups of Rs. 75
and above per month
6. As has been done in the
case of cotton and woollen
fabrics
7. Expenditure on books,
newspapers, journals and
periodicals
8. On the basis of expenditure
on agricultural goods
9. Expenditure on milk pro
ducts and poultry
10. Expenditure on knitted
garments (including cotton
millmade, cotton hand-
loom, cotton khadi and wool,
art silk and pure silk)

82 IXCIDENTCE OF INDIRECT TAXATION Ix\T INDIA
11. Electric motors
12. Boot and shoe manufacturing
machinery
13. Cinema projecting apparatus
14. Oil crushing machinery
Petroleum gas well drilling
equipment
Refrigerating machinery
Sound recording appliances
Sugar manufacturing machinery
Machine for carding, spinning
wheel, cotton textile machinery,
textile machinery and parts and
looms of all kinds
Power distribution transformers
Electrical instruments, apparatus
and appliances
16.
IT.
18.
19-
20.
21.
24.
25.
26.
Electric medical apparatus
Wireless transmission apparatus
Tramcars and components
Railway materials, components
and parts
Conveyance not otherwise
specified
Carriage carts and parts thereof
28. Sparking plugs
29.
30.
Single cylinder fuel injection
pumps
Nozzle holders
11. As in the case of domestic
production of electric
motors
12. As in case of footwear
13. Household expenditure on
cinema
14. Expenditure on all types of
edible oils
15. As in the case of petroleum
products
16. As in the case ofrefrigerators
17. Expenditure on cinema
18. Expenditure on sugar
19. On the basis of the propor
tions obtained in respect
of the domestic production
of textiles
20. As in the case of electricity
21. As in the case of domestic
production of electrical
appliances
22. Expenditure on allopathic
medicines
23. Expenditure on communi
cation
24. Expenditure on conveyance
in the urban sector
25. As in case of railway track
26. Expenditure on other con
veyance
27. Expenditure on road con
veyance
28. Expenditure on cars, motor
cycles and scooters
29. Expenditure on cars
30. Expenditure on motor
vehicles

APPENDIX I 83
31. Aeroplane parts 3I. Expenditure on hired con
veyance other than road,
water-ways and railways
32. Optical instruments 32. Expenditure on spectacles
33. Photographic instruments 33. As in the case of domestic
production of such instru
ments
34. Typewriters 34. As in the case of domestic
production
35. Office machines 35. 50 per cent treated as go
vernment purchases; the re
maining 50 per cent is
allocated on the basis of
expenditure on manufac
tured goods
In the case of the following capital goods the allocation of the tax
yield has been done on the basis of expenditure on manufactured goods:
Grinding wheels; Machinery like prime motors and boilers; Mining
machinery; Carbon electric; Ships and other vessels; Components of
machinery; Passenger lifts; Machinery and parts; Instruments, apparatus
and appliances.
D. Imports of Partly Capital Goods and Parts thereof
1. Other furniture
It is assumed that the whole of imported furniture is meant for
private household consumption for the group with per capita expen
diture of Rs. 100 and above in the urban sector. Thus the entire yield
is allocated to this group.
2. Electric fans
The entire yield is allocated to the group with per capita expenditure
of Rs. 100 and above in the urban sector under the head 'electric
fan'.

84 INCIDENCE OF INDIRECT TAXATION IN INDIA
3. Motor cycle, scooter and parts thereof
The entire yield is allocated to the group with per capita expenditure
of Rs. ioo and above in the urban sector under expenditure on scooters.
4. Motor cars
Government import is taken to be negligible. The whole of the
amount is allocated to the group with per capita expenditure of Rs. ioo
and above in the urban sector under the head of expenditure on car.
5. Complete wireless receivers
Allocated to the groups with per capita expenditure of Rs. ioo and
above in the urban sector under the head expenditure on radios.
6. Refrigerators and parts thereof
The allocation is the same as in the case of domestic production.
7. Sewing machines
Half of the yield is attributed to domestic use by the group with
per capita expenditure of Rs. ioo and above in the urban sector and
the remaining half is allocated to different expenditure groups on the
basis of expenditure on cotton and woollen fabrics.
8. Bicycles and parts thereof
Allocated to the households in the urban sector on the basis of ex
penditure on cycles.
9. Accessories of motor vehicles
The treatment is the same as in the case of domestic production of
motor vehicles.
10. Rubber products other than tyres and tubes
The allocation has been done in the same way as in the case of klo-
mestic production of rubber products other than tyres and tubes.

APPENDIX I 85
11. Brushes all sorts
The yield has been allocated to urban households with per capita
expenditure of Rs. 100 and above under the head expenditure on toilet
requistes.
12. Parts of shoe manufacturing machinery
Allocation has been done in the same way as in the case of shoes
produced domestically.
13. Parts of electric medical appliances
Allocation has been done on the basis of expenditure on allopathic
medicines.
14. Components and parts of amplifiers and loud speakers
The allocation has been done on the basis of expenditure on radios.
It may be noted that duties on some of the imported goods which
were imported specifically for the government sector were ignored.
These are mainly animals all sorts, horses of value exceeding Rs 2000,
and globes for hurricane lanterns and chimneys and cadmium
sulphide and uranium oxide.
Ill STATE TAXES
A. Sales Taxes
As indicated in the text, we were able to obtain esitmates of com
modity-wise yield of sales tax (including Central sales tax) from 13 major
States. On this basis, the commodity-wise yield of sales tax in all India
(all States combined) was estimated.
The allocation of the burden of sales tax on commodities also sub
ject to excise duties was done in the same manner as for the latter. The
allocation of the burden of sales tax on other commodities did not raise
any special problems as there were more or less corresponding entries in
the NSS consumption data.
B. Electricity Duty
Statistical Abstract of the IndianUnion, published by the CSO gives
a detailed break-up of the uses of electricity in quantity for all the States

86 INCIDENCE OF INDIRECT TAXATION IN TNDTA
and Union territories taken together and also for individual States and
Union territories. The latest Abstract Available is for the year 1974.
which contains data for 1972-73. According to this information, the share
of each type of use in the total consumption of electricity is as follows:
Million kWh
1. Domestic
2. Commercial
3. Industrial power at low and mediuir
voltage
4. Industrial power at high voltage
5. Agricultural
6. Traction
7. Public lighting
8. Public water works and sewage
pumping
9. Miscellaneous
TOTAL
4309
2852
1
4546
27698
5918
1761
520
1094
390
49088
Percentage of total
8.78
5.81
9.26
564312.06
3-59
1.06
2.23
0.78
100.00
In the absence of any other information, the share attributable to
public lighting, public water works and sewage pumping and miscel
laneous (all taken together) has been distributed among various expen
diture groups on the basis of rents paid (actual as well as imputed) by
urban households. This allocation is based on the assumption that, in
the final analysis, the urban house dwellers bear the burden according
to the housing facilities enjoyed by them. The share for agricultural
use has been distributed on the basis of household expenditure on agri
cultural goods. The share of traction has been allocated on the basis
of expenditure on railway fares and expenditure on manufactured goods,
each getting 50 per cent.
C. Motor Vehicles Tax
The Motor Vehicles Tax collections can broadly be classified under
(i) motor cycle; (ii) private cars (including jeeps); (iii) taxis inclusive of
autorikshahs; (iv) buses (P.S.V.); (v) goods vehicles; and(vi)miscellaneous.
The t?x revenue figures for each of these groups arc available from
the CSO's annual publicatior, Statistical Abstract of the Indian Union. The
latest information related to the year 1970-71. The relative shares of
the tax revenue of each of those groups obtaining in 1970-71 have been

APPENDIX Sj
assumed for 1973-74 also. In the case of motor cycles, private cars and
taxis, the distribution among the various expenditure groups in the rural
and urban sectors has been done in accordance with the relative shares
of expenditure on these items as given in tne NSS. However, care has
been taken to deduct 4 per cent of the total tax yield (share of govern
ment vehicles) before the allocation. In the case of buses the allocation
has been done on the basis of expenditure of households on bus fares.
As regards goods and miscellaneous vehicles, 50 per cent of tax yield
has been distributed among the various expenditure groups on the basis
of expenditure on agricultural goods and the remaining 50 per cent on
the basis of expenditure on manufactured goods.
D. Goods and Passengers Taxes
The report of the Taxation Enquiry Committee, Uttar Pradesh, 1974
gives data on the tax burden of the passengers tax (on 52-seated buses)
and goods tax (on trucks with 9 tonnes RLW and 13 tonnes RLW) for
1972-73. The information is available for 8 States, namely, Uttar
Pradesh, Karnataka, Kerala, Tamil Nadu, Andhra Pradesh, Bihar, Gujarat
and Madhya Pradesh. Such data are also available for Maharashtra.
Information regarding the number of vehicles registered in India with the
above break-up is available from Statistical Abstract of the Indian Union,
1974. The number of buses (52-seated) has been multiplied by the tax
burden to get the total yield from the passengers tax. A similar exercise
has been done for trucks (9 tonnes and 13 tonnes RLW) to get the total
tax yield from goods tax. The proportions between the two tax yield
figures have been applied to the all-India figure of passengers and goods
tax yield in 1973-74 to work out the share of each of the items. The
share allocated to passengers tax has been distributed among various ex
penditure groups on the basis of expenditure on bus fares; 50 per cent
of the share of goods tax has been distributed on the basis ofexpenditure
on agricultural goods and the remaining 50 per cent on the basis of ex
penditure on manufactured goods.
E. State Excise Duty
On the basis of the average of the figures, obtained from Uttar
Pradesh, Gujarat, Kerala, Madhya Pradesh, Maharashtra, Punjab,
Rajasthan and West Bengal, we have broken down the aggregate tax
yield into the following groups; (i) country spirit, (ii) country fermented
liquor, (iii) opium and (iv) foreign liquor. The distribution has been
done on the basis of expenditure on these items. Country spirit has
been taken to represent country liquor and country fermented liquor
has been taken to represent toddy.

8 8 INCIDENCE OF INDIRECT TAXATION IN INDIA
F. Entertainment Tax
On the basis of data obtained for four States, namely, Uttar Pradesh,
Karnataka, Maharashtra and Punjab, the aggregate tax collection figure
is broken down into: (i) cinema theatre and (ii) 'fair'. The share of
each group has been distributed among various expenditure groups on
the basis of expenditure on the two groups of items.
G. Other taxes
They include mostly cess on sugarcane, tax on raw jute, tobacco
duty and betting tax. The cess on sugarcane has bean distributed on
the basis of household expenditure on sugar and the raw jute tax has
been allocated on the basis of expenditure on manufactured goods and
agricultural goods as in case of intermediate consumption of jute. To
bacco duty has been allocated on the basis of expenditure on tobacco.
Betting tax has been allocated on the basis of household expenditure on
fair.

Appendix II
THE METHOD OF ESTIMATING GOVERNMENT SHARE
OF INDIRECT TAXES
For the purpose of measuring the incidence of indirect taxation
on households as discussed earlier, it has been decided that the share
of the tax revenues attributable to general government consumption
and capital formation should be excluded from the computation. The
taxes paid by the Government on goods purchased for consumption or
capital formation represent only accounting transfers and hence they
need not be considered io result in a net burden on the private sector.
It might be indicated that government consumption is measured by the
current expenditure on goods and services and wages of only the govern
ment administrative departments including defence. Government
capital formation is normally taken to include capital formation by the
government administrative departments as well as by the departmental
enterprises of the Government. For the purpose of the present study,
however, we have excluded capital formation by the departmenal enter
prises.
Full details of commodity-wise information on purchases made
by the Central government, State governments and the local authorities
are not available. The Director General of Supplies and Disposal (DGS
& D) publishes, annually, Directory of Government Purchases, giving
commodity-wise values of purchases made by the Governments. The
DGS & D data, however, suffer from three main limitations. Firstly,
the coverage of the data is partial because there are no statutory require
ments for all the Central and State government agencies to make pur
chases only through DGS & D. Secondly, government purchases of
less than Rs. 20,000 in the case of defence and Rs. 5,000 in case of other
ministries are made directly by government departments and other
government agencies, a greater part of which is not reflected in the pur
chases shown in the Directory. Thirdly, separate information on pur
chases made by the administrative departments of the Central and State
governments and those by departmental and non-departmental under-

90 INCIDENCE OF INDIRECT TAXATION IN INDIA
takings of the Central and State governments is not available. The
information contained in the Directory gives only a break-up into fa)
purchases made through DGS & D, and (b) orders placed directly by
the government departments, government undertakings, etc. On the
basis of this break-up, it is not possible to segregate the share of pur
chases made by government administrative departments.
Information contained in the Input-Output Table for India, 1963,
could not be used for the reason that the estimates relate to the year
1963 and since then the pattern of government consumption has under
gone a great change.
Again, the estimates of fixed capital formation given in the Input-
Output Table for India relate to the entire economy and separate infor
mation for the government administrative departments is not pro
vided. For more or less the same reasons, we could not use also the
information contained in the Material and Financial Balances, 1966 for
drawing estimates of purchases of different categories of commDdities
by the government sector.
In the absence of any other source of information for the present
study, reliance has been placed on the information on public consump
tion contained in the Technical Note of the Planning Commission (See
A Technical Note on the Approaches to the Fifth Plan of India 1974-79,
published in 1973). The Technical Note gives information on the value
of purchases made by the Government for consumption(public consump
tion) in 1973-74 at 1971-72 prices along with the value of total gross
output in the economy and the total value of imports for a large number
of commodities.
A list of goods purchased for public consumption along with the
value of purchase in the year 1973-74 at 1971-72 prices for each item
as contained in the Planning Commission's Technical Note is given below.
It might be pointed out that the gross value of output includes the value
of output used for intermediate consumption as well as for final uses.
The value of intermediate consumption does not enter into the picture
because such goods are purchased by entrepreneurial units of the eco
nomy (government and non-government) which are in a position to pass
on the incidence to households and government administrative depart
ments through the sale of their output.

APPENDIX II
TABLE A.5
Value of Public Consumption Goods in 1973-74
(Valued at 1971-72 Prices)
(Rs. crore)
s.
I
I.
2.
3
4
5
6
7
8
9
10
11
12
13
14
15
16
17
18
19
20
21
22
23
24
25
26
27
28
29
No. Item
2
. Animal husbandry
, Forestry
. Coal
. Sugar and guv
. Vegetable oil
. Tea and coffee
. Other food products
. Cotton textiles
. Jute textiles
. Other textiles
. Miscellaneous textile products
. Wood products
. Paper and paper products
. Leather products
. Rubber products
. Plastics
. Cosmetics and drugs
. Other chemicals
. Petroleum products
. Other non-metal mineral products
. Bolts and nuts
. Metal containers
. Other metal products
. Office domestic equipment
. Electric wires
. Electronics
. Batteries
. Electrical household goods
. Telephone and Telegraphs equipment
Public con
sumption
3
2.1
16.4
1.8
0.6
0.6
1.2
25.4
2/4
63.5
38.9
14.5
45-9
64.6
11.2
25.7
1.8
2.5
4-4
27.6
i-3
0.9
5-7
29.9
4-7
32.4
19.0
6.1
8.0
i-4
Gross
output
4
4065.0
686.3
296.1
762.1
534-o
39J-5
2451.7
2350.0
413.6
588.6
688.5
381.2
239.2
191-9354.0
152.4
492.5
720.8
297.9
725.0
53-4
67.3
916.0
56.7
232.2
80.5
59.6
98.6
53-6

92 INCTOENCF OF INDIRECT TAXATION IN INDIA
30. Other electricals 57.1 260.7
31. Motorcycle 0.4 120.6
32 Motor vehicles 51.5 477-0
33. Ship and boats 7.6 43.7
34. Aircraft 4.5 40.5
35. Rail equipment 12.0 352.5
36. Other transport equipment 24.4 53.4
37. Miscellaneous scientific instrument 7.8 37.3
38. Other industries 6.2 433-8
39. Printing 4.1 176.1
40. Electricity 22.0 1025.3
41. Construction 350.4 4856.7
42. Railways 7.3 1203.0
43. Other transport 25.0 1476.9
44. Other services 3753-0 12454.3
Source : A Technical Note on the Approaches to the Fifth Plan
for India, 1974-79, Planning Commission, April 1973.
We find three types of goods purchased for government consump
tion : (i) some goods mostly in the nature of consumption goods; (ii) some
in the nature of capital goods; and (iii) the remaining in the nature of
services. Items 1 to 25 and 27 are consumption goods; item 26 and 28
to 38 and 41, are capital goods and items 39, 40, 42 and 44, services. In
ihe case of those goods which are mostly in the nature of consumption
goods, the procedure of estimating the Government share of indirect
taxes is simple. We have the ratios of the value of government consump
tion to the total value of output plus import in respect of each item. This
ratio has been applied to the total value of tax yield for each commodity
(including sales tax) separately to work out the share of tax yield allo-
cable to government consumption. In some cases, however, the break
up of government consumption in the necessary derail is not available.
In all such cases, many taxable items have been clubbed together to
make them comparable to government consumption items.
Expenditure on goods of a capital nature for defence purposes only
is treated as expenditure on consumption. The goods of a capital
natuia indicated in the above table under public consumption represent
goods meant for defence purposes. Most of these goods are free from
excise duties. Those which are subject to duties have been dealt with
in the same fashion as we have done in the case of goods mostly in the
nature of consumption goods.

APPENDIX II 93
The main difficulty arises in the case of capital formation. The
estimates of gross fixed investment given in the Technical Note include
capital formation in the government administrative departments. Item-
wise information on fixed investment by government administration,
however, is not available. The methodology followed for estimating
item-wise value of capital formation by the administrative departments
is as follows.
In the case of construction, following the CSO practice, it is assumed
that government construction falls into the category of those works which
need material inputs. They are covered by the commodity flow ap
proach of estimation of capital formation in India by the CSO. We
could obtain from the CSO value of construction falling into the cate
gory of commodity-flow approach broken up into government admini
stration and the rest. The amount cf tax yield worked out for construc
tion inputs can be broken up into government administration and the
rest on the basis of the ratio of the value of government construction in
1973-74 under the commodity-flow approach to the total value of cons-
struction under the commodity-flow approach.
For items of the nature of fixed capital investment in machinery
and equipment, we do not have separate item-wise break-up into govern
ment administration and the rest. In the case of motor cars and motor
cycles, however, the Directorate General of Technical Development was
in a position to give the percentage of total cars and motor cycles pro
duced (4 per cent) going to government administrative departments of
the Central and State governments. Therefore, 4 per cent of the tax
yield from cars and motor cycles has been taken as attributable to govern
ment administrative departments. The remaining items of capital
formation in government administration is taken to be negligible and
hence ignored. Construction in the government sector and purchase
of motor cars and motor cycles by the Government cover a very
large part of the capital formation by government administration
departments. According to the CSO, these two items cover about 95 per
cent of gross fixed investment in government administration.

STATISTICAL APPENDIX

TABLE
I
PerCapita
PerAnnumConsumerExpenditure,IndirectTaxBurdenandIndirectTaxburdenasPerCentof
ConsumerExpenditure
(1973-74)l
Monthly
percapitaexpenditure
group
(Rs.)
1
Totalconsumerexpenditure
Rs.Per
capitaperannum
Amount
oftaxRs.percapita
perannum
CENTRALTAXES
1.
Centralexcise
2.
Importduty
STATESTAXES
1.Stateexcise
2.
Salestax
3.Salestaxonmotor
spirit
4.
Motor
vehiclestax
5.Taxesongoodsand
passengers
6.
Entertainmenttax
7.Electricityduty
8.
Othertaxesand
duties
ALLINDIRECTTAXES
0—15
2
164.66
2.76
2.34
0.42
2.03
0.37
1.04
0.06
0.25
0.17
0.00
0.11
0.03
4.79
15—28
3
311.20
5.80
4.66
1.14
4.57
0.83
2.55
0.10
0.48
0.31
0.00
0.22
0.08
10.37
R
28—43
4
478.55
12.36
9.60
2.76
8.92
1.52
4.66
0.24
0.94
0.76
0.18
044
0.18
21.28
U
43—55
5
653.01
24.04
19.07
4.97
16.30
4.10
7.57
0.43
1.45
1.29
0.29
0-74
0.43
40.34
R
55—75
6
855.11
36.37
27.93
8.44
21.02
3.18+
10.46
0.73
2.14
2.03
0.73
1.21
0.54
57.39
A
75—100
7
1146.46
72.48
55.56
16.92
42.38
10.63
18.99
1.26
3.51
3.60
1.33
1.98
1.08
114.86
L
100and
above
8
1907.89
196.45
150.17
46-28
111.99
34.80
46.22
3.37
7.82
8.21
3.67
5.00
2.90
308.44
Allhouse
holds
9 713.74
35.38
27.46
8.12
21.72
5.22
10.01
0.64
1.88
1.78
0.61
1.04
0.54
57.30
C/l
H 55 H r u* w

TABLE
I(Contd.)
UL
78
Taxaspercentageofconsumer
'expenditure(percent)
CENTRALTAXES
1.68
1.86
2.58
3.68
4.25
6.32
10.3
0499
1.Centralexcise
1.42
i.5O
2.01
2.92
3.27
4.85
7.87
385
2.Im
port
duty
0.26
0.37
0.58
0.76
0.99
1.48
2.43
—TAXES
1.23
1.47
inc1£J1AACJ
1.23
1.47
1.86
2.50
2.46
3.70
587
304
1.Stateex
cise
(onliquor)
0.22
0.27
0.32
0.63
0.37
093
l'82
073
?'fa
JC8t
ax.
.0.
630.
820.97
1.16
1.22
l".6
62'
.42
1*40
3.Salestaxon
motor
spir
it0.04
0.03
0.05
0.07
0.09
011
018
009
4.Motor
vehi
cles
tax
O.i5
O.i5
0.20
0.22
0.25
0.31
041
026
5.Ta
xesongoodsandpassengers
0.10
0.10
O.lo
020
024
031
043
025
6.Entertainmenttax
0.00
0.00
0.04
0.04
0.09
0.12
0.19
009
7.El
ectn
atyd
uty
0.07
0.07
0.09
0.11
0.14
0.17
0.26
015
8Ot
her
taxesan
ddu
ties
0.02
0.03
0.04
0.07
0.06
009
015
008
ALLIN
DIRE
CTTAXES
2.91
3.33
4.45
6.18
6.71
H).o1
il\j
I'll
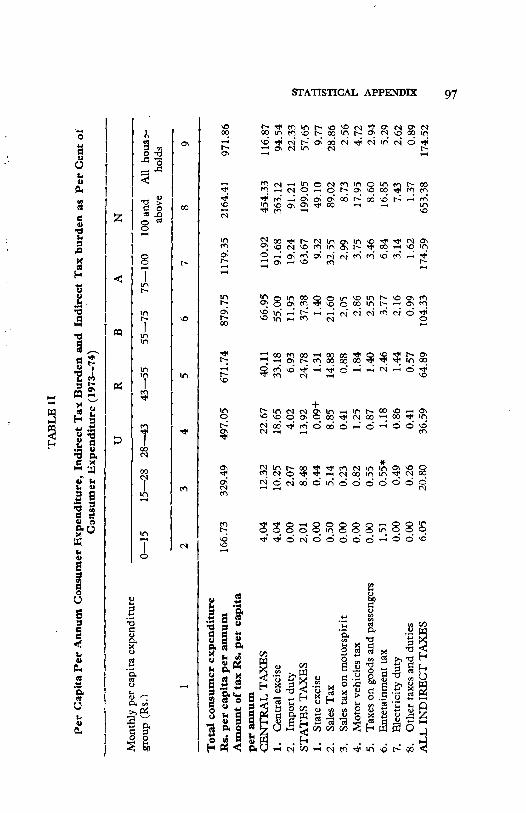
TABLE
II
Per
CapitaPerAnnumConsumerExpenditure,
IndirectTaxBurdenand
IndirectTaxburden
asPerCent
of
ConsumerExpenditure(1973—74)
Monthlypercapitaexpenditure
group
(Rs.")
0—15
UR
N
15—28
28—43
43—55
55—75
75—100
100and
All
housi-
above
holds
Totalconsumerexpenditure
Rs.percapitaperannum
Amount
oftaxRs.percapita
perannum
CENTRALTAXES
1.Centralexcise
2.
Importduty
STATESTAXES
1.
Stateexcise
2.
SalesTax
3.
Salestaxonmotorspirit
4.
Motor
vehiclestax
5.Taxesongoodsandpassengers
6.
Entetainmenttax
7.Electricityduty
8.
Other
taxesand
duties
ALLINDIRECTTAXES
166.73
329.49
497.05
671.74
879.75
1179.35
2164.41
971.86
4.04
4.04
0.00
2.01
0.00
0.50
0.00
0.00
0.00
1.51
0.00
0.00
6.05
12.32
10.25
2.07
8.48
0.44
5.14
0.23
0.82
0.55
0.55*
0.49
0.26
20.80
22.67
18.65
4.02
13.92
0.09+
8.85
0.41
1.25
0.87
1.18
0.86
0.41
36.59
40.11
33.18
6.93
24.78
1.31
14.88
0.88
1.84
1.40
2.46
1.44
0.57
64.89
66.95
55.00
11.95
37.38
1.40
21.60
2.05
2.86
2.55
3.77
2.16
0.99
104.33
110.92
91.68
19.24
63.67
9.32
32.55
2.99
3.75
3.46
6.84
3.14
1.62
174.59
454.33
363.12
91.21
199.05
49.10
89.02
8.73
17.95
8.60
16.85
7.43
1.37
653.38
116.87
94.54
22.33
57.65
9.77
28.86
2.56
4.72
2.94
5.29
2.62
0.89
174.52

u
2
TABLE
R
3
II
4
(Contd.)
B
5
A
67
N
89
Taxaspercentageofconsumer
expenditure(percent)
2
—.—
n
CENTRALTAXES
1.Centralexcise
2.
Importduty
STATESTAXES
1.Stateexcise(onliquor)
2.
Salestax
3.
Salestaxonmotor
spirit
4.Motor
vehi
cles
tax
0.00
0.25
0.25
0.27
0.33
0.32
0.83
049
>5.
Taxe
son
good
sandpassengers
0.00
0.17
0.18
0.21
0.29
0.29
0.40
030
§6.
Entertainmenttax
~'-
7.Electricityduty
8.
Othertaxesand
duties
ALLINDIRECTTAXES
2.42
2.42
0.00
1.21
0.00
0.30
0.00
0.00
0.00
0.91
0.00
0.00
3.63
3.74
3.11
0.63
2.57
0.13
1.56
0.07
0.25
0.17
0.17
0.15
0.08
6.31
4.66
3.75
0.81
2.80
0.02
1.78
0.08
0.25
0.18
0.24
0.17
0.08
7.36
5.97
4.94
1.03
3.69
0.20
2.22
0.13
0.27
0.21
0.37
0.21
0.08
9.66
7.61
6.25
1.36
4.25
0.16
2.46
0.23
0.33
0.29
0.43
0.25
0.11
11.86
9.41
7.77
1.63
5.40
0.79
2.76
0.25
0.32
0.29
0.58
0.27
0.14
14.80
20.99
16.78
4.21
9.20
2.27
4.11
0.40
0.83
0.40
0.78
0.34
0,06
30.19
12.03
9.73
2.30
5.93
1.01
2.97
0.26
0.49
0.30
0.54
0.27
0.09
17.96

TABLE
III
PerCapitaPerAnnumConsumerExpenditure,
IndirectTaxBurdenand
IndirectTaxBurden
asPerCentof
ConsumerExpenditure(1973-74)
RURAL
ANDURBAN
COM
BIN
ED
Monthlypercapitalexpenditure
group
(Rs.)
0—15
15—28
28—43
43—55
55—75
75—100
100
and
Allhouse-
above
holds
1
Totalconsumer
expenditure
Rs.percapitaperannum
164.75
312.91
481.29
656.57
Amount
oftaxRs.percapita
perannum
CENTRALTAXES
2.83
6.41
13.88
27.10
1.Centralexcise
2.43
5.18
10.94
21.76
2.
Importduty
0.40
1.23
2.94
5.34
STATESTAXES
2.04
4.94
9.67
17.90
1.Stateexcise
0.35
0.79
1.30
3.57
2.
Salestax
1.02
2.79
5.28
8.96
3.
Salestaxonmotor
spirit
0.05
0.11
0.27
0.51
4.
Motor
vehiclestax
0.24
0.52
0.99
1.53
5.Taxesongoodsand
passengers
0.16
0.34
0.78
1.31
6.
Entertainment
tax
0-08
0.05
0.33
0.70
7.Electricityduty
0.11
0.24
0.50
0.87
8.
Othertaxesandduties
0.03
0.10
0.22
0.45
ALLINDIRECTTAXES
4.87
11.35
23.55
45.00
860.75
43.37
34.13
9.24
24.76
2.77+
13.01
1.03
2.31
2.15
1.43
1.42
0.64
68.13
1155.78
2006.09
83.38
65.80
17.58
48.43
10.26
22.84
1.75
3.58
3.56
2.89
2.31
1.24
131.81
295.14
231.67
63.47
145.30
40.27
62.60
5.42
11.70
8.36
8.71
5.93
2.31
440.44
765.13
51.77
40.82
10.95
28.88
6.12
13.76
1.03
2.45
2.01
1.54
1.36
0.61
80.65
NO

TABLE
III
(Contd.)
RURAL
AND
URBAN
COMBINE
Tax
aspercentageofconsumer
expenditure(percent)
CENTRALTAXES
1.Centralexcise
2.
Importduty
STATESTAXES
1.Stateexciseon
(liquor)
2.
Salestax
3.Salestaxonmotor
spir
it
4.
Motor
vehiclestax
5.Taxesongoodsand
passengers
6.Entertainmenttax
7.Electricityduty
8.
Othertaxesandduties
ALLINDIRECTTAXES
1.72
1.47
0.24
1.24
0.21
0.62
0.03
0.15
0.10
0.05
0.07
0.02
2.96
2.05
1.66
0.39
1.58
0.25
0.89
0.04
0.17
0.11
0.02
0.08
0.03
3.63
2.88
2.27
0.61
2.01
0.27
1.10
0.06
0.21
0.16
0.07
0.10
0.05
4.89
4.13
3.31
0.81
2.73
0.54
1.36
0.08
0.23
0.20
0.11
0.13
0.07
6.85
5.04
3.97
1.07
2.88
0-33
1.51
0.12
0.27
0.25
0.17
0.16
0.07
7.92
7.21
5.69
1.52
4.19
0.89
1.98
0.15
0.31
0.31
0.25
0.20
0.11
11.40
14.71
11.55
3.16
7.24
2.01
3.12
0.27
0.58
0.42
0.43
0.30
0.12
21.96
6.77
5.34
1.43
3.77
0.80
1.80
0.13
0.32
0.26
0-20
0.18
0.08
10.54
aggregated
valueof
cons
umer
expe
ndit
ure
forth
eho
useh
old
sect
orca
lcul
ated
onth
eba
sis
ofNSS
data
islo
wer
than
theco
rres
pond
ingCSO
esti
mate
.TheNSS
estimateshave
ther
efor
ebeen
blownup
tomatch
theCSO
esti
-mates.
The
estimatesof
theconsumption
ofliquor
aspe
rNSS
data
isless
for
the
expendituregr
oup
Rs55
-75than
for
thegroup
Rs.
43-55.
NSS
cons
umer
expenditureon
coun
tryliquor
forth
eex
pend
itur
egr
oup
Rs.
28-43
isless
than
forth
eexpenditure
groupRs^
15-2
8.NSS
consumer
expe
ndit
ureoncinema
thea
tre
etc.,
isless
for
theexpenditure
groupRs
15-2
8than
forthegr
oups
Rs.
0-15
andRs.
28-43.
8P

STATISTICAL APPENDIX ioi
TABLE IV
Total Annual Cash Purchase Expenditure As Percentage of
Total Annual Expenditure
Monthly per capita
expenditure group
(Rs.)
0—15
15—28
28—43
43—55
55—75
75—100
100 and above
All households
Rural
Toral annual
cash purchase
expenditure as
per cent of total
annual expen
diture
64
6361
60
59
61
72
62
Urban
Total annual
cash purchase
expenditure as
per cent of total
annual expen
diture
81
93
93
94
93
93
96
94
All India
Total annual
cash purchase
expenditure as
per cent of total
annual expen
diture
6566
66
66
6770
82
70
Source: 28th NSS round, 1973-74.

INDEX 103
ad Valorem, 39
Budget incidence, 2
Capital goods, 4, 5, 21
Central excises, 20, 24
Central taxes, 20
Central Excise Year Book, 38
Commodity taxes, 5
Consumption goods, 21
Consumer goods, 26
Cumulative burdens, 9
Dey, Banamali, 6n
Differential incidence, 3
Elasticity of demand, 4
Elasticity of supply, 4
Electricity duty, 11,12
Entertainment tax, 12
Excise Tariff Book, 36, 38
Expenditure groups, 7,26
Expenditure taxes, 27
Factor of production, 4
Gandhi, Ved P., 6n
Governments' consumption, 11
Gross fixed investment, 93
Hannmant^a Rao, C. H., 6n
Import duties, J2
Income distribution, 7
Input output model, 9
Intermediate goods, 22
Intermediate products, 28
Incidence by type of goods, 21
Lydall and Ahmed, 7n
Ministry of Finance, 6
Money burden of indirect taxes, 33
Musgrave, 5
National Sample survey, 6
Neutral tax, 2
Orissa Taxation Enquiry Committee
Report, 7n
Patel, Arun S.,6n
Pathak, Mahesh T., 6n
Planning Commission, 10, 11
Real Income, 2
Rural sector, 18
Sales tax, 3, 4
Saluja, M. R.,9n
State excise on liquor, 12
Statistical Abstract of the Indian
Union, 85
Statistical Year Book-Central Excise,
12,13
Taxation Enquiry Commission, 6
Tax "matrix", 9
Taxes on exports, 12
Tax structure, 18
Technical Note on the Approaches to
the Fifth Plan of India, 11
Type of goods-consumption goods,
intermediate goods, capital goods, 21
Union excise, 12
Urban households, 26

Incidence of IndirectTaxation in India 1973-74
This book attempts to measure the incidence of indirect taxes
levied by the centre and the states in India foi the year 1973'74. As
these taxes account for about 80 per cent of the taxes levied by the
Centre and States, their incidence is of crucial importance and is a
subject matter of wide-spread interest'
Whilethisstudyemploysthesamebasicapproachastheearlierstudies by the Taxation Enquiry Commission ( I953'54) and the
Ministry of Finance, it jncorporates several methodological
improvements. The treatment of indirect taxes falling on general
government consumption, for example, represents an important
innovation. simitarly, the allocation of taxes falling on inputs has been
done on a far more scientific basis than in the earlier studies' The
availability of more disaggregated consumption as well as tax data and
theuseofinput.outputinformationhaveenabledamuchmoreaccurateallocation of tax burden than was attempted or possible earlier. And
for the first time, the detailed methodology has been presented for
information and evaluation. In terms of conceptual refinement and
methodologicalrigour,thepresentstudycanbesaidtomakeagreatadvance ovei earlier studies'
The book will be of interest not only to policy makers and
professional research workers in applied economics, but also to teachers
and students of economics at the post-gradlate level in all developing
countries.
Fe.p0
-"oCD
Po.Fs)
t2r{t$


