1
The Version of Scholarly Record of this Article is published in Clinical Psychological Science,
available online at: http://dx.doi.org/10.1177/2167702616672038. Note that this article may not
exactly replicate the final version published in Clinical Psychological Science.
Toffalini, E., Giofrè, D., & Cornoldi, C. (2017). Strengths and Weaknesses in the Intellectual
Profile of Different Subtypes of Specific Learning Disorder. Clinical Psychological Science, 5,
402–409. doi:10.1177/2167702616672038
Strengths and Weaknesses in the Intellectual Profile of Different Subtypes of Specific
Learning Disorder: A Study on 1049 Diagnosed Children
Enrico Toffalini1, David Giofrè2, and Cesare Cornoldi1
1Department of General Psychology, University of Padova, Italy. 2Natural Science and Psychology, Liverpool John Moores University, UK.
For correspondence:
Enrico Toffalini
E-mail: [email protected]
Paper accepted: August 31st 2016
Acknowledgments
We are grateful to the Italian Association for Learning Disability (AIRIPA) and to all the colleagues
who contributed in preparing data file, and in particular to E. Stoppa, A.M. Antonucci, C. Vio, F.
Brembati, and L. Bertolo.
1
Abstract
The present study analyzes whether and how the most common diagnoses within the Specific
Learning Disorder (SLD) category are characterized by different intellectual profiles. The issue is
relevant to the current debate on the unitary vs. decomposable nature of the SLD category and may
help define specific interventions. Intellectual profiles were obtained using the Wechsler
Intelligence Scale for Children-IV (WISC-IV) on 1049 children diagnosed with SLD using the
ICD-10 codes. Four major subsamples were compared: reading disorder, spelling disorder, disorder
of arithmetical skills, and mixed disorder of scholastic skills. The four main WISC-IV indexes
(verbal comprehension, perceptual reasoning, working memory, and processing speed) were
considered. Results showed that all SLD subgroups share similar weaknesses in working memory
and processing speed, but also showed that they are characterized by partly different intellectual
profiles. These specificities should be considered in the definition of SLD.
Keywords: WISC-IV, intelligence, specific learning disabilities, dyslexia, dyscalculia

2
The consideration of intelligence has always been crucial for the diagnosis of specific learning
disorders (SLDs). In particular, the hypothesis of a discrepancy between normal-to-high general
intellectual abilities and poor academic achievement has traditionally been stressed (Mercer, Jordan,
Allsopp, & Mercer, 1996). However, the traditional view of SLD has been criticized (e.g., Siegel,
1988). First of all, the dimensional distribution of academic and intellectual performances (i.e., a
continuum of severity with no break points) has been emphasized, raising doubts on the use of
specific cut-points (Francis et al., 2005; see also Branum-Martin, Fletcher, & Stuebing, 2013).
Another criticism concerns the fact that the discrepancy hypothesis treats intelligence as a unitary
construct, contrasting a single, overall measure of intelligence (i.e. the full scale intelligence
quotient [FSIQ]) with achievement measures. However, many formulations of the construct of
intelligence suggest that it can be better accounted for by considering different aspects (Carroll,
1993). Particularly in the case of children with SLD, using a battery of intelligence tests can help to
detect strengths and weaknesses that do not emerge when a unitary IQ is considered (Giofrè &
Cornoldi, 2015). In this respect, the different factor scores obtained using the Wechsler Intelligence
Scale for Children-IV (WISC-IV; Wechsler, 2003) –i.e. the most widely used tool for assessing
children intelligence in the Western countries (Evers et al., 2012)– can be useful.
Recent research has shown that the intellectual profile of children with SLD differs from that
of typically developing (TD) children. In particular, it has been shown that children with SLD,
despite good general intellectual skills, may present specific weaknesses in some cognitive abilities
that support academic learning, including working memory capacity (e.g., Cornoldi, Giofrè, Orsini,
& Pezzuti, 2014; De Weerdt, Desoete, & Roeyers, 2013; Giofrè & Cornoldi, 2015; Peng & Fuchs,
2016). With regard to the WISC-IV indexes, the verbal comprehension (VCI) and the perceptual
reasoning (PRI) indexes, which together compose the general ability index (GAI), are preserved in
children in SLD, while the working memory (WMI) and the processing speed (PSI) indexes, which
together compose the cognitive proficiency index (CPI), are deficient (Cornoldi et al., 2014; De
Clercq-Quaegebeur et al., 2010; Poletti, 2016). However, the extant research does not allow one to
3
firmly establish whether, within the broad SLD category, this pattern is confirmed and subgroups
with different intellectual profiles emerge. This issue is relevant given the contrasting evidence in
literature concerning the question of whether different cognitive and neuropsychological profiles
can actually help differentiate between children with different types of academic impairments
(D’Angiulli & Siegel, 2003; Swanson & Jerman, 2006; Willcutt et al., 2013), and given the recent
proposal by the DSM-5 (Diagnostic and Statistical Manual of Mental Disorders, 5th edition;
American Psychiatric Association [APA], 2013) to focus on the commonalities rather than on the
differences; hence, the use of a single diagnostic category (although specifiers for different areas of
impairment can still be adopted).
Previous research on differences in the neuropsychological functioning across different SLD
subtypes has produced relevant results and suggestions. So far, the main focus has been on the
comparison between the two apparently best distinguishable cases, i.e. specific disorder in the
reading area (i.e. dyslexia) and specific disorder in the arithmetical area (i.e. dyscalculia). Available
evidence suggests that both dyslexia and dyscalculia are characterized by a weakness in working
memory capacity (e.g. De Weerdt et al., 2013). However, despite the fact that deficits in visual
attentional capacity have also been reported (Bosse, Tainturier, & Valdois, 2007), dyslexia is
specifically marked by deficits in tasks requiring phonological processing (Landerl, Fussenegger,
Moll, & Willburger, 2009; Willcutt et al., 2013). On the contrary, dyscalculia is characterised by a
general weakness in visuo-spatial abilities, including visual-spatial problem solving, visual
perception, and even visuo-motor integration (Pieters, Desoete, Roeyers, Vanderswalmen, & Van
Waelvelde, 2012; Swanson & Jerman, 2006; Szucs, Devine, Soltesz, Nobes, & Gabriel, 2013; see in
particular Wilcutt et al., 2013, for a detailed investigation on the specific deficits in reading vs.
arithmetical disorder).
Some studies specifically used subtests taken from the WISC battery to describe the average
intellectual skills in children with different types of SLD. Notably, Rourke and Finlayson (1978)
found that children with arithmetic deficiencies performed worse than children with reading and
4
spelling deficiencies in the WISC subtests involving visuo-spatial abilities, whereas they were
superior in the subtests involving verbal abilities (see also Poletti, 2016). However, this result was
not replicated in a subsequent study, as verbal IQ was found generally lower in SLD than TD
children and reached the lowest level in children with arithmetical disability (D’Angiulli & Siegel,
2003).
It is also worth noting that many children with SLD receive diagnoses different from reading
or arithmetical disorder. For example, using the ICD-10 coding system (World Health Organization,
1993), children can also be diagnosed with specific spelling disorder and mixed disorder of
scholastic skills (i.e. with impairments in reading and/or spelling and in the arithmetical area).
Previous research has sometimes considered subgroups that have both reading and arithmetical
disorder, and found that they perform worse than children with isolated disorders in most tasks,
concluding that the cognitive deficits underlying the two disorders are additive (Landerl et al.,
2009). Concerning children with an isolated spelling disorder, clear evidence is missing and there is
only a suggestion that they could have an intellectual profile comparable to that of children with
reading disorder (Poletti, 2016).
In sum, whereas the DSM-5 has introduced a single diagnostic category for SLD, there is
evidence that different academic difficulties can be associated with different underlying intellectual
profiles. However, existing evidence is limited by the small sample size and the results are
inconclusive. In the present study we sought to overcome the limitations of previous research by
analysing a large sample of children who had received a clinical diagnosis of SLD based on the
ICD-10, and who had been administered the 10 basic subtests of the WISC-IV battery. We thus
invited Italian Centres diagnosing SLD to provide information on the ICD-10 diagnoses and the
WISC-IV scores obtained by recently diagnosed children.
Considering the four main WISC-IV indexes, we looked for evidence supporting the
observation that, independently from the subtype, the intellectual profile of children with SLD
would be characterized by a strength in verbal comprehension and perceptual reasoning, and a

5
marked weakness in working memory and processing speed (i.e. by a general ability index superior
to the cognitive proficiency index; Cornoldi et al., 2014; Poletti, 2016). By considering specific
subgroups, we aimed to examine whether SLD cases associated with different clinical categories
would be characterized by significantly different profiles. In particular, we hypothesized that: i) a
difference would emerge when comparing children with reading disorders vs. arithmetical
disorders, with lower visuo-spatial abilities in the latter case (Rourke & Finlayson, 1978); ii)
concerning children with mixed disorder, we hypothesized that they would be characterized by an
overall lower intellectual profile, due to the overlapping of different deficits (Landerl et al., 2009);
iii) based on the fact that children with spelling and reading disorders are both characterized by
difficulties in the written language, we hypothesized similar intellectual profiles.
Method
Participants
With the sponsorship of the Italian Association for Learning Disability (AIRIPA), we
obtained data on 1049 children and adolescents, aged between 7 and 16 years, all born in Italy, and
recently (after 2012) diagnosed with SLD. Children were assessed by a group of 27 licensed
psychologists with expertise in the assessment and treatment of learning disabilities, in clinical
centers located in eight major Italian regions (i.e. Piemonte, Lombardia, Veneto, Emilia-Romagna,
Toscana, Lazio, Puglia, and Campania). All participants received a diagnosis based on the ICD-10
coding system and met the criteria indicated in the National Italian Consensus Conference on SLD
published by the Italian Ministry of Health (Istituto Superiore di Sanità, 2010), specifically: a)
inclusion of academic achievement in specific areas below the 5th percentile, or more than 2 SDs
below average, as assessed using standardized tests (a detailed list of tests used during the
diagnostic process is reported in the Supplemental material available online), and b) exclusion of
any major influence of known socio-cultural, educational, emotional, intellectual, sensory and
neurological problems is excluded.

6
According to the ICD-10 coding system, cases were classified as specific reading disorder
(F81.0), specific spelling disorder (F81.1), specific disorder of the arithmetical skills (F81.2) or
mixed disorder of scholastic skills (F81.3); cases who had residual diagnoses within the F81
category (F81.8, F81.9), or who received an unclear diagnosis were not included in the sample.
Cases diagnosed with any comorbid neuropsychological condition coded by the ICD-10 at the time
of testing (e.g. attention-deficit hyperactivity disorders, developmental coordination disorder,
specific language impairment) were not included in the dataset. Some cases analyzed here (for a
total of 864 cases) had been examined in previous studies (Cornoldi et al., 2014; Giofrè & Cornoldi,
2015; Giofrè, Stoppa, Ferioli, Pezzuti, & Cornoldi, 2016), but none of the analyses discussed in this
paper were the object of said previous publication.
The 1049 cases fell into the four diagnostic categories as follows: 308 children (29% of the
entire sample) with reading disorder (F81.0; Mage = 11.72 [SD = 2.61]; 133 females, 168 males, 7
unspecified); 147 children (14%) with spelling disorder (F81.1; Mage = 10.88 [SD = 2.48]; 33
females, 107 males, 7 unspecified); 93 children (9%) with specific disorder of arithmetical skills
(F81.2; Mage = 12.59 [SD = 2.25]; 59 females, 32 males, 2 unspecified); and 501 children (48%)
with mixed disorder of the scholastic skills (F81.3; Mage = 11.56 [SD = 2.31]; 199 females, 254
males, 48 unspecified). Age differed significantly across groups, F(3,1045) = 9.82, p < .001, η2 =
.03. The female-male proportions significantly varied across groups, χ2(3) = 39.58, p < .001,
Cramer`s V = .20. Although statistically significant, these differences were small in terms of effect
size. In any case, we controlled for age and gender in all the subsequent analyses.
Instrument
The Italian adaptation of the WISC-IV (Orsini, Pezzuti, & Picone, 2012) with the four main
indexes (VCI, PRI, WMI, and PSI), the two additional indexes (GAI and CPI), and the FSIQ was
used.
7
Results
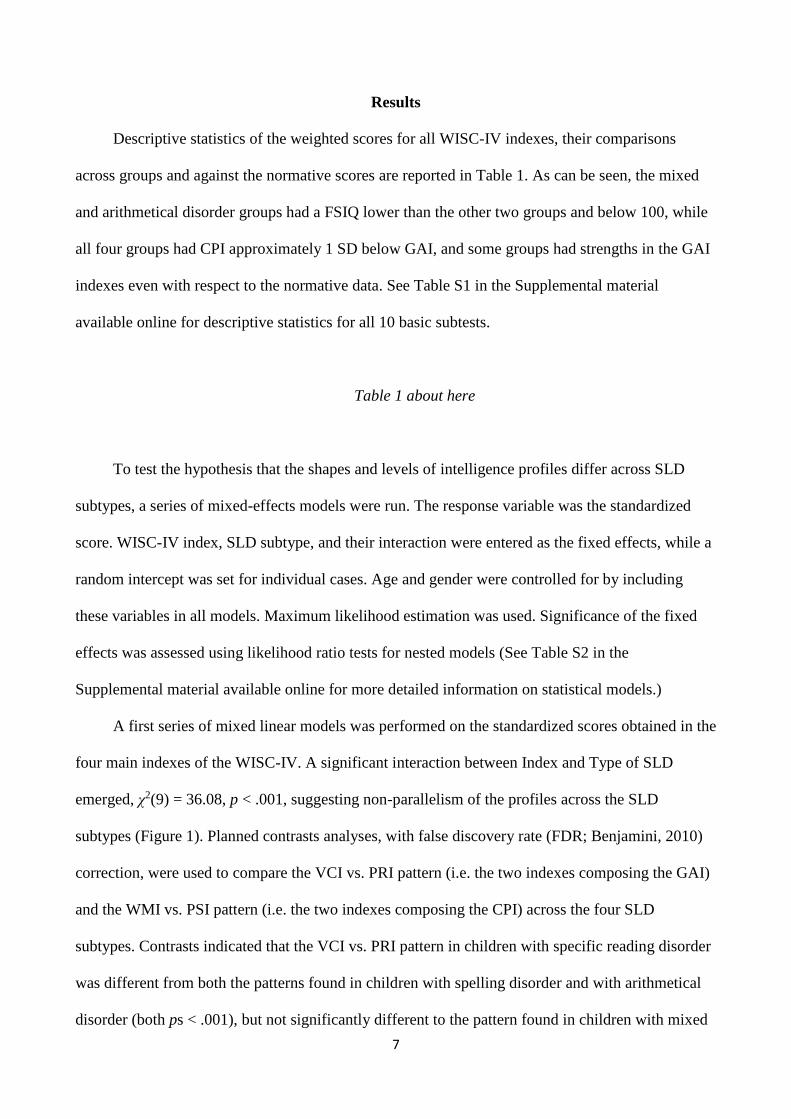
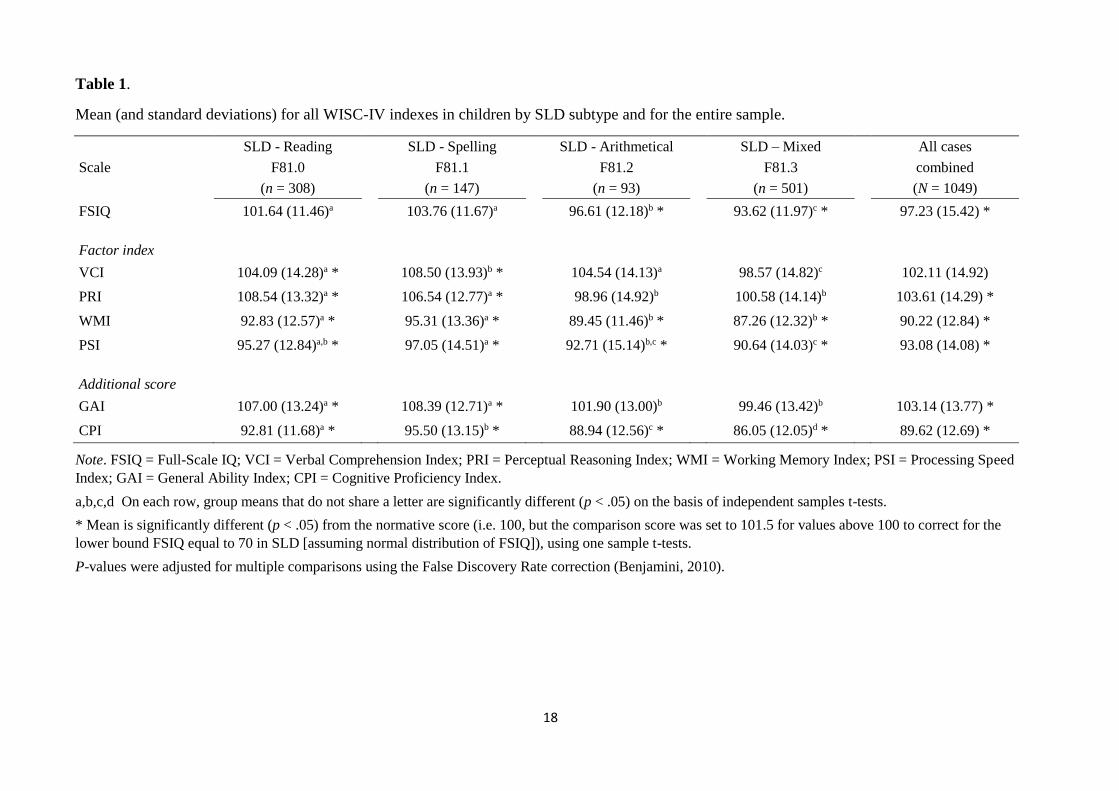
Descriptive statistics of the weighted scores for all WISC-IV indexes, their comparisons
across groups and against the normative scores are reported in Table 1. As can be seen, the mixed
and arithmetical disorder groups had a FSIQ lower than the other two groups and below 100, while
all four groups had CPI approximately 1 SD below GAI, and some groups had strengths in the GAI
indexes even with respect to the normative data. See Table S1 in the Supplemental material
available online for descriptive statistics for all 10 basic subtests.
Table 1 about here
To test the hypothesis that the shapes and levels of intelligence profiles differ across SLD
subtypes, a series of mixed-effects models were run. The response variable was the standardized
score. WISC-IV index, SLD subtype, and their interaction were entered as the fixed effects, while a
random intercept was set for individual cases. Age and gender were controlled for by including
these variables in all models. Maximum likelihood estimation was used. Significance of the fixed
effects was assessed using likelihood ratio tests for nested models (See Table S2 in the
Supplemental material available online for more detailed information on statistical models.)
A first series of mixed linear models was performed on the standardized scores obtained in the
four main indexes of the WISC-IV. A significant interaction between Index and Type of SLD
emerged, χ2(9) = 36.08, p < .001, suggesting non-parallelism of the profiles across the SLD
subtypes (Figure 1). Planned contrasts analyses, with false discovery rate (FDR; Benjamini, 2010)
correction, were used to compare the VCI vs. PRI pattern (i.e. the two indexes composing the GAI)
and the WMI vs. PSI pattern (i.e. the two indexes composing the CPI) across the four SLD
subtypes. Contrasts indicated that the VCI vs. PRI pattern in children with specific reading disorder
was different from both the patterns found in children with spelling disorder and with arithmetical
disorder (both ps < .001), but not significantly different to the pattern found in children with mixed
8
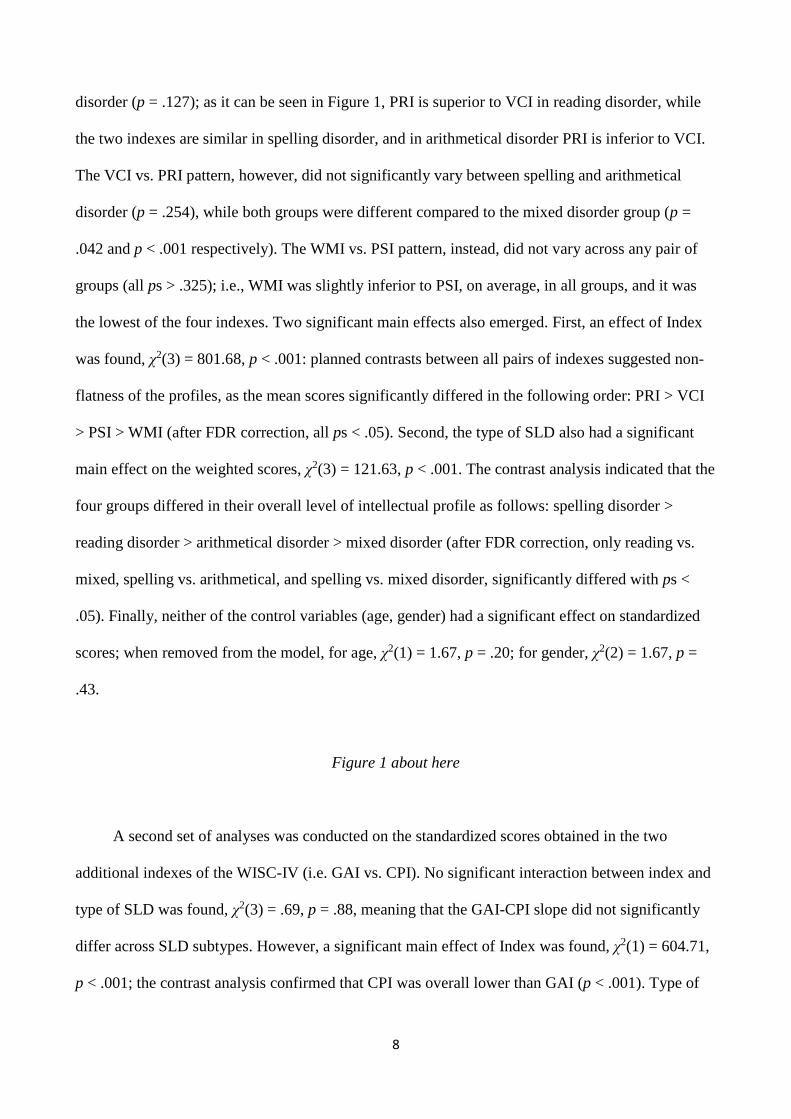
disorder (p = .127); as it can be seen in Figure 1, PRI is superior to VCI in reading disorder, while
the two indexes are similar in spelling disorder, and in arithmetical disorder PRI is inferior to VCI.
The VCI vs. PRI pattern, however, did not significantly vary between spelling and arithmetical
disorder (p = .254), while both groups were different compared to the mixed disorder group (p =
.042 and p < .001 respectively). The WMI vs. PSI pattern, instead, did not vary across any pair of
groups (all ps > .325); i.e., WMI was slightly inferior to PSI, on average, in all groups, and it was
the lowest of the four indexes. Two significant main effects also emerged. First, an effect of Index
was found, χ2(3) = 801.68, p < .001: planned contrasts between all pairs of indexes suggested non-
flatness of the profiles, as the mean scores significantly differed in the following order: PRI > VCI
> PSI > WMI (after FDR correction, all ps < .05). Second, the type of SLD also had a significant
main effect on the weighted scores, χ2(3) = 121.63, p < .001. The contrast analysis indicated that the
four groups differed in their overall level of intellectual profile as follows: spelling disorder >
reading disorder > arithmetical disorder > mixed disorder (after FDR correction, only reading vs.
mixed, spelling vs. arithmetical, and spelling vs. mixed disorder, significantly differed with ps <
.05). Finally, neither of the control variables (age, gender) had a significant effect on standardized
scores; when removed from the model, for age, χ2(1) = 1.67, p = .20; for gender, χ2(2) = 1.67, p =
.43.
Figure 1 about here
A second set of analyses was conducted on the standardized scores obtained in the two
additional indexes of the WISC-IV (i.e. GAI vs. CPI). No significant interaction between index and
type of SLD was found, χ2(3) = .69, p = .88, meaning that the GAI-CPI slope did not significantly
differ across SLD subtypes. However, a significant main effect of Index was found, χ2(1) = 604.71,
p < .001; the contrast analysis confirmed that CPI was overall lower than GAI (p < .001). Type of
9
SLD also had a significant main effect on standardized scores, χ2(3) = 130.52, p < .001 (contrast
analysis is not reported here as it is redundant after the first set of analyses).
Discussion
To the best of our knowledge, this is one of the largest studies examining the intellectual
profiles of children with a diagnosis of SLD. In particular, we analysed cases diagnosed on the basis
of one of the most widely used classifications for psychological disorders, i.e. the ICD-10 system,
proposed by the World Health Organisation (1993) and adopted in many countries including Italy.
The ICD-10 represents the international alternative to the American DSM; although the two
systems share many points, the last version of the DSM (DSM-5; APA, 2013) diverges on the
consideration of SLD types, as it proposes that a single category be used.
At a first observation of our sample, it emerged that mixed disorder (F81.3) was the single
most frequently used ICD-10 category for SLD. This is consistent with evidence that in the general
population impairments of different types tend to co-occur rather than being isolated (as reported by
the DSM-5; see also Willcutt et al., 2013). However, there were also large groups of children who
received diagnoses which only mentioned specific aspects of deficient learning; the most frequent
isolated diagnosis was reading disorder (F81.0), followed by spelling disorder (F81.1). The
relatively large presence of children with a specific spelling problem, in absence of a reading
problem, could be due to the characteristics of Italian, where –due to its transparent nature– reading
errors may be easily avoided but children may have difficulty writing out words correctly especially
under pressure or when specific features (e.g. geminates, accents) must be added. The arithmetic
disorder (F81.2) was the smallest subgroup in our sample; this is consistent with the notion that
“pure” dyscalculia is relatively infrequent, as in most cases it is associated with literacy-related
disorders (Butterworth, 2004).

10
As the main study goal, we tested the hypothesis that children in different SLD categories
would differ not only in terms of their academic difficulties, but also at the underlying level of
intellectual skills. To this purpose, we tested whether the WISC-IV intellectual profile would differ
across SLD subtypes. Having a very large data sample at our disposal, we could obtain precise
estimates of the average levels of the WISC-IV indexes in the four groups.
The four SLD subgroups showed many similarities. This result supports the decision to
introduce a single SLD category (see the DSM-5; APA, 2013). In particular, the most evident
weakness, i.e. CPI below GAI by around 1 SD (with WMI reaching the lowest level in all groups)
was shared across SLD subtypes. The fact that a similar GAI-CPI discrepancy was noticed across
all subgroups is in line with the observation that working memory and processing speed are crucial
for the successful acquisition of skills in different areas of academic learning (Bull, Espy, & Wiebe,
2008; Compton, Fuchs, Fuchs, Lambert, & Hamlett, 2012; Savage, Lavers, & Pillay, 2007; Peng &
Fuchs, 2016). It is worth noting, however, that the deficit in the CPI may not have the same
implications in all subgroups: the CPI is only a few points below the normative data in the reading
and spelling disorders, but around 1 SD below it in the mixed disorder.
Strengths presented more differentiated patterns across the groups, as compared to
weaknesses. PRI reached the highest level –and was significantly above the normative data– in
reading disorder, bringing some support to the controversial hypothesis of an above-average level in
visuo-spatial abilities in dyslexia (von Károlyi, Winner, Gray, & Sherman, 2003; but see also
evidence on visual attention span deficit in dyslexia, e.g. Bosse et al., 2007), while it was relatively
lower in arithmetical disorder, in line with findings indicating perceptual and visuo-spatial deficits
in children with dyscalculia (Pieters et al., 2012; Rourke & Finlayson, 1978; Swanson & Jerman,
2006); however, also note that PRI in dyscalculia was not significantly below the normative data.
Concerning the spelling disorder, the intellectual profile was similar to that found in reading
disorder both in terms of the overall level and the profile’s shape; this finding may suggest that
reading and spelling disorders could be characterized by a common cognitive profile associated
11
with impairments in the elaboration of written language. However, the specific VCI-PRI pattern in
spelling disorder differed from that in reading disorder, as in the former case the two indexes were
not differentiated, while in reading disorder there was a superiority of PRI over VCI. Note that
reading and spelling disorder were marked by a GAI in the normal range but significantly higher
than the normative sample; as the GAI index is known to be more related to g-factor than the CPI
(Giofrè & Cornoldi, 2015). This may suggest that the core intellectual functions could be even
above average in certain categories of children who receive a diagnosis of SLD. Finally, our results
indicated that children with mixed disorder are characterized by the lowest intellectual profile
among the four groups. This finding brings support to the hypothesis that cognitive deficits
underlying academic impairments in SLD are additive (Landerl et al., 2009).
Taken together our results seem to indicate that the SLD category is an umbrella term,
characterized by many similarities, but in which it is eventually possible to maintain a distinction
based on specific areas of impairment which are associated with partly different patterns of
intellectual functioning. This further stresses the importance of adopting the specifiers that the
DSM-5 uses within the SLD category.
Our result may also offer useful insight for clinical practice. As for the assessment, while the
SLD diagnosis mainly focuses on the discrepancy between overall IQ and achievement, our results
seem to indicate that the particular discrepancies within the intellectual profile should also be taken
into account. Furthermore, when planning an intervention it is important to be aware of the specific
strengths and weaknesses of each case. Knowing how intellectual strengths and weaknesses vary
partially but systematically across SLD subtypes can be a first step in this direction. Indeed,
previous research showed that cognitive indicators can predict the response to intervention of
children with SLD and are more predictive than other variables such as achievement and
demographic information (Compton et al., 2012). One possible implication is that children with
SLD and with different cognitive profiles can effectively respond to different treatments based on

12
their cognitive profiles. However, caution should be exercised as the evidence is scarce on this and
future studies are warranted to address this issue.
Despite its important theoretical and clinical implications, this study has a number of
limitations that should be addressed in future research. A first limitation is that we relied on the
diagnoses made by different clinicians, and the exact achievement scores obtained by the children
were not available. Future research should also investigate the specific relationship between a
particular intelligence profile and the related learning achievement, with comparisons both between
and within SLD subtypes. Second, in Italy the diagnosis of SLD does not apply to children with
impairments in reading comprehension, written expression, and mathematical reasoning skills;
however, it would be interesting to also analyse these profiles. Finally, as a new version of the
Wechsler scale (i.e., the WISC-V) is now available in a few countries, it will be important to
investigate how the present pattern of results may apply to it. In this new scale, for example, two
new indexes have been included (i.e., the Visuospatial and the Fluid Reasoning), and few new
subtests had been introduced. Although there were some changes in the subtests and in the indexes,
the structure of the WISC-V appears to be quite similar to the previous version. For this reason, a
similar cognitive profile of children with SLD in the two version of the scale (i.e., WISC-IV and V)
can be hypothesized. However, caution must be applied as the two versions are not entirely
identical. Finally, further research should examine the consequences of a possible earlier presence
of a specific language impairment (SLI), which we did not consider; in fact, SLI and SLD have
been sometimes considered as different manifestations of the same underlying problem, only
differing in the severity or in the developmental stage (Bishop & Snowling, 2004).
To sum up, we offered a general overview of the average intellectual profiles associated with
the most common SLD subtypes. While it appears that all subtypes are characterized by a
heterogeneous profile, marked by a fundamental GAI-CPI discrepancy, they have also some
specificities (Cornoldi et al., 2014; Poletti, 2016). The data reported here suggests that considering

13
the pattern of similarities and specificities across SLD subtypes is important on theoretical grounds,
and may have consequences for the assessment and intervention with children with SLD.

14
References
American Psychiatric Association. (2013). Diagnostic and Statistical Manual of Mental Disorders
(5th ed.). Arlington, VA: American Psychiatric Publishing.
Benjamini, Y. (2010). Discovering the false discovery rate. Journal of the Royal Statistical Society:
Series B, 72, 405–416.doi:10.1111/j.1467-9868.2010.00746.x
Bishop, D. V. M., & Snowling, M. J. (2004). Developmental dyslexia and specific language
impairment: same or different? Psychological Bulletin, 130, 858–886.doi:10.1037/0033-
2909.130.6.858
Bosse, M.-L., Tainturier, M. J., & Valdois, S. (2007). Developmental dyslexia: The visual attention
span deficit hypothesis. Cognition, 104, 198–230.doi:10.1016/j.cognition.2006.05.009
Branum-Martin, L., Fletcher, J. M., & Stuebing, K. K. (2013). Classification and identification of
reading and math disabilities: The special case of comorbidity. Journal of Learning
Disabilities, 46, 490–499.doi:10.1177/0022219412468767
Bull, R., Espy, K. A., & Wiebe, S. A. (2008). Short-term memory, working memory, and executive
functioning in preschoolers: Longitudinal predictors of mathematical achievement at age 7
years. Developmental Neuropsychology, 33, 205–228.doi:10.1080/87565640801982312
Butterworth, B. (2004). Developmental Dyscalculia. In J. D. Campbell (Ed.), The Handbook of
Mathematical Cognition (pp. 455–469). New York, NY, NY: Psychology Press.
Carroll, J. B. (1993). Human Cognitive Abilities: A Survey of Factor Analytic Studies. New York:
Cambridge University Press.
Compton, D. L., Fuchs, L. S., Fuchs, D., Lambert, W., & Hamlett, C. (2012). The cognitive and
academic profiles of reading and mathematics learning disabilities. Journal of Learning
Disabilities, 45, 79–95.doi:10.1177/0022219410393012
Cornoldi, C., Giofrè, D., Orsini, A., & Pezzuti, L. (2014). Differences in the intellectual profile of
children with intellectual vs. learning disability. Research in Developmental Disabilities, 35,
2224–2230.doi:10.1016/j.ridd.2014.05.013
15
D’Angiulli, A., & Siegel, L. S. (2003). Cognitive functioning as measured by the Wisc-R: Do
children with learning disabilities have distinctive patterns of performance? Journal of
Learning Disabilities, 36, 48–58.doi:10.1177/00222194030360010601
De Clercq-Quaegebeur, M., Casalis, S., Lemaitre, M.-P., Bourgois, B., Getto, M., & Vallée, L.
(2010). Neuropsychological profile on the WISC-IV of French children with dyslexia.
Journal of Learning Disabilities, 43, 563–74.doi:10.1177/0022219410375000
De Weerdt, F., Desoete, A., & Roeyers, H. (2013). Working memory in children with reading
disabilities and/or mathematical disabilities. Journal of Learning Disabilities, 46, 461–
472.doi:10.1177/0022219412455238
Evers, A., Muñiz, J., Bartram, D., Boben, D., Egeland, J., Fernández-Hermida, J. R.,…Urbánek, T.
(2012). Testing practices in the 21st century. European Psychologist, 17, 300–
319.doi:10.1027/1016-9040/a000102
Francis, D. J., Fletcher, J. M., Stuebing, K. K., Lyon, G. R., Shaywitz, B. A., & Shaywitz, S. E.
(2005). Psychometric approaches to the identification of LD: IQ and achievement scores are
not sufficient. Journal of Learning Disabilities, 38, 98–
108.doi:10.1177/00222194050380020101
Giofrè, D., & Cornoldi, C. (2015). The structure of intelligence in children with specific learning
disabilities is different as compared to typically development children. Intelligence, 52, 36–
43.doi:10.1016/j.intell.2015.07.002
Giofrè, D., Stoppa, E., Ferioli, P., Pezzuti, L., & Cornoldi, C. (2016). Forward and backward digit
span difficulties in children with specific learning disorder. Journal of Clinical and
Experimental Neuropsychology, 1–9.doi:10.1080/13803395.2015.1125454
Istituto Superiore di Sanità (2010). Consensus Conference: Disturbi Specifici dell’Apprendimento
[National Consensus Conference on Specific Learning Disability]. Roma, Italy. Retrieved
from http://www.snlg-iss.it/cms/files/Cc_Disturbi_Apprendimento_sito.pdf
Landerl, K., Fussenegger, B., Moll, K., & Willburger, E. (2009). Dyslexia and dyscalculia: Two

16
learning disorders with different cognitive profiles. Journal of Experimental Child
Psychology, 103, 309–324.doi:10.1016/j.jecp.2009.03.006
Mercer, C. D., Jordan, L., Allsopp, D. H., & Mercer, A. R. (1996). Learning disabilities definitions
and criteria used by state education departments. Learning Disability Quarterly, 19, 217–
232.doi:10.2307/1511208
Orsini, A., Pezzuti, L., & Picone, L. (2012). WISC-IV: Contributo alla taratura Italiana. [WISC-IV
Italian Edition]. Florence, Italy: Giunti O. S.
Peng, P., & Fuchs, D. (2016). A meta-analysis of working memory deficits in children with learning
difficulties: Is there a difference between verbal domain and numerical domain? Journal of
Learning Disabilities, 49, 3–20.doi:10.1177/0022219414521667
Pieters, S., Desoete, A., Roeyers, H., Vanderswalmen, R., & Van Waelvelde, H. (2012). Behind
mathematical learning disabilities: What about visual perception and motor skills? Learning
and Individual Differences, 22, 498–504.doi:10.1016/j.lindif.2012.03.014
Poletti, M. (2016). WISC-IV intellectual profiles in Italian children with specific learning disorder
and related impairments in reading, written expression, and mathematics. Journal of Learning
Disabilities, 49, 320–335. doi:10.1177/0022219414555416
Rourke, B. P., & Finlayson, M. A. J. (1978). Neuropsychological significance of variations in
patterns of academic performance: Verbal and visual-spatial abilities. Journal of Abnormal
Child Psychology, 6, 121–133.doi:10.1007/BF00915788
Savage, R., Lavers, N., & Pillay, V. (2007). Working memory and reading difficulties: What we
know and what we don’t know about the relationship. Educational Psychology Review, 19,
185–221.doi: 10.1007/s10648-006-9024-1
Siegel, L. S. (1988). Evidence that IQ scores are irrelevant to the definition and analysis of reading
disability. Canadian Journal of Psychology, 42, 201–15.doi:10.1037/h0084184
Swanson, H. L., & Jerman, O. (2006). Math disabilities: A selective meta-analysis of the literature.
Review of Educational Research, 76, 249–274. doi:10.3102/00346543076002249

17
Szucs, D., Devine, A., Soltesz, F., Nobes, A., & Gabriel, F. (2013). Developmental dyscalculia is
related to visuo-spatial memory and inhibition impairment. Cortex, 49, 2674–
88.doi:10.1016/j.cortex.2013.06.007
von Károlyi, C., Winner, E., Gray, W., & Sherman, G. F. (2003). Dyslexia linked to talent: Global
visual-spatial ability. Brain and Language, 85, 427–431.doi:10.1016/S0093-934X(03)00052-
X
Wechsler, D. (2003). WISC-IV Technical and Interpretive Manual. San Antonio, TX: The
Psychological Association.
Willcutt, E. G., Petrill, S. A., Wu, S., Boada, R., DeFries, J. C., Olson, R. K., & Pennington, B. F.
(2013). Comorbidity between reading disability and math disability: Concurrent
psychopathology, functional impairment, and neuropsicological functioning. Journal of
Learning Disabilities, 46, 500–516.doi:0.1177/0022219413477476
World Health Organization. (1993). The ICD-10 classification of mental and behavioural
disorders: Clinical descriptions and diagnostic guidelines. Geneva, Switzerland: World
Health Organization.
18
Table 1.
Mean (and standard deviations) for all WISC-IV indexes in children by SLD subtype and for the entire sample.
Scale
SLD - Reading
SLD - Spelling
SLD - Arithmetical
SLD – Mixed
All cases
F81.0 F81.1 F81.2 F81.3 combined
(n = 308) (n = 147) (n = 93) (n = 501) (N = 1049)
FSIQ 101.64 (11.46)a 103.76 (11.67)a 96.61 (12.18)b * 93.62 (11.97)c * 97.23 (15.42) *
Factor index
VCI 104.09 (14.28)a * 108.50 (13.93)b * 104.54 (14.13)a 98.57 (14.82)c 102.11 (14.92)
PRI 108.54 (13.32)a * 106.54 (12.77)a * 98.96 (14.92)b 100.58 (14.14)b 103.61 (14.29) *
WMI 92.83 (12.57)a * 95.31 (13.36)a * 89.45 (11.46)b * 87.26 (12.32)b * 90.22 (12.84) *
PSI 95.27 (12.84)a,b * 97.05 (14.51)a * 92.71 (15.14)b,c * 90.64 (14.03)c * 93.08 (14.08) *
Additional score
GAI 107.00 (13.24)a * 108.39 (12.71)a * 101.90 (13.00)b 99.46 (13.42)b 103.14 (13.77) *
CPI 92.81 (11.68)a * 95.50 (13.15)b * 88.94 (12.56)c * 86.05 (12.05)d * 89.62 (12.69) *
Note. FSIQ = Full-Scale IQ; VCI = Verbal Comprehension Index; PRI = Perceptual Reasoning Index; WMI = Working Memory Index; PSI = Processing Speed
Index; GAI = General Ability Index; CPI = Cognitive Proficiency Index.
a,b,c,d On each row, group means that do not share a letter are significantly different (p < .05) on the basis of independent samples t-tests.
* Mean is significantly different (p < .05) from the normative score (i.e. 100, but the comparison score was set to 101.5 for values above 100 to correct for the
lower bound FSIQ equal to 70 in SLD [assuming normal distribution of FSIQ]), using one sample t-tests.
P-values were adjusted for multiple comparisons using the False Discovery Rate correction (Benjamini, 2010).

19
Figure 1 Estimated mean standardized scores obtained by the four groups of children in the four main WISC-IV indexes. PRI = perceptual reasoning index; PSI =
processing speed index; VCI = verbal comprehension index; WMI = working memory index. Error bars indicate 95% confidence intervals.


