I
THE USEFULNESS OF MODULARIZATION, MASS CUSTOMIZATION,
POSTPONEMENT AND CUSTOMER ORDER DECOUPLING POINT
ACROSS THE PRODUCT LIFE CYCLE
LIU-IEI-TEK-A--10/00871--SE
Master’s thesis
Department of Management and Engineering
Division of Production Economics
Linköping Institute of Technology
2010
By Songmei Dong
Supervisor: Jan Olhager

II
Abstract
The concept of the product life cycle is not new, having been described, analyzed and discussed
so often in the literature of marketing, management and manufacturing. While its strategic
implications have been the subject of much research, little is known about its effect on
operational aspects, particularly for product and process design. This paper intends to fill this gap.
Four product and process concepts are considered; they are modularization, mass customization,
the customer order decoupling point, and postponement.
By means of a causal loop diagram, the relationships between the different concepts are explored,
all finally connecting to one of two business benefits: cost reduction or customer value
enhancement.
Building on the diagram, a conceptual framework is presented; intended to serve as a set of
guidelines for companies wishing to align their product and process design with respect to the
product life cycle, allowing benefits to be gained by leveraging the different stages of the product
life cycle.
Finally, a case study tests the conceptual framework against a global materials handling
equipment manufacturer. Due to the long product life cycles existing in the industry, it was not
possible to fully cover all steps of the product life cycle. However, the application of the other
concepts was explored in great detail for both the operational supply chain, as well as for the
design of new products.

III
Acknowledgements
After completion of this research the author wishes to thank the people who have contributed to
the quality of this report. First, I would like to thank my thesis supervisor, Jan Olhager, for his
support. Thanks also go to Per Ola Post for all his help during the case study.
Lastly, the author wishes to thank her family and Philip for always being there.
IV
Table of Contents 1. Introduction ............................................................................................................................. 1
1.1 Background ....................................................................................................................... 1
1.2 Purpose ............................................................................................................................. 2
1.3 Delimitations ..................................................................................................................... 2
1.4 Structure of paper .............................................................................................................. 2
2. Theoretical framework ............................................................................................................ 2
2.1 Product design concepts ..................................................................................................... 3
2.1.1 The Product Life Cycle ............................................................................................... 3
2.1.1.1 Traditional PLC concept ....................................................................................... 4
2.1.1.2 Different product life cycle patterns ...................................................................... 5
2.1.1.3 Connecting the PLC model to strategic choice ...................................................... 7
2.1.1.4 The product life cycle and product portfolio ....................................................... 14
2.1.1.5 Lessons of the product life cycle ......................................................................... 15
2.1.2 Modularization.......................................................................................................... 15
2.1.2.1 Product modularity ............................................................................................. 15
2.1.2.2 Benefits of product modularity ........................................................................... 23
2.1.2.3 Obstacles to product modularity ......................................................................... 26
2.2 Product-process design concept ....................................................................................... 28
2.2.1 Mass customization ................................................................................................... 28
2.2.1.1 Concept Implication ........................................................................................... 28
2.2.1.2 Levels of mass customization ............................................................................. 32
2.2.1.3 Building blocks of mass customization implementation ...................................... 34
2.2.1.4 Mass customization benefits and challenges ....................................................... 35
2.2.2 The Customer Order Decoupling Point ...................................................................... 37
2.2.2.1 Information and material decoupling points ........................................................ 37
2.2.2.2 Definition and characteristics ............................................................................. 39
2.2.2.3 Factors affect the CODP positions ...................................................................... 44
2.2.2.4 Positioning the CODP ........................................................................................ 45
2.3 Supply Chain Management .............................................................................................. 48
2.3.1 Supply chain structure ............................................................................................... 48
2.3.1.1 Definitions and concepts .................................................................................... 48
2.3.1.2 Leanness ............................................................................................................ 51

V
2.3.1.3 Agility................................................................................................................ 53
2.3.1.4 Comparing leanness and agility .......................................................................... 56
2.3.1.5 Hybrid lean/agile ................................................................................................ 59
2.3.2 Postponement ........................................................................................................... 62
2.3.2.1 The concept of postponement ............................................................................. 63
2.3.2.2 Some classifications ........................................................................................... 65
2.3.2.3 Benefits of postponement ................................................................................... 67
2.3.2.4 Lessons from postponement ............................................................................... 70
2.4 Summary of chapter......................................................................................................... 71
3. Research design..................................................................................................................... 71
3.1 Research philosophy ........................................................................................................ 71
3.2 The modeling process ...................................................................................................... 72
3.2.1 System dynamics approach to modeling .................................................................... 72
3.2.2 General approach to causal loop diagrams ................................................................. 73
3.3 Research quality .............................................................................................................. 74
4. Conceptual framework .......................................................................................................... 75
4.1 Business objectives .......................................................................................................... 75
4.1.1 Profit ........................................................................................................................ 76
4.1.2 Customer value ......................................................................................................... 77
4.2 Concepts and their effects ................................................................................................ 78
4.2.1 Postponement ........................................................................................................... 78
4.2.2 The Customer Order Decoupling Point ...................................................................... 79
4.2.3 Modularization.......................................................................................................... 80
4.2.4 Mass customization ................................................................................................... 82
4.3 Connect the effects of concepts with causes of objectives................................................. 83
4.4 The causal loop diagram .................................................................................................. 84
4.5 Conceptual framework ..................................................................................................... 87
4.5.1 Design phase ............................................................................................................. 89
4.5.2 Introduction phase..................................................................................................... 89
4.5.3 Growth phase ............................................................................................................ 90
4.5.4 Maturity phase .......................................................................................................... 91
4.5.5 Decline phase............................................................................................................ 92
4.5.6 Framework applications ............................................................................................ 93

VI
5. Case study ............................................................................................................................. 93
5.1 Case company ................................................................................................................. 93
5.2 Scope of case study ......................................................................................................... 94
5.3 Concepts application ........................................................................................................ 96
5.3 Discussion ....................................................................................................................... 98
6. Concluding remarks .............................................................................................................. 99
6.1 Conclusion ...................................................................................................................... 99
6.2 Limitations ...................................................................................................................... 99
6.3 Future research .............................................................................................................. 100
7. References .......................................................................................................................... 100

VII
Table of figures
Figure 1 Structure of the theoretical framework ........................................................................... 3 Figure 2 The traditional product life cycle model (Steffens & Kaya, 2008) .................................. 4 Figure 3 Alternative PLC curve (Meenaghan & O' Sullivan, 1986) .............................................. 7 Figure 4 A typical product life cycle and its relationship to focus (Hill, 2000).............................. 9 Figure 5 Entrance-exit strategies framework (Hayes & Wheelwright, 1979). ............................. 11
Figure 6 Generic lighting product life cycle framework (Aitken et al., 2003) ............................. 13 Figure 7 Relationship between the product life cycle and portfolio matrix (Van der Walt et al., 1996). ....................................................................................................................................... 14
Figure 8 Five approaches to modularity (Ulrich & Tung, 1991) ................................................. 16 Figure 9 Four desk architecture (Ulrich, 1995)........................................................................... 18 Figure 10 Differences effective approaches for modular and integral architecture along product development process (Ulrich, 1995). ......................................................................................... 19 Figure 11 Link product architectures to product managerial importance (Ulrich, 1995) .............. 20
Figure 12 Unrealize potential of modularity (Kusiak, 2002) ....................................................... 27 Figure 13 Positioning mass customization (Squire et al., 2006) .................................................. 30 Figure 14 Economic Implications of Mass Customization (Tseng & Jiao, 1996) ........................ 30
Figure 15 Main mass customization positions in product-process matrix (Chandra & Kamrani, 2004) ........................................................................................................................................ 31
Figure 16. The four approaches to customization (Gilmore & Pine, 1997) ................................. 33
Figure 17 Operationalized configurational model (Duray et al., 2000) ....................................... 33 Figure 18 Summary of generic levels of mass customization ..................................................... 34 Figure 19 Comparison of Material and Information Decoupling Point Positions within a Supply Chain (Mason-Jones & Towill, 1999) ........................................................................................ 38 Figure 20 Different product delivery strategies relate to different CODPs (Olhager, 2003) ......... 39
Figure 21 The two-dimensional CODP model (Rudberg & Wikner, 2004) ................................. 40
Figure 22 Differentiating manufacturing focus upstream and downstream of the CODP (Hallgren & Olhager, 2006) ...................................................................................................................... 41
Figure 23 Different CODP positions in term of different supply chain strategies (Mason-Jones & Towill, 1999) ............................................................................................................................ 44
Figure 24 The productivity–flexibility tradeoff and the CODP position (Rudberg & Wikner, 2004). ....................................................................................................................................... 46
Figure 25 The concept of P/D ratio (Wikner & Rudberg, 2005a) ................................................ 46 Figure 26 Four typical CODP positions, based on P/D ratio (Wikner & Rudberg, 2005a) ........... 47
Figure 27 Model for choosing the right product delivery strategy (Olhager, 2003). .................... 47
Figure 28 The supply chain network (Christopher, 2005) ........................................................... 49 Figure 29 Types of channel relationship (Mentzer et al., 2001) .................................................. 49 Figure 30 The value chain (Porter, 1985) ................................................................................... 50 Figure 31 Elements in the supply chain management (Cooper et al., 1997) ................................ 50
Figure 32 SCOR model (Supply Chain Council, 2005) .............................................................. 51 Figure 33 Seven Wastes (Ohno, 1988) ....................................................................................... 52 Figure 34 Five steps principles of lean thinking (Womack & Jones, 2007) ................................. 53

VIII
Figure 35 Distinctive focus of flexibility versus agile in managing change (Wadhwa & Rao, 2000) ................................................................................................................................................. 54
Figure 36 The agile supply chain framework (Christopher, 2005) .............................................. 55 Figure 37 Market winners and market qualifiers for agile versus lean supply (Mason-Jones et al., 2000) ........................................................................................................................................ 56
Figure 38 Matching supply chain with products (Fisher, 1997) .................................................. 59 Figure 39 Efficient supply chain operations frontier between responsiveness and efficiency (Selldin & Olhager, 2007) ......................................................................................................... 59
Figure 40 The Time/Space Matrix (Towill & Christopher, 2002) ............................................... 61 Figure 41 The Pareto distribution (Christopher & Towill, 2001) ................................................ 62 Figure 42 The application of postponement (van Hoek, 2001) ................................................... 63 Figure 43 Postponement and different supply chain strategies (Yang & Burns, 2003) ................ 67
Figure 44 Tradeoff curves for inventory level and customer service level (Graman & Bukovinsky, 2005) ........................................................................................................................................ 69
Figure 45 Conceptual model of form postponement ................................................................... 70 Figure 46 Model describing system dynamics modeling (Sterman, 2000) .................................. 73
Figure 47 Structure of the conceptual framework ....................................................................... 75 Figure 48 The cumulative experience curve ............................................................................... 84 Figure 49 Causal loop diagrams ................................................................................................ 85 Figure 50 The conceptual framework ........................................................................................ 88 Figure 51 Location of the Mjölby factory (C) ............................................................................ 95 Figure 52 Order flow for powered pallet trucks, stackers and reach trucks. ................................ 95 Figure 53 Order flow for hand pallet trucks. .............................................................................. 96
IX
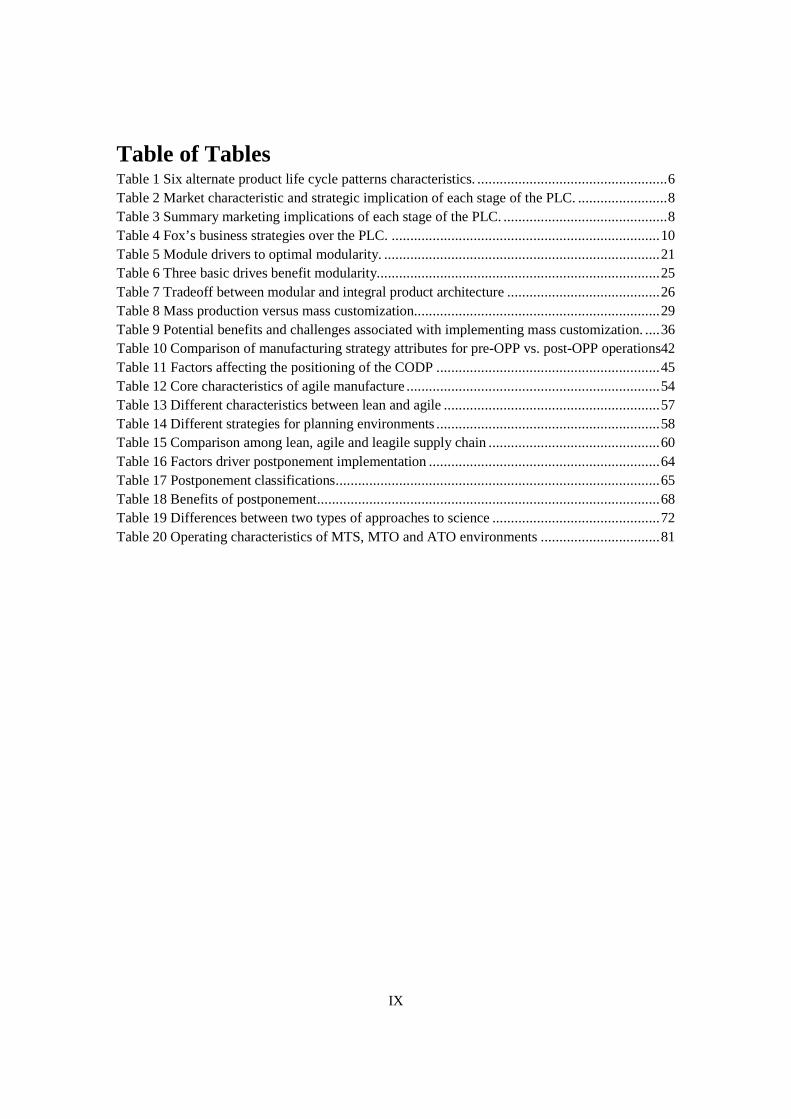
Table of Tables Table 1 Six alternate product life cycle patterns characteristics. ................................................... 6 Table 2 Market characteristic and strategic implication of each stage of the PLC. ........................ 8
Table 3 Summary marketing implications of each stage of the PLC. ............................................ 8 Table 4 Fox’s business strategies over the PLC. ........................................................................ 10 Table 5 Module drivers to optimal modularity. .......................................................................... 21 Table 6 Three basic drives benefit modularity............................................................................ 25 Table 7 Tradeoff between modular and integral product architecture ......................................... 26 Table 8 Mass production versus mass customization.................................................................. 29 Table 9 Potential benefits and challenges associated with implementing mass customization. .... 36
Table 10 Comparison of manufacturing strategy attributes for pre-OPP vs. post-OPP operations42
Table 11 Factors affecting the positioning of the CODP ............................................................ 45 Table 12 Core characteristics of agile manufacture .................................................................... 54 Table 13 Different characteristics between lean and agile .......................................................... 57 Table 14 Different strategies for planning environments ............................................................ 58 Table 15 Comparison among lean, agile and leagile supply chain .............................................. 60 Table 16 Factors driver postponement implementation .............................................................. 64 Table 17 Postponement classifications ....................................................................................... 65 Table 18 Benefits of postponement ............................................................................................ 68 Table 19 Differences between two types of approaches to science ............................................. 72 Table 20 Operating characteristics of MTS, MTO and ATO environments ................................ 81
X
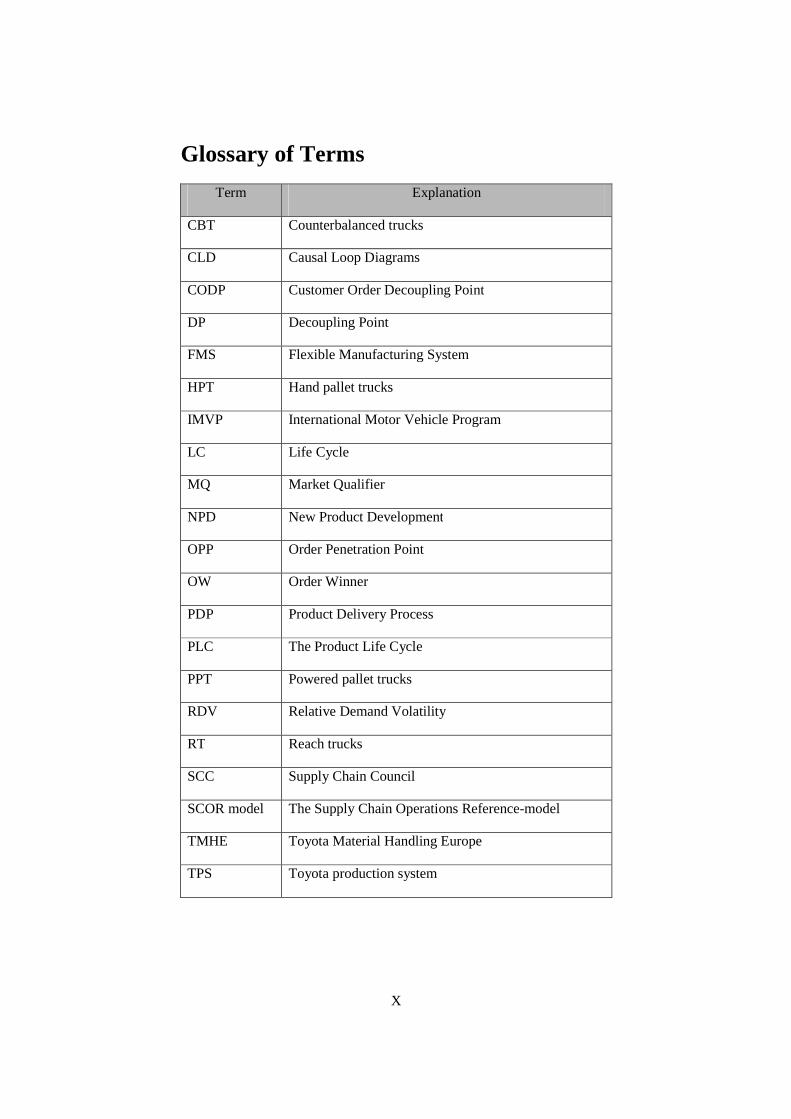
Glossary of Terms
Term Explanation
CBT Counterbalanced trucks
CLD Causal Loop Diagrams
CODP Customer Order Decoupling Point
DP Decoupling Point
FMS Flexible Manufacturing System
HPT Hand pallet trucks
IMVP International Motor Vehicle Program
LC Life Cycle
MQ Market Qualifier
NPD New Product Development
OPP Order Penetration Point
OW Order Winner
PDP Product Delivery Process
PLC The Product Life Cycle
PPT Powered pallet trucks
RDV Relative Demand Volatility
RT Reach trucks
SCC Supply Chain Council
SCOR model The Supply Chain Operations Reference-model
TMHE Toyota Material Handling Europe
TPS Toyota production system

1
1. Introduction
In this chapter, the research background is presented, this leads to the purpose of the research.
1.1 Background
Customers demand products that meet their specific needs at low costs. However, product
customization involves increased use of research and development (R & D), manufacturing,
and marketing resources, which leads to a high unit cost (Ahmad et al., 2010). Finding a
balance between these tradeoffs becomes a core challenge, which many manufacturers in
today’s dynamic business environment must face; this allows them to continuously align their
product and process design, so that the maximization of customer value and the minimization
of cost can be achieved simultaneously.
Many researchers suggest that a strategic product design should be modularized; this is due to
modularization increasing product variety without seriously affecting production costs (Ulrich
& Tung, 1991). The concept is also frequently used in connection with mass customization to
highlight customizing standard products, so that high customer value to be created at low cost.
Two process design strategies are often suggested by previous researchers: a postponement
strategy recommends delaying some value-adding processes until the customer order arrives;
and the customer order decoupling point (CODP) strategy breaks the supply chain process
into two sub-processes, where production shifts from being make-to-stock to being make-to-
order (Olhager, 2003). A successful process design has to strategically consider these two
concepts, thereby the whole supply chain process efficiency and responsiveness can be gained
simultaneously.
In term of the product life cycle (PLC), much is written in the literature about its strategic
implications in term of product, market, manufacturing, organization management
perspectives (Fox, 1973), however little is known about its operational perspectives,
particularly for product and process design. This leads to the motivation of this thesis, which
is to investigate usefulness of the product and process design concepts across the PLC.
Standing on the previous research, four product and process concepts are considered in this
thesis: they are modularization, mass customization, the customer order decoupling point, and
postponement.
2
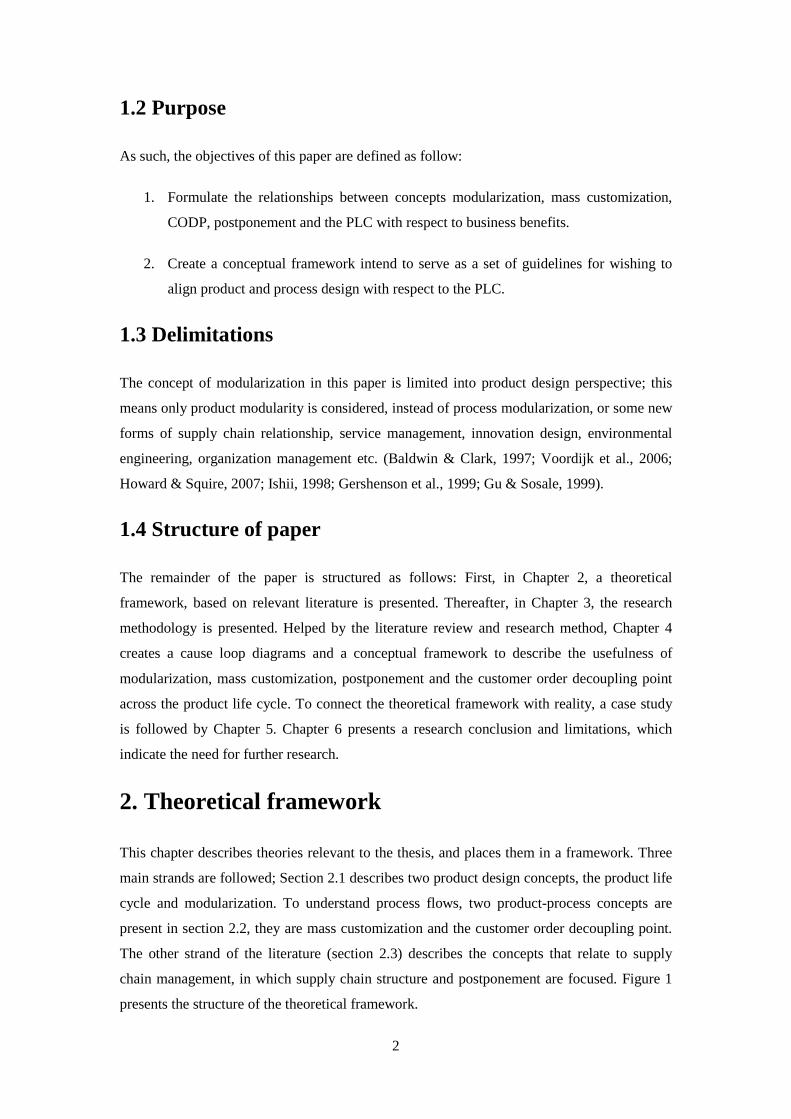
1.2 Purpose
As such, the objectives of this paper are defined as follow:
1. Formulate the relationships between concepts modularization, mass customization,
CODP, postponement and the PLC with respect to business benefits.
2. Create a conceptual framework intend to serve as a set of guidelines for wishing to
align product and process design with respect to the PLC.
1.3 Delimitations
The concept of modularization in this paper is limited into product design perspective; this
means only product modularity is considered, instead of process modularization, or some new
forms of supply chain relationship, service management, innovation design, environmental
engineering, organization management etc. (Baldwin & Clark, 1997; Voordijk et al., 2006;
Howard & Squire, 2007; Ishii, 1998; Gershenson et al., 1999; Gu & Sosale, 1999).
1.4 Structure of paper
The remainder of the paper is structured as follows: First, in Chapter 2, a theoretical
framework, based on relevant literature is presented. Thereafter, in Chapter 3, the research
methodology is presented. Helped by the literature review and research method, Chapter 4
creates a cause loop diagrams and a conceptual framework to describe the usefulness of
modularization, mass customization, postponement and the customer order decoupling point
across the product life cycle. To connect the theoretical framework with reality, a case study
is followed by Chapter 5. Chapter 6 presents a research conclusion and limitations, which
indicate the need for further research.
2. Theoretical framework
This chapter describes theories relevant to the thesis, and places them in a framework. Three
main strands are followed; Section 2.1 describes two product design concepts, the product life
cycle and modularization. To understand process flows, two product-process concepts are
present in section 2.2, they are mass customization and the customer order decoupling point.
The other strand of the literature (section 2.3) describes the concepts that relate to supply
chain management, in which supply chain structure and postponement are focused. Figure 1
presents the structure of the theoretical framework.

3
Figure 1 Structure of the theoretical framework
2.1 Product design concepts
This section presents two product design concepts, the product life cycle and modularization.
2.1.1 The Product Life Cycle
The concept of Product life cycle was developed in the 1950s and subsequently popularized
in the 1960s. Nowadays, it is one of the core elements of marketing management theory. The
assumption behind the PLC theory is that every product has a limited life cycle just like
human beings. Over time all products that have been ‘born’ onto that market will grow,
mature and eventually die (Meenaghan & O' Sullivan, 1986).
The purpose of this section is to understand the PLC and its implications. To do this, first, the
traditional PLC model and different PLC patterns are introduced, then, we connect the PLC
model to a company’s strategic choice perspective; after that, product portfolio management
is introduced; finally, some limitations of the PLC are described.
2. Theoretical framework
2.1 Product design concepts 2.2 Product-process design concepts 2.3 Supply chain management
2.1.1 The product
life cycle
2.1.2
Modularization
2.2.1 Mass
customization2.2.2 The CODP
2.3.1 Supply
chain structure
2.3.2
Postponement
2.1.1.1 The
traditional PLC
2.1.1.2 Different
PLC patterns
2.1.1.3 Connecting
the PLC model to
strategic choice
2.1.1.4 The PLC
and product
portfolio
2.1.1.5 lessons of
the PLC
2.1.2.1 Product
modularity
2.1.2.2 Benefits
of product
modularity
2.1.2.3 Obstacles
of product
modularity
2.2.1.1 Concept
implication
2.2.1.2 Levels of
mass
customization
2.2.1.3 Building
blocks of mass
customization
implementation
2.2.1.4 Benefits
and challenges
2.2.2.1 Information
and material
decoupling points
2.2.2.2 Definition and
charactertics
2.2.2.3 Factors affect
the CODP
2.2.2.4 Positioning
the CODP
2.3.1.1 Definitions
and concepts
2.3.1.2 Leanness
2.3.1.3 Agility
2.3.1.4 Comparing
leanness and
agility
2.3.1.5 Hybrid
lean/agile
2.3.2.1 the concept
of postponement
2.3.2.2 Some
classifications
2.3.2.3 Benefits of
postponement
2.3.2.4 Lessons
from
postponement
2.4 Summary of chapter

4
2.1.1.1 Traditional PLC concept
The traditional PLC theory is defined by the pattern of sales against time, which is generally
assumed to adopt a bell-like shaped curve (Steffens & Kaya, 2008). The PLC can be divided
into four key life stages, they are: introduction, growth, maturity, and decline, each
representing a different level of sales volume as shown in Figure 2.
Figure 2 The traditional product life cycle model (Steffens & Kaya, 2008)
1. Introduction: This is the time when a new product is first brought to market, the
sales volume increase slowly at this stage. Companies try to ‘create’ demand through
working out technical problems and gaining customers’ acceptance. Since the market
is new, few competitors exist. The profit is negative at this time since high promotion
cost is necessary in term of new product to be accepted by customers.
2. Growth: Demand begins to accelerate and sales take off. New competitors attracted
by the opportunity start moving into the market. Some of them merely copy the
originator’s product; others may make some improvements, which generates product
and brand differentiation. Prices are reduced slightly since manufacturing costs fall.
The profit is around zero since the profit generated in this stage has to pay for the
high capacity requirement. Also, promotion cost is still necessary to grow or maintain
market share.
3. Maturity: Demand levels off and sales growth slows down. Competition intensifies
and competitors scramble to find their niches. Generally, the prices are reduced
greatly in this period since mass production allows for significant cost reduction.
Positive profits are generated in this stage through a high sales volume and low cost
production. The promotion changes to brand focus instead of product.
5
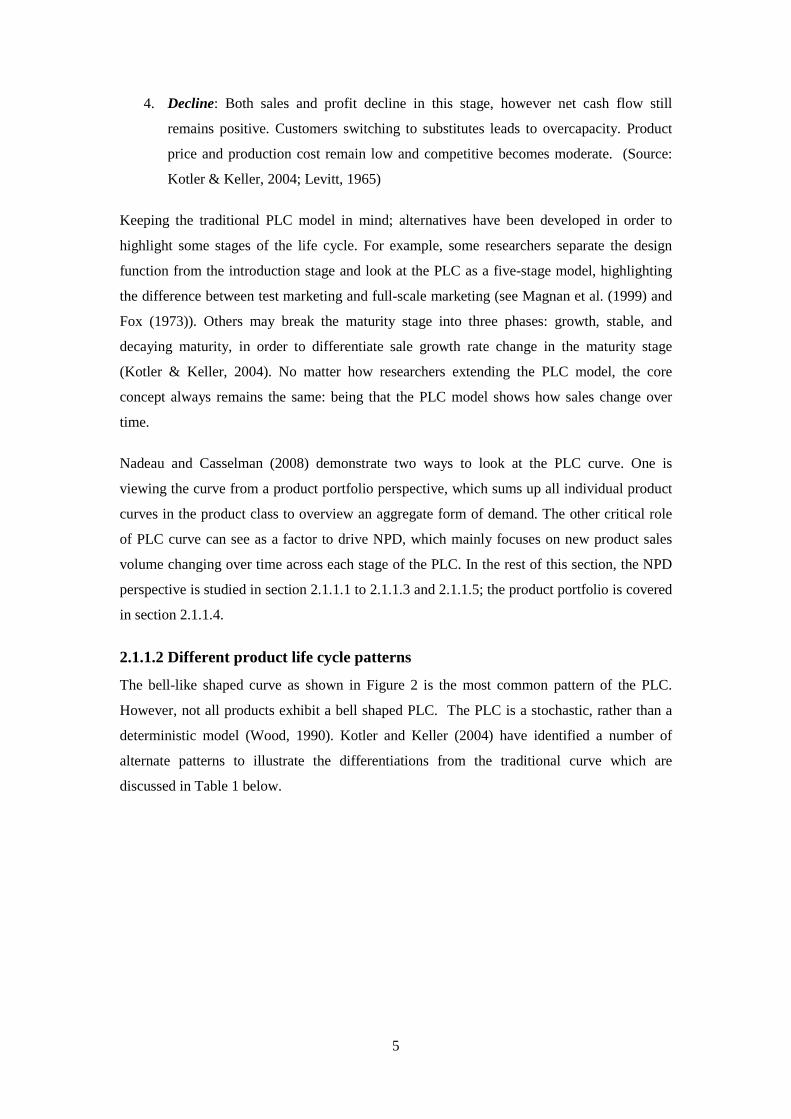
4. Decline: Both sales and profit decline in this stage, however net cash flow still
remains positive. Customers switching to substitutes leads to overcapacity. Product
price and production cost remain low and competitive becomes moderate. (Source:
Kotler & Keller, 2004; Levitt, 1965)
Keeping the traditional PLC model in mind; alternatives have been developed in order to
highlight some stages of the life cycle. For example, some researchers separate the design
function from the introduction stage and look at the PLC as a five-stage model, highlighting
the difference between test marketing and full-scale marketing (see Magnan et al. (1999) and
Fox (1973)). Others may break the maturity stage into three phases: growth, stable, and
decaying maturity, in order to differentiate sale growth rate change in the maturity stage
(Kotler & Keller, 2004). No matter how researchers extending the PLC model, the core
concept always remains the same: being that the PLC model shows how sales change over
time.
Nadeau and Casselman (2008) demonstrate two ways to look at the PLC curve. One is
viewing the curve from a product portfolio perspective, which sums up all individual product
curves in the product class to overview an aggregate form of demand. The other critical role
of PLC curve can see as a factor to drive NPD, which mainly focuses on new product sales
volume changing over time across each stage of the PLC. In the rest of this section, the NPD
perspective is studied in section 2.1.1.1 to 2.1.1.3 and 2.1.1.5; the product portfolio is covered
in section 2.1.1.4.
2.1.1.2 Different product life cycle patterns
The bell-like shaped curve as shown in Figure 2 is the most common pattern of the PLC.
However, not all products exhibit a bell shaped PLC. The PLC is a stochastic, rather than a
deterministic model (Wood, 1990). Kotler and Keller (2004) have identified a number of
alternate patterns to illustrate the differentiations from the traditional curve which are
discussed in Table 1 below.

6
Figure Name Life cycle characteristics Example
The growth-slump-maturity pattern
Sales grow rapidly during product introduction phase, and then fall to a ‘petrified’ level, until late adapters buying the product for the first time and early adopters replacing the product to sustain the petrified level.
Small kitchen appliances such as bread makers.
The cycle-recycle pattern
When pharmaceutical companies aggressively promote a new drug which result the first cycle-primary cycle. Later, the company gives the drug another promotion push when sales start declining, which produces a second cycle (recycle).
New drugs
The scalloped pattern
Sales pass through a succession of life cycles based on the discovery of new-product characteristics, uses or users.
Nylon
Style A style is a basic and distinctive mode of expression appearing in a field of human endeavor. Once a style is invented, it can last for generations, going in and out of vogue.
Home, clothing etc.
Fashion A currently accepted or popular style in a given field. The length of a fashion cycle is hard to predict.
Jean is fashion in today’s clothing.
Fad Fads are fashions that come quickly into public attention, are adopted with great zeal, peak early, and decline very fast. Generally, fads acceptance cycle are short.
Trivial pursuit
Source: Kotler & Keller, 2004
Table 1 Six alternate product life cycle patterns characteristics.

7
Different from Kotler and Keller, Meenaghan & O' Sullivan (1986) summarize the alternative
PLC shapes into four categories, including ‘logistic’,’ exponential’, ‘fad’ and ‘4th degree of
polynomial’ as shown in figure 3. The ‘logistic’ curve indicates the traditional ‘low
acceleration’ products which have an initial period of market development exist; On the
contrary, the ‘exponential’ curve is associated with a ‘high acceleration’ curve shape in which
little learning is required by the consumer. The ideals of ‘fad’ and ‘4th degree of polynomial’
patterns are similar with the ‘fad’ and ‘cycle-recycle’ patterns described by Kotler and Keller.
Knowing this, a company can apply this concept for strategy planning and decision-making.
In the next section, we introduce the strategic implications in term of each stage of the PLC
from different perspectives, such as marketing, manufacturing, management.
2.1.1.3 Connecting the PLC model to strategic choice
In the early 60’s, Levitt (1965) had already realized the impact of the stage of the PLC in the
light of strategic decision making. He suggests identify the stage of the product first, and then
selects an appropriate strategy to fit the stage. Table 2 shows Levitt’s point of view of
strategic implication of each stage of the PLC.
Figure 3 Alternative PLC curve (Meenaghan & O' Sullivan, 1986)
8
Stage of the PLC
Characteristics Strategic Implications
Introduction
A new product is first brought to market. Sales are low and creep along slowly.
’used apply policy’, the company should let others do the pioneering.
Growth ‘takeoff’
Demand begins to accelerate and the size of the total market expands rapidly.
The company should try to increase customer’s brand loyalty.
Maturity Demand levels off and grows. Producers should keep their market share and
pay attention to the consumers’ advices through direct communication.
Decline The product begins to lose consumer appeal and sales drift downward.
Producers should hasten competitors eclipse directly and try to be one of the survivors.
Source: Levitt, 1965.
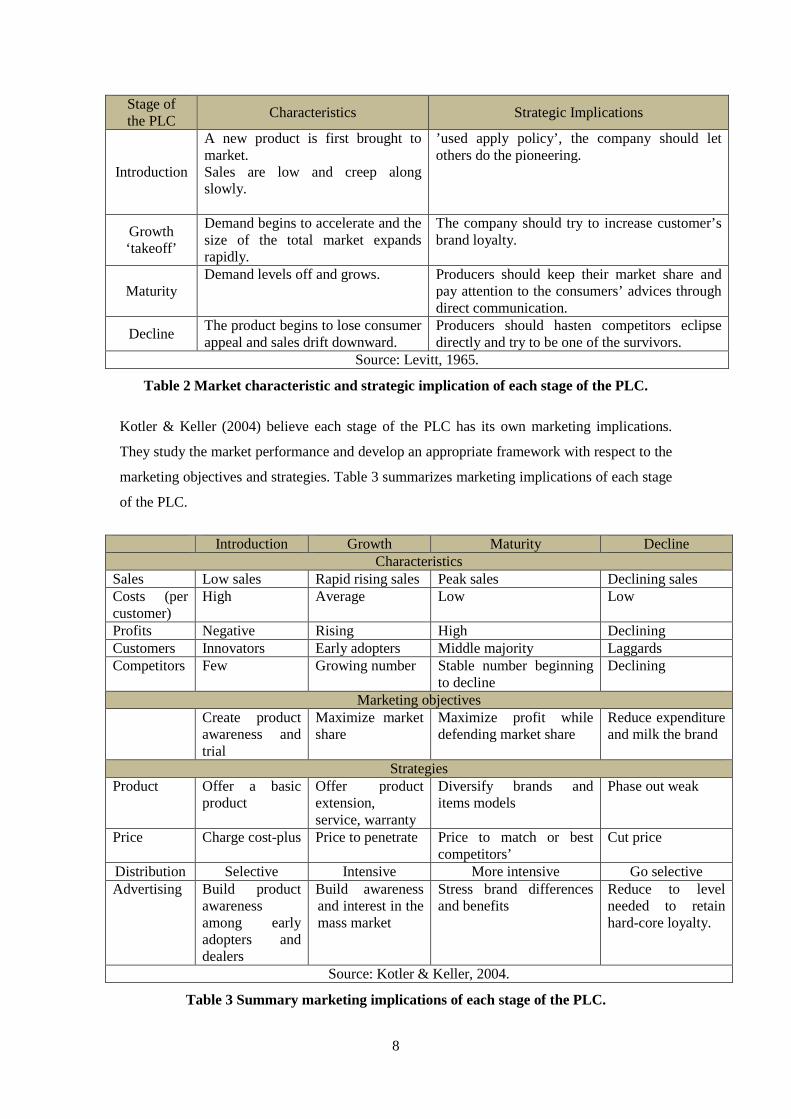
Table 2 Market characteristic and strategic implication of each stage of the PLC.
Kotler & Keller (2004) believe each stage of the PLC has its own marketing implications.
They study the market performance and develop an appropriate framework with respect to the
marketing objectives and strategies. Table 3 summarizes marketing implications of each stage
of the PLC.
Introduction Growth Maturity Decline Characteristics
Sales Low sales Rapid rising sales Peak sales Declining sales Costs (per customer)
High Average Low Low
Profits Negative Rising High Declining Customers Innovators Early adopters Middle majority Laggards Competitors Few Growing number Stable number beginning
to decline Declining
Marketing objectives Create product
awareness and trial
Maximize market share
Maximize profit while defending market share
Reduce expenditure and milk the brand
Strategies Product Offer a basic
product Offer product extension, service, warranty
Diversify brands and items models
Phase out weak
Price Charge cost-plus Price to penetrate Price to match or best competitors’
Cut price
Distribution Selective Intensive More intensive Go selective Advertising Build product
awareness among early adopters and dealers
Build awareness and interest in the mass market
Stress brand differences and benefits
Reduce to level needed to retain hard-core loyalty.
Source: Kotler & Keller, 2004.
Table 3 Summary marketing implications of each stage of the PLC.
9
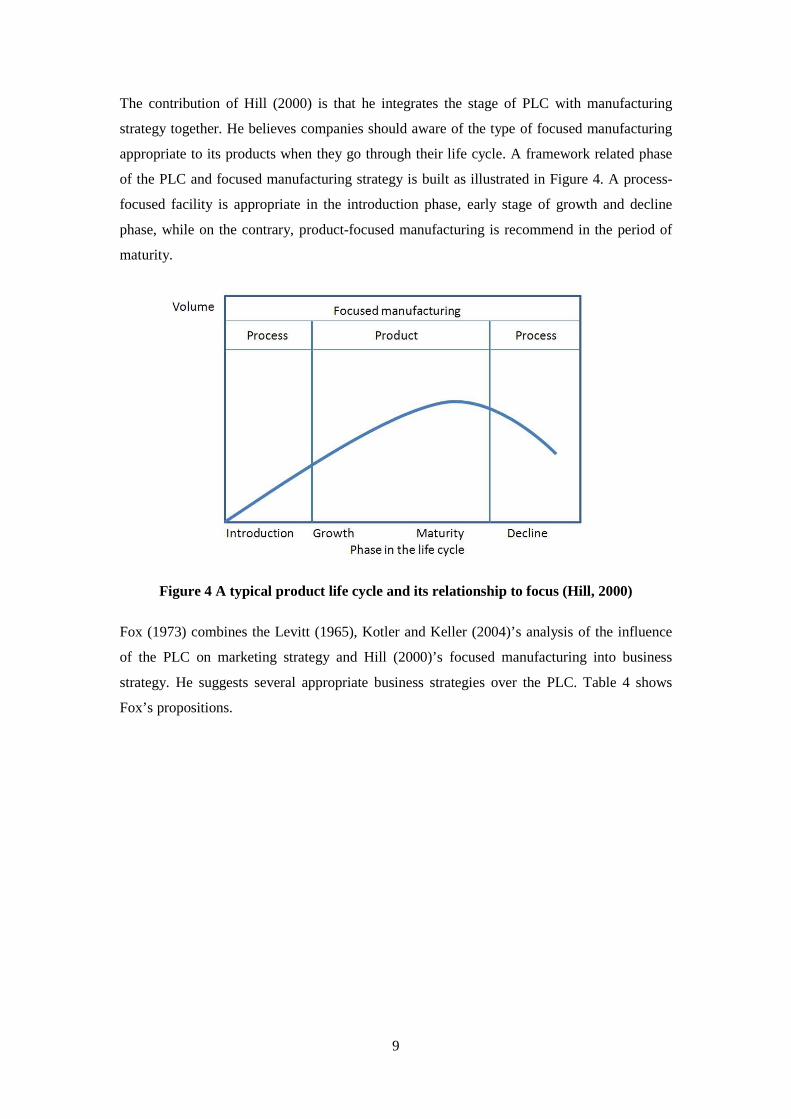
The contribution of Hill (2000) is that he integrates the stage of PLC with manufacturing
strategy together. He believes companies should aware of the type of focused manufacturing
appropriate to its products when they go through their life cycle. A framework related phase
of the PLC and focused manufacturing strategy is built as illustrated in Figure 4. A process-
focused facility is appropriate in the introduction phase, early stage of growth and decline
phase, while on the contrary, product-focused manufacturing is recommend in the period of
maturity.
Figure 4 A typical product life cycle and its relationship to focus (Hill, 2000)
Fox (1973) combines the Levitt (1965), Kotler and Keller (2004)’s analysis of the influence
of the PLC on marketing strategy and Hill (2000)’s focused manufacturing into business
strategy. He suggests several appropriate business strategies over the PLC. Table 4 shows
Fox’s propositions.

10
Design Introduction Growth Maturity Decline Functional Focus
Coordination of R&D and other functions
Engineering: debugging in R&D production, and field.
Production Marketing and logistics
Finance
R & D Reliability tests, Release blueprints
Technical corrections(engineering changes)
Start successor product
Develop minor variants, Reduce costs through value analysis, Originate major adaptations to start new cycle.
Withdraw all R&D from initial version.
Production Production design, Process planning, Purchasing dept. lines up vendors and subcontractors.
Subcontracting, Centralize pilot plants, test various processes, develop standards.
Centralize production, Phase out subcontractors, Expedite vendors output, long runs.
Many short runs, Decentralize, Import parts, low priced models, Cost reduction.
Revert to subcontracting, simplify production line. Careful inventory control, stock spare parts.
Marketing Test marketing, Detailed marketing plan
Induce trial, fill pipelines, sales agents or commissioned salesmen, publicity.
Channel commitment, Brand emphasis, Salaried sales force, Reduce price if necessary.
Short-term promotions, Salaried salesmen, Cooperative advertising, Forward integration, Routine marketing research.
Revert to commission basis, withdraw most promotional support. Raise price. Selective distribution.
Physical Distribution
Plan shipping schedules, mix carloads, Rent warehouse space, trucks.
Plan a logistics system.
Expedite deliveries, Shift to owned facilities.
Reduce costs and raise customer service level, Control finished goods inventory.
Reduce inventory and service.
Finance LC plan for cash flows, profited, investments, subsidiaries.
Accounting deficit, high net cash outflow, Authorize large production facilities.
Very high profits, net cash outflow still rising, Sell equities.
Declining profit rate but increasing net cash inflow.
Administer system. Sell unneeded equipment. Export the machinery.
Customers Panels & other test respondents.
Innovators and some early adopters.
Early adopters & early majority.
Early adopters, early & late majority, some laggards etc.
Mainly laggards.
Competition Neglects opportunity or is working on similar idea.
Monopoly Oligopoly ( A few imitate, improve, or cut prices)
Monopoly competition (First shakeout, yet many rivals)
Oligopoly (After 2nd shakeout, only few rivals)
Source: Fox, 1973.
Table 4 Fox’s business strategies over the PLC.

11
In contrast, Hayes & Wheelwright (1979) consider ‘when’ products should enter and exit the
market, they use the PLC stage as reference; further suggest an entrance-exit strategies
framework (Figure 5) to help companies make strategy decisions.
Figure 5 Entrance-exit strategies framework (Hayes & Wheelwright, 1979).
As Figure 5 shows, four combinations of entrance and exit strategies (simply called A, B, C
and D) are given in their framework, as well the characteristics of each combinations.
Obviously,
1. Strategy A is suitable for ‘little guys’, who focus on products diversification instead
of low-margin, mass production. Normally, ‘little guys’ do not have very much funds,
so portfolio management becomes vital to determine the company’s successes (see
next section about product portfolio concept).
2. Strategy B is considered to be the most desirable one when a company is seeking to
be a major factor in the market during the whole PLC.
3. Strategy C refuses to be a pioneer, waiting on the sidelines until figuring out that the
new ideal (product) works, then quickly follows. This kind of strategy also called
‘used apple policy‘ as we had already mentioned before (see Table 2). Hayes &
Wheelwright call strategy C as ‘lucky accident’; however it is far more than ‘lucky’.
Actually, strategy C is particularly favored by large national or multinational
companies; those companies have high, stable production system and plentiful funds
to do mass production, therefore, their competitive advantages are enhanced.
4. No companies would like to use strategy D since they do not have sufficient time
milking, so that take back initial investments become castles in the air.

12
Comparing the five strategic models given by Levitt (1965), Fox (1973), Hayes &
Wheelwright (1979), Hill (2000) and Kotler and Keller (2004), many differences can be
found.
1. Levitt (1965), Kotler and Keller (2004) focus on marketing strategic performance
over the PLC; Hill (2000) pays attention to the manufacturing perspective; Hayes &
Wheelwright (1979) look at entrance-exit market strategies; Fox (1973) combines
them by looking at the business strategy as a whole, his model not only includes the
marketing aspect, but also manufacturing, organization and technology strategies.
2. Levitt (1965) suggests consideration of PLC stage implications before making
strategic decisions; it does not work in reality since three key operation questions
cannot be answered accurately, they are:
� How and to what extent the shape and duration of each stage can be predicted;
� How to determine what stage a product is in;
� How the concept can be used effectively.
3. The problem with Fox (1973)’s business strategic model is that it is too narrow. For
example, ‘state of the art’ has great effect in term of R&D department’s job
responsibility. When technology changes rapidly, the R&D department should focus
on new product design or improvement (increased customer value), otherwise they
should concentrate on process improvement (reduce production cost). However,
Fox’s model does not consider this dynamic environment.
Hofer (1975) agrees that PLC stage is the most fundamental variable in determining an
appropriate business strategy and summaries four descriptive propositions which provide
guideline for company’s strategic decision-making.
1. Major changes in business strategy are usually required during three stages of the life
cycle: introduction, maturity, and decline.
2. In the introductory stage of the life cycle, the major determinants of business strategy
are the newness of the product, the rate of technological change in product design, the
needs of the buyer, and the frequency with which the product is purchased.
3. In the maturity stage of the life cycle, the major determinants of business strategy are
the nature of buyer needs, the degree of product differentiation, the rate of

13
technological change in process design, the degree of market segmentation, the ratio
of distribution costs to manufacturing value added, and the frequency with which the
product is purchased.
4. In the decline stage of the life cycle, the major determinants of business strategy are
buyer loyalty, the degree of product differentiation, the price elasticity of demand, the
company's share of market, product quality, and marginal plant size.
After theory analysis the usefulness of the PLC on strategic choice, Aitken et al. (2003)
connect the theory with reality. They provide a case study which addresses how an innovative
UK lighting company re-engineered its supply chain to accommodate the impact of the PLC,
Figure 6 shows the company’s generic lighting PLC framework.
Figure 6 Generic lighting product life cycle framework (Aitken et al., 2003)
The core idea of this case is that supply chain should be engineered to match customer
requirement. By doing this, first at all, the company should analyze the key order winners
(OWs) and market qualifiers (MQs) during each stage of a product’s life cycle, then
appropriate supply chain strategy should be decided to match the engineering requirements,
finally a framework is formulated as company’s operational reference (Figure 6). When a new
product enters the market, the company evaluates the demand signal first (customer
requirements), and then dynamically chooses an appropriate supply chain strategy based on
their generic PLC reference model, and finally reaches monitoring a product match to the
most appropriate supply chain strategy.
The UK lighting company also can be considers as a case of portfolio management since the
framework can handles different products in the company. Stern & Deimler (2006) claim that
if a company wants to be successful, it should have a portfolio of products at different stages

14
of the PLC. Based on their proposition, following we will study the relationships between the
PLC and product portfolio.
2.1.1.4 The product life cycle and product portfolio
To compete in the market, companies have to expand their production line and differentiate of
their product offerings from their competitors, it unavoidably leads to high complexity and
costs in product fulfillment, especially when products has different lifecycles or at different
stage of the lifecycle. Therefore,’ when’ and ‘how’ to offer ‘right’ product varieties to the
target market become important in order to determine the company’s success. Such decisions
are suggested by the Boston Consulting Group, also well knows as product portfolio strategy.
Stern & Deimler (2006) develop a portfolio strategy matrix, which differentiates products into
four categories (question mark, star, cash cow and dog) based on different market growth
rates and shares. As illustrated in Figure 7, the question mark and star have high growth rate,
star and cash cow share high market share.
Van der Walt et al. (1996) study the stage characteristics of PLC and the product portfolio
concept, the relationship between them are found (Figure 7). The arrows can be seen as the
time dimension of the PLC model. The introduction stage begins in the question mark
quadrant; the growth phase starts at the end of this quadrant and extends into star area; the
maturity stage starts in the cash cow quadrant; the decline stage begins in the end of cash cow
area and positioned between the cash cow and dog quadrant.
Figure 7 Relationship between the product life cycle and portfolio matrix (Van der Walt
et al., 1996).
15
Stern & Deimler (2006) believe a balanced portfolio strategy has far-reaching impact on the
company’s business success in competition. To do so, the company needs cash cows that
generate cash for future growth; stars in which to invest cash, assure the future; question
marks which can convert into stars by investing cash.
Research of the usefulness of the PLC in strategic choice cannot be accomplished overnight;
however some key lessons can be learned.
2.1.1.5 Lessons of the product life cycle
The lessons of the PLC concept are mainly derived from the assumption we presented
previously and various criticisms associated with its practical application. It is true that the
PLC has some similarities compare to the biological lifecycle such as going from ‘birth’ to
‘death’, however they are different in two ways (Dhalla & Yuspeh, 1976; Grantham, 1997):
1. The length of the PLC tends to differ from product to product, so does the length of
different stages, however human being’s life cycle does not have so much difference.
2. It is possible that PLC does not follows the expected sequence of the model
(introduction-growth-maturity-decline), however human beings has to.
2.1.2 Modularization
To be competitive in today’s turbulent business environment, manufacturers have to maintain
a fast new product development speed in response to different customer preferences and short
product life cycles. Modularization as a strategic decision is popular used by manufacturers
to increase product variety without seriously affecting production costs (Lau & Yam, 2005).
In this section, the research is limited to consider the product modularity, aiming at creating
an understanding of the usefulness of modularization with respect to product design and
configuration. To do this, first, the concept of product modularity is defined; then, some
benefits and limitations are presented based on literature studies.
2.1.2.1 Product modularity
The concept of product modularity emerged in the 1960s. Simon (1962) initially looks at the
product as a complex system within a hierarchical structure, which is made up of a large
number of parts and interacted in a non-simple way. As Langlois (1999) states, modularity is
a very general set of principles for managing complexity. Simon (1962) believes the product
should be modular designed, so that assembling a new product become quicker and easier.

16
Hsuan (1999) applies Simon’s (1962) structural conception of hierarchy into product design,
claiming that modularization in NPD can take place at sequenced levels: component level,
module level, subsystem and system level (from low to high level). Each level is created by a
combination of different parts from a lower level, an example being modules created from the
parts of component level. She also believes each level of modularization has corresponding
interface constrains and opportunities for modularization.
Both Simon (1962) and Hsuan (1999) look at product as a complex system, however the
relationships inside of the product is missing. As a pioneer, Suh (1990) first time breaks the
product system down, to study the functional relationships inside of a product. In his paper,
he brings up a concept of the ‘independent axiom’, which indicates that ‘in a good design, the
independent of functional requirements are maintained.’ He explains such independence as
follow, ‘in an acceptable design, the [design parameters] and the [functional requirements] are
related in a way that a specific [design parameter] can be adjusted to satisfy its corresponding
[functional requirement] without affecting other functional requirements’. Therefore, if
possible, all functional elements in a product should be independent to each other. This
axiom explores the relationship between a product’s form and functions, and further leads to
the study of the connection between physical independence and functional independence
(Gershenson & Prasad, 1997; Gershenson et al., 2003).
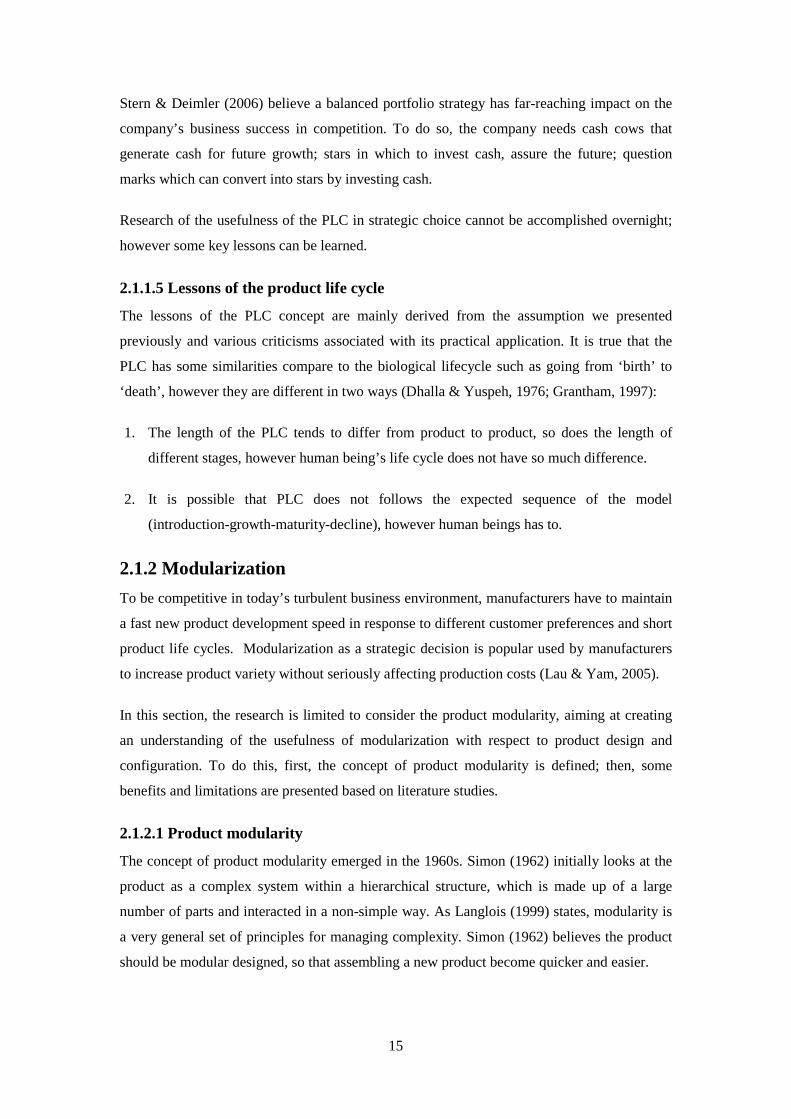
Ulrich & Tung (1991) extend Suh’s (1990) research into the modular design area. They
consider product modularity as a design goal, and that modularity can be seen as a useful tool
to reach more or less modular designs (Gershenson et al., 2003). In their paper, five types of
modularity are introduced, namely component-swapping modularity, component-sharing
modularity, fabricate-to-fit modularity, bus modularity and sectional modularity, see Figure 8.
Those five approaches to modularity are distinguished based on the dependency between
functional and physical component as well as the interface among them.
Figure 8 Five approaches to modularity (Ulrich & Tung, 1991)
17
Component-swapping modularity, component-sharing and fabricate-to-fit modularity are
defined from a ‘component’ point of view. Component-swapping modularity states different
components (options) match with a standard product; component-sharing modularity focuses
on same component shared by many products; the core of fabricate-to-fit modularity is
alternate the dimension of a module before fit it into other modules. Bus modularity and
sectional modularity are defined from the ‘modular connection’ viewpoint, while bus
modularity uses a standard basis (bus) to carry various modules, sectional modularity arranges
standard modules in different ways in order to increase the product variety, thereby, a
standard interface becomes vital to determine the success of modules.
Ulrich (1995) further expands his research (Ulrich & Tung, 1991) from ‘modular structures’
into ‘architectural modular’, he believes module is a product architecture, which exhibits both
‘what’ the basic physical building blocks of the product do and ‘how’ they interface with the
rest of the modules. He studies the relationship between functional elements (what it does)
and physical components, as well as component interfaces coupling, two modularity design
rules come out,
1. Similarity design between the physical and functional architecture;
2. Minimize the degree of interaction among physical components (independence
components).
Another contribution of Ulrich (1995) is that he proposes a new concept ‘integral architecture’
in contrast to ‘modular architecture’. He argues that any product can be more or less modular
or integral. The following definitions of integral and modular product architecture typologies
are given by Ulrich:
� Modular: one-to-one mapping from functional elements to physical components, and
specific decoupled interfaces between components or otherwise high independence.
� Integral: mappings from functional elements to physical components are complex
(not one-to-one), and/or coupled interfaces between components, or exhibit high
interdependence.
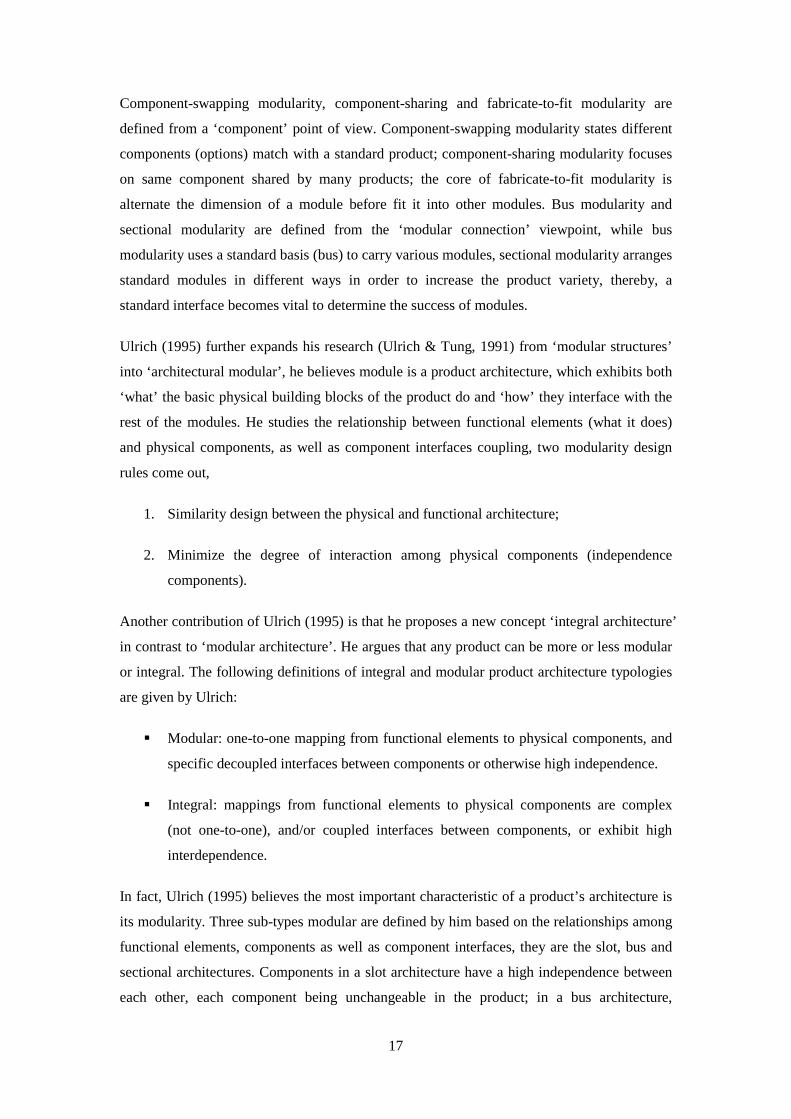
In fact, Ulrich (1995) believes the most important characteristic of a product’s architecture is
its modularity. Three sub-types modular are defined by him based on the relationships among
functional elements, components as well as component interfaces, they are the slot, bus and
sectional architectures. Components in a slot architecture have a high independence between
each other, each component being unchangeable in the product; in a bus architecture,

18
components have the same type of interface which can be used to connect with a common bus;
the same type of interface is also necessary for sectional structure, however no common bus
exists; instead assembly is built up by connecting components through identical interfaces. To
compare the difference between modular and integral architecture, as well as to illustrate
those three modular typologies clearly, a desk design is presented out as shown in Figure 9.
Figure 9 Four desk architecture (Ulrich, 1995)
In order to figure out different focuses between modular and integral architecture in term of
the product development process, Ulrich (1995) splits the product development process into
four steps: concept development, system-level design, detailed design, and finally, product
testing and refinement. He summaries the differences between effective approaches for
modular and integral architecture along the product development process as shown in Figure
10, As the figure exhibits, the effectiveness of approaches is focused during concept
development phase; differentiation starts from system-level design to product testing and
refinement.

19
Figure 10 Differences effective approaches for modular and integral architecture along
product development process (Ulrich, 1995).
Ulrich (1995) further links the typology of product architecture (Integral, modular-slot,
modular-bus, modular-sectional) with five areas of product managerial importance, includes
product change, product variety, component standardization, product performance, product
development management; and detail compared the different characteristics of those four
architectures in term of five areas, see Figure 11.
�Choose
technological working
principles;
�Set performance
targets;
�Define desired
features and variety;
�Choose architectural
approach.
�‘Heavyweight system
architect’ as team leader;
�Map functional elements
to components;
�Define interface standards
and protocols;
�Division of effort to
specialists.
�‘Heavyweight system
integrator’ as team leader;
�Emphasis on overall
system-level performance
targets;
�Division of product into a
few integrated subsystems;
�Assignment of subsystems
to multidisciplinary teams.
�Component design
proceeds in parallel;
�Monitoring of components
relative to interface
standrads and performance
design;
�Design performed by
‘supply-like’ entities;
�Component testing can be
done independently.
�Constant interaction
required to evaluate
performance and to manage
implications of design
changes;
�Component designers are
all ‘on the core team’;
�Component tests must be
done simultaneously.
�Effort focused on tuning
the overall system;
�Required performance
changes propagate to many
components.
�Effort focused on checking
for unanticipated couping
and interactions;
�Required performance
changes localized to a few
components.
INTEGRAL APPROACH
MODULAR APPROACH
Product Test
and RefinementDetailed DesignSystem-Level DesignConcept Development
PRODUCT DEVELOPMENT PROCESS

20
Figure 11 Link product architectures to product managerial importance (Ulrich, 1995)
Kreng & Lee (2004) summarize fourteen modular drivers to optimal modularity from
literatures studies (Table 5), they are: carryover, technology evolution, planned product
changes, standardization of common modules, product variety, customization, flexibility in
use, product development management, product styling, purchasing modularity components,
manufacturability refinement and quality assurance, quick services and maintenance, product
upgrading and recycling, reuse and disposal.
�Complex mapping unctional elements to components.�And/or the component interfaces are coupled.
�One-to one mapping between functional elements and components.�Interfaces between components are not coupled.
Integral Modular- Slot Modular- Bus Modular- Sectional
�Component interfaces are all different.
�Component interfaces are all the same.
�A single component (the bus) links the other components.
Definition
Examples
�Automobile unit
body.
� Neon sign/lighting.
�Truck body and frame.
�Table lamp with
bulb and shade.
�Track lighting.�Shelves with brackets and rails.
�Stackable shelving units,�Freight train.
�Any change in functionality requires a change to several components.
Product
Change
�Functional changes can be made to a product in the field.�Manufacturers can change the function of subsequent model generations by changing a single component.
Product
variety
�Variety not feasible without flexible component production processes.
�Products can be assembled in a combinatorial fashion from a relatively small set
of component building blocks to create variety.�Variety possible even without flexible component production processes.
�Variety confined to the choices of components within a pre-defined overall product structure.
�Variety in overall structure of the product possible (e.g. Lego blocks, piping).
Component
standardization
�Components can be standardized across a product line.�Firms can use standard components provided by suppliers.
�Interfaces may adhere to an industry standard.
Product
Performance
�May exhibit higher performance for global performance characteristics like drag, noise, and aesthetics.
�May facilitate local performance.
�Decoupling interfaces may require additional mass and space.�One-to-one mapping of functional elements to components prevents; function sharing-the simultaneous implementation of more than one functional element by a single component-potentially resulting in physical redundancy.
Product Development Management
�Requires tight coordination of design tasks.
�Design tasks can be cleanly separated, thus allowing the tasks to be completed in
parallel.�Specialization and division of labor possible.
�Architectural innovation may be difficult.
�Requires the top-down creation of a global product architecture.
�Standardized interfaces may result in additional redundancy and physical "overhead“.

21
Lee and Corey
(1994) Ulrich and Eppinger
(1995) Ericsson and Erixon
(1999) Gu and Sosale
(1999)
Product development and design
Modularization and component standardization;
Design for localization.
Component;
Standardization;
Product variety;
Add-ones;
Flexibility in use;
Product performance;
Product;
Development;
Management;
Adaptation;
Carryover;
Technology evolution;
Planned product changes;
Common unit;
Different;
Specification;
Styling;
Standardization;
Product variety and customization;
Reconfiguration;
Dividing design task for parallel development.
Fabrication Manufacturability Process and/or
organization Production and assembly
improvement
Quality Separate testing
Purchase Supplier available
After sales
Wear, consumption;
Upgrade;
Reuse.
Service and
Maintenance;
Upgrading;
Recycling.
Services;
Upgrading;
Recycling, reuse and disposal.
Source: Kreng & Lee, 2004.
Table 5 Module drivers to optimal modularity.
Gershenson et al. (2003) consider a modular product to be made up of modules; therefore, the
definition of modularity is built upon the definition of modules. Newcomb et al. (1996) define
a module from product design perspective; he states a module is a physical or conceptual
grouping of components. In other word, a module consists of all the physical components in
the module plus the relationship among these components. Marshall et al. (1998) identify
module characteristics from the broadest term, they address this as follows:
� Modules are co-operative subsystems that form a product, manufacturing system,
business etc.
� Modules have their main functional interactions within rather than between modules.
� Modules have one or more well defined functions that can be tested in isolation from
the system and are a composite of the components of the module.
� Modules are independent and self-contained and may be combined and configured
with similar units to achieve a different overall outcome.

22
Marshall et al. (1998) are exponents of the usefulness of modularity in the product design area,
stating that modularity is typically to rationalize product variety through the partitioning of
product functions.
To increase design modularity, Gershenson et al. (1999) provide three design suggestions to
increase the similarity and independence described by Ulrich,
� Attribute Independence: Component attributes have fewer dependencies on attributes
of other module (external attributes),
� Process Independence: Each task of each life-cycle process of each component in a
module has fewer dependencies on the process of external components.
� Process Similarity: Group components and subassemblies that undergo the same or
compatible lifecycle processes into the same module.
Kentaro (2005) looks at the modular product development as updating process; he classifies
modular products into two categories: those with stable modular architectures and those with
evolving modular architectures. In modular product with stable architecture, the standard
module design rules had already established initially, innovation and technique development
focus on independent module components; On the contrary, modular product with evolving
architecture does not have definitive design rules at the beginning, instead continuous
inspecting module interoperability is necessary during the whole product development
process.
As Ulrich proposed, in most cases, there is no absolutely modular or completely integral
architecture exist, what product development team can focuses is that ‘what functional
elements should be treated in a modular way and what ones should be treated in an integral
way’ (Ulrich, 1995). In other words, each product can be seen as having some degree of
modularity. This generates another research question concerning the measurement of
modularity. Generally, different researchers suggest different methods in term of measuring
the degree of modularity, which may covers mathematic matrices, developed formulas,
modeling approaches etc.; however, the foundations are similar, all considering the degree of
component independence and the degree of interface standardization between those
components (Mikkola & Skjott-Larsen, 2004; Voordijk et al., 2006; Mikkola & Gassmann,
2003). We are not interested in how to measure product modularity; instead benefits of
modular products are taken into our consideration.
23
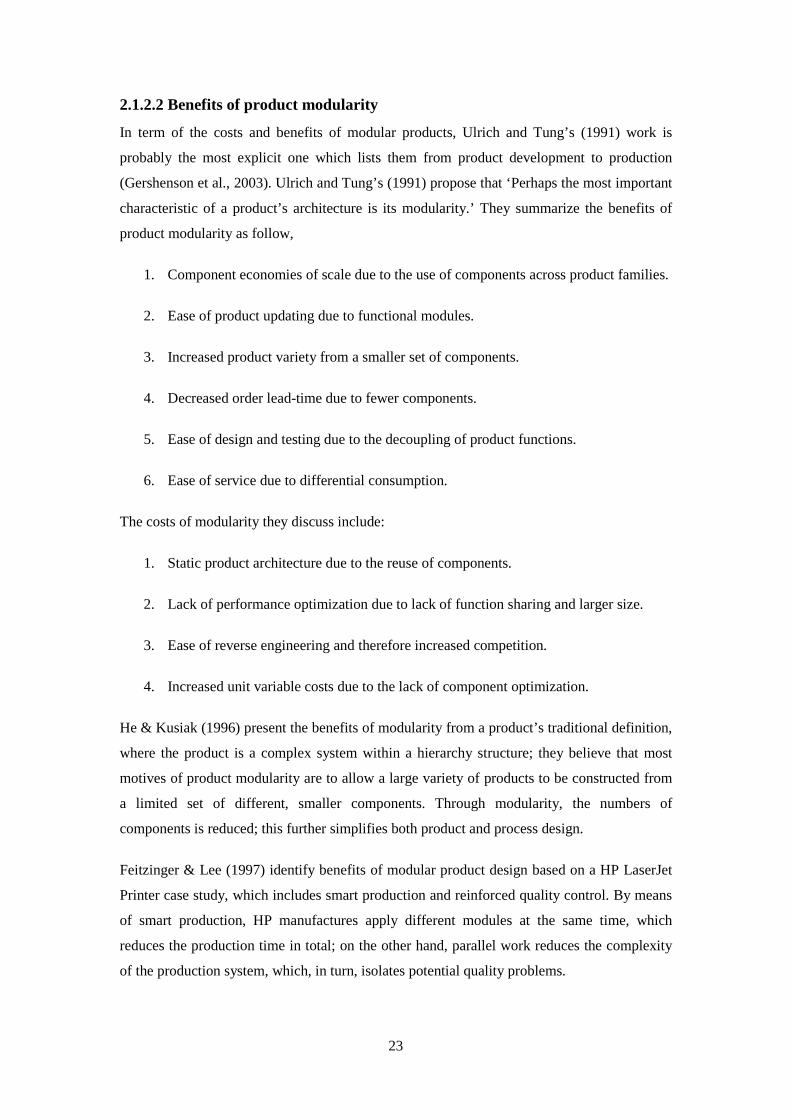
2.1.2.2 Benefits of product modularity
In term of the costs and benefits of modular products, Ulrich and Tung’s (1991) work is
probably the most explicit one which lists them from product development to production
(Gershenson et al., 2003). Ulrich and Tung’s (1991) propose that ‘Perhaps the most important
characteristic of a product’s architecture is its modularity.’ They summarize the benefits of
product modularity as follow,
1. Component economies of scale due to the use of components across product families.
2. Ease of product updating due to functional modules.
3. Increased product variety from a smaller set of components.
4. Decreased order lead-time due to fewer components.
5. Ease of design and testing due to the decoupling of product functions.
6. Ease of service due to differential consumption.
The costs of modularity they discuss include:
1. Static product architecture due to the reuse of components.
2. Lack of performance optimization due to lack of function sharing and larger size.
3. Ease of reverse engineering and therefore increased competition.
4. Increased unit variable costs due to the lack of component optimization.
He & Kusiak (1996) present the benefits of modularity from a product’s traditional definition,
where the product is a complex system within a hierarchy structure; they believe that most
motives of product modularity are to allow a large variety of products to be constructed from
a limited set of different, smaller components. Through modularity, the numbers of
components is reduced; this further simplifies both product and process design.
Feitzinger & Lee (1997) identify benefits of modular product design based on a HP LaserJet
Printer case study, which includes smart production and reinforced quality control. By means
of smart production, HP manufactures apply different modules at the same time, which
reduces the production time in total; on the other hand, parallel work reduces the complexity
of the production system, which, in turn, isolates potential quality problems.
24
Gershenson & Prasad (1997) and Gershenson et al. (1999) consider NPD flexibility as the
main benefit of modularity. They state modularity is useful as it allows the designer to control
the impact of changes and be flexible to response to change by promoting interchangeability.
Also, this flexibility allows for delaying some decision making without delaying the product
development process, since some design decision have a lower impact on the total product.
This, in turn, improves product’s quality because more information is available to make
product decisions.
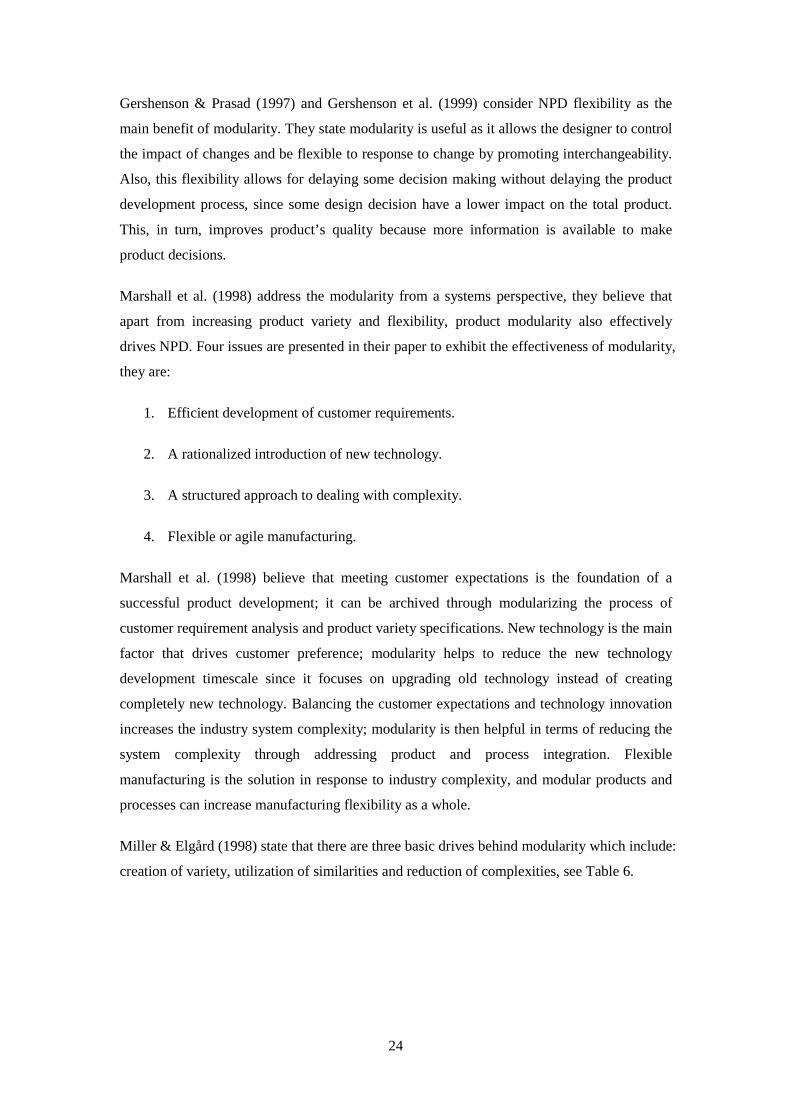
Marshall et al. (1998) address the modularity from a systems perspective, they believe that
apart from increasing product variety and flexibility, product modularity also effectively
drives NPD. Four issues are presented in their paper to exhibit the effectiveness of modularity,
they are:
1. Efficient development of customer requirements.
2. A rationalized introduction of new technology.
3. A structured approach to dealing with complexity.
4. Flexible or agile manufacturing.
Marshall et al. (1998) believe that meeting customer expectations is the foundation of a
successful product development; it can be archived through modularizing the process of
customer requirement analysis and product variety specifications. New technology is the main
factor that drives customer preference; modularity helps to reduce the new technology
development timescale since it focuses on upgrading old technology instead of creating
completely new technology. Balancing the customer expectations and technology innovation
increases the industry system complexity; modularity is then helpful in terms of reducing the
system complexity through addressing product and process integration. Flexible
manufacturing is the solution in response to industry complexity, and modular products and
processes can increase manufacturing flexibility as a whole.
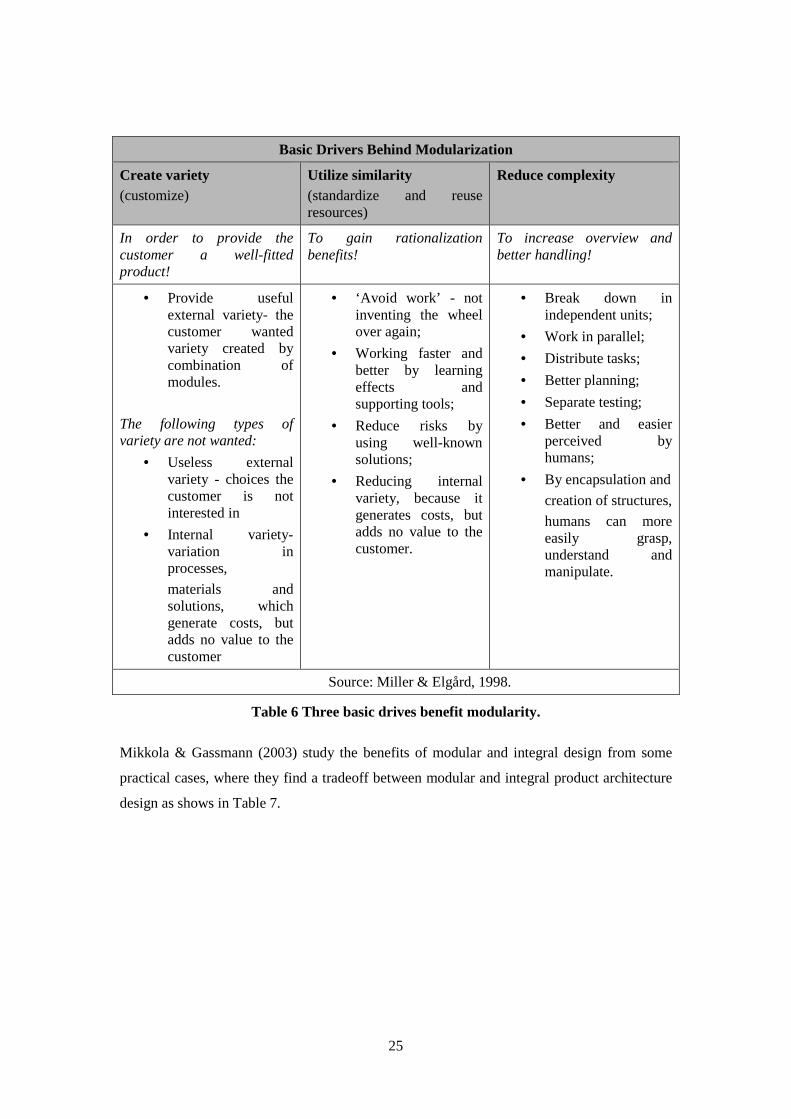
Miller & Elgård (1998) state that there are three basic drives behind modularity which include:
creation of variety, utilization of similarities and reduction of complexities, see Table 6.
25
Basic Drivers Behind Modularization
Create variety (customize)
Utilize similarity (standardize and reuse resources)
Reduce complexity
In order to provide the customer a well-fitted product!
To gain rationalization benefits!
To increase overview and better handling!
• Provide useful external variety- the customer wanted variety created by combination of modules.
The following types of variety are not wanted:
• Useless external variety - choices the customer is not interested in
• Internal variety- variation in processes,
materials and solutions, which generate costs, but adds no value to the customer
• ‘Avoid work’ - not inventing the wheel over again;
• Working faster and better by learning effects and supporting tools;
• Reduce risks by using well-known solutions;
• Reducing internal variety, because it generates costs, but adds no value to the customer.
• Break down in independent units;
• Work in parallel;
• Distribute tasks;
• Better planning;
• Separate testing;
• Better and easier perceived by humans;
• By encapsulation and
creation of structures,
humans can more easily grasp, understand and manipulate.
Source: Miller & Elgård, 1998.
Table 6 Three basic drives benefit modularity.
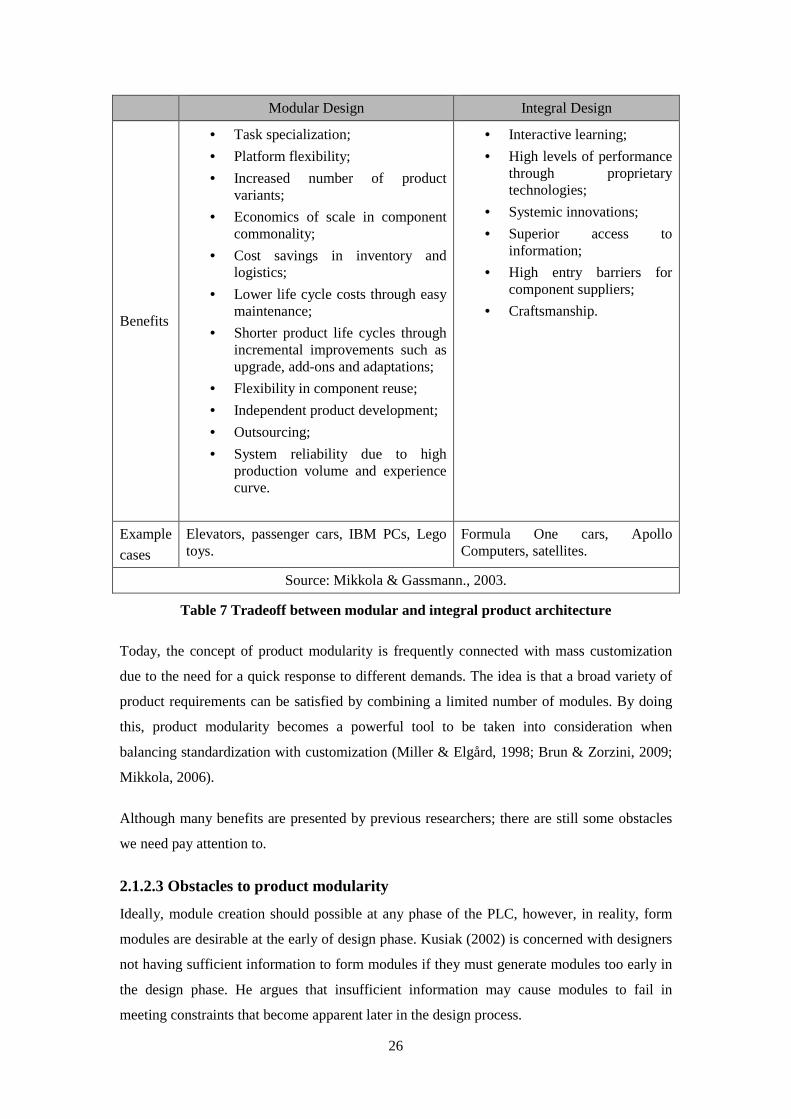
Mikkola & Gassmann (2003) study the benefits of modular and integral design from some
practical cases, where they find a tradeoff between modular and integral product architecture
design as shows in Table 7.
26
Modular Design Integral Design
Benefits
• Task specialization;
• Platform flexibility;
• Increased number of product variants;
• Economics of scale in component commonality;
• Cost savings in inventory and logistics;
• Lower life cycle costs through easy maintenance;
• Shorter product life cycles through incremental improvements such as upgrade, add-ons and adaptations;
• Flexibility in component reuse;
• Independent product development;
• Outsourcing;
• System reliability due to high production volume and experience curve.
• Interactive learning;
• High levels of performance through proprietary technologies;
• Systemic innovations;
• Superior access to information;
• High entry barriers for component suppliers;
• Craftsmanship.
Example
cases
Elevators, passenger cars, IBM PCs, Lego toys.
Formula One cars, Apollo Computers, satellites.
Source: Mikkola & Gassmann., 2003.
Table 7 Tradeoff between modular and integral product architecture
Today, the concept of product modularity is frequently connected with mass customization
due to the need for a quick response to different demands. The idea is that a broad variety of
product requirements can be satisfied by combining a limited number of modules. By doing
this, product modularity becomes a powerful tool to be taken into consideration when
balancing standardization with customization (Miller & Elgård, 1998; Brun & Zorzini, 2009;
Mikkola, 2006).
Although many benefits are presented by previous researchers; there are still some obstacles
we need pay attention to.
2.1.2.3 Obstacles to product modularity
Ideally, module creation should possible at any phase of the PLC, however, in reality, form
modules are desirable at the early of design phase. Kusiak (2002) is concerned with designers
not having sufficient information to form modules if they must generate modules too early in
the design phase. He argues that insufficient information may cause modules to fail in
meeting constraints that become apparent later in the design process.

27
Kusiak (2002) also summarizes three main criticisms of modularity practice:
� Poor understanding of the modularity issue.
� Lack of theory and tools for the definition of modules from a broad perspective,
� Some designers’ do not believe modularity’s advantages since nobody has been able
to demonstrate it to them.
Based on the study of modularity practice, he believes that modularity still has tremendous
unrealized potential as shown in Figure 12, the small white box indicates the current
modularity practice, the four shadowed quadrants represent the unrealized potential of
modularity. The idea is that modularity should be redefined by incorporating the PLC,
considering the varieties of both product and technology and some soft issues as well (various
kind of standards, e.g. technology process modeling standards etc.)
Figure 12 Unrealize potential of modularity (Kusiak, 2002)
Tu et al. (2004) argue that the effectiveness of modularity strategy in term of dealing with
fast-paced change and solving technological problems is complex, however, he states that the
constraints of product modularity is not how to design a modular product, but understanding
what exactly customers need. They believe companies should make an effort to getting closer
to customers in order to gain benefits from modularity.
Although benefits from product modularization had already been recognized by many
companies, they still need pay attention to use it in an appropriate way. Fleming & Sorenson
(2001) state the dangers of modularity in two ways:
1. Excessive use modularity will result undermine the innovation opportunity.

28
2. Change the modularity of component is only one way to alter a technological terrain.
After going through two product design concepts of the PLC and modularization, in the next
section, two product-process design concepts, mass customization and the customer order
decoupling point are presented.
2.2 Product-process design concept
In this section two product-process design concepts are introduced. While mass customization
is concerned with creating high customer value products at low price, the customer order
decoupling point (CODP) is the point in a supply chain process where products change from
being made-to-stock to being made-to-order. Thereby, positioning the CODP in mass
customization involves identifying the optimal balance between the productivity and
flexibility (Rudberg & Wikner, 2004).
2.2.1 Mass customization
With the increasing competition in the business environment, manufacturers have been facing
the challenge of maximizing individual customization while minimizing costs simultaneously.
Mass customization is popular as a solution and finds applications in both manufacturing and
service industries. In the broadest term, the aim of mass customization is to provide customers
with anything they want profitably, any time they want it, anywhere they want it, any way
they want it (Hart, 1995).
Being different from traditional production systems, mass customization involves customers
at the beginning of the value chain, and production is based on the goal of nearly everyone
find exactly what they want with affordable price (Pine, 1993). Hence, profitability is
enhanced through a synergy of increased customer perceived value and cost reduction in
production (Jiao et al., 2002).
This section is organized as follow: in the first section, we review the concept through a study
of existing literature; then, levels of mass customization are classified according to the degree
of customer involvement; after that, success factors and enablers of mass customization
implementation are discussed; finally, some benefits and challenges are carried out.
2.2.1.1 Concept Implication
The term of mass customization was anticipated by Toffler (1971) and coined by Davis (1987)
in his book Future Perfect. Davis predicted that companies would have the technology

29
enabled capability to customize products and effectively compete with mass produced
products.
Pine (1993) brought this concept into industry production arena and explored the operation
management implications in term of adopting mass customization. He describes the
manufacturing aspect of mass customization through mapping the progression from mass
production to mass customization as shown in Table 8. Thus, mass customization as a new
paradigm to provide customized products and services while maintaining near mass
production efficiency is well defined.
Mass Production Mass customization
Focus Efficiency through stability and control. Variety and Customization through
flexibility and quick responsiveness.
Goal
Developing, producing, marketing, and
delivering goods and services at prices
low enough that nearly everyone can
afford them.
Developing, producing, marketing,
and delivering affordable goods and
services with enough variety and
customization that nearly everyone
finds exactly what they want.
Key
features
• Stable demand,
• Large homogeneous markets,
• Low-cost, consistent quality,
standardized goods and
services,
• Long product development
cycles,
• Long product life cycles.
• Fragmented demand,
• Heterogeneous niches,
• Low-cost, high-quality,
customized goods and service,
• Short product development
cycles,
• Short product life cycles.
Product Standardized products built to
inventory.
Standardized modules assembled
based on customer needs.
Structure Mechanistic, bureaucratic and
hierarchical.
Organic, flexible, and relatively less
hierarchical.
Source: Pine, 1993
Table 8 Mass production versus mass customization
Chandra & Kamrani (2004) look at mass customization as a process which is grouped by a set
of interlinked activities, those activities take the responsibility of capturing individual
requirements and translating them into the physical product, which is then produced and
delivered to the customer. Six sub-processes are classified, which are the development sub-

30
process, interaction sub-process, purchasing sub-process, production sub-process, logistics
sub-process, and information sub-process.
Silveira et al. (2001) highlight the value of information technologies and market needs with
respect to mass customization implementation. They propose mass customization as a system
that uses information technology, flexible processes, and organizational structures to deliver a
wide range of products and services that meet specific needs of individual customers at a cost
near that of mass produced items.
Squire et al. (2006) look at mass customization as a dynamic solution by moving the best of
both craft and mass production (see Figure 13) to provide customers with individualized
products at near mass production efficiency.
Figure 13 Positioning mass customization (Squire et al., 2006)
Tseng & Jiao (1996) compare the profit margin between mass customization and mass
production as shown in Figure 14, finding mass customization as standing for low volume and
high variety production which can achieve higher profit margins than mass production.
Figure 14 Economic Implications of Mass Customization (Tseng & Jiao, 1996)
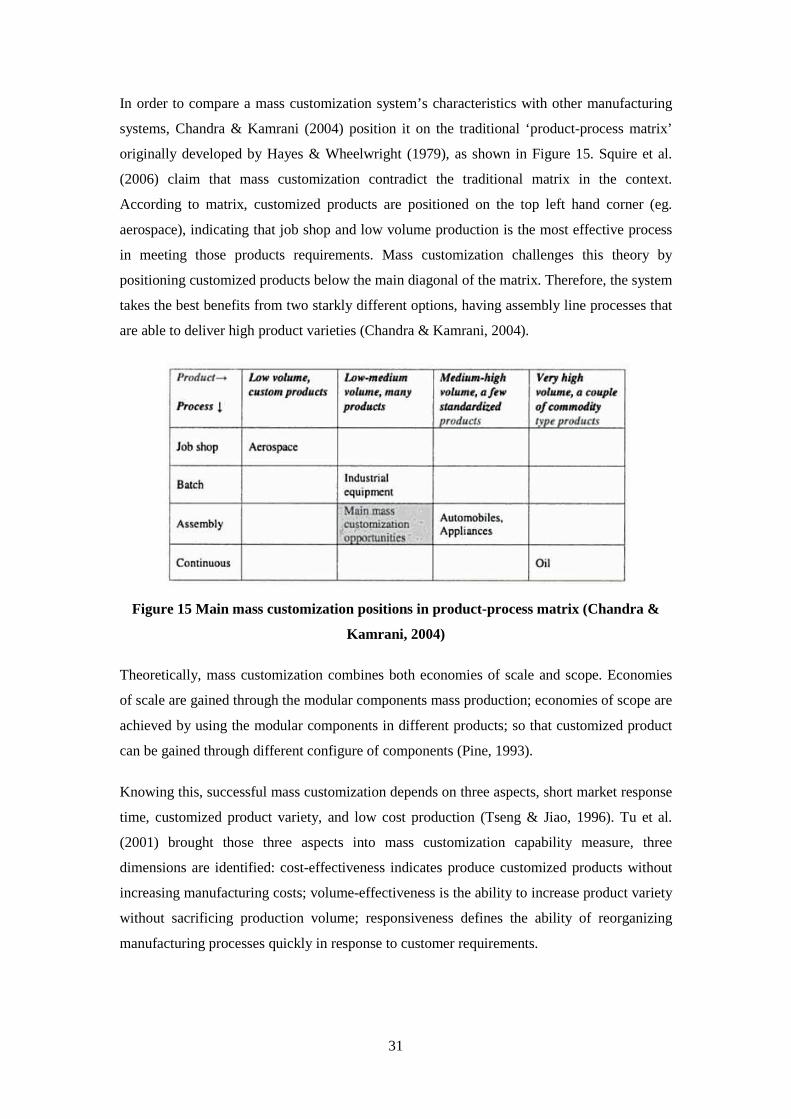
31
In order to compare a mass customization system’s characteristics with other manufacturing
systems, Chandra & Kamrani (2004) position it on the traditional ‘product-process matrix’
originally developed by Hayes & Wheelwright (1979), as shown in Figure 15. Squire et al.
(2006) claim that mass customization contradict the traditional matrix in the context.
According to matrix, customized products are positioned on the top left hand corner (eg.
aerospace), indicating that job shop and low volume production is the most effective process
in meeting those products requirements. Mass customization challenges this theory by
positioning customized products below the main diagonal of the matrix. Therefore, the system
takes the best benefits from two starkly different options, having assembly line processes that
are able to deliver high product varieties (Chandra & Kamrani, 2004).
Figure 15 Main mass customization positions in product-process matrix (Chandra &
Kamrani, 2004)
Theoretically, mass customization combines both economies of scale and scope. Economies
of scale are gained through the modular components mass production; economies of scope are
achieved by using the modular components in different products; so that customized product
can be gained through different configure of components (Pine, 1993).
Knowing this, successful mass customization depends on three aspects, short market response
time, customized product variety, and low cost production (Tseng & Jiao, 1996). Tu et al.
(2001) brought those three aspects into mass customization capability measure, three
dimensions are identified: cost-effectiveness indicates produce customized products without
increasing manufacturing costs; volume-effectiveness is the ability to increase product variety
without sacrificing production volume; responsiveness defines the ability of reorganizing
manufacturing processes quickly in response to customer requirements.

32
2.2.1.2 Levels of mass customization
Customization appears to be a continuum, it can occur at various points along the supply
chain (Mikkola & Skjott-Larsen, 2004; Rudberg & Wikner, 2004). Hence, the level of
customer involvement plays a critical role in the value chain, in determining the product
variety and the type of customization employed (Duray et al., 2000).
Lampel & Mintzberg (1996) divide mass customization into five categories, ranging from
pure standardization to pure customization. Pure standardization leaves no room for
customization; segmented standardization provides customized distribution service;
customized standardization implements final assembly based on customer requirements;
tailored customization includes customer specific components or modules in the final
assemble; pure customization, as the opposite of pure standardization, indicates design for
customization.
Yang & Burns (2003) expand Lampel & Mintzberg (1996)’s model, seven mass
customization strategies are classified based on the point order received, they are, engineering
to order, buy to order, make to order, assemble to order, packaging/labelling to order,
shipment to order and make to forecast.
Gilmore & Pine (1997) believe customization can be achieved not only through customizing
the actual product, but also the representation of the product. They suggest four approaches to
customization called collaborative, adaptive, cosmetic and transparent (see Figure 16).
� Building a direct dialogue between designer and individual customer is the core of
collaborative, where the product is designed and produced according to the
customer’s specific requirements.
� Adaptive customization offers one standard but customizable product, so that
customers can alter it themselves to suit different occasions. The Lutron lighting
system is a good example, allowing customers change the sharp and light of the
system as they want.
� By using a cosmetic strategy, standard product can be presented according to
customers’ requirements, such as different packaging or names.
� Products in the transparent situation are customized without customers’ knowledge.
This strategy is especially suitable for predictable products, where carefully observing
customer behavior becomes the core of success.

33
Figure 16. The four approaches to customization (Gilmore & Pine, 1997)
Duray et al. (2000) believe that the operation of mass customization should consider the
degree of customer involvement and the type of modularity two dimensions. By doing this,
four categories of mass customization can be grouped as shown in Figure 17. Fabricators
closely resemble a pure customization strategy, however modularity is employed to gain
commonality of components; Involvers involve customers early on the production cycle, and
customization is achieved by combining standard modules to meet customers’ requirement;
Modularizes use modular components at the first stages of production but involve customers
during assembly and use; Assemblers provide a wide range of modular components, and
customers specify products based on the assembly-to-order principle. Duray (2002) further
tests this model’s validity by using multiple methods including surveys, plant visits and
feasibility assessment.
Figure 17 Operationalized configurational model (Duray et al., 2000)
Piller (2002) describes two types of mass customization based on the point customization
starts. Soft customization is based on fully standardized manufacturing processes and
Adaptive
CollaborativeChange
No change
No change Change
Transparent
Cosmetic
Product
Representation
Modularizers
Involvers
Design
Fabricators
Assemblers
Point of
Customer
Involvement
Fabrication Assembly Use
Design
Fabrication
Assembly
Use
Modularity Type

34
customization begins from the customers themselves (self customization, e.g. Lutron
Electronics) or customized delivery and service, whereas hard customization starts
customization within the manufacturing process itself and the customer specifications are
expected during production.
Based on a literature study, Silveira et al. (2001) develop a framework including eight levels
of mass customization, being: design, fabrication, assembly, additional custom work,
additional services, package and distribution, usage, and standardization. Taking in order, it
offers a progression to move from pure customization to pure standardization, Figure 18
summaries the generic levels of mass customization from different sources.
Figure 18 Summary of generic levels of mass customization
2.2.1.3 Building blocks of mass customization implementation
Success of mass customization relies on a cumulative achievement of customer sensitivity,
process amenability, competitive environment, organizational and supply chain readiness
(Kotha, 1995; Chandra & Kamrani, 2004; Blecker & Friedrich, 2006, Silveira et al., 2001). In
other words, an effective mass customization program depends on the combinations of those
five factors.
� Customer sensitivity considering customers demand in the first place, the success of
mass customization depends on the balance between potential sacrifice that customers
make and the company’s ability to produce according to customer requirements;
� Process amenability includes technological availability and product customization;
� Competitive environment requires market conditions to be appropriate. First at all, not
all markets are appropriate for mass customization. Mass customization should
Collaborative;
Cosmetic
Pure customization
Segmented standardization
Pure standardization
Engineering to order
Gilmore & Pine
(1997)
Lampel & Mintzberg
(1996)
Yang & Burns
(2003)
Silveira et al.
(2001)
Piller
(2002)
Hard
Soft
Duray et al.
(2000)
Fabricators;
Modularizers;
Tailored customization
Customized standardization
Adaptive
8. Design
7. Fabrication
6. Assembly
5. Additional custom work
4. Additional services
3. Package and distribution
2. Usage
1. Standardization
Transparent
Involvers
Assemblers
Buy to order;
Make to order
Assembly to order;
Packaging to order;
Shipment to order
Make to forecast

35
consider industry characteristics and companies’ business segmentation in the first
place. For example, customers of commodity products or government services often
bar customization (Pine et al., 1993). Secondly, the stage of the PLC needs to be
identified. As Pine (1993) states that the ideal point of mass customization is during
the maturity and decline stages of the PLC, when customers are familiar with the
products and know exactly what they want (Comstock et al., 2004).
� Organizational readiness indicates firm’s attitudes, culture and resources should be
ready to transform demand into products.
� Supply chain readiness means the collaboration readiness between suppliers,
distributors and retailers.
Based on those factors, Silveira et al. (2001) provide some enabler practices to support the
implementation of the system.
� Agility practice combines the best of both agile and lean manufacturing, which offers
customized products with quickly response and affordable price.
� Supply chain management practice concerning the supply value chain as a whole, and
competitive advantage depends on the coordination of resources and the collaboration
between suppliers and customers.
� Advanced manufacturing technologies (e.g. flexible manufacturing systems etc.) and
network technologies (e.g. computer-aided design, computer integrated
manufacturing etc.), as technological foundations are vital to determine the success of
mass customization.
2.2.1.4 Mass customization benefits and challenges
There is no doubt concerning the benefit of mass customization as a strategic concept, which
enables companies gain both economies of scale and scope, as a result to outpace competitors.
However, as an implementation concept, the success of mass customization depends very
much on ‘how to do it’ rather than the concept itself (Duray, 2002).
Blecker & Friedrich (2006) identify the challenges in implementing a successful mass
customization into external and internal complexity. While external complexity considers
customer’s uncertainty, internal complexity is mainly due to the proliferation of product
variety which negatively affects the companies’ operations.
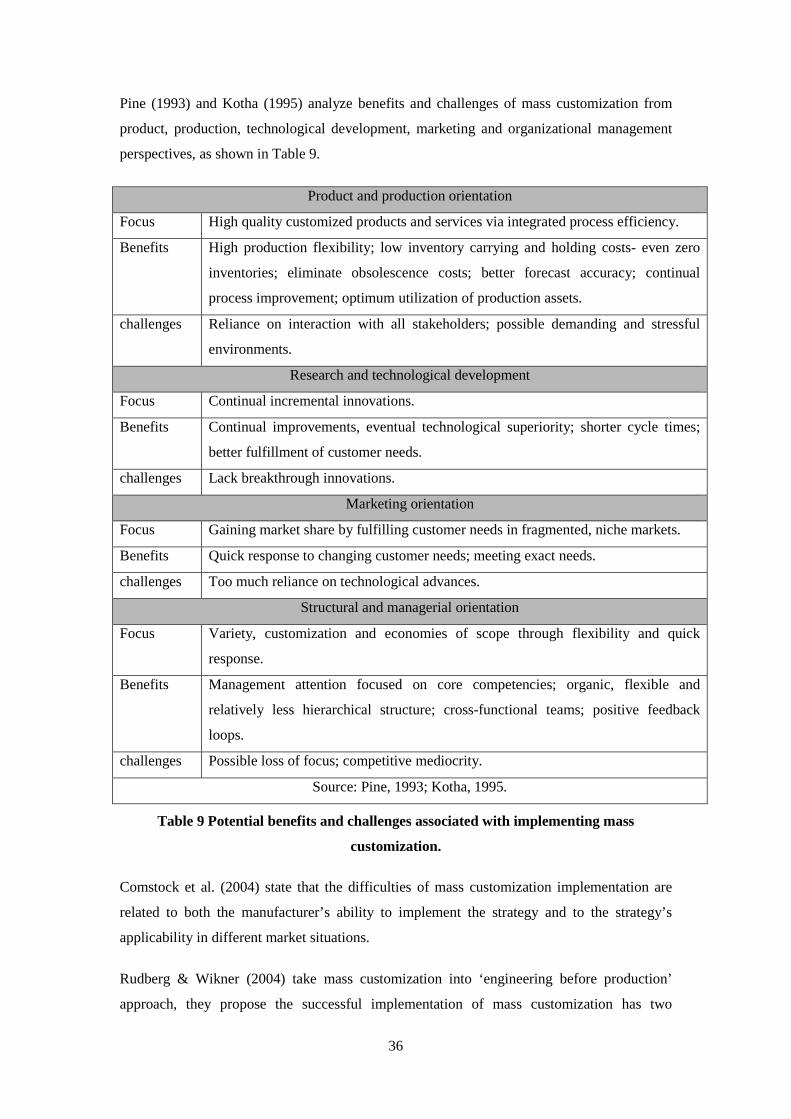
36
Pine (1993) and Kotha (1995) analyze benefits and challenges of mass customization from
product, production, technological development, marketing and organizational management
perspectives, as shown in Table 9.
Product and production orientation
Focus High quality customized products and services via integrated process efficiency.
Benefits High production flexibility; low inventory carrying and holding costs- even zero
inventories; eliminate obsolescence costs; better forecast accuracy; continual
process improvement; optimum utilization of production assets.
challenges
Reliance on interaction with all stakeholders; possible demanding and stressful
environments.
Research and technological development
Focus Continual incremental innovations.
Benefits Continual improvements, eventual technological superiority; shorter cycle times;
better fulfillment of customer needs.
challenges Lack breakthrough innovations.
Marketing orientation
Focus Gaining market share by fulfilling customer needs in fragmented, niche markets.
Benefits Quick response to changing customer needs; meeting exact needs.
challenges Too much reliance on technological advances.
Structural and managerial orientation
Focus Variety, customization and economies of scope through flexibility and quick
response.
Benefits Management attention focused on core competencies; organic, flexible and
relatively less hierarchical structure; cross-functional teams; positive feedback
loops.
challenges Possible loss of focus; competitive mediocrity.
Source: Pine, 1993; Kotha, 1995.
Table 9 Potential benefits and challenges associated with implementing mass
customization.
Comstock et al. (2004) state that the difficulties of mass customization implementation are
related to both the manufacturer’s ability to implement the strategy and to the strategy’s
applicability in different market situations.
Rudberg & Wikner (2004) take mass customization into ‘engineering before production’
approach, they propose the successful implementation of mass customization has two

37
constrains, firstly, finds a mechanism that combines each customer’s specification in product
design and/or product production; then, finds appropriate production and distribution
strategies to delivery customer-specific products at a competitive price.
Pine (1993) claims the advent of mass customization was assumed to eliminate trade-offs
between customization and other objectives, companies could have it all. Fujita (2002)
extends this trade-off, believing that mass customization faces the challenge of balancing the
tradeoff between product variety and production costs, where product variety leads to a
potential increase of both sales and production cost. Fisher (1997) believes that mass
customization is not necessarily cheap. He uses Henry Ford success in changing the
company’s strategy back to mass production to slash labor costs as an example, exhibiting the
expense of mass customization.
Silveira et al. (2001) highlight the difficulty of information transfer from customers to
manufacturers, they claim the customer-manufacturer interface management is the core to
developing and implementing a mass customization program. Zipkin (2001) agrees to Silveira
et al. (2001)’s proposition, believing that mass customization requires a highly flexible
production technology and information system. However, developing such technologies and
systems can be expensive and time-consuming.
2.2.2 The Customer Order Decoupling Point
Effective supply chain management requires companies to develop innovative strategies that
match supply and demand in an uncertain and dynamic environment. The decoupling point
(DP), also called customer order decoupling point (CODP) (van Hoek, 2001; Wikner &
Rudberg, 2005b) or order penetration point (OPP) (Sharman, 1984; Olhager, 2003) is
popularly used as a strategic tool to enhance the process efficiency through reconfiguring the
supply chain process structure.
This section is organized as follow, firstly, we compare the difference between information
DP and material DP from supply chain dynamics point of view; then, we define the material
DP concept and discuss its characteristics; after that, factors affecting the positioning of the
material DP are carried out; finally, different models relate to positioning the material DP are
discussed.
2.2.2.1 Information and material decoupling points
Considering the supply chain dynamics, the whole supply chain can be seen as a ‘U’ shaped
process with orders following an information pipeline upstream and products flowing
downstream along a physical (material) pipeline. Therefore, there are two separate DPs
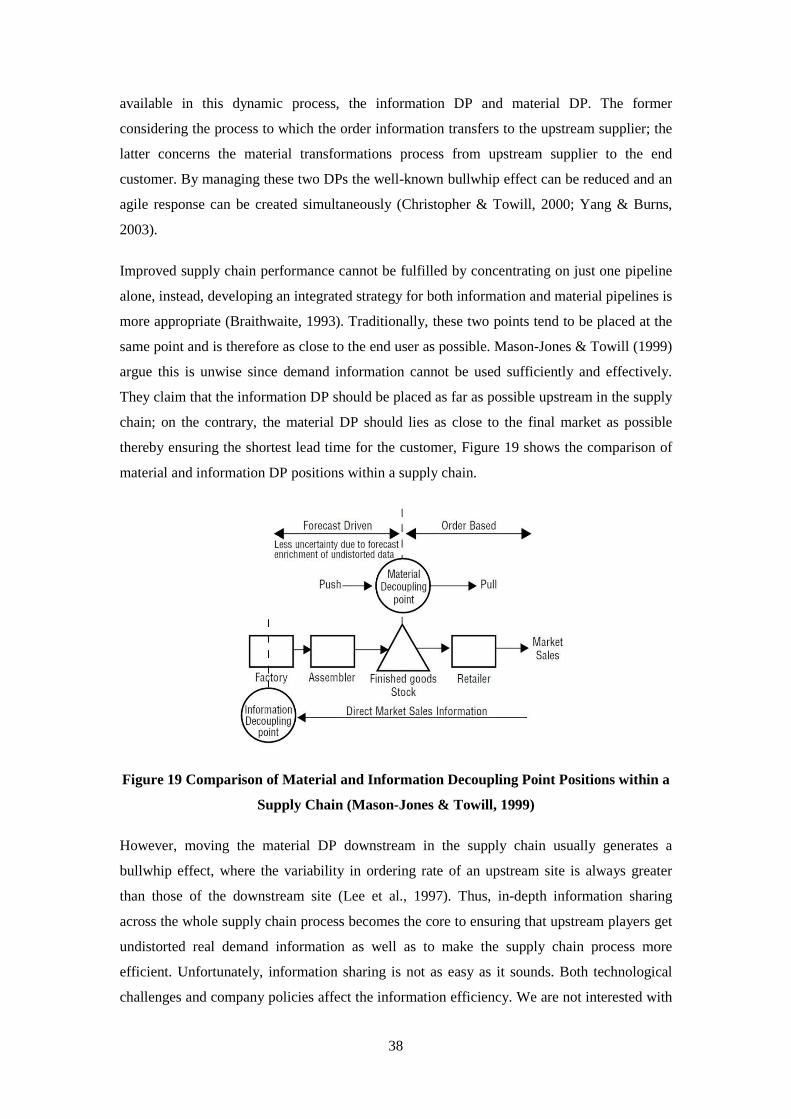
38
available in this dynamic process, the information DP and material DP. The former
considering the process to which the order information transfers to the upstream supplier; the
latter concerns the material transformations process from upstream supplier to the end
customer. By managing these two DPs the well-known bullwhip effect can be reduced and an
agile response can be created simultaneously (Christopher & Towill, 2000; Yang & Burns,
2003).
Improved supply chain performance cannot be fulfilled by concentrating on just one pipeline
alone, instead, developing an integrated strategy for both information and material pipelines is
more appropriate (Braithwaite, 1993). Traditionally, these two points tend to be placed at the
same point and is therefore as close to the end user as possible. Mason-Jones & Towill (1999)
argue this is unwise since demand information cannot be used sufficiently and effectively.
They claim that the information DP should be placed as far as possible upstream in the supply
chain; on the contrary, the material DP should lies as close to the final market as possible
thereby ensuring the shortest lead time for the customer, Figure 19 shows the comparison of
material and information DP positions within a supply chain.
Figure 19 Comparison of Material and Information Decoupling Point Positions within a
Supply Chain (Mason-Jones & Towill, 1999)
However, moving the material DP downstream in the supply chain usually generates a
bullwhip effect, where the variability in ordering rate of an upstream site is always greater
than those of the downstream site (Lee et al., 1997). Thus, in-depth information sharing
across the whole supply chain process becomes the core to ensuring that upstream players get
undistorted real demand information as well as to make the supply chain process more
efficient. Unfortunately, information sharing is not as easy as it sounds. Both technological
challenges and company policies affect the information efficiency. We are not interested with
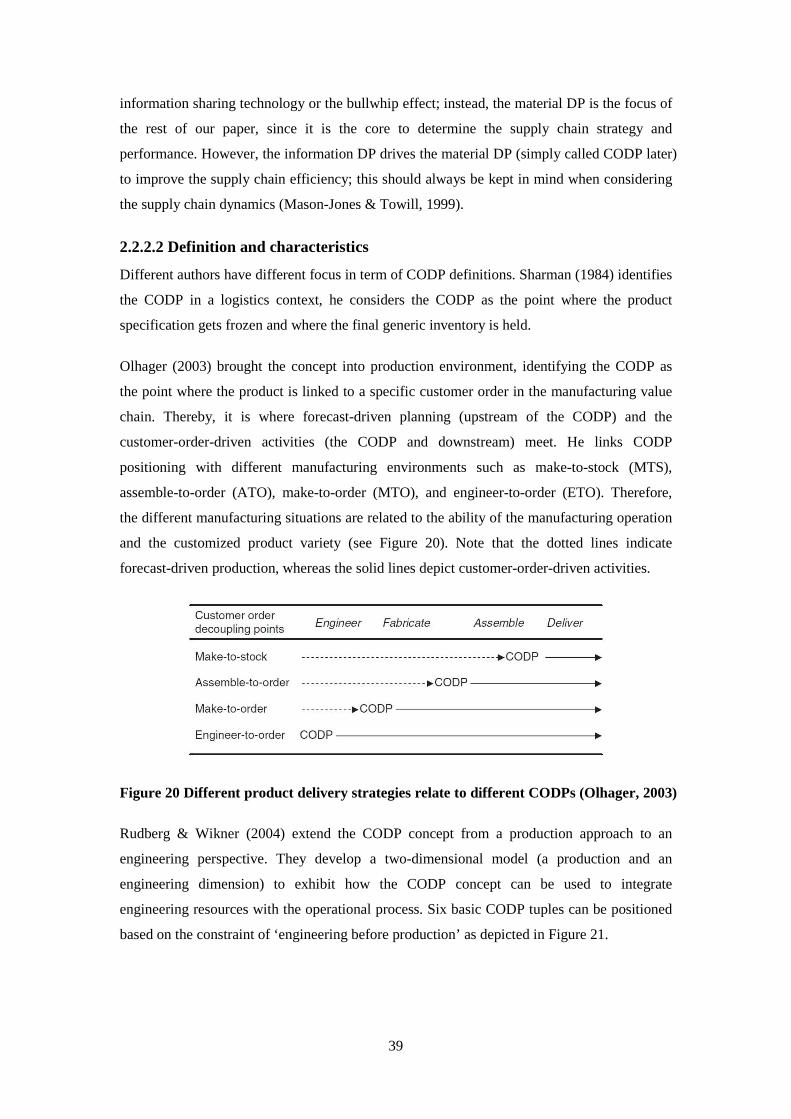
39
information sharing technology or the bullwhip effect; instead, the material DP is the focus of
the rest of our paper, since it is the core to determine the supply chain strategy and
performance. However, the information DP drives the material DP (simply called CODP later)
to improve the supply chain efficiency; this should always be kept in mind when considering
the supply chain dynamics (Mason-Jones & Towill, 1999).
2.2.2.2 Definition and characteristics
Different authors have different focus in term of CODP definitions. Sharman (1984) identifies
the CODP in a logistics context, he considers the CODP as the point where the product
specification gets frozen and where the final generic inventory is held.
Olhager (2003) brought the concept into production environment, identifying the CODP as
the point where the product is linked to a specific customer order in the manufacturing value
chain. Thereby, it is where forecast-driven planning (upstream of the CODP) and the
customer-order-driven activities (the CODP and downstream) meet. He links CODP
positioning with different manufacturing environments such as make-to-stock (MTS),
assemble-to-order (ATO), make-to-order (MTO), and engineer-to-order (ETO). Therefore,
the different manufacturing situations are related to the ability of the manufacturing operation
and the customized product variety (see Figure 20). Note that the dotted lines indicate
forecast-driven production, whereas the solid lines depict customer-order-driven activities.
Figure 20 Different product delivery strategies relate to different CODPs (Olhager, 2003)
Rudberg & Wikner (2004) extend the CODP concept from a production approach to an
engineering perspective. They develop a two-dimensional model (a production and an
engineering dimension) to exhibit how the CODP concept can be used to integrate
engineering resources with the operational process. Six basic CODP tuples can be positioned
based on the constraint of ‘engineering before production’ as depicted in Figure 21.
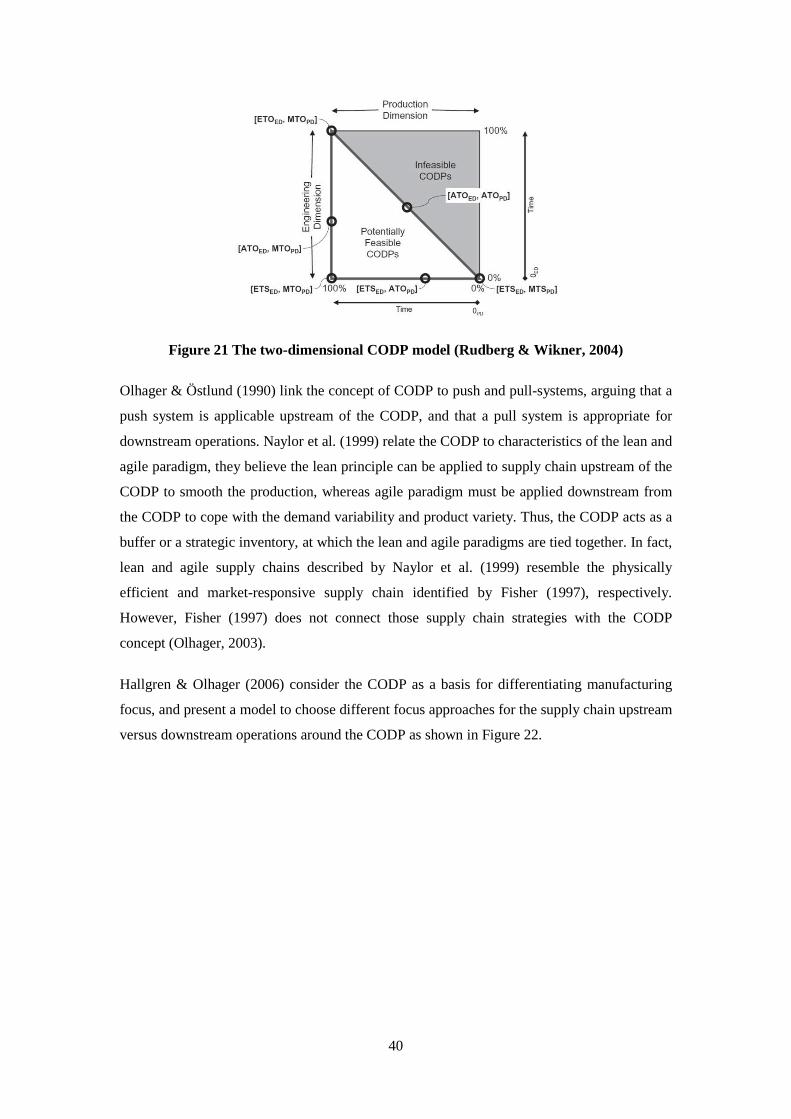
40
Figure 21 The two-dimensional CODP model (Rudberg & Wikner, 2004)
Olhager & Östlund (1990) link the concept of CODP to push and pull-systems, arguing that a
push system is applicable upstream of the CODP, and that a pull system is appropriate for
downstream operations. Naylor et al. (1999) relate the CODP to characteristics of the lean and
agile paradigm, they believe the lean principle can be applied to supply chain upstream of the
CODP to smooth the production, whereas agile paradigm must be applied downstream from
the CODP to cope with the demand variability and product variety. Thus, the CODP acts as a
buffer or a strategic inventory, at which the lean and agile paradigms are tied together. In fact,
lean and agile supply chains described by Naylor et al. (1999) resemble the physically
efficient and market-responsive supply chain identified by Fisher (1997), respectively.
However, Fisher (1997) does not connect those supply chain strategies with the CODP
concept (Olhager, 2003).
Hallgren & Olhager (2006) consider the CODP as a basis for differentiating manufacturing
focus, and present a model to choose different focus approaches for the supply chain upstream
versus downstream operations around the CODP as shown in Figure 22.
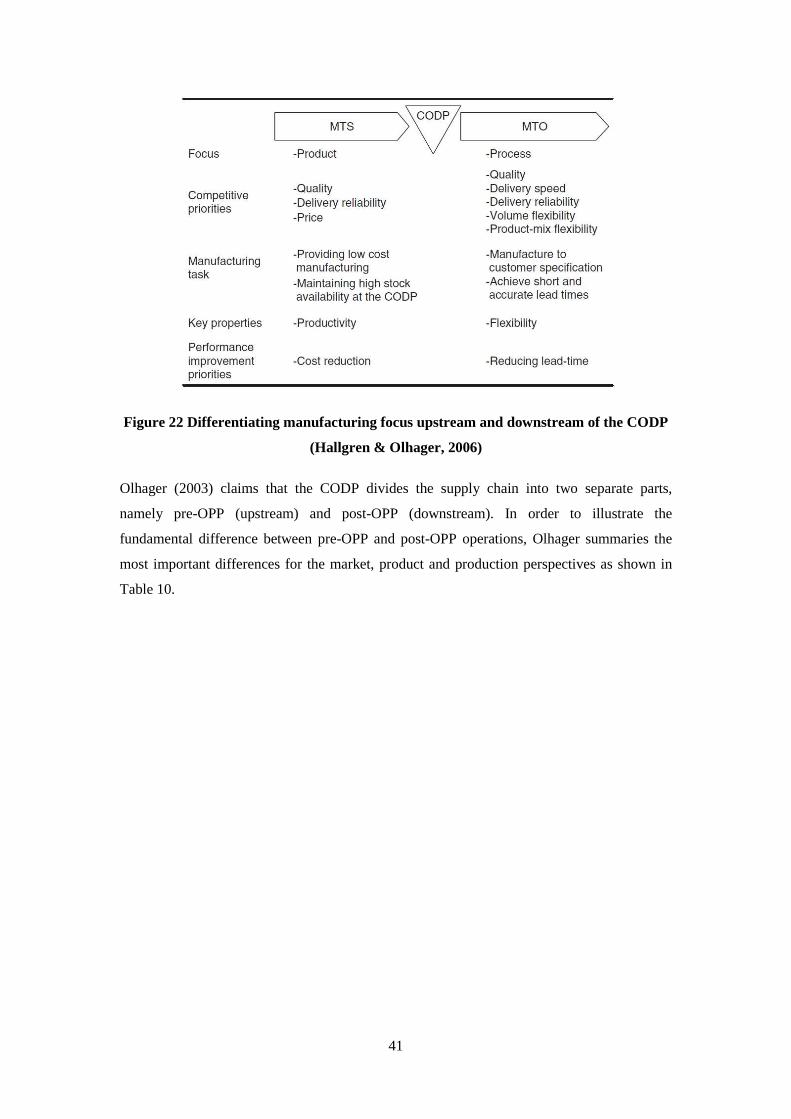
41
Figure 22 Differentiating manufacturing focus upstream and downstream of the CODP
(Hallgren & Olhager, 2006)
Olhager (2003) claims that the CODP divides the supply chain into two separate parts,
namely pre-OPP (upstream) and post-OPP (downstream). In order to illustrate the
fundamental difference between pre-OPP and post-OPP operations, Olhager summaries the
most important differences for the market, product and production perspectives as shown in
Table 10.

42
Attributes Pre-OPP operations Post-OPP operations
Markets and products
Product type Standard, commodities Special
Product range Predetermined, narrow Wide
Demand High volume, predictable Low volume, volatile
Order winners Price Design, flexibility, delivery speed
Market qualifiers Design, quality, on-time delivery Price, quality, on-time delivery
Production (decision categories)
Process Line, high-volume batch Job shop, low-volume batch
Capacity Lag/track Lead/track
Facilities Product focus Process focus
Vertical
integration
• Supplier relationships,
• OPP buffer/post-OPP
operations
• Customer relationships,
• OPP buffer/pre-OPP operations
Quality Process quality focus Product quality focus
Organization Centralized Decentralized
Production
planning
and control
• Level S&OP strategy;
• Order promising based on
stock availability;
• Rate-based material
planning;
• Pull-type execution.
• Chase S&OP strategy;
• Order promising based on lead
time agreement, and material
and capacity availability;
• Time-phased material
planning; Push-type execution
Performance
measurement Cost, productivity Flexibility, delivery lead times
Source: (Olhager, 2003)
Table 10 Comparison of manufacturing strategy attributes for pre-OPP vs. post-OPP
operations
Wikner & Rudberg (2005a) focus on the usefulness of the concept, claiming that the CODP is
used to classify value-adding activities in terms of customer demand, and clarify the need for
different management approaches depending on whether the activities are upstream or
downstream of the DP.
Different supply chain structures can be achieved by altering the position of the CODP
(Mason-Jones et al., 2000). In other words, matching different degree of forecast-driven and
customer-order-driven activities generates different supply chain strategies. Pagh & Cooper

43
(1998) propose four generic supply chain specification-postponement strategies through
separating the supply chain process into manufacturing and logistics parts, they are: the full
speculation strategy, the manufacturing postponement strategy, the logistics postponement
strategy, and the full postponement strategy (see Figure 23).
� Manufacturing operations in the full speculation strategy is based on inventory
forecast, where the CODP positioning is at the finished warehouse level. A standard
product with low demand uncertainty is the major characteristic of this strategy.
� The CODP in the manufacturing postponement strategy is located before the finished
warehouse level, whereas the final manufacturing operation (assembly, packaging or
labeling etc.) will perform until customer orders have been received.
� The logistics postponement strategy can be seen as the combination of speculative
manufacturing and postponed logistics. In other words, the CODP separates the
whole supply chain based on manufacturing/logistics level and locates at plant of
central warehouse. Thus, all manufacturing operations are inventory oriented, only
logistics operations are customer order initiated.
� Both manufacturing and logistics operations are customer order based in the full
postponement strategy, where the CODP is located inside the production plant. This
strategy is especially suitable for highly customized products with high demand
uncertainty.

44
Figure 23 Different CODP positions in term of different supply chain strategies (Mason-
Jones & Towill, 1999)
2.2.2.3 Factors affect the CODP positions
The positioning of the CODP depends on many factors. Sharman (1984) states that the CODP
position depends on a balance between competitive pressure and product cost/complexity. He
believes the CODP vary from industry to industry, and determines by product design,
customer segmentation, and market conditions. Olhager & Östlund (1990) argue that the
CODP can be assigned at any point of the value chain, and manufacturing environment plays
a critical role from a planning point of view. By using a system dynamics model,
Hedenstierna & Ng (2010) highlight the importance of demand signal characteristics with
respect to the optimal placement of the CODP. Pagh & Cooper (1998) believe the
combination of three decision categories, the product, the market and demand, the
manufacturing and logistic system, need to be considered to exam the CODP positions, a
number of decision determinants include: Product life cycle, monetary density, value profile,
product design characteristics, delivery time, frequency of delivery, demand uncertainty,
economies of scale and special knowledge.

45
Olhager’s (2003) conceptual impact model probably is the most explicit one, which not only
listing and grouping all factors, but also creates the relationship between them (see Table 11).
Table 11 Factors affecting the positioning of the CODP
2.2.2.4 Positioning the CODP
The CODP is an important element in the supply chain process and its positioning is critical
to determine the supply chain structure and performance (Yang & Burns, 2003). Rudberg &
Wikner (2004) suggest that positioning the CODP involves identifying the optimal balance
between the productivity force and flexibility force, as shown in Figure 24. When companies
take price as an OW, the productivity force pushes the CODP downstream and close to end
customers, so that the operational efficiency is enhanced. On the contrary, when flexibility is
Delivery lead-timerequirements
Restricts how far backwards the CODP can be positioned.Considering delivery speed as an OW, and production lead time can
Product demand volatility Low demand volatility indicates forecast-driven production, and vice
Product volume This factor indicates company’s strategy (OW) shifting based on the stage of the PLC. For example, demand volume increase duringtheinitial stage of the PLC, wherefore the OW may change from
Product range and productcustomization requirements
A narrow product range and low customization requirement aresuitable for an MTS production system, and vice versa.
Customer order size andfrequency
Large customer order size indicates high volume demand, andhighfrequency leads to easier forecast.
Seasonal demand Manufacturing some products to stock in low demand season inanticipation of peak demand period. Thus, smooth production and
Modular product design Increase product variety and reduce delivery lead time.Customization opportunities High level of customizationrequired at early production stage should
use MTO policy to reach flexibility, and vice versa.Material profile Different material profile suits different manufacturing situations.
For example A and T profiles represent ATO situation.Product structure The breadth and depth of the product structure indicating the
product complexity, which determines the production lead time.
Production lead time Important factor to determine the delivery lead time.
Planning points The number of planning points restricts the potential CODPFlexibility Production process flexibility, such as through short set-up times.
Bottleneck The position of the bottleneck affects the position of the CODPdifferently according to different production principles, e.g.Bottleneck at just-in-time principle should positions downstream of
Sequence-dependent set-uptimes
Resources with sequence-dependent set-up times are bestpositioned upstream the CODP.
Market-related factors
Product-related factors
Production-related factors
Source: Olhager, 2003
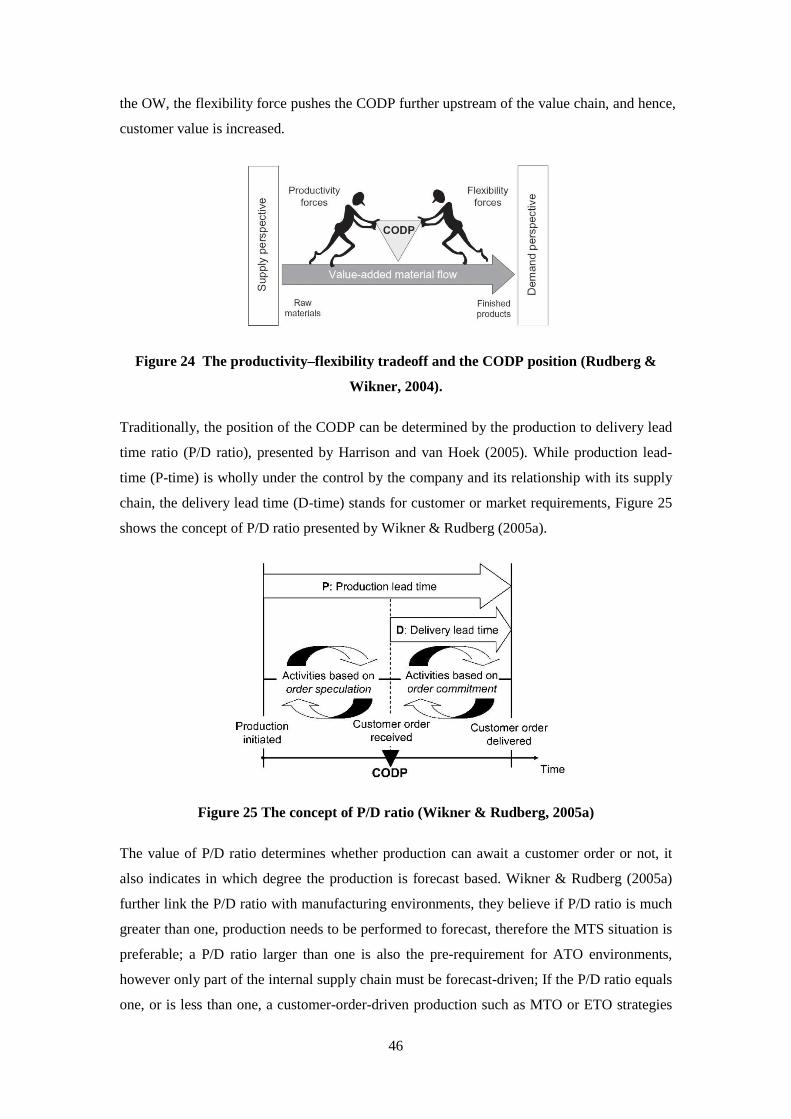
46
the OW, the flexibility force pushes the CODP further upstream of the value chain, and hence,
customer value is increased.
Figure 24 The productivity–flexibility tradeoff and the CODP position (Rudberg &
Wikner, 2004).
Traditionally, the position of the CODP can be determined by the production to delivery lead
time ratio (P/D ratio), presented by Harrison and van Hoek (2005). While production lead-
time (P-time) is wholly under the control by the company and its relationship with its supply
chain, the delivery lead time (D-time) stands for customer or market requirements, Figure 25
shows the concept of P/D ratio presented by Wikner & Rudberg (2005a).
Figure 25 The concept of P/D ratio (Wikner & Rudberg, 2005a)
The value of P/D ratio determines whether production can await a customer order or not, it
also indicates in which degree the production is forecast based. Wikner & Rudberg (2005a)
further link the P/D ratio with manufacturing environments, they believe if P/D ratio is much
greater than one, production needs to be performed to forecast, therefore the MTS situation is
preferable; a P/D ratio larger than one is also the pre-requirement for ATO environments,
however only part of the internal supply chain must be forecast-driven; If the P/D ratio equals
one, or is less than one, a customer-order-driven production such as MTO or ETO strategies
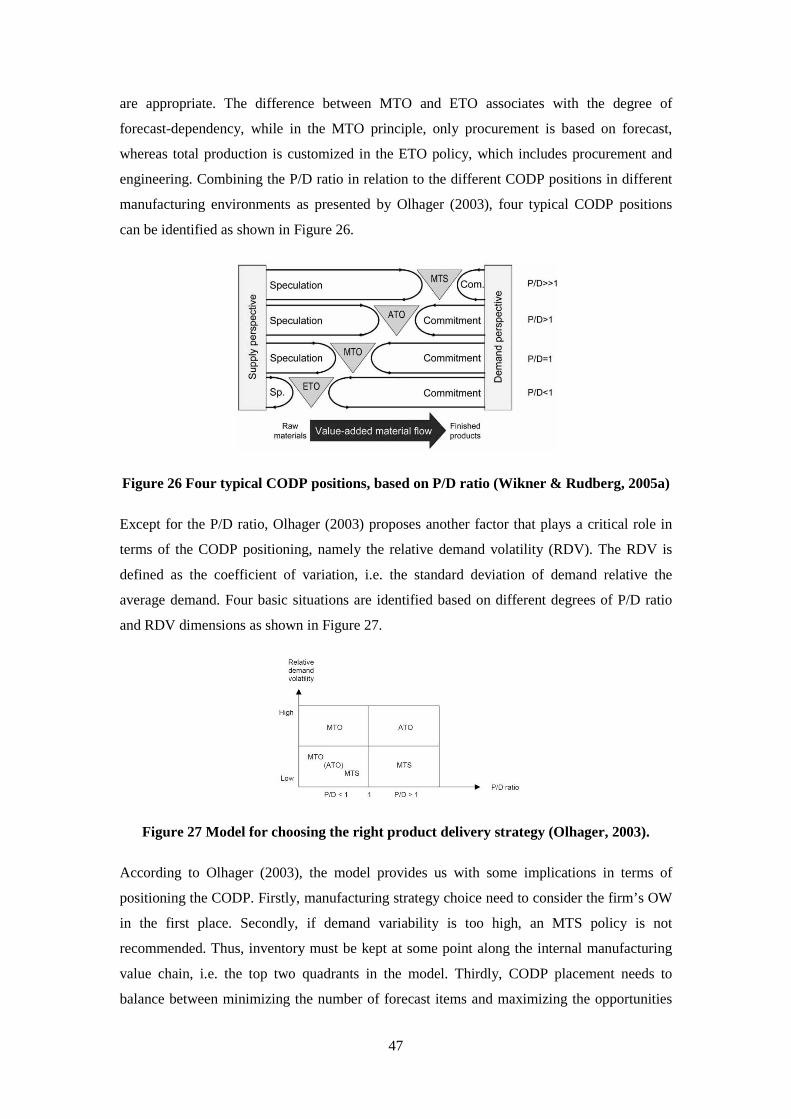
47
are appropriate. The difference between MTO and ETO associates with the degree of
forecast-dependency, while in the MTO principle, only procurement is based on forecast,
whereas total production is customized in the ETO policy, which includes procurement and
engineering. Combining the P/D ratio in relation to the different CODP positions in different
manufacturing environments as presented by Olhager (2003), four typical CODP positions
can be identified as shown in Figure 26.
Figure 26 Four typical CODP positions, based on P/D ratio (Wikner & Rudberg, 2005a)
Except for the P/D ratio, Olhager (2003) proposes another factor that plays a critical role in
terms of the CODP positioning, namely the relative demand volatility (RDV). The RDV is
defined as the coefficient of variation, i.e. the standard deviation of demand relative the
average demand. Four basic situations are identified based on different degrees of P/D ratio
and RDV dimensions as shown in Figure 27.
Figure 27 Model for choosing the right product delivery strategy (Olhager, 2003).
According to Olhager (2003), the model provides us with some implications in terms of
positioning the CODP. Firstly, manufacturing strategy choice need to consider the firm’s OW
in the first place. Secondly, if demand variability is too high, an MTS policy is not
recommended. Thus, inventory must be kept at some point along the internal manufacturing
value chain, i.e. the top two quadrants in the model. Thirdly, CODP placement needs to
balance between minimizing the number of forecast items and maximizing the opportunities

48
to take advantage of economies of scale. For example, the lower left quadrant in the model,
theoretically, an MTO strategy should be appropriate. However, since small RDV indicates
stable demand, MTS or ATO strategies may be recommended gaining economies of scale and
increasing productivity simultaneously. Finally, the ATO strategy splits the supply chain
around the CODP, which must be MTS upstream and MTO downstream of the CODP, so that
maximum manufacturing efficiency upstream and inventory flexibility downstream can be
gained at the same time, while maintaining a high level of customer service level, i.e. the
upper right hand corner of the model.
2.3 Supply Chain Management
A key feature of present-day business is the idea that it is supply chains that compete, not
companies (Christopher, 1992); this means the success of supply chain management is the
key for company to not only survival but also gain competitive advantage. In this section, the
supply chain structure and postponement are presented as two core concepts are, with the aim
of understanding different supply chain strategies and their benefits.
2.3.1 Supply chain structure
To understand the supply chain structure, we first differentiate the concepts of supply chain,
supply chain management and logistics; then, two basic supply chain management approaches
- leanness and agility are introduced; considering the complementary aspects of these two
approaches, a hybrid lean/agile strategy is finally presented, granting the benefits of both.
2.3.1.1 Definitions and concepts
The term supply chain has risen to prominence over the past twenty years. Nowadays, it
becomes a ‘hot topic’ covered both academic and practice area (Mentzer et al. 2001). In term
of definitions of ‘supply chain’ and ’supply chain management’, there is a great difference
between authors (Cooper & Ellram, 1993). The purpose of this section is to review and to
classify the definitions of both supply chain and supply chain management in order to gets a
thorough understanding of the similarities and differences between them.
Harrison & van Hoek (2005) state that a supply chain is a group of partners that pass material
forward in order to increase end customer value. By partners, suppliers, producers, assemblers
and retailer, are considered, or in other words, all participants in a supply chain who have
responsibility to add value to a product.

49
Some definitions view supply chain as a network of organizations, those organizations are
connected or otherwise interdependent and cooperatively work together to control, manage
and improve material and information flows from suppliers to end users (Aitken, 1998).
Figure 28 illustrates how a focal firm at the center of the network connects with upstream and
downstream organizations.
Figure 28 The supply chain network (Christopher, 2005)
Hopp (2003) defines the supply chain as a goal-oriented network of processes and stock-
points used to deliver goods and services to customers, where processes and stock-points are
connected by a network.
Mentzer et al. (2001) define supply chain from channel relationship perspective, they propose
supply chain as a set of three or more entities (organizations and individuals) directly
involved in the upstream and downstream flows of products, service, finance and/or
information from a source to a customer. Three degrees of supply chain complexity are
included, these are: direct, extended and ultimate supply chain as shown in Figure 29. In
direct supply, three parties (supplier, firm and customer) simply connect in sequence;
immediate suppliers and customers are considered in the extended supply chain; the ultimate
structure includes all of the organizations in supply chain, in our example three service parties
are involved, they are financial providers, third party logistics and a market research firm.
Figure 29 Types of channel relationship (Mentzer et al., 2001)

50
Porter (1985) presents the supply chain as a value chain, which can be categorized into two
types, primary activities (include inbound logistics, operations, outbound logistics, marketing
and sales, service) and support activities (firm infrastructure, human resource management,
technology development, procurement) as shown in Figure 30. The model considers the joint
contribution of all functions in a company and value chains are then aligned in sequence by
networks with suppliers.
Figure 30 The value chain (Porter, 1985)
Although the definition of a supply chain differs greatly across authors, the concept of supply
chain management as the integration of business operations across the supply chain is
commonly recognized.
Cooper et al. (1997) build a new conceptual framework which considers supply chain
management into three core elements: supply chain structure, business process and
management components, as illustrated in Figure 31. The business processes indicate value-
related activities, the management components are used to manage and structure the business
process; the supply chain structure indicates the way of organizing the supply chain
configuration.
Figure 31 Elements in the supply chain management (Cooper et al., 1997)
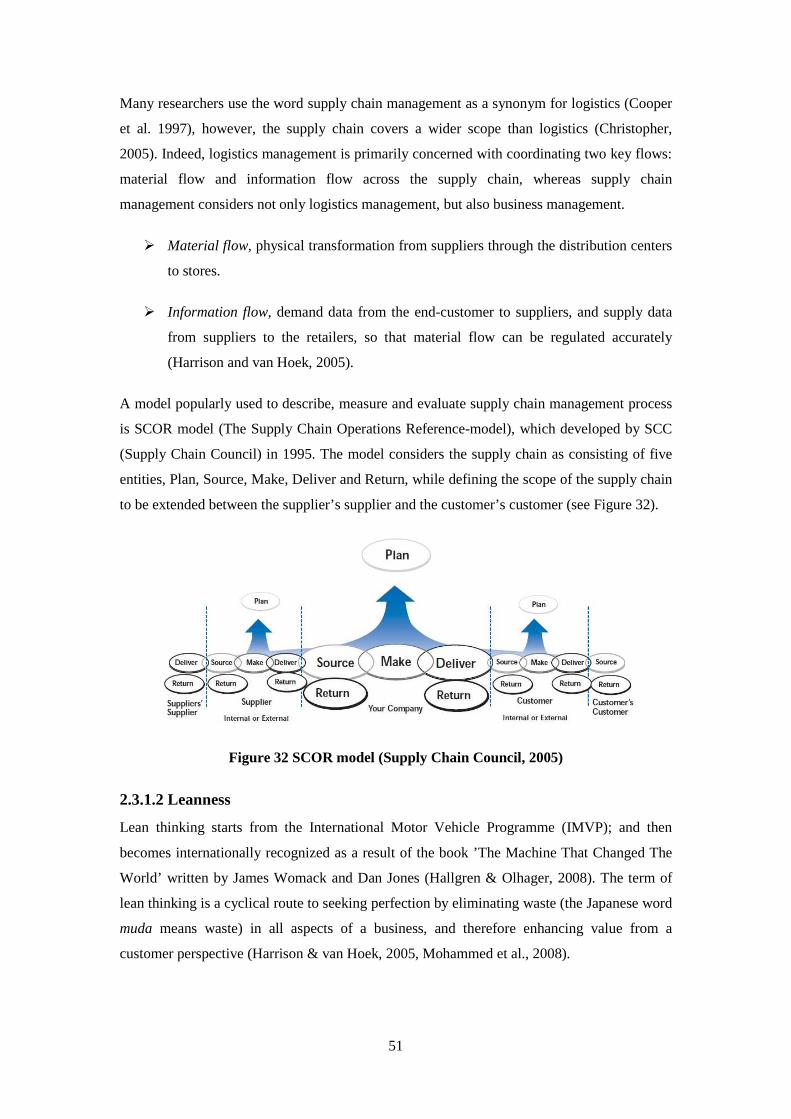
51
Many researchers use the word supply chain management as a synonym for logistics (Cooper
et al. 1997), however, the supply chain covers a wider scope than logistics (Christopher,
2005). Indeed, logistics management is primarily concerned with coordinating two key flows:
material flow and information flow across the supply chain, whereas supply chain
management considers not only logistics management, but also business management.
� Material flow, physical transformation from suppliers through the distribution centers
to stores.
� Information flow, demand data from the end-customer to suppliers, and supply data
from suppliers to the retailers, so that material flow can be regulated accurately
(Harrison and van Hoek, 2005).
A model popularly used to describe, measure and evaluate supply chain management process
is SCOR model (The Supply Chain Operations Reference-model), which developed by SCC
(Supply Chain Council) in 1995. The model considers the supply chain as consisting of five
entities, Plan, Source, Make, Deliver and Return, while defining the scope of the supply chain
to be extended between the supplier’s supplier and the customer’s customer (see Figure 32).
Figure 32 SCOR model (Supply Chain Council, 2005)
2.3.1.2 Leanness
Lean thinking starts from the International Motor Vehicle Programme (IMVP); and then
becomes internationally recognized as a result of the book ’The Machine That Changed The
World’ written by James Womack and Dan Jones (Hallgren & Olhager, 2008). The term of
lean thinking is a cyclical route to seeking perfection by eliminating waste (the Japanese word
muda means waste) in all aspects of a business, and therefore enhancing value from a
customer perspective (Harrison & van Hoek, 2005, Mohammed et al., 2008).
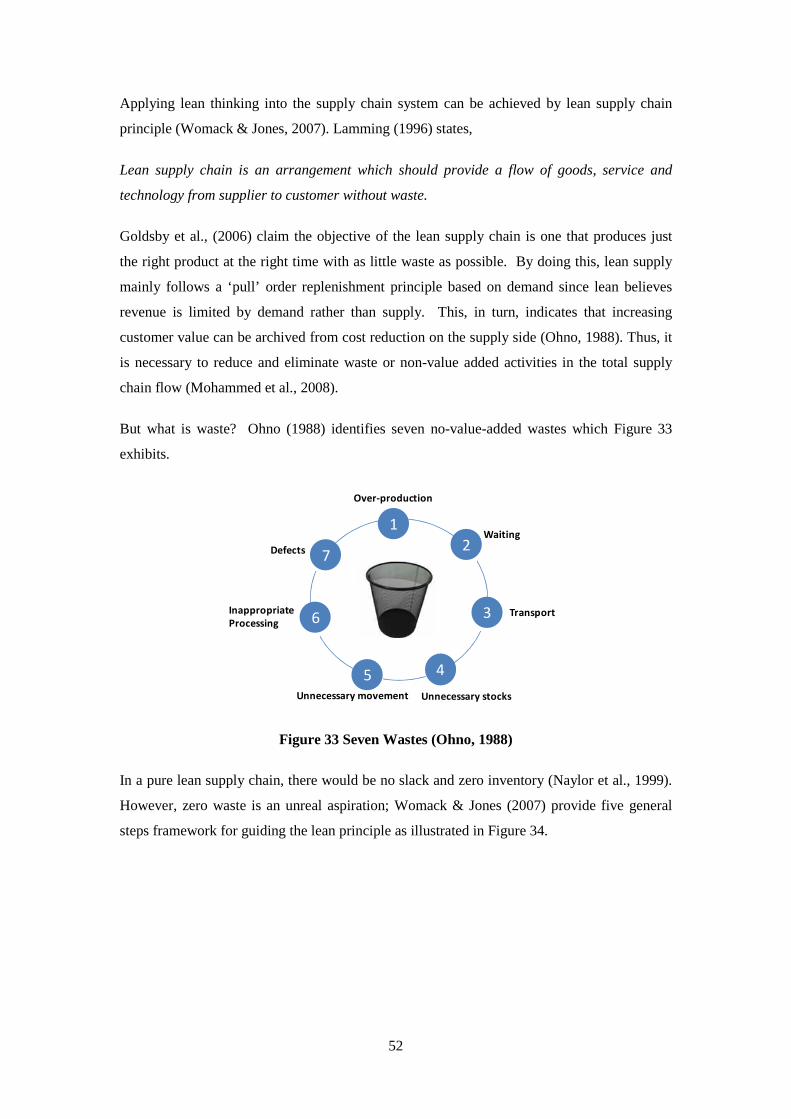
52
Applying lean thinking into the supply chain system can be achieved by lean supply chain
principle (Womack & Jones, 2007). Lamming (1996) states,
Lean supply chain is an arrangement which should provide a flow of goods, service and
technology from supplier to customer without waste.
Goldsby et al., (2006) claim the objective of the lean supply chain is one that produces just
the right product at the right time with as little waste as possible. By doing this, lean supply
mainly follows a ‘pull’ order replenishment principle based on demand since lean believes
revenue is limited by demand rather than supply. This, in turn, indicates that increasing
customer value can be archived from cost reduction on the supply side (Ohno, 1988). Thus, it
is necessary to reduce and eliminate waste or non-value added activities in the total supply
chain flow (Mohammed et al., 2008).
But what is waste? Ohno (1988) identifies seven no-value-added wastes which Figure 33
exhibits.
Figure 33 Seven Wastes (Ohno, 1988)
In a pure lean supply chain, there would be no slack and zero inventory (Naylor et al., 1999).
However, zero waste is an unreal aspiration; Womack & Jones (2007) provide five general
steps framework for guiding the lean principle as illustrated in Figure 34.
6
5 4
3
2
1
7
Over-production
Transport
Waiting
Unnecessary movement
Defects
Inappropriate
Processing
Unnecessary stocks
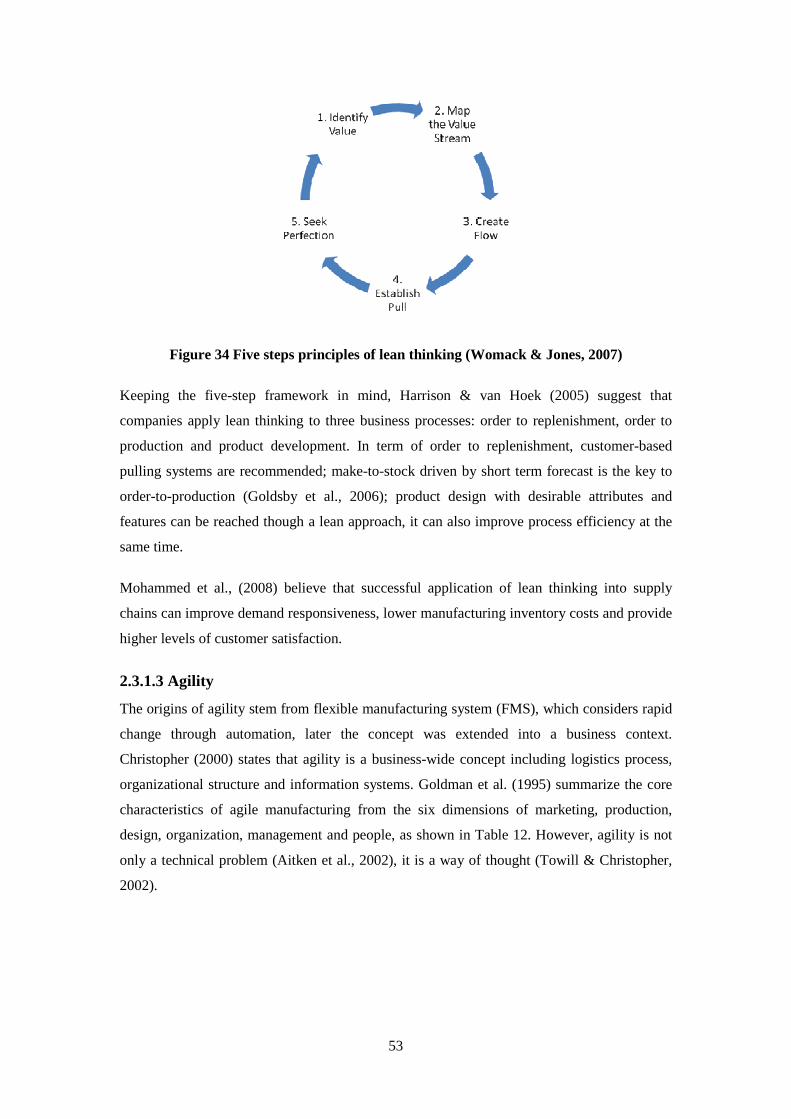
53
Figure 34 Five steps principles of lean thinking (Womack & Jones, 2007)
Keeping the five-step framework in mind, Harrison & van Hoek (2005) suggest that
companies apply lean thinking to three business processes: order to replenishment, order to
production and product development. In term of order to replenishment, customer-based
pulling systems are recommended; make-to-stock driven by short term forecast is the key to
order-to-production (Goldsby et al., 2006); product design with desirable attributes and
features can be reached though a lean approach, it can also improve process efficiency at the
same time.
Mohammed et al., (2008) believe that successful application of lean thinking into supply
chains can improve demand responsiveness, lower manufacturing inventory costs and provide
higher levels of customer satisfaction.
2.3.1.3 Agility
The origins of agility stem from flexible manufacturing system (FMS), which considers rapid
change through automation, later the concept was extended into a business context.
Christopher (2000) states that agility is a business-wide concept including logistics process,
organizational structure and information systems. Goldman et al. (1995) summarize the core
characteristics of agile manufacturing from the six dimensions of marketing, production,
design, organization, management and people, as shown in Table 12. However, agility is not
only a technical problem (Aitken et al., 2002), it is a way of thought (Towill & Christopher,
2002).
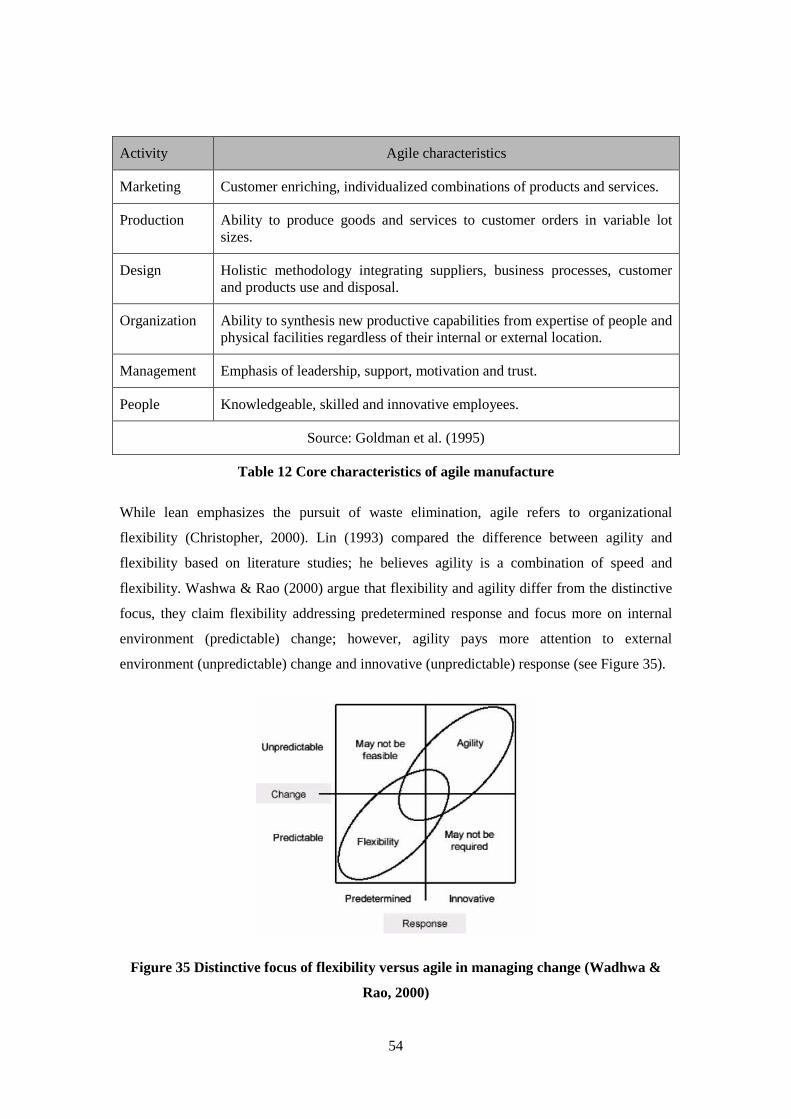
54
Activity Agile characteristics
Marketing Customer enriching, individualized combinations of products and services.
Production Ability to produce goods and services to customer orders in variable lot sizes.
Design Holistic methodology integrating suppliers, business processes, customer and products use and disposal.
Organization Ability to synthesis new productive capabilities from expertise of people and physical facilities regardless of their internal or external location.
Management Emphasis of leadership, support, motivation and trust.
People Knowledgeable, skilled and innovative employees.
Source: Goldman et al. (1995)
Table 12 Core characteristics of agile manufacture
While lean emphasizes the pursuit of waste elimination, agile refers to organizational
flexibility (Christopher, 2000). Lin (1993) compared the difference between agility and
flexibility based on literature studies; he believes agility is a combination of speed and
flexibility. Washwa & Rao (2000) argue that flexibility and agility differ from the distinctive
focus, they claim flexibility addressing predetermined response and focus more on internal
environment (predictable) change; however, agility pays more attention to external
environment (unpredictable) change and innovative (unpredictable) response (see Figure 35).
Figure 35 Distinctive focus of flexibility versus agile in managing change (Wadhwa &
Rao, 2000)
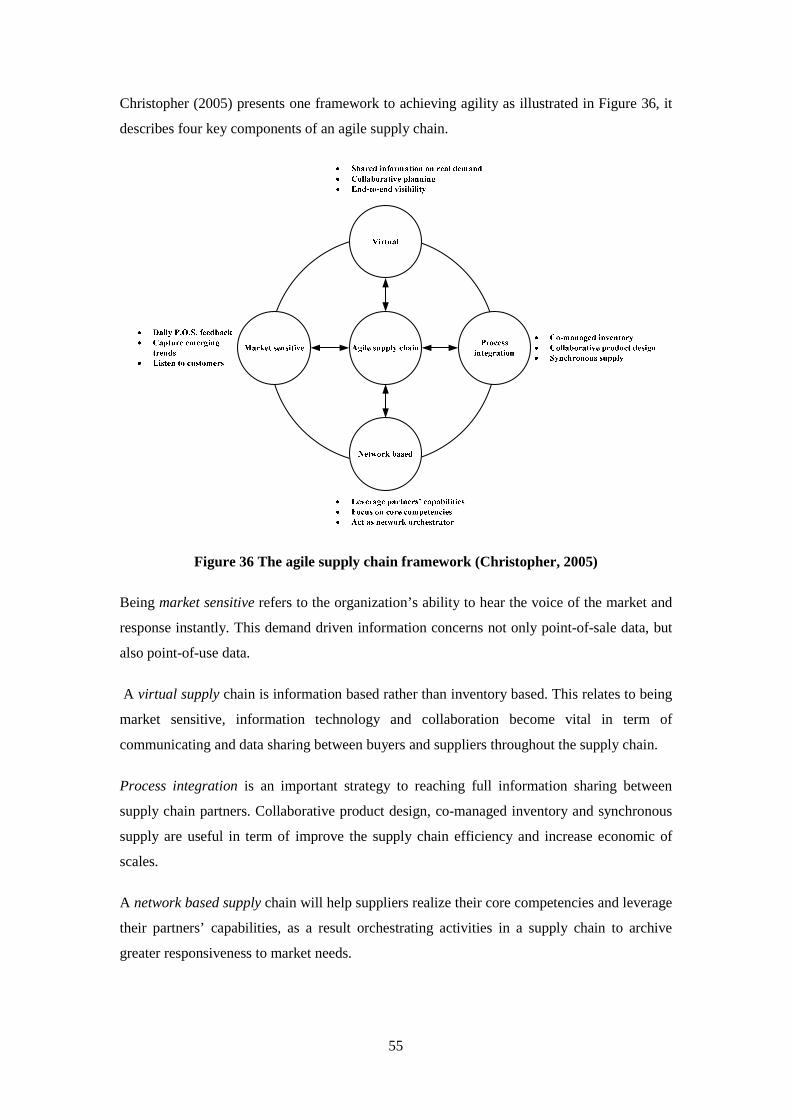
55
Christopher (2005) presents one framework to achieving agility as illustrated in Figure 36, it
describes four key components of an agile supply chain.
Figure 36 The agile supply chain framework (Christopher, 2005)
Being market sensitive refers to the organization’s ability to hear the voice of the market and
response instantly. This demand driven information concerns not only point-of-sale data, but
also point-of-use data.
A virtual supply chain is information based rather than inventory based. This relates to being
market sensitive, information technology and collaboration become vital in term of
communicating and data sharing between buyers and suppliers throughout the supply chain.
Process integration is an important strategy to reaching full information sharing between
supply chain partners. Collaborative product design, co-managed inventory and synchronous
supply are useful in term of improve the supply chain efficiency and increase economic of
scales.
A network based supply chain will help suppliers realize their core competencies and leverage
their partners’ capabilities, as a result orchestrating activities in a supply chain to archive
greater responsiveness to market needs.

56
Another approach of agility is the triple-A supply chain, which stands for agility. Lee (2004)
states ‘the best supply chains aren’t just fast and cost-effective, they are also agile and
adaptable, and ensure that all their companies’ interests stay aligned.’ While agile indicates
quick response to sudden changes; adaptable provides supply chain strategy and structure
flexibility; aligned creates incentive and collaboration for better performance. Lee (2004) also
suggests six rules of thumb in term of build agility into supply chains as follow: continuously
update information, develop collaboration, product and process modularization, keep
inexpensive inventory, build flexible logistics systems, and build efficient teams.
2.3.1.4 Comparing leanness and agility
Though lean and agile strategies toward the same goal, increases total customer value,
however, they have different characteristics, work in different ways, and may suit different
types of planning environments (Fisher, 1997; Aitken et al., 2002).
Johansson et al. (1993) propose a simple equation to express the total customer value in a
business, see Formula (1). This equation is particularly helpful since it is possible to make a
major distinction between lean and agile based on their market qualifiers and winner as
shown in Figure 37.
Total value �� ���� �������� ���������� � �� � ���� (1)
Figure 37 Market winners and market qualifiers for agile versus lean supply (Mason-
Jones et al., 2000)
Both lean and agile demand high levels of product quality and minimization of the total lead
time from product to end customer (Christopher & Towill, 2001). However, lean seeks
additional value from cost reduction through waste elimination inside the supply chain, while
agile, seeks value from service level enhancements. A similar discussion is also found in
Fisher (1997), who proposes a formula (2) of total costs for product delivery process (PDP) as
follow:
�Quality
�Cost
�Lead time
�Quality
�Lead time
�Service level
�Service level
� Cost
Agile
supply
Lean
supply
Market Qualifiers Market Winner
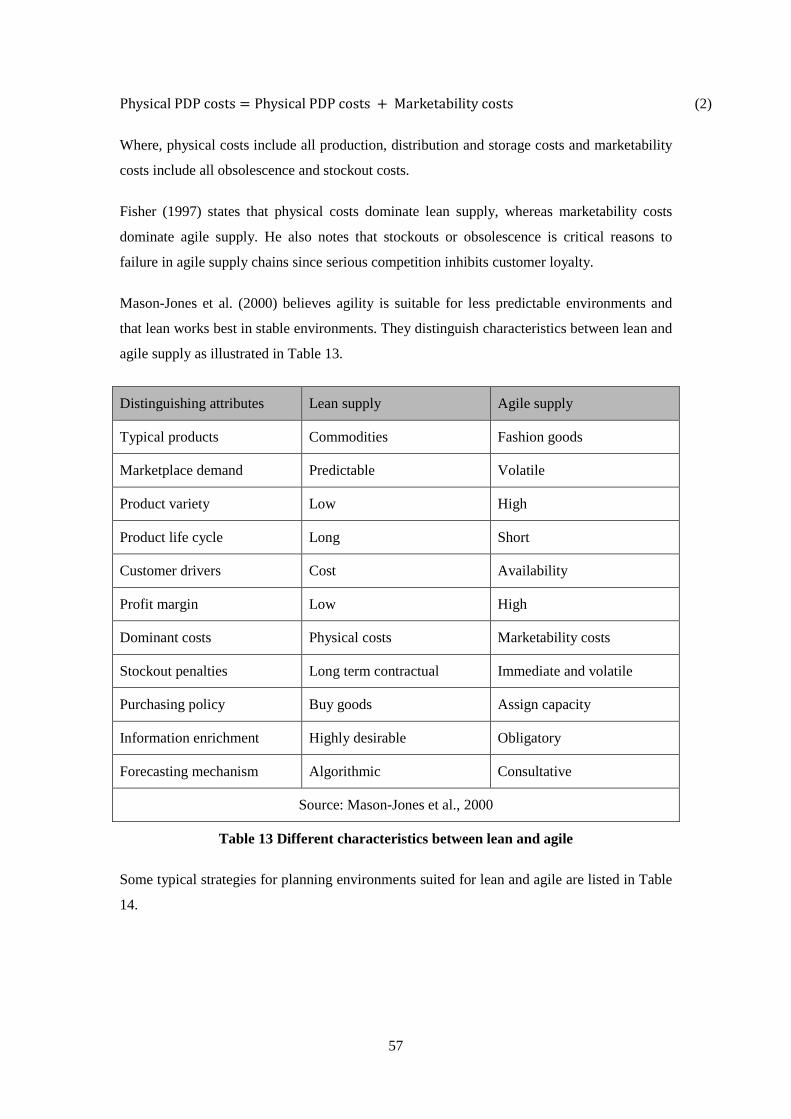
57
Physical PDP costs Physical PDP costs % Marketability costs (2)
Where, physical costs include all production, distribution and storage costs and marketability
costs include all obsolescence and stockout costs.
Fisher (1997) states that physical costs dominate lean supply, whereas marketability costs
dominate agile supply. He also notes that stockouts or obsolescence is critical reasons to
failure in agile supply chains since serious competition inhibits customer loyalty.
Mason-Jones et al. (2000) believes agility is suitable for less predictable environments and
that lean works best in stable environments. They distinguish characteristics between lean and
agile supply as illustrated in Table 13.
Distinguishing attributes Lean supply Agile supply
Typical products Commodities Fashion goods
Marketplace demand Predictable Volatile
Product variety Low High
Product life cycle Long Short
Customer drivers Cost Availability
Profit margin Low High
Dominant costs Physical costs Marketability costs
Stockout penalties Long term contractual Immediate and volatile
Purchasing policy Buy goods Assign capacity
Information enrichment Highly desirable Obligatory
Forecasting mechanism Algorithmic Consultative
Source: Mason-Jones et al., 2000
Table 13 Different characteristics between lean and agile
Some typical strategies for planning environments suited for lean and agile are listed in Table
14.

58
Physically Efficient Process
(Lean)
Market-Responsive Process
(Agile)
Primary purpose Supply predictable demand efficiently at the lowest possible cost.
Respond quickly to unpredictable demand in order to minimize stockouts, forced markdowns, and obsolete inventory.
Manufacturing focus
Maintain high average utilization rate.
Deploy excess buffer capacity.
Inventory strategy Generate high turns and
minimize inventory
throughout the chain
Deploy significant buffer stock of parts of finished goods.
Lead-time focus Shorten lead time as long as it doesn’t increase cost
Invest aggressively in ways to reduce lead time.
Approach to choosing
suppliers
Select primarily for cost and quality.
Select primarily for speed, flexibility, and quality.
Product-design strategy
Maximize performance and minimize cost.
Use modular design in order to postpone product differentiation for as long as possible.
Source: Fisher, 1997
Table 14 Different strategies for planning environments
Based on these characteristics, Fisher (1997) proposes a model to match the supply chain with
products, as shown in Figure 38. He believes an efficient supply chain should be designed
with respect to the product that is going to be supplied through the chain. By doing this, he
splits products into functional and innovative products based on the demand patterns; and
categories supply chain into physical efficient and market responsive according to a goods or
information transformation focus. Indeed, lean supply chains are physically efficient, and
agile ones have the similar characteristics of market responsive supply chains (Selldin &
Olhager, 2007). In another study, Olhager & Selldin (2007) highlight the importance of
alignment between market requirements and manufacturing strategy.

59
Figure 38 Matching supply chain with products (Fisher, 1997)
Selldin & Olhager (2007) empirically tested Fisher’s model for 128 Swedish companies, and
found that while companies tended to match supply chains with demand characteristics, they
were not more profitable than mismatched supply chains. Instead of Fisher’s model, an
efficient supply chain operations frontier (see Figure 39) is proposed, which describes the
relationship between physical efficiency and market responsiveness.
Figure 39 Efficient supply chain operations frontier between responsiveness and
efficiency (Selldin & Olhager, 2007)
2.3.1.5 Hybrid lean/agile
In attempt to get the best of both, hybrid solutions, also called ‘leagile’, have been suggested
by Naylor et al. (1999), who formally define leagile as follows:
‘Leagile is the combination of the lean and agile paradigms within a total supply chain
strategy by positioning the decoupling point so as to best suit the need for responding to a
volatile demand downstream yet providing level scheduling upstream from the marketplace.’
Mismatch
MismatchPhysical efficient
Supply Chain
Market responsive
Supply Chain
Functional
Products
Innovative
Products
Match
Match
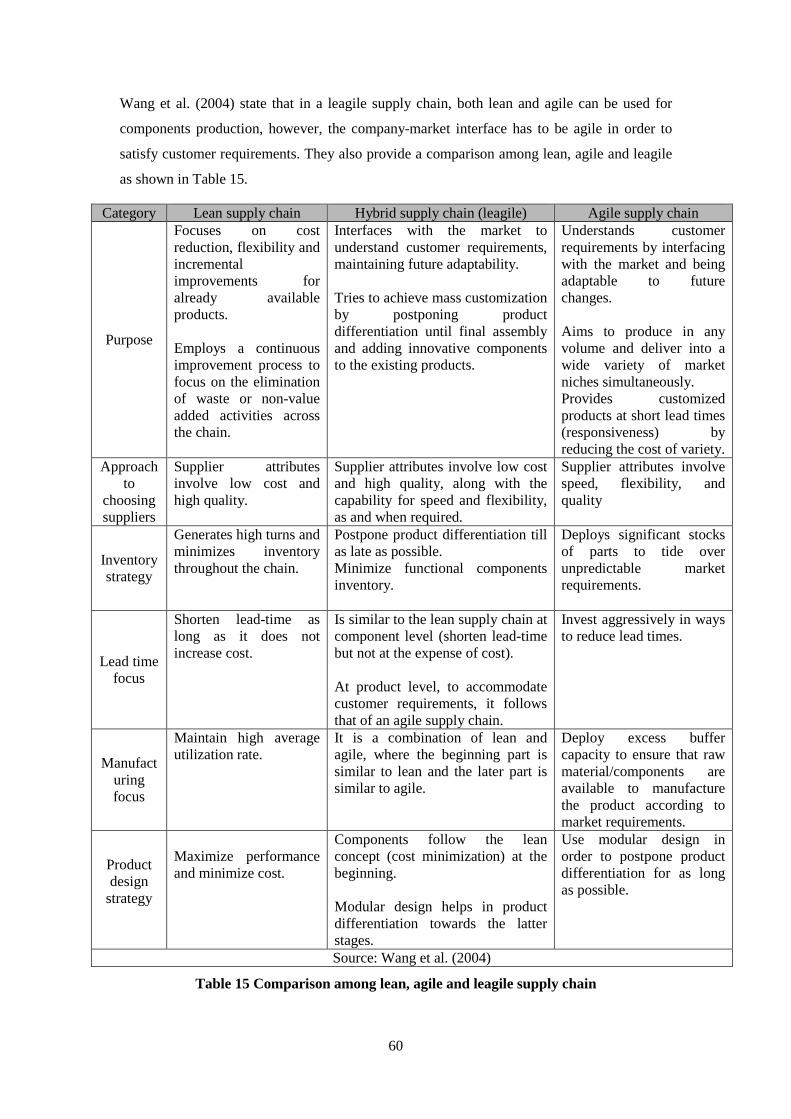
60
Wang et al. (2004) state that in a leagile supply chain, both lean and agile can be used for
components production, however, the company-market interface has to be agile in order to
satisfy customer requirements. They also provide a comparison among lean, agile and leagile
as shown in Table 15.
Category Lean supply chain Hybrid supply chain (leagile) Agile supply chain
Purpose
Focuses on cost reduction, flexibility and incremental improvements for already available products. Employs a continuous improvement process to focus on the elimination of waste or non-value added activities across the chain.
Interfaces with the market to understand customer requirements, maintaining future adaptability. Tries to achieve mass customization by postponing product differentiation until final assembly and adding innovative components to the existing products.
Understands customer requirements by interfacing with the market and being adaptable to future changes. Aims to produce in any volume and deliver into a wide variety of market niches simultaneously. Provides customized products at short lead times (responsiveness) by reducing the cost of variety.
Approach to
choosing suppliers
Supplier attributes involve low cost and high quality.
Supplier attributes involve low cost and high quality, along with the capability for speed and flexibility, as and when required.
Supplier attributes involve speed, flexibility, and quality
Inventory strategy
Generates high turns and minimizes inventory throughout the chain.
Postpone product differentiation till as late as possible. Minimize functional components inventory.
Deploys significant stocks of parts to tide over unpredictable market requirements.
Lead time focus
Shorten lead-time as long as it does not increase cost.
Is similar to the lean supply chain at component level (shorten lead-time but not at the expense of cost). At product level, to accommodate customer requirements, it follows that of an agile supply chain.
Invest aggressively in ways to reduce lead times.
Manufacturing focus
Maintain high average utilization rate.
It is a combination of lean and agile, where the beginning part is similar to lean and the later part is similar to agile.
Deploy excess buffer capacity to ensure that raw material/components are available to manufacture the product according to market requirements.
Product design
strategy
Maximize performance and minimize cost.
Components follow the lean concept (cost minimization) at the beginning. Modular design helps in product differentiation towards the latter stages.
Use modular design in order to postpone product differentiation for as long as possible.
Source: Wang et al. (2004)
Table 15 Comparison among lean, agile and leagile supply chain
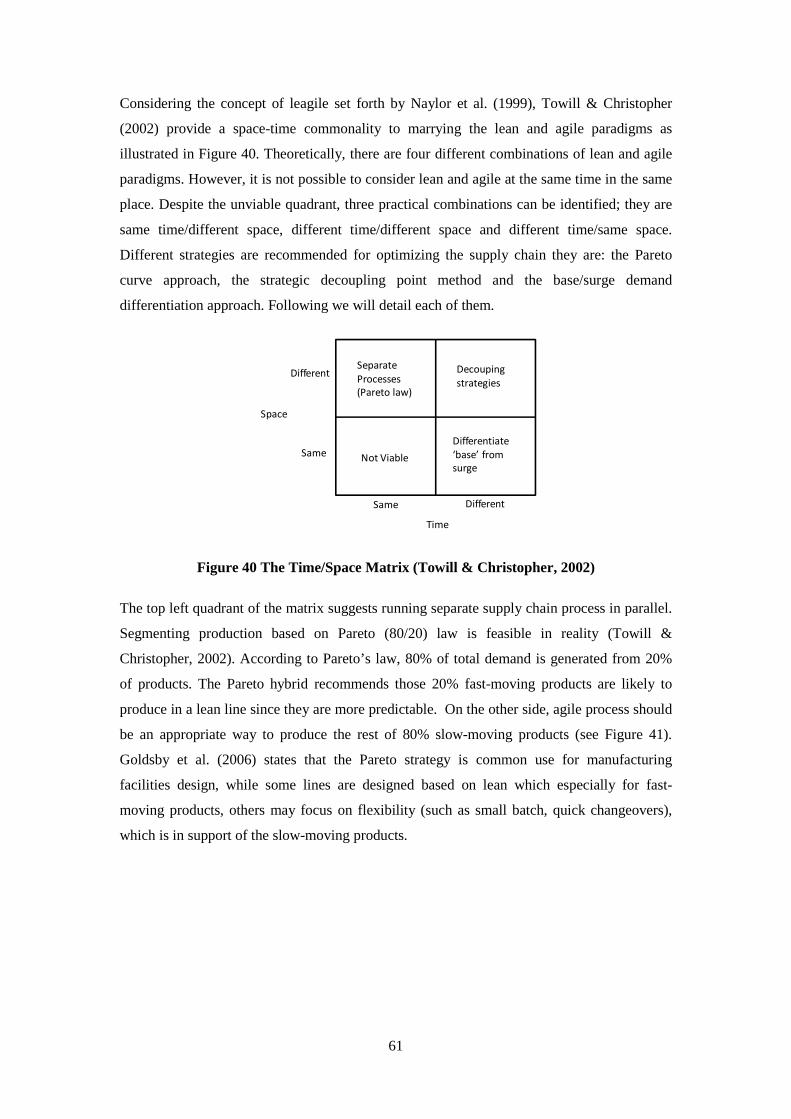
61
Considering the concept of leagile set forth by Naylor et al. (1999), Towill & Christopher
(2002) provide a space-time commonality to marrying the lean and agile paradigms as
illustrated in Figure 40. Theoretically, there are four different combinations of lean and agile
paradigms. However, it is not possible to consider lean and agile at the same time in the same
place. Despite the unviable quadrant, three practical combinations can be identified; they are
same time/different space, different time/different space and different time/same space.
Different strategies are recommended for optimizing the supply chain they are: the Pareto
curve approach, the strategic decoupling point method and the base/surge demand
differentiation approach. Following we will detail each of them.
Figure 40 The Time/Space Matrix (Towill & Christopher, 2002)
The top left quadrant of the matrix suggests running separate supply chain process in parallel.
Segmenting production based on Pareto (80/20) law is feasible in reality (Towill &
Christopher, 2002). According to Pareto’s law, 80% of total demand is generated from 20%
of products. The Pareto hybrid recommends those 20% fast-moving products are likely to
produce in a lean line since they are more predictable. On the other side, agile process should
be an appropriate way to produce the rest of 80% slow-moving products (see Figure 41).
Goldsby et al. (2006) states that the Pareto strategy is common use for manufacturing
facilities design, while some lines are designed based on lean which especially for fast-
moving products, others may focus on flexibility (such as small batch, quick changeovers),
which is in support of the slow-moving products.
Not Viable
Decouping
strategiesDifferent
Same
Same Different
Separate
Processes
(Pareto law)
Differentiate
‘base’ from
surge
Time
Space

62
Figure 41 The Pareto distribution (Christopher & Towill, 2001)
The top-right quadrant indicates the opportunity to decouple the supply chain through the
concept of postponement. Through the creation of a decoupling point, strategic inventory is
held as buffer between smooth and customization production. By using postponement,
companies may utilize lean principles up to the decoupling point and agile for the rest of the
supply chain (Christopher & Towill, 2001). The goal of this hybrid strategy is to build an
agile response on a lean platform by seeking to follow lean principle up to the decoupling
point and agile practices after that point (Christopher, 2005). Goldsby et al. (2006) claim this
approach works best when good can be developed into a near finished state and then
diversifying products according to distinct customer needs.
The bottom right quadrant represents an alternative option. Here demand patterns for each
product is broken into base and surge elements, where base demand can be forecast based on
the history data, and surge demand cannot (Gattorna & Walters, 1996).The idea of this
approach is to allocate a lean supply line for base demand, while surge demand should be
supplied by agile processes (Goldsby et al., 2006).
2.3.2 Postponement
To enhance the supply chain management efficiency, company must develop innovative
strategies in order to integrate both logistics and manufacturing activities. Postponement as a
strategic method is popularly used to achieve timely and cost effective simultaneously
through the rearrangement of the production and supply chain structure (Pagh & Cooper,
1998).
In this section, we first introduce the definition of postponement as well as its classification,
then its benefits and some lessons are detailed.

63
2.3.2.1 The concept of postponement
The principle of postponement was originally proposed by Alderson in 1950 from a
marketing management perspective, he notes the importance of postponement is the delayed
differentiation of goods and that it promotes the marketing system efficiency (Alderson,
1950).
Bucklin (1965) views postponement as a means by which a supplier may shift risk to the
buyer, where value-adding activities are delayed until customer orders are received. He looks
at postponement as a continuum concept, and develops a complementary concept of
postponement, namely speculation, which involves adding value before the order is received
(zero postponement). He believes that postponement needs to be combined with speculation
since long lead time in production and distribution has made it difficult to rely on
postponement. Thereby, where, when and who to hold inventory in distribution channel as the
core questions are discussed in order to reduce the supply chain cost and risk.
Over time, the scope of postponement considerations has expanded from marketing and
distribution channels to the entire supply chain, from souring to final distribution. Graman &
Bukovinsky (2005) review postponement as a process of organizing the operational functions,
so that from the point of differentiation the work-in-process can be made into multiple
versions of the product as close as possible to the point when demand is known. Van Hoek
(2001) views postponement as an organizational concept whereby some of the activities in the
supply chain are not performed until customer orders are received. This implicates that the
application of postponement can be a minor or a major share of the supply chain operation.
Further, he investigates the positions of some companies’ postponement applications in the
supply chain, which are shown in Figure 42, while different degrees of postponement
applications and the supply chain position are combination in order to promote the companies’
performance.
Figure 42 The application of postponement (van Hoek, 2001)
High degree
Low degreeSourcing Fabrication
MCC
Application
of postponement
DELLWn
ChPh
Mars
Position of postponement in the supply chain
Assembly Packaging Distribution

64
Theoretically, postponement can occur at any points along the supply chain, however, not all
products and process may accommodate postponement (e.g. many processes cannot be
decoupled in the chemical industry). Thus, the applicability of postponement differs greatly
across products, technologies, processes and market characteristics (Pagh & Cooper, 1998;
van Hoek & Commandeur, 1998). Van Hoek (2001) details those determinant factors as
shown in Table 16.
Operating
characteristics Factors
Technology
and process
• Feasible to decouple primary and postponed operations;
• Limited complexity of customizing operations;
• Modular product designs;
• Sourcing from multiple locations.
Product
• High commonality of modules;
• Specific formulation of products and/or specific peripherals/packaging;
• High value density/unit value of products;
• Product cube and/or weight increases through customization.
Market
• Short product life cycle/ fashion cycles;
• Short and reliable lead times required;
• High sales fluctuations and/or price competition;
• Varied and (physically) fragmented markets.
Source: Van Hoek, 2001
Table 16 Factors driver postponement implementation
Some authors consider the value of postponement when the production philosophy changed
from mass production to mass customization. They believe postponement is an important
concept used to accommodate mass customization in the supply chain (Feitzinger & Lee,
1997; Mikkola & Skjott-Larsen, 2004; Silveira et al., 2001; Ernst & Kamrad, 2000; Wong et
al., 2009). Others may focus on the contribution of postponement with respect to gaining the
benefits of both leanness and agility (Christopher, 2000; Yang et al., 2004b). As Christopher
(2000) states, postponement is the delayed configuration based on seeking modular design
and assembling customized products until final market destination is known. Ideally, the
longer that products can remain as generic ‘work-in-process’ the greater the supply chain
flexibility will be(Christopher, 2005).
Van Hoek (2001) focuses on the difference between postponement and mass customization
and claims postponement is a method to reach mass customization; however, it is not the only
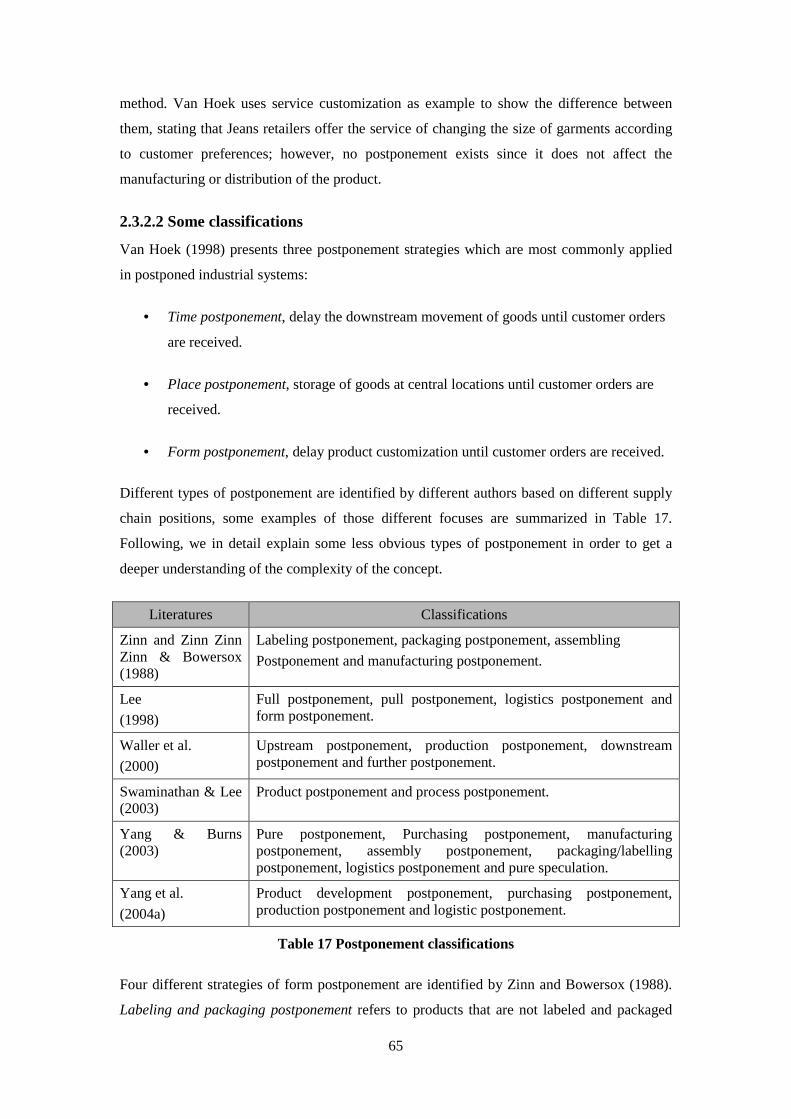
65
method. Van Hoek uses service customization as example to show the difference between
them, stating that Jeans retailers offer the service of changing the size of garments according
to customer preferences; however, no postponement exists since it does not affect the
manufacturing or distribution of the product.
2.3.2.2 Some classifications
Van Hoek (1998) presents three postponement strategies which are most commonly applied
in postponed industrial systems:
• Time postponement, delay the downstream movement of goods until customer orders
are received.
• Place postponement, storage of goods at central locations until customer orders are
received.
• Form postponement, delay product customization until customer orders are received.
Different types of postponement are identified by different authors based on different supply
chain positions, some examples of those different focuses are summarized in Table 17.
Following, we in detail explain some less obvious types of postponement in order to get a
deeper understanding of the complexity of the concept.
Literatures Classifications
Zinn and Zinn Zinn Zinn & Bowersox (1988)
Labeling postponement, packaging postponement, assembling
Postponement and manufacturing postponement.
Lee
(1998)
Full postponement, pull postponement, logistics postponement and form postponement.
Waller et al.
(2000)
Upstream postponement, production postponement, downstream postponement and further postponement.
Swaminathan & Lee (2003)
Product postponement and process postponement.
Yang & Burns (2003)
Pure postponement, Purchasing postponement, manufacturing postponement, assembly postponement, packaging/labelling postponement, logistics postponement and pure speculation.
Yang et al.
(2004a)
Product development postponement, purchasing postponement, production postponement and logistic postponement.
Table 17 Postponement classifications
Four different strategies of form postponement are identified by Zinn and Bowersox (1988).
Labeling and packaging postponement refers to products that are not labeled and packaged

66
until final orders are received; Assembly and manufacturing postponement indicates where
additional assembly or manufacturing need to be performed at the assembly facility before
delivery the product to the right customer. An example of packaging postponement is Mars (a
Masterfoods company), where postponed packaging and labeling is carried out for special
products in the Christmas season. In terms of manufacturing postponement, the ‘3-day car’
project can be seen as a good example, the core of which is to complete paint, trim, final
assembly and delivery of a car to dealerships within three days (Harrison & van Hoek, 2005).
Lee (1998) specifies a new concept of pull postponement which highlights the value of
postponement with respect to moving the decoupling point upstream to configure to order.
The concept of full postponement states the full combination of MTO manufacturing,
centralized inventories and direct distribution in logistics, which is defined in contrast to full
speculation. Logistics postponement can be viewed as the combination of time and place
postponement (Yang et al., 2004a), which refers to delaying the forward movement of goods
in supply chain operations and keeping goods at central locations in the distribution channel.
An example of full postponement is the Danish audio-video manufacturer Bang & Olufsen,
which assembles, tests and delivers customized audio-video products directly to the final
European customer in five days. Ford’s European Distribution Centre successfully applies a
logistics postponement strategy to the supply of spare parts to dealerships all over Europe
within 24 to 48 hours.
Waller et al. (2000) look at the supply chain network as a whole, they broadly specify the
postponement strategies into upstream, production, downstream and further postponement.
Upstream postponement indicates that manufacturers wait to order raw materials from
suppliers until customer orders are received; production postponement includes
manufacturing, assembly, packaging and labeling; downstream postponement focuses on
delay some sort of physical change of the product after it leaves the primary manufacturing
stage; further postponement includes distribution postponement which occurs after the
product has all value-added features.
Swaminathan & Lee (2003) believe a successful postponement strategy depends on the ability
of a firm to tailor its process and product characteristics according to the market requirements.
They state concepts of product and process postponement in relation to product design
changes and process design changes respectively. The semiconductor firm Xilinx is a good
example of successful use of those two different postponement strategies that have created
great value (Brown et al., 2000).
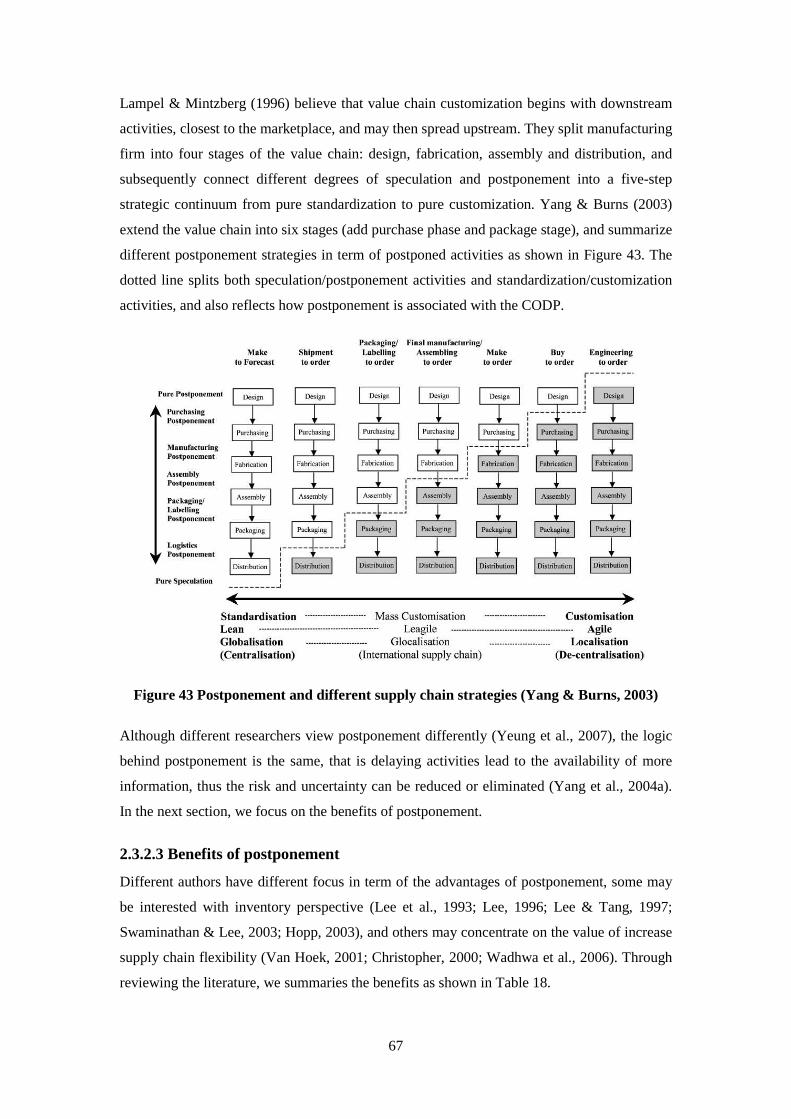
67
Lampel & Mintzberg (1996) believe that value chain customization begins with downstream
activities, closest to the marketplace, and may then spread upstream. They split manufacturing
firm into four stages of the value chain: design, fabrication, assembly and distribution, and
subsequently connect different degrees of speculation and postponement into a five-step
strategic continuum from pure standardization to pure customization. Yang & Burns (2003)
extend the value chain into six stages (add purchase phase and package stage), and summarize
different postponement strategies in term of postponed activities as shown in Figure 43. The
dotted line splits both speculation/postponement activities and standardization/customization
activities, and also reflects how postponement is associated with the CODP.
Figure 43 Postponement and different supply chain strategies (Yang & Burns, 2003)
Although different researchers view postponement differently (Yeung et al., 2007), the logic
behind postponement is the same, that is delaying activities lead to the availability of more
information, thus the risk and uncertainty can be reduced or eliminated (Yang et al., 2004a).
In the next section, we focus on the benefits of postponement.
2.3.2.3 Benefits of postponement
Different authors have different focus in term of the advantages of postponement, some may
be interested with inventory perspective (Lee et al., 1993; Lee, 1996; Lee & Tang, 1997;
Swaminathan & Lee, 2003; Hopp, 2003), and others may concentrate on the value of increase
supply chain flexibility (Van Hoek, 2001; Christopher, 2000; Wadhwa et al., 2006). Through
reviewing the literature, we summaries the benefits as shown in Table 18.

68
Factors Benefits of postponement
Technological
and process
• Economies of scale through postponement and short processing times.
• Short set- up and changeover times due to limited complexity.
Product
• High commonality of modules leads to less inventory needs based on pooling principle.
• Total inventory carrying and holding costs are reduced through direct transportation and common/modular components application.
• Improved product customization through postpone activities and greater products flexibility.
Market
• Less risk of obsolete inventory due to short product life cycles.
• Reduce stockout and/or obsolescence costs due to delaying finalization of products.
• Better Forecast accuracy at the generic level than at the level of the finished item.
• Short and reliable lead times lead to high service level.
• Increase supply chain flexibility.
Table 18 Benefits of postponement
A famous example of this is Hewlett Packard Deskjet Printer case. In order to deal with
labeling, instructions and power supply that were tailored to the language and electrical
conventions of each country, HP changed their production/distribution process from fully
forecast-driven and centralized inventories into (1) making instructions and labeling generic
and (2) postponing installation of the power supply to the distribution center in each country.
This resulted in a better forecast accuracy, less inventory needs, as well as reduced
obsolescence costs and less lost sales (Feitzinger & Lee, 1997; Hopp, 2003).
Graman & Bukovinsky (2005) compare the inventory level and customer service level before
and after postponement as shown in Figure 44, they believe postponement applications to
reduce overall inventory levels while maintaining the customer service level. In other words,
postponement helps improving customer service level for a given level of total inventory.
They also found that the inventory levels decrease as more of a product is postponed.
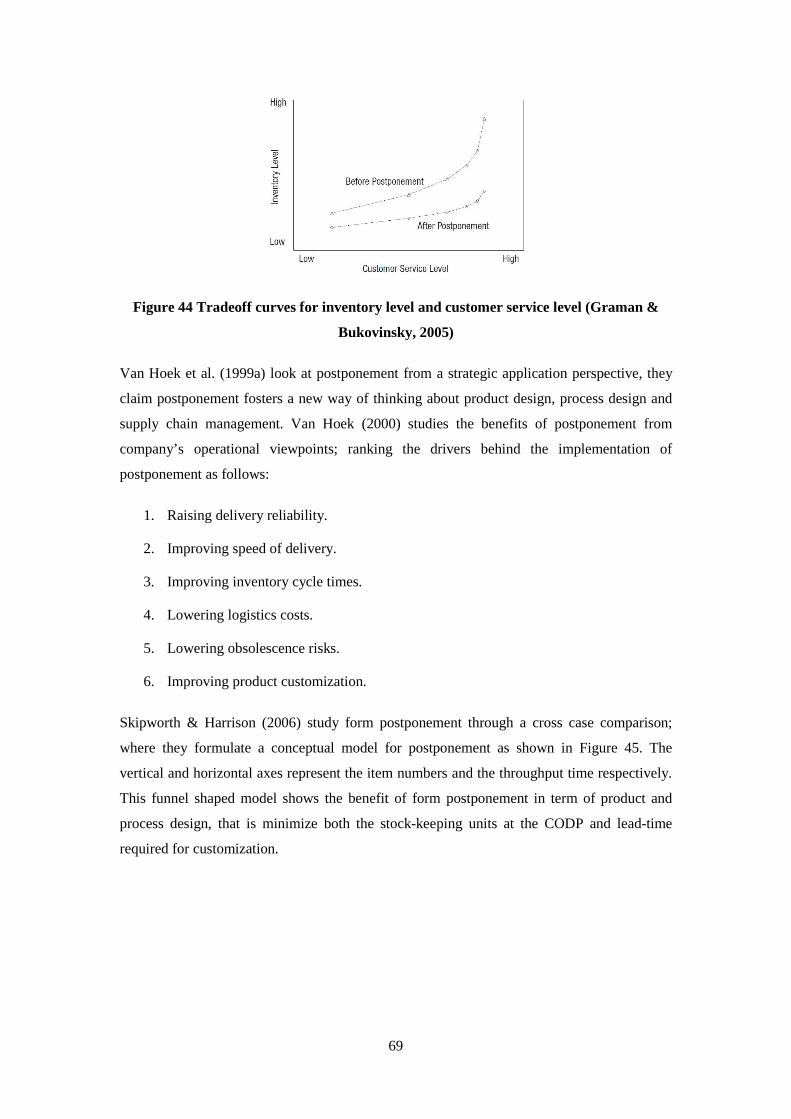
69
Figure 44 Tradeoff curves for inventory level and customer service level (Graman &
Bukovinsky, 2005)
Van Hoek et al. (1999a) look at postponement from a strategic application perspective, they
claim postponement fosters a new way of thinking about product design, process design and
supply chain management. Van Hoek (2000) studies the benefits of postponement from
company’s operational viewpoints; ranking the drivers behind the implementation of
postponement as follows:
1. Raising delivery reliability.
2. Improving speed of delivery.
3. Improving inventory cycle times.
4. Lowering logistics costs.
5. Lowering obsolescence risks.
6. Improving product customization.
Skipworth & Harrison (2006) study form postponement through a cross case comparison;
where they formulate a conceptual model for postponement as shown in Figure 45. The
vertical and horizontal axes represent the item numbers and the throughput time respectively.
This funnel shaped model shows the benefit of form postponement in term of product and
process design, that is minimize both the stock-keeping units at the CODP and lead-time
required for customization.

70
Figure 45 Conceptual model of form postponement
2.3.2.4 Lessons from postponement
Postponement is not free. Swaminathan & Lee (2003) believe different types of postponement
strategies have different costs and benefits associated with them. In other words,
postponement implementations need to consider the tradeoff between costs and benefits. For
example, packaging postponement reduces inventory costs due to stocking of the standard
product, whereas different packaging costs become higher since the agile packaging principle
loses economies of scale. Similar tradeoffs also exist in manufacturing, assembly
postponement etc. This further generates a decision related to when and where postponement
should be implemented (Yang & Burns, 2003). In order to identify the benefits and costs
associated with postponement, three types of factors (market, process and product factors) are
classified by Swaminathan & Lee (2003): market factors are related to customer demand and
service requirements which mainly consider demand fluctuations or variance; process factors
relate to both manufacturing and logistics process in the supply chain network; product
factors are those related to the design of the product or product lines.
Van Hoek et al. (1999b) note that not all products and processes are suitable for the
implementation of postponement principles. They identify a series of operations categories
that can affect postponement feasibility, being technology and process, product and market
characteristics.

71
Harrison & Van Hoek (2005) believe the applicability of postponement differs depending on
the operating environments that differ by industry. They compare the application of
postponement from different industries, and find postponement applications to be the highest
in the automotive sector, followed by electronics, while food and other industries lag behind.
Van Hoek (2000) investigates the application of postponement throughout the supply chain,
and finds existing postponement applications to mainly involve downstream activities
(distribution, packing and final manufacturing), however, successful postponement
applications should first lie in organizing the product architecture (Yang et al., 2005). This
implies that companies should consider postponement during the product development phase,
so that major changes later in the development process can be avoided.
2.4 Summary of chapter
Having reviewed to the research relevant literature, a framework containing the body of
knowledge that is useful and applicable for this research may be drawn up. The next chapter
presents the details of the research design, including research philosophy, the modeling
process, and research quality three main strands.
3. Research design
The purpose of this chapter is to describe the research design of this thesis. Firstly, the
approach to science is discussed; then the modeling approach and tools are introduced; finally,
the validity and reliability of the research is covered.
3.1 Research philosophy Several research disciplines have evolved since the start of scientific method, which includes
two main groups: Positivistic or Phenomenological paradigms (Blaikie, 1993; Easterby-Smith
et al., 2008). The differences between those two methods are shown in Table 19.

72
Positivist paradigm Phenomenological paradigm
Basic belief
• The world is external and objective;
• Observer is independent;
• Science is value-free.
• The world is socially constructed and subjective;
• Observer is part of what is observed;
• Science is driven by human interest.
Researcher should
Focus on facts Focus on meanings
Preferred methods
• Look for causality and fundamental laws;
• Reduce phenomena to simplest elements;
• Formulate hypotheses and then test them;
• Operational concepts so that they can be measured;
• Taking large samples.
• Try to understand what is happening;
• Look at the totality of each situation;
• Develop ideas through induction from data;
• Using multiple methods to establish different views of phenomena;
• Small samples investigated in depth or over time.
Source: (Easterby-Smith et al., 2008)
Table 19 Differences between two types of approaches to science
While both paradigms have individual merits, both also have their weaknesses. The advantage
of the positivist approach is that it provides the foundations of knowledge in absolute terms,
however, it neither can generate ideas through induction, nor it can prove immeasurable
hypotheses. The phenomenological method may be good for generating hypotheses; however,
it may not be well proved, which is best left to positivism.
3.2 The modeling process Two points are the core in term of modeling a process, which include: ‘how to map the
behaviors’ and ‘how to model a system’. By doing so, causal loop diagrams and a five-steps
modeling approach are introduced in this section, which provides a theoretical foundation for
further model building.
3.2.1 System dynamics approach to modeling
Similar to the approach suggested by Pidd (1988), Sterman (2000) introduces a more
comprehensive system dynamics modeling approach, as shown in Figure 46, where a flow
from the definition of a problem to the final experimentation is formulated.

73
Figure 46 Model describing system dynamics modeling (Sterman, 2000)
The starting point is the articulation of a problem, which should be questioned, clarified until
there is an agreement on what and why should be examined. Indeed, how to increase profits
and customer value across the PLC from supply chain improvements are taken into our
consideration.
Following on this is the formulation of a dynamic hypothesis, which is mainly concern with a
first guess on the causes of expected or observed behavior. Then, the hypothesis should be
used as a starting point when mapping the dynamic behaviors. When the predicted behavior
can be described as an endogenous function of the system, this means the hypothesis
formulation stage is complete; otherwise the scope may have to be expanded, either in width,
or in depth. In our case, PLC, modularization, mass customization, CODP and postponement
as starting points are focused and causal loop diagrams are used to mapping the supply chain
dynamics.
Formulation means the actual programming of the model. Here reasoning is used.
The purpose of Testing is to verify the model can replicate previously observed behavior.
Finally, the policy formulation and evaluation, the model needs to answer a set of questions.
Such as what-if scenarios, policy design changes, changes in external conditions.
3.2.2 General approach to causal loop diagrams
Helped by the literature review that has been available in academic journals or books, the aim
of the paper is to understanding the usefulness of modularization, mass customization, CODP,
and postponement across the PLC. The research method was designed by using causal loop
diagrams (CLD) to better understanding the system dynamics behavior.

74
Causal loop diagrams (CLDs) are a kind of systems thinking tool, which used to aid in
visualizing how interrelated variables affect one another. The diagrams consist of arrows
connecting a set of variables which changing over time. Two kinds of relationships are
available between these variables, represented by arrows, can be labeled as positive (+) or
negative (-) causal link.
� Positive causal links (+), means that two linked variables change in the same
direction, e.g. if the variable in which the link starts increase, the other linked variable
also increase, vice versa.
� Negative causal link (-), on the other side, indicates that two linked variables change
in the opposite direction, e.g. if the variable in which the link starts increases, then the
other one decreases, vice versa.
When a variable of a system indirectly influences itself, the portion of the system involved is
called a feedback loop or a causal loop. More formally, a feedback loop is a closed sequences
of causes and effects, that is, a closed path of action and information (Golafshani, 2003).
A causal loop can be reinforcing (positive) or balancing (negative), the former has an even
number of negative links, whereas the latter has an odd number of negative links. The rule
works because positive loops change, while balancing loops are self-correcting (they oppose
disturbances) (Sterman, 2000).
A positive, or reinforcing, feedback loop is associated with exponential growth, which having
slow growth at the beginning, then it leads to rapid growth at an ever-increasing rate; whereas
a negative, or balancing, feedback loop is associated with reaching a plateau, where the loop
structure push its value up or down based on a goal. When positive and negative loops are
combined, a variety of behavior patterns are possible.
3.3 Research quality “Reliability and validity are tools of an essentially positivist epistemology.”
(Watling, as cited in Winter, 2000, p. 7)
The purpose of the research quality determines whether any confidence may be placed in its
results. Typically, research quality is divided into two main groups: reliability and validity.
While validity indicates whether the means of measurement are accurate and whether they are
actually measuring what they are intended to measure, whereas, reliability means whether the
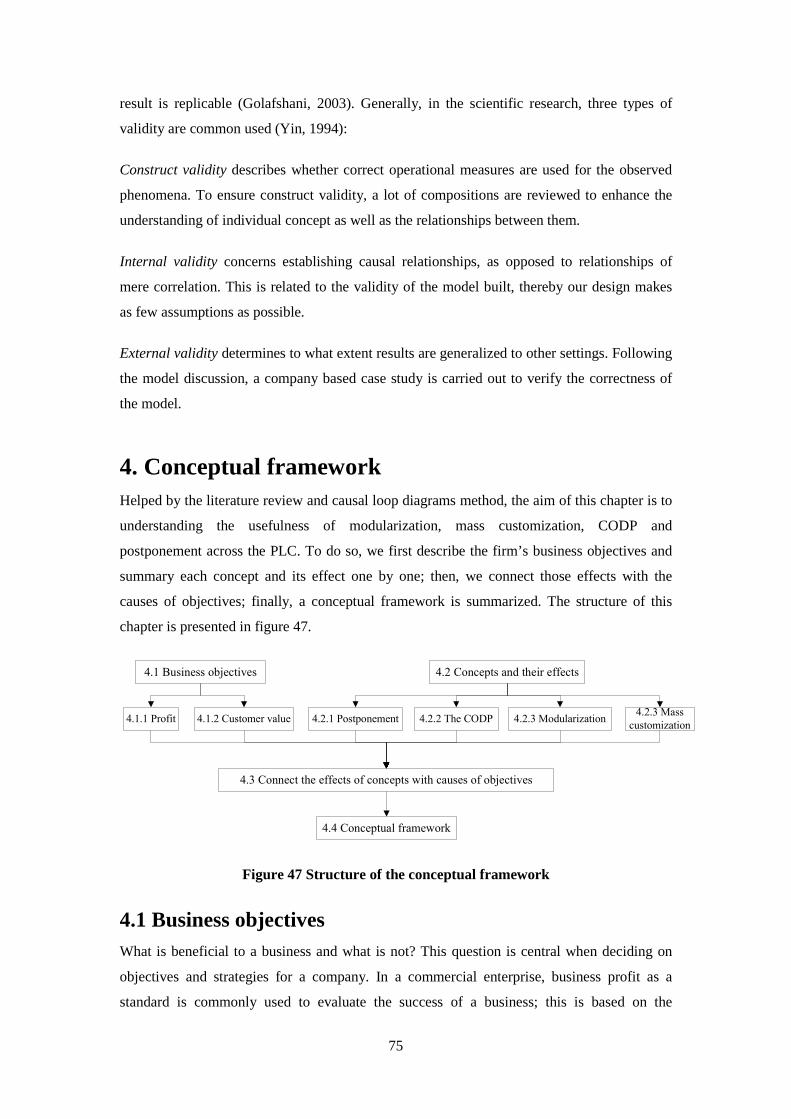
75
result is replicable (Golafshani, 2003). Generally, in the scientific research, three types of
validity are common used (Yin, 1994):
Construct validity describes whether correct operational measures are used for the observed
phenomena. To ensure construct validity, a lot of compositions are reviewed to enhance the
understanding of individual concept as well as the relationships between them.
Internal validity concerns establishing causal relationships, as opposed to relationships of
mere correlation. This is related to the validity of the model built, thereby our design makes
as few assumptions as possible.
External validity determines to what extent results are generalized to other settings. Following
the model discussion, a company based case study is carried out to verify the correctness of
the model.
4. Conceptual framework Helped by the literature review and causal loop diagrams method, the aim of this chapter is to
understanding the usefulness of modularization, mass customization, CODP and
postponement across the PLC. To do so, we first describe the firm’s business objectives and
summary each concept and its effect one by one; then, we connect those effects with the
causes of objectives; finally, a conceptual framework is summarized. The structure of this
chapter is presented in figure 47.
Figure 47 Structure of the conceptual framework
4.1 Business objectives What is beneficial to a business and what is not? This question is central when deciding on
objectives and strategies for a company. In a commercial enterprise, business profit as a
standard is commonly used to evaluate the success of a business; this is based on the
4.1 Business objectives 4.2 Concepts and their effects
4.1.1 Profit 4.1.2 Customer value 4.2.1 Postponement 4.2.2 The CODP 4.2.3 Modularization4.2.3 Mass
customization
4.3 Connect the effects of concepts with causes of objectives
4.4 Conceptual framework
76
assumption of the discounted cash inflows greater than the cash outflows. In the context of
customers, the concept of customer value in relation to market sales is strong related to a
company’s profits, this meaning that the higher customer value indicates more market sales or
shares.
4.1.1 Profit
Dean (1954) states business profits are those activities where the discounted cash inflows are
greater than the cash outflows. Ohno (1988) and Shingo (1989) category those business
incomes that a company received as revenue and the monetary value of expenditures for
production etc. as cost, thus profit refer to the difference between the revenue and the costs
are take into their consideration, as shown in follow,
Profit = Revenue – Cost (3)
The formula indicates that increased profit can be archived from a maximization of revenue
and/or a reduction of cost.
The concept of revenue determined by the two factors, sale volume and product price, the
former influenced by the PLC since the different stages of the PLC has their own marketing
implications in term of sales volumes (Kotler & Keller, 2004); the latter concerning the
company’s competitive priorities which include price, quality, delivery speed and reliability,
and flexibility in terms of product volume and mix (Olhager, 2003). Hill (2000) presents the
concept of order winners (OW) and qualifiers (OQ) to differentiate the importance among
competitive priorities, while the OW indicates how to win orders in the market place, whereas
OQ concerns the basic criteria that a company has to meet in order to enter the market. To
match the manufacturing strategy with the OW, manufacturing strategies related to decision
categories including process, capacity, production planning and control etc. should be
considered appropriately (Olhager, 2003).
The classifications of cost differ from different management perspectives. From a supply
chain management point of view, cost can be split based on its value-adding attributes, where
value adding cost and nonvalue-adding cost are specified. In order to reduce cost, it is
necessary to remove all process steps that incur cost while not adding any value to the
consumer. This waste elimination refers to the lean paradigm.
From a manufacturing operations perspective, it is useful to break down cost into two major
parts:

77
� Throughput cost, which is the total (variable) cost for production, given a certain
throughput level. The cost function generally grows nonlinearly, implying that stable
throughput levels give lower costs that volatile ones.
� Inventory cost, which is the cost for having tied-up capital in the pipeline, along with
the extra overhead caused by large inventories and materials handling.
These are useful because demand variability inadvertently will affect at least one out of three
factors:
� Inventory levels, as inventory generally is used as a buffer against demand volatility.
� Throughput, as stable deliveries and inventory levels require highly responsive
production.
� Delivery time to customers/service levels, as a system that does not buffer against
uncertainty itself will transfer the uncertainty back to customers.
Knowing how throughput cost behaves, it becomes attractive to try to stabilize throughput by
buffering against inventory, or rarely against promised delivery time.
4.1.2 Customer value
Another concept related to a company’s profit is the customer value. The concept is based on
the assumption that customers, when faced with the choice of selecting one out of multiple
products, will buy the product that is perceived to provide them the most value relative to
their sacrifice (Naumann & Kordupleski, 1995). Christopher (2005) breaks down customer
value to four constituent parts, as shown in Formula 4, where the items in the dividend
increase value, while items in the divisor decrease value.
Customer value ������� � �� �������� � ,��� (4)
While service and quality are quite concerned with marketing decisions and product
development, cost and time are factors that relate strongly to each other, especially if we
consider the supply chain perspective as our boundary. With cost being the cost to the
customer, i.e. the price, we can relate this to our promised delivery time. As the promised
delivery time increases, more time can be used for order smoothing, leading to smaller shocks
for either of the variability buffers (inventory, throughput or delivery time) in the supply
chain (Hedenstierna & Ng, 2010).
78
4.2 Concepts and their effects This section describes the concepts of postponement, the customer order decoupling point,
modularization and mass customization, and analyses their effects with respect of the
business objectives.
4.2.1 Postponement
Postponement is concerned with keeping products uncommitted in the same flow for as long
as possible, until they are assigned to a specific customer or end market. The gains from this
arise not only from greater planning flexibility, allowing for low safety stocks, but also from
reduced processing times due to consolidation of setup times across fewer products.
The core benefit of postponement comes from cost saving due to capacity utilization and
safety stock reduction. Indeed, postponed production can be viewed as manage demand
variability through waste elimination (lean principle), where waste comes in two forms:
unnecessary operations and safety stocks. Postponement eliminating unnecessary operations
through reduces the turnover of the pre-production, which in turn reducing the total set up
time as well as operation costs. Eliminating unnecessary safety stocks concern common safety
stock sharing through pooling, which in turn reduces the amount of buffering that is required.
To illustrate these phenomena, following we will consider them from mathematic perspective.
Capacity utilization (U) as a ratio of the actual level of throughput (TH/ to a sustainable
maximum level of throughput, or capacity (TH� 0), is shown in Formula 5.
U ,1,1234 (5)
Suppose that one unit processing time and one set-up time are t5 and t� respectively, one
production batch takes the time ( 67 % 8 � 69 ), where Q is the batch quantity and 8 � 69 equals to total processing time for produce one batch products. Assume D is the market
demand, and ;� equals to the numbers of production orders.
Thus,
<= >? � @67 % 8 � 69 / (6)
U ,1,1234
AB � @CDE?�CF /
,1234 (7)
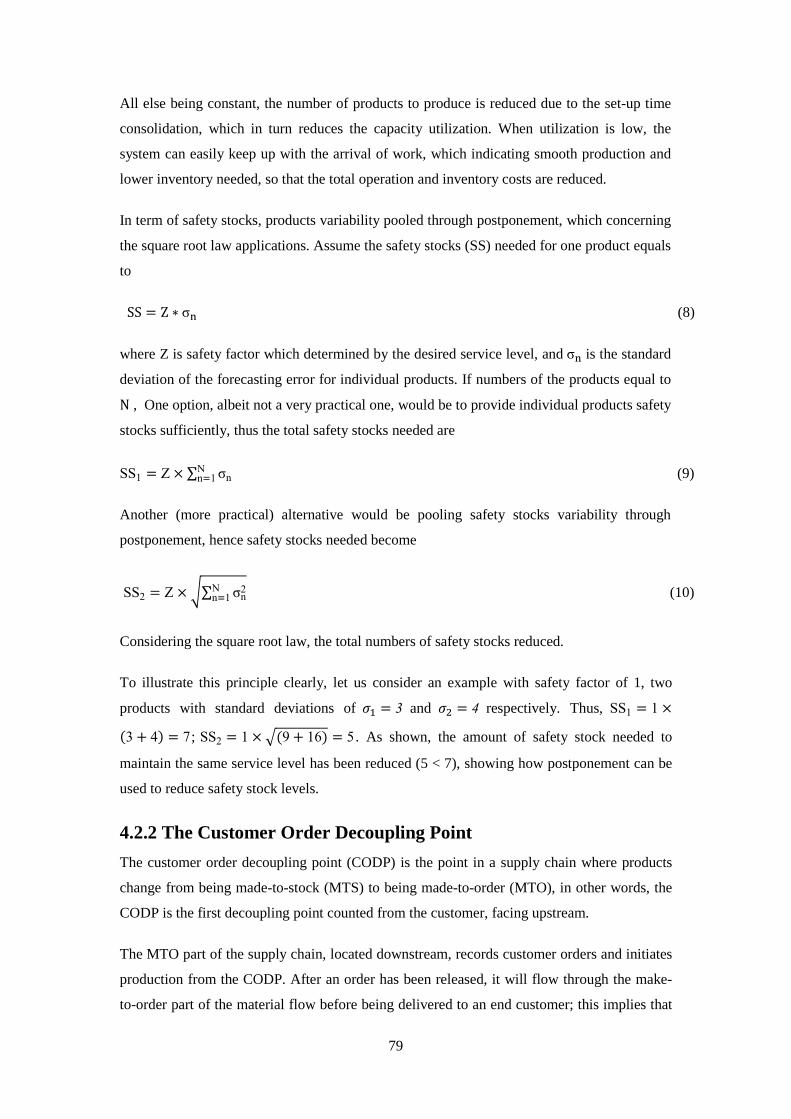
79
All else being constant, the number of products to produce is reduced due to the set-up time
consolidation, which in turn reduces the capacity utilization. When utilization is low, the
system can easily keep up with the arrival of work, which indicating smooth production and
lower inventory needed, so that the total operation and inventory costs are reduced.
In term of safety stocks, products variability pooled through postponement, which concerning
the square root law applications. Assume the safety stocks (SS) needed for one product equals
to
SS Z I σJ (8)
where Z is safety factor which determined by the desired service level, and σJ is the standard
deviation of the forecasting error for individual products. If numbers of the products equal to
N , One option, albeit not a very practical one, would be to provide individual products safety
stocks sufficiently, thus the total safety stocks needed are
SS1 Z � ∑ σnNnM1 (9)
Another (more practical) alternative would be pooling safety stocks variability through
postponement, hence safety stocks needed become
SS2 Z � N∑ σn2N
nM1 (10)
Considering the square root law, the total numbers of safety stocks reduced.
To illustrate this principle clearly, let us consider an example with safety factor of 1, two
products with standard deviations of OP 3 and OQ 4 respectively. Thus, SS1 1 �@3 % 4/ 7; SS2 1 � R@9 % 16/ 5 . As shown, the amount of safety stock needed to
maintain the same service level has been reduced (5 < 7), showing how postponement can be
used to reduce safety stock levels.
4.2.2 The Customer Order Decoupling Point
The customer order decoupling point (CODP) is the point in a supply chain where products
change from being made-to-stock (MTS) to being made-to-order (MTO), in other words, the
CODP is the first decoupling point counted from the customer, facing upstream.
The MTO part of the supply chain, located downstream, records customer orders and initiates
production from the CODP. After an order has been released, it will flow through the make-
to-order part of the material flow before being delivered to an end customer; this implies that

80
there is a delay between order receipt and delivery – a delay that must not be longer than the
customer is willing to accept. The goods flow in the MTO part of the supply chain is
characterized by having no safety stock, meaning that demand variability cannot be buffered
by stock, but only by adapting production throughput or by extending the delivery time.
The upstream, or make-to-stock (MTS) part of the supply chain, monitors stock levels at the
CODP and uses this to make a forecast of future demand. This is used to place replenishment
orders at suppliers, based on how much inventory is expected to be consumed, and to what
degree safety stock levels need to be adjusted to cover deviations from forecasted demand. A
phenomenon arising from these adjustments is the bullwhip effect, which causes the variance
of demand to increase as it is transformed into replenishment orders. This effect worsens each
time information is decoupled. The best way to avoid this effect is to integrate information
flows, for instance, by using VMI, thus unnecessary decoupling points are removed.
Knowing this, a firm can position its CODP such that the MTO part of the supply chain deals
with introducing variants, while the MTS part of the supply chain works with standard
components (Harrison & Van Hoek, 2005). It must however be considered that MTO
processes must buffer against demand variability with capacity, as stock is not available; this
requires careful consideration when positioning the CODP, or when developing MTO
processes.
Another benefit of the CODP is inventory saving due to variability sharing, which had been
proved in the section 4.2.1 with variability pooling formula 8, 9 and 10. Low inventory levels
indicate less tied-up capital in the pipeline, which in turn reduced the total inventory costs.
4.2.3 Modularization
Modularization means using a small amount of shared components across product platforms
to create a vast array of possible end products that are tailored to the individual needs of a
large group of customers. From a manufacturing management perspective, modularization
creates an opportunity of changing from either MTS or MTO to ATO production, which will
allow total costs, including both inventory and production costs, to be reduced.
In an MTS environment, customers buy directly from available inventory, which is held as
finished goods. This allows for deliveries directly from stock, so the promised delivery lead-
time. However, a problem with the MTS environment is that every product must be kept as
finished goods inventory, suggesting a need for large quantities of safety stock.
Instead considering a CODP upstream, reflecting an MTO environment, demand must be
translated into production orders, which then need to pass through the entire production
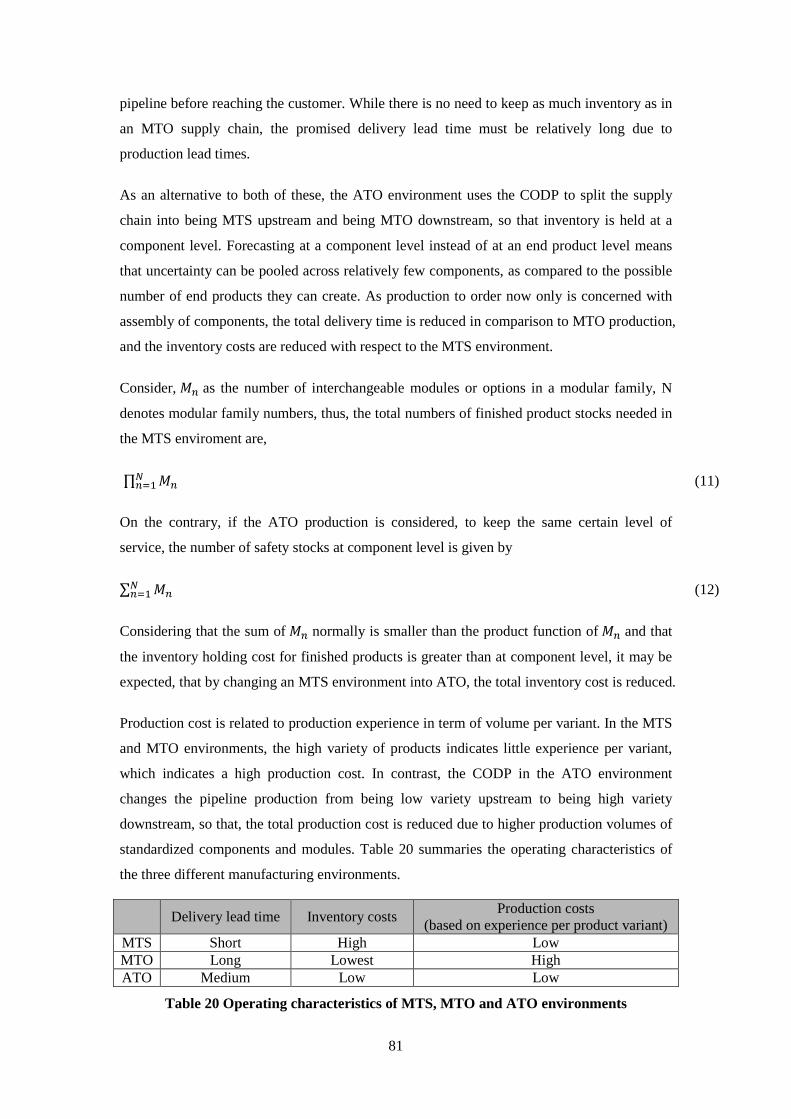
81
pipeline before reaching the customer. While there is no need to keep as much inventory as in
an MTO supply chain, the promised delivery lead time must be relatively long due to
production lead times.
As an alternative to both of these, the ATO environment uses the CODP to split the supply
chain into being MTS upstream and being MTO downstream, so that inventory is held at a
component level. Forecasting at a component level instead of at an end product level means
that uncertainty can be pooled across relatively few components, as compared to the possible
number of end products they can create. As production to order now only is concerned with
assembly of components, the total delivery time is reduced in comparison to MTO production,
and the inventory costs are reduced with respect to the MTS environment.
Consider, ST as the number of interchangeable modules or options in a modular family, N
denotes modular family numbers, thus, the total numbers of finished product stocks needed in
the MTS enviroment are,
∏ STVTMP (11)
On the contrary, if the ATO production is considered, to keep the same certain level of
service, the number of safety stocks at component level is given by
∑ STVTMP (12)
Considering that the sum of ST normally is smaller than the product function of ST and that
the inventory holding cost for finished products is greater than at component level, it may be
expected, that by changing an MTS environment into ATO, the total inventory cost is reduced.
Production cost is related to production experience in term of volume per variant. In the MTS
and MTO environments, the high variety of products indicates little experience per variant,
which indicates a high production cost. In contrast, the CODP in the ATO environment
changes the pipeline production from being low variety upstream to being high variety
downstream, so that, the total production cost is reduced due to higher production volumes of
standardized components and modules. Table 20 summaries the operating characteristics of
the three different manufacturing environments.
Delivery lead time Inventory costs Production costs
(based on experience per product variant) MTS Short High Low MTO Long Lowest High ATO Medium Low Low
Table 20 Operating characteristics of MTS, MTO and ATO environments

82
4.2.4 Mass customization
Mass customization is concerned with catering to individual customer needs, by customizing
standard products, so that high customer value to be created at low cost. This means that,
when the customers facing multiple choices of the product, they will buy the one that provide
them the most customer value. This creates an opportunity for a company to customize their
products through reconsider the products attributes based on an individual customer
preference, so that the individual customer value is maximized, this will further improve the
company’s sales and market shares as well.
From a group of competing products, a customer will buy the one that provides the highest
perceived value, in the eyes of that customer. The perceived value is determined by the
attributes that the customer compares between products, and how the customer values each of
these attributes.
Consider product attributes to be benefits or disadvantages that come as part of a product,
making it comparable to competing products, as each product may offer some individual
benefit at the expense of others. For instance, a certain brand of jeans may be available in
attractive colors, but not be well-fitting, while another brand may only be available in dull
colors, but with an excellent fit. In this case, the customer needs to decide whether color or fit
should be considered most important for the purchasing decision. This preference may differ
across customers or market segments, meaning that different products may be more or less
attractive to different customers.
Assume fitness, color, material and brand, as four comparable attributes in our Jeans case,
where W5 15 10 10XandW15 2 3 20X show different product characteristics provided
by two companies. When the customers decide to buy Jeans, they will consider different
weight based on the importance of each attribute in his eye, if W40% 30% 10% 20%X and
W20% 50% 20% 10%X are two different weighted preferences by two individual
customers 1 and 2, the total customer value is shown as YZ[\ , where i and j express the
company number and customer number respectively,
Thus,
YZPP W5 15 10 10XW40% 30% 10% 20%X= 9 (13)
YZPQ W5 15 10 10XW20% 50% 20% 10%X= 11 (14)
YZQP W15 2 3 20XW40% 30% 10% 20%X= 10.9 (15)

83
YZQQ W15 2 3 20XW20% 50% 20% 10%X= 6.6 (16)
Consider YZQP is bigger than YZ11 (10.9 > 9), customer 1 prefers Jeans in company 2 instead
of company 1, on the other hand, customer 2 would like to buy jeans at company 1 since YZ22 is smaller than YZ12 (6.6 < 11). This point out using a product attributes and customer
preference matrix not only helps a company understand their products’ weaknesses and
strengths, but also implicates the company’s market position.
Understanding the individual customer preference helps a company moving from where it is
to where it wants to be, this can be archived through customization. For example, Jeans
fitness is very important for customer 1, this implicates that if the company can provide
extend service in term of sewing the Jeans based on the customer’s requirement, the company
can win that order. Same situations for customer 2, if the company can customize their Jeans
through reconsidering the customers’ color preference, they can win those group of customers
without hesitate. So that, the company’s product mix attractiveness is enhanced, this further
increases the company’s sales and market shares.
4.3 Connect the effects of concepts with causes of objectives The product life cycle (PLC) describes how the sales volume of products is expected to
develop as the product matures. The maturity of a product can be connected to one of five
stages in the PLC, these are: design, introduction, growth, maturity and decline, each
representing a different level of sales volume.
The development of sales volume over time is interesting in one aspect; it can be used to
describe how much experience a production system has for a certain product. This experience
is critical for improving both the product design, as well as the process configuration.
However, the feasibility of certain process configurations does not only depend on experience,
but also on expected production volume; meaning that both the sales volume and the
cumulative experience, determine what process configurations are suitable for a given
scenario.
Consider the experience as the cumulative sales volume over the PLC, as shown in Figure 48,
this indicates better product and process configuration skills can be achieved over time.

84
Figure 48 The cumulative experience curve
Better product configuration skill influences both product design and mix abilities, the former
concerning the ability of create a vast array of possible end products through shared
components or modules across product platforms, which allows cost reduction in term of
safety stock sharing and low variety production; the latter concerning the ability of a
company customizes standard products based on individual customer needs, so that product
mix attractiveness is enhanced, which, in turn, increase the customer value.
As the prerequisite of the postponement, modularity provides better process configuration
opportunity. This can be archived through variability reduction from both product design and
process structure perspectives. Process configuration skill is strong related to a firm’s abilities
of postponement and position the CODP. While well-structured process eliminates
unnecessary operation, allows inventory saving due to safety stock sharing, this indicates total
cost reduction in the whole supply chain.
Knowing this, a firm can reconsider its product and process configurations from the PLC
point of view, especially when the firm decides to develop a new product or enter a new
market, this requires careful consideration the firm’s OWs in terms of product volume and
mix, better product and process design can either increase the customer value or reduce costs,
this, in turn, enhance the firm’s competitive advantages.
4.4 The causal loop diagram
Having discussed the concepts and their effects with respect to business objectives, a
causal loop diagram is created as shown in Figure 49, having six reinforcing (positive)
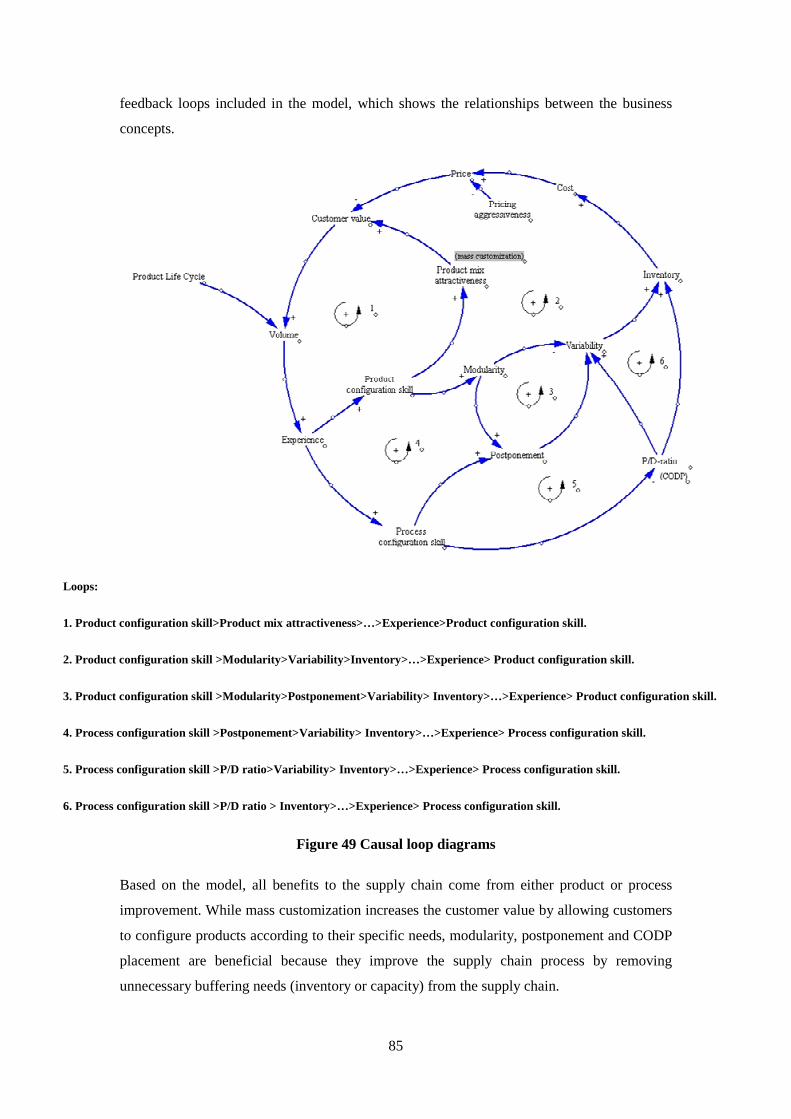
85
feedback loops included in the model, which shows the relationships between the business
concepts.
Loops:
1. Product configuration skill>Product mix attracti veness>…>Experience>Product configuration skill.
2. Product configuration skill >Modularity>Variabil ity>Inventory>…>Experience> Product configuration skill.
3. Product configuration skill >Modularity>Postponement>Variability> Inventory>…>Experience> Product configuration skill.
4. Process configuration skill >Postponement>Variability> Inventory>…>Experience> Process configuration skill.
5. Process configuration skill >P/D ratio>Variability> Inventory>…>Experience> Process configuration skill.
6. Process configuration skill >P/D ratio > Inventory>…>Experience> Process configuration skill.
Figure 49 Causal loop diagrams
Based on the model, all benefits to the supply chain come from either product or process
improvement. While mass customization increases the customer value by allowing customers
to configure products according to their specific needs, modularity, postponement and CODP
placement are beneficial because they improve the supply chain process by removing
unnecessary buffering needs (inventory or capacity) from the supply chain.

86
If we assume Loop No.1 starts from product configuration skill, better product configuration
increases the product mix attractiveness, which in turn enhances customer value. Having a
product that is preferred by customers will drive sales volume, increasing the firm’s
cumulative experience, which further enhances the product configuration skill.
In Loop No. 2, a better product configuration skill can manifest itself in the use of
modularization, which reduces variability in the supply chain. Reduced variability implies
lower requisite inventory levels, which drives down total cost from both inventory and
production perspectives. A lower cost provides the firm with the opportunity to reduce
product price, which helps the firm gain sales volume by providing better value for money.
The increased sales volumes translates into cumulative experience, which further reinforces
the product configuration skill (see loop No.1).
Loop No. 3 has similar feedback to loop No. 2, the difference being that considerate does not
consider the direct effect of modularity on variability, but instead considers the relationship
between modularity and variability through the use of postponement. Modularity is one way
to facilitate the use of postponement, this could for instance concern keeping an expensive
unspecified base product separate from less costly localization options (such as stickers,
manuals, power cords), meaning that the product need not be allocated to a final market until
the very time of distribution. This reduces the variability the supply chain must face, meaning
that the total inventory need is reduced.
Loop No. 4 serves as a companion to Loop No. 3, using the process configuration skill to
drive postponement. The combination of product and process improvement skills is necessary
to achieve a viable postponement strategy; luckily both are related to the cumulative
experience gained from production.
Considering Loop No. 4 as a reference, Loop No. 5 has the same feedback, excepting that
postponement is substituted for P/D-ratio. With a better process configuration skill, the
customer order decoupling point may be moved upstream, meaning that the process, in terms
of time, may be changed to be more make-to-order and less make-to-stock. The result being a
lower variability for the supply chain due to the shorter time under which production is
governed by forecasts.
In close relation to Loop No. 5 is Loop No. 6, which instead of variability considers the base
inventory requirement. Following the hypothesis that make-to-order supply chains require
less inventory than make-to-stock ones (due to e.g. increased visibility of demand and the
reduction of bullwhip), a supply chain with a CODP placed upstream will require less base

87
inventory to operate. As in the other loops, the cost reduction lowers prices, which increases
sales volumes and at the same time the cumulative experience, further improving our process
configuration skill, thereby closing the loop.
4.5 Conceptual framework
It has already been explained that market characteristics (OWs and OQs) and the stages of the
PLC are the underlying factors in configuring the appropriate product and process structures.
To help company strategically design their products and processes through product
maturation, a conceptual framework is built, connecting the concepts of mass customization,
postponement, the customer order decoupling point and modularization with the PLC stages,
market characteristics (OWs and OQs) and business implications, as is exhibited in Figure 50.
The conceptual framework is organized as follows: firstly, the business perspective
implications involved have been placed into four categories: marketing, products,
manufacturing, investment and cost. Then, important business issues for each perspective are
discussed. Following the business implications, the problem statements are summarized on
the basis of an overall manufacturing perspective. This influences a company’s product and
process configuration strategies with respect to the application of the concepts.
In the following section, we explain the conceptual framework and its applications: firstly,
concepts implications with respect to each of the PLC stages are discussed; then the
application of the framework in reality is discussed. For each stage of the life cycle, we
discuss marketing and products implications first, followed by manufacturing, investment and
cost, and finally the influence of the problem statements on the application of the four
concepts.

88
Figure 50 The conceptual framework
Aspects Design Introduction Growth Maturity Decline
Price Very high High Lower Lowest Lowest
Competitors No Few Many Many Few
Customers Panels & test respondents Innovators Early adopters Middle majority Laggards
Customers numbers Very low Low-Medium Medium-High Hign-Medium Medium-Low
How are orders won?
Order winners Design capability Quick response/design
Product quality/quick
response/flexible production/
delivery dependability Price Price
Market qualifiers Design/conformance quality
On-time
delivery/conformance quality
On-time delivery/conformance
quality/Price
On-time delivery/conformance
quality/Price
On-time delivery/conformance
quality/Price
Volume Very low Low-Medium Medium-High High-Medium Medium-Low
Vol growth Very low Low High None Declining
Product mix Wide Narrow Narrow Wide Adequate/narrow
No of parts per SKU Many Many Medium Few Few
Forecast quality Poor Poor Medium Good Good
Focus Process Process Process&Product Product Process
Quality focus Product Product Process&Product Process Product
Relative capacity Low/high Low Low Adequate Surplus
Performance measure Flexibility Flexibility Cost, flexibility Cost, productivity Cost, flexibility
Cumulative
experience Very low Low Low-Medium Medium-High High
Level of capital
investment Low/high Low-Medium High Low High/None/Low
Unit cost Very high High Medium Low Low
Cost reduction None Few Many Slower Few
Net cash flow Negative Negative Rising High Positive (declining)
Problem statement Uncertainty Uncertainty Capacity growth Cost reduction Termination strategy
Influence on
mass customization MTO
Postponement Design for postponement Developed Improved Fine-tuned Unchanged
CODP CODP location planned Implemented Modified Modified Possibly changed
modularization Most modules defined Implemented Improved Fine-tuned Improved/unchanged
Stage of PLC
Related to product mix/capacity for each stage
Marketing
Products
Manufacturing
Investment and cost

89
4.5.1 Design phase
The design phase is the stage at which a new product is first considered; the company faces great
uncertainty in terms of customers’ requirements and market preferences. To test product ideas, a very low
volume and wide range of products may be produced for evaluation by test panels or respondents, this
leads to an extremely high product cost. Little experience concerning product design results in an
unnecessarily large number of parts per SKU, as well as a poor quality of forecasted demand. In most
cases, no competitor exists at this phase; the company wins orders on design capability, and with design
and conformance quality acting as market qualifiers.
In essence, the business sells capability instead of product at this phase, which includes know-how, and
skills to design products based according to customer preferences. This also strongly relates to the
company’s existing equipment, facilities etc. Unpredictable sales volumes, frequent product and process
modifications call for processes to match the capacity with flexibility requirements. Quality control, on
the other hand, should focus on the product instead of the process, this is central to this phase of the PLC,
designing a customer preferred product through market testing.
The capital investment can be low or high, depending on the company’s business strategy and financial
budget. Production costs, especially in terms of labor and of defects, are likely to be high, due to little
experience regarding both process and product design. No cost reduction exists and the net cash flow
intends to be negative because no profit can be generated during this period.
New product introduction requires production to be started from company push instead of market pull, a
small quantity is produced to internal customer order and is associated with customized product
modification based on market testing. Products can already be designed with postponement in mind; this
may also be related to the planned position for the CODP. Modularization must be thought about in the
design phase if it is to be implemented later, most modules should already be designed at this stage –
either through the design of new modules or through the potential recombination of functionality from
previous products or concepts.
4.5.2 Introduction phase
Past the product design phase is the introduction phase, which is the time when a new product is formally
brought into the market. The company tries to ‘create’ demand by gaining the acceptance of customers
(innovators)’, while at the same time working out technical “teething” problems. The number of
customers increases slowly at this stage. Although the production cost is lower than for prototypes, the

90
initial sales price is high, for those concepts which have made it through market tests. Forecasts are still of
low quality, and the number of parts per SKU is still high. Some competitors may see the potential market
opportunity and enter the market at this time. The company wins orders on aspects such as quick response
and/or design capability, and criteria such as on-time delivery and conformance quality have typically
changed from being order-winners to being market-qualifiers.
As a consequence of the uncertain production volumes for each SKU, manufacturing should be process-
focused with flexibility and product quality as the major goal for winning orders. An increasing market
growth challenges existing capacity, which forces the company to reconsider its product and process
configurations.
Considering future growth, expensive equipment and facilities may be purchased at this stage, leading to
an increase in capital investment. Product cost may be reduced; this is mainly concerned with increased
production volumes and with product and process configuration modifications. However, the unit cost is
still high, albeit decreasing. The net cash flow is still negative at this stage since the generated profits are
insufficient to cover expenses, such as new equipment purchases and a high marketing cost.
Due to the uncertainties in product demand and the need to respond quickly to customer-driven changes,
both product and process configurations should be reconsidered; these push the company to start
implementing modularization and to apply CODP and postponement strategies to improve the supply
chain performance. In addition, mass customization should be used to exploit OWs, the implementation
being strongly related to product mix and capacity at this stage. This is concerned with matching existing
capacity with the product mix ability based on OW criteria, so that the individual customer preferences
can be satisfied.
4.5.3 Growth phase
The growth stage of the PLC is marked by a rapid growth in sales, with a volume change from medium to
high levels. Customers at this stage include early adopters and new additional consumers. The part
numbers per SKU is reduced due to the implementation of product modularization and a greater
understanding of the product design. The forecast quality improves in comparison to the introduction
phase. Prices fall slightly, along with reduced manufacturing costs. Many competitors attempt to exploit
the sales opportunity by entering the market with either the same features or improved products. This
generates a differentiated market flora of products and brands. A degree of maturity regarding product
design leads to competition on aspects other than design, which include product quality, responsiveness,
flexibility and delivery dependability, depending on the company’s business strategy and OWs. A wide

91
product range provided by different companies means that the company cannot charge an arbitrarily set
price, instead a reasonable market price is established; this introduces product price as a new market
qualifier.
It can be deduced from the marketing and product characteristics that the manufacturing strategy at the
growth stage has to consider cost and flexibility simultaneously; which of these factors the company
should focus on depends on competitive priorities. This also extends to the manufacturing focus, which
must consider competitive priorities to determine the balance the efforts between process (which allows
capacity to keep up with demand) and product. Following this, the quality focus should also be balanced
between process and product. Considering the cumulative sales volume over the PLC, the cumulative
production experience grows sharply at this stage.
A firm in the growth stage faces a trade-off between high capacity requirement and high current profit. By
spending money on promotion, product and process improvement, the firm can gain a large market share.
This leads to a either negative or positive net cash flow. The unit cost is reduced greatly due to the
product and process modifications in the introduction phase.
The major problem at this stage relies on the capacity growth. To cover the capacity growth requirement,
two ways are normally chosen:
1. Purchasing new equipment or increasing machine working hours.
2. Improve the product and process structures, so that high customer value can be achieved through
smooth production, and low operation and inventory costs. This calls for the improvements of
postponement, modularization, and modifications of the CODP and mass customization
implementation.
4.5.4 Maturity phase
At the maturity stage companies face slow or no sales growth with the volume of sales stabilizing.
Product maturity indicates a good product design and forecast quality, with intensified competition
leading to a wide product range and a lower product price. At this stage, the company will sell products
rather than capability, large customer orders will be won principally on price.
In this price sensitive market, the major manufacturing tasks will be low cost production; this can be
achieved through high production volumes, leading to high capacity utilization. The manufacturing
should be product focused and quality should be process focused, so that high volume, good quality

92
products can gain through a continuous process. Production experience continuously now increases
constantly, due to the near-zero growth in sales volume.
Capital investment at this stage tends to be low, but some process modification and promotion costs are
still necessary with respect to cost reduction and to retaining customers. High profits can accrue at this
stage due to high sales and low expense; this can be used for the company’s future growth.
To help keep costs low, the product bill of materials will be well structured based on ease of mass
production, this requires fine-tuning the product modularization and customization strategy. In terms of
process structure, a high level of dedication to the high production volumes is suitable; this leads to the
modifications of postponement and CODP placement.
4.5.5 Decline phase
The decline stage is marked by sales decline, this is due to new technological advances and shifting
customer tastes, the speed of decline might be slow or rapid, depending on the products and industries.
Some firms may withdraw from the market at this time since the sales decline leads to lowered profit,
others may decide to remain, and reconsider both their market segmentations and competitive strengths,
these lead to a reduction of both the number of products being offered and of the products’ sales price.
The sales decline leads to overcapacity, challenging firms’ existing manufacturing strategies. To better
cope with the surplus capacity, a suitable termination strategy becomes core to determining the firm’s
future growth. At this stage, the key manufacturing task relies on low cost production with great
flexibility, this calls for a process focused manufacturing and a product focused quality control.
Depending on what termination strategy the firm chooses, the level of capital investment at this stage can
be high, none or low. While increase investment helps firm to dominate the declining market, ignoring to
invest lets the firm use its already existing capacity to milk the market. Firms choosing a low investment
level may do this to cater to lucrative niches. In term of net cash flow, it is still positive but tending to
decline.
Depending on the firm’s termination strategy, mass customization may be reconsidered as a consequence
of changing demand and capacity levels. The CODP is most likely unchanged, due to an established
network structure; however, low volumes may push the CODP upstream or downstream depending on the
requirements of remaining customers and the costs of distribution. The postponement strategy is likely to
be unchanged, as the cost of changes to product/process design may not be covered by the small sales

93
volume. Modularization may however be changed, either by removing less popular modules, thereby
reducing production and stockholding complexity, or by introducing new modules which may keep the
product platform alive for a longer time.
4.5.6 Framework applications
The critical application of the conceptual framework is intended to serve as a set of guidelines for
companies wishing to align their product and process design with the PLC, allowing benefits (cost
reduction / customer value) to be gained by leveraging the different stages of the PLC. For instance,
companies designing or changing their products and process structures typically need to know where the
problem is or what should be improved. Considering the company’s OWs and the product’s business
characteristics, the maturity of a product can be defined, which determines the stage of the PLC. Going to
the conceptual framework and checking the stage of the PLC, the problem statements and concepts
implications provide some guidelines which companies should consider when they design or change their
product and process structures. It is necessary for firms to understand this relationship, so that
unnecessary waste can be avoided, the product and process can be continuously improved on the basis of
demand characteristics in a way that will provide competitive advantage.
Another contribution of the conceptual framework is related to the product portfolio management, where
the same sequences are followed by each product type. This, in turn, helps companies manage different
products and reduce the complexity and costs in term of demand fulfillment.
5. Case study
To test the model in practice, a company case is described in this chapter, we first introduce the case
company; then, the concept application is presented; finally, some discussions are carried out.
5.1 Case company
Toyota Industrial Equipment and BT have joined forces to become Toyota Material Handling Group
(TMHG) in 2000. Since then, it becomes a leading manufacturer of lift trucks and other materials
handling equipment throughout the world. TMHG has five regional organizations, covering Japan, China,
North America, Europe and "International (includes the Middle East, Oceania, Latin America and
Africa)". Apart from different product and market focus, these five divisions have similar business
mission, organization culture and production system structure.

94
TMHG’s vision is “To build trust and confidence with customers by delivering outstanding quality
products and services which add real value to their business.” This leadership is achieved as consisting of
two parts:
• Customer first
• Quality
The customer first philosophy leads the Toyota production system (TPS) starts from customer s’ demands,
and with satisfy their needs as mission. At the heart of this approach lies an uncompromising commitment
to quality.
Leading by the vision, the Toyota production system (TPS) is based on the principles of Jidoka and Just-
in-time, with the support of a strong team culture - the Toyota way. While Jidoka means intelligent
automation, refers to the production comes to a halt whenever a problem is detected, a signal is sent
immediately and trained staff will come to fix the problem directly, the whole process will continue until
the root cause of the problem is identified and resolved. This guarantee of maximum product quality and
minimum wastage during the process at all times. Just-in-time means produce the right product at the
right time in the right conditions. This relies on ‘Just-in-time’ production, which means fine-tuned
process of production in the assembly follows a step by step procedure, so that the necessary
infrastructure, people, place and machine can be tightly organized based on the customer orders.
Supporting this system is the Toyota culture, by going to the source to find the facts to make correct
decisions (Genchi Genbutsu), by continuous improvement (Kaizen), by embracing challenges, by
respecting customers and each other, by teamwork, the product quality is optimized, as well as customer
satisfaction, this further leads the success of Toyota.
5.2 Scope of case study
The case study is limited to consider one of the three factories in Toyota Material Handling Europe
(TMHE), located in Mjölby, Sweden; it is one of the largest warehouse truck manufacturing facilities in
the world with 76 000 m2 factory space and 1 500 employees. With the major mission of satisfying
European customers, the Mjölby factory provides product ranges from hand pallet trucks to powered
pallet trucks, stackers and reach trucks (See Figure 51).
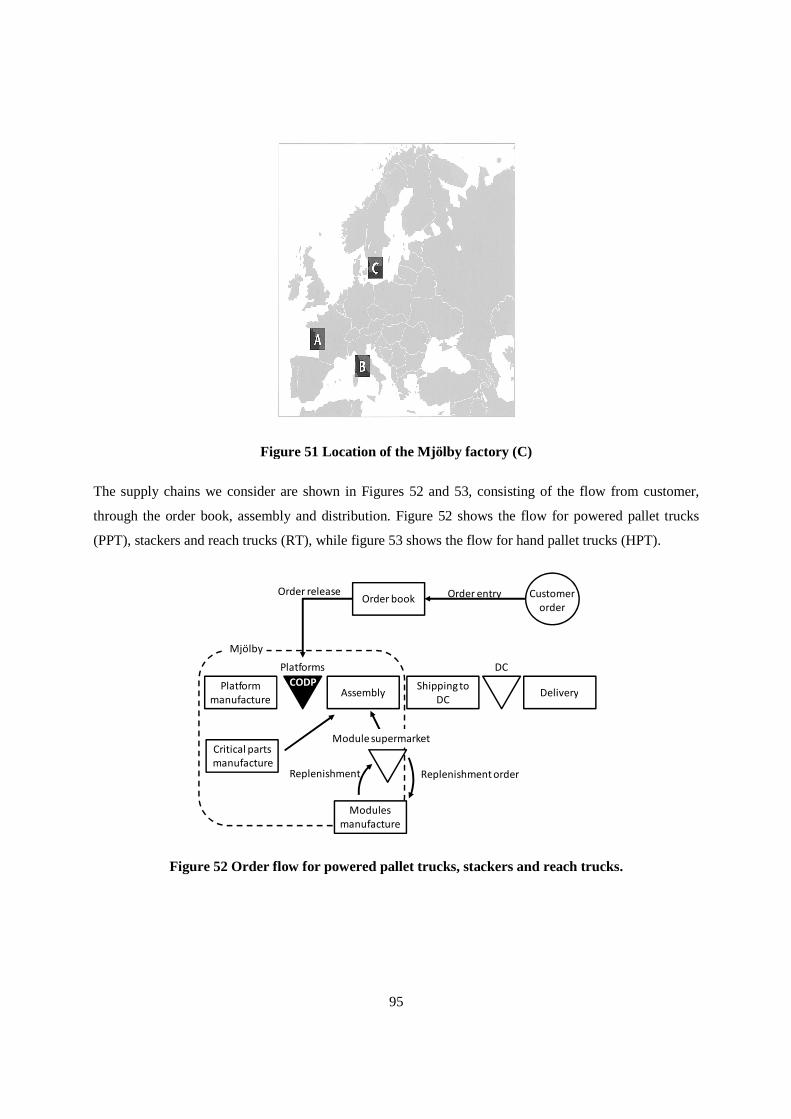
Figure
The supply chains we consider are shown in Figures
through the order book, assembly and distribution.
(PPT), stackers and reach trucks
Figure 52 Order flow for powered pallet trucks
Platform
manufacture
Order release
Mjölby
Critical parts
manufacture
95
Figure 51 Location of the Mjölby factory (C)
The supply chains we consider are shown in Figures 52 and 53, consisting of the flow from customer,
through the order book, assembly and distribution. Figure 52 shows the flow for powered pallet trucks
(RT), while figure 53 shows the flow for hand pallet trucks
flow for powered pallet trucks, stackers and reach trucks
Order book
AssemblyShipping to
DCDelivery
DCPlatforms
Customer
order
Order entryOrder release
Modules
manufacture
Module supermarket
Replenishment orderReplenishment
CODP
, consisting of the flow from customer,
shows the flow for powered pallet trucks
shows the flow for hand pallet trucks (HPT).
reach trucks.
Delivery
Customer
order
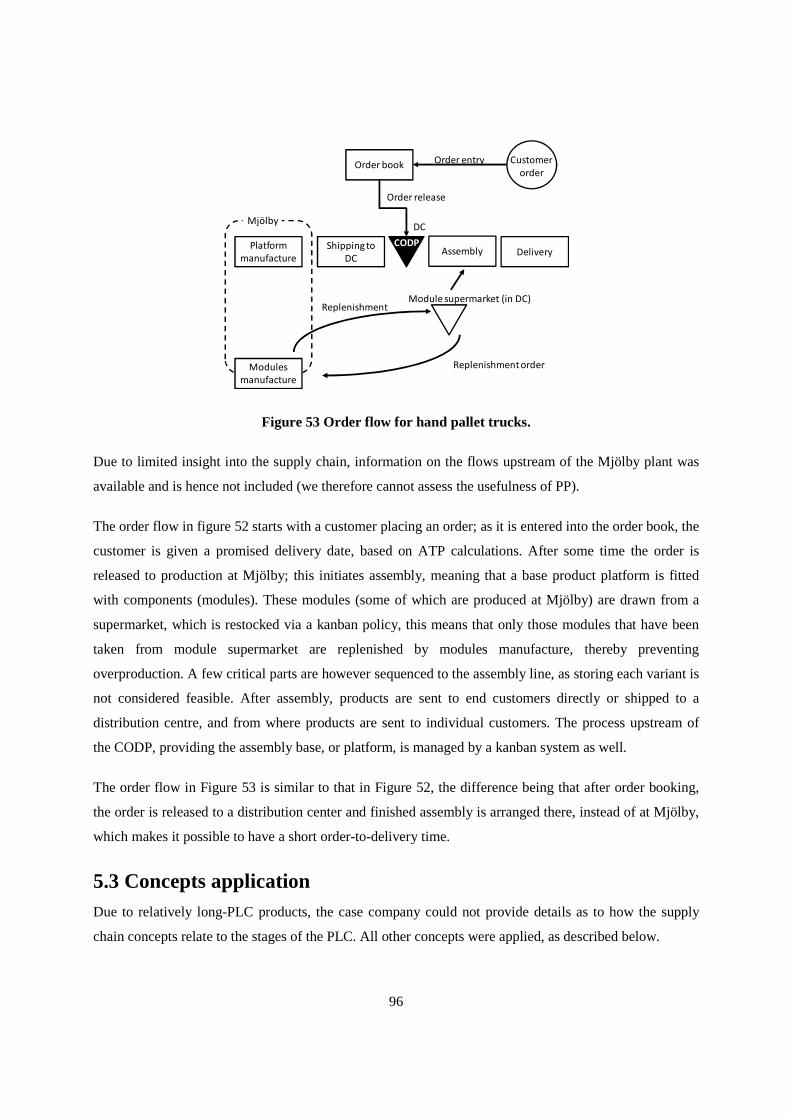
96
Figure 53 Order flow for hand pallet trucks.
Due to limited insight into the supply chain, information on the flows upstream of the Mjölby plant was
available and is hence not included (we therefore cannot assess the usefulness of PP).
The order flow in figure 52 starts with a customer placing an order; as it is entered into the order book, the
customer is given a promised delivery date, based on ATP calculations. After some time the order is
released to production at Mjölby; this initiates assembly, meaning that a base product platform is fitted
with components (modules). These modules (some of which are produced at Mjölby) are drawn from a
supermarket, which is restocked via a kanban policy, this means that only those modules that have been
taken from module supermarket are replenished by modules manufacture, thereby preventing
overproduction. A few critical parts are however sequenced to the assembly line, as storing each variant is
not considered feasible. After assembly, products are sent to end customers directly or shipped to a
distribution centre, and from where products are sent to individual customers. The process upstream of
the CODP, providing the assembly base, or platform, is managed by a kanban system as well.
The order flow in Figure 53 is similar to that in Figure 52, the difference being that after order booking,
the order is released to a distribution center and finished assembly is arranged there, instead of at Mjölby,
which makes it possible to have a short order-to-delivery time.
5.3 Concepts application Due to relatively long-PLC products, the case company could not provide details as to how the supply
chain concepts relate to the stages of the PLC. All other concepts were applied, as described below.
Order book
AssemblyShipping to
DCDelivery
DC
Platform
manufacture
Customer
order
Order entry
Order release
Module supermarket (in DC)
Replenishment order
Replenishment
Mjölby
Modules
manufacture
CODP
97
Modularization
Toyota trucks employs modularization to a very high degree, with some modules being shared across
many different types of trucks; this includes forks, batteries, wheels and handles where the same SKU can
be used for vastly different products. Modules are also shared within product groups, as only the
differentiating factor between products (e.g. weight capacity, fork length or lift height) is varied between
products in the same family. Doing this standardizes assembly operations, at the same time as it reduces
overall BOM-complexity. Some modules exist in many different varieties; of these only the standard
variants are stored, with more infrequent ones only being made directly to customer order.
Mass customization
Toyota trucks implement customization (for about 15% of the sales volume) across whatever categories
customers request; common modifications include lift height, battery capacity and color of the products.
Concerning lift height and battery capacity, there is a limited range of standard configurations; however it
is possible for customers to order the exact lift height they require. In the same way, product color can
also be produced exactly as desired. For lift height and battery capacity, the SKUs are managed as generic
modules, while non-standard color configurations are modules assigned to specific customers; we
consider this as true mass customization, as customers can choose just about any color they like. In
extreme cases, even the chassis design can be customized; this however implies much longer lead times
as well as a significantly greater cost.
However, for standard configurations, we only find a smaller degree of customization due to the limited
catalogue of modules, which makes fast delivery possible (as they allow for a downstream CODP
position) and also help to reduce variability in the supply chain.
Customer order decoupling point (CODP)
Toyota Trucks have different CODP’s for different products; with HPT’s having a CODP much closer to
the customer than other types of trucks. This is due to HPT’s having a very simple BOM, making it
possible to assemble them in distribution centers, which makes a short order-to-delivery time possible.
Placing the CODP downstream makes it possible for the order book to smooth out short-term demand
variations, thus reducing the need for safety stock.
For the more complex BOM products (PPT, stackers and RT) the CODP is placed upstream, in the
Mjölby plant, as the number of stored SKU’s can be reduced due to collecting the demand variability into
common platforms. This leads to a longer delivery lead time to customers, however if the delivery lead
98
time is longer than customer expectations, customers may rent similar equipment until their ordered
machine can be delivered. Because safety stocks can be reduced by having a CODP placed upstream, this
could reflect on the price of the product – customers willing to sacrifice the convenience of a short
delivery time may instead be able to buy the product at a slightly cheaper price, given that they wait a bit
longer.
Postponement
A feature of the Toyotas trucks supply chain, is that products are only managed on a generic level
upstream the CODP, with products being specified to order downstream of the point. This indicates a
system where much variability is filtered out due to as late as possible (i.e. at the CODP) commitment of
materials to a specific configuration. We may therefore say that Toyota uses form postponement for their
products.
5.3 Discussion The supply chain at Toyota trucks does not provide evidence for the effect of the product life cycle on the
other supply chain concepts; this is likely due to the long product life cycle for the truck category of
products, making it hard to appreciate the development of the PLC as it moves very slowly. All, other
concepts of the study were actively used in Toyotas manufacture of material handling equipment.
One important aspect is the existence of CODPs in different locations for different products; with HPT’s
being assembled in distribution centres instead of the factory. This allows for supply to be closer to the
customer in terms of lead time, while the stock requirements do not increase very much, due to having
common parts for the several HPT trucks. Modularization ties nicely into the CODP concept, as many
components are made to stock, serving the assembly line. Being able to use the same modules for a large
range of end products, Toyota can effectively reduce the variation, and thereby the safety stock levels in
its supply chain.
Mass customization is implemented by combining the modules in different ways, but also by producing
some modules completely to customer specification (lift height, being the main feature that is customized).
With regards to postponement, Toyota manages to reduce supply chain variability by delaying all
specification of a product until production is committed to a customer order. This application of
postponement relates strongly to both the CODP and to modularization, indicating the potential benefits
that can be realised if the concepts are applied together, rather than separately.
99
6. Concluding remarks
This final chapter not only covers the implications of this research, but also discusses the research
limitations and future works.
6.1 Conclusion
In this paper, we have reviewed the concepts of the product life cycle (PLC), modularization, mass
customization, the customer order decoupling point (CODP) and postponement, and discussed their
benefits and limitations individually. By using a causal loop diagram (CLD), we formulate a cause-and
effect-model and create a conceptual framework to investigate the usefulness of modularization, mass
customization, the CODP and postponement across the PLC. Two research objectives were reached:
1. Formulate the relationships between concepts modularization, mass customization, CODP,
postponement and the PLC with respect to business benefits.
2. Create a conceptual framework intend to serve as a set of guidelines for wishing to align product
and process design with respect to the PLC.
Some learning points were discovered when this research was conducted.
1. The PLC fosters a new way of thinking about product and process design; this should take
business benefits on the first place.
2. The PLC can be view as a driven factor to progressive increases in synergistic specificity
between product and process design, so that production cost and customer value are balanced
in a way of maximize the company’s profits.
6.2 Limitations
A potential limitation to use the conceptual framework in practice is that not all products are suitable for
CODP, postponement, modularization, and customization. This is mainly concern with the drawbacks or
limitations of each concept. For example, in processing industries, it is difficult to decouple process into
many sub-processes, therefore, not possible to obtain both economics of scale and scope. Moreover, some
products may hard to use a modularization strategy since it is difficult to gain sufficient information with
respect to customer need. In term of customization, it may not be relevant for some commodity products
100
or government services. Consequently, the conceptual framework can only be served as a set of
guidelines for company to align their product and process design with respect to the PLC; this means that
the framework may not be capable fit all companies and products.
6.3 Future research
We consider the conceptual framework as a preliminary step towards linking the PLC with the product
and process design. An interesting direction for future research would be test the model by using either
statistic method or simulation model to probe exactly ‘how’ the PLC effect these product and process
concepts.
7. References
Ahmad, S., Schroeder, R. G. & Mallick, D. N., 2010. The relationship among modularity, functional
coordination, and mass customization: Implications for competitiveness. European Journal of Innovation
Management, Vol. 13, No. 1, pp. 46-61.
Aitken, J., 1998. Supply integration within the context of a supplier association. Cranfield university, Ph.
D. thesis.
Aitken, J., Christopher, M. & Towill, D., 2002. Understanding, implementing and exploiting agility and
leanness. International Journal of Logistics: Research and Applications, Vol. 5, No. 1, pp. 59-74.
Aitken, J., Childerhouse, P. & Towill, D., 2003. The impact of product life cycle on supply chain strategy.
International Journal of Production Economics, Vol.85, pp. 127–140.
Alderson, W., 1950. Marketing efficiency and the principle of postponement. Cost and Profit Outlook,
Vol. 3, pp. 15-18.
Baldwin, C. & Clark, K., 1997. Managing in an age of modularity. Harvard Business Review, pp.84-93.
Blaikie, N.,1993. Approaches to Social Enquiry. Polity Press, Cambridge, UK.
Blecker, T. & Friedrich, G., 2006. Mass customization: challenges and solutions. Springer Science.
Braithwaite, A., 1993. Logistic systems or customer focused organization: which comes first? Logistics
Information Management Journal, Vol. 6, No. 4, pp.26-37.

101
Brown, A. O., Lee, H. L. & Petrakian, R., 2000. Xilinx improves its semiconductor supply chain using
product and process postponement. Interfaces, Vol. 30, No. 4, pp. 65-80.
Brun, A. & Zorzini, M., 2009. Evaluation of product customization strategies through modularization and
postponement. International Journal of Production Economics, Vol. 120, pp. 205-220.
Bucklin, L. P., 1965. Postponement, speculation and the structure of distribution channels. Journal of
Marketing Research, pp. 26-31.
Chandra, C. & Kamrani, A., 2004. Mass customization: a supply chain approach. New York: Kluwer
Academic.
Christopher, M., 1992. Logistics and supply chain management. First edition. London, Pitmans.
Christopher, M., 2000. The agile supply chain: competing in volatile markets. Working Paper, Cranfield
School of Management, UK.
Christopher, M., 2005. Logistics and supply chain management. Third edition. Prientice Hall, finance
times.
Christopher, M. & Towill, D. R., 2000. Supply chain migration from lean and functional to agile and
customised. Supply Chain Management: An International Journal, Vol. 5, No. 4, pp. 206-213.
Christopher, M. & Towill, D., 2001. An integrated model for the design of agile supply chains.Working
paper.
Comstock, M., Johansen, K. & Winroth, M. 2004. From mass production to mass customization: enabling
perspectives from the Swedish mobile telephone industry. Production Planning & Control, Vol. 15, No. 4,
pp. 362-372.
Cooper, C. & Ellram, L., 1993. Characteristics of supply chain management and the implication for
purchasing and logistics strategy. The International Journal of Logistics Management, Vol. 4, No. 2, pp.
13-24.
Cooper, M. C., Lambert, D. M. & Pagh, J. D., 1997. Supply chain management: more than a new name
for logistics. The International Journal of Logistics Management, Vol. 8, No. 1, pp. 1-14.
Davis, S.M., 1987. Future Perfect. Addison-Wesley, MA.

102
Dean, J., 1954. Measuring the Productivity of Capital. Harvard Business Review, Vol. 32, No. 1, pp. 120-
130.
Dhalla, N. & Yuspeh, S., 1976. Forget the product life cycle concept. Harvard Business Review, pp.102-
112.
Duray, R., 2002. Mass customization origins: mass or custom manufacturing? International Journal of Operations & Production Management, Vol. 22, No. 3, pp. 314-328.
Duray, R., Ward, P. T., Milligan, G. W. & Berry, W. L., 2000. Approaches to mass customization:
configurations and empirical validation. Journal of Operations Management, Vol. 18, pp. 605–625.
Easterby-Smith, M. Thorpe, R.and Jackson, P., 2008. Management Research: Theory and Practice. Sage
Publications, London.
Ericsson, A. & Erixon, G., 1999. Controlling Design Variants: Modular Product Platforms. New York:
ASME.
Ernst, R. & Kamrad, B., 2000. Evaluation of supply chain structures through modularization and
postponement. European Journal of Operational Research, Vol.124, No. 3, pp. 495-510.
Feitzinger, E. & Lee, H., 1997. Mass customization at HewlettPackard: the power of postponement.
Harvard Business Review, pp. 116-121.
Fisher, M. L., 1997. What is the right supply chain for your products? Harvard Business Review, pp. 105-
116.
Fleming, L. & Sorenson, O., 2001. The dangers of modularity. Harvard Business Review, pp. 20-21.
Fox, Harold W., 1973. A framework for functional coordination. Atlanta Economic Review, Vol. 23, No.
6, pp. 8-11.
Fujita, K., 2002. Product variety optimization under modular architecture. Computer-Aided Design,
Vol.34, No. 12, pp. 953-965.
Gattorna, J. L. & Walters, D.W., 1996. Managing the supply chain: a strategic perspective, MacMillan,
London.

103
Gershenson, J. & Prasad, G., 1997. Product modularity and its effect on service and maintenance.
Proceedings of the 1997 Maintenance and Reliability Conference, Knoxville, Tennessee.
Gershenson, J., Prasad, G. & Allamneni, S., 1999. Modular product design: A life-cycle view. Journal of
Integrated Design and Process Science, Vol. 3, No 4, pp. 13-26.
Gershenson, J., Prasad, G. & Zhang, Y., 2003. Product modularity: definitions and benefits. Journal of
Engineering Design, Vol. 14, No. 3, pp. 295–313.
Gilmore, J. H. & Pine, B. J., 1997. The four faces of mass customization.Harvard Business Review, pp.
91-101.
Golafshani, N., 2003. Understanding reliability and validity in qualitative research. The Qualitative
Report, Vol. 8, No. 4, pp. 597-607.
Goldman, S., Nagel, R. & Preiss, K., 1995. Agile Competitors and Virtual Organisations. New York, Van
Nostrand Reinhold.
Goldsby, T. J., Griffis, S. E. & Roath, A. S., 2006. Modeling lean, agile and leagile supply chain
strategies. Journal of Business Logistics, Vol. 27, No. 1, pp. 57-80.
Grantham, L., 1997. The validity of the product life cycle in the high-tech industry. Marketing
Intelligence & Planning, Vol.15, No. 1, pp. 4-10.
Graman, G. A. & Bukovinsky, D. M., 2005. From mass production to mass customization: postponement
of inventory differentiation. The Journal of Corporate Accounting & Finance, pp. 61-65.
Gu, P. & Sosale, S., 1999. Product modularization for life cycle engineering. Robotics and Computer
Integrated Manufacturing, Vol. 15, pp. 387-401.
Hallgren, M. & Olhager, J., 2006. Differentiating manufacturing focus. International Journal of
Production Research, Vol. 44, No. 18-19, pp. 3863–3878.
Hallgren, M. & Olhager, J., 2008. Lean and agile manufacturing: external and internal drivers and
performance outcomes. International Journal of Operations & Production Management, Vol. 29, No. 10,
pp. 976-999.
104
Harrison, A. & Van Hoek, R., 2005. Logistics management and strategy. Second edition. Prientice Hall,
finance times.
Hart, C., 1995. Mass customization: conceptual underpinnings, opportunities and limits. International
Journal of Service Industry Management, Vol. 6, No. 2, pp. 36-45.
Hayes, R. H. & Wheelwright, S. C., 1979. Link manufacturing process and product life cycles. Harvard
Business Review, pp. 133-140.
Hayes, R. & Wheelwright, S., 1979. The dynamics of process-product life cycles. Harvard Business
Review, pp. 127-136.
Hedenstierna, P & Ng, H.C. A., 2010. Proceedings of The eighth International Conference on Supply
Chain Management and Information Systems, Hong Kong, submitted.
He, D.W. & Kusiak, A., 1996. Performance analysis of modular products. International Journal of
Product Development, Vol. 34, No. 1, pp. 253-272.
Hill, T., 2000. Manufacturing Strategy: Text and Cases. Second edition. Palgrave, Houndmills,
Hampshire.
Van Hoek, R. I., 1998. Reconfiguring the supply chain to implement postponed manufacturing. The
International Journal of Logistics Management, Vol. 9, No. 1, pp. 95-110.
Van Hoek, R. I., 2000. The thesis of leagility revisited. International Journal of Agile Management
Systems, Vol. 2, No. 3, pp. 196-201.
Van Hoek, R. I., 2001. The rediscovery of postponement a literature review and directions for research.
Journal of Operations Management, Vol. 19, pp. 161–184.
Van Hoek, R. I. & Commandeur, H. R., 1998. Reconfiguring logistics systems through postponement
strategies. Journal of Business Logistics, Vol. 19, No. 1, pp. 33-54.
Van Hoek, R.L, Peelen, E. & Commandeur, H.R., 1999a. Achieving mass customization through
postponement: a study of international changes. J. Market Focused Manage, Vol. 3, pp. 353-368.
Van Hoek, R. I., Vos, B. & Commandeur, H. R., 1999b. Restructuring European supply chains by
implementing postponement strategies. Long Range Planning, Vol. 32, No. 5, pp. 505–518.

105
Hofer, C., 1975. Toward a contingency theory of business strategy. Academy of Management Journal,
Vol.18, No. 4, pp. 784-810.
Hopp, W. J., 2003. Supply chain science. First edition. McGraw-Hill, Irwin.
Howard, M. & Squire, B., 2007. Modularization and the impact on supply relationships. International
Journal of Operations & Production Management, Vol. 27, No. 11, pp. 1192-1212.
Hsuan, J., 1999. Impacts of supplier–buyer relationships on modulariza tion in new product development.
European Journal of Purchasing & Supply Management, Vol. 5, pp. 197–209.
Ishii, K., 1998. Modularity: A key concept in product life-cycle engineering. Stanford University [online].
Available at: http://www-mml.stanford.edu/publications/1998/1998.LEbook.ishii.pdf [accessed 18 April
2010].
Jiao, J., Ma, Q. & Tseng, M. M., 2002. Towards high value-added products and services: mass
customization and beyond. Technovation, Vol. 23, pp. 809–821.
Johansson, H. J., McHugh, P., Pendlebury, A.J. & Wheeler, W. A., 1993. Business Process Reengineering:
Breakpoint Strategies for Market Dominance, John Wiley & Sons, Chichester.
Kentaro, N., 2005. Competitiveness of Japanese companies in products with modular architecture:
Limitation of Chinese digital appliance manufacturers with capabilities to assemble. Research Institute of
Economy, Trade & Industry, IAA, [online]. Available at: http://www.rieti.go.jp/en/papers/research-
review/028.html [accessed 18 April 2010].
Kotha, S., 1995. Mass customization: implementing the emerging paradigm for competitive advantage.
Strategic Management Journal, Vol. 16, pp. 21-42.
Kotler, P. & Keller, K., 2004. Marketing management. Twelfth edition. Prentice Hall.
Kreng, V., & Lee, T., 2004. QFD-based modular product design with linear integer programming-a case
study. Journal of Engineering Design, Vol. 15, No. 3, pp. 261–284.
Kusiak, A., 2002. Integrated product and process design: a modularity perspective. Journal of Engineering
Design, Vol. 13, No. 3, pp. 223-231.

106
Lamming, R. C., 1996. Squaring lean supply with supply chain management. International Journal of
Operations & Production Management, Vol. 16, No. 2, pp. 183-196.
Lampel, J. & Mintzberg, H., 1996. Customizing Customization. Sloan Management Review, pp. 21-30.
Langlois, R., 1999. Modularity in technology, organization and society. Working Papers 1999-05,
university of connecticut, [online]. Available at:
http://papers.ssrn.com/sol3/papers.cfm?abstract_id=204089.
Lau, A. & Yam, R., 2005. A case study of product modularization on supply chain design and
coordination in Hong kong and China. Journal of Manufacturing Technology Management, Vol. 16, No.
4, pp. 432-446.
Lee, H. L., 1996. Effective management of inventory and service through product and process redesign.
Operations Research, Vol. 44, pp. 151-159.
Lee, H.L., 1998. Postponement for mass customization: satisfying customer demands for tailor-made
products, in Gattorna, J. (Ed.), Strategic Supply Chain Alignment, Gower, Brookfield, VT, pp. 77-91.
Lee, H. L., 2004. The triple-A supply chain. Harvard Business Review, pp. 102-112.
Lee, H. L., Billington, C. & Carter, B., 1993. Hewlett-packard gains control of inventory and service
through design for localization. Interfaces, Vol. 23, No. 4, pp. 1-11.
Lee, H. L. & Corey, B., 1994. Designing products and processes for postponement. In Management of
Design: Engineering and Management Perspectives, edited by S. Dasu, & C.M. Eastman (Boston:
Kluwer), pp. 105–122.
Lee, H. L., Padmanabhan, V. & Whang, S., 1997. The bullwhip effect in supply chain. Sloan
Management Review, pp. 93-102.
Lee, H. L. & Tang, C. S., 1997. Modelling the costs and benefits of delayed product differentiation.
Management Science, Vol. 43, No. 1, pp. 40-53.
Levitt, T., 1965. Exploit the product life cycle. Harvard Business Review, pp. 81-94.
Lin, Q., 1993. To be lean or to be agile? The choice of supply chain strategy. Zhong Shan university,
Master thesis.
107
Magnan, G., Fawcett, S. & Birou, L., 1999. Benchmarking manufacturing practice using the product life
cycle. Benchmarking: An International Journal, Vol.6, No. 3, pp. 239-253.
Marshall, R., Leaney, P. G. & Botterell, P., 1998. Enhanced product realisation through modular design: an example of product/process integration. Proceedings of Third Biennial World Conference on Integrated Design and Process Technology, Society for Design and Process Sciences, Berlin
Mason-Jones, R., Naylor, B. & Towill, D. R., 2000. Engineering the leagile supply chain. International
Journal of Agile Management Systems, Vol. 2, No. 1, pp. 54-61.
Mason-Jones, R. & Towill, D., 1999. Using the information decoupling point to improve supply chain
performance. The International Journal of Logistics Management, Vol. 10, No. 2, pp. 13-26.
Meenaghan, J. & O' Sullivan, P., 1986. The shape and length of the product life cycle. Irish Marketing
Review, [online]. Vol.1, pp. 83-102. Available at: http://arrow.dit.ie/buschmarart/23 [accessed 18 April
2010].
Mentzer, J. et al., 2001. Defining supply chain management. Journal of Business Logistics, Vol. 22, No. 2,
pp. 1-25.
Mikkola, J., 2006. Management of product architecture modularity for mass customization: modeling and
theoretical considerations. IEEE Transactions on Engineering Management, Vol. 54, No. 1, pp. 57-69.
Mikkola, J. & Gassmann, O., 2003. Managing modularity of product architectures: toward an integrated
theory. IEEE Transactions on Engineering Management, Vol. 50, No. 2, pp.1-15.
Mikkola, J. & Skjott-Larsen, T., 2004. Supply-chain integration: implications for mass customization,
modularization and postponement strategies. Production Planning & Control, Vol. 15, No. 4, pp. 352-361.
Miller, T. D. & Elgård, P., 1998. Defining modules, modularity and modularization: evolution of the
concept in a historical perspective. Design for Integration in Manufacturing. Proceedings of the 13th IPS
Research Seminar, Fuglsoe.
Mohammed, I. R., Shankar, R. & Banwet, D.K., 2008. Creating flex-lean-agile value chain by
outsourcing: an ISM-based interventional roadmap. Business Process Management Journal, Vol. 14, No.
3, pp. 338-389.
Nadeau, J. & Casselman, R., 2008. Competitive advantage with new product development-implications
for life cycle theory. Journal of Strategic Marketing, Vol. 16, No. 5, pp. 401–411.
108
Naumann, E. & Kordupleski, R., 1995. Customer Value Toolkit. First edition. South-Western College
Publishing.
Naylor, J. B., Naim, M. M. & Berry, D., 1999. Leagility: Integrating the lean and agile manufacturing
paradigms in the total supply chain. International Journal of Production Economics, Vol. 62, pp. 107-118.
Newcomb, P., Bras, B. & Rosen, D., 1996. Implications of modularity on product design for the life cycle.
Proceedings of The 1996 ASME Design Engineering Technical Conferences and Computers in
Engineering Conference, Irvine, California.
Ohno, T., 1988. Toyota production system: beyond large-scale production, Productivity Press, New York.
Olhager, J., 2003. Strategic positioning of the order penetration point. International Journal of Production
Economics, Vol. 85, No. 3, pp. 319-329.
Olhager, J. & Östlund, B., 1990. An integrated push-pull manufacturing strategy. European Journal of
Operational Research, Vol. 45, No. 2/3, pp. 135-142.
Olhager, J. & Selldin, E., 2007. Manufacturing planning and control approaches: market alignment and
performance. International Journal of Production Research, Vol. 45, No. 6, pp.1469-1484.
Pagh, J. D. & Cooper, M. C., 1998. Supply chain postponement and speculation strategies: how to choose
the right strategy. Journal of Business Logistics, Vol. 19, No. 2, pp.13-33.
Pidd, M., 1988. Computer simulation in management science, Wiley, Hoboken.
Piller, F., 2002. Customer interaction and digitizability: a structural approach to mass
customization.Working paper.
Pine, B. J., 1993. Mass customization: the new frontier in business competition. Harvard Business School
Press, Boston.
Pine, B. J., Victor, B. & Boynton, A. C., 1993. Making mass customization work. Harvard Business
Review, pp. 108-119
Porter, M. E., 1985. Competitive advantage. Free Press, New York, NY.
Rudberg, M. & Wikner, J., 2004. Mass customization in terms of the customer order decoupling point.
Production Planning & Control, Vol. 15, No. 4, pp. 445–458.

109
Selldin, E. & Olhager, J., 2007. Linking products with supply chains: testing Fisher's model. Supply
Chain Management: An International Journal, Vol. 12, No. 1, pp. 42-51.
Sharman, G., 1984. The rediscovery of logistics. Harvard Business Review, Vol. 62, No. 5, pp. 71–80.
Shingo, S., 1989. A study of the Toyota production system from an industrial engineering Viewpoint.
Productivity Press, New York, NY.
Silveira, G. D., Borenstein, D. & Fogliatto, F. S., 2001. Mass customization: Literature review and
research directions. International Journal of Production Economics, Vol. 72, pp. 1-13.
Simon, H., 1962. The architecture of complexity. Proceedings of The American Philosophical Society,
Vol. 106, No. 6, pp. 467-482.
Skipworth, H. & Harrison, A., 2006. Implications of form postponement to manufacturing a customized
product. International Journal of Production Research, Vol. 44, No. 8, pp. 1627–1652.
Squire, B., Brown, S., Readman, J. & Bessant, J., 2006. The Impact of mass customisation on
manufacturing trade-offs. Production and Operations Management, Vol. 15, No. 1, pp. 10–21.
Steffens, P. & Kaya, M., 2008. Reconceptualizing the product life cycle concept-lessons from diffusion of
innovations. Social Science Research Network, [online]. Working Paper Series. Available at:
http://papers.ssrn.com/sol3/papers.cfm?abstract_id=1142890 [accessed 18 April 2010].
Sterman, J., 2000. Systems thinking and modeling for a complex world, McGraw Hill, New York, NY.
Stern, C. & Deimler, M., 2006. The Boston Consulting Group on Strategy: Classic concepts and new
perspectives. Second edition. John Wiley & Sons, Inc., Hoboken, New Jersey.
Suh, N.P., 1990. The Principles of Design. Oxford University Press.
Supply Chain Council, 2005. Supply Chain Operations Reference-model, Overview Version 7.0, pp. 3.
Swaminathan, J. M. & Lee, H. L., 2003. Design for postponement. In Graves & de Kok, ed.
Handbook of OR/MS on Supply Chain Management.
Toffler, A., 1971. Future Shock. Bantam Books, New York.

110
Towill, D. & Christopher, M., 2002. The supply chain strategy conundrum: to be lean or agile or to be
lean and agile? International Journal of Logistics: Research and Applications, Vol. 5, No. 3, pp. 299-309.
Tseng, M. M. & Jiao, J., 1996. Mass Customization.In Gavriel Salvendy, ed. Handbook of Industrial
Engineering. Wiley–Interscience. Ch.25.
Tu, Q., Vonderembse, M. A. & Ragu-Nathan, T. S., 2001. The impact of time-based manufacturing
practices on mass customization and value to customer. Journal of Operations Management, Vol. 19, No.
2, pp. 201-217.
Tu, Q., Vonderembse, M., Ragu-Nathan, T. & Ragu-Nathan, B., 2004. Measuring modularity-based
manufacturing practices and their impact on mass customization capability: a customer-driven perspective.
Decision Sciences, Vol. 35, No. 2, pp. 147-168.
Ulrich, K., 1995. The role of product architecture in the manufacturing firm. Research Policy, Vol. 24, pp.
419-440.
Ulrich, K.T. & Eppinger, S.D., 1995. Product Design and Development. New York: McGraw-Hill.
Ulrich, K. & Tung, K., 1991. Fundamentals of product modularity. Proceedings of the 1991 ASME
Design Engineering Technical Conferences - Conference on Design/Manufacture Integration, Miami, FL.
Van der Walt, A., Strydom, WJ., Marx, S. & Jooste, CJ., 1996. Marketing strategy. Third edition. South
Africa: Juta.
Voordijk, H., Meijboom, B. & Haan, J., 2006. Modularity in supply chains: a multiple case study in the
construction industry. International Journal of Operations & Production Management, Vol. 26, No. 6, pp.
600-618.
Wadhwa, S., Bhoon, K.S. & Chan, F. T. S., 2006. Postponement strategies through business process
redesign in automative manufacturing knowledge innovation. Industrial Management & Data Systems,
Vol. 106, No. 3, pp. 307-326.
Waller, M. A., Dabholkar, P. A. & Gentry, J.J., 2000. Postponement, product customization, and market-
oriented supply chain management. Journal of Business Logistics, Vol. 21, No. 2, pp. 133-60.

111
Wang, G., Huang, S. H. & Dismukes, J. P., 2004. Product-driven supply chain selection using integrated
multi-criteria decision-making methodology. International Journal of Production Economics, Vol. 91, pp.
1-15.
Washwa, S. & Rao, K.S., 2000. Flexibility: an emerging meta-competence for managing high technology.
International Journal of Technology Management, Vol.19, No. 7/8, pp. 820-845.
Wikner, J. & Rudberg, M., 2005a. Introducing a customer order decoupling zone in logistics decision-
making. International Journal of Logistics: Research and Applications, Vol. 8, No. 3, pp. 211-224.
Wikner, J. & Rudberg, M., 2005b. Integrating production and engineering perspectives on the customer
order decoupling point. International Journal of Operations & Production Management, Vol. 25, No. 7, pp.
623-641.
Winter, G., 2000. A comparative discussion of notion of ‘validity’ in qualitative and quantitative research.
The Qualitative Report, Vol. 4, No. 3/4, pp. 7.
Womack, J. P. & Jones, D. T., 2007. Lean thinking: banish waste and create wealth in your corporation.
Action Learning: Research and Practice, Vol. 4, No. 1, pp. 105–114.
Wong, H., Wikner, J. & Naim, M., 2009. Analysis of form postponement based on optimal positioning of
the differentiation point and stocking decisions. International Journal of Production Research, Vol.
47, No.5, pp. 1201-1224.
Wood, L., 1990. The end of the product life cycle? Education says goodbye to an old friend. Journal of
Marketing Management, Vol.6, No. 2, pp. 145-155.
Yang, B. & Burns, N.D., 2003. Implications of postponement for the supply chain. International Journal
of Production Research, Vol. 41, No. 9, pp. 2075-2090.
Yang, B., Burns, N. D. & Backhouse, C. J., 2004a. Management of uncertainty through postponement.
International Journal of Production Research, Vol. 42, No. 6, pp. 1049-1064.
Yang, B., Burns, N. D. & Backhouse, C. J., 2004b. Postponement: a review and an integrated framework.
International Journal of Operations & Production Management, Vol. 24, No. 5, pp. 468-487.
Yang, B., Burns, N. D. & Backhouse, C. J., 2005. An empirical investigation into the barriers to
postponement. International Journal of Production Research, Vol. 43, No. 5, pp. 991-1005.

112
Yeung, J., Selen, W., Deming, Z. & Min, Z., 2007. Postponement strategy from a supply chain
perspective: a case from China. International Journal of Physical Distribution & Logistics Management,
Vol. 37, No. 4, pp. 331-356.
Yin, R. K., 1994. Case study research: Design and methods, Sage Publications, London.
Zinn, W. & Bowersox, D.J., 1988. Planning physical distribution with the principle of postponement.
Journal of Business Logistics, Vol. 9, No. 2, pp. 117-136.
Zipkin, P., 2001. The limits of mass customization. MIT Sloan management review, Vol. 42, No. 3, pp.
81-87.


