
The use of MSC derived hepatocyte-like cells (HLCs) in
microfluidic culture systems: an approach for studying the
metabolic syndrome
Joana Saraiva Rodrigues
Thesis to obtain the Master of Science Degree in
Biomedical Engineering
Supervisor(s): Professor Joana Paiva Gomes Miranda
and Professor Maria Margarida Fonseca Rodrigues Diogo
Examination Committee
Chairperson: Professor João Pedro Estrela Rodrigues Conde
Supervisor: Professor Joana Paiva Gomes Miranda
Member of the comittee: Professor Maria da Graça Tavares Soveral
Rodrigues
November 2016

II

III
Acknowledgements
Firstly, I would like to express my gratitude to Professor Joana Miranda for accepting me as
a master thesis student at the Chemical Biology and Toxicology (CBT) group, in iMed.ULisboa,
Faculty of Farmacy, Universidade de Lisboa, and for giving me the opportunity to work in a field
that I have always been very interested. I am also thankful for all the advices and for teaching me
a precise methodology of work in the laboratory.
I am grateful to Professor Margarida Diogo who was always very helpful throughout my
master’s degree and for showing me the variety of investigation fields in Bioengineering.
I want to show my gratitude to all the members of the CBT team. I was very lucky to be in a
pleasant work environment with the people I met in this group: Inês, Susana, Bernardo and
Catarina. I am very grateful to Madalena Cipriano, for always being available to answer my
questions, passing me her knowledge, for the suggestions to improve my work and for being
patient with me. Thank you, Sérgio Camões, for our fun moments at the laboratory, for teaching
me routine procedures and for helping me to solve my problems in the laboratory.
To the friends I made in the university, huge thanks for all the good times: Jorge, for your
wonderful sense of humour moments, with you I am always laughing; Ana, for pushing me to the
next level and for all our fun times; Catarina, for always being available either when I just want to
go outside for a break or when I want to go to a party; João, for providing me so many funny
moments just by being yourself. We also spent some bad times but we supported each other and
that made all easier. Without you, Técnico would have been impossible to overcome. To my older
friends, I am also thankful for showing interest in my studies and for cheering me up when needed.
A special thanks to Texas for being my bestfriend.
Most importantly, I need to recognize the patience of my family, specially my mother and
father. Thank you for always believing in my capacities, for giving me the opportunity to proceed
my studies and for taking good care of me (specially my mother for bringing me sweets whenever
I ask her).

IV

V
Resumo
A síndrome metabólica, ou síndrome de resistência à insulina, afeta cerca de um quarto
da população mundial. Três tipos celulares estão envolvidos no desenvolvimento desta doença,
nomeadamente, adipócitos, miofibroblastos e hepatócitos. Assim, é crucial entender o papel da
interação entre estes tipos celulares neste contexto. A utilização de dispositivos de microfluídica
apresenta diversas vantagens, incluindo a possibilidade de estudar a comunicação entre vários
tipos de células. Neste sentido, este trabalho focou-se na adaptação de células tipo-hepatócito
(HLCs), derivadas de células estaminais mesenquimais da matriz do cordão umbilical (hnMSCs),
a estes dispositivos e na avaliação do metabolismo energético destas células.
Neste trabalho, conseguimos adaptar o processo de diferenciação hepático ao
dispositivo de microfluídica e manter HLCs funcionais até duas semanas. Verificou-se ainda a
manutenção das suas atividades de biotransformação de fase I e de fase II, capacidade de
armazenamento de glicogénio, presença de marcadores hepáticos (CK-18, ALB, HNF-4α, OATP-
C e MRP-2) e produção de ureia e albumina, ao longo deste período. Além disto, as HLCs
apresentaram níveis de expressão de genes envolvidos na glicólise/lipogénese (PDK4),
gluconeogénese (PEPCK e G6PASE), metabolismo de ácidos gordos (PPARA) e de ácidos
biliares (FXR e CYP7A1) e biogénese mitocondrial (PGC-1A) com tendência semelhante à
observada a nível fisiológico, em resposta à insulina e ao glucagon.
Concluindo, foi possível adaptar e manter HLCs funcionais num dispositivo de
microfluídica, mantendo as suas características ao longo do tempo em paralelo com a
capacidade de resposta a estímulos hormonais. Deste modo, é possível futuramente utilizar
estas células em estudos de interação celular nestes dispositivos de microfluídica.
Palavras-chave: Células tipo-hepatócito; Dispositivo de microfluídica; Insulina; Glucagon;
Síndrome metabólico

VI
Abstract
The metabolic syndrome, or insulin resistance syndrome, affects approximately one
quarter of the world population. Three cell types are involved in its pathophysiology: adipocytes,
myofibroblasts and hepatocytes. Therefore, it is crucial to understand the role of cell-to-cell
interactions in the development of this disease. The use of microfluidic devices has several
advantages including the possibility to study the communication between different cell types.
Thus, this work focused on the adaptation of hepatocyte-like cells (HLCs), derived from human
umbilical cord matrix-derived mesenchymal stem cells, to a microfluidic device, and to evaluate
HLCs energy metabolism.
Herein, we were able to adapt the hepatic differentiation procedure to the microfluidic
device and to maintain functional HLCs up to two weeks. Moreover, part of the hepatic
differentiation process was successfully adapted to the microfluidic device. Maintenance of phase
I and II biotransformation activities, glycogen storage, presence of hepatic markers (CK-18, ALB,
HNF-4α, OATP-C and MRP2) and urea and albumin production were observed throughout this
period. Most importantly, HLCs expressed genes regarding glycolysis and lipogenesis (PDK4),
gluconeogenesis (PEPCK and G6PASE), fatty acid oxidation (PPARA), bile acid metabolism
(FXR and CYP7A1) and mitochondrial function and biogenesis (PGC-1A) with similar trend to that
observed in a physiologic context, in response to insulin and glucagon, and adapt their
metabolism to fasting.
To conclude, it was possible to obtain functional HLCs of human origin in a microfluidic
device that maintained its characteristics throughout culture time protocol. Moreover, the cells
were capable of responding to insulin and to glucagon and to adapt their metabolism to fasting,
setting up the roads for the possibility of using these cells to study cell-to-cell interactions in this
microfluidic device.
Keywords: Hepatocyte-like cells; Insulin; Glucagon; Microfluidic devices; Metabolic syndrome

VII
Index
Acknowledgements ...................................................................................................................... III
Resumo ......................................................................................................................................... V
Abstract ........................................................................................................................................ VI
Index ............................................................................................................................................ VII
List of Figures ............................................................................................................................... IX
List of Abbreviations ................................................................................................................... XIII
I. Introduction .......................................................................................................................... 1
I. 1. Liver Function and Structure .............................................................................................. 1
I. 1. 1. Biotransformation ....................................................................................................... 2
I. 1. 2. Metabolic Homeostasis .............................................................................................. 3
I. 2. Metabolic Syndrome ......................................................................................................... 10
I. 3. Stem Cells ........................................................................................................................ 11
I. 4. Mesenchymal Stem Cells (MSCs) ................................................................................... 11
I. 5. Deriving human hepatocyte-like cells (HLCs) from stem cells by mimicking liver
embryogenesis ........................................................................................................................ 12
I. 6. Microfluidic Devices .......................................................................................................... 14
I. 7. Motivation and Aims ......................................................................................................... 16
II. Materials and Methods ...................................................................................................... 18
II. 1. Reagents ......................................................................................................................... 18
II. 2. Cell Culture ...................................................................................................................... 18
II. 3. Collagen Coating ............................................................................................................. 18
II. 5. Hepatocyte Differentiation Protocol ................................................................................. 19
II. 6. HLCs Response to Insulin/Glucagon Stimuli .................................................................. 20
II. 7. Microfluidic Device Set-up ............................................................................................... 21
II. 7. 1. Set-up ...................................................................................................................... 21
II. 7. 2. HLCs inoculation ..................................................................................................... 22
II. 8. Quantitative Real-Time Polymerase Chain Reaction (qRT-PCR)................................... 22
II. 9. Histology .......................................................................................................................... 22
II. 9. 1. Periodic Acid Schiff’s (PAS) Staining ...................................................................... 22
II. 9. 2. Immunocytochemistry ............................................................................................. 23
II. 10. Urea and Albumin Quantification .................................................................................. 23
II. 11. Biotransformation Activity .............................................................................................. 23
II. 12. Protein Quantification .................................................................................................... 24
II. 13. Statistical Analysis ......................................................................................................... 24
III. Results and Discussion .................................................................................................... 25
III. 1. HLCs could be adapted to commercial rat-tail type I collagen coated surfaces ............ 25

VIII
III. 2. Different dexamethasone and insulin concentrations do not affect HLCs’
biotransformation capacity ...................................................................................................... 26
III. 3. Different dexamethasone and insulin concentrations induce altered gene expression
profiles in HLCs ....................................................................................................................... 30
III. 4. HLCs adapt their response to fasting ............................................................................. 33
III. 5. HLCs respond to insulin and glucagon exposure .......................................................... 38
III. 6. HLCs can be maintained up to two weeks in the microfluidic device ............................ 45
IV. Conclusions and Future Perspectives ............................................................................ 53
V. References ............................................................................................................................. 55
VI. Annexes ................................................................................................................................ 63
VI. 1. Primers List .................................................................................................................... 63

IX
List of Figures
Figure 1 - Cell microenvironment in the liver. Hepatocytes can be in contact with sinusoids, uptaking or
secreting substances into the blood, or other hepatocytes through tight junctions, defining bile canaliculi (from Bettinger C, Borenstein JT, Tao SL, 2013) 1.
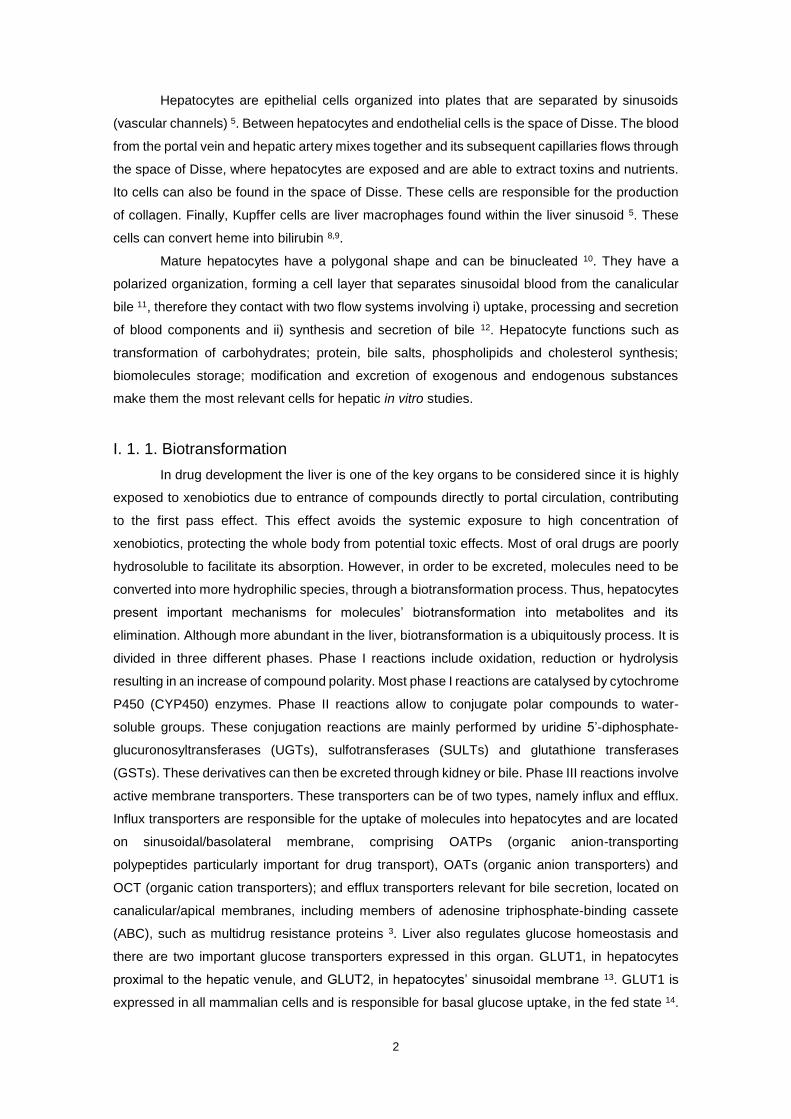
Figure 2 - Overview of the fed/fasted states: the effect in hepatocytes metabolism. The fed state is
characterized by insulin release from the pancreatic β cells and glucose uptake. Insulin induces anabolic reactions such as glycogenesis, protein synthesis and fatty acid synthesis. It also induces glycolysis for basal energy expenditures. In the opposite state, the fasted state, glucagon is released by pancreatic α cells and catabolic reactions are induced: glycogenolysis, gluconeogenesis and β oxidation, in order to produce energy. Bile acids are synthesized because a lower amount reaches the liver, through the portal vein, in the fasted state.
Figure 3 - Glucose Metabolism Pathways. Gluconeogenic pathways are marked in blue, and the pentose
phosphate pathway is marked in orange. Insulin inhibits G6Pase, PEPCK and PDKs. Abbreviations: GCK (glucokinase); G6Pase (glucose-6-phosphatase); G6P (glucose 6-phosphate); G1P (glucose 1-phosphate); GP (glycogen phosphorylase); GS (glycogen synthase); PFK (6- phosphofructo-1 kinase); FBPase (fructose 1,6 bisphosphatase); F-1,6-P (fructose 1,6-biphosphatase); GAP (glyceraldehyde 3-phosphate); DHAP (dihydroxyacetone phosphate); L-PK (liver pyruvate kinase); PC (pyruvate carboxylase); PDC (pyruvate dehydrogenase complex); PDKs (pyruvate dehydrogenase kinases); (adapted from L. Rui 2014) 2.
Figure 4 - Lipogenic Pathway. Insulin stimulates the synthesis of TAG and fatty acids.
Abbreviations: GCK (glucokinase); G6P (glucose 6-phosphate); F6P (fructose-6-phosphate); L-PK (liver pyruvate kinase); PC (pyruvate carboxylase); PDC (mitochondrial pyruvate dehydrogenase complex); NADPH (nicotinamide adenine dinucleotide phosphate); ACL (ATP-citrate lyase); ACC (acetyl-CoA carboxylase); FAS (fatty acid synthase); Elovls (fatty acyl-CoA elongases); LCFAs (long-chain fatty acids); SCDs (stearoyl-CoA desaturases); TAG (triacylglycerol); (from L. Rui, 2014) 2.
Figure 5 – Mitochondrial and peroxisomal β oxidation pathways. Fatty acid oxidation is induced in the
fasted state. The end products are acyl-CoA and acetyl-CoA. Abbreviations: ATP (adenosine triphosphate); AMP (adenosine monophosphate); PPi (inorganic pyrophosphate); FAD (flavin adenine dinucleotide); FADH2 (FAD reduced form); NAD+ (nicotinamide adenine dinucleotide; NADH (reduced form of nicotinamide adenine dinucleotide); SCPX (sterol carrier protein x); (from Reddy et al, 2001) 35.
Figure 6 - Roles of FXR and CYP7A1 during fasting and refeeding. In the postprandial state, bile acids
are released from gallbladder into the gut to facilitate lipid absorption. Carbohydrates, such as glucose, and bile acids are reabsorbed and reach hepatocytes, through the portal vein. When bile acids enter hepatocytes, FXR is activated to inhibit their synthesis by repressing CYP7A. Abbreviations: FXR (farnesoid X receptor); BAs (bile acids); SHP (small heterodimer partner); CYP7A (cholesterol 7α-hydroxylase); Ac-CoA (acetyl-CoA); FFAs (free fatty acids); VLDL (very low density proteins); LPK (L-pyruvate kinase); SREBP (sterol regulatory element-binding protein); ACC (acetyl-CoA carboxylase); FAS (fatty acid synthase); FGF (fibroblast growth factor); (from Lefebvre et al, 2009) 42.
Figure 7 - Hepatocyte Differentiation Protocol. This protocol consists in three steps: endoderm
commitment/foregut induction, hepatoblast and liver bud formation and hepatoblast differentiation/hepatocyte maturation. Abbreviations: BM (basal medium); FBS (fetal bovine serum); EGF (epidermal growth factor); FGF (fibroblast
growth factor); HGF (hepatocyte growth factor); ITS (insulin-transferrin-selenium); DMSO (dimethyl
sulfoxide); OSM (oncostatin M); BSA (bovine serum albumin); D0 – D34 (day 0-34 of the differentiation
protocol).
Figure 8 - Insulin and glucagon stimuli protocol. In the insulin stimuli, a 2-hour exposure to SM was
performed followed by an 8h-incubation with 80 nM of insulin in SM. Negative control was performed in parallel in which cells were maintained in SM. In the glucagon stimuli, an 8-hour exposure to 100 nM of glucagon in SM was performed. Negative control was performed in parallel in which cells were maintained in SM. Abbreviations: SM (starvation medium).
Figure 9 - Microfluidic Device Diagram (from Xona Microfluidics) 109. This microfluidic device is
composed of two channels, allowing the communication between two wells, each. Microgrooves connect the two channels.
Figure 10 - HLCs' morphology in 2D static culture: a) HLCs in MM at D27; b) HLCs in DM at D27; c) HLCs in MM at D34; d) HLCs in DM at D34. White arrows indicate binucleated cell and black arrows indicate lipid droplets. Scale bar = 100 µm.

X
Figure 11 - PAS staining of HLCs at D27 and D34, maintained in MM and DM revealed glycogen storage ability throughout culture time. The controls used were hnMSCs, rpHep and HLCs cultured in
DM at D34 incubated with amylase. rpHep was used as a positive control. Scale bar = 100 µm. Abbreviations: hnMSCs (undifferentiated human neonatal mesenchymal stem cells); rpHep (rat primary
hepatocytes); MM (maintenance medium); DM (differentiation medium); D27, D34 (day 27, day 34 of the
differentiation protocol)
Figure 12 - Immunocytochemical staining revealed the presence of specific hepatic markers: HNF-4α, ALB, OATP-C, MRP2 and CK-18 in HLCs maintained in both media, at D27 and D34. Cell nuclei
were counterstained with DAPI. Scale bar = 50 µm. Abbreviations: MM (maintenance medium); DM (differentiation medium); D27, D34 (day 27, day 34 of the
differentiation protocol); HNF-4α (hepatocyte nuclear factor-4α); ALB (albumin); OATP-C (organic anion-
transporting polypeptide-C); MRP2 (multidrug resistance protein 2); CK-18 (cytokeratin-18).
Figure 13 - Effect of culture time and medium composition on Phase I and II activities: a) EROD, b) ECOD and c) UGT activities. Data is represented as Average ± SEM (n=2-4). Undifferentiated hnMSCs
and HepG2 cell line, rpHeps and cryopreserved hpHep are negative and positive controls, respectively (white bars). *, **, *** Significantly differs among the controls with p < 0.05, p < 0.01 and p < 0.001, respectively. Abbreviations: rpHep (rat primary hepatocytes); hpHep (human primary hepatocytes); hnMSC (undifferentiated human neonatal mesenchymal stem cells); MM (maintenance medium); DM (differentiation medium); D27, D34 (day 27, day 34 of the differentiation protocol); EROD (7-ethoxyresorufin-O-deethylase); ECOD (7-ethoxycoumarin-O-deethylase); UGTs (uridine 5’-diphosphate glucuronosyltransferases).
Figure 14 - Genes used for energy metabolism study divided by metabolic pathways: glycolysis and lipogenesis, gluconeogenesis, fatty acid metabolism, bile acid metabolism and mitochondrial biogenesis and function. Abbreviations: PDK4 (pyruvate dehydrogenase kinase 4); SREBP-1C (Sterol regulatory element-binding protein 1-c); CHREBP (Carbohydrate response element binding protein); GLUT1 (glucose transporter 1); PEPCK (phosphoenolpyruvate carboxylase); G6PASE (glucose-6-phosphatase); PPARA (peroxisome proliferator-activated receptor α); CPT1A (carnitine palmitoyltransferase 1 α); ACOX1 (acyl-CoA oxidase 1); FXR (farnesoid X receptor); CYP7A1 (cytochrome P450 enzyme cholesterol 7α-hydroxylase); PGC-1A (peroxisome proliferator γ-activated receptor coactivator 1-α); PGC-1B (Peroxisome proliferator γ-activated receptor coactivator 1-β); ERRA (Estrogen-related receptor α); NRF1 (nuclear respiratory factor 1); CYTC (cytochrome C).
Figure 15 – Gene expression in HLCs throughout culture time in MM and DM regarding a) glycolysis and lipogenesis; b) gluconeogenesis; c) fatty acid metabolism; d) bile acid metabolism and e) mitochondrial biogenesis and function. The graphs represent HLCs’ evolution in MM and DM relative to
8h-fasting at D34. Data is represented as Average ± SEM (n=2-6). *, **, *** Significantly differs from the different media composition and the days of differentiation with p < 0.05, p < 0.01 and p < 0.001, respectively. Abbreviations: D27 (day 27 of the differentiation protocol); D34 (day 34 of the differentiation protocol), MM (maintenance medium), DM (differentiation medium); PDK4 (pyruvate dehydrogenase kinase 4); GLUT1/SLC2A1 (glucose transporter 1/solute carrier family 2 member 1); PEPCK (phosphoenolpyruvate carboxylase); G6PASE (glucose-6-phosphatase); PPARA (peroxisome proliferator-activated receptor α); CPT1A (carnitine palmitoyltransferase 1 α); ACOX1 (acyl-CoA oxidase 1); FXR (farnesoid X receptor); CYP7A1 (cytochrome P450 enzyme cholesterol 7α-hydroxylase); PGC-1A (peroxisome proliferator γ-activated receptor coactivator 1-α); PGC-1B (peroxisome proliferator γ-activated receptor coactivator 1-β); ERRA (estrogen-related receptor α); NRF1 (nuclear respiratory factor 1); CYTC (cytochrome C).
Figure 16 – HLCs’ adaptive response to fasting at D34. Gene expression of specific genes of a) glycolysis and lipogenesis, b) gluconeogenesis, c) fatty acid metabolism, d) bile acid metabolism and e) mitochondrial biogenesis and function. The graphs represent the fold induction of HLCs in
response to 8h- and 10-fasting relative to MM. Grid lines represent fold induction equal to 0.8 and 1.2. Data is represented as Average ± SEM (n=2-6). *, **, *** Significantly differs from the different media composition and the days of differentiation with p < 0.05, p < 0.01 and p < 0.001, respectively. #, ##, ### Significantly induced or repressed expression with p < 0.05, p < 0.01 and p < 0.001, respectively. Abbreviations: PDK4 (pyruvate dehydrogenase kinase 4); SREBP-1C (sterol regulatory element-binding protein 1-c); CHREBP1 (carbohydrate response element binding protein); GLUT1/SLC2A1 (glucose transporter 1/solute carrier family 2 member 1); PEPCK (phosphoenolpyruvate carboxylase); G6PASE (glucose-6-phosphatase); PPARA (peroxisome proliferator-activated receptor α); CPT1A (carnitine palmitoyltransferase 1 α); ACOX1 (acyl-CoA oxidase 1); FXR (farnesoid X receptor); CYP7A1 (cytochrome P450 enzyme cholesterol 7α-hydroxylase); PGC-1A (peroxisome proliferator γ-activated receptor coactivator 1-α); PGC-1B (Peroxisome proliferator γ-activated receptor coactivator 1-β); ERRA (estrogen-related receptor α); NRF1 (nuclear respiratory factor 1); CYTC (cytochrome C).
Figure 17 – Gene expression in HLCs in response to insulin and glucagon regarding a) glycolysis and lipogenesis and b) gluconeogenesis. Grid lines represent fold induction equal to 0.8 and 1.2. Data is

XI
represented as Average ± SEM (n=2-6). *, **, *** Significantly differs from the different media composition and the days of differentiation with p < 0.05, p < 0.01 and p < 0.001, respectively. #, ##, ### Significantly induced or repressed expression with p < 0.05, p < 0.01 and p < 0.001, respectively. Abbreviations: HLCs (hepatocyte-like cells); hpHep (human cryopreserved hepatocytes); PDK4 (pyruvate dehydrogenase kinase 4); SREBP-1C (sterol regulatory element-binding protein 1-c); CHREBP1 (carbohydrate response element binding protein); GLUT1/SLC2A1 (glucose transporter 1/solute carrier family 2 member 1); GLUT2/SLC2A2 (glucose transporter 2/solute carrier family 2 member 2); PEPCK (phosphoenolpyruvate carboxylase); G6PASE (glucose-6-phosphatase).
Figure 18 – Gene expression in HLCs in response to insulin and glucagon regarding a) fatty acid metabolism, b) bile acid metabolism and c) mitochondrial biogenesis and function. Grid lines
represent fold induction equal to 0.8 and 1.2. *, **, *** Significantly differs from the different media composition and the days of differentiation with p < 0.05, p < 0.01 and p < 0.001, respectively. #, ##, ### Significantly induced or repressed expression with p < 0.05, p < 0.01 and p < 0.001, respectively. Abbreviations: HLCs (hepatocyte-like cells); hHeps (human cryopreserved hepatocytes), PPARA (peroxisome proliferator-activated receptor α); CPT1A (carnitine palmitoyltransferase 1 α); ACOX1 (acyl-CoA oxidase 1); FXR (farnesoid X receptor); CYP7A1 (cytochrome P450 enzyme cholesterol 7α-hydroxylase); PGC-1A (peroxisome proliferator γ-activated receptor coactivator 1-α); PGC-1B (peroxisome proliferator γ-activated receptor coactivator 1-β); ERRA (estrogen-related receptor α); NRF1 (nuclear respiratory factor 1); CYTC (cytochrome C).
Figure 19 – HLCs morphology at D17 and the change from a fibroblast-like shape to a polygonal shape throughout the day of inoculation, in the microfluidic device: a) HLCs before trypsinization (scale bar = 500 µm); b) HLCs 20 minutes after device inoculation (scale bar = 500 µm); c) HLCs 1 hour after device inoculation (scale bar = 500 µm); d) HLCs 2 hours after device inoculation (scale bar = 100 µm).
Figure 20 - HLCs' morphology throughout culture time in the MD: a) HLCs at D27 in MM (scale bar = 500 µm); b) HLCs at D27 in DM (scale bar = 100 µm); c) HLCs at D34 in MM (scale bar = 100 µm); d) HLCs at D34 in DM (scale bar = 100 µm).
Figure 21 - Effect of culture time on a) urea and b) albumin production HLCs cultured in MM and DM at D27 and D34. Data is represented as Average ± SEM (n=4-5). Undifferentiated hnMSCs and HepG2 cell
line, rpHeps and hpHeps are negative and positive controls, respectively (white bars). *, **, *** Significantly differs among the controls with p < 0.05, p < 0.01 and p < 0.001, respectively. Abbreviations: rpHep (rat primary hepatocytes), hpHep (human primary hepatocytes) and hnMSC (undifferentiated human neonatal mesenchymal stem cells), MM (maintenance medium), DM (differentiation medium); D27 (day 27 of the differentiation protocol); D34 (day 34 of the differentiation protocol).
Figure 22 - Evolution in gene expression of HLCs in the microfluidic device and in plates throughout culture time, in a) MM and b) DM. The graphs represent the fold induction regarding gene expression of
HLCs in MM and DM at D34 relative to D27. Grid lines represent fold induction equal to 0.8 and 1.2. Data is represented as Average ± SEM (n=2-4). *, **, *** Significantly differs from the different media composition and the days of differentiation with p < 0.05, p < 0.01 and p < 0.001, respectively. #, ##, ### Significantly induced or repressed expression with p < 0.05, p < 0.01 and p < 0.001, respectively. Abbreviations: MD (microfluidic device); MM (maintenance medium); DM (differentiation medium); PDK4 (pyruvate dehydrogenase kinase 4); PEPCK (phosphoenolpyruvate carboxylase); G6PASE (glucose-6-phosphatase); PPARA (peroxisome proliferator-activated receptor α); CPT1A (carnitine palmitoyltransferase 1 α); ACOX1 (acyl-CoA oxidase 1); FXR (farnesoid X receptor); CYP7A1 (cytochrome P450 enzyme cholesterol 7α-hydroxylase); PGC-1A (peroxisome proliferator γ-activated receptor coactivator 1-α).
Figure 23 - Comparison of microfluidic devices relative to plates in a) MM and b) DM, in both days.
The graphs represent the fold induction of HLCs cultured in MD relative to plates. Grid lines represent fold induction equal to 0.8 and 1.2. Data is represented as Average ± SEM (n=2-4). *, **, *** Significantly differs from the different media composition and the days of differentiation with p < 0.05, p < 0.01 and p < 0.001, respectively. #, ##, ### Significantly induced or repressed expression with p < 0.05, p < 0.01 and p < 0.001, respectively. Abbreviations: MD (microfluidic device); MM (maintenance medium); DM (differentiation medium); PDK4 (pyruvate dehydrogenase kinase 4); PEPCK (phosphoenolpyruvate carboxylase); G6PASE (glucose-6-phosphatase); PPARA (peroxisome proliferator-activated receptor α); CPT1A (carnitine palmitoyltransferase 1 α); ACOX1 (acyl-CoA oxidase 1); FXR (farnesoid X receptor); CYP7A1 (cytochrome P450 enzyme cholesterol 7α-hydroxylase); PGC-1A (peroxisome proliferator γ-activated receptor coactivator 1-α).
Figure 24 - Gene expression levels in HLCs cultured in the microfluidic device or in 2D static cultures in a) D27 and b) D34. Fold induction of gene expression in HLCs cultured in MM relative to HLCs cultured
in DM. Grid lines represent fold induction equal to 0.8 and 1.2. Data is represented as Average ± SEM (n=2-4). *, **, *** Significantly differs from the different media composition and the days of differentiation with p < 0.05, p < 0.01 and p < 0.001, respectively. #, ##, ### Significantly induced or repressed expression with p < 0.05, p < 0.01 and p < 0.001, respectively.

XII
Abbreviations: MD (microfluidic device); MM (maintenance medium); DM (differentiation medium); PDK4 (pyruvate dehydrogenase kinase 4); PEPCK (phosphoenolpyruvate carboxylase); G6PASE (glucose-6-phosphatase); PPARA (peroxisome proliferator-activated receptor α); CPT1A (carnitine palmitoyltransferase 1 α); ACOX1 (acyl-CoA oxidase 1); FXR (farnesoid X receptor); CYP7A1 (cytochrome P450 enzyme cholesterol 7α-hydroxylase); PGC-1A (peroxisome proliferator γ-activated receptor coactivator 1-α).

XIII
List of Abbreviations
2D Two-dimensional cell culture
4-MU 4-methylumbeliferone
5-AZA 5-azacytidine
α-MEM Minimum essential medium Eagle with alfa modification
ABC Adenosine triphosphate-binding cassete
ACC Acetyl-CoA carboxylase
ACOX1 Acyl-CoA oxidase 1
ADME Absorption, distribution, metabolism and excretion
ADP Adenosine diphosphate
AFP α-fetoprotein
Akt Protein kinase B
ALB Albumin
AMP Adenosine monophosphate
ATP Adenosine triphosphate
BA Bile acids
BM Basal medium
bmMSC Bone marrow mesenchymal stem cells
BMP Bone morphogenic protein
BSA Bovine serum albumin
BSEP Bile salt export pump
cAMP Cyclic adenosine monophosphate
CAR Constitutive activated receptor
CD Cluster of differentiation
cDNA Complementary deoxyribonucleic acid
ChREBP Carbohydrate response element binding protein
CoA Coenzyme A
CPT1 Carnitine palmitoyltransferase 1
CREB cAMP response element-binding protein
CK Cytokeratin
CYP450 Cytochrome P450 superfamily
CYP7A Cytochrome P450 enzyme cholesterol 7α-hydroxylase
CytC Cytochrome C
DAPI 4',6-diamidino-2-phenylindole
DM Differentiation medium
DMSO Dimethyl sulfoxide
ECOD 7-ethoxycoumarin-O-deethylase
EGF Epidermal growth factor
EROD 7-ethoxyresorufin-O-deethylase
ERR Estrogen-related receptors

XIV
F6P Fructose-6-phosphate
FA Fatty acid
FAD Flavin adenine dinucleotide
FADH2 Flavin adenine dinucleotide (reduced form)
FBS Fetal bovine serum
FGF Fibroblast growth factor
Foxa Forkhead box
FXR Farnesoid X receptor
G6P Glucose-6-phosphate
G6Pase Glucose-6-phosphatase
GATA GATA binding factor
GCK Glucokinase
GLUT Glucose transporter
GSTs Glutathione transferases
HBSS Hank’s balanced salt solution
HepaRG Human hepatoma cell line
HepG2 Human hepatoma cell line
HGF Hepatocyte growth factor
Hhex Hematopoietically-expressed homeobox protein
HLA-DR Human leukocyte antigen - antigen D related
HLC Hepatocyte-like cells
HNF-4α Hepatocyte nuclear factor 4α
hnMSCs Human umbilical cord matrix mesenchymal stem cells-derived
hnMSCs-HLCs Hepatocyte-like cells derived from hnMSCs
IMDM Iscove's modified Dulbecco's medium
iPSCs Induced pluripotent stem cells
ITS Insulin-transferrin-selenium
Klf Krüppel-like family of transcription factors
LCFA Long-chain fatty acids
L-PK Liver pyruvate kinase
MD Microfluidic device
MM Maintenance medium
MSCs Mesenchymal stem cells
NAD+ Nicotinamide adenine dinucleotide
NADH Nicotinamide adenine dinucleotide (reduced form)
NADPH Nicotinamide adenine dinucleotide phosphate (reduced form)
NEAA Non-essential amino acids
NRF Nuclear respiratory factor
OATPs Organic anion-transporting polypeptides
OATs Organic anion transporters

XV
OCT Organic cation transporters
Oct Octamer transcription factor
OSM Oncostatin M
PAS Periodic acid Schiff
PBS Phosphate buffered saline
PDC Pyruvate dehydrogenase complex
PDK Pyruvate dehydrogenase kinase
PKA Protein kinase A
PEPCK Phosphoenolpyruvate carboxylase
PFA Paraformaldehyde
PFK-2/FBP-2 6-phosphofructo-2-kinase/fructose-2,6-bisphosphatase
PGC-1α -1β Peroxisome proliferator γ-activated receptor coactivator 1-α 1-β
PPARα Peroxisome proliferator-activated receptor α
P/S/A Penincilin/streptomicin/ amphotericin B
PXR Pregnane X receptor
qRT-PCR Quantitative real-time polymerase chain reaction
rpHep/hpHep Rat primary hepatocytes/human primary hepatocytes
RT Room temperature
SCD Stearoyl-CoA desaturases
SEM Standard error of the mean
SHP Small heterodimer partner
SLCA2 Solute carrier family 2
SM Starvation medium
SOX Sex determining region Y (Sry)-related high mobility group (HMG)-box
SREBP Sterol regulatory element-binding protein
STM Septum transversum mesenchyme
SULTs Sulfotransferases
TAG Triacylglycerol
TCA Tricarboxylic acid
UCP Uncoupling protein
UGTs Uridine 5’-diphosphate glucuronosyltransferases
VLDL Very low density lipoproteins

1
I. Introduction
I. 1. Liver Function and Structure
Liver is an important organ that regulates the metabolism of the whole body and
homeostasis. It is located under the lower ribs, in the right-hand side and weights between 1.2
and 1.6 kg 1. Upon food digestion in the gastrointestinal tract, glucose, amino acids and fatty acids
are absorbed into the bloodstream and through the portal vein circulation system, before reaching
the liver 2. The hepatic artery provides nutrients and oxygen while the portal vein carries
substances absorbed by the small intestines. Liver functions include the uptake of nutrients and
storage of important molecules, such as glycogen and glucose. The liver is also involved in
processes of biotransformation and excretion, through bile secretion, granting its protection role
against exogenous and potentially toxic substances 3. It synthesizes urea as a mean of ammonia
detoxification 4 and protein synthesis, such as albumin and coagulant proteins.
The human liver is arranged in 4 lobules composed of 60 % of hepatocytes (parenchymal
cells), which represent approximately 80 % of the total liver mass 5. The non-parenchymal cells
(40 %) consist of sinusoidal endothelial cells (form the lining of the blood vessels), a population
of macrophages termed Kupffer cells, Ito or stellate cells (fat storing cells), biliary epithelial cells
and immune cells, such as lymphocytes and leukocytes 6. The hepatic acinus is the liver structure
of 1-2 mm in length 7, defined as the population of hepatocytes supplied by one portal triad, i.e.,
a microcirculatory functional unit influenced by the flow of blood from the microcirculation (Figure
1) to the central vein 7.
Figure 1 - Cell microenvironment in the liver. Hepatocytes can be in contact with sinusoids, uptaking or
secreting substances into the blood, or other hepatocytes through tight junctions, defining bile canaliculi (from Bettinger C, Borenstein JT, Tao SL, 2013) 7.
2
Hepatocytes are epithelial cells organized into plates that are separated by sinusoids
(vascular channels) 5. Between hepatocytes and endothelial cells is the space of Disse. The blood
from the portal vein and hepatic artery mixes together and its subsequent capillaries flows through
the space of Disse, where hepatocytes are exposed and are able to extract toxins and nutrients.
Ito cells can also be found in the space of Disse. These cells are responsible for the production
of collagen. Finally, Kupffer cells are liver macrophages found within the liver sinusoid 5. These
cells can convert heme into bilirubin 8,9.
Mature hepatocytes have a polygonal shape and can be binucleated 10. They have a
polarized organization, forming a cell layer that separates sinusoidal blood from the canalicular
bile 11, therefore they contact with two flow systems involving i) uptake, processing and secretion
of blood components and ii) synthesis and secretion of bile 12. Hepatocyte functions such as
transformation of carbohydrates; protein, bile salts, phospholipids and cholesterol synthesis;
biomolecules storage; modification and excretion of exogenous and endogenous substances
make them the most relevant cells for hepatic in vitro studies.
I. 1. 1. Biotransformation
In drug development the liver is one of the key organs to be considered since it is highly
exposed to xenobiotics due to entrance of compounds directly to portal circulation, contributing
to the first pass effect. This effect avoids the systemic exposure to high concentration of
xenobiotics, protecting the whole body from potential toxic effects. Most of oral drugs are poorly
hydrosoluble to facilitate its absorption. However, in order to be excreted, molecules need to be
converted into more hydrophilic species, through a biotransformation process. Thus, hepatocytes
present important mechanisms for molecules’ biotransformation into metabolites and its
elimination. Although more abundant in the liver, biotransformation is a ubiquitously process. It is
divided in three different phases. Phase I reactions include oxidation, reduction or hydrolysis
resulting in an increase of compound polarity. Most phase I reactions are catalysed by cytochrome
P450 (CYP450) enzymes. Phase II reactions allow to conjugate polar compounds to water-
soluble groups. These conjugation reactions are mainly performed by uridine 5’-diphosphate-
glucuronosyltransferases (UGTs), sulfotransferases (SULTs) and glutathione transferases
(GSTs). These derivatives can then be excreted through kidney or bile. Phase III reactions involve
active membrane transporters. These transporters can be of two types, namely influx and efflux.
Influx transporters are responsible for the uptake of molecules into hepatocytes and are located
on sinusoidal/basolateral membrane, comprising OATPs (organic anion-transporting
polypeptides particularly important for drug transport), OATs (organic anion transporters) and
OCT (organic cation transporters); and efflux transporters relevant for bile secretion, located on
canalicular/apical membranes, including members of adenosine triphosphate-binding cassete
(ABC), such as multidrug resistance proteins 3. Liver also regulates glucose homeostasis and
there are two important glucose transporters expressed in this organ. GLUT1, in hepatocytes
proximal to the hepatic venule, and GLUT2, in hepatocytes’ sinusoidal membrane 13. GLUT1 is
expressed in all mammalian cells and is responsible for basal glucose uptake, in the fed state 14.
3
GLUT2 has a higher KM and is expressed in hepatocytes, promoting glucose efflux, following
gluconeogenesis, in fasted state 13, 14. Hepatocyte-specific deletion of GLUT2 blocks glucose
uptake but does not affect glucose release in the fed state, suggesting that it can be released
through other transporters, such as GLUT1 2.
Thus, a hepatic in vitro model which is competent regarding biotransformation allows to
assess therapeutic and toxic profile of a drug candidate.
I. 1. 2. Metabolic Homeostasis
There are several gene pathways regulating the metabolic homeostasis of our body,
which are activated or inhibited according to the levels of glucose in the blood that, in a physiologic
context, are kept between 4 and 7 mM 15. Glucose control is crucial since it is the “fuel” for all
organs, especially the brain where prolonged hypoglycaemia can cause acute brain damage. On
the other hand, hyperglycaemia is a serious consequence of diabetes and the hyperosmolar
hyperglycaemic state can be fatal due to electrolyte imbalance and dehydration 15.
Within the human body, glucose concentration is regulated mainly by two pancreatic
hormones, insulin and glucagon, with antagonist effects. Insulin is secreted by pancreatic β cells.
It is stored in secretory vesicles and is released, according to the intracellular adenosine
triphosphate/ adenosine diphosphate (ATP/ADP) ratio that is related to the glucose availability in
pancreatic β cells, particularly elevated after feeding. On the other hand, when glucose levels are
low, glucagon, which is processed in pancreatic α-cells, and glucocorticoids are released.
Glucose is both a substrate and an end product for cells. Therefore, two opposite states need to
be considered: high glucose (fed state) and low glucose (fasting or starvation) 15 (Figure 2).
Figure 2 - Overview of the fed/fasted states: the effect in hepatocytes metabolism. The fed state is
characterized by insulin release from the pancreatic β cells and glucose uptake. Insulin induces anabolic reactions such as glycogenesis, protein synthesis and fatty acid synthesis. It also induces glycolysis for basal energy expenditures. In the opposite state, the fasted state, glucagon is released by pancreatic α cells and catabolic reactions are induced: glycogenolysis, gluconeogenesis and β oxidation, in order to produce energy. Bile acids are synthesized because a lower amount reaches the liver, through the portal vein, in the fasted state.
In the fed state, nutrients absorbed into the bloodstream (glucose, fatty acids and amino
acids) reach the liver through the portal vein. Glucose is converted into pyruvate, through

4
glycolysis, in the cytoplasm, being oxidized, through the tricarboxylic acid (TCA) cycle and
oxidative phosphorylation in the mitochondria, to produce ATP. If energy is not needed, glucose
is stored as glycogen or converted into fatty acids and amino acids in the liver. Hepatocytes
generate triacylglycerol (TAG) through free fatty acid esterification. TAG is then stored in lipid
droplets or secreted as very low density lipoproteins (VLDL), into circulation. Amino acids are
used to synthesize proteins, glucose or other biomolecules 2. These functions are controlled by
insulin, which stimulates the uptake of glucose by peripheral tissues, causing a quick removal of
glucose from blood. It induces energy storage and anabolic reactions, namely glycogen synthesis
(glycogenesis) in liver and muscle, and fatty acid synthesis in liver and adipose tissue, in the fed
state 15. Insulin also stimulates glycolysis and in the liver, insulin blocks glycogenolysis
(hydrolization of glycogen to generate glucose) and gluconeogenesis 16.
In the fasted state, fuel substrates are released into the circulation, from the liver, to be
metabolized, in peripheral tissues, according to the body’s needs. Glucagon release provokes a
rise in intracellular cyclic adenosine monophosphate (cAMP), in the liver. Liver provides glucose
when nutrients are scarce and the alteration of cAMP levels is the main mechanism by which liver
releases glucose in the blood, through the induction of gluconeogenesis and glycogenolysis 17. β
oxidation of fatty acids is unable to produce gluconeogenic substrates. However, it produces ATP,
which is necessary for gluconeogenesis. Protein degradation occurs during prolonged starvation,
releasing amino acids, which can serve as gluconeogenic substrates 2.
I. 1. 2. 1. Glucose Metabolism - Glycolysis and Gluconeogenesis
Liver selects metabolic fuels (glucose or fatty acids) according to nutrient availability and
hormonal signalling.
Glucose enters hepatocytes, via GLUT2 and is phosphorylated by glucokinase (GCK),
generating glucose-6-phosphate (G6P). G6P can be used as a precursor for glycogen synthesis,
can be metabolized to pyruvate through glycolysis and then enter the TCA cycle to be completely
oxidized to generate ATP or it can generate nicotinamide adenine dinucleotide phosphate
(NADPH) via the pentose phosphate pathway, required for lipogenesis and biosynthesis of other
molecules. In the fasted state, G6P in the endoplasmic reticulum is dephosphorylated by glucose
6-phosphatase (G6Pase), releasing glucose 2.
Glycolysis is mainly controlled by the kinases GCK, 6-phosphofruto-1 kinase (PFK), liver
pyruvate kinase (L-PK) and pyruvate dehydrogenase kinases (PDKs) (Figure 3). These enzymes
present low levels of activity in the fasted state, increasing in the postprandial state. Insulin and
carbohydrates, in the fed state, stimulate the kinase activity of 6-phosphofructo-2-kinase/fructose-
2,6-bisphosphatase (PFK-2/FBP-2), inducing the glycolytic pathway 2. However, insulin
suppresses PDK4, which is a negative regulator of the mitochondrial pyruvate dehydrogenase
complex (PDC), by phosphorylation, thus increasing pyruvate consumption and glycolysis 18. In
fact, fasted PDK4 knockout mice present hypoglycaemia, since PDC activity is increased and
pyruvate enters TCA cycle for complete oxidation, thus not being available as a gluconeogenic
substrate 19.

5
Figure 3 - Glucose Metabolism Pathways. Gluconeogenic pathways are marked in blue, and the pentose
phosphate pathway is marked in orange. Insulin inhibits G6Pase, PEPCK and PDKs. Abbreviations: GCK (glucokinase); G6Pase (glucose-6-phosphatase); G6P (glucose 6-phosphate); G1P (glucose 1-phosphate); GP (glycogen phosphorylase); GS (glycogen synthase); PFK (6- phosphofructo-1 kinase); FBPase (fructose 1,6 bisphosphatase); F-1,6-P (fructose 1,6-biphosphatase); GAP (glyceraldehyde 3-phosphate); DHAP (dihydroxyacetone phosphate); L-PK (liver pyruvate kinase); PC (pyruvate carboxylase); PDC (pyruvate dehydrogenase complex); PDKs (pyruvate dehydrogenase kinases); (adapted from L. Rui 2014) 2.
In short periods of fasting, liver uses glycogenolysis to produce and release glucose. In
contrast, during longer periods, after glycogen being depleted, hepatocytes synthesize glucose
through gluconeogenesis, using lactate, pyruvate, glycerol and amino acids. Prolonged periods
of fasting increase cAMP levels in liver 20. cAMP response element-binding protein (CREB), a
gluconeogenic transcription factor, is activated by protein kinase A (PKA)-mediated
phosphorylation, inducing the expression of G6PASE, cytoplasmic phosphoenolpyruvate
carboxylase (PEPCK) and peroxisome proliferator γ-activated receptor coactivator 1-α (PGC-1Α)
2. Herein, hepatocytes use other sources for gluconeogenesis, e.g. lactate, which can be
generated in the liver or delivered from extrahepatic tissues through circulation. Lactate is
oxidized to generate pyruvate by lactate dehydrogenase. Afterwards, in the mitochondria,
pyruvate is converted to oxaloacetate by pyruvate carboxylase. PEPCK converts cytoplasmic
oxaloacetate to phosphoenolpyruvate, which is a key step in gluconeogenesis (Figure 3). Mice

6
with liver-specific deletion of PEPCK are unable to produce glucose via gluconeogenesis from
lactate and amino acids, leading to accumulation of TCA cycle intermediates and hepatic
steatosis 21, which demonstrates the role of PEPCK in maintaining equilibrium in fuel substrates.
Phosphoenolpyruvate ultimately is converted to fructose-6-phosphate (F6P). F6P generates G6P,
which is transported into the endoplasmic reticulum and dephosphorylated by G6Pase to
generate glucose (Figure 3). Specific deletion of G6Pase in mice leads to hepatomegaly with
glycogen accumulation and steatosis 22, showing the importance of G6Pase in the conversion of
glycogen into glucose. PGC-1α was shown to be elevated in the fasted state and in disease
models of diabetes and insulin resistance 23, stimulating gluconeogenesis by coactivating
hepatocyte nuclear factor 4α (HNF-4α) 20. This is an interesting fact since it correlates a tissue
that is highly enriched in HNF-4α with the primarily place where gluconeogenesis takes place, the
liver. Insulin release in response to increasing glucose levels, phosphorylates Akt (or Protein
kinase B), stimulates the phosphorylation of PGC-1α and decreases the ability of PGC-1α to
activate gluconeogenic genes 24.
I. 1. 2. 2. Fatty Acid Metabolism – Lipogenesis and Fatty Acid Oxidation
In the fed state, when carbohydrates are abundant, glucose is used as the main metabolic
fuel whereas the liver uses it to synthesize fatty acids. Carbohydrates provided in meals drive
lipogenesis (Figure 4). Pyruvate is the link between glycolysis and lipogenesis, providing a carbon
source. Pyruvate can be originated from glucose through glycolysis, converted back
to carbohydrates via gluconeogenesis, or to fatty acids through a reaction with acetyl-CoA
(lipogenesis). In the mitochondria, pyruvate generates acetyl-coA and oxaloacetate and when
these molecules react with each other citrate is formed and is exported to cytoplasm. Citrate is
then split into oxaloacetate and acetyl-CoA, being the last carboxylated to form malonyl-CoA.
Both malonyl-CoA and NADPH, obtained from the conversion of malate (after reduction of
oxaloacetate) into pyruvate by malic enzyme, are precursors of palmitic acid. This is elongated
by fatty acyl-CoA elongases, generating long-chain fatty acids (LCFAs – with more than 16-
carbon-chain). LCFAs can then produce TAG or unsaturated fatty acids 2.
Fatty acids can also be obtained from the bloodstream, after nutrient absorption or after
being released from adipose tissue. Fatty acids are either esterified with glycerol 3-phosphate,
generating TAG or, with cholesterol, producing cholesterol esters. These products can be stored
in hepatocytes as lipid droplets or released as VLDL into circulation. Fatty acids are also used for
phospholipids synthesis that contribute to cell membranes composition 2.

7
Figure 4 - Lipogenic Pathway. Insulin stimulates the synthesis of TAG and fatty acids.
Abbreviations: GCK (glucokinase); G6P (glucose 6-phosphate); F6P (fructose-6-phosphate); L-PK (liver pyruvate kinase); PC (pyruvate carboxylase); PDC (mitochondrial pyruvate dehydrogenase complex); NADPH (nicotinamide adenine dinucleotide phosphate); ACL (ATP-citrate lyase); ACC (acetyl-CoA carboxylase); FAS (fatty acid synthase); Elovls (fatty acyl-CoA elongases); LCFAs (long-chain fatty acids); SCDs (stearoyl-CoA desaturases); TAG (triacylglycerol); (from L. Rui, 2014) 2.
Transcriptional factors and coregulators of glycolytic and lipogenic genes are important
for the control of these pathways. Carbohydrate response element binding protein (ChREBP)
stimulates the expression of lipogenic genes (e.g. malic enzyme) 25. An isoform of the sterol
regulatory element-binding protein (SREBP) family of transcription factors, SREBP-1c, is
responsible for the insulin-dependent increase in gene expression of lipogenic enzymes required
for fatty acid and triglyceride synthesis 25.
In the fed state, insulin stimulates i) hepatic lipogenesis, inducing SREBP-1c 26 and ii)
glycolysis, thus providing lipogenic precursors. Insulin induces PGC-1α phosphorylation by Akt,
impairing the ability of PGC-1α to stimulate β oxidation 24.
On the other hand, β oxidation is induced in the fasted state, which provides energy for
hepatocytes and ketone bodies, serving as substrates to be metabolized in peripheral tissues.
Glucagon interacts with peroxisome proliferator-activated receptor α (PPARα) 27, the main
regulator of β oxidation and promotes it both in mitochondria and peroxisomes (Figure 5). In fact,
deletion of PPARα in mice showed a massive lipid accumulation in the liver, hypothermia,
hypoglycaemia and elevated plasma levels of free fatty acid 28, impairing fatty acid oxidation.
PGC-1α is also a coactivator of PPARα 29. β oxidation takes place in the mitochondria, thus
LCFAs must be translocated from cytoplasm. This transport is mediated by carnitine
palmitoyltransferase 1 (CPT1), which is inhibited by malonyl-CoA 2, a rate-limiting step in this
pathway.

8
Nevertheless, PGC-1β is reported to have opposite effects. Some authors state that it is
another PPARα coactivator and its liver-specific overexpression increases the expression of β
oxidative genes 30 while other authors observed that the expression PGC-1B in the liver induces
hepatic lipogenesis, increasing TAG synthesis and VLDL secretion 31. In fact, whole-body ablation
of PGC-1B in mice resulted in impaired mitochondrial function and hepatic steatosis 32. Acyl-CoA
oxidase (ACOX) is a rate-limiting enzyme of β oxidation in peroxisomes, being targeted by PPARα
33. ACOX null mice result in hepatic steatosis 34.
Figure 5 – Mitochondrial and peroxisomal β oxidation pathways. Fatty acid oxidation is induced in the
fasted state. The end products are acyl-CoA and acetyl-CoA. Abbreviations: ATP (adenosine triphosphate); AMP (adenosine monophosphate); PPi (inorganic pyrophosphate); FAD (flavin adenine dinucleotide); FADH2 (FAD reduced form); NAD+ (nicotinamide adenine dinucleotide; NADH (reduced form of nicotinamide adenine dinucleotide); SCPX (sterol carrier protein x); (from Reddy et al, 2001) 35.
I. 1. 2. 3. Bile Acid Metabolism
Bile acids regulate cholesterol homeostasis and contribute to the digestion and lipid
absorption. Cholesterol is an essential component of membranes and a precursor for steroids
and bile acid synthesis whose uptake is performed in the intestine through lipoprotein particles,
designated as chylomicrons. Such particles consist of triglycerides, phospholipids, cholesterol
and proteins. After the delivery of TAG to peripheral tissues, the cholesterol remnants of
chylomicrons reach the liver where they are used for bile acid synthesis or incorporated in VLDL,
which are redirected to blood circulation. When cholesterol is in excess, its conversion into bile
acids is increased to allow its elimination (in the faeces). An important part of the bile acids
pathway is the enterohepatic cycle, which consists on its secretion into the gut, followed by
reabsorption in the small intestine and redelivery to the liver, avoiding the loss of these energy-

9
costly molecules, cholesterol and bile acid derivatives. 90 % of bile acids are reabsorbed in the
intestine and return to the liver. Therefore, in the fed state, high amounts of bile acids reach the
liver through the portal vein. Upon starvation, there is a decrease in the levels of circulating bile
acids 36. On the other hand, when there is cholesterol demand, de novo synthesis occurs in liver
and intestine 15.
The synthesis of bile acids consists in a series of enzymatic reactions which take place
in the liver and contribute to the conversion of the hydrophobic cholesterol to a more water-soluble
molecule. The first and rate-limiting step in the bile synthesis pathway is that catalysed by the
cytochrome P450 enzyme cholesterol 7α-hydroxylase (CYP7A) 37. The size of the bile acid pool
is controlled tightly, in a feedback system 37. Farnesoid X receptor (FXR) senses bile acids and it
responds by inhibiting its synthesis 15, since its accumulation beyond a certain level becomes
cytotoxic 37. FXR downregulates a CYP7A isoform, CYP7A1, limiting liver bile acid accumulation
37.
In rat hepatocytes, insulin was shown to negatively regulate FXR gene expression 38. On
CYP7A1, insulin was shown to have a dual effect. Physiological insulin concentrations rapidly
induce CYP7A1 expression while prolonged insulin treatment represses it 39. However, there is
no consensus regarding bile acids regulation by PGC-1α. There are reports that FXR is induced
by PGC-1α 40,41 and the latter is elevated in fasting conditions, stimulating gluconeogenesis.
Therefore, CYP7A1 expression is decreased due to inhibition by FXR. On the other hand, some
authors claim that PGC-1α interacts with CYP7A1 promoter 36. Thus, after prolonged fasting,
CYP7A1 transcription increases and this may help to prepare the gastrointestinal tract for
absorption of fats in a future meal 36.
Figure 6 - Roles of FXR and CYP7A1 during fasting and refeeding. In the postprandial state, bile acids
are released from gallbladder into the gut to facilitate lipid absorption. Carbohydrates, such as glucose, and bile acids are reabsorbed and reach hepatocytes, through the portal vein. When bile acids enter hepatocytes, FXR is activated to inhibit their synthesis by repressing CYP7A. Abbreviations: FXR (farnesoid X receptor); BAs (bile acids); SHP (small heterodimer partner); CYP7A (cholesterol 7α-hydroxylase); Ac-CoA (acetyl-CoA); FFAs (free fatty acids);VLDL (very low density proteins); LPK (L-pyruvate kinase); SREBP (sterol regulatory element-binding protein); ACC (acetyl-CoA carboxylase); FAS (fatty acid synthase); FGF (fibroblast growth factor); (from Lefebvre et al, 2009) 42.

10
I. 2. Metabolic Syndrome
The International Diabetes Federation estimates that a quarter of the adults worldwide
suffers from metabolic syndrome. This disease increases the heart attack risk by 2-fold with an
associating 3-fold higher mortality. It represents a higher risk of developing cardiovascular
diseases and the risk of developing type II diabetes is five times higher in diseased people,
compared with healthy people 43.
The metabolic syndrome is a combination of obesity, dyslipidaemia (elevation of
triglycerides in plasma), insulin resistance and hypertension, which are interrelated 44. The main
mechanism of its pathophysiology is insulin resistance (metabolic syndrome is also known as
insulin resistance syndrome) where liver, skeletal muscle and adipose tissue cells become
progressively less sensitive to insulin. Ultimately, glucose absorption no longer occurs 43. The
cause for insulin resistance is an increase in circulating free fatty acids, released from an
expanded mass of adipose tissue. These free fatty acids decrease insulin-mediated glucose
uptake in muscle tissue, leading to a reduction in insulin sensitivity. Insulin resistance results in
hyperinsulinaemia, as a compensation mechanism for the defect in insulin action to maintain a
normal level of blood glucose, which is elevated since it is not removed by the cells. The lack of
insulin action causes failure to suppress gluconeogenesis in the liver and to mediate glucose
uptake in muscle and adipose tissue, causing glucose intolerance. The pancreatic β cells,
responsible for the production of insulin, become worn out. Once the pancreas reaches a state
where it can no longer produce enough insulin, high glucose levels are observed in the blood
(hyperglycaemic) and type II diabetes is diagnosed. In the liver, free fatty acids increase the
production of TAG, glucose and secretion of VLDL 43. Since insulin, under a physiologic state,
should stimulate glycogen synthase in the fed state 2, in a pathologic situation, in the liver, glucose
conversion to glycogen is reduced and lipid accumulation through TAG is increased. In fact,
insulin has an antilipolytic function but when insulin resistance occurs, insulin can no longer act
as antilipolytic and there is an increased level of lipolysis of triacylglycerol in the adipose tissue,
producing even more fatty acids. This may create further lipolysis due to additional inhibition of
the antilipolytic effect of insulin. Therefore, hypertriglyceridemia is an important criterion for the
diagnosis of the metabolic syndrome since it reflects insulin resistance. Other characteristic
presented in the metabolic syndrome is dyslipidaemia 44, i.e., there is an increase in secretion of
VLDL into the systemic circulation due to increased free fatty acid flux to the liver. Hypertension
is another symptom in people with metabolic syndrome, since insulin is a vasodilator in people
with normal weight. It also affects the reabsorption of sodium in the kidneys. When insulin
resistance occurs, insulin loses its vasodilatory effects but the effect on renal reabsorption of
sodium continues. In addition, the increase of fatty acids in circulation can cause vasoconstriction,
all leading to hypertension 44.
Abdominal obesity and increased waist circumference are key causative factors of the
metabolic syndrome, according to the International Diabetes Federation 43. However, there are
also people with normal weight who can be metabolically obese, presenting increased amount of
visceral adipose tissue. This type of adipose tissue is related with a higher flux rate of fatty acids

11
to the liver, through the splanchnic circulation, while abdominal fat is related with the release into
the systemic circulation of lipolysis products.
I. 3. Stem Cells
Stem cells are an important resource for biomedical applications due to their ability to
continuously self-renew in culture (maintaining its undifferentiated state), to differentiate into
distinct cell types, and to secrete several molecules such as immunomodulatory factors 45,46.
These cells can be divided into embryonic, fetal, neonatal and adult, according to their origin.
Other possible categorization of stem cells is the division through their differentiation potential:
totipotent (can give rise to an entire organism), pluripotent (the epiblast which is capable of giving
rise to cells from the three germ layers, through gastrulation, such as mesoderm, endoderm and
ectoderm), multipotent (which can only differentiate into cells from a particular germ layer) and
unipotent cells (which can only differentiate into one cell type). Embryonic stem cells present a
pluripotent potential. However, the access to these cells poses ethical, technical and legal
concerns. More recently, Yamanaka et al 47 were able to generate induced pluripotent stem cells
(iPSCs), with a combination of four transcription factors: Oct3/4, Sox2, Klf4 and c-Myc. iPSCs
may be derived from somatic tissues of patients and allows the use of human cells with the same
genetic makeup as the patients. However, the reprograming protocols still have very low yields
48. iPSCs also present safety issues regarding teratoma formation and genetic stability 49.
An alternative source of stem cells is the umbilical cord. This source does not raise such
ethical issues, since after birth this tissue was discarded 50. It contains mesenchymal stem cells,
hematopoietic stem cells, which are more primitive than those found in bone marrow or in adipose
tissue 51.
I. 4. Mesenchymal Stem Cells (MSCs)
Mesenchymal stem cells (MSCs) are a subset of multipotent stem cells that can be
isolated from fetal blood, liver and bone marrow 52, adult bone marrow 53, amniotic fluid and
placenta 54, adipose tissue 55, peripheral blood 56, umbilical cord blood 57 and umbilical cord matrix
58, 59.
The International Society for Cellular Therapy defined the following parameters for the
characterization of MSCs: plastic-adherence when in culture; expression of CD105, CD73 and
CD90 surface markers and lack of the expression of CD45, CD34, CD14 or CD11b, CD79α or
CD19 and HLA-DR. Finally, since they are considered to be multipotent, they should be able to
differentiate into mesodermal lineages derivatives, such as adipocytes, chondrocytes and
osteoblasts 60.
MSCs were firstly harvested from bone marrow (bmMSC) 61 which are the most well
studied source of MSCs. However, the harvesting constitutes an invasive procedure with low
yields. Neonatal tissues such as placenta and umbilical cord blood or matrix have awakened
interest due to its more primitive origin and non-invasive method of harvesting. Neonatal MSCs,

12
in particular, present less of donor variability compared with other sources of MSCs due to donor
age, clinical history or lifestyle. By analysing MSC karyotype during the culture process, it was
concluded that MSCs maintained a normal karyotype, as oppose to embryonic stem cell lines,
which accumulated mutations 62. When comparing MSC recovery from umbilical cord blood with
umbilical cord matrix, results showed that the latter is a richer source of MSC, the isolation
efficiency is higher and the growth kinetics are higher as well, compared with bmMSCs 63.
Furthermore, the presence of early endodermal markers in MSCs derived from the
umbilical cord matrix such as GATA-4 and HNF-4α allows to hypothesize that these cells may
undergo endoderm-specific differentiation, possibly originating liver cells 62 and not only
adipocytes, chondrocytes and osteoblasts. Most importantly, transcription factors important for
the liver development (GATA-6, SOX9 and SOX17) and liver progenitor markers (DKK1, DPP4,
DSG2, CX43 and K19) were demonstrated to be higher expressed in this type of MSCs compared
with other MSC sources 58. These results provide evidence that human umbilical cord matrix could
be a promising MSC source to generate hepatocyte-like cells (HLCs) for in vitro applications, such
as disease modelling, drug screening, toxicological studies and, ultimately, regenerative medicine
applications.
I. 5. Deriving human hepatocyte-like cells (HLCs) from stem cells by
mimicking liver embryogenesis
There are several sources of hepatocytes that can be used in in vitro models, such as the
use of primary hepatocytes (either from human or animal sources), post-mortem tissues or
immortalized cell lines. The use of primary hepatocytes poses problems due to its availability and,
once in culture, there is a decrease in expansion capacity and rapid loss of functionality 6. On the
other hand, post-mortem tissues usually only represent the late-stage characteristics of pathology
progression. Animal models are also frequently used in studies but they fail to describe efficiently
the human body complexity and raise obvious ethical issues. Immortalized cell lines (e.g. HepG2)
have a great expansion capacity. However, these lines are derived from tumours and may contain
genetic and metabolic abnormalities. Thus, they do not represent accurately liver physiology.
These drawbacks demonstrate the need for reliable physiological hepatic models for biomedical
applications or pharmaceutical industry. Stem cells are a fundamental source for these purposes
due to its ability to self-renew and differentiate into mature cells 6.
Hepatocyte differentiation has been described from human bmMSCs 64, 65, MSCs derived
from human adipose tissue 66 and MSCs derived from human umbilical cord matrix (hnMSCs) 67.
In vitro stem cell differentiation aims at mimicking embryonic organogenesis. Thus, liver
development can be divided into four stages: i) endoderm induction; ii) foregut and hepatic
competence induction; iii) hepatoblast and liver bud formation and iv) differentiation of hepatoblast
into hepatocyte. These steps involve the interaction of multiple signalling pathways and other
developing structures of the embryo. The differentiation protocols include mainly the addition of
cytokines and growth factors.

13
During gastrulation, the definitive endoderm emerges as a sheet of cells from the anterior
end of the primitive streak. Endoderm forms the primitive gut which is subdivided into foregut,
midgut and hindgut 68. Liver originates from the ventral foregut endoderm 69.
Nodal is an important signalling pathway for the pattern formation and differentiation
processes during gastrulation, stimulating the expression of a group of endoderm transcription
factors (e.g. SOX17 and Foxa1-3), in a concentration-dependent manner where high doses of
Nodal induce endoderm 70. Endoderm starts to acquire the shape of a gut tube epithelium,
surrounded by mesoderm. This new structure is further patterned into foregut, midgut and hindgut.
Foregut is a precursor of the liver and expresses the transcription factor Hhex 68. In vitro, this
phase is mimicked by exposure to fibroblast growth factor (FGF) and epidermal growth factor
(EGF), which induce Hhex gene expression 71,72. Regarding Wnt/β-catenin signalling, the correct
temporal sequence is essential for liver development. During gastrula, low levels of β-catenin are
observed in the anterior endoderm and are important to maintain foregut identity. However, later
in development, Wnt and FGF signalling promote hepatic development, having the opposite effect
73. The developing heart and septum transversum mesenchyme (STM) release FGF and bone
morphogenic protein (BMP) respectively, inducing hepatic fate in the ventral foregut endoderm
74,75. The first sign of the embryonic liver is the hepatic diverticulum. After hepatic fate commitment
by FGF and BMP signals, hepatoblasts begin to express liver markers (Hhex, GATA-4 and GATA-
6) and there is a transition in the hepatic epithelium from a columnar to a pseudostratified
epithelium, promoted by the homeobox gene Hhex 76. The hepatic epithelium is surrounded by a
laminin rich basement membrane and endothelial precursors, embedded in the STM. At this point,
basal lamina breaks down. Hepatoblasts form the liver bud, invading the STM 68. Liver bud then
becomes the major fetal hematopoietic organ since it is vascularized and colonized by
hematopoietic cells, inducing a period of fast tissue growth. Liver genes, such as HNF-4Α,
albumin (ALB), cytokeratin19 (CK-19) and α-fetoprotein (AFP) are expressed shortly after hepatic
specification 68. STM and hepatic mesenchyme promote hepatoblast proliferation and survival
through secretion of FGF, BMP, retinoic acid and hepatocyte growth factor (HGF) 71,77–79. In order
to promote in vitro hepatoblast formation, HGF combined with insulin-transferrin-selenium (ITS),
nicotinamide and dexamethasone are added to cell culture medium since they are liver-specific
factors reported to act synergistically 80.
Hepatoblasts are bipotent cells. They can either differentiate into hepatocytes or into
biliary epithelial cells. These cells express genes associated with both adult hepatocytes (HNF-
4Α, ALB, and cytokeratin-18, CK-18) and biliary epithelial cells (CK-19). Hepatoblasts in contact
with the portal vein increase CK-19 expression while those which are not in contact with portal
veins differentiate into mature hepatocytes 68. Hematopoietic cells in liver, during mid-gestation
produce a cytokine called oncostatin M (OSM), which promotes hepatocyte differentiation. OSM
also induces the expression of G6PASE and glycogen accumulation 81. HGF, which originally
appeared in serum of partially hepatectomized rats, was shown to stimulate proliferation of adult
hepatocytes, being an important factor for liver regeneration 81. OSM and HGF, along with
dexamethasone and Wnt, promote the expression of ALB and HNF-4Α 68. It was shown that

14
dexamethasone induces hepatocyte maturation, suppressing growth while HGF and EGF are
associated with cells at the intermediate hepatoblast phase. Dexamethasone, in the absence of
HGF and EGF, induces exclusively hepatocyte maturation 82.
The use of epigenetic modifiers combined with growth factors has also been attempted
in differentiation protocols. Epigenetic modifiers produce changes in genome function without
changing the DNA sequence. In the differentiation protocol used in this work two epigenetic
modifiers have been used: dimethyl sulfoxide (DMSO) and 5-azacytidine (5-AZA). DMSO
[(CH3)2SO] is an amphipatic molecule with two apolar domains and one polar domain, being
soluble in both aqueous and organic media 83. DMSO was previously shown to induce hepatic
differentiation of mesenchymal stem cells and fetal liver stem/progenitor cells 84–86. The
mechanism by which it induces hepatic differentiation is not fully understood but some authors
associate it to histone hyperacetylation-inducing effects 87 which facilitates DNA transcription 88.
Chetty et al studied DMSO in order to improve pluripotent stem cell differentiation 89. It was shown
that DMSO, by activating a regulator of the G1 phase of the cell cycle, the retinoblastoma protein,
increases the competency of pluripotent stem cells to respond to differentiation signals, across all
germ layers 89. G1 phase has been associated with a differentiated status 90. 5-AZA is a cytidine
analogue which inhibits DNA methylation and has also been reported to induce hepatic
differentiation from mesenchymal stem cells 91, 92. It is a potent inhibitor of DNA-cytosine
methyltransferases 93. The inhibition of DNA methylation increases the expression of genes in a
selective environment, which is the combination of small molecules used in the differentiation
medium. 5-AZA was the first hypomethylating compound to be approved by the U.S. Food and
Drug Administration to treat myelodysplastic syndrome. Cells must be in a proliferative in order to
allow this cytidine analogue to be incorporated into the DNA 94.
I. 6. Microfluidic Devices
The use of MSCs-derived HLCs is an important breakthrough for liver studies, since, it
does not involve the use of immortalized cell lines or animal models. Thus, it contributes to create
models that resemble human biology more closely and that better predict the efficacy and safety
of new drugs. Ultimately it contributes for implementing the principle of the 3R’s: methods that
replace the use of animal models (replacement); methods that minimise the number of animals
used in an experiment (reduction); and methods that improve animal welfare (refinement) 95.
Two-dimensional (2D) models were already proven to fail to predict living tissue
behaviours because they do not mimic in vivo cellular organization, do not involve interaction with
other cell types and do not present media flows as what happens in vivo 6,96. Microfluidic devices
are now being used for in vitro applications due to its low reactant consumption, the possibility of
modelling important aspects of microenvironment, such as creating dynamic flows and, according
to its design, it can add an extra level of physiologic complexity, e.g. by allowing co-culture of
different types of cells. These devices are a possibility to overcome the limitations of current
methods, introducing the organ-on-a-chip concept. It combines biology and engineering to
improve control over experimental conditions thus exploring techniques to control substrate

15
feature size, shape and topography on the same scale (µm or nm) that cells experience within
our body 97. Microfluidics, due to ability to create flows, can be especially useful when studying
pharmacokinetics and pharmacodynamics. Pharmacokinetics (PK) refers to the movement of a
drug within the body overtime, involving absorption, distribution, metabolism and excretion
(ADME) 98. A reported physiologically based pharmacokinetic model has separate compartments,
representing different organs, connected by blood circulation. This will allow to predict the
concentration profile of a drug and its metabolites 99. Pharmacodynamics (PD) is related to how
the body processes the drug 100. It can predict the pharmacological effect of a drug at the target
site 99. A microfluidic device combining PK and PD was created, by Sung JH et al, representing
liver (using HepG2), marrow and tumour 99.
Hepatocytes are mostly considered for in vitro drug toxicity testing and disease modelling.
Together with the possibility of creating dynamic interactions between compounds and
hepatocytes and between hepatocytes and other types of cells, brought by the use of microfluidic
devices, the necessary characteristics for a relevant in vitro model are created. Microfluidic
devices can provide a dynamic medium flow similar to blood circulation. There are reports of a
microfluidic design which allows the culture of primary human and rat hepatocytes, mimicking
mass transport features of the human liver sinusoid 101; a microfluidic culture system which can
predict hepatic clearance (a relevant pharmacokinetic parameter to be considered in drug
discovery) 102; a microfluidic device which allows to study interactions between hepatocytes
receiving or not receiving HGF (important for liver injury studies, immunology and developmental
biology) 103; drug-metabolism studies using a microfluidic hepatic co-culture platform 104; and
modelling of nonalcoholic fatty liver disease in a microfluidic device 105. Regarding multiple cellular
interactions, there are microfluidic devices designed for culturing different cell types, creating the
called multi-organ-chip 106. TissUse is a German company that developed a platform allowing
different cell types to be in contact through media flow 107. Maschmeyer et al 106,108 developed
multi-organ-chips that included liver (using HepaRG cell line), intestine, skin and kidney
equivalents 106,108, mainly created to assess systemic toxicity of drugs. These devices contain a
support with temperature control and micro-pumps, which provides a pulsatile fluid flow. However,
these complex features require expertise while working and make them expensive. Nevertheless,
the main advantages of using a microfluidic culture system is the possibility of creating medium
flow, becoming closer to the in vivo conditions, and the bigger control of cell disposition and
architecture. Therefore, these culture systems would be an interesting approach to study cell-to-
cell interactions that can be regulated by secreting cellular factors or direct contact. Besides, cell–
cell interaction within same or different cell types is another essential part of microenvironment
making these devices important candidates for studying the metabolic syndrome where the
interaction between liver cells, adipocytes and myofibroblasts is essential.
The microfluidic device herein adopted was the Xona Microfluidics Standard Neuron
Device, mainly used in neuroscience field, allowing the fluidic isolation of axons and dendrites 109.
Despite not having pumps for a more controlled fluid flow, these devices are rather simple to use
and can be adapted to other cell types. Herein, we adapted the HLCs differentiation process and

16
culturing to this device in order to enable further tests with one of the other cell lines involved in
the metabolic syndrome. In fact, in the future, with some modifications, these platforms will
possibly allow the culture of different cell types, in the context of the metabolic syndrome.
I. 7. Motivation and Aims
The metabolic syndrome is a combination of risk factors, such as dyslipidaemia, insulin
resistance and hypertension, commonly associated with type II diabetes, which increase the
probability of having cardiovascular problems 43, 110. Therefore, the economic burden caused by
these health problems needs to be considered specially, because there is a prediction that the
incidence of diabetes will double by 2025, along with the cardiovascular-related illness 43. In 2003,
it was estimated that for the 25 European Union countries the total direct health care costs of
diabetes in people between 20 and 79 years old represented 7.2 % of the total healthcare
expenditures for these countries (64,9 thousand millions international dollars) 43.
Metabolic syndrome’s pathophysiology involves the interaction of different organs,
namely, liver, adipose tissue and skeletal muscle. The novelty brought by the microfluidic devices
is that it allows to study interactions between different cell types with control of fluid flow, similar
to the blood 111. These characteristics allow in vitro studies to better mimic what happens in vivo.
In the context of the metabolic syndrome, the possibility of studying crosstalk between cells is of
particular interest, namely crosstalk between hepatocytes and the other two cell types. The
increased release of free fatty acids from an expanded mass of adipose tissue induces insulin
resistance, causing the glucose homeostasis dysregulation 43. The lack of insulin sensitivity in the
liver fails to suppress gluconeogenesis, increasing glucose production; reduces glycogen
synthesis and increases the production of TAG and VLDL secretion 43. Therefore, to fully
understand the mechanisms underlying metabolic syndrome, hepatocytes have a relevant role
and studying its behaviour is of utmost importance.
Regarding hepatic in vitro studies, the maintenance of primary hepatocytes in culture is
difficult due to its phenotypic instability over culture time; whereas the availability of human
samples is scarce 6. To overcome these limitations, cell lines may be an alternative, since they
are highly available and present a stable phenotype 6. However, most hepatocyte cell lines may
contain genetic abnormalities are derived from tumours and do not present the same drug-
metabolizing characteristics of human hepatocytes 6. Therefore, there is still the demand for
functional hepatocyte sources of human origin. HLCs, derived from stem cells, can be an
alternative. hnMSCs represent an ethically acceptable, widely available and safe source,
compared to embryonic stem cells 45,46,62. Furthermore, there are reports showing that MSCs
derived from the umbilical cord present early endoderm markers and that they express
transcription factors related to liver development and liver progenitor markers 59,63.
Based on such information, the major objective of this thesis was to adapt HLCs derived
from hnMSCs to a microfluidic device that would enable the in vitro study of the metabolic
syndrome. Traditionally, hepatocytes’ culture medium has high concentrations of dexamethasone
and insulin, which are necessary to induce a more mature phenotype 80. However, these interfere

17
with glucose homeostasis 112. Additionally, the collagen coating used in the differentiation process
is of a gel type 86, which may present drawbacks such as the formation of clots of micrometres’
order within the channels of the microfluidic device. In this context, we firstly adapted the HLCs
to both a new medium with lower concentrations of dexamethasone and insulin and to a new
collagen coating.
Secondly, since insulin and glucagon control blood glucose levels and the energy
metabolism of hepatocytes, we studied HLCs’ response to the stimuli of these two hormones,
through gene expression. In addition, HLCs’ adaption to fasting was also studied. Lastly, we
aimed to maintain HLCs in this microfluidic device up to two weeks to demonstrate whether these
could be used in this type of cell culture for further studies regarding the metabolic syndrome.
In sum, the specific questions addressed in this thesis were:
1. Do HLCs in a thin collagen coating and cultured in a medium with lower concentration of
insulin and dexamethasone maintain their biotransformation activity, the presence of
hepatic markers, glycogen storage, urea and albumin production throughout culture time?
2. Are HLCs able to respond to insulin and glucagon stimuli and fasting, altering their energy
metabolism accordingly?
3. Can we maintain HLCs in microfluidic devices over a reasonable culture time, allowing
the development of an alternative in vitro HLC-based culture model for further
mechanistic studies?

18
II. Materials and Methods
II. 1. Reagents
Cell culture supplements were purchased from Lonza, unless otherwise stated. Trypsin-
EDTA, fetal bovine serum (FBS), insulin-transferrin-selenium solution (ITS), non-essential amino
acids supplement (NEAA), rat-tail type I collagen and human insulin were purchased from
Gibco®/Life Technologies. 7- ethoxyresorufin and 7-ethoxycoumarin were purchase from Alfa
Aesar. Hepatocyte growth factor (HGF), fibroblast growth factors (FGF-2 and FGF-4) and
oncostatin-M (OSM) were purchased from Peprotech. Finally, Iscove's modified Dulbecco's
medium (IMDM), alpha modified Eagle's medium (α-MEM), epidermal growth factor (EGF),
dexamethasone, DMSO, nicotinamide, 5-AZA, trypan blue, periodic acid, Schiff’s reagent,
Mayer’s hematoxylin, amylase, Hank’s balanced salt solution (HBSS), 4-methylumbelliferone (4-
MU), β-glucuronidase/arylsulfatase, resorufin, amphotericin B and glucagon were acquired from
Sigma-Aldrich®.
II. 2. Cell Culture
hnMSCs were isolated as described by Miranda et al 45 and Santos et al 46 and expanded
as undifferentiated cells in α-MEM supplemented with 10 % of FBS (growing medium). Briefly,
cell expansion consisted on passages every 2-3 days, when a 70-80 % confluence was reached.
HepG2 cells (purchased from ATCC (HB-8065; American Type Culture Collection (ATCC) were
cultured in α-MEM supplemented with 10 % FBS, 1 mM of sodium pyruvate and 1 % NEAA.
Cryopreserved human primary hepatocytes (hpHeps; pool of 10 donors) were purchased from
Invitrogen™ (Carlsbad, CA, USA; HEP10, A12176), thawed on cryopreserved hepatocyte
recovery medium (CHRM; CM7000, Invitrogen™) and manipulated according to manufacturer
instructions. Rat primary hepatocytes (rpHeps) were isolated from Wistar rats 3- to 6-month old,
weighting 200 to 400 g, obtained from Charles River Laboratories and cultured according to
Miranda et al 113. Prior to each experiment, the animals were kept in a separate cage for at least
24 hours, with ad libitum access to food and water. All applicable institutional and governmental
regulations concerning the ethical use of animals were followed, according to the European
guidelines for the protection of animals used for scientific purposes (European Union Directive
2010/63/EU) and the Portuguese Law nº 113/2013. Cell cultures of hnMSCs, HepG2, hpHeps
and freshly isolated rpHeps were maintained at 37 °C in a humidified atmosphere with 5 % CO2
in air. Cell viability was assessed through trypan blue exclusion method.
II. 3. Collagen Coating
Rat-tail collagen and commercial rat-tail collagen were used in this work. The protocol for
rat-tail extraction was based on Rajan et al 114. Briefly, rat-tails were washed twice in 70 % ethanol
prior to skin removal using surgical material. Tendon fibres were pulled out, separated from bone
and cartilaginous tissue and suspended in PBS. Fibres were then washed three times and
19
immersed for 1 hour in 70 % EtOH before being transferred into 0.1 % acetic acid and stirred
during 48 hours at 4 °C, for fibre acid digestion. The solution was centrifuged at 16000xg for 90
minutes at 4ºC. The supernatant was collected, lyophilized and the resultant solid stored at -80°
C until further use.
The extracted rat-tail collagen was dissolved in 0.1 % acetic acid to a stock concentration
of 1 mg/mL. The stock solution was diluted in PBS to 0.2 mg/mL in a volume that assures total
culture surface coverage. After 1-hour incubation at 37 ºC, cell culture surfaces were washed with
PBS before inoculation. The differentiation process occurred using this collagen coating until day
17 and onwards for energy metabolism studies in well plates.
Coating with commercial type I collagen was used for the microfluidic device and in
parallel for the cover glasses (VWR®) in 24-well plates. Commercial collagen at a stock
concentration of 3 mg/mL was diluted in 0.1 % acetic acid to a final concentration of 0.2 mg/mL.
This collagen was used from day 17 onwards. Coating was performed with three overnights to
guarantee the formation of a collagen film throughout the culture surface. Collagen was allowed
to polymerize each overnight. The device and the well plates were washed three times with PBS
and before inoculation, the microfluidic device was washed three times with warmed IMDM and
was left at the incubator for medium equilibration.
II. 5. Hepatocyte Differentiation Protocol
The differentiation protocol was performed as described in Cipriano et al 86,96. hnMSCs
were seeded at a density of 1.5x10⁴ cells/cm2 in plates coated with rat-tail collagen, reaching a
cell confluency of 90 % within 24 hours after inoculation. A three-step differentiation protocol
(Figure 7) was applied using IMDM with 1 % penicillin-streptomycin-amphotericin B (P/S/A) as
basal medium (BM). Briefly, the first step consisted in a 48-hour incubation of BM with 2 % FBS,
10 ng/mL of EGF and 4 ng/mL of FGF-2, for endoderm commitment and foregut induction. In the
second step, cells were maintained for 10 days in BM supplemented with 10 ng/mL of FGF-4, 4
ng/mL of FGF-2, 20 ng/mL of HGF, 1 % ITS and 0.61 g/L of nicotinamide, to induce hepatoblast
and liver bud formation. At day 10 of differentiation (D10), 1 % DMSO was added. In the third
step, at D13, BM was supplemented with 8 ng/mL of OSM, 1 μM of dexamethasone, 1 % DMSO
and 1 % ITS, defined as differentiation medium (DM). At D17, as a proliferative step, cells were
trypsinized, re-inoculated and maintained in this culture medium supplemented with 20 μM of 5-
AZA. At D21, cells could be maintained in DM or changed to maintenance medium (MM), which
was BM supplemented with 8 ng/mL of OSM, 100 nM of dexamethasone, 1 % DMSO, 1 nM of
insulin and 0.2 % bovine serum albumin (BSA). The concentrations of dexamethasone, insulin
and BSA used in MM were based on Estal et al 115. HLCs culture was maintained up to D34.

20
Figure 7 - Hepatocyte Differentiation Protocol. This protocol consisted in three steps: endoderm
commitment/foregut induction, hepatoblast and liver bud formation and hepatoblast differentiation/hepatocyte maturation. Abbreviations: BM (basal medium); FBS (fetal bovine serum); EGF (epidermal growth factor); FGF (fibroblast
growth factor); HGF (hepatocyte growth factor); ITS (insulin-transferrin-selenium); DMSO (dimethyl
sulfoxide); OSM (oncostatin M); BSA (bovine serum albumin); D0 – D34 (day 0-34 of the differentiation
protocol).
II. 6. HLCs Response to Insulin/Glucagon Stimuli
The hormone stimuli assays were performed at D34, as described on Figure 8. Before
the insulin stimuli, cells culture medium was changed from MM to starvation medium (SM: DMEM,
1 % P/S, 4 mM of glutamine, 1 % DMSO, 8 ng/mL of OSM and 0.2 % BSA), for an incubation
period of 2 hours, to enhance the response to insulin incubation, as described in Correia et al 116.

21
Figure 8 - Insulin and glucagon stimuli protocol. In the insulin stimuli, a 2-hour exposure to SM was
performed followed by an 8h-incubation with 80 nM of insulin in SM. Negative control was performed in parallel in which cells were maintained in SM. In the glucagon stimuli, an 8-hour exposure to 100 nM of glucagon in SM was performed. Negative control was performed in parallel in which cells were maintained in SM. Abbreviations: SM (starvation medium).
II. 7. Microfluidic Device Set-up
II. 7. 1. Set-up
The device herein used was the Xona Microfluidics Standard Neuron Device (SND150)
with a 150 μm microgroove barrier. The device is made of polydimethylsiloxane (PDMS) and has
four wells and two channels connected by microgrooves, as presented on Figure 9. The wells are
8 mm in diameter. The main channel is 7 mm long. The smaller channels (connecting the wells
to the main channel) are 2.07 mm long. All the channels are 100 μm in height and 1.5 mm wide.
Figure 9 - Microfluidic Device Diagram (from Xona Microfluidics) 109. This microfluidic device is
composed of two channels, allowing the communication between two wells, each. Microgrooves connect the two channels.
The cover glasses (VWR®) used for plasma bonding were firstly submitted to a cleaning
procedure consisting on sonication in a water bath for 30 minutes, being rinsed in distilled water,
followed by rinsing in 70 % ethanol and three times rinsing in distilled water. As a sterilization
procedure, the cover glasses were allowed to dry in a laminar flow hood cabinet, under ultraviolet
(UV) light exposure. The next step was to place both the microfluidic device and the cover glass

22
into a Plasma Cleaner (Harrick Plasma) for plasma bonding procedure, for about 1 minute, at 300
mTorr. The channels were filled with 70 % ethanol until the microfluidic device was used. A
cleaned glass slide was placed on top of the chambers to avoid liquid evaporation. The devices
were stored at 4 º C, up to 5 months. Before use, the microfluidic channels were washed with
water to remove the ethanol.
II. 7. 2. HLCs inoculation
At D17 of differentiation, a suspension containing 7.5x10⁴ cells was centrifuged, at 200xg
for 5 minutes, and resuspended in 10 μL of DM containing 20 % FBS, in order to inoculate one
microfluidic channel. After 1 hour, when most of the cells were adherent, 100 μL of the same DM
was added to each one of the four wells to allow further cell adhesion. Up to 1 hour later, 200 μL
of DM without FBS containing 20 μM 5-AZA, as a proliferative step, was added to each one of
the wells. In parallel, 24-well plates were inoculated at a seeding density of 30 000 cells/cm2.
II. 8. Quantitative Real-Time Polymerase Chain Reaction (qRT-PCR)
Total RNA was isolated from samples with 0.15-1.0 million of cells using Trizol® (Life
Technologies) according to manufacturer instructions and quantified by measuring absorbance
at 260 nm using LVis Plate mode (SPECTROstar Omega, BMG Labtech, Ortengerg, Germany).
260/280 nm and 230/280 nm ratios were used as purity measurements for protein and solvent
presence, respectively, considering ratios between 1.8-2.2.
cDNA was synthesized from 0.5-1 μg RNA using NZY First-Strand cDNA Synthesis kit
(NZYTech) according to the manufacturer instructions. Quantitative real time PCR was performed
using PowerUp™ SYBR® Green Master Mix (Life Technologies) which was prepared for a final
reaction volume of 15 μL, using 2 μL of template cDNA and 0.333 μM of forward and reverse
primers (Table A in chapter VI). Annexes presents the specific primers used in this work. The
reaction was performed on 7300 Real-Time PCR System (Applied Biosystems®/ Life
Technologies) consisting of a denaturation step at 95 °C for 10 minutes, 40 cycles of denaturation
at 95 °C for 15 seconds, annealing at 60 °C for 1 minute and extension at 72 °C for 30 seconds.
A dissociation stage was added to determine the melting temperature (Tm) of a single nucleic
acid target sequence as a quality and specificity measure. The comparative Ct method (2-ΔΔCt)
was used to quantify gene expression, which was normalized to a reference gene (β-actin).
II. 9. Histology
II. 9. 1. Periodic Acid Schiff’s (PAS) Staining
Cultured cells were washed with PBS and fixed with 4 % paraformaldehyde (PFA; Sigma-
Aldrich®) in PBS at room temperature (RT), for 15 minutes. One sample was incubated with
amylase for 15 minutes at 37 ºC allowing to distinguish between positive and unspecific staining
since it digests glycogen. Cell surface was oxidized with 1 % Periodic Acid (Sigma-Aldrich®) in
water for 10 minutes. A washing step with distilled water for 5 minutes was followed by incubation
with Schiff’s reagent for 15 minutes. Cells were washed again and counterstained with Mayers’

23
hematoxylin (Sigma-Aldrich®). The wells were rinsed with distilled water and were observed under
light microscope (Olympus CK30 inverted microscope).
II. 9. 2. Immunocytochemistry
For immunocytochemistry staining adherent cells were, firstly, washed with PBS and fixed
with 4 % PFA and 4 % sucrose in PBS, at RT, for 15 minutes. The next step was permeabilization
with 0.3 % Triton-100 in PBS, for 15 minutes at RT. Afterwards, blocking buffer containing 2.5 %
BSA, 2 % FBS in PBS was applied for 30 minutes at RT. Incubation with primary antibody was
carried out at 4ºC overnight. The following primary antibodies were used: CK-18 (mouse
monoclonal IgG; Santa Cruz Biotechnology®), organic anion-transporting polypeptide-C (OATP-
C; mouse monoclonal IgG; Santa Cruz Biotechnology®), multidrug resistance protein-2 (MRP-2;
rabbit policlonal IgG; Santa Cruz Biotechnology®), ALB (rabbit polyclonal IgG; Santa Cruz
Biotechnology®) and HNF-4α (mouse monoclonal IgG; Perseus Proteomics Inc.). 1h-incubation
with secondary antibody was performed at RT. All antibodies were diluted in blocking buffer. The
final step was to apply DAPI (Sigma-Aldrich®) and aqua-poly/mount coverslipping medium
(Polysciences). The coverslides were observed on an inverted fluorescence microscope (Axiovert
200M, Carl Zeiss) coupled with a monochrome camera (AxioCam MNC, Carl Zeiss). Sample
fluorescence was examined in fluorescence at excitation/emission wavelengths of 590/617 nm
(goat anti-rabbit Alexa Fluor 594; Life Technologies), 495/519 nm (donkey anti-mouse Alexa Fluor
488; Life Technologies) and 358/461 (DAPI). Images were acquired using AxioVision Rel. 4.7
software.
II. 10. Urea and Albumin Quantification
Urea and albumin were quantified in cell culture supernatants using a colorimetric urea
kit (QuantiChrom™ Urea Assay Kit, BioAssay Systems) and ELISA commercial kit (ICL's Human
Albumin ELISA kit), respectively. The absorbance was measured at 520 nm for urea and 450 nm
for albumin ELISA in a microplate reader (SPECTROStar Omega, BMG Labtech), according to
manufacturer instructions. Data is presented as the rate of production: µg/106 cells.h (for urea)
and pg/106 cells.h (for albumin).
II. 11. Biotransformation Activity
Phase I metabolism reactions were assessed by quantification of 7-ethoxyresorufin-O-
deethylase (EROD) and 7-ethoxycoumarin-O-deethylase (ECOD) activities. Phase II metabolism
reactions were quantified by measuring UGTs activity.
EROD assay allows to assess human CYP1A1 and CYP1A2 117 activity. The protocol
herein used was adapted from Donato et al 118 and consisted in a 90-minutes cell incubation with
IMDM containing 8 μM 7-ethoxyresorufin followed by a 2-hour enzymatic digestion with β-
glucuronidase/arylsulfatase. The concentration of the product (7-hydroxyresorufin) was
measured at an excitation wavelength of 530 nm and an emission of 590 nm.
24
ECOD activity reflects human CYP2B6, 1A2 and 2E1 activity 117,119. The protocol consisted on a
90 minutes’ cell incubation with 0.8 mM 7-ethoxycoumarin diluted in IMDM. After 2-hour
enzymatic digestion with β-glucuronidase/arylsulfatase, liquid-liquid extractions, with chloroform
(collecting the organic phase) and a solution of 1.0 M NaCl and 0.1 M NaOH (collecting the
aqueous alkaline phase), the concentration of the product (7-hydroxycoumarin) was measured at
an excitation wavelength of 340 nm and an emission wavelength of 460 nm.
UGTs activity was determined by cell incubation with 4-methylumbelliferone (4-MU). The
substrate was quantified both before and after cell incubation, in order to evaluate the extent of
conversion. The protocol was based on Miranda et al. 119. Briefly, a 1-hour cell incubation with
100 μM 4-MU solution diluted in HBSS was performed. Afterwards, the supernatant was
transferred into a 96-well plate and 4 μL of NaOH at 0.1 M was added per well in order to achieve
pH = 11. The fluorescence was measured at an excitation wavelength of 340 nm and an emission
wavelength of 460 nm.
II. 12. Protein Quantification
Protein concentration was determined by measuring the absorbance at 280 nm, using
LVis plate mode (SPECTROstar Omega, BMG Labtech). Total protein was quantified after cell
lysis with 0.1 M NaOH solution at 37 °C overnight, stored at -20 ºC for further analysis and used
to normalise urea and albumin quantification as well as biotransformation activity.
II. 13. Statistical Analysis
The results are given as the Average ± SEM. Statistical data analysis was performed
using PRISM 6.0 (GraphPad Software). The effects on biotransformation activity and the
response of HLCs’ regarding energy metabolism were evaluated by two-way ANOVA with Tukey’s
test in order to determine whether the biotransformation activity of each compound was
significantly altered by the medium composition over culture time, the effect of medium
composition, the effect of fasting and exposure to insulin and glucagon in gene expression and
to evaluate differences between groups and controls. p < 0.05 was considered statistically
significant.

25
III. Results and Discussion
Metabolic syndrome is a disease commonly associated to type II diabetes and to a higher
risk of developing heart problems 43. It depends on the interaction between different organs such
as adipose tissue, skeletal muscle, pancreas and liver. However, further understanding of the role
of each organ and the mechanisms leading to this disease is still necessary, namely that of the
liver. Human hepatocytes cannot be maintained in culture during a reasonable time in order to
allow long-term studies of cellular interaction 6. Therefore, new hepatocyte models resembling the
human physiology are demanded for disease modelling and for the development of new potential
therapies. These models seek characteristics closer to the human physiology. Despite
immortalized cell lines and animal models being more available those are not the ideal models
for these studies. Differentiation protocols of stem cells are being developed and adopted by the
scientific community to overcome these drawbacks. Moreover, microfluidic devices can be
regarded as an alternative model since these systems allow the study of interactions between
different cell types and even the creation of organ-on-a-chip concept 97. In this study, we
attempted to culture HLCs derived from hnMSCs in a microfluidic device (Xona Microfluidics
Standard Neuron Device - SND150) and checked their competence for energy metabolism
studies.
III. 1. HLCs could be adapted to commercial rat-tail type I collagen coated
surfaces
With the ultimate goal of adapting the cells to a microfluidic device, the surface coating
was firstly optimized. In vitro cultures of epithelial cells, such as hepatocytes, require specialized
coating of culture surface with extracellular matrix proteins, namely collagen, contributing to a
better attachment and maintenance of differentiated properties 120. Two types of collagen were
used throughout this work: rat-tail type I collagen and commercial type I collagen. Collagen
extracted from a rat tail at a laboratory scale does not present the same purity of a commercial
collagen submitted to purity controls at an industrial scale. Therefore, the use of commercial
collagen as a coating contributes to culture definition and to the development of standard in vitro
methods. The stock solution of rat-tail collagen and the commercial collagen were diluted in acetic
acid. The acid solution allows the fibres to be more flexible 120. However, at an acidic pH, collagen
fibres do not polymerize and this is the reason why acetic acid is used to store collagen, in a liquid
form. When pH is raised achieving a value close to the normal physiological level (in our
laboratory we used PBS, at pH = 7.45) a thick gel layer is formed 120. Our group has previously
optimized a differentiation protocol for deriving HLCs from hnMSCs and characterized them at
morphological, biochemical and biotransformation levels 86,96. However, the collagen coating used
in that protocol was optimized using as coating 0.2 mg/mL of rat-tail collagen diluted in PBS. This
coating, although inducing a more polygonal shape in HLCs (data not shown), did not enable a
homogeneous cell inoculation in the microfluidic device, since the formed gel clogs the channels.
An initial step of coating optimization was performed, using cryopreserved HLCs, to assess which

26
would be the better commercial collagen concentration. 0.1 mg/mL and 0.2 mg/mL were the
concentrations tested, diluted in PBS or 0.1 % acetic acid. HLCs seeded in 0.2 mg /mL of
commercial collagen diluted in acetic acid provided better morphology, maintaining its adherence
until D34 (data not shown). Therefore, this was the coating used in the microfluidic device and on
the maintenance of HLCs’.
III. 2. Different dexamethasone and insulin concentrations do not affect
HLCs’ biotransformation capacity
Our protocol for deriving and culturing HLCs from hnMSCs 86,96 consists in the use DM
(Figure 7) that contains high concentrations of dexamethasone (1 µM) and insulin (1.72 µM).
Indeed, as abovementioned, dexamethasone is a glucocorticoid that induces hepatocyte
maturation, namely phase I metabolic activity 121. However, glucocorticoids may cause insulin
resistance 112 and, therefore, interfere with cell energy metabolism. Being the liver an organ that
controls homeostasis, its cells present functions altered by the surrounding environment. Thus,
to further study the responses of HLCs in terms of energy metabolism, there was the need to
change the medium formulation to closer physiological concentrations by decreasing
dexamethasone and insulin concentrations to 100 nM and 1 nM, respectively, as described by
Estal et al in the culture of primary mouse hepatocytes 115. This medium formulation is referred
as MM (Figure 7). Pascussi et al demonstrated that this range of dexamethasone concentrations
were able to positively control the activation of two nuclear receptors, pregnane X receptor (PXR)
and the constitutive activated receptor (CAR) which in turn activated CYP3A4 transcription 122
yielding the basal expression of CYP3A4 in the absence of xenobiotic inducers, in both MM and
DM.
The influence of the alterations regarding media and collagen coating was evaluated on
HLCs’ morphology, glycogen storage ability, presence of hepatic markers and biotransformation
activity. These assays were performed in HLCs cultured in coated coverslips since HLCs in the
MD would also be in contact with a coated glass cover. D27 and D34 were chosen as time points
for these evaluations because D27 is considered to be the day at which the differentiation process
ends 96 whereas D34, on the other hand, represents maintenance of cells in culture for one week
long.
We observed that in both MM and DM conditions HLCs presented binucleated cells and
a polygonal shape (Figure 10) throughout time in culture, displayed glycogen storage ability
(Figure 11) and the presence of specific hepatic markers such as HNF-4α, ALB, the influx
transporter OATP-C, located on the sinusoidal membrane, the efflux transporter MRP-2, located
on the canalicular/apical membrane, and CK-18 (Figure 12), at D27 and D34, suggesting the
maintenance of hepatic phenotype in culture.
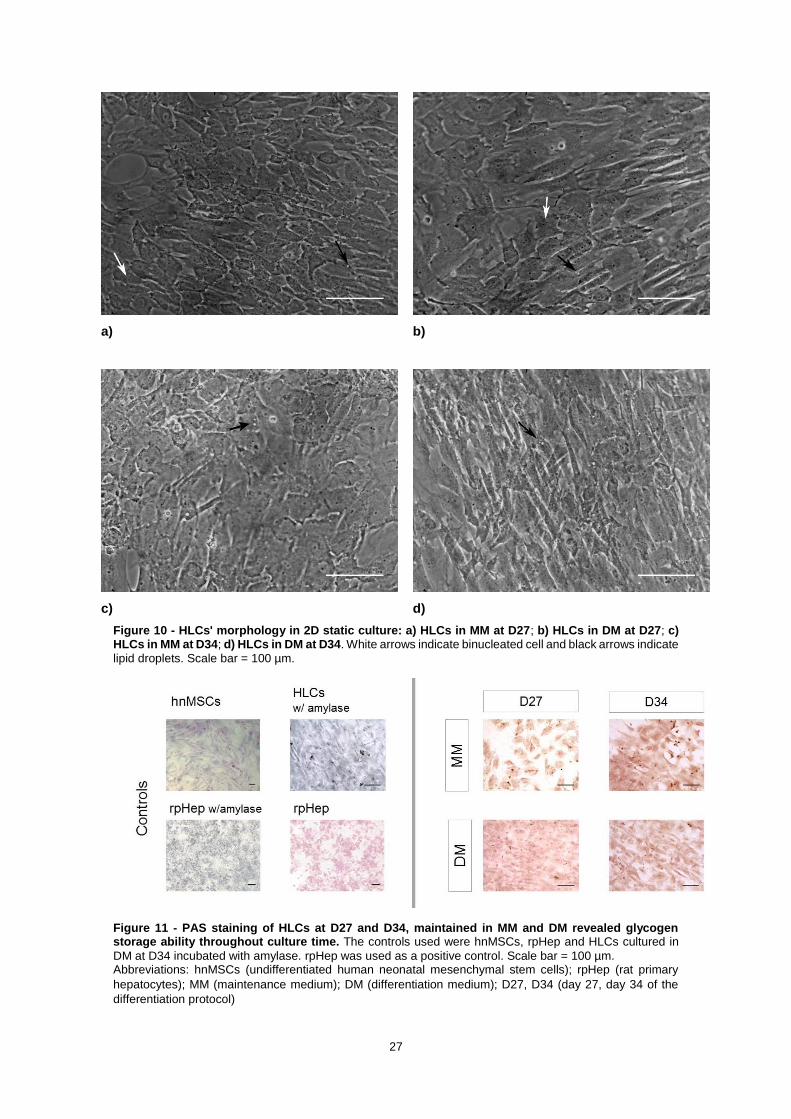
27
a)
b)
c)
d)
Figure 10 - HLCs' morphology in 2D static culture: a) HLCs in MM at D27; b) HLCs in DM at D27; c) HLCs in MM at D34; d) HLCs in DM at D34. White arrows indicate binucleated cell and black arrows indicate
lipid droplets. Scale bar = 100 µm.
Figure 11 - PAS staining of HLCs at D27 and D34, maintained in MM and DM revealed glycogen storage ability throughout culture time. The controls used were hnMSCs, rpHep and HLCs cultured in
DM at D34 incubated with amylase. rpHep was used as a positive control. Scale bar = 100 µm. Abbreviations: hnMSCs (undifferentiated human neonatal mesenchymal stem cells); rpHep (rat primary
hepatocytes); MM (maintenance medium); DM (differentiation medium); D27, D34 (day 27, day 34 of the
differentiation protocol)

28
Figure 12 - Immunocytochemical staining revealed the presence of specific hepatic markers in HLCs: HNF-4α, ALB, OATP-C, MRP2 and CK-18 in HLCs maintained in both media, at D27 and D34. Cell
nuclei were counterstained with DAPI. Scale bar = 50 µm. Abbreviations: MM (maintenance medium); DM (differentiation medium); D27, D34 (day 27, day 34 of the
differentiation protocol); HNF-4α (hepatocyte nuclear factor-4α); ALB (albumin); OATP-C (organic anion-
transporting polypeptide-C); MRP2 (multidrug resistance protein 2); CK-18 (cytokeratin-18).
To assess the effect of the media culture condition on HLCs’ biotransformation
competence, EROD, ECOD and UGTs activities were also tested. hnMSCs were used as a
negative control, in order to verify the maturation process of HLCs, while HepG2, rat primary
hepatocytes and human hepatocytes were used as positive controls, since these are the most
commonly used cell types for hepatic in vitro models.
Extended in vitro hepatocyte cultures are hampered by loss of CYP activity. Hence, phase
I and II reactions were analysed at D27 and D34 of the differentiation protocol in both MM and
DM. EROD activity (Figure 13a), covering CYP1A1/2, showed a slight increase from D27 to D34,
in cells maintained in both MM and DM, although not significant (p > 0.05). When compared to
DM, HLCs in MM presented higher EROD activity in both days (non-significant). Dexamethasone
was shown to decrease CYP1A1 activity in adult human hepatocytes 123 being in accordance with
our results that demonstrated higher EROD activity in HLCs cultured in lower dexamethasone
(MM) than in the DM formulation. In contrast to EROD activity, ECOD assay which covers
CYP2B6/1A2/2E1 activities showed a slight decrease in activity from D27 to D34 (non-significant)
in both media (Figure 13b). At D27, the activity was similar in HLCs in MM and in DM. At D34, the
activity was slightly higher in HLCs maintained in DM, that contains higher concentration of
dexamethasone (non-significant). Indeed, dexamethasone is a known inducer of CYP2B6 124 in
human hepatocytes, suggesting that the higher ECOD activity in DM may be related to the
presence of a higher concentration of this glucocorticoid.

29
Phase II enzymes have important roles in the metabolism of xenobiotics 125. Therefore,
their activity was also studied in HLCs exposed to different concentrations of dexamethasone and
insulin. Herein, UGTs activity was evaluated since most phase II reactions within the human body
are catalysed by these enzymes. Dexamethasone and insulin are known inducers of human
UGTs activity 126. UGTs activity in HLCs showed no significant differences when compared to
human hepatocytes (p > 0.05) in all tested conditions, being always higher than all other controls
(Figure 13c) confirming that HLCs maintained its competence throughout culture time under the
different culture media formulations.
Figure 13 - Effect of culture time and medium composition on Phase I and II activities: a) EROD, b) ECOD and c) UGTs activity. Data is represented as Average ± SEM (n=2-4). Undifferentiated hnMSCs and
HepG2 cell line, rpHeps and cryopreserved hpHep are negative and positive controls, respectively (white bars). *, **, *** Significantly differs among the controls with p < 0.05, p < 0.01 and p < 0.001, respectively. Abbreviations: rpHep (rat primary hepatocytes); hpHep (human primary hepatocytes); hnMSC (undifferentiated human neonatal mesenchymal stem cells); MM (maintenance medium); DM (differentiation medium); D27, D34 (day 27, day 34 of the differentiation protocol); EROD (7-ethoxyresorufin-O-deethylase); ECOD (7-ethoxycoumarin-O-deethylase) ); UGTs (uridine 5’-diphosphate glucuronosyltransferases).
Overall, HLCs’ maintained a hepatic morphology, glycogen storage ability, presence of
hepatic markers and biotransformation activities, in DM and MM, not showing significant
differences. Based on this data, MM was used for further studies since the concentrations of
dexamethasone and insulin are closer to physiological levels and are less probable of interfere
with HLCs’ energy metabolism. In addition, commercial collagen revealed to be adequate in

30
maintaining HLCs in culture and it was the coating used for all the studies performed in the
microfluidic device.
III. 3. Different dexamethasone and insulin concentrations induce altered
gene expression profiles in HLCs
Being the liver an organ that controls homeostasis its cells present functions altered by
the surrounding environment. Liver contributes to glucose homeostasis by providing glucose in
the fasted state and by storing it as glycogen, in the fed state. When glycogen storages are
saturated, the remaining glucose is stored as lipid droplets or secreted as VLDL 2. As previously
observed, HLCs showed formation lipid droplets (Figure 10) and glycogen storage ability (Figure
11). But to understand how HLCs regulate their energy metabolism, we studied the expression of
key genes involved in glycolysis and lipogenesis regulation, gluconeogenesis, lipolysis, fatty acids
metabolism, bile acids metabolism and mitochondrial function and biogenesis in HLCs cultured
in DM and MM, exposed to insulin and glucagon and in SM. The chosen genes are presented in
Figure 14.
Figure 14 - Genes used for energy metabolism study divided by metabolic pathways: glycolysis and lipogenesis, gluconeogenesis, fatty acid metabolism, bile acid metabolism and mitochondrial biogenesis and function.
Abbreviations: PDK4 (pyruvate dehydrogenase kinase 4); SREBP-1C (Sterol regulatory element-binding protein 1-c); CHREBP (Carbohydrate response element binding protein); GLUT1 (glucose transporter 1); PEPCK (phosphoenolpyruvate carboxylase); G6PASE (glucose-6-phosphatase); PPARA (peroxisome proliferator-activated receptor α); CPT1A (carnitine palmitoyltransferase 1 α); ACOX1 (acyl-CoA oxidase 1); FXR (farnesoid X receptor); CYP7A1 (cytochrome P450 enzyme cholesterol 7α-hydroxylase); PGC-1A (peroxisome proliferator γ-activated receptor coactivator 1-α); PGC-1B (Peroxisome proliferator γ-activated receptor coactivator 1-β); ERRA (Estrogen-related receptor α); NRF1 (nuclear respiratory factor 1); CYTC (cytochrome C).
DM and MM have both equal glucose concentrations (25 mM) but the ratios of insulin to
dexamethasone are 1.72 in DM and 0.01 in MM. Therefore, in DM the insulin effect may overlap
dexamethasone effect while the opposite happens in MM. Besides, the concentrations of
dexamethasone and insulin are also higher in DM. Antagonist effects of dexamethasone and
insulin incubation, together with other molecules, with rat hepatocytes in TAG synthesis was

31
previously reported 127, where the presence of both compounds decreased the activity of an
enzyme involved in gluconeogenesis compared with dexamethasone alone.
We studied the gene expression profile of HLCs cultured in MM and DM, in plates, at
different culture time points (D27 and D34) using as a reference HLCs subjected to 8h-fasting at
D34 since this condition has lower glucose concentration (5 mM) and has no dexamethasone or
insulin (Figure 15).
HLCs in DM showed an increased gene expression in all genes tested, except for GLUT1
and ERRA (Figure 15a and e), from D27 to D34, which might be an indicator of HLCs maturation
induced by the dexamethasone and insulin concentrations 80 used in the differentiation protocol.
Indeed, glucose transporter GLUT1 expression decreased from D27 to D34 in both MM and DM
(only significant in DM). This may be explained due to a transition from a foetal phenotype, which
presents higher GLUT1 expression, to a neonatal phenotype, having little expression in neonatal
and adult hepatocytes 128 and HLCs present a similar trend. Regarding, ERRA, this gene
regulates the transition from glycolysis to fatty acid oxidation 129. Possibly, the decrease in its
expression is related to a continued exposure to high concentrations of insulin, which induces
glycolysis and inhibits fatty acid oxidation 2.
In contrast to DM conditions, as expected, when exposed to MM the expression levels of
PEPCK, G6PASE, ACOX1, FXR and NRF1 presented the opposite trend being higher at D27
(Figure 15b, c, d and e).

32
Figure 15 – Gene expression in HLCs throughout culture time in MM and DM regarding a) glycolysis and lipogenesis; b) gluconeogenesis; c) fatty acid metabolism; d) bile acid metabolism and e) mitochondrial biogenesis and function. The graphs represent HLCs’ evolution in MM and DM relative to
8h-fasting at D34. Data is represented as Average ± SEM (n=2-6). *, **, *** Significantly differs from the different media composition and the days of differentiation with p < 0.05, p < 0.01 and p < 0.001, respectively. Abbreviations: D27 (day 27 of the differentiation protocol); D34 (day 34 of the differentiation protocol), MM (maintenance medium), DM (differentiation medium); PDK4 (pyruvate dehydrogenase kinase 4); GLUT1/SLC2A1 (glucose transporter 1/solute carrier family 2 member 1); PEPCK (phosphoenolpyruvate carboxylase); G6PASE (glucose-6-phosphatase); PPARA (peroxisome proliferator-activated receptor α); CPT1A (carnitine palmitoyltransferase 1 α); ACOX1 (acyl-CoA oxidase 1); FXR (farnesoid X receptor); CYP7A1 (cytochrome P450 enzyme cholesterol 7α-hydroxylase); PGC-1A (peroxisome proliferator γ-activated receptor coactivator 1-α); PGC-1B (peroxisome proliferator γ-activated receptor coactivator 1-β); ERRA (estrogen-related receptor α); NRF1 (nuclear respiratory factor 1); CYTC (cytochrome C).
These results suggested that DM was more adequate for enhancing HLCs’ metabolic
characteristics during culture time, by inducing a continued maturation. However, for the purpose
of studying cells adaptation to fasting and/or the response to insulin and glucagon exposure, a

33
lower gene expression profile, as the one observed in HLCs in MM may allow observing cells
adaptation to fasting and/or the response to insulin and glucagon exposure. Therefore, this
condition was used in the fasting adaptation (section III. 4) and insulin and glucagon studies
(section III. 5).
III. 4. HLCs adapt their response to fasting
Liver needs to adapt its metabolism to face changes in nutrient availability. Particularly,
in starvation, liver is able to provide fuel substrates to the rest of the organism. Thus, to possibly
establish a relevant hepatic in vitro model for energy metabolism studies, HLCs were subjected
to fasting.
HLCs at D34 presented metabolic responses more similar to the expected than HLCs in
earlier stages of development (data not shown). This observation further suggested that the
decrease in gene expression throughout time in HLCs cultured in MM allowed the observation of
energy metabolism responses while, in parallel, HLCs display a more mature phenotype.
Therefore, energy metabolism studies (response to fasting and to insulin and glucagon stimuli)
were performed at D34. Hence, the adaptation of HLCs to fasting 130 was studied by evaluating
gene expression of specific genes in HLCs subjected to starvation for a period of 8 and 10 hours
relative to HLCs cultured in MM at D34 in order to study the effect of 25 mM of glucose (in MM)
and 5 mM of glucose (in SM) on the expression levels of the same genes tested above.
Glucose oxidation through glycolysis is downregulated due to the lack of this substrate
during starvation. In our experimental conditions, 8 hours of fasting presented higher expression
of PDK4 than 10 hours of fasting (p < 0.001) (Figure 16a), which may be explained by a time
course of events leading to glucose homeostasis, in which in a first moment PDK4 is induced and
downregulated afterwards. In fact, in an in vivo study by Palou et al, fasting rat revealed a peak
in PDK4 expression at 8 hours of fasting, showing a subsequent decrease 131. Moreover, SREBP-
1C and CHREBP1 induce lipogenesis 2 and upon fasting, it was strongly downregulated (Figure
16a). This is expected since starvation demands the use of fuel substrates and not energy
storage. In addition, glucose activates CHREBP1 transcription 132 and under the condition herein
evaluated, this substrate is lacking. GLUT1 was shown to be upregulated in rat hepatocytes in
both fasting and diabetes 133. However, in HLCs, GLUT1 was downregulated after 8 hours and
maintained its expression, relative to MM, after 10 hours of fasting. Thus, GLUT1 presented an
increase in its expression from 8 to 10 hours of fasting (Figure 16a), suggesting that the expected
gene upregulation might be seen if HLCs were submitted to a longer fasting period.
When glycolysis is downregulated, pyruvate can then be directed to gluconeogenesis,
due to the need for glucose 2. Similarly, as expected, PEPCK was markedly induced (p < 0.05)
after 10 hours of fasting, since this condition induces gluconeogenesis 2 in response to the lack
of fuel substrates (Figure 16b). G6PASE approximately maintained its expression after 10 hours
of fasting (Figure 16b). However, after 8 hours of fasting, both PEPCK and G6PASE showed a
slight decrease in expression compared to MM (non-significant). In fact, MM contains
dexamethasone and as a glucocorticoid, it induces gluconeogenesis 23. The effect of the

34
dexamethasone may overlap the duration of starvation and gluconeogenesis is possibly more
induced in MM than after 8 hours of fasting. On the other hand, the effect of 10 hours of fasting
caused HLCs to strongly activate gluconeogenesis, suggested by the induced expression of
PEPCK.
Alternatively to gluconeogenesis, when glycolysis is downregulated due to PDK4
upregulation 18 a switch from glucose to fatty acids utilization 134 may also occur, inducing PPARA.
However, in HLCs, PPARA and ACOX1 were not induced upon starvation (Figure 16c), but
instead a decrease in its expression from 8 to 10 hours of fasting was observed. CPT1A, as a
target of PPARA 2, was progressively induced with increasing duration of fasting (Figure 16 c). A
similar trend was observed in fasting rats where CPT1A expression increased from 8 to 24 hours
of fasting 131. In addition, in the same study, PPARA expression had a peak after 4 hours,
decreasing afterwards while ACOX1 presented an increasing trend 131. These observations
suggest that, in HLCs, PPARA might have been induced some time before 8 hours of fasting and
that it caused CPT1A upregulation, as a cascade of events downstream. Therefore, it would be
interesting to evaluate, in future studies, other time points of fasting in order to observe the
evolution of PPARA. Regarding ACOX1, the trend in rat livers and in HLCs was contrasting,
suggesting that in HLCs, ACOX1 upregulation may have occurred in an anterior time point.

35
Figure 16 – HLCs’ adaptive response to fasting at D34. Gene expression of specific genes of a) glycolysis and lipogenesis, b) gluconeogenesis, c) fatty acid metabolism, d) bile acid metabolism and e) mitochondrial biogenesis and function. The graphs represent the fold induction regarding gene
expression of HLCs in response to 8h- and 10-fasting relative to MM. Grid lines represent fold induction equal to 0.8 and 1.2. Data is represented as Average ± SEM (n=2-6). *, **, *** Significantly differs from the different media composition and the days of differentiation with p < 0.05, p < 0.01 and p < 0.001, respectively. #, ##, ### Significantly induced or repressed expression with p < 0.05, p < 0.01 and p < 0.001, respectively. Abbreviations: PDK4 (pyruvate dehydrogenase kinase 4); SREBP-1C (sterol regulatory element-binding protein 1-c); CHREBP1 (carbohydrate response element binding protein); GLUT1/SLC2A1 (glucose transporter 1/solute carrier family 2 member 1); PEPCK (phosphoenolpyruvate carboxylase); G6PASE (glucose-6-phosphatase); PPARA (peroxisome proliferator-activated receptor α); CPT1A (carnitine palmitoyltransferase 1 α); ACOX1 (acyl-CoA oxidase 1); FXR (farnesoid X receptor); CYP7A1 (cytochrome P450 enzyme cholesterol 7α-hydroxylase); PGC-1A (peroxisome proliferator γ-activated receptor coactivator 1-α); PGC-1B (Peroxisome proliferator γ-activated receptor coactivator 1-β); ERRA (estrogen-related receptor α); NRF1 (nuclear respiratory factor 1); CYTC (cytochrome C).
Mitochondrial biogenesis was also evaluated in fasting conditions. PGC-1A was
upregulated upon starvation, having its expression higher after 10 hours of starvation compared

36
to 8 hours of starvation (p < 0.01) (Figure 16e). This upregulation was in line with previously
reported in mice 23. PGC-1α induces gluconeogenesis and β oxidation. Upon starvation, HLCs
showed an activation of both pathways, more relevant in gluconeogenesis, through upregulation
of PEPCK, suggesting that the regulation by PGC-1α also occurs in these cells. CYP7A1 (bile
acid metabolism) was upregulated in fasting (p < 0.05) (Figure 16d), which may be related to
PGC-1A activation 135. Our results are in accordance with the reported CYP7A1 activation in livers
of fasted mice 135, augmenting the synthesis of bile acids. PGC-1A upregulation upon fasting
allows to infer that it may influence CYP7A1 expression. The decrease of CYP7A1 expression
with time suggests that this gene follows the same trend of PDK4 and CPT1A. A sequence of
events downstream takes place and the expression is progressively decreased. On the other
hand, contrary to reported 40,41, FXR (bile acid metabolism) was not induced by PGC-1α in HLCs
(Figure 16e), upon fasting. FXR senses bile acids and between 8 and 10 hours of fasting, bile
acid synthesis was induced through CYP7A1 activation. Nevertheless, beyond a certain pool size
of bile acids, their synthesis is inhibited due to cytotoxic effects 37. Thus, a longer fasting time
would possibly result in FXR upregulation. PGC-1β is related to mitochondrial biogenesis and
function 136. Opposing to PGC-1A, PGC-1B in fasted rats and mice showed no alteration in its
expression when compared to the fed state 136. Our results for HLCs showed a downregulation of
this gene after 8 hours of fasting (p < 0.05), followed by an increase in expression (p < 0.05),
maintaining it approximately equal to the one presented in MM after 10 hours of fasting (Figure
16e). PGC-1β is related to lipogenesis 31 and upon fasting, there is a lack of substrates to be used
in this pathway, thus explaining the observed downregulation. Due to its widespread tissue
distribution, PGC-1β may fulfil other functions necessary for the basal cell energy requirements
and these results may not be fully explained just by the response to fasting 136. Estrogen-related
receptor α (ERRα) is a nuclear receptor and its functions are related with mitochondrial function.
ERRα null mice showed decreased expression of genes coding for fatty acid oxidation enzymes
and oxidative phosphorylation components 137. A study in mice by Herzog et al revealed that
ERRα interacts with PEPCK promoter, thus inhibiting gluconeogenesis 137. Our results showed
that ERRA was downregulated (non-significant), presenting approximately the same level of
expression, after 8 and 10 hours of fasting (Figure 16e). This downregulation accompanied by an
induction of gluconeogenesis in HLCs, possibly suggests that ERRα was not activated in order to
gluconeogenesis occur as a source of energy. In addition, ERRα is reported to induce expression
of genes related to mitochondrial biogenesis, such as nuclear respiratory factor 1 (NRF1), and
respiratory chain cytochrome C (CYTC) 137. However, not much is known about the metabolic
regulation of these two genes. Nevertheless, NRF1 and CYTC were downregulated upon fasting
in HLCs (non-significant) (Figure 16e), possibly due to the lack of induction of ERRα.
Based on these results, we observed that all the genes tested regarding glycolysis,
gluconeogenesis, bile acid metabolism and mitochondrial function respond as expected, except
for G6PASE, although showing the expected increasing trend. We could conclude that the
pathway that better responded to starvation in HLCs is gluconeogenesis (namely PEPCK and
PGC-1A which is also involved), which is actually the first pathway to respond in this condition 14.
37
In addition, the differentiation protocol is characterized by high concentrations of glucose in the
medium. The marked responses in genes regarding gluconeogenesis in HLCs correlates with
what happens during the gestation period of several animals, including humans. The mother, in
a well fed state, provides glucose and the foetus does not have the need of producing it. However,
fasting mothers can induce premature foetal gluconeogenesis 138. Genes related to fatty acid
metabolism may not present the expected physiological responses, because we only considered
8 and 10 hours of fasting. As suggested by genes expression throughout time, we may be missing
upregulations. Metabolic pathways are regulated by a cascade of events occurring in different
time points. For genes involved in gluconeogenesis regulation, this window of time is adequate
whereas fatty acid metabolism and bile acid metabolism may demand earlier and later time points,
respectively.

38
III. 5. HLCs respond to insulin and glucagon exposure
In addition to adapt their functions to starvation, hepatocytes are expected to stimulate or
inhibit genes controlling glucose metabolism when exposed to insulin or glucagon. In order to
further validate HLCs’ regarding energy metabolism competence, cell response to an insulin or
glucagon stimuli was evaluated. Herein, the effect of insulin and glucagon was evaluated under
SM (5 mM glucose) in cells that were maintained in MM. Human primary hepatocytes maintained
in the same culture conditions were used as controls. Table 1 presents the expected responses
of each of the genes and the response of HLCs and primary human hepatocytes.
HLCs Primary Hepatocytes Expected Response
Insulin Glucagon Insulin Glucagon Insulin Glucagon
Glycolysis
PDK4 Down Up No change No change Down Up
SREBP-1C No
change Up Down No change Up Down
CHREBP1 Down No
change Up No change Up Down
Gluconeogenesis PEPCK Down Up No change No change Down Up
G6PASE Down Up No change No change Down Up
Fatty acid
metabolism
PPARA Down No
change No change No change Down Up
CPT1Α No
change
No
change No change No change Down Up
ACOX1 No
change
No
change No change No change Down Up
Bile acid
metabolism
FXR Down No
change No change No change Down Up
CYP7A1 Down No
change Down No change Down Up
SHP No
change
No
change Down No change Down Up
BSEP Down Up No change No change Down Up
Mitochondrial
function and
biogenesis
PGC-1Α Down No
change No change Up Down Up
PGC-1Β Up No
change Up No change Unknown Unknown
ERRΑ No
change
No
change Down No change Unknown Unknown
NRF1 Down Up No change No change Unknown Unknown
CYTC Down No
change No change Up Unknown Unknown
Table 1 - Response to insulin and glucagon: overview of HLCs and primary hepatocytes significant response compared to the expected response in literature. ”Up” indicates upregulation and “Down”
indicates downregulation. Green is associated with responses similar to that of primary hepatocytes or to the expected, yellow is associated to genes that presented responses similar to that of primary hepatocytes but was not the expected response and red is associated to the genes that did not respond to the expected in both HLCs and primary hepatocytes.

39
Physiologically, under high glucose concentrations, insulin is released, while glucagon is
released in low glucose concentrations. As mentioned earlier, insulin stimulates glycolysis and
lipogenesis 2. In this work, both HLCs and human hepatocytes when incubated with insulin,
inhibited PDK4 (glycolysis) expression (Figure 17a), indicating increased pyruvate consumption
and glycolysis 2, although only significant in HLCs (p < 0.001). The opposite response was
observed when cells were exposed to glucagon where pyruvate is used to produce energy
through catabolic reactions 134 (Figure 17a). On the other hand, CHREBP1 (lipogenesis pathway)
was downregulated in response to insulin (p < 0.05) while GLUT1 (glycolysis pathway) maintained
its expression in HLCs (Figure 17a). Moreover, SREBP-1C (lipogenesis pathway) was
downregulated (p < 0.05) in the positive control, i.e., human hepatocytes. In fact, SREBP-1c
belongs to a family of transcription factors involved in fatty acid synthesis that are positively
controlled by insulin 139. This gene is activated when senses elevated cholesterol concentration
140. However, in our experimental conditions, the medium did not contain cholesterol, which can
explain why the expression of SREBP-1C was inhibited. In addition, 8 hours of insulin exposure
may not be adequate to observe the expected upregulation, as mentioned above. Indeed, insulin
stimulation in rat hepatocytes with a duration of 6 hours increased SREBP-1C expression 139,
suggesting that a shorter period of insulin incubation with HLCs would be interesting to study.
ChREBP1, on the other hand, is directly activated by glucose 2, and indirectly by insulin since
insulin induces lipogenesis. CHREBP1 was upregulated in primary hepatocytes (p < 0.05) and
downregulated in HLCs (p < 0.05) (Figure 17a) but other mechanisms may induce synergistically
the expression of CHREBP1 towards lipogenesis. Finally, glucose transporter GLUT2 was only
detected in primary hepatocytes, maintaining its expression when exposed to insulin and
glucagon (Figure 17a). Rat hepatocytes demonstrated a transient inhibitory insulin effect on
GLUT2 141 and its expression was decreased after a 24-hour incubation. GLUT2 has a high KM
for glucose (15-20 mM) 14. Therefore, after meals, GLUT2 is upregulated for the uptake of glucose
and storage 14. Insulin is suggested to act synergistically with glucose abundance in an early
period upregulating it and afterwards, by an unknown mechanism of autoregulation, GLUT2
expression is decreased to basal levels 141. We can infer that glucagon, acting in a fasted state
by promoting glucose, has a similar effect. Firstly, it upregulates GLUT2 in order to remove
glucose, produced through gluconeogenesis, from hepatocytes and its expression is then
decreased to basal levels. However, the expected responses of this glucose transporter may not
have been observed due to low glucose concentration in the media. In HLCs, the upregulation of
gluconeogenic genes in response to glucagon (Figure 17b) and the inexistent expression of
GLUT2 could possibly explain the upregulation of GLUT1 (p < 0.001), suggesting that the latter
is used for glucose output, in accordance with previous observations 2.
Gluconeogenesis is upregulated by glucagon in order to produce glucose for extrahepatic
tissues, after glycogen depletioned 2. Therefore, as expected, PEPCK and G6PASE were
upregulated when medium contained glucagon and downregulated in response to insulin, in both
HLCs and primary hepatocytes (Figure 17b). Moreover, HLCs presented more marked changes
in gluconeogenic genes than human hepatocytes, being more downregulated (p < 0.05 for

40
PEPCK and p < 0.001 for G6PASE) or upregulated (p < 0.001 for both genes) when incubated
with insulin and glucagon, respectively. This may be due to high glucose concentration of the
medium of the differentiation protocol. On the other hand, hepatocytes have other energy
substrates since they present more lipid droplets than HLCs and its constituents can be directed
to β oxidation 142. Furthermore, β oxidation is mainly developed after birth in response to a change
from a high-carbohydrate and low-fat diet to a high-fat and low-carbohydrate diet 138. Thus,
glucose may constitute a stimulus to the development of HLCs’ pathways related to glucose
homeostasis, in particular, gluconeogenesis. Regarding starvation, PEPCK had an increased
upregulation with the course of time and G6PASE had an increased expression when compared
to MM, although the latter was not upregulated (Figure 16b). This result suggests that glucagon
is an important regulator of the G6PASE expression, which is not only induced by fasting.
Figure 17 – Gene expression in HLCs in response to insulin and glucagon regarding a) glycolysis and lipogenesis and b) gluconeogenesis. Grid lines represent fold induction equal to 0.8 and 1.2. Data is
represented as Average ± SEM (n=2-6). *, **, *** Significantly differs from the different media composition and the days of differentiation with p < 0.05, p < 0.01 and p < 0.001, respectively. #, ##, ### Significantly induced or repressed expression with p < 0.05, p < 0.01 and p < 0.001, respectively. Abbreviations: HLCs (hepatocyte-like cells); hpHep (human cryopreserved hepatocytes); PDK4 (pyruvate dehydrogenase kinase 4); SREBP-1C (sterol regulatory element-binding protein 1-c); CHREBP1 (carbohydrate response element binding protein); GLUT1/SLC2A1 (glucose transporter 1/solute carrier family 2 member 1); GLUT2/SLC2A2 (glucose transporter 2/solute carrier family 2 member 2); PEPCK (phosphoenolpyruvate carboxylase); G6PASE (glucose-6-phosphatase).
The oxidation of fatty acids is downregulated by insulin and stimulated by glucagon 27 to
obtain energy and PPARα promotes β oxidation 2. Longuet et al reported that glucagon signalling
activates a PPARα-dependent cascade of events, enhancing fatty acid oxidation in mice 130. This

41
nuclear receptor targets ACOX1, the rate-limiting enzyme of the partial oxidation of LCFAs in
peroxisomes and CPT1A 33. PPARA was downregulated, in HLCs, in response to insulin (p <
0.05) and upregulated upon glucagon treatment in HLCs and human hepatocytes (non-
significant) (Figure 18a). However, in HLCs just PPARA was responsive while target genes of
PPARα did not show different responses to insulin or glucagon (Figure 18a). This may indicate
that this pathway is not fully developed in HLCs. In fact, hepatocytes isolated from guinea pig
were able to oxidize fatty acids only 12 hours after birth 143. The lack of fatty acids in the medium
could also be the reason why the genes related to fatty acids metabolism do not present the
excepted expression. Interestingly, PPARA expression of HLCs that were subjected to starvation
was downregulated (Figure 16d), suggesting that glucagon regulates its expression.
Regarding bile acids metabolism, insulin downregulated FXR in both HLCs (p < 0.05) and
human hepatocytes (non-significant) while glucagon resulted in its upregulation (non-significant)
(Figure 18b). The downregulation of FXR induced by insulin is in line with previously reported in
rat hepatocytes cultured in low glucose concentrations (5 mM) 38. Small heterodimer partner
(SHP) is a target of FXR 38 (Figure 6), being involved in the inhibition of cholesterol conversion to
bile acids. Since FXR was downregulated by insulin, we may infer that SHP expression will not
be induced, as observed (Figure 18b). CYP7A1 was also downregulated in HLCs (p < 0.01) and
primary hepatocytes (p < 0.05) during prolonged exposure to insulin (Figure 18b), which is in
accordance with previous observations 39. However, SHP and CYP7A1 expression had no
differences when cells were incubated with glucagon. FXR positively regulates bile salt export
pump (BSEP), excreting bile acids from the hepatocytes into bile canaliculus 15. BSEP was
downregulated when human hepatocytes were exposed to insulin and glucagon (Figure 18b).
However, in HLCs, BSEP was upregulated in response to glucagon, possibly due to induction by
FXR. We may infer that the expected responses were not observed may be due to the lack of
cholesterol and bile acids in the medium 144. CYP7A1 synthesizes bile acids from cholesterol and
since this substrate was not available in culture, this enzyme may not be expressed because it is
not necessary. Glucagon induced different responses in FXR and CYP7A1, when compared to
fasting. Several papers suggest that FXR upregulation occurs through the action of PGC-1α upon
fasting 40,41. However, in HLCs, FXR was upregulated by glucagon but it was downregulated when
HLCs were in fasting conditions (Figure 16d). Based on this observation, glucagon may have
additional mechanisms for the regulation of FXR.
PGC-1α is a regulator of mitochondrial biogenesis 145. In both HLCs and hepatocytes,
glucagon treatment caused PGC-1A upregulation (p < 0.05 for hepatocytes) whereas insulin
repressed it (p < 0.05 for HLCs) (Figure 18c) as expected 17. PGC-1α is also a transcription factor
relevant for the regulation of liver metabolism in several ways 2 co-activating genes regarding
gluconeogenesis (PEPCK and G6PASE) 15. Therefore, by downregulating PGC-1A, insulin
inhibits gluconeogenesis, which is not needed since this hormone is released in well fed
situations. PGC-1A was upregulated in fasting conditions, as well (Figure 16e). PGC-1β is related
to lipogenesis, among other mitochondrial functions 31. In response to insulin, both HLCs (p <
0.01) and hepatocytes (p < 0.001) presented PGC-1B upregulation (Figure 18c). The

42
physiological response of PGC-1β to hormonal signalling has not yet been clarified. However,
since insulin also induces lipogenesis, this may be a possible response. On the other hand,
glucagon caused a decrease in the upregulation of PGC-1B (Figure 18c), allowing to infer that a
longer incubation with this hormone would induce a downregulation, which would be expected
since lipogenesis is repressed by glucagon 130. Upon fasting, this gene was downregulated,
although with an increasing trend (Figure 16e). Due to the involvement in several mitochondrial
functions and wide tissue distribution, it is difficult to explain what should be its role in metabolism
homeostasis 136. Regarding the remaining genes related to mitochondrial function, ERRA, NRF1
and CYTC were mostly downregulated by insulin (Figure 18c). ERRα was shown to repress
gluconeogenesis 146, which might explain the strong repression shown by human hepatocytes. In
HLCs, ERRA essentially presented the same level of expression in response to glucagon and
insulin (Figure 18c). Glucagon mostly induced an increase in expression of these genes when
compared to insulin (Figure 18c). PGC-1α was reported to have stimulatory effects in ERRα, Nrf1
and CytC 147. Therefore, the trend presented in gene expression may reveal a possible
upregulation if the incubation time with glucagon would be longer. The response of this set of
genes to glucagon contrasts with their response to fasting (Figure 16e), in which they were mainly
inhibited. Thus, it is difficult to conclude what would occur in a physiological context, which is a
combination of the two studied conditions: decrease of the levels of glucose (fasting condition)
and release of glucagon (glucagon response).
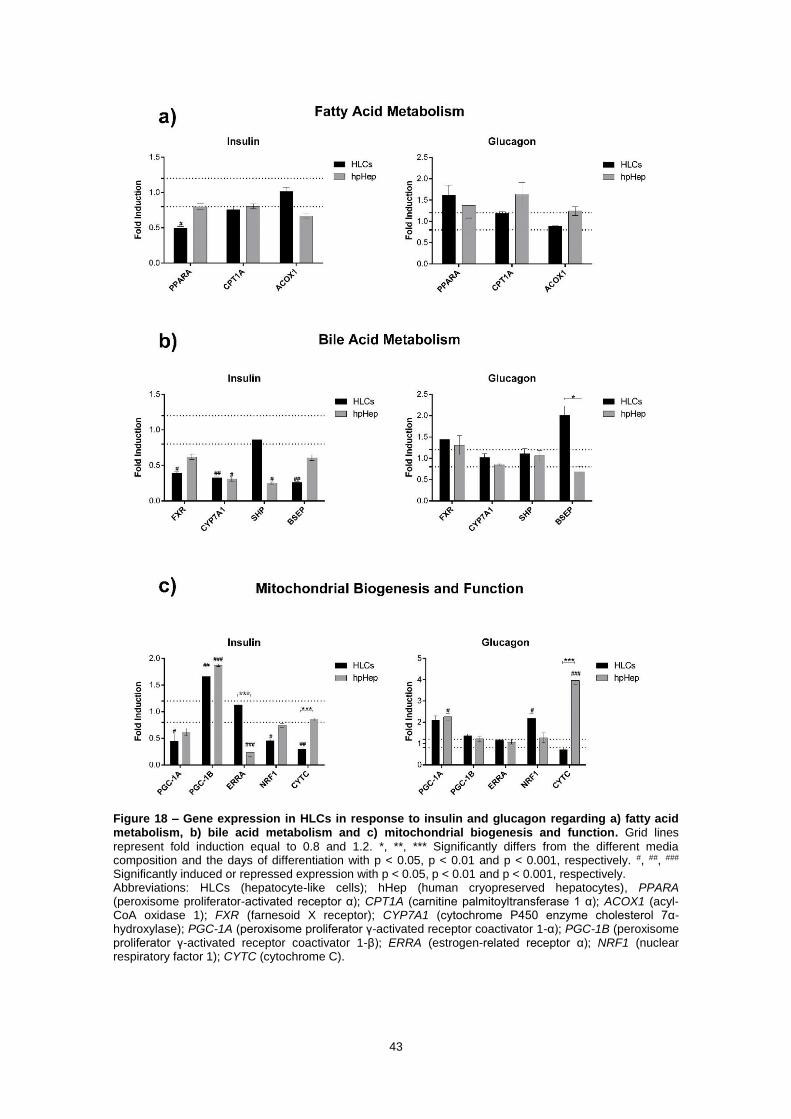
43
Figure 18 – Gene expression in HLCs in response to insulin and glucagon regarding a) fatty acid metabolism, b) bile acid metabolism and c) mitochondrial biogenesis and function. Grid lines
represent fold induction equal to 0.8 and 1.2. *, **, *** Significantly differs from the different media composition and the days of differentiation with p < 0.05, p < 0.01 and p < 0.001, respectively. #, ##, ### Significantly induced or repressed expression with p < 0.05, p < 0.01 and p < 0.001, respectively. Abbreviations: HLCs (hepatocyte-like cells); hHep (human cryopreserved hepatocytes), PPARA (peroxisome proliferator-activated receptor α); CPT1A (carnitine palmitoyltransferase 1 α); ACOX1 (acyl-CoA oxidase 1); FXR (farnesoid X receptor); CYP7A1 (cytochrome P450 enzyme cholesterol 7α-hydroxylase); PGC-1A (peroxisome proliferator γ-activated receptor coactivator 1-α); PGC-1B (peroxisome proliferator γ-activated receptor coactivator 1-β); ERRA (estrogen-related receptor α); NRF1 (nuclear respiratory factor 1); CYTC (cytochrome C).

44
In sum, gluconeogenesis is the pathway where HLCs presented more accentuated and
expected responses, compared with human hepatocytes. Glucose is a medium component
present in high concentrations during all the differentiation process. Therefore, this biomolecule
possibly stimulates pathways that regulate its use. In addition, genes upregulating
gluconeogenesis are functional in foetuses if the mother is submitted to fasting 138, suggesting
the early development of this pathway. PDK4, which is related to glycolysis, also showed
significant downregulation and upregulation when HLCs were exposed to insulin and glucagon,
respectively. Considering fatty acid oxidation, in HLCs just PPARA was responsive, being
downregulated when exposed to insulin. Genes downstream may show a downregulating trend if
the exposure to insulin was prolonged. Genes regarding bile acid metabolism responded to insulin
stimuli but did not show significant responses to glucagon, except for BSEP, suggesting the need
for optimization of hormone concentration or time incubation. PGC-1α induces gluconeogenesis
gene expression and interacts with PPARα, activating fatty acid oxidation 148 and is a co-activator
of FXR, inhibiting bile acid synthesis. Our results showed that when PGC-1Α was upregulated,
these genes were also. Godoy et al demonstrated that including bile salts in hepatocytes culture
increased expression of mature liver function genes (e. g. BSEP) 144.
Thus, it would be interesting to use a medium containing biomolecules frequently in
contact with hepatocytes such as fatty acids, cholesterol and bile acids and adapt their
concentration to the one found in fasted and fed states. Incubation with these compounds might
produce different responses, possibly bringing this model closer to an in vivo situation.

45
III. 6. HLCs can be maintained up to two weeks in the microfluidic device
The results obtained above suggest a dual effect of MM and DM in HLCs’ culture. MM
enables the observation of responses related to energy metabolism homeostasis, by lowering
gene expression, while DM induces a more mature phenotype in HLCs. In addition, it was noticed
that HLCs were responsive to insulin and glucagon and adapted their metabolism to fasting,
demonstrating their competence for energy metabolism studies. Moreover, HLCs cultured in
coverslips coated with commercial type I collagen maintained their phenotype, biotransformation
activity, glycogen storage ability and presence of hepatic markers throughout time in culture.
Therefore, we proceeded to adapt HLCs to the microfluidic device (MD).
HLCs were inoculated at D17. After 20 minutes, they started to adhere to the microfluidic
channel and, after 1 hour, they acquired a polygonal shape (Figure 19).
a)
b)
c)
d)
Figure 19 – HLCs morphology at D17 and the change from a fibroblast-like shape to a polygonal shape throughout the day of inoculation, in the microfluidic device: a) HLCs before trypsinization (scale bar = 500 µm); b) HLCs 20 minutes after device inoculation (scale bar = 500 µm); c) HLCs 1 hour after device inoculation (scale bar = 500 µm); d) HLCs 2 hours after device inoculation (scale bar = 100
µm).
Cell loading at high pressures leads to cell damage and death while low pressures cause
low cell-cell contact, an important feature to be considered 7, especially in hepatocytes. To avoid
such effect, most of the works in this field use a pressure pump that allows a controlled cell loading
(always at the same speed and pressure) and a controlled medium flow. However, this was not
possible in this particular MD. Cells were loaded manually, which may not result in equal pressure
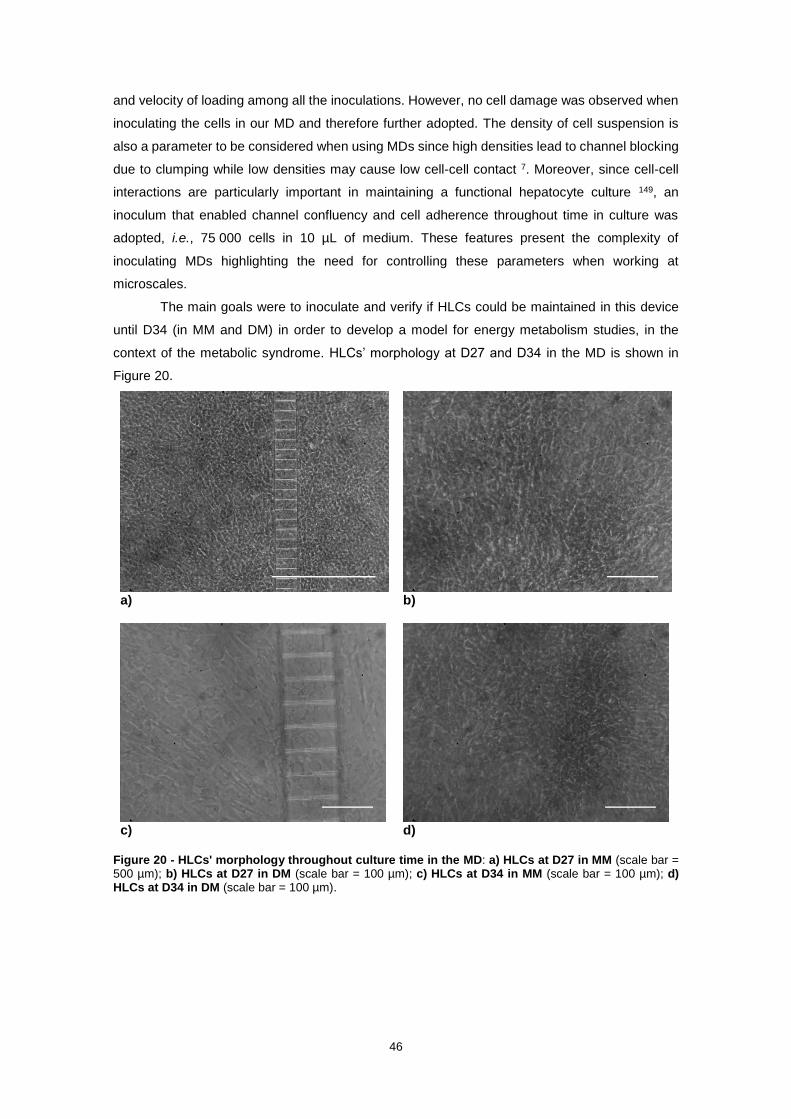
46
and velocity of loading among all the inoculations. However, no cell damage was observed when
inoculating the cells in our MD and therefore further adopted. The density of cell suspension is
also a parameter to be considered when using MDs since high densities lead to channel blocking
due to clumping while low densities may cause low cell-cell contact 7. Moreover, since cell-cell
interactions are particularly important in maintaining a functional hepatocyte culture 149, an
inoculum that enabled channel confluency and cell adherence throughout time in culture was
adopted, i.e., 75 000 cells in 10 µL of medium. These features present the complexity of
inoculating MDs highlighting the need for controlling these parameters when working at
microscales.
The main goals were to inoculate and verify if HLCs could be maintained in this device
until D34 (in MM and DM) in order to develop a model for energy metabolism studies, in the
context of the metabolic syndrome. HLCs’ morphology at D27 and D34 in the MD is shown in
Figure 20.
a)
b)
c)
d)
Figure 20 - HLCs' morphology throughout culture time in the MD: a) HLCs at D27 in MM (scale bar = 500 µm); b) HLCs at D27 in DM (scale bar = 100 µm); c) HLCs at D34 in MM (scale bar = 100 µm); d) HLCs at D34 in DM (scale bar = 100 µm).

47
To assess if HLCs in the microfluidic device maintained their phenotype throughout
culture time, urea and albumin production were quantified, at D27 and D34, in MM and DM. HLCs
cultured in MM showed an increase from D27 to D34 in urea production, while HLCs cultured in
DM showed the opposite trend, although non-significant in both media compositions (Figure 21a).
There are reports that insulin stimulates albumin production in rat liver cells 150 and our results
(Figure 21b) showed that albumin production was higher in DM than in MM, in both days (non-
significant). These data suggests the maintenance of a hepatic phenotype in the MD.
Figure 21 - Effect of culture time on a) urea and b) albumin production in HLCs cultured in the microfluidic device, in MM and DM at D27 and D34, in the microfluidic device. Data is represented as
Average ± SEM (n=4-5). Undifferentiated hnMSCs and HepG2 cell line, rpHep and hpHep are negative and positive controls, respectively (white bars). *, **, *** Significantly differs among the controls with p < 0.05, p < 0.01 and p < 0.001, respectively. Abbreviations: rpHep (rat primary hepatocytes), hpHep (human primary hepatocytes) and hnMSC (undifferentiated human neonatal mesenchymal stem cells), MM (maintenance medium), DM (differentiation medium); D27 (day 27 of the differentiation protocol); D34 (day 34 of the differentiation protocol).
Additionally, in order to further understand the evolution of HLCs’ characteristics
throughout the culture time in the MD, we compared the level of gene expression of D34 relative
to D27 (Figure 22), in MM and DM. The influence of MM and DM in gene expression profile of

48
HLCs cultured in plates was discussed in section III. 3. Thus, the traditional 2D static system was
used as a control in this analysis, allowing to compare gene expression in a novel culture system
(MD) to a culture system extensively used and optimized (considering HLCs’ biotransformation
activity and biochemical characteristics) in this laboratory. However, gene expression analysis of
HLCs cultured in the MD considered a smaller group of genes, namely PDK4, G6PASE, PEPCK,
PPARA, CPT1A, ACOX1, FXR, CYP7A1 and PGC-1A, due to lower sample quantity, since each
microfluidic device has approximately 150 000 cells. Nevertheless, this subset of genes still
includes glycolysis/lipogenesis, gluconeogenesis, fatty acid metabolism, bile acid metabolism and
mitochondrial function and biogenesis.
Regarding MM, we observed a decrease in the level of expression from D27 to D34 in all
the genes tested, in the MD (Figure 22a). Therefore, the MD did not improve maturation when
compared to plates.
In the MD, PEPCK, G6PASE and PGC-1A showed increased expression at D34
compared to D27, when HLCs were maintained in DM (Figure 22b). In particular, G6PASE and
PGC-1A had greater differences (p < 0.001) between the two days when compared to plates.
CYP7A1 expression was not detected in HLCs in the device, at D27.

49
Figure 22 - Gene expression levels in HLCs in the microfluidic device and in plates throughout culture time, in a) MM and b) DM. The graphs represent the fold induction regarding gene expression of
HLCs in MM and DM at D34 relative to D27. Grid lines represent fold induction equal to 0.8 and 1.2. Data is represented as Average ± SEM (n=2-4). *, **, *** Significantly differs from the different media composition and the days of differentiation with p < 0.05, p < 0.01 and p < 0.001, respectively. #, ##, ### Significantly induced or repressed expression with p < 0.05, p < 0.01 and p < 0.001, respectively. Abbreviations: MD (microfluidic device); MM (maintenance medium); DM (differentiation medium); PDK4 (pyruvate dehydrogenase kinase 4); PEPCK (phosphoenolpyruvate carboxylase); G6PASE (glucose-6-phosphatase); PPARA (peroxisome proliferator-activated receptor α); CPT1A (carnitine palmitoyltransferase 1 α); ACOX1 (acyl-CoA oxidase 1); FXR (farnesoid X receptor); CYP7A1 (cytochrome P450 enzyme cholesterol 7α-hydroxylase); PGC-1A (peroxisome proliferator γ-activated receptor coactivator 1-α).
These data suggest that HLCs present different characteristics when cultured in MD or in
standard static 2D cultures. Indeed, in the MD, medium flow is promoted, creating conditions more
similar to what happens in vivo. Moreover, HLCs were seeded in the MD at a much higher
inoculum (450 000 cells/cm2 in the MD and 30 000 cells/cm2 in plates). These observations,
further highlight the differences between the two culture systems.
As a mean to analyse the differences between these two culture systems, we further
compared expression levels of the genes studied above of HLCs cultured in the MD relative to
the gene expression of HLCs cultured in plates in MM or in DM (Figure 23), in both days.
HLCs in MM presented higher expression of all the genes, in the MD than in plates, at
D27 (Figure 23a). However, at D34, PGC-1A continued to show significantly higher expression in
the MD (p < 0.001) (Figure 23a). PDK4, PEPCK, G6PASE were also higher expressed at D34 in

50
the MD than in plates, although not significant. As observed above, CYP7A1 was not detected at
D27 in MM, in MD.
On the other hand, PDK4 and CPT1A had higher expression in MD than in plates, in both
days, when in DM (Figure 23b), although only significant for PDK4 at D27 (p < 0.01). However,
at D34, the difference in expression between MD and plates decreased. The remaining genes
had similar expression in both days, in plates and in MD. CYP7A1 at D27 was not detected in MD
but it was detected in plates, suggesting a possible need for longer adaption of HLCs to the MD.
Figure 23 - Gene expression levels in HLCs (D27 and D34) in the microfluidic device relative to plates in a) MM and b) DM, in both days. The graphs represent the fold induction regarding gene expression of
HLCs cultured in MD relative to plates. Grid lines represent fold induction equal to 0.8 and 1.2. Data is represented as Average ± SEM (n=2-4). *, **, *** Significantly differs from the different media composition and the days of differentiation with p < 0.05, p < 0.01 and p < 0.001, respectively. #, ##, ### Significantly induced or repressed expression with p < 0.05, p < 0.01 and p < 0.001, respectively. Abbreviations: MD (microfluidic device); MM (maintenance medium); DM (differentiation medium); PDK4 (pyruvate dehydrogenase kinase 4); PEPCK (phosphoenolpyruvate carboxylase); G6PASE (glucose-6-phosphatase); PPARA (peroxisome proliferator-activated receptor α); CPT1A (carnitine palmitoyltransferase 1 α); ACOX1 (acyl-CoA oxidase 1); FXR (farnesoid X receptor); CYP7A1 (cytochrome P450 enzyme cholesterol 7α-hydroxylase); PGC-1A (peroxisome proliferator γ-activated receptor coactivator 1-α).
Finally, to compare the effect between the medium used to maintain HLCs for energy
metabolism studies with the medium used in the differentiation protocol, gene expression of HLCs
cultured in MM relative to gene expression of HLCs in DM was evaluated in the MD and plates,
in both days (Figure 24).

51
At D27, we observed that all the considered genes presented higher expression in MM
compared to DM in the MD, namely PEPCK (p < 0.001), G6PASE (p < 0.001), CPT1A (p < 0.01),
ACOX1 (p < 0.01), PGC-1A (p < 0.001) (Figure 24a). Moreover, these genes and PPARA
significantly differ in its expression in the MD when compared to plates. At D34, genes related to
gluconeogenesis, G6PASE, PEPCK and PGC-1A, continued to be significantly more expressed
in the MD (p < 0.001) while this set of genes was strongly repressed in plates (p < 0.01) (Figure
24b). This observation was possibly due to higher influence of dexamethasone relative to insulin
in MM, inducing gluconeogenesis 23, since the ratio of insulin to dexamethasone is 0.01 in this
medium condition.
Figure 24 - Gene expression levels in HLCs cultured in the microfluidic device or in 2D static cultures in a) D27 and b) D34. Fold induction of gene expression in HLCs cultured in MM relative to HLCs cultured
in DM. Grid lines represent fold induction equal to 0.8 and 1.2. Data is represented as Average ± SEM (n=2-4). *, **, *** Significantly differs from the different media composition and the days of differentiation with p < 0.05, p < 0.01 and p < 0.001, respectively. #, ##, ### Significantly induced or repressed expression with p < 0.05, p < 0.01 and p < 0.001, respectively. Abbreviations: MD (microfluidic device); MM (maintenance medium); DM (differentiation medium); PDK4 (pyruvate dehydrogenase kinase 4); PEPCK (phosphoenolpyruvate carboxylase); G6PASE (glucose-6-phosphatase); PPARA (peroxisome proliferator-activated receptor α); CPT1A (carnitine palmitoyltransferase 1 α); ACOX1 (acyl-CoA oxidase 1); FXR (farnesoid X receptor); CYP7A1 (cytochrome P450 enzyme cholesterol 7α-hydroxylase); PGC-1A (peroxisome proliferator γ-activated receptor coactivator 1-α).

52
In summary, some important conclusions can be taken regarding cell culture in this MD:
1. Cell characteristics throughout time in the MD - MM induced higher gene expression at
D27, in all genes tested while in plates PDK4, PPARA, CPT1A and PGC1-A were higher
expressed at D34. On the other hand, HLCs in DM maintained or enhanced expression
of all genes at D34, except for PDK4, CPT1A and ACOX1, while in plates, all genes were
higher expressed at D34;
2. MD vs static 2D cultures – regarding MM, gene expression in MD at D27 was greater in
all genes tested than in plates and at D34, PDK4, PEPCK, G6PASE and PGC-1A (p <
0.001) continued to have greater expression in the MD. On the other hand, at D27, DM
induced greater expression in PDK4 (p < 0.001), CPT1A (non-significant) and ACOX1
(non-significant) in the MD while at D34, just PDK4 and CPT1A continued to have higher
expression in the MD;
3. MM vs DM in the MD – at D34, PEPCK, G6PASE and PGC-1A (p < 0.001) continued to
have greater expression in HLCs cultured in MM than in HLCs cultured in DM.
Overall, MM enhanced gene expression in the MD by comparison to 2D static cultures.
Although a decrease in expression from D27 to D34 was observed, it was not significant. On the
other hand, DM induced higher gene expression in plates from D27 to D34, as seen in chapter
III. 2. for most of the genes tested. Therefore, DM, being used for HLCs maturation, is not suitable
within the MD.
Concluding, there are differences regarding MD and static 2D culture systems. MM induced
higher gene expression in the MD than in plates, at D27. At D34, this trend was not maintained
except for genes that regulate gluconeogenesis such as PEPCK, G6PASE and PGC-1A. In fact,
higher concentrations of dexamethasone (instead of insulin) in MM induces gluconeogenesis 23.
Thus, opposite trends when comparing HLCs cultured (in the MD and plates) in MM or DM were
observed. The differences between these two systems are based on the inoculum and the
possibility of creating a flow, by a daily addition of 30 µL of medium from the bottom wells to the
upper wells. HLCs in the MD were cultured at a higher inoculum than in plates. In fact, high density
cultures (>200 000 cells/cm2) enhance cell function. In a study performed by Zhang et al, HepG2
seeded at high densities in a microfluidic device presented greater albumin production than 2D
static cultures 151. We can infer that the decrease in concentrations of insulin and dexamethasone
(in MM), which are important in the differentiation protocol, may be supplanted by increased cell-
to-cell contact in the MD. The enhancement of tight junctions mimics the in vivo liver configuration
where high density of hepatocytes is in close contact 151. However, this trend is maintained up to
D34 just for a set of genes regulating gluconeogenesis. In addition, fluid friction and shear stress
are parameters that further approximate this culture system to liver microenvironment, since in
vivo liver regeneration is related to portal pressure 152. Furthermore, cells cultured in MD were
maintained in small medium volumes, where diffusion of growth factors and secreted
biomolecules is limited because surface-to-volume ratio is very high and molecular diffusion
resembles what occurs physiologically 153.

53
IV. Conclusions and Future Perspectives
To understand the pathophysiological development of the metabolic syndrome, the
regulation of energy metabolism in hepatocytes needs to be studied.
The work presented in this thesis showed that if hnMSCs-derived HLCs were changed
from a medium already proved to induce a more mature phenotype 86 to a medium with less
dexamethasone and insulin (MM), biotransformation activity, glycogen storage, presence of
hepatic markers and urea and albumin production could be maintained throughout culture time.
However, HLCs cultured in MM could not maintain a stable gene expression, decreasing
throughout culture time, from D27 to D34. Indeed, DM induced an increase in gene expression
until D34, in plates, leading to a more mature phenotype. Nevertheless, MM allowed testing HLCs
response to insulin and glucagon stimuli and their adaptation to fasting. Gluconeogenesis was
the pathway that showed more similar responses to the physiological state, being significantly
repressed when incubated with insulin and significantly activated in response to glucagon. Some
of the genes related to fatty acid oxidation and bile acid metabolism did not respond entirely as
expected, although displaying a possible trend of regulation, possibly due to the lack of fatty acids,
cholesterol and bile acids in the culture media 144. In the future, we would like to add these
molecules to the medium. Other interesting parameter to be studied would be gene expression in
other time points, allowing to further understanding trends of response. In addition, all organs in
the human body are in interaction with each other and liver, in particular, is responsible for
regulating homeostasis. Therefore, it needs to receive signals from other sources to regulate its
metabolism accordingly. Thus, crosstalk between different types of cells is important to observe
changes in energy metabolism. Perhaps, this is the reason for most of the studies in the field of
metabolism being made in animal models.
Following the energy metabolism studies, HLCs were successfully inoculated into a MD,
maintaining functionality during culture time. Thus, a future step of this work would be the study
of HLCs response to insulin, glucagon and fasting in the MD. Nevertheless, differences between
2D static culture and MD culture were noticed, namely that most of the genes of HLCs in MM
presented higher gene expression in the MD than in plates, in both days. In addition, genes
related to gluconeogenesis were higher expressed in HLCs cultured in MM than in HLCs in DM,
possibly because MM presents lower insulin effect than DM. However, further information
regarding MD culture will be gathered once the response to fasting and to hormone signalling is
evaluated in the MD culture.
The differentiation process of hnMSCs into HLCs takes approximately one month. For
future studies of cellular interaction, it would also be more convenient to have HLCs ready to be
inoculated. Therefore, we tried to inoculate cryopreserved HLCs 154 into MDs. However, we could
not reproduce the process (data not shown). The process of thawing of HLCs and posterior
inoculation of the MD still needs to be optimized since these cells did not present the same
characteristics as freshly differentiated HLCs. In fact, cryopreserved hepatocytes do not have the
same functional levels and do not demonstrate the same morphology as freshly isolated ones 155.

54
Cryopreserved cells are more sensitive and need more time to adhere, being not yet compatible
with the timing of the MD operation, at the day of inoculation. In the future, we intend to optimize
the inoculation of cryopreserved HLCs into MDs and also adapt these cells to study metabolic
responses.
In conclusion, this work demonstrates that HLCs obtained by a specific differentiation
protocol are capable of responding to insulin and to glucagon and to adapt their metabolism to
fasting. Although the medium composition should be optimized in order to better mimic the
composition of blood in the human body, containing additional biomolecules 144, we could
successfully inoculate these cells into a MD and maintain them for up to two weeks. We hope that
future studies in the context of metabolic syndrome using HLCs and other relevant cell types,
such as adipocytes and myofibroblasts, in similar MDs, will be useful to create a better
understanding of this pathology and thus designing therapeutic strategies.

55
V. References
1. Normal Liver Physiology.
http://biomed.brown.edu/Courses/BI108/BI108_2002_Groups/liver/webpage/NormalLiver.htm. Accessed
February 17, 2016.
2. Rui L. Energy Metabolism in the Liver. NIH Public Access. 2014;72(2):181-204. doi:10.1038/nature13314.A.
3. Mazzoleni G, Steimberg N. New Models for the In Vitro Study of Liver Toxicity : 3D Culture Systems and the
Role of Bioreactors. Intechopen. 2009.
4. Chemistry for Biologists: Excretion and the liver.
http://www.rsc.org/Education/Teachers/Resources/cfb/excretion.htm.
5. Physiology and Pathophysiology of liver inflammation, damage and repair.
http://www.jpp.krakow.pl/journal/archive/08_08_s1/pdf/107_08_08_s1_article.pdf. Accessed February 17,
2016.
6. Godoy P, Hewitt NJ, Albrecht U, et al. Recent advances in 2D and 3D in vitro systems using primary
hepatocytes, alternative hepatocyte sources and non-parenchymal liver cells and their use in investigating
mechanisms of hepatotoxicity, cell signaling and ADME. Arch Toxicol. 2013;87(8):1315-1530.
doi:10.1007/s00204-013-1078-5.
7. Bettinger C, Borenstein JT, Tao SL. Microfluidic Cell Culture Systems. Elsevier, William Andrew; 2013.
8. Bilirubin. http://chemistry.elmhurst.edu/vchembook/634bilirubin.html.
9. Naito M, Hasegawa G, Ebe Y, Yamamoto T. Differentiation and function of Kupffer cells. Med Electron Microsc.
2004;37(1):16-28. doi:10.1007/s00795-003-0228-x.
10. Hepatic Histology: Hepatocytes.
http://www.vivo.colostate.edu/hbooks/pathphys/digestion/liver/histo_hcytes.html. Accessed April 4, 2016.
11. Gissen P, Arias IM. Structural and functional hepatocyte polarity and liver disease. J Hepatol. 2015;63(4):1023-
1037. doi:10.1016/j.jhep.2015.06.015.
12. Treyer A, Müsch A. Hepatocyte polarity. Compr Physiol. 2013;3(1):243-287. doi:10.1002/cphy.c120009.
13. Karim S, Adams DH, Lalor PF. Hepatic expression and cellular distribution of the glucose transporter family.
World J Gastroenterol. 2012;18(46):6771-6781. doi:10.3748/wjg.v18.i46.6771.
14. Berg J, Tymoczko J, Stryer L. Biochemistry. Biochemistry. 2002.
http://www.ncbi.nlm.nih.gov/books/NBK21154/.
15. Desvergne B, Michalik L, Wahli W. Transcriptional regulation of metabolism. Physiol Rev. 2006;86(2):465-514.
doi:10.1152/physrev.00025.2005.
16. Saltiel AR, Kahn CR. Insulin signalling and the regulation of glucose and lipid metabolism. Nature.
2001;414(6865):799-806. doi:10.1038/414799a.
17. Jiang G, Zhang BB. Glucagon and regulation of glucose metabolism. AmJPhysiol EndocrinolMetab.
2003;284(4):E671-E678. http://www.ncbi.nlm.nih.gov/pubmed/12626323.
18. Jeong JY, Jeoung NH, Park K-G, Lee I-K. Transcriptional regulation of pyruvate dehydrogenase kinase.
Diabetes Metab J. 2012;36(5):328-335. doi:10.4093/dmj.2012.36.5.328.
19. Jeoung NH, Wu P, Joshi MA, et al. Role of pyruvate dehydrogenase kinase isoenzyme 4 (PDHK4) in glucose
homoeostasis during starvation. Biochem J. 2006;397(3):417-425. doi:10.1042/BJ20060125.
20. Yoon JC, Puigserver P, Chen G, et al. Control of hepatic gluconeogenesis through the transcriptional
coactivator PGC-1. Nature. 2001;413(6852):131-138. doi:10.1038/35093050.
21. Burgess SC, Hausler N, Merritt M, et al. Impaired Tricarboxylic Acid Cycle Activity in Mouse Livers Lacking
Cytosolic Phosphoenolpyruvate Carboxykinase. J Biol Chem. 2004;279(47):48941-48949.
doi:10.1074/jbc.M407120200.
22. Mutel E, Abdul-Wahed A, Ramamonjisoa N, et al. Targeted deletion of liver glucose-6 phosphatase mimics
glycogen storage disease type 1a including development of multiple adenomas. J Hepatol. 2011;54(3):529-
537. doi:10.1016/j.jhep.2010.08.014.
23. Herzig S, Long F, Jhala US, et al. CREB regulates hepatic gluconeogenesis through the coactivator PGC-1.
Nature. 2001;413(6852):179-183. doi:10.1038/35093131.
56
24. Li X, Monks B, Ge Q, Birnbaum MJ. Akt/PKB regulates hepatic metabolism by directly inhibiting PGC-1alpha
transcription coactivator. Nature. 2007;447(7147):1012-1016. doi:10.1038/nature05861.
25. Iizuka K, Bruick RK, Liang G, Horton JD, Uyeda K. Deficiency of carbohydrate response element-binding
protein (ChREBP) reduces lipogenesis as well as glycolysis. Proc Natl Acad Sci U S A. 2004;101(19):7281-
7286. doi:10.1073/pnas.0401516101.
26. Wan M, Leavens KF, Saleh D, et al. Postprandial hepatic lipid metabolism requires signaling through Akt2
independent of the transcription factors FoxA2, FoxO1, and SREBP1c. Cell Metab. 2011;14(4):516-527.
doi:10.1016/j.cmet.2011.09.001.
27. Longuet C, Sinclair EM, Maida A, et al. The glucagon receptor is required for the adaptive metabolic response
to fasting. Cell Metab. 2008;8(5):359-371. doi:10.1016/j.cmet.2008.09.008.
28. Kersten S, Seydoux J, Peters JM, Gonzalez FJ, Desvergne B, Wahli W. Peroxisome proliferator-activated
receptor alpha mediates the adaptive response to fasting. J Clin Invest. 1999;103(11):1489-1498.
doi:10.1172/JCI6223.
29. Vega RB, Huss JM, Kelly DP. The coactivator PGC-1 cooperates with peroxisome proliferator-activated
receptor alpha in transcriptional control of nuclear genes encoding mitochondrial fatty acid oxidation enzymes.
Mol Cell Biol. 2000;20(5):1868-1876. http://www.ncbi.nlm.nih.gov/pubmed/10669761. Accessed August 29,
2016.
30. Bellafante E, Murzilli S, Salvatore L, Latorre D, Villani G, Moschetta A. Hepatic-specific activation of
peroxisome proliferator-activated receptor γ coactivator-1β protects against steatohepatitis. Hepatology.
2013;57(4):1343-1356. doi:10.1002/hep.26222.
31. Hernandez C, Lin JD, Finck BN, et al. A sweet path to insulin resistance through PGC-1beta. Cell Metab.
2009;9(3):215-216. doi:10.1016/j.cmet.2009.02.001.
32. Lelliott CJ, Medina-Gomez G, Petrovic N, et al. Ablation of PGC-1beta results in defective mitochondrial
activity, thermogenesis, hepatic function, and cardiac performance. PLoS Biol. 2006;4(11):e369.
doi:10.1371/journal.pbio.0040369.
33. Burri L, Thoresen GH, Berge RK, Burri L, Thoresen GH, Berge RK. The Role of PPARα Activation in Liver and
Muscle. PPAR Res. 2010;2010. doi:10.1155/2010/542359.
34. Fan C-Y, Pan J, Chu R, et al. Hepatocellular and Hepatic Peroxisomal Alterations in Mice with a Disrupted
Peroxisomal Fatty Acyl-coenzyme A Oxidase Gene. J Biol Chem. 1996;271(40):24698-24710.
doi:10.1074/jbc.271.40.24698.
35. Reddy JK, Hashimoto T. Peroxisomal beta-oxidation and peroxisome proliferator-activated receptor alpha: an
adaptive metabolic system. Annu Rev Nutr. 2001;21:193-230. doi:10.1146/annurev.nutr.21.1.193.
36. De Fabiani E, Mitro N, Gilardi F, Galmozzi A, Caruso D, Crestani M. When Food Meets Man: the Contribution
of Epigenetics to Health. Nutrients. 2010;2(5):551-571. doi:10.3390/nu2050551.
37. Staels B, Fonseca VA. Bile acids and metabolic regulation: mechanisms and clinical responses to bile acid
sequestration. Diabetes Care. 2009;32 Suppl 2(Suppl 2):S237-45. doi:10.2337/dc09-S355.
38. Duran-Sandoval D, Mautino G, Martin G, et al. Glucose regulates the expression of the farnesoid X receptor in
liver. Diabetes. 2004;53(4):890-898. doi:10.2337/diabetes.53.4.890.
39. Park W-H, Pak YK. Insulin-dependent suppression of cholesterol 7α-hydroxlase is a possible link between
glucose and cholesterol metabolisms. Exp Mol Med. 2011;43(10):571-579. doi:10.3858/emm.2011.43.10.064.
40. Zhang Y, Castellani LW, Sinal CJ, Gonzalez FJ, Edwards PA. Peroxisome proliferator-activated receptor-
gamma coactivator 1alpha (PGC-1alpha) regulates triglyceride metabolism by activation of the nuclear
receptor FXR. Genes Dev. 2004;18(2):157-169. doi:10.1101/gad.1138104.
41. Kanaya E, Shiraki T, Jingami H. The nuclear bile acid receptor FXR is activated by PGC-1alpha in a ligand-
dependent manner. Biochem J. 2004;382(Pt 3):913-921. doi:10.1042/BJ20040432.
42. Lefebvre P, Cariou B, Lien F, Kuipers F, Staels B. Role of bile acids and bile acid receptors in metabolic
regulation. Physiol Rev. 2009;89(1):147-191. doi:10.1152/physrev.00010.2008.
43. Alberti SG, Zimmet P, Shaw J, Grundy SM. The IDF Consensus Worldwide Definition of the Metabolic
Syndrom. 2006:24. https://www.idf.org/webdata/docs/IDF_Meta_def_final.pdf.
44. Shimano H. Pathophysiology of metabolic syndrome. Nippon rinsho Japanese J Clin Med. 2004;62(6):1029-
1035. doi:10.1097/MAJ.0b013e31823ea214.

57
45. Miranda JP, Filipe E, Fernandes AS, et al. The human umbilical cord tissue-derived MSC population UCX®
promotes early motogenic effects on keratinocytes and fibroblasts and G-CSF-mediatedmobilization of BM-
MSCS when transplanted in vivo. Cell Transplant. 2015;24(5):865-877. doi:10.3727/096368913X676231.
46. Santos JM, Camões SP, Filipe E, et al. 3D spheroid cell culture of umbilical cord tissue-derived MSCs (UCX®)
leads to enhanced paracrine induction of wound healing. Stem Cell Res Ther. 2015;6(1):90.
doi:10.1186/s13287-015-0082-5.
47. Takahashi K, Tanabe K, Ohnuki M, et al. Induction of Pluripotent Stem Cells from Adult Human Fibroblasts by
Defined Factors. Cell. 2007;131(5):861-872. doi:10.1016/j.cell.2007.11.019.
48. Medvedev SP, Shevchenko AI, Zakian SM. Induced Pluripotent Stem Cells: Problems and Advantages when
Applying them in Regenerative Medicine. Acta Naturae. 2010;2(2):18-28.
http://www.ncbi.nlm.nih.gov/pubmed/22649638. Accessed September 10, 2016.
49. Vojnits K, Bremer S. Challenges of using pluripotent stem cells for safety assessments of substances.
Toxicology. 2010;270(1):10-17. doi:10.1016/j.tox.2009.12.003.
50. Moise KJ. Umbilical Cord Stem Cells. Obstet Gynecol. 2005;106(6):1393-1407.
doi:10.1097/01.AOG.0000188388.84901.e4.
51. Hordyjewska A, Popiołek Ł, Horecka A. Characteristics of hematopoietic stem cells of umbilical cord blood.
Cytotechnology. 2015;67(3):387-396. doi:10.1007/s10616-014-9796-y.
52. Campagnoli C, Roberts IAG, Kumar S, Bennett PR, Bellantuono I, Fisk NM. Identification of mesenchymal
stem / progenitor cells in human first-trimester fetal blood , liver , and bone marrow. 2015;98(8):2396-2403.
53. Jiang Y, Jahagirdar BN, Reinhardt RL, et al. Pluripotency of mesenchymal stem cells derived from adult
marrow. Nature. 2002;418(6893):41-49. doi:10.1038/nature05812.
54. In ’t Anker PS, Scherjon SA, Kleijburg-van der Keur C, et al. Isolation of mesenchymal stem cells of fetal or
maternal origin from human placenta. Stem Cells. 2004;22(7):1338-1345. doi:10.1634/stemcells.2004-0058.
55. Zuk, PA E Al. Multilineage cells from human adipose tissue: implications for cell-based therapies. Tissue Eng.
2001;7(2):211-228. doi:10.1089/107632701300062859.
56. Zvaifler NJ, Marinova-Mutafchieva L, Adams G, et al. Mesenchymal precursor cells in the blood of normal
individuals. Arthritis Res. 2000;2(6):477-488. doi:10.1186/ar130.
57. Erices a, Conget P, Minguell JJ. Mesenchymal progenitor cells in human umbilical cord blood. Br J Haematol.
2000;109(1):235-242. doi:10.1046/j.1365-2141.2000.01986.x.
58. Buyl K, De Kock J, Najar M, et al. Characterization of hepatic markers in human Wharton’s Jelly-derived
mesenchymal stem cells. Toxicol In Vitro. 2014;28(1):113-119. doi:10.1016/j.tiv.2013.06.014.
59. Secco M, Zucconi E, Vieira NM, et al. Multipotent Stem Cells from Umbilical Cord: Cord Is Richer than Blood!
Stem Cells. 2008;26(1):146-150. doi:10.1634/stemcells.2007-0381.
60. Dominici M, Le Blanc K, Mueller I, et al. Minimal criteria for defining multipotent mesenchymal stromal cells.
The International Society for Cellular Therapy position statement. Cytotherapy. 2006;8(4):315-317.
doi:10.1080/14653240600855905.
61. Friedenstein a J, Piatetzky-Shapiro II, Petrakova K V. Osteogenesis in transplants of bone marrow cells. J
Embryol Exp Morphol. 1966;16(3):381-390.
62. La Rocca G, Anzalone R, Corrao S, et al. Isolation and characterization of Oct-4+/HLA-G+ mesenchymal stem
cells from human umbilical cord matrix: Differentiation potential and detection of new markers. Histochem Cell
Biol. 2009;131(2):267-282. doi:10.1007/s00418-008-0519-3.
63. Zeddou M, Briquet A, Relic B, et al. The umbilical cord matrix is a better source of mesenchymal stem cells
(MSC) than the umbilical cord blood. Cell Biol Int. 2010;34(7):693-701. doi:10.1042/CBI20090414.
64. Snykers S, Vanhaecke T, De Becker A, et al. Chromatin remodeling agent trichostatin A: a key-factor in the
hepatic differentiation of human mesenchymal stem cells derived of adult bone marrow. BMC Dev Biol.
2007;7:24. doi:10.1186/1471-213X-7-24.
65. Dong X, Pan R, Zhang H, Yang C, Shao J, Xiang L. Modification of histone acetylation facilitates hepatic
differentiation of human bone marrow mesenchymal stem cells. PLoS One. 2013;8(5):e63405.
doi:10.1371/journal.pone.0063405.
66. Li X, Yuan J, Li W, et al. Direct Differentiation of Homogeneous Human Adipose Stem Cells Into Functional
Hepatocytes by Mimicking Liver Embryogenesis. J Cell Physiol. 2014;229(6):801-812. doi:10.1002/jcp.24501.

58
67. Campard D, Lysy PA, Najimi M, Sokal EM. Native Umbilical Cord Matrix Stem Cells Express Hepatic Markers
and Differentiate Into Hepatocyte-like Cells. Gastroenterology. 2008;134(3):833-848.
doi:10.1053/j.gastro.2007.12.024.
68. Zorn AM. Liver Development. StemBook. October 2008. doi:10.3824/stembook.1.25.1.
69. Tremblay KD, Zaret KS. Distinct populations of endoderm cells converge to generate the embryonic liver bud
and ventral foregut tissues. Dev Biol. 2005;280(1):87-99. doi:10.1016/j.ydbio.2005.01.003.
70. Shen MM. Nodal signaling: developmental roles and regulation. Development. 2007;134(6):1023-1034.
doi:10.1242/dev.000166.
71. Calmont A, Wandzioch E, Tremblay KD, et al. An FGF response pathway that mediates hepatic gene induction
in embryonic endoderm cells. Dev Cell. 2006;11(3):339-348. doi:10.1016/j.devcel.2006.06.015.
72. Shen MM. Nodal signaling: developmental roles and regulation. Development. 2007;134(6):1023-1034.
doi:10.1242/dev.000166.
73. McLin V a, Rankin S a, Zorn AM. Repression of Wnt/beta-catenin signaling in the anterior endoderm is
essential for liver and pancreas development. Development. 2007;134(12):2207-2217.
doi:10.1242/dev.001230.
74. Rossi JM, Dunn NR, Hogan BL, Zaret KS. Distinct mesodermal signals, including BMPs from the septum
transversum mesenchyme, are required in combination for hepatogenesis from the endoderm. Genes Dev.
2001;15(15):1998-2009. doi:10.1101/gad.904601.
75. Ameri J, Ståhlberg A, Pedersen J, et al. FGF2 Specifies hESC-Derived Definitive Endoderm into
Foregut/Midgut Cell Lineages in a Concentration-Dependent Manner. Stem Cells. 2009;28(1):N/A-N/A.
doi:10.1002/stem.249.
76. Bort R, Signore M, Tremblay K, Martinez Barbera JP, Zaret KS. Hex homeobox gene controls the transition of
the endoderm to a pseudostratified, cell emergent epithelium for liver bud development. Dev Biol.
2006;290(1):44-56. doi:10.1016/j.ydbio.2005.11.006.
77. Rossi JM, Dunn NR, Hogan BL, Zaret KS. Distinct mesodermal signals, including BMPs from the septum
transversum mesenchyme, are required in combination for hepatogenesis from the endoderm. Genes Dev.
2001;15(15):1998-2009. doi:10.1101/gad.904601.
78. Wang Z, Dollé P, Cardoso W V., Niederreither K. Retinoic acid regulates morphogenesis and patterning of
posterior foregut derivatives. Dev Biol. 2006;297(2):433-445. doi:10.1016/j.ydbio.2006.05.019.
79. Liver development | StemBook. http://www.stembook.org/node/512.html. Accessed March 20, 2016.
80. Chivu M, Dima SO, Stancu CI, et al. In vitro hepatic differentiation of human bone marrow mesenchymal stem
cells under differential exposure to liver-specific factors. Transl Res. 2009;154(3):122-132.
doi:10.1016/j.trsl.2009.05.007.
81. Kamiya A, Kinoshita T, Miyajima A. Oncostatin M and hepatocyte growth factor induce hepatic maturation via
distinct signaling pathways. FEBS Lett. 2001;492(1-2):90-94. doi:10.1016/S0014-5793(01)02140-8.
82. Michalopoulos GK, Bowen WC, Mulè K, Luo J. HGF-, EGF-, and dexamethasone-induced gene expression
patterns during formation of tissue in hepatic organoid cultures. Gene Expr. 2003;11(2):55-75.
http://www.ncbi.nlm.nih.gov/pubmed/12837037. Accessed August 7, 2016.
83. Santos NC, Figueira-Coelho J, Martins-Silva J, Saldanha C. Multidisciplinary utilization of dimethyl sulfoxide:
Pharmacological, cellular, and molecular aspects. Biochem Pharmacol. 2003;65(7):1035-1041.
doi:10.1016/S0006-2952(03)00002-9.
84. Alizadeh E, Zarghami N, Eslaminejad MB, Akbarzadeh A, Barzegar A, Mohammadi SA. The effect of dimethyl
sulfoxide on hepatic differentiation of mesenchymal stem cells. Artif cells, nanomedicine, Biotechnol.
2014;(May):1-8. doi:10.3109/21691401.2014.928778.
85. Liu W, Liu Z, You N, et al. Several Important In Vitro Improvements in the Amplification, Differentiation and
Tracing of Fetal Liver Stem/Progenitor Cells. Kerkis I, ed. PLoS One. 2012;7(10):e47346.
doi:10.1371/journal.pone.0047346.
86. Cipriano M, Correia J, Castro M, Santos JM, Miranda JP. The Role of Epigenetic Modifiers on Extended
Cultures of Functional Hepatocyte-Like Cells Derived From hnMSCs. Arch Toxicol. 2016. Epub ahead of prin
87. Snykers S, Vanhaecke T, De Becker A, et al. Chromatin remodeling agent trichostatin A: a key-factor in the
hepatic differentiation of human mesenchymal stem cells derived of adult bone marrow. BMC Dev Biol.

59
2007;7(August):24. doi:10.1186/1471-213X-7-24.
88. Eberharter A, Becker PB. Histone acetylation: a switch between repressive and permissive chromatin. Second
in review series on chromatin dynamics. EMBO Rep. 2002;3(3):224-229. doi:10.1093/embo-reports/kvf053.
89. Chetty S, Pagliuca FW, Honore C, Kweudjeu A, Rezania A, Melton DA. A simple tool to improve pluripotent
stem cell differentiation. Nat Methods. 2013;10(6):553-556. doi:10.1038/nmeth.2442.
90. Calder A, Roth-Albin I, Bhatia S, et al. Lengthened G1 Phase Indicates Differentiation Status in Human
Embryonic Stem Cells. Stem Cells Dev. 2012;22(2):120829080827006. doi:10.1089/scd.2012.0168.
91. Seeliger C, Culmes M, Schyschka L, et al. Decrease of global methylation improves significantly hepatic
differentiation of Ad-MSCs: Possible future application for urea detoxification. Cell Transplant. 2013;22(1):119-
131. doi:10.3727/096368912X638946.
92. Yoshida Y, Shimomura T, Sakabe T, et al. A role of Wnt/beta-catenin signals in hepatic fate specification of
human umbilical cord blood-derived mesenchymal stem cells. Am J Physiol Gastrointest Liver Physiol.
2007;293(5):G1089-98. doi:10.1152/ajpgi.00187.2007.
93. Santi D V, Norment A, Garrett CE. Covalent bond formation between a DNA-cytosine methyltransferase and
DNA containing 5-azacytosine. Proc Natl Acad Sci U S A. 1984;81(22):6993-6997.
http://www.ncbi.nlm.nih.gov/pubmed/6209710. Accessed August 21, 2016.
94. Komashko VM, Farnham PJ. 5-Azacytidine Treatment Reorganizes Genomic Histone Modification Patterns.
Epigenetics. 2010;5(3):229-240. doi:10.4161/epi.5.3.11409.
95. The 3Rs. https://www.nc3rs.org.uk/the-3rs.
96. Miranda J, Cipriano M, Castro M. Self-Assembled 3D Spheroids and Hollow-fibre Bioreactors improve MSC-
Derived Hepatocyte-Like Cell Maturation In Vitro. Arch Toxicol. 2016.
97. Beebe DJ, Ingber Cde DE, Den Toonder J. Organs on Chips. Lab Chip. 2013;13. doi:10.1039/c3lc90080k.
98. Overview of Pharmacokinetics - Clinical Pharmacology - Merck Manuals Professional Edition.
http://www.merckmanuals.com/professional/clinical-pharmacology/pharmacokinetics/overview-of-
pharmacokinetics.
99. Sung JH, Kam C, Shuler ML. A microfluidic device for a pharmacokinetic–pharmacodynamic (PK–PD) model
on a chip. Lab Chip. 2010;10(4):446. doi:10.1039/b917763a.
100. Overview of Pharmacodynamics - Clinical Pharmacology - Merck Manuals Professional Edition.
http://www.merckmanuals.com/professional/clinical-pharmacology/pharmacodynamics/overview-of-
pharmacodynamics.
101. Lee PJ, Hung PJ, Lee LP. An artificial liver sinusoid with a microfluidic endothelial-like barrier for primary
hepatocyte culture. Biotechnol Bioeng. 2007;97(5):1340-1346. doi:10.1002/bit.21360.
102. Chao P, Maguire T, Novik E, Cheng K-C, Yarmush ML. Evaluation of a microfluidic based cell culture platform
with primary human hepatocytes for the prediction of hepatic clearance in human. Biochem Pharmacol.
2009;78(6):625-632. doi:10.1016/j.bcp.2009.05.013.
103. Patel D, Haque A, Gao Y, Revzin A. Using reconfigurable microfluidics to study the role of HGF in autocrine
and paracrine signaling of hepatocytes. Integr Biol (Camb). 2015;7(7):815-824. doi:10.1039/c5ib00105f.
104. Novik E, Maguire TJ, Chao P, Cheng KC, Yarmush ML. A microfluidic hepatic coculture platform for cell-based
drug metabolism studies. Biochem Pharmacol. 2010;79(7):1036-1044. doi:10.1016/j.bcp.2009.11.010.
105. Gori M, Simonelli MC, Giannitelli SM, Businaro L, Trombetta M, Rainer A. Investigating Nonalcoholic Fatty
Liver Disease in a Liver-on-a-Chip Microfluidic Device. PLoS One. 2016;11(7):e0159729.
doi:10.1371/journal.pone.0159729.
106. Maschmeyer I, Lorenz AK, Schimek K, et al. From chip-in-a-lab to lab-on-a-chip: towards a single handheld
electronic system for multiple application-specific lab-on-a-chip (ASLOC). 2014. doi:10.1039/c5lc00392j.
107. TissUse • Emulating Human Biology. http://www.tissuse.com/index.html.
108. Maschmeyer I, Hasenberg T, Jaenicke A, et al. Chip-based human liver–intestine and liver–skin co-cultures –
A first step toward systemic repeated dose substance testing in vitro. Eur J Pharm Biopharm. 2015;95:77-87.
doi:10.1016/j.ejpb.2015.03.002.
109. Technology & Science - Xona Microfluidics. http://xonamicrofluidics.com/about/technology-science/.
110. NHLBI N. What Is Metabolic Syndrome? http://www.nhlbi.nih.gov/health/health-topics/topics/ms.
111. Bhatia SN, Ingber DE. Microfluidic organs-on-chips. Nat Biotechnol. 2014;32(8):760-772.

60
doi:10.1038/nbt.2989.
112. Ferris HA, Kahn CR, Barnes P, et al. New mechanisms of glucocorticoid-induced insulin resistance: make no
bones about it. J Clin Invest. 2012;122(11):3854-3857. doi:10.1172/JCI66180.
113. Miranda JP, Leite SB, Teixeira AP, et al. Merging bioreactor technology with 3D hepatocyte-fibroblast culturing
approaches: Improved in vitro models for toxicological applications. Toxicol Vitr. 2009;25(4):825-832.
doi:10.1016/j.tiv.2011.02.002.
114. Rajan N, Habermehl J, Coté M-F, Doillon CJ, Mantovani D. Preparation of ready-to-use, storable and
reconstituted type I collagen from rat tail tendon for tissue engineering applications. Nat Protoc.
2006;1(6):2753-2758. doi:10.1038/nprot.2006.430.
115. Estall JL, Ruas JL, Choi CS, et al. PGC-1alpha negatively regulates hepatic FGF21 expression by modulating
the heme/Rev-Erb(alpha) axis. Proc Natl Acad Sci U S A. 2009;106(52):22510-22515.
doi:10.1073/pnas.0912533106.
116. Martínez-redondo V, Agudelo LZ, Sinha I, Zierath JR, Groen AK, Ruas JL. Correia et al, 2015. 2015.
117. Wilkening S, Stahl F, Bader A. Comparison of primary human hepatocytes and hepatoma cell line HepG2 with
regard to their biotransformation properties. Drug Metab Dispos. 2003;31(8):1035-1042.
doi:10.1124/dmd.31.8.1035.
118. Donato MT, Gomez-Lechon MJ, Castell J V. A microassay for measuring cytochrome P450IA1 and P450IIB1
activities in intact human and rat hepatocytes cultured on 96-well plates. 1993.
119. Miranda JP, Rodrigues A, Tostões RM, et al. Extending Hepatocyte Functionality for Drug-Testing Applications
Using High-Viscosity Alginate–Encapsulated Three-Dimensional Cultures in Bioreactors. Tissue Eng Part C
Methods. 2010;16(6):1223-1232. doi:10.1089/ten.tec.2009.0784.
120. Strom SC, Michalopoulos G. Collagen as a substrate for cell growth and differentiation. In: ; 1982:544-555.
doi:10.1016/0076-6879(82)82086-7.
121. Pascussi JM, Gerbal-Chaloin S, Drocourt L, Maurel P, Vilarem MJ. The expression of CYP2B6, CYP2C9 and
CYP3A4 genes: A tangle of networks of nuclear and steroid receptors. Biochim Biophys Acta - Gen Subj.
2003;1619(3):243-253. doi:10.1016/S0304-4165(02)00483-X.
122. Pascussi JM, Drocourt L, Gerbal-Chaloin S, Fabre JM, Maurel P, Vilarem MJ. Dual effect of dexamethasone
on CYP3A4 gene expression in human hepatocytes. Sequential role of glucocorticoid receptor and pregnane X
receptor. Eur J Biochem. 2001;268:6346-6358.
123. Monostory K, Kőhalmy K, Prough RA, Kóbori L, Vereczkey L. The effect of synthetic glucocorticoid,
dexamethasone on CYP1A1 inducibility in adult rat and human hepatocytes. FEBS Lett. 2005;579(1):229-235.
doi:10.1016/j.febslet.2004.11.080.
124. Stephen C. Strom, Ljubomir A. Pisarov, Kenneth Dorko, Melissa T. Thompson, John D. Schuetz and EGS.
Use of Human Hepatocytes to Study P450 Gene Induction. 1996;272(1992):388-401.
125. Gomez-Lechon MJ, Tolosa L, Conde I, Donato MT. Competency of different cell models to predict human
hepatotoxic drugs. Expert Opin Drug Metab Toxicol. 2014;10(11):1553-1568.
doi:10.1517/17425255.2014.967680 [doi].
126. Sutherland L, Ebner T, Burchell B. The expression of UDP-glucuronosyltransferases of the UGT1 family in
human liver and kidney and in response to drugs. Biochem Pharmacol. 1993;45(2):295-301. doi:10.1016/0006-
2952(93)90064-4.
127. Pittner RA, Fears R, Brindley DN. Effects of cyclic AMP, glucocorticoids and insulin on the activities of
phosphatidate phosphohydrolase, tyrosine aminotransferase and glycerol kinase in isolated rat hepatocytes in
relation to the control of triacylglycerol synthesis and gluconeogenesis. Biochem J. 1985;225(2):455-462.
http://www.pubmedcentral.nih.gov/articlerender.fcgi?artid=1144611&tool=pmcentrez&rendertype=abstract.
128. Polin R, Fox WW, Abman SH. Fetal and Neonatal Physiology: Expert Consult - Online and Print - Richard Alan
Polin, William W. Fox, Steven H. Abman - Google Livros. Elsevier; 2011.
129. Audet-Walsh É, Giguère V. The multiple universes of estrogen-related receptor α and γ in metabolic control
and related diseases. Acta Pharmacol Sin. 2015;36121(10):51-61. doi:10.1038/aps.2014.121.
130. Longuet C, Sinclair EM, Maida A, Baggio LL, Charron MJ, Drucker DJ. The glucagon receptor is required for
the adaptive metabolic response to fasting. Cell. 2009;8(5):359-371. doi:10.1016/j.cmet.2008.09.008.The.
131. Palou M, Priego T, Sánchez J, et al. Sequential changes in the expression of genes involved in lipid

61
metabolism in adipose tissue and liver in response to fasting. Pflugers Arch Eur J Physiol. 2008;456(5):825-
836. doi:10.1007/s00424-008-0461-1.
132. Iizuka K, Horikawa Y. ChREBP: A Glucose-activated Transcription Factor Involved in the Development of
Metabolic Syndrome. Endocr J. 2008;55(4):617-624.
133. TAL M, KAHN BB, LODISH HF. Expression of the Low Km GLUT-1 Glucose Transporter Is Turned on in
Perivenous Hepatocytes of Insulin- Deficient Diabetic Rats*. Endocrinology. 1991;129(4):1933-1941.
doi:10.1210/endo-129-4-1933.
134. Connaughton S, Chowdhury F, Attia RR, et al. Regulation of pyruvate dehydrogenase kinase isoform 4 (PDK4)
gene expression by glucocorticoids and insulin. Mol Cell Endocrinol. 2010;315(1-2):159-167.
doi:10.1016/j.mce.2009.08.011.
135. Shin D-J, Campos JA, Gil G, Osborne TF. PGC-1alpha activates CYP7A1 and bile acid biosynthesis. J Biol
Chem. 2003;278(50):50047-50052. doi:10.1074/jbc.M309736200.
136. Meirhaeghe A, Crowley V, Lenaghan C, et al. Characterization of the human, mouse and rat PGC1β
(peroxisome- proliferator-activated receptor-γ co-activator 1β) gene in vitro and in vivo. Biochem J.
2003;373:155-165.
137. Herzog B, Cardenas J, Hall RK, et al. Estrogen-related receptor alpha is a repressor of phosphoenolpyruvate
carboxykinase gene transcription. J Biol Chem. 2006;281(1):99-106. doi:10.1074/jbc.M509276200.
138. Girard J. Gluconeogenesis in Late Fetal and Early Neonatal Life. Neonatology. 1986;50(5):237-258.
doi:10.1159/000242605.
139. Azzout-Marniche D, Bécard D, Guichard C, Foretz M, Ferré P, Foufelle F. Insulin effects on sterol regulatory-
element-binding protein-1c (SREBP-1c) transcriptional activity in rat hepatocytes. Biochem J. 2000;350 Pt 2(Pt
2):389-393. http://www.ncbi.nlm.nih.gov/pubmed/10947952. Accessed September 16, 2016.
140. Foretz M, Pacot C, Dugail I, et al. ADD1/SREBP-1c is required in the activation of hepatic lipogenic gene
expression by glucose. Mol Cell Biol. 1999;19(5):3760-3768. http://www.ncbi.nlm.nih.gov/pubmed/10207099.
Accessed September 16, 2016.
141. Postic C, Burcelin R, Rencurel F, et al. Evidence for a transient inhibitory effect of insulin on GLUT2 expression
in the liver: studies in vivo and in vitro. Biochem J. 1993;293:119-124.
142. Mashek DG, Khan SA, Sathyanarayan A, Ploeger JM, Franklin MP. Hepatic lipid droplet biology: Getting to the
root of fatty liver. Hepatology. 2015;62(3):964-967. doi:10.1002/hep.27839.
143. Shipp DA, Parameswaran M, Arinze IJ. Development of fatty acid oxidation in neonatal guinea-pig liver.
Biochem J. 1982;208:723-730.
144. Godoy P, Widera A, Schmidt-Heck W, et al. Gene network activity in cultivated primary hepatocytes is highly
similar to diseased mammalian liver tissue. Arch Toxicol. 2016;90(10):2513-2529. doi:10.1007/s00204-016-
1761-4.
145. Austin S, St-Pierre J. PGC1a and mitochondrial metabolism – emerging concepts and relevance in ageing and
neurodegenerative disorders. J Cell Sci. 125:4963-4971. doi:10.1242/jcs.113662.
146. Giguère V. Transcriptional Control of Energy Homeostasis by the Estrogen-Related Receptors. Endocr Rev.
2008;29(6):677-696. doi:10.1210/er.2008-0017.
147. Liu C, Lin JD. PGC-1 coactivators in the control of energy metabolism Structure and function of PGC-1. Acta
Biochim Biophys Sin. 2011;43(4):248-257. doi:10.1093/abbs/gmr007.Advance.
148. Liang H, Ward WF. PGC-1a: a key regulator of energy metabolism.
149. Ben-Ze’ev A, Robinson GS, Bucher NL, Farmer SR. Cell-cell and cell-matrix interactions differentially regulate
the expression of hepatic and cytoskeletal genes in primary cultures of rat hepatocytes. Proc Natl Acad Sci U S
A. 1988;85(7):2161-2165.
http://www.pubmedcentral.nih.gov/articlerender.fcgi?artid=279949&tool=pmcentrez&rendertype=abstract.
Accessed May 28, 2016.
150. Dich J, Gluud CN, Gluud CN. Effect of Insulin on Albumin Production and Incorporation of 14C-leucine into
Proteins in Isolated Parenchymal Liver Cells from Normal Rats BY. 1975:236-243.
151. Zhang MY, Lee PJ, Hung PJ, Johnson T, Lee LP, Mofrad MRK. Microfluidic environment for high density
hepatocyte culture. Biomed Microdevices. 2008;10(1):117-121. doi:10.1007/s10544-007-9116-9.
152. Niiya T, Murakami M, Aoki T, Murai N, Shimizu Y, Kusano M. Immediate increase of portal pressure, reflecting
62
sinusoidal shear stress, induced liver regeneration after partial hepatectomy. J Hepatobiliary Pancreat Surg.
1999;6(3):275-280. doi:10.1007/s005340050118.
153. Zhang C, Noort D van. Cells in Microfluidics. TripleC. 2011;11(1):13-35. doi:10.1007/128.
154. Cipriano M, Belém B, Rodrigues JS, et al. Of-the-Shelf Hepatocyte-like Cells (HLCs): Characterization of
Cryopreserved Human Mesenchymal Stem Cells Derived-HLCs.; 2016.
https://docs.google.com/document/d/17uU5wYDVWIHxnIDLOpb41ar7X1H5X5RV91sgMIvYKVk/edit.
155. Stéphenne X, Najimi M, Sokal EM. Hepatocyte cryopreservation: is it time to change the strategy? World J
Gastroenterol. 2010;16(1):1-14. doi:10.3748/wjg.v16.i1.1.

63
VI. Annexes
VI. 1. Primers List
Name Sequence Melting Temperature
(Tm ºC)
B-actin_F CATGTACGTTGCTATCCAGGC 87.80
B-actin_R CTCCTTAATGTCACGCACGAT 87.80
PDK4_F TCTGAGGCTGATGACTGGTG 80.60
PDK4_R GGAGGAAACAAGGGTTCACA 80.60
SREBP-1c_F TGTTTGTTAGTGGGAGGAGTG 86.20
SREBP-1c_R GAGGTGAGAAGGGACAACTGA 86.20
ChREBP1_F GTTCCCTCTCTCTGCTCCTTC 86.80
ChREBP1_R CCACACACACACATCCACAC 86.80
PEPCK_F GCTTTTCAGCATCTCCAAGGA 80.30
PEPCK_R GCTTCAAGGCAAGGATCTCTC 80.30
G6PASE_F CAGAGCAATCACCACCAAGC 80.30
G6PASE_R ACATTCATTCCTTCCTCCATCC 80.30
PPARA_F CTGTCATTCAAGCCCATCTTC 81.60
PPARA_R TTATTTGCCACAACCCTTCC 81.60
FXR_F AGAACCTGGAAGTGGAACC 81.60
FXR_R CTCTGCTACCTCAGTTTCTCC 81.60
CYP7A1_R CCAGAAGCAATGAAAGCAGC 79.30
CYP7A1_F GGATGTTGAGGGAGGGACT 79.30
PGC-1A_F GCTGAAGAGGCAAGAGACAGA 80.40
PGC-1A_R AAGCACACACACCACACACA 80.40
PGC-1B_F GATGCCAGCGACTTTGACTC 85.90
PGC-1B_R ACCCACGTCATCTTCAGGGA 85.90
GLUT1_SLC2A1_F TCTGGCATCAACGCTGTCTTC 83.00
GLUT1_SLC2A1_R CGATACCGGAGCCAATGGT 83.00
GLUT2_SLC2A2_F GCTGCTCAACTAATCACCATGC 80.90
GLUT2_SLC2A2_R TGGTCCCAATTTTGAAAACCCC 80.90
CPT1a_F TCCAGTTGGCTTATCGTGGTG 80.90
CPT1a_R TCCAGAGTCCGATTGATTTTTGC 80.90
ACOX1_F ACTCGCAGCCAGCGTTATG 81.60
ACOX1_R AGGGTCAGCGATGCCAAAC 81.60
NRF_F AGGAACACGGAGTGACCCAA 83.00
NRF_R TATGCTCGGTGTAAGTAGCCA 83.00
ERRA_F AGGGTTCCTCGGAGACAGAG 71.60
ERRA_R TCACAGGATGCCACACCATAG 71.60
CYTC_F CTGATCTGCGGCTACAATTCTG 83.40
CYTC_R CCCGGAAGAGGACTTGCTT 83.40
Table A - Primers used for RT-qPCR.


