8THE UNIVERSITY OF THE STATE OF NEW YORK
GRADE 8INTERMEDIATE-LEVEL
SCIENCE TEST
WRITTEN TESTJUNE 2, 2014
Student Name ________________________________________________________________
School Name ________________________________________________________________
Print your name and the name of your school on the lines above.
The questions on this test measure your knowledge and understanding of science. The test has two parts. Both parts are contained in this test booklet.
Part I consists of 45 multiple-choice questions. Record your answers to these questions on theseparate answer sheet. Use only a No. 2 pencil on your answer sheet.
Part II consists of 40 open-ended questions. Write your answers to these questions in thespaces provided in this test booklet.
You may use a calculator to answer the questions on the test if needed.
You will have two hours to answer the questions on this test.
DO NOT TURN THIS PAGE UNTIL YOU ARE TOLD TO DO SO.
THE UNIVERSITY OF THE STATE OF NEW YORKTHE STATE EDUCATION DEPARTMENT
ALBANY, NEW YORK 12234
The possession or use of any communications device is strictly prohibited when taking this examination. If you have or use any communications device, no matter how briefly, your examination will be invalidated and no score will be calculated for you.

Grade 8 Science — June ’14 [3] [OVER]
Part I
DIRECTIONS
There are 45 questions on Part I of the test. Each question is followed by four choices,numbered 1 through 4. Read each question carefully. Decide which choice is the best answer. On the separate answer sheet, mark your answer in the row of circles for eachquestion by filling in the circle that has the same number as the answer you have chosen.
Read the sample question below.
Sample Question
Earth gets most of its light from
(1) the stars(2) the Sun(3) the Moon(4) other planets
The correct answer is the Sun, which is choice number 2. On your answer sheet, look atthe box showing the row of answer circles for the sample question. Since choice number 2is the correct answer for the sample question, the circle with the number 2 has been filledin.
Answer all of the questions in Part I in the same way. Mark only one answer for each question. If you want to change an answer, be sure to erase your first mark completely.Then mark the answer you want.
You will not need scrap paper. You may use the pages of this test booklet to work out youranswers to the questions.
You may use a calculator if needed.
When you are told to start working, turn the page and begin with question 1. Work carefully and answer all of the questions in Part I.
When you have finished Part I, go right on to Part II. Answer all of the questions in Part II.

1 The diagram below represents a plant cell.Letter X represents a structure in the cell.
Which cell structure is represented by X?(1) nucleus (3) cell wall(2) cytoplasm (4) cell membrane
2 A major function of a plant’s roots is to(1) produce flowers(2) release oxygen(3) transport carbon dioxide(4) take in water
3 Which type of relationship exists when a certaintype of tree’s roots need a fungus present inorder to grow normally?(1) beneficial (3) harmful(2) competitive (4) infectious
4 Which process releases energy from digestedfood?(1) photosynthesis(2) cellular respiration(3) vitamin production(4) fertilization
5 Most hormones are produced by which humanorgan system?(1) digestive (3) respiratory(2) endocrine (4) nervous
6 Which process results in the formation of a newcell with a full set of chromosomes?(1) respiration (3) fertilization(2) digestion (4) evolution
7 Specialized cells protect the human body fromdisease-causing microbes by(1) producing chemicals that destroy the
microbes(2) dissolving wastes from the microbes(3) creating recessive genes in the microbes(4) supplying oxygen and nutrients to the
microbes
8 Which model can be used to trace genetic inheritance?(1) life cycle (3) food web(2) pedigree chart (4) energy pyramid
9 The transfer of a section of DNA from oneorganism into the DNA of another organism byscientists is called(1) selective breeding(2) genetic engineering(3) natural selection(4) internal fertilization
10 A green plant absorbs light. A frog eats flies.These are both examples of how organisms(1) obtain energy (3) produce offspring(2) escape predators (4) excrete waste
11 A body cell that is undergoing abnormal celldivision is most likely (1) producing sex cells(2) transporting nutrients(3) forming cancerous cells(4) developing an infection
12 A main function of a plant’s seed is to(1) store food to be used during early
development(2) attract pollen to be used during
development(3) take in light energy to be used during
photosynthesis(4) produce chlorophyll to be used during
photosynthesis
X
Part I
Grade 8 Science — June ’14 [4]

13 The drawings below represent three different birds. The beak shape makes it easy for each bird to obtainfood in a different way.
The differences in beak shape are examples of(1) camouflage (3) dynamic equilibrium(2) competition (4) biological adaptation
14 The diagram below represents the stages of development in a mosquito.
Which process is represented by the four stages in this diagram?(1) fertilization (3) metamorphosis(2) metabolism (4) succession
(Not drawn to scale)
Adult
Larva
PupaEgg
(Not drawn to scale)
Grade 8 Science — June ’14 [5] [OVER]

Grade 8 Science — June ’14 [6]
15 The diagram below represents a person cooking eggs on a stove. The person has touched the hot fryingpan and pulled his hand away.
Which title is the best one for this diagram?(1) A Human Requires Oxygen to Survive (3) All Living Things Require Energy(2) Metabolism is Influenced by Diet (4) A Human Responds to a Stimulus
16 Which graph shows what most likely would happen to the population of a certain animal if a new predator were introduced at time A?
17 The diagrams below represent the same location over a period of many years.
The sequence of diagrams best shows that, over time,(1) erosion increases (3) communities stay the same(2) climates get colder (4) ecological succession occurs
Time
Pond Swamp Land community
(Not drawn to scale)
Po
pu
lati
on
Time
A
( 1 )
A
( 2 )
A
( 3 )
A
( 4 )
Po
pu
lati
on
Time
Po
pu
lati
on
Time
Po
pu
lati
on
Time

18 Which process in an apple tree primarily resultsfrom cell division?(1) growth (3) gas exchange(2) photosynthesis (4) waste removal
19 A single human body cell typically containsthousands of(1) genes (3) chloroplasts(2) nuclei (4) bacteria
20 The equation below shows the products formedwhen a solution of silver nitrate (AgNO3) reactswith a solution of sodium chloride (NaCl).
AgNO3 � NaCl → NaNO3 � AgCl(Reactants) (Products)
In this equation, the total mass of the reactants is(1) greater than the total mass of the products(2) equal to the total mass of the products(3) equal to the mass of AgCl(4) less than the mass of AgCl
21 A lamp converts electrical energy to light energy.In addition to the light energy, much of this electrical energy is also converted to(1) mechanical energy (3) heat energy(2) chemical energy (4) nuclear energy
22 One example of matter is(1) magnetism (3) water(2) heat (4) radiation
23 Volcanic eruptions are caused primarily by themovement of(1) rock by erosion (3) planetary winds(2) Earth in its orbit (4) tectonic plates
24 Which type of air mass forms over the oceannear the equator?(1) moist and warm (3) dry and warm(2) moist and cool (4) dry and cool
25 Which energy resource is considered non-renewable?(1) solar energy(2) fossil fuels(3) geothermal energy(4) hydroelectric power
26 The diagram below represents two atoms in a molecule of oxygen that combine chemicallywith one atom of carbon to form a carbon dioxidemolecule.
Carbon dioxide is an example of(1) a mixture (3) a solution(2) an element (4) a compound
27 Which weather condition commonly occursalong a cold front?(1) clear skies(2) precipitation(3) warm temperatures(4) dry air
(Oxygen) (Carbon) (Carbon dioxide)
(Not drawn to scale)
+
Grade 8 Science — June ’14 [7] [OVER]

Grade 8 Science — June ’14 [8]
28 Letters A, B, C, and D in the diagram below represent four positions of the Moon in its orbit around Earth.
At which Moon position would a person on Earth see the entire lighted half of the Moon (full-Moon phase)?(1) A (3) C(2) B (4) D
29 The arrows in the diagrams below represent the path of light as it strikes four different objects. Which diagram best represents the refraction of light?
( 1 ) ( 2 ) ( 4 )( 3 )
Sun’s
rays
Earth
D
B
A C
(Not drawn to scale)
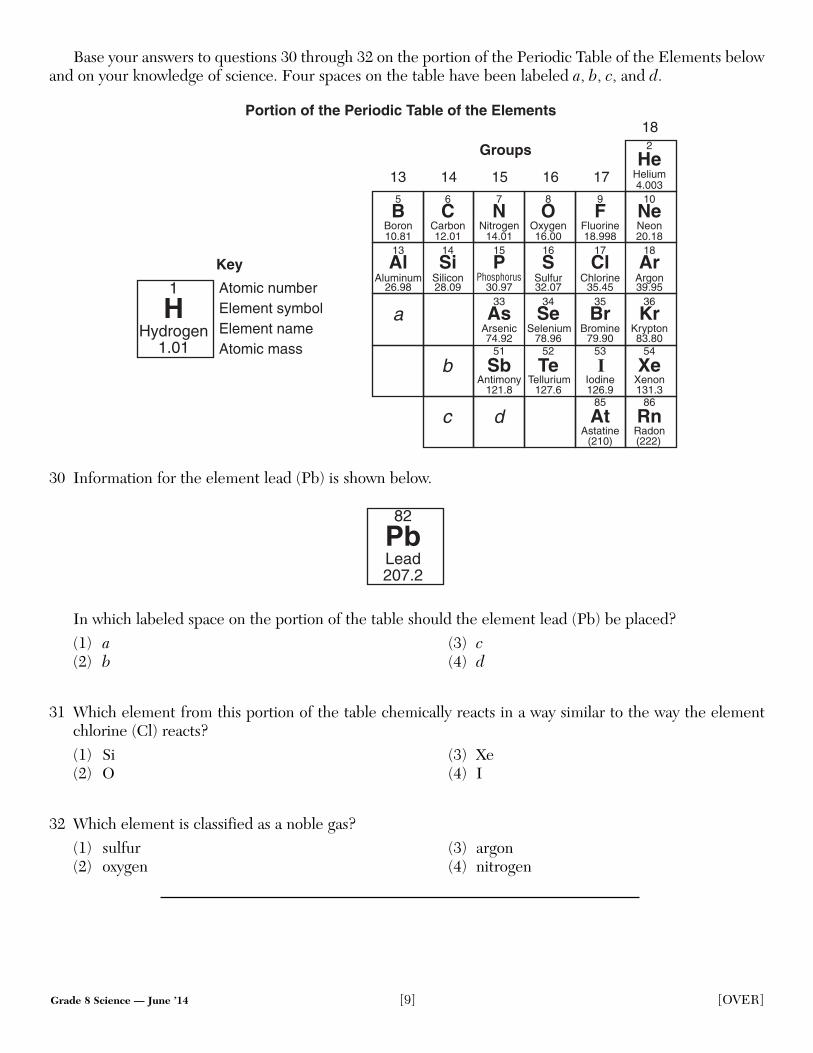
Base your answers to questions 30 through 32 on the portion of the Periodic Table of the Elements belowand on your knowledge of science. Four spaces on the table have been labeled a, b, c, and d.
30 Information for the element lead (Pb) is shown below.
In which labeled space on the portion of the table should the element lead (Pb) be placed?(1) a (3) c(2) b (4) d
31 Which element from this portion of the table chemically reacts in a way similar to the way the elementchlorine (Cl) reacts?(1) Si (3) Xe(2) O (4) I
32 Which element is classified as a noble gas?(1) sulfur (3) argon(2) oxygen (4) nitrogen
Pb82
207.2Lead
He2
5 6 7 8 9 10
13 14 15 16 17 18
33 34 35
51 52 53 54
85 86
10.81 12.01 14.01 16.00 18.998 20.18
4.003Helium
B C N O F Ne
ArClSPSiAl
As Se Br Kr
Sb Te XeI
At Rn
Boron Carbon Nitrogen Oxygen Fluorine Neon
ArgonChlorineSulfurAluminum Silicon26.98 28.09 30.97 32.07 35.45 39.95
KryptonBromineSeleniumArsenic74.92 79.9078.96 83.80
131.3XenonAntimony IodineTellurium
121.8 126.9127.6
(210) (222)RadonAstatine
36
c
Groups
13 14 15 16 17
18
a
b
d
Atomic numberElement symbolElement nameAtomic mass
H1
1.01Hydrogen
Key
Portion of the Periodic Table of the Elements
Grade 8 Science — June ’14 [9] [OVER]

Grade 8 Science — June ’14 [10]
Base your answers to questions 33 through 35 on the table below and on your knowledge of science. The table shows some physical properties of four minerals.
Physical Properties of Four Minerals
33 Which mineral is hard and has the same color and streak?(1) magnetite (3) pyrite(2) muscovite mica (4) sulfur
34 The volume of a sample of sulfur was measured to be 5.0 cm3. Based on the equation below, what is themass of this sample?
MassDensity � ________
Volume
(1) 2.5 grams (3) 5.0 grams(2) 2.0 grams (4) 10.0 grams
35 Which physical property best distinguishes magnetite from pyrite?(1) luster (3) color(2) streak (4) hardness
MineralPhysical Properties
Luster Density Streak Color Hardness
magnetite metallic 5.2 g/cm3 black black hard
muscovitemica
nonmetallic 2.8 g/cm3 colorless towhite
colorless toyellow
soft
pyrite metallic 5.0 g/cm3 greenishblack
brassyyellow
hard
sulfur nonmetallic 2.0 g/cm3 white toyellow
yellow toamber
soft

Grade 8 Science — June ’14 [11] [OVER]
Base your answers to questions 36 and 37 on thediagram below and on your knowledge of science.The diagram represents a person pushing a 50-kg boxup a ramp.
36 Which two simple machines are being used inthe diagram?(1) inclined plane; pulley(2) inclined plane; wheel and axle(3) lever; pulley(4) lever; wheel and axle
37 Which force will decrease if the surface of theramp is made smoother?(1) gravity (3) friction(2) magnetism (4) electricity
38 A substance in the solid phase (state) of matterhas(1) a definite shape and a definite volume(2) a definite shape, but no definite volume(3) no definite shape, but a definite volume(4) no definite shape and no definite volume
39 Which atmospheric gas has the greatest effect onthe weather conditions associated with an airmass?(1) oxygen (3) methane(2) nitrogen (4) water vapor
40 Which process transfers heat when particlescollide in a solid?(1) convection (3) radiation(2) conduction (4) evaporation
41 In a car accident, a seat belt helps preventinjuries by applying a force(1) less than the force of the moving passenger(2) greater than the force of the moving car(3) in the same direction as the car’s motion(4) in the opposite direction of the passenger’s
motion
42 The force of gravitational attraction between twoobjects depends on the distance between theobjects and their(1) buoyancies (3) masses(2) temperatures (4) shapes
43 The graph below shows population data for onekind of insect over a 50-year period.
Which statement best describes the populationof this insect over the 50-year period?(1) It decreased steadily.(2) It increased steadily.(3) It remained constant.(4) It followed a cyclic pattern.
1943
Year
1938
1933
1928
1923
1918
1913
1908
1903
1898
1893
Inse
ct P
op
ula
tio
n
Insect Population Over Time
50 kg

Grade 8 Science — June ’14 [12]
44 The data table below shows times that an observer in New York State saw the Moon rise during a 5-dayperiod. The time of the Moon rise on Wednesday is not shown.
Time of the Moon Rise for 5 Days
Based on the pattern in the data table, at what time did the Moon rise on Wednesday?(1) 10:00 p.m. (3) 11:00 p.m.(2) 10:44 p.m. (4) 11:15 p.m.
45 The solubility graph below shows the amounts of four substances that will dissolve in 100 grams of waterat various water temperatures.
Which substance has 80 grams of solute dissolved in 100 grams of water at 50°C?(1) potassium bromide (3) potassium chloride(2) ammonium chloride (4) lithium hydroxide
Solubility Graph
Water Temperature (°C)
0 10 20 30 40 50 60 70 80 90 100
110
100
90
80
70
60
50
40
30
20
10
0
Gra
ms
of
So
lute
th
at W
ill D
isso
lve
in 1
00 G
ram
s o
f W
ater
Lithium hydroxide
Potassium chloride
Ammonium chloridePotassium bromide
Day of theWeek
Monday Tuesday Wednesday Thursday Friday
Time of theMoon Rise
9:00 p.m. 9:52 p.m. ??? 11:36 p.m. 12:28 a.m.
Part II
Directions (46–85): Record your answers in the space provided below each question.
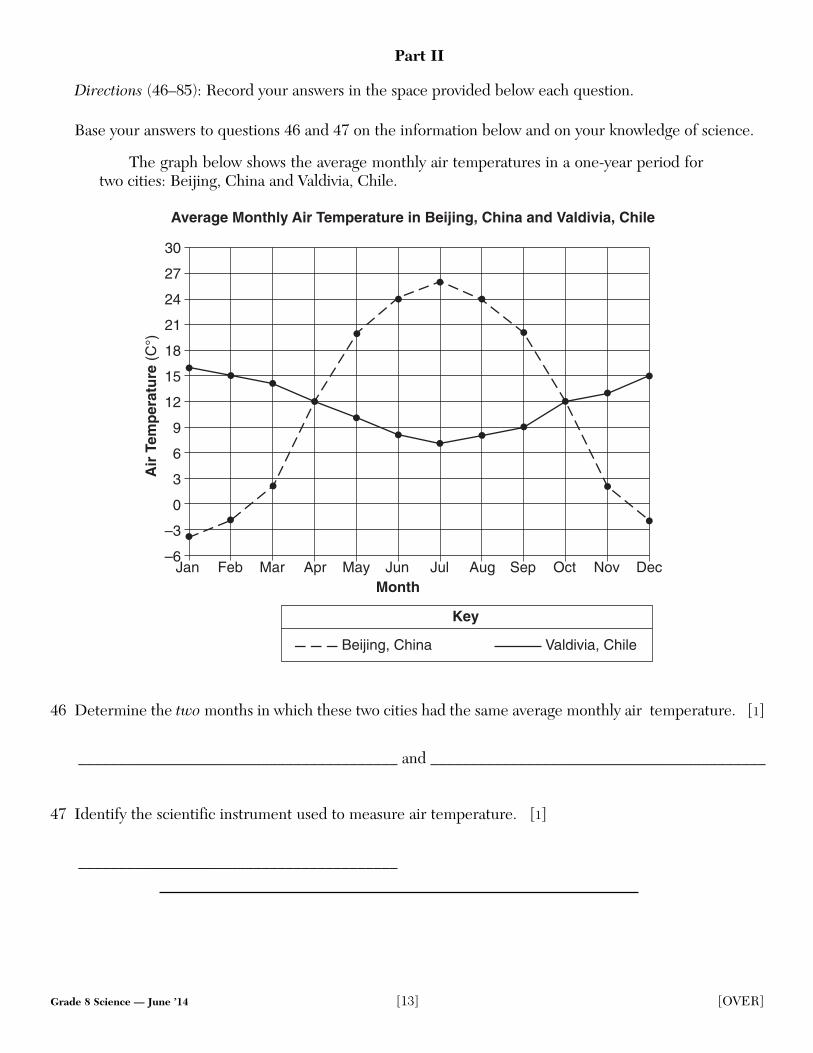
Base your answers to questions 46 and 47 on the information below and on your knowledge of science.
The graph below shows the average monthly air temperatures in a one-year period fortwo cities: Beijing, China and Valdivia, Chile.
46 Determine the two months in which these two cities had the same average monthly air temperature. [1]
________________________________________ and __________________________________________
47 Identify the scientific instrument used to measure air temperature. [1]
________________________________________
30
27
24
21
18
15
12
9
6
3
0
–3
–6
Month
Air
Tem
per
atu
re (
C°)
Jan Feb Mar Apr May Jun Jul Aug Sep Oct Nov Dec
Average Monthly Air Temperature in Beijing, China and Valdivia, Chile
Key
Beijing, China Valdivia, Chile
Grade 8 Science — June ’14 [13] [OVER]

Grade 8 Science — June ’14 [14]
Base your answers to questions 48 through 50 on the information below and on your knowledge of science.
A group of students conducted an experiment to test the hypothesis that radish plantswatered with acidic rainwater would not be as tall as radish plants watered with nonacidicrainwater. The students planted two identical radish seeds in equal amounts of soil. One waswatered with nonacidic rainwater, and the other was watered with an equal amount of acidicrainwater. All other variables that would affect plant growth were the same for both plants.The students measured the heights of the plants in centimeters (cm). The height of the plantwatered with acidic rainwater on various days is shown in the table below.
Data Table
48 The height of the plant watered with nonacidic rainwater is shown by the dashed line on the graph below.On the graph, use an X to plot the height of the plant watered with acidic rainwater for each day shownin the data table. Connect the Xs with a solid line. [1]
0 4 10 14 20Day
Hei
gh
t (c
m)
2 6 8 12 16 18
10
9
8
7
6
5
4
3
2
1
0
Height of Radish Plants
Nonaci
dic
rain
wat
er
DayHeight of Plant Wateredwith Acidic Rainwater
(cm)
8 1
12 2
14 3
17 4
20 7

Grade 8 Science — June ’14 [15] [OVER]
49 Describe how the data support the student’s original hypothesis. [1]
______________________________________________________________________________________
______________________________________________________________________________________
50 Describe one way in which the students might improve the design of this experiment if it were repeated. [1]
______________________________________________________________________________________
______________________________________________________________________________________
Base your answers to questions 51 and 52 on the pie graphs below. The graphs show the percentage ofCalories from different nutrients found in two different cheeseburgers, A and B.
51 Determine the difference between the percentage of Calories that come from fat in cheeseburger A andthe percentage of Calories that come from fat in cheeseburger B. [1]
_______________ %
52 Cheeseburger B contains 600 total Calories. Calculate the number of these Calories that come from protein. [1]
_______________ Calories
40%carbohydrates 42%
fat
18%protein
31%carbohydrates 49%
fat
20%protein
Cheeseburger A Cheeseburger B
Percentage of Calories from Different Nutrients

Grade 8 Science — June ’14 [16]
Base your answers to questions 53 and 54 on the topographic map of a hill below and on your knowledgeof science. The contour lines on the map show the elevation of the land above sea level. Point X represents alocation on the hill.
53 Determine the elevation of location X. [1]
_______________ ft
54 Describe one piece of evidence on the map that indicates that the western side of the hill has the steepest slope. [1]
______________________________________________________________________________________
______________________________________________________________________________________
55 Pea plants can produce pods that are green or yellow. The gene for green color (G) is dominant and thegene for yellow color (g) is recessive. Complete the Punnett square below to show the results of a crossbetween two green pea plants with Gg genes. [1]
G g
G
g
X
600
Contour interval = 20 feet
N
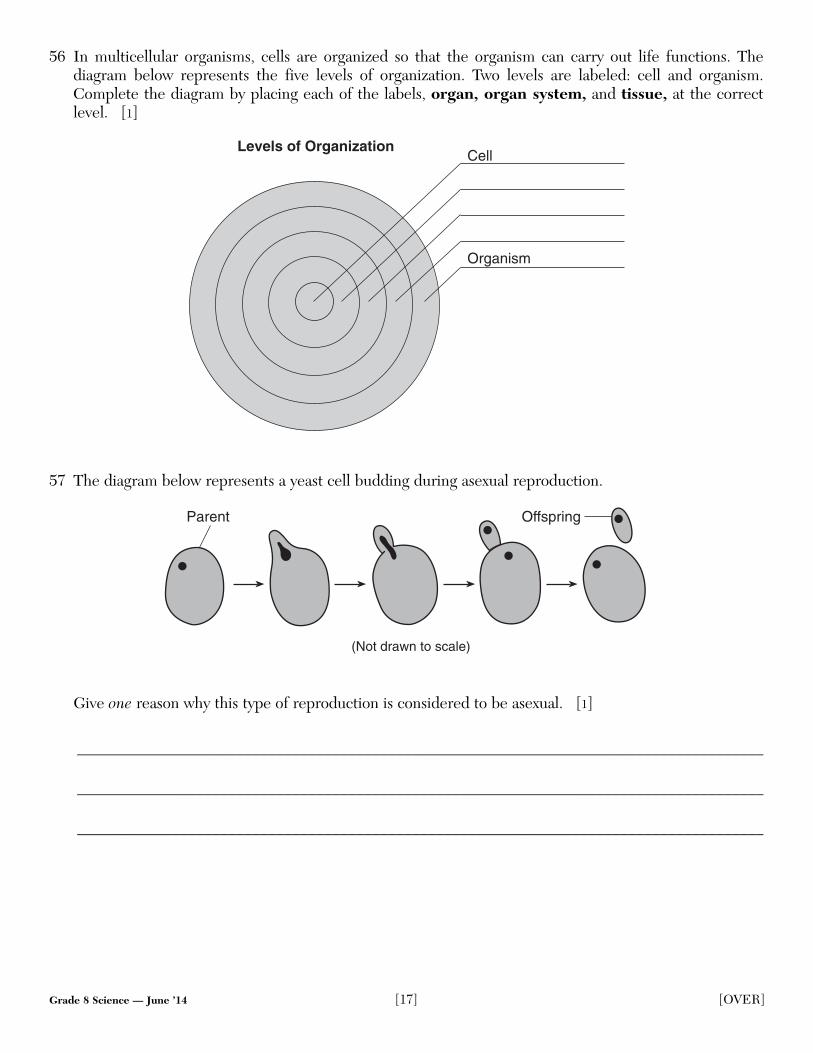
56 In multicellular organisms, cells are organized so that the organism can carry out life functions. The diagram below represents the five levels of organization. Two levels are labeled: cell and organism.Complete the diagram by placing each of the labels, organ, organ system, and tissue, at the correctlevel. [1]
57 The diagram below represents a yeast cell budding during asexual reproduction.
Give one reason why this type of reproduction is considered to be asexual. [1]
______________________________________________________________________________________
______________________________________________________________________________________
______________________________________________________________________________________
Parent Offspring
(Not drawn to scale)
Cell
Organism
Levels of Organization
Grade 8 Science — June ’14 [17] [OVER]

Base your answers to questions 58 through 60 on the chart below and on your knowledge of science. The chart shows the levels of classification for five different organisms.
Levels of Classification for Five Organisms
58 Identify the most general level of classification shown for the E. coli bacteria. [1]
________________________________________
59 Identify the two organisms in the chart most closely related by level of classification. [1]
________________________________________ and __________________________________________
60 Identify one organism in the chart that is a decomposer. [1]
________________________________________
Level ofClassification
Organism
DomesticDog
Orange DayLily
E. coliBacteria
White ButtonMushroom
WolfSpider
Kingdom Animalia Plantae Monera Fungi Animalia
Phylum Chordata Magnoliophyta Proteobacteria Basidiomycota Arthropoda
Class Mammalia LiliopsidaGamma
ProteobacteriaAgaricomycetes Arachnida
Order Carnivora Liliales Enterobacteriales Agaricales Araneae
Family Canidae Liliaceae Enterobacteriaceae Agaricaceae Lycosidae
Genus Canis Hemerocallis Escherichia Agaricus Pardosa
Species familiaris fulva coli bisporus atlantica
Grade 8 Science — June ’14 [18]

Base your answers to questions 61 and 62 on the diagram below, which represents several parts of the humandigestive system, and on your knowledge of science.
61 Describe one way that food is mechanically changed during the process of digestion. [1]
______________________________________________________________________________________
______________________________________________________________________________________
62 Two other human body systems are listed below. Circle one body system from the list and describe howthat body system works together with the digestive system. [1]
Circle one: circulatory skeletal
Description: ___________________________________________________________________________
______________________________________________________________________________________
Grade 8 Science — June ’14 [19] [OVER]

Base your answers to questions 63 and 64 on the diagram below and on your knowledge of science. Thediagram represents a cross section of rock layers A, B, and C and some fossils found within them. The rocklayers have not been overturned.
63 Describe one piece of evidence in the diagram that shows rock layer A formed after rock layer B. [1]
______________________________________________________________________________________
______________________________________________________________________________________
64 Are the rock layers shown most likely igneous, metamorphic, or sedimentary? Circle your answer belowand describe one piece of evidence in the diagram that supports your answer. [1]
Circle one: igneous metamorphic sedimentary
Evidence: _____________________________________________________________________________
______________________________________________________________________________________
(Not drawn to scale)
Rock Layers
A
B
C
Grade 8 Science — June ’14 [20]
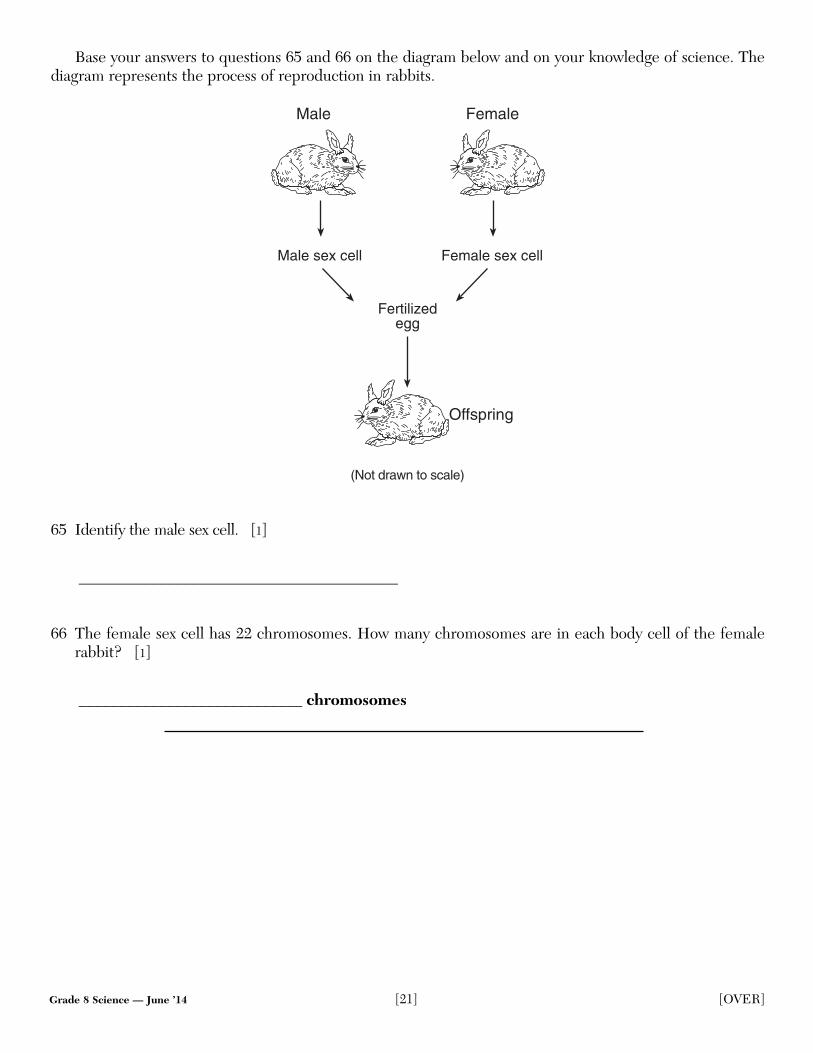
Base your answers to questions 65 and 66 on the diagram below and on your knowledge of science. Thediagram represents the process of reproduction in rabbits.
65 Identify the male sex cell. [1]
________________________________________
66 The female sex cell has 22 chromosomes. How many chromosomes are in each body cell of the femalerabbit? [1]
____________________________ chromosomes
Male sex cell
Offspring
(Not drawn to scale)
FemaleMale
Female sex cell
Fertilizedegg
Grade 8 Science — June ’14 [21] [OVER]

Base your answers to questions 67 and 68 on the partial food web below and on your knowledge of science.
67 These organisms can be classified according to the way they obtain energy. Complete the chart below byidentifying one example of each type of organism labeled in this food web. [1]
68 Explain why the population of rabbits might decrease if the population of mice decreased. [1]
______________________________________________________________________________________
______________________________________________________________________________________
______________________________________________________________________________________
Type of Organism Example in Food Web
carnivore
herbivore
producer
Snakes
Rabbits
(Not drawn to scale)
Grasses
Mice
Wheat plants
Owls
Grade 8 Science — June ’14 [22]

69 The diagram below represents two gases being cycled through an ecosystem. Letter X represents one of thosegases.
Identify the gas represented by X. [1]
________________________________________
70 The map below shows the location of a nature preserve and the surrounding area. The preserve is anecosystem that is home to several endangered species.
Based on the map, describe one human activity that could have a negative effect on the nature preserve. [1]
______________________________________________________________________________________
______________________________________________________________________________________
Nature Preserve
Landfill
ShoppingMall
Highway
HousingDevelopment
Shopping Mall
N
Oxygen
Photosynthesis(green plants)
Cellular respiration(plants and animals)
X
Sun
Grade 8 Science — June ’14 [23] [OVER]
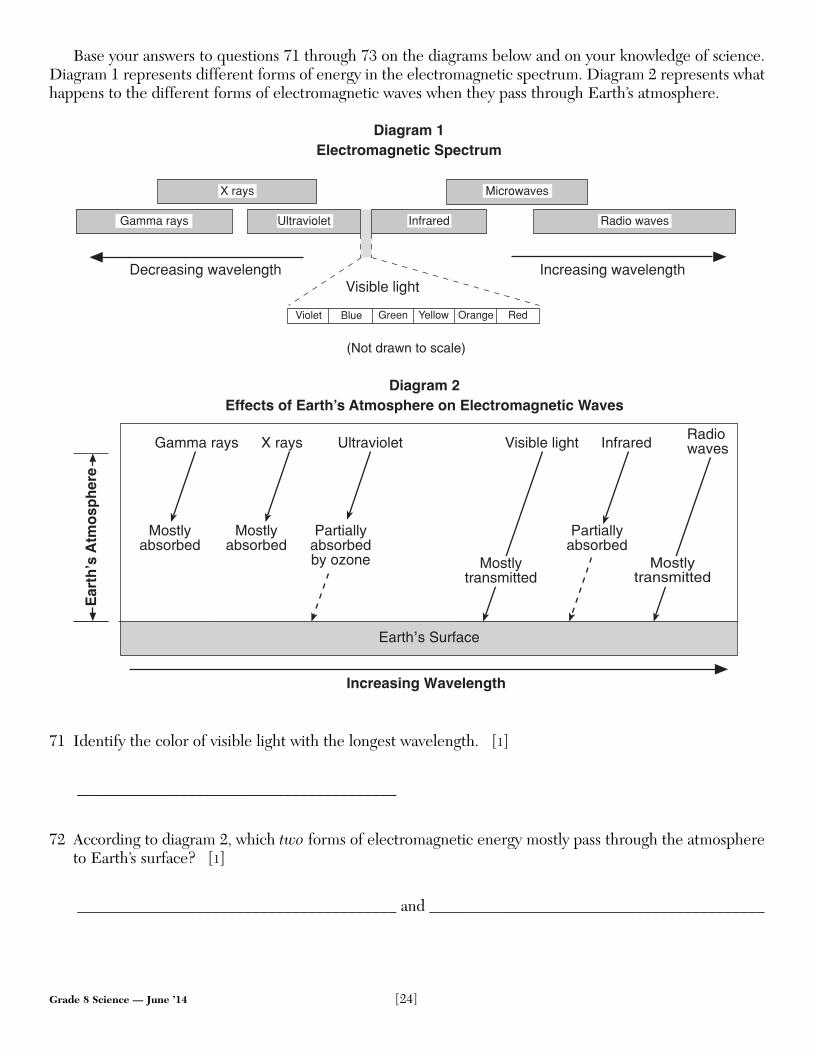
Base your answers to questions 71 through 73 on the diagrams below and on your knowledge of science.Diagram 1 represents different forms of energy in the electromagnetic spectrum. Diagram 2 represents whathappens to the different forms of electromagnetic waves when they pass through Earth’s atmosphere.
71 Identify the color of visible light with the longest wavelength. [1]
________________________________________
72 According to diagram 2, which two forms of electromagnetic energy mostly pass through the atmosphereto Earth’s surface? [1]
________________________________________ and __________________________________________
Partiallyabsorbedby ozone
Partiallyabsorbed
InfraredVisible lightUltravioletX raysGamma raysRadiowaves
Earth’s Surface
Mostlyabsorbed
Mostlyabsorbed
Mostlytransmitted
Mostlytransmitted
Increasing Wavelength
(Not drawn to scale)
Diagram 1Electromagnetic Spectrum
Grade 8 Science — June ’14 [24]
73 Ultraviolet rays can cause skin cancer in humans and other living things. Explain why the depletion of theozone layer by pollutants has increased the risk of skin cancer. [1]
______________________________________________________________________________________
______________________________________________________________________________________
______________________________________________________________________________________
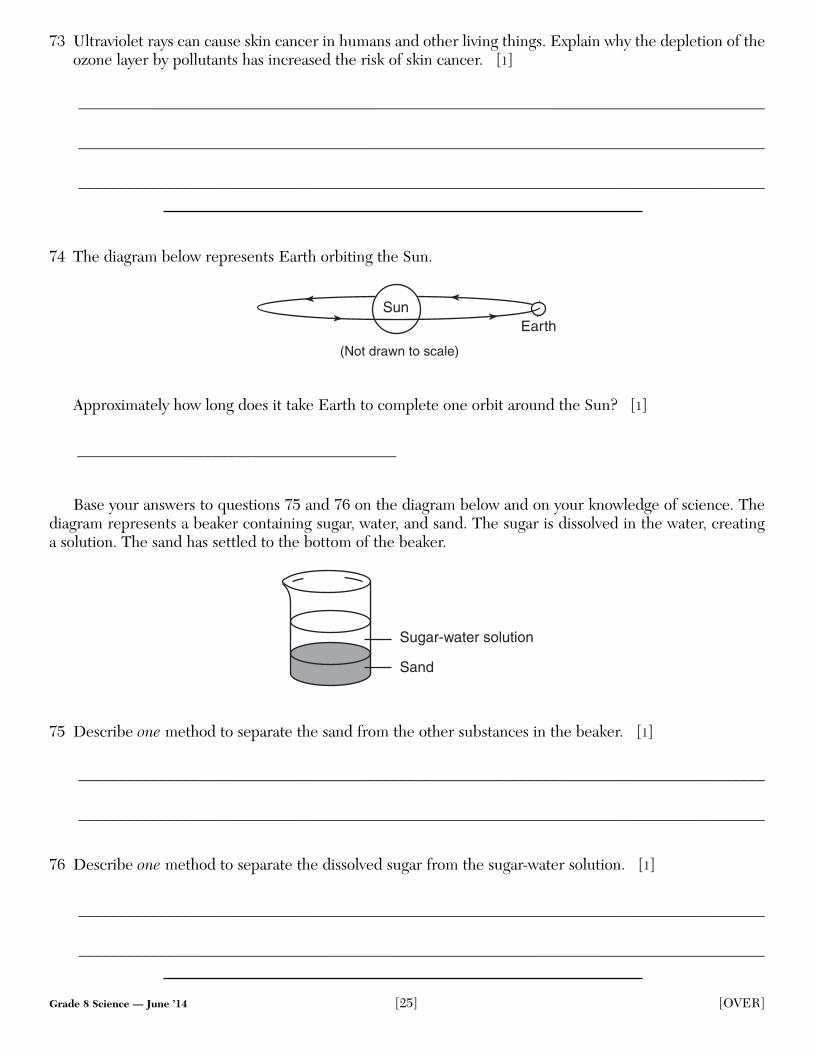
74 The diagram below represents Earth orbiting the Sun.
Approximately how long does it take Earth to complete one orbit around the Sun? [1]
________________________________________
Base your answers to questions 75 and 76 on the diagram below and on your knowledge of science. Thediagram represents a beaker containing sugar, water, and sand. The sugar is dissolved in the water, creating a solution. The sand has settled to the bottom of the beaker.
75 Describe one method to separate the sand from the other substances in the beaker. [1]
______________________________________________________________________________________
______________________________________________________________________________________
76 Describe one method to separate the dissolved sugar from the sugar-water solution. [1]
______________________________________________________________________________________
______________________________________________________________________________________
Sugar-water solution
Sand
Sun
(Not drawn to scale)
Earth
Grade 8 Science — June ’14 [25] [OVER]

Base your answers to questions 77 and 78 on diagrams A and B below and on your knowledge of science. Diagram A represents a glass of water containing ice cubes. As the water and glass cooled, dropletsformed on the outside of the glass. Diagram B represents the same undisturbed glass of water two days later.
77 Complete the chart below by identifying the phase change that caused each event. [1]
78 Explain why the ice floats in the liquid water in diagram A. [1]
______________________________________________________________________________________
______________________________________________________________________________________
Event Phase Change
Water droplets formed on the outside of the glass in diagram A.
Ice is no longer visible in diagram B.
The level of water in the glass dropped indiagram B.
Water dropletson the outside
of the glassDiagram A Diagram B
2 days later
Icecubes
Glass
Water
Glass
Water
Grade 8 Science — June ’14 [26]
Grade 8 Science — June ’14 [27] [OVER]
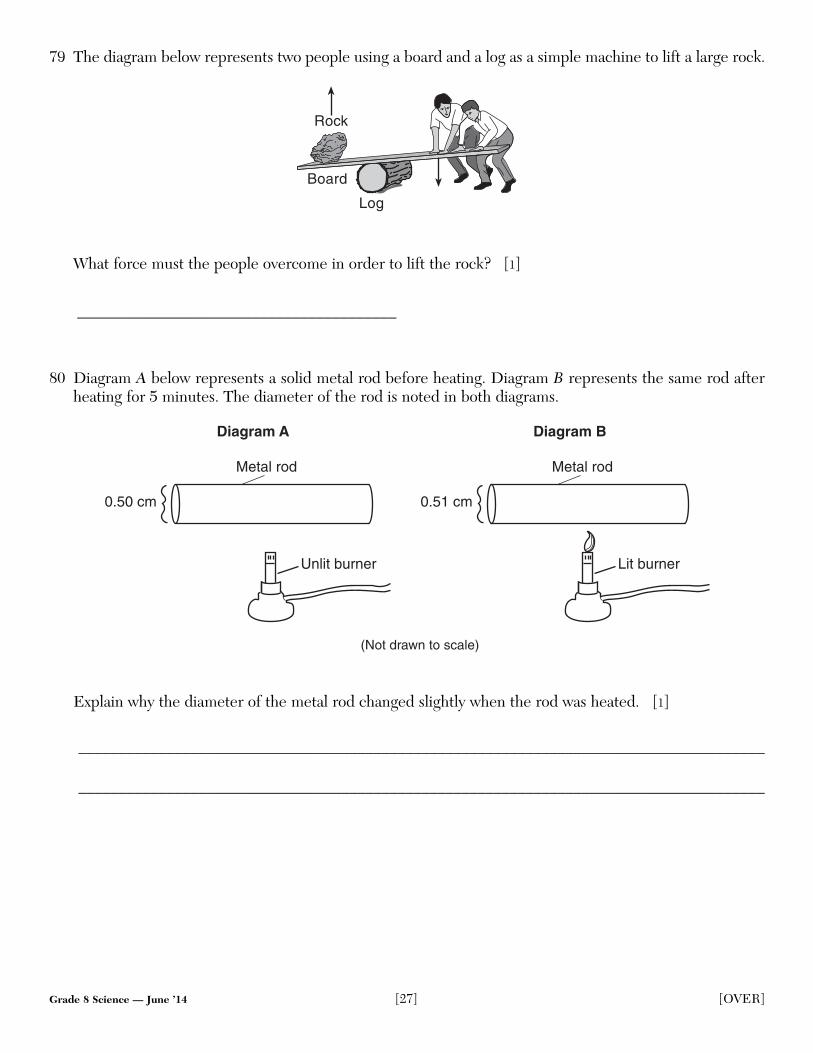
79 The diagram below represents two people using a board and a log as a simple machine to lift a large rock.
What force must the people overcome in order to lift the rock? [1]
________________________________________
80 Diagram A below represents a solid metal rod before heating. Diagram B represents the same rod afterheating for 5 minutes. The diameter of the rod is noted in both diagrams.
Explain why the diameter of the metal rod changed slightly when the rod was heated. [1]
______________________________________________________________________________________
______________________________________________________________________________________
0.50 cm
Unlit burner Lit burner
Metal rod
Diagram A Diagram B
(Not drawn to scale)
0.51 cm
Metal rod
Log
Rock
Board

Base your answers to questions 81 through 83 on the information and diagram below and on your knowledge of science. The diagram represents the magnetic field lines of a bar magnet. Four magnetic compasses, labeled 1, 2, 3, and 4, are located along one of the field lines. The compass needle inside compass4 has been left out.
81 Explain why the south end of the needle in compass 1 is pointing toward the north pole of the magnet. [1]
______________________________________________________________________________________
______________________________________________________________________________________
______________________________________________________________________________________
82 Explain why the magnetic force acting on compass 1 is greater than the magnetic force acting on compass 3. [1]
______________________________________________________________________________________
______________________________________________________________________________________
______________________________________________________________________________________
N S
1
2 3
4
Key
South end
North endCompassneedle
Field line
Grade 8 Science — June ’14 [28]

83 On the diagram of compass 4 below, draw the needle of the compass correctly oriented to the magnet, andshade the north end of the compass needle to show how the compass should appear at that position. [1]
S
4
Grade 8 Science — June ’14 [29] [OVER]
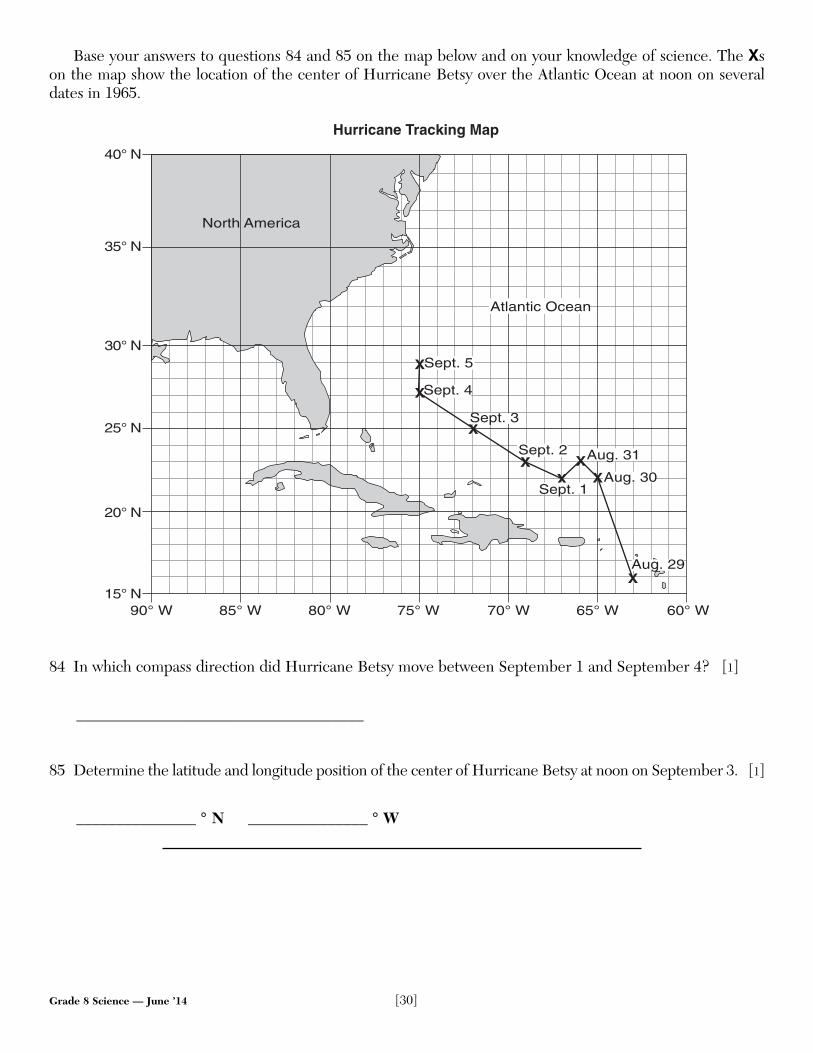
Base your answers to questions 84 and 85 on the map below and on your knowledge of science. The Xson the map show the location of the center of Hurricane Betsy over the Atlantic Ocean at noon on severaldates in 1965.
84 In which compass direction did Hurricane Betsy move between September 1 and September 4? [1]
____________________________________
85 Determine the latitude and longitude position of the center of Hurricane Betsy at noon on September 3. [1]
_______________ ° N _______________ ° W
North America
15° N
20° N
25° N
30° N
35° N
40° N
85° W 80° W 75° W 70° W 65° W90° W
Hurricane Tracking Map
60° W
X
Atlantic Ocean
XX
XX
X
X
X
Aug. 31Sept. 2
Sept. 3
Sept. 5
Sept. 4
Sept. 1Aug. 30
Aug. 29
Grade 8 Science — June ’14 [30]

For Teacher Use OnlyPart II Credits
QuestionMaximum
CreditCredit
Allowed
46 147 148 149 150 151 152 153 154 155 156 157 158 159 160 161 162 163 164 165 166 167 168 169 170 171 172 173 174 175 176 177 178 179 180 181 182 183 184 185 1
Total 40
GRADE 8 INTERMEDIATE-LEVEL SCIENCEGRADE 8 INTERMEDIATE-LEVEL SCIENCE
Printed on Recycled Paper


