
The transcriptome of corresponding cumulus and granulosa cellsDo differences in genetic markers of cumulus andgranulosa cells reflect the implantation potentialof the oocyte?
Marie Louise Grøndahl, DVM, PhD
Laboratory of Reproductive Biology and Fertility Clinic, University Hospital of Copenhagen, Rigshospitalet, Copenhagen, Denmark.
e-mail: [email protected]

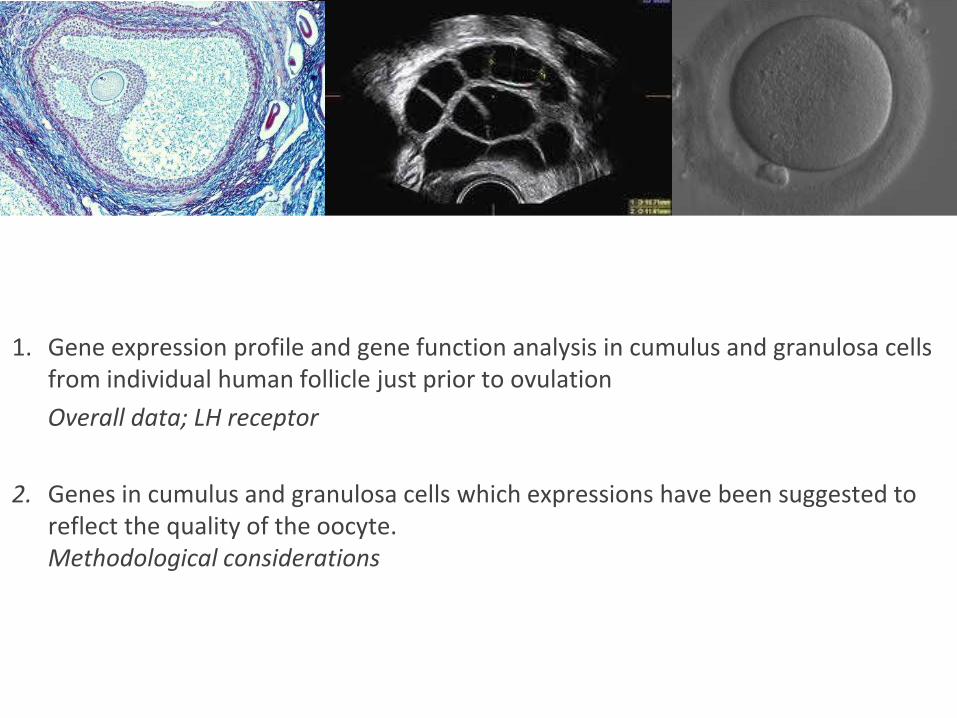
1. Gene expression profile and gene function analysis in cumulus and granulosa cells from individual human follicle just prior to ovulation
Overall data; LH receptor
2. Genes in cumulus and granulosa cells which expressions have been suggested to reflect the quality of the oocyte. Methodological considerations

Cumulus cells, CC
30-40 pre-granulosa cells
Mural granulosa cells, MGC
FolliculogenesisFrom pre-granulosa to cumulus and granulosa cells
Review: Zuccotti et al., 2011
Activators
•LIF
•GDF9
•Kit ligand
•BMP4/7/15
•
Suppressors
•AMH
•P27
•FOXO3a
•PTEN
•
•TGF-b
•BMP15
•GDF9
•Activins
•
•
~ 50,000,000
~ 500-1000

Gene expression profile - TranscriptomeA snapshot of the activity in the cells

A: Picopure RNA Isolation kit
B: Double amplification protocol for small RNAsamples. Affymetrix
C: HG-U133plus2 GeneChip array. Affymetrix
D: Scanning, data handling software, analysis
E: Confirmation af array dataRT-PCR. TaqMan® Probes
Microarray analysis

Gene expression profile and gene function analysis of cumulus and granulosa cells from individual human follicle just prior to ovulation
Overall data, LH receptor
1

•12 women aged 27-39 years in IVF / ICSI treatment
•Controlled ovarian hyperstimulation
•Short antagonist protocol
•rFSH and hCG (10.000 IU)
Corresponding cumulus and granulosa cells
from 12 large (mean: 3.5 ml) pre-ovulatory follicles
containing a MII oocyte
•RT-PCR confirmation in additional 6 independent women
Materials and Methods

Flash frozen -196 °C Storage -80 °C
RNAse inhibitor RNAse inhibitor
within 30 minutes after OPU
Materials and MethodsIsolation of granulosa and cumulus cells
Flash frozen -196 °C Storage -80 °C

•CD45 (leucocyte marker)
negative
•CYP17 (theca cell marker)
negative
Average 50 ng and 90 ng of total RNA extracted from the cumulus and mural granulosa cells, respectively
Grøndahl et al., 2009, 2010, 2011
DCHIP
Homogeneous cell populations
Cumulus cells
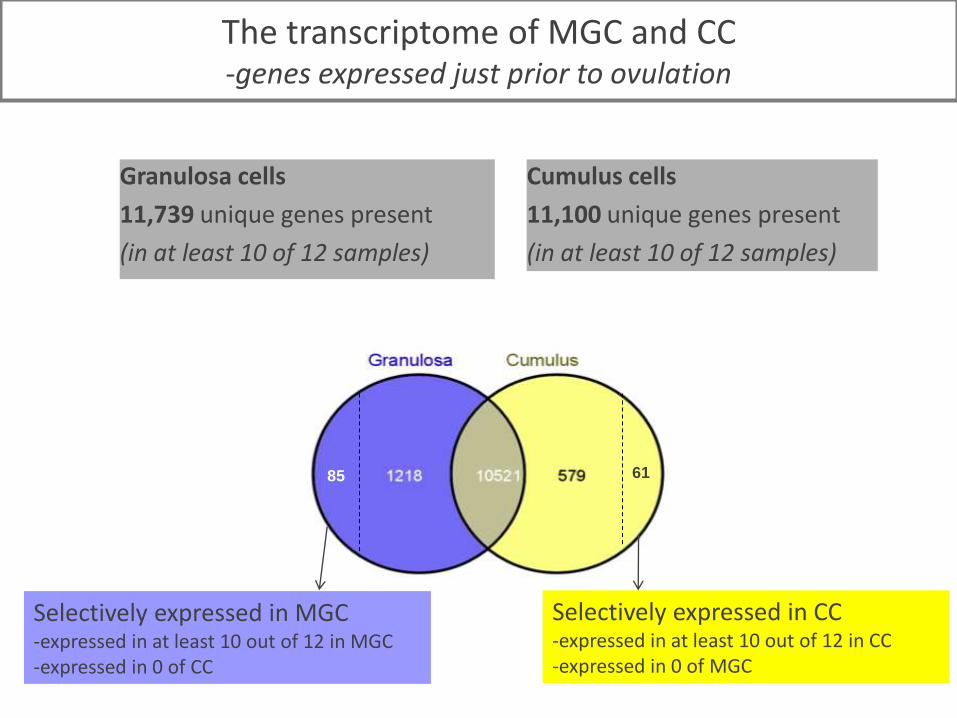
11,100 unique genes present
(in at least 10 of 12 samples)
Granulosa cells
11,739 unique genes present
(in at least 10 of 12 samples)
85 61
The transcriptome of MGC and CC-genes expressed just prior to ovulation
Selectively expressed in MGC-expressed in at least 10 out of 12 in MGC-expressed in 0 of CC
Selectively expressed in CC-expressed in at least 10 out of 12 in CC-expressed in 0 of MGC

Paired t-test with Benjamini Hochberg multiple testing corrections with p-value below 0.01, fold-change larger than 2 and difference of means larger than 50
1542 unique genes were differentially expressed by more than 2 fold
489 genes differentially expressed227 overlap with present dataSamples represent cohort of folliclesCC isolated in connection to ICSICC up-to 4 hours in vitroMGC cells isolated by centrifugationMGC CYP17 (theca cell) positiveKôks et al. 2009
Differentially expressed genes in CC and MCG
CC MGC

1542 differentially expressed genes
Lower (2-8) fold changed1377 genes
High (>8) fold changed165 genes
Gene function enrichment analysis ofthe differentially expressed genes

Number of genes
Gene function enrichment of differentially expressedlower (2-8) fold changed genes (p<0.001)

Number of genes
Gene function enrichment of differentially expressed high (>8) fold changed genes (p<0.001)

85 61
0 5 10 15 20
cell communication
signal transduction
multicellular organismal process
extracellular region
cell surface receptor linked signal transduction
nervous system development
substrate specific channel activity
gated channel activity
proteinaceous extracellular matrix
enzyme linked receptor protein signaling pathway
0 10 20 30 40 50
catalytic activity
hydrolase activity
mitochondrion
lipid metabolic process
carboxylic acid metabolic process
organic acid metabolic process
monocarboxylic acid metabolic process
protein serine/threonine phosphatase activity
metallocarboxypeptidase activity
Series1
Number of genes Number of genes
RYR2: Ryanodine Receptor 2
AMH: Anti-Mullerian Hormone
Gene function enrichment (p<0.001) of selectively expressed genes

Cholesterol Synthesiso24-dehydrocholesterolreductaseoCYP51
Cholesterol deliveryScarb1
Transfer of substrate cholesterol to the inner mitochondrial membranefor steroidogenesis.StAR
CYP11A / P450scc
Wikipedia, 2010
CY
P1
9A
/ Aro
ma
tase
•CYP19A1 expression significantly higher in cumulus cells as compared to floating granulosa cells(Kôks et al. 2009) Human
•Mature COC in culture express high aromatase activity and produce estradiol when androgen is present in the culture media. (Bar-Ami et al., 1997) Human
Steroidogenic genes in MGC and CC
Top 10 in both the CC and MGCExpression of genes for cholesterol
availability for steroidogenesis

• FSH receptor was not expressed in appreciable levels in neither
CC nor MGC
• LH receptor was moderately expressed at the same level in both
CC and MGC
Xu et al.,
2010
Ovulatory dose of
hCG induces
abolishment of the
gonadotrophinreceptor
expression, where
after the LH receptor
mRNA reappear
(Eyster and Stouffer,
1985, Xu et al., 2010).
Gonadotropin receptors

• These findings may reflect that LH receptor expression levels in the
somatic cell compartment are correlated to patients or more likely
correlated to the individual follicle
• Variation in LH receptor expression in MGC
and CC: up-to 10 fold difference in expression
level
(Haouzi et al., 2009)
LH receptor expression
0,00
500,00
1000,00
1500,00
2000,00
2500,00
3000,00
3500,00
4000,00
4500,00
0,00 500,00 1000,00 1500,00 2000,00
Cumulus
Mu
ral
gra
nu
los
a
Pearson correlation coefficient = 0.72
p-value = 0.003
Variarion in LH expression in Cumulus cells
0,00
500,00
1000,00
1500,00
2000,00
0 2 4 6 8 10 12 14
Sample number
Exp
ressio
n v
alu
es ,
Mic
ro
array
Strong correlation between LH receptor expressionin corresponding CC and MGC

Gene name Symbol Pearson correlation coefficient
P-value
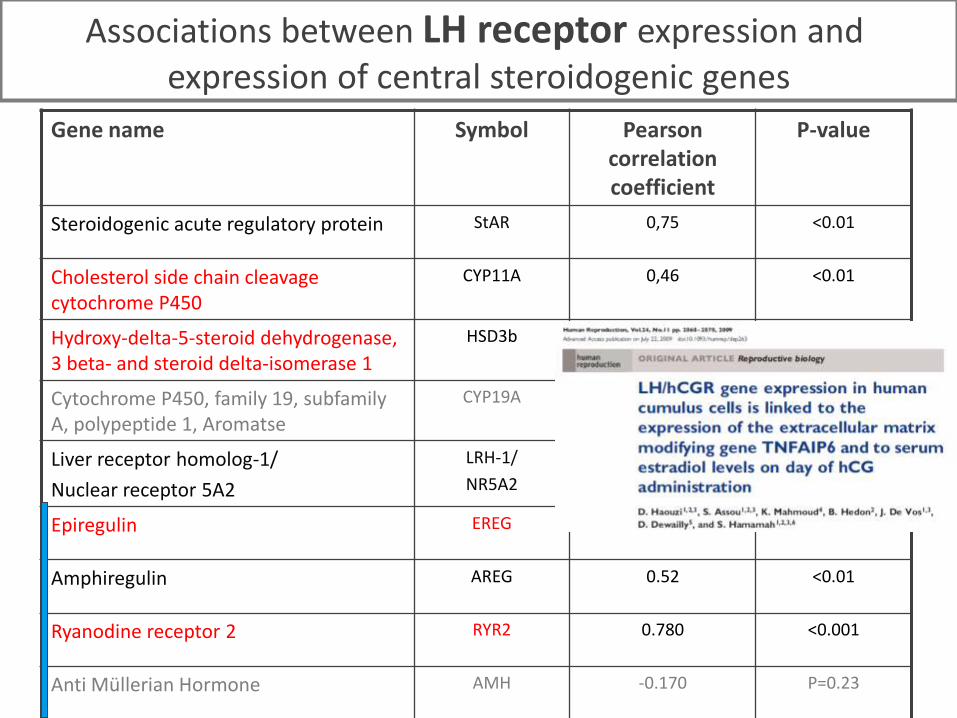
Steroidogenic acute regulatory protein StAR 0,75 <0.01
Cholesterol side chain cleavage cytochrome P450
CYP11A 0,46 <0.01
Hydroxy-delta-5-steroid dehydrogenase, 3 beta- and steroid delta-isomerase 1
HSD3b 0.63 <0.001
Cytochrome P450, family 19, subfamilyA, polypeptide 1, Aromatse
CYP19A 0.27 0.12
Liver receptor homolog-1/
Nuclear receptor 5A2
LRH-1/
NR5A2
0.45 <0.05
Epiregulin EREG 0.55 <0.01
Amphiregulin AREG 0.52 <0.01
Ryanodine receptor 2 RYR2 0.780 <0.001
Anti Müllerian Hormone AMH -0.170 P=0.23
Associations between LH receptor expression and expression of central steroidogenic genes
Gene name Symbol Pearson correlation coefficient
P-value
Steroidogenic acute regulatory protein StAR 0,75 <0.01
Cholesterol side chain cleavagecytochrome P450
CYP11A 0,46 <0.01
Hydroxy-delta-5-steroid dehydrogenase, 3 beta- and steroid delta-isomerase 1
HSD3b 0.63 <0.001
Cytochrome P450, family 19, subfamily A, polypeptide 1, Aromatse
CYP19A 0.27 0.12
Liver receptor homolog-1/
Nuclear receptor 5A2
LRH-1/
NR5A2
0.45 <0.05
Epiregulin EREG 0.55 <0.01
Amphiregulin AREG 0.52 <0.01
Ryanodine receptor 2 RYR2 0.780 <0.001
Anti Müllerian Hormone AMH -0.170 P=0.23
Associations between LH receptor expression and expression of central steroidogenic genes

The paired analysis within individual follicle gives a unique picture of the two
somatic cell compartments
Functional enrichment analysis of selectively expressed genes provided
list of genes describing a metabolic ‘phenotype’ of MGC and cell communication
‘phenotype’ of CC
High steroidogenic capacity was present in both cell-types with differences in
levels of genes encoding for enzymes involved in steroidogenesis
Correlation between LH receptor expression in corresponding CC and MGC
Association between both LH expression and central steroidogenic and growth
factor genes.
Confirmation of substantial inter follicle variation / unique milieu
Conclusion
Genes in cumulus and granulosa cells which expressions have been suggested to reflect the quality of the oocyte
Methodological considerations
2

Quality markers -increase the outcome of ART -reduce the multiple pregnancies
ESHRE, dec 2010
Sample TechniqueOocyte
competenceMGC CC
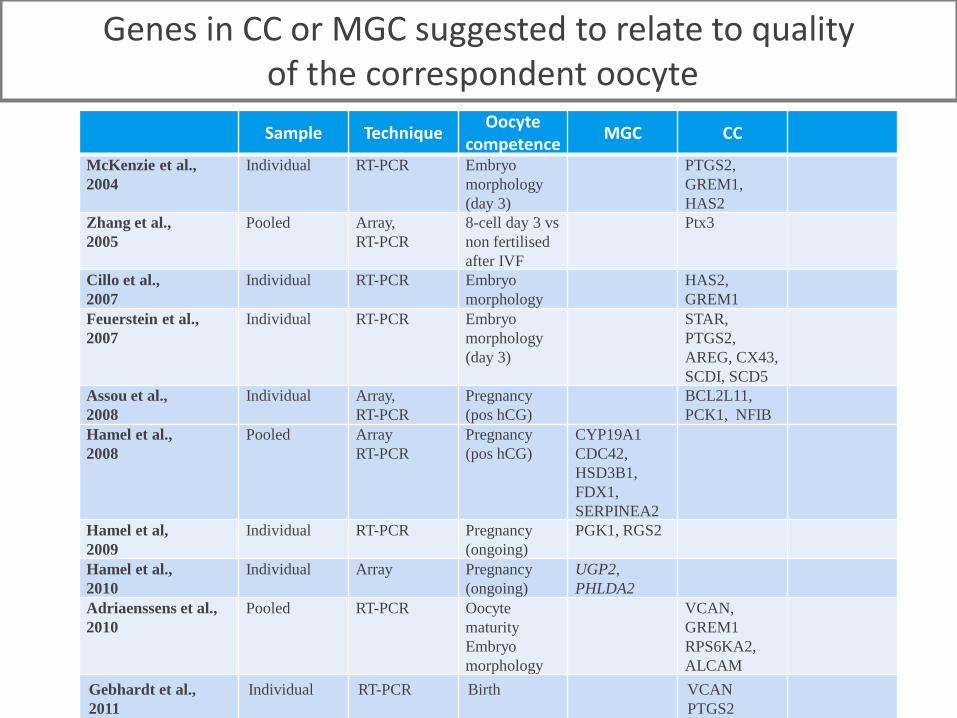
McKenzie et al.,
2004
Individual RT-PCR Embryo
morphology
(day 3)
PTGS2,
GREM1,
HAS2
Zhang et al.,
2005
Pooled Array,
RT-PCR
8-cell day 3 vs
non fertilised
after IVF
Ptx3
Cillo et al.,
2007
Individual RT-PCR Embryo
morphology
HAS2,
GREM1
Feuerstein et al.,
2007
Individual RT-PCR Embryo
morphology
(day 3)
STAR,
PTGS2,
AREG, CX43,
SCDI, SCD5
Assou et al.,
2008
Individual Array,
RT-PCR
Pregnancy
(pos hCG)
BCL2L11,
PCK1, NFIB
Hamel et al.,
2008
Pooled Array
RT-PCR
Pregnancy
(pos hCG)
CYP19A1
CDC42,
HSD3B1,
FDX1,
SERPINEA2
Hamel et al,
2009
Individual RT-PCR Pregnancy
(ongoing)
PGK1, RGS2
Hamel et al.,
2010
Individual Array Pregnancy
(ongoing)
UGP2,
PHLDA2
Adriaenssens et al.,
2010
Pooled RT-PCR Oocyte
maturity
Embryo
morphology
VCAN,
GREM1
RPS6KA2,
ALCAM
Gebhardt et al.,
2011
Individual RT-PCR Birth VCAN
PTGS2
Genes in CC or MGC suggested to relate to qualityof the correspondent oocyte

ESHRE, dec 2010
Sample TechniqueOocyte
competenceMGC CC
McKenzie et al.,
2004
Individual RT-PCR Embryo
morphology
(day 3)
PTGS2,
GREM1,
HAS2
Zhang et al.,
2005
Pooled Array,
RT-PCR
8-cell day 3 vs
non fertilised
after IVF
Ptx3
Cillo et al.,
2007
Individual RT-PCR Embryo
morphology
HAS2,
GREM1
Feuerstein et al.,
2007
Individual RT-PCR Embryo
morphology
(day 3)
STAR,
PTGS2,
AREG, CX43,
SCDI, SCD5
Assou et al.,
2008
Individual Array,
RT-PCR
Pregnancy
(pos hCG)
BCL2L11,
PCK1, NFIB
Hamel et al.,
2008
Pooled Array
RT-PCR
Pregnancy
(pos hCG)
CYP19A1
CDC42,
HSD3B1,
FDX1,
SERPINEA2
Hamel et al,
2009
Individual RT-PCR Pregnancy
(ongoing)
PGK1, RGS2
Hamel et al.,
2010
Individual Array Pregnancy
(ongoing)
UGP2,
PHLDA2
Adriaenssens et al.,
2010
Pooled RT-PCR Oocyte
maturity
Embryo
morphology
VCAN,
GREM1
RPS6KA2,
ALCAM
Gebhardt et al.,
2011
Individual RT-PCR Birth VCAN
PTGS2
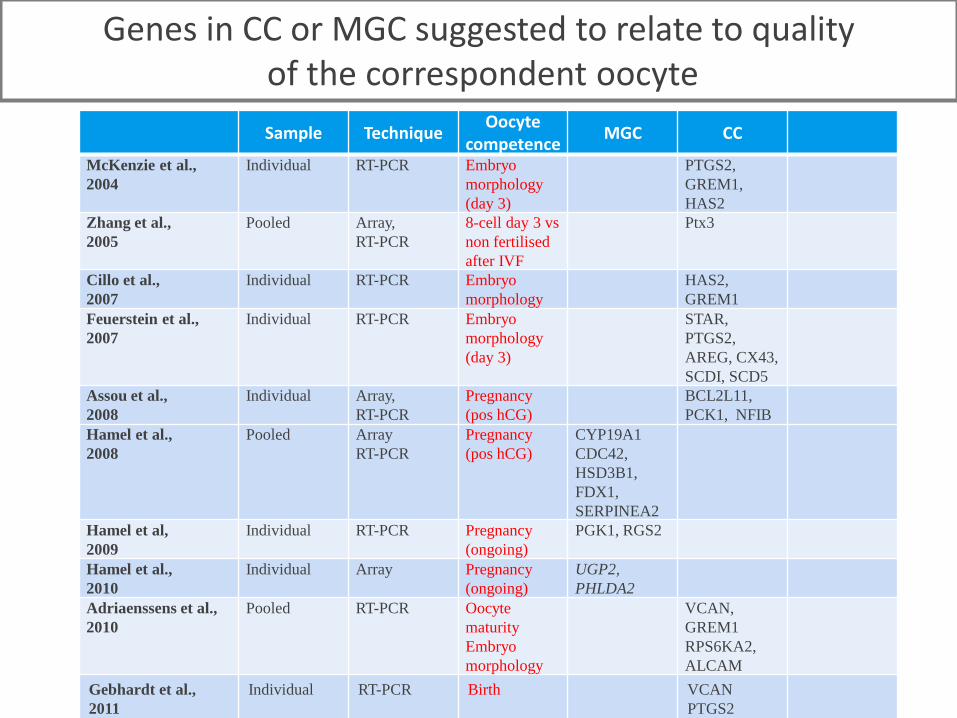
Genes in CC or MGC suggested to relate to qualityof the correspondent oocyte
ESHRE, dec 2010
Sample TechniqueOocyte
competenceMGC CC
McKenzie et al.,
2004
Individual RT-PCR Embryo
morphology
(day 3)
PTGS2,
GREM1,
HAS2
Zhang et al.,
2005
Pooled Array,
RT-PCR
8-cell day 3 vs
non fertilised
after IVF
Ptx3
Cillo et al.,
2007
Individual RT-PCR Embryo
morphology
HAS2,
GREM1
Feuerstein et al.,
2007
Individual RT-PCR Embryo
morphology
(day 3)
STAR,
PTGS2,
AREG, CX43,
SCDI, SCD5
Assou et al.,
2008
Individual Array,
RT-PCR
Pregnancy
(pos hCG)
BCL2L11,
PCK1, NFIB
Hamel et al.,
2008
Pooled Array
RT-PCR
Pregnancy
(pos hCG)
CYP19A1
CDC42,
HSD3B1,
FDX1,
SERPINEA2
Hamel et al,
2009
Individual RT-PCR Pregnancy
(ongoing)
PGK1, RGS2
Hamel et al.,
2010
Individual Array Pregnancy
(ongoing)
UGP2,
PHLDA2
Adriaenssens et al.,
2010
Pooled RT-PCR Oocyte
maturity
Embryo
morphology
VCAN,
GREM1
RPS6KA2,
ALCAM
Gebhardt et al.,
2011
Individual RT-PCR Birth VCAN
PTGS2
Genes in CC or MGC suggested to relate to qualityof the correspondent oocyte

ESHRE, dec 2010
Sample TechniqueOocyte
competenceMGC CC
McKenzie et al.,
2004
Individual RT-PCR Embryo
morphology
(day 3)
PTGS2,
GREM1,
HAS2
Zhang et al.,
2005
Pooled Array,
RT-PCR
8-cell day 3 vs
non fertilised
after IVF
Ptx3
Cillo et al.,
2007
Individual RT-PCR Embryo
morphology
HAS2,
GREM1
Feuerstein et al.,
2007
Individual RT-PCR Embryo
morphology
(day 3)
STAR,
PTGS2,
AREG, CX43,
SCDI, SCD5
Assou et al.,
2008
Individual Array,
RT-PCR
Pregnancy
(pos hCG)
BCL2L11,
PCK1, NFIB
Hamel et al.,
2008
Pooled Array
RT-PCR
Pregnancy
(pos hCG)
CYP19A1
CDC42,
HSD3B1,
FDX1,
SERPINEA2
Hamel et al,
2009
Individual RT-PCR Pregnancy
(ongoing)
PGK1, RGS2
Hamel et al.,
2010
Individual Array Pregnancy
(ongoing)
UGP2,
PHLDA2
Adriaenssens et al.,
2010
Pooled RT-PCR Oocyte
maturity
Embryo
morphology
VCAN
GREM1
RPS6KA2,
ALCAM
Gebhardt et al.,
2011
Individual RT-PCR Birth VCAN
PTGS2
Genes in CC or MGC suggested to relate to qualityof the correspondent oocyte

• Lack of consistent markers in published studies
- no common standard for developmental competence
- difference in sampling (time)
- analysis on individual or pooled follicles
• Studies where MGC and CC are collected and embryoescultured individually
-sampling immediately after OPU
-analysis on cells for individual follicles
-well defined developmental competence (ongoing
pregnancy / birth)
Current statusfor identifying gene expression quality markers

Cell adhesion
Inflammation
Response to wounding
Electron transport chain
Cell-to-cell signalling
Signal transduction
Regulation of proteolysis
Cell cycle regulation
Growth factor
Fatty acid biosynthesis
Lipid metabolic process
Carbohydrate metabolic process
Extracellular matrix
Gene ontology functions/process of suggested marker genes

Ongoing study
No pregnancy
X
•Marker expression profile based on pregnant and non-
pregnant classification
1) Cumulus cells
2) Granulosa cells
3) Cumulus:Granulosa ratio
Classification of the gene expression profileCorrelation between somatic cell gene-expression and competence of the oocytes

Lack of consistent gene expression markers in CC and MGC
Difference in sampling competence measure may be the explanation
Classification of CC and MGC in ‘pregnant’ and ‘non pregnant’ expression profile may provide us a tool to prospectively select and de-select oocytes/embryoes
Conclusion

Acknowledgement
Rehannah BorupMicroarray Centre
Rigshospitalet
Claus Yding AndersenRigshospitalet
Jeanette Bogstad, VibekeBoujida Hartvig, Jens IngemanssenAnita Elverdal, Pernille AndersenKirsten Langbøl,Marianne Pedersen,Mette Villads Nielsen, Tanja SchrøderFertility ClinicHvidovre Hospital
MSD, Denmark

-50
-40
-30
-20
-10
0
10
20
30
AMH CYP11a1 ESR GHR
Microarray(n= 12)
RT-PCR (n= 6)
AMH
BP
β-actin
Grøndahl et al., 2011
RT-PCR confirmation of array analysis
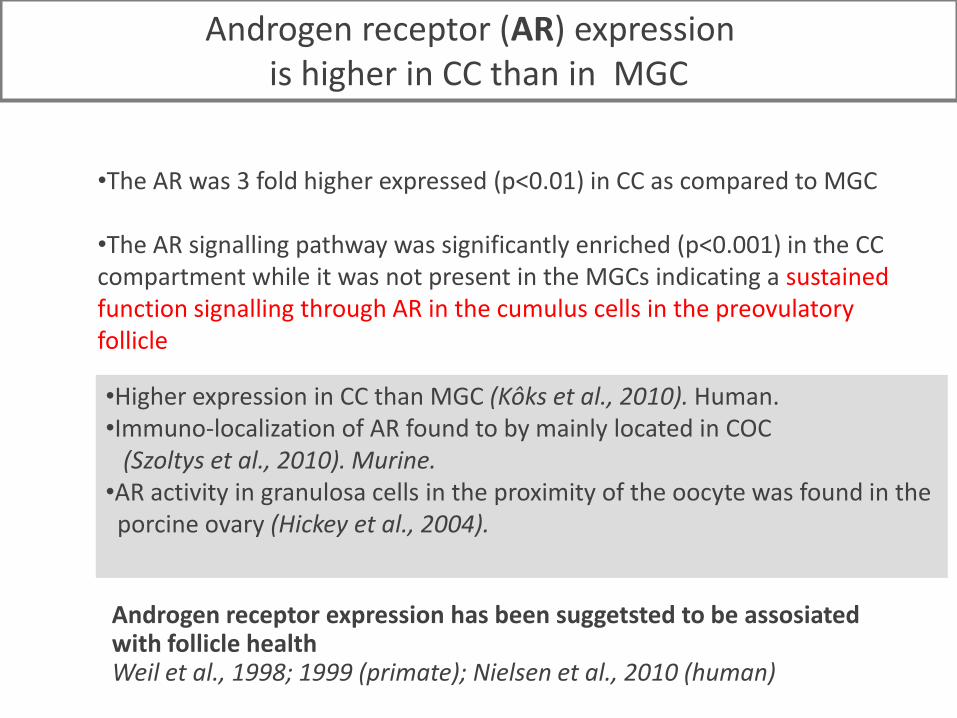
•The AR was 3 fold higher expressed (p<0.01) in CC as compared to MGC
•The AR signalling pathway was significantly enriched (p<0.001) in the CC compartment while it was not present in the MGCs indicating a sustained function signalling through AR in the cumulus cells in the preovulatory follicle
Androgen receptor expression has been suggetsted to be assosiated with follicle health Weil et al., 1998; 1999 (primate); Nielsen et al., 2010 (human)
Androgen receptor (AR) expression is higher in CC than in MGC
•Higher expression in CC than MGC (Kôks et al., 2010). Human.•Immuno-localization of AR found to by mainly located in COC
(Szoltys et al., 2010). Murine.•AR activity in granulosa cells in the proximity of the oocyte was found in the porcine ovary (Hickey et al., 2004).

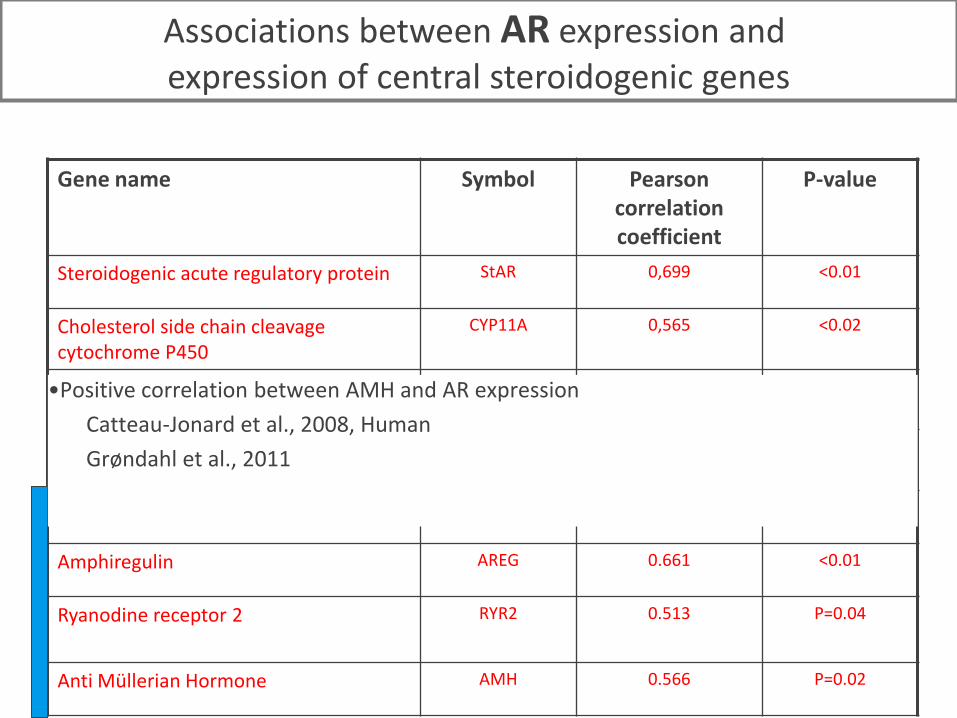
Gene name Symbol Pearson correlation coefficient
P-value
Steroidogenic acute regulatory protein StAR 0,699 <0.01
Cholesterol side chain cleavage cytochrome P450
CYP11A 0,565 <0.02
Hydroxy-delta-5-steroid dehydrogenase, 3 beta- and steroid delta-isomerase 1
HSD3b 0.071 P=0.42
Cytochrome P450, family 19, subfamily A, polypeptide 1, Aromatse
CYP19A 0.44 P=0.07
Epiregulin EREG 0.034 P=0.45
Amphiregulin AREG 0.661 <0.01
Ryanodine receptor 2 RYR2 0.513 P=0.04
Anti Müllerian Hormone AMH 0.566 P=0.02
Associations between AR expression and expression of central steroidogenic genes
•Positive correlation between AMH and AR expression
Catteau-Jonard et al., 2008, Human
Grøndahl et al., 2011


