
Copyright 2018 © Atlas Hospitality Group
California Lodging Investment Conference
The State of the California Hotel Industry
March 7th, 2019
Presented by
Alan X. Reay, PresidentCalBRE: 00959901
Atlas Hospitality GroupTel. (949) 622-3400, ext. 409 E-mail: [email protected]: www.atlashospitaltiy.com

2018 Predictions• Decline in number of transactions and sales volume
• Individual sales down 24%• Sales volume down 10%
• Sales price per room will go up 5-10%• Median price per room up 17%, a new California
record

2018 Predictions• Interest rates will go up
• Prime rate went from 4.5% to 5.5%, up 22.2%• 5-, 10- and 30-year Treasuries remained flat to
slightly down
• Rev PAR increases to level off• California Rev PAR went up 3.8% in 2018, as
compared to 2.1% in 2017
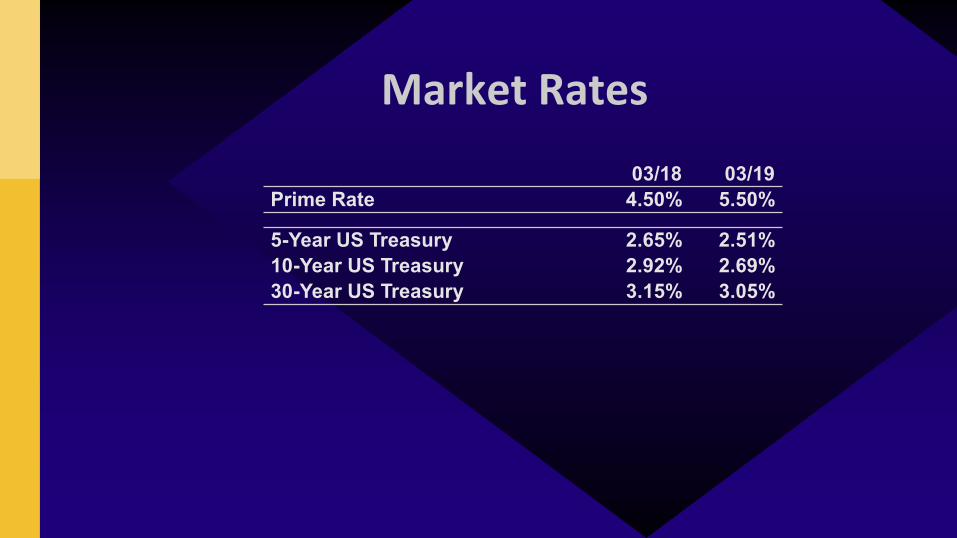
Market Rates
03/18 03/19Prime Rate 4.50% 5.50%
5-Year US Treasury 2.65% 2.51%10-Year US Treasury 2.92% 2.69%30-Year US Treasury 3.15% 3.05%

2018 Review

2018 CRE REIT Stock Performance
Single Family Rental -12.8%
Office -13.7%
Data Center -16.0%
Shopping Center -16.3%
Hotel -17.5%
Poor 2018 despite strong year for hotel industry
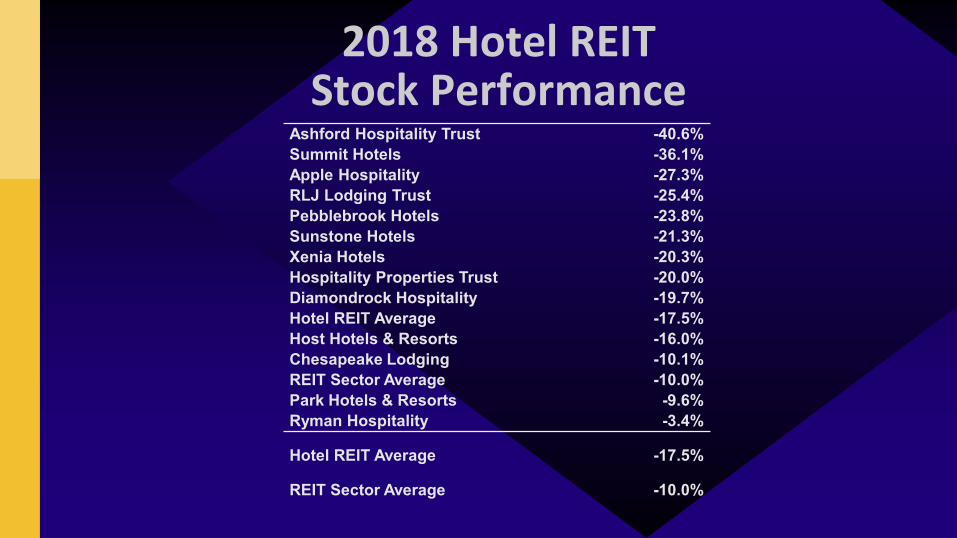
2018 Hotel REIT Stock Performance
Ashford Hospitality Trust -40.6%Summit Hotels -36.1%Apple Hospitality -27.3%RLJ Lodging Trust -25.4%Pebblebrook Hotels -23.8%Sunstone Hotels -21.3%Xenia Hotels -20.3%Hospitality Properties Trust -20.0%Diamondrock Hospitality -19.7%Hotel REIT Average -17.5%Host Hotels & Resorts -16.0%Chesapeake Lodging -10.1%REIT Sector Average -10.0%Park Hotels & Resorts -9.6%Ryman Hospitality -3.4%
Hotel REIT Average -17.5%
REIT Sector Average -10.0%

2018 Hotel Operator Stock Performance
Marriott -20.0%
Hilton -10.1%
Hyatt -8.1%
Choice -7.8%
Hotel C-Corp Average -15.0%

2018 California Hotel Sales Highlights
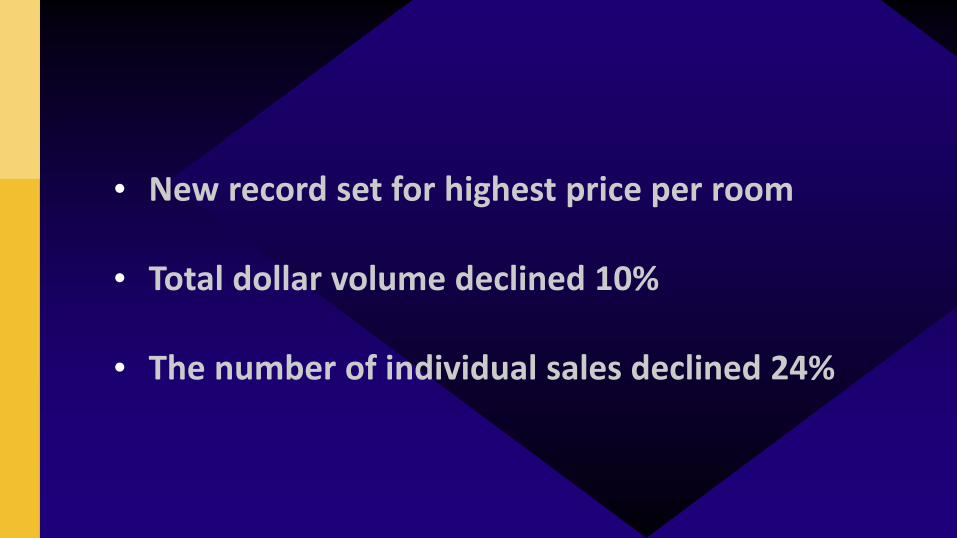
• New record set for highest price per room
• Total dollar volume declined 10%
• The number of individual sales declined 24%

Historical Sales Chart
$0
$20,000
$40,000
$60,000
$80,000
$100,000
$120,000
$140,000
2001
2002
2003
2004
2005
2006
2007
2008
2009
2010
2011
2012
2013
2014
2015
2016
2017
2018
Median Price per Room
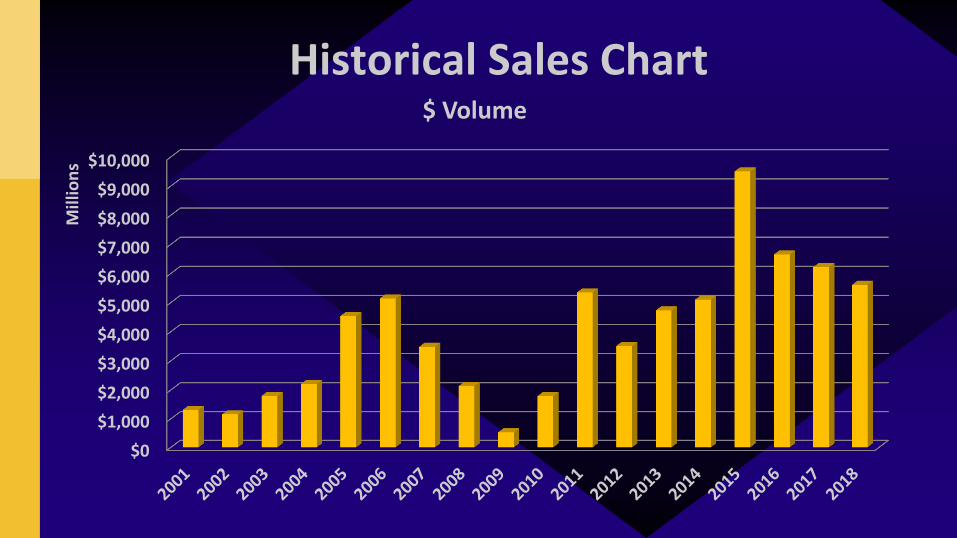
Historical Sales Chart
$0$1,000$2,000$3,000$4,000$5,000$6,000$7,000$8,000$9,000
$10,000
Mill
ions
$ Volume
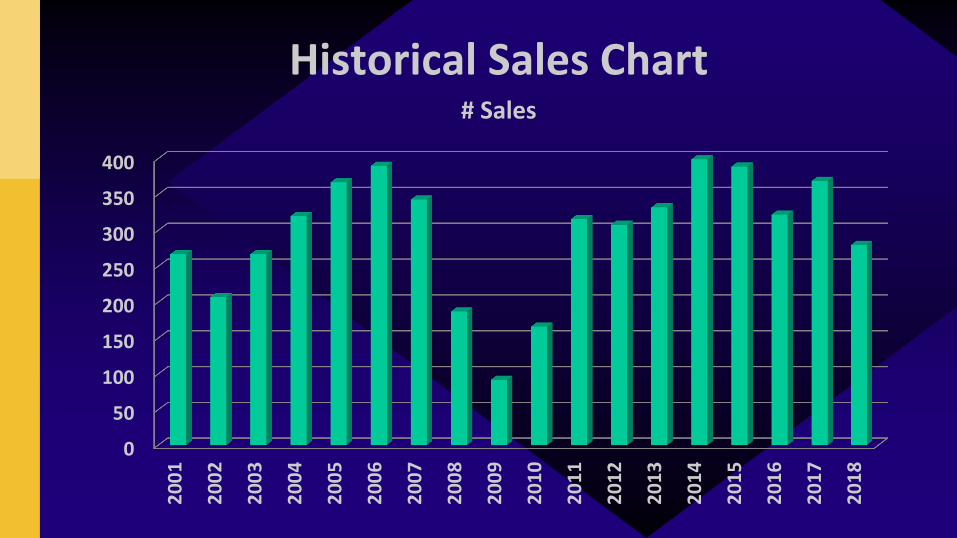
Historical Sales Chart
0
50
100
150
200
250
300
350
40020
01
2002
2003
2004
2005
2006
2007
2008
2009
2010
2011
2012
2013
2014
2015
2016
2017
2018
# Sales

Notable 2018 California Hotel Sales
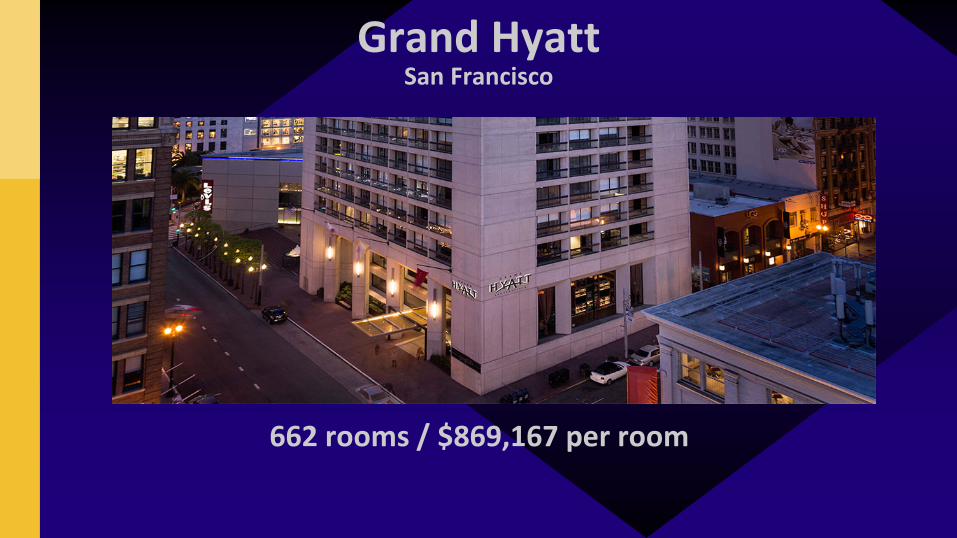
Grand HyattSan Francisco
662 rooms / $869,167 per room
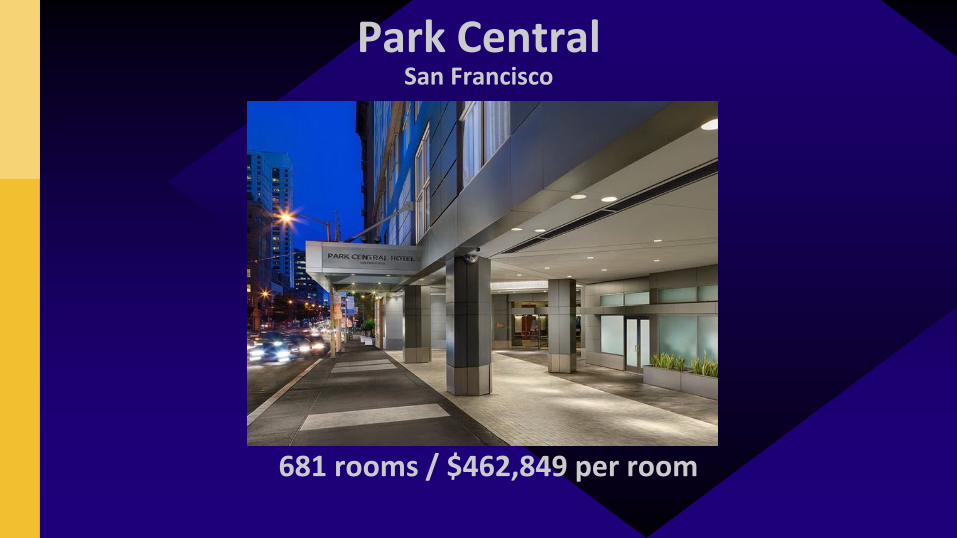
Park CentralSan Francisco
681 rooms / $462,849 per room
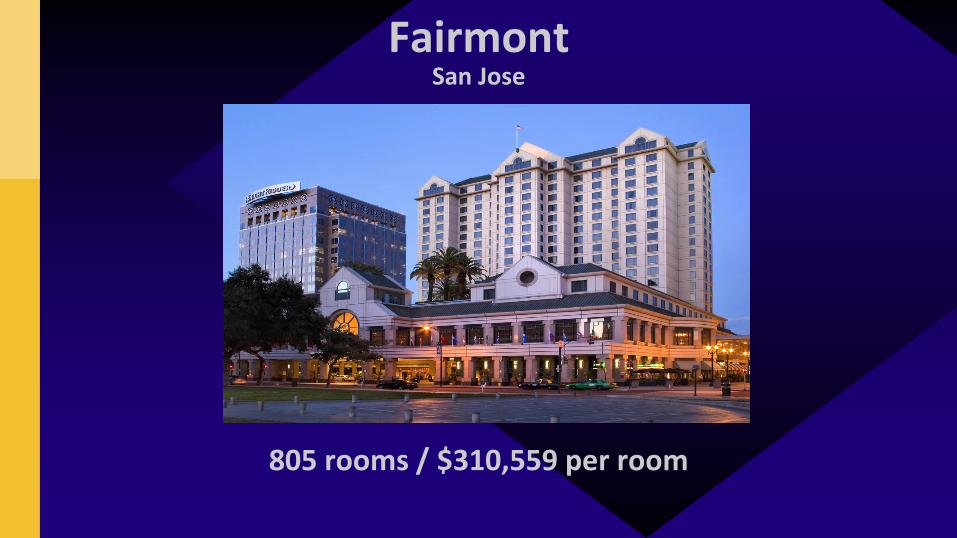
FairmontSan Jose
805 rooms / $310,559 per room
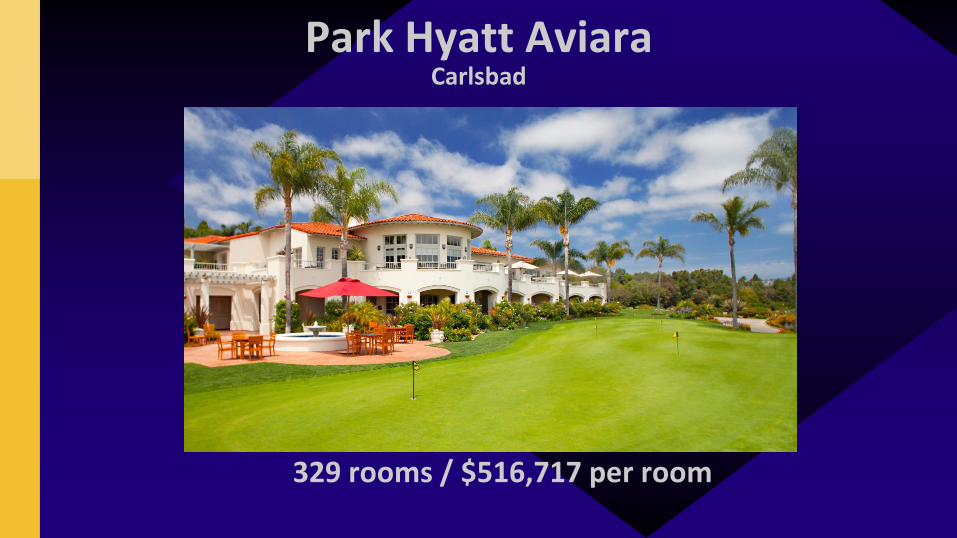
Park Hyatt AviaraCarlsbad
329 rooms / $516,717 per room

Cavallo PointSausalito
142 rooms / $1,068,415 per room

DoubleTree SuitesSanta Monica
253 rooms / $608,696 per room

La Quinta Resort, a Waldorf AstoriaLa Quinta
796 rooms / $165,327 per room

2018 California Median Sales Price per Room

California $121,439
Santa Clara County $276,671San Mateo County $262,743San Francisco County $230,769Alameda County $214,671Orange County $162,963Los Angeles County $150,000San Diego County $115,385Riverside County $96,897San Bernardino County $66,750
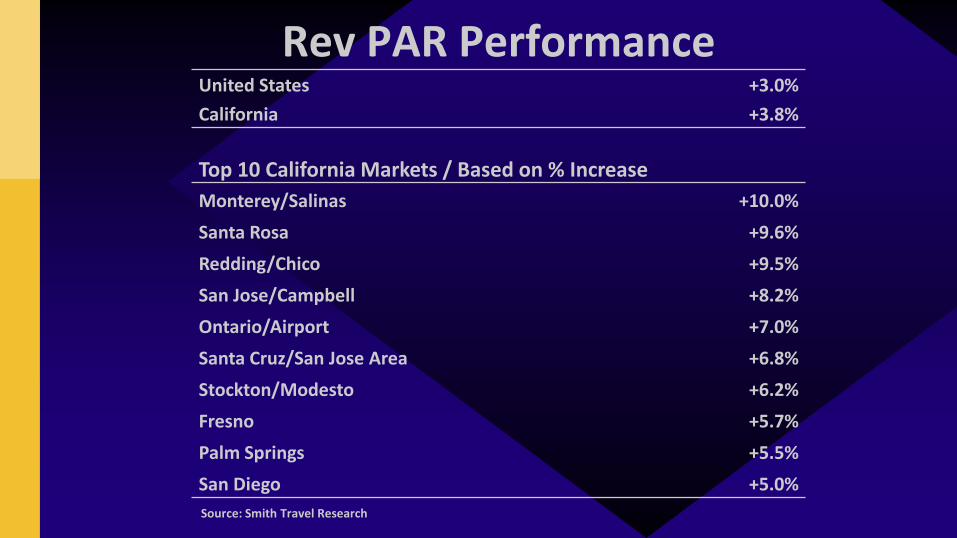
Rev PAR PerformanceUnited States +3.0%California +3.8%
Top 10 California Markets / Based on % IncreaseMonterey/Salinas +10.0%Santa Rosa +9.6%Redding/Chico +9.5%San Jose/Campbell +8.2%Ontario/Airport +7.0%Santa Cruz/San Jose Area +6.8%Stockton/Modesto +6.2%Fresno +5.7%Palm Springs +5.5%San Diego +5.0%Source: Smith Travel Research
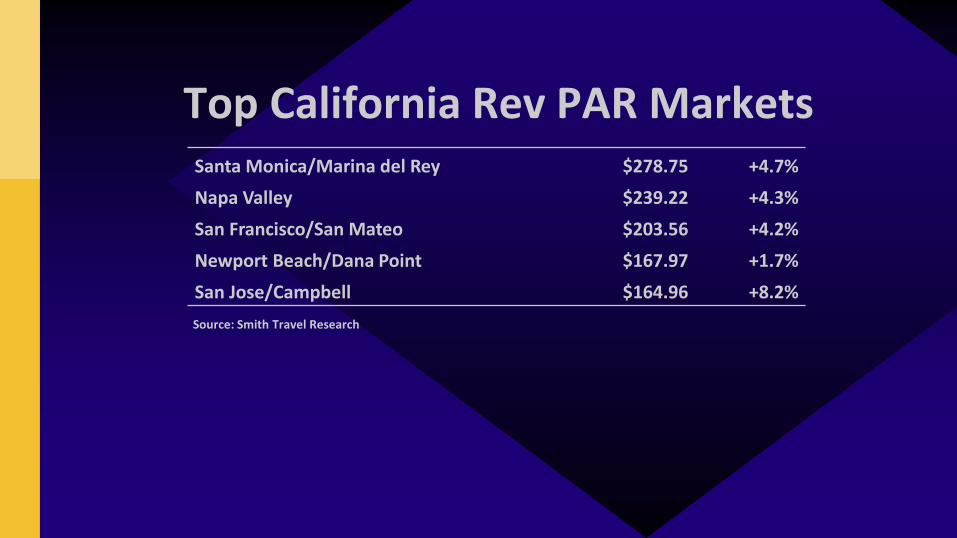
Top California Rev PAR MarketsSanta Monica/Marina del Rey $278.75 +4.7%Napa Valley $239.22 +4.3%San Francisco/San Mateo $203.56 +4.2%Newport Beach/Dana Point $167.97 +1.7%San Jose/Campbell $164.96 +8.2%Source: Smith Travel Research

Lowest California Rev PAR Markets Stockton/Modesto $71.74 +6.2%Fresno $67.90 +5.7%Redding/Chico $67.11 +9.5%Eureka/Crescent City $66.80 -5.8%Bakersfield $50.37 +3.6%Source: Smith Travel Research
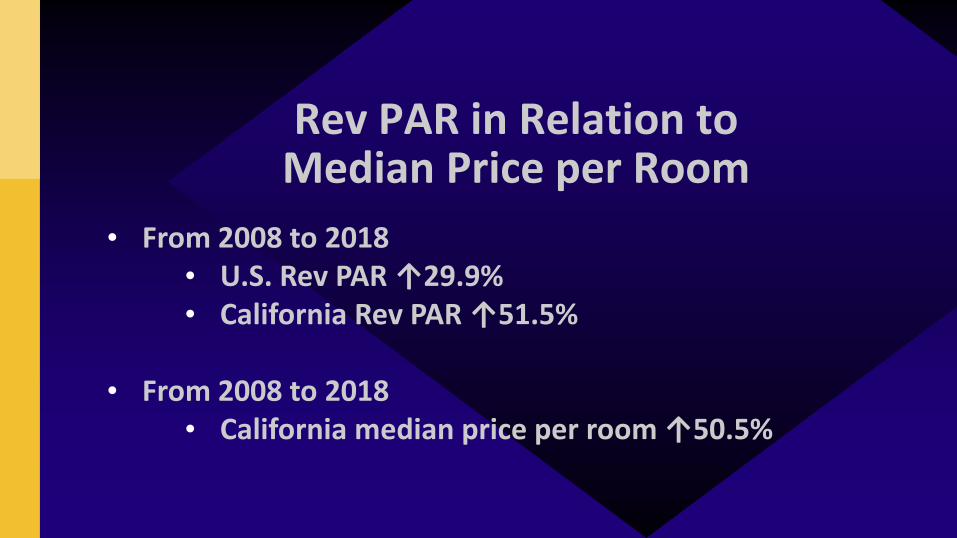
Rev PAR in Relation to Median Price per Room
• From 2008 to 2018• U.S. Rev PAR ↑29.9%• California Rev PAR ↑51.5%
• From 2008 to 2018• California median price per room ↑50.5%

Rev PAR in Relation to Median Price per Room
• More upside in lower Rev PAR markets versus higher Rev PAR markets over the long term?
• From 2008 to 2018• Santa Monica Rev PAR ↑52.5%• Bakersfield Rev PAR ↑27.7%

2019 Forecast

Clouds on the Horizon• December 2018 retail sales sink 1.2%, the worst plunge
since 2009
• Economists predict a recession by 2020
• Home mortgage originations at lowest level since 2014
• A record 7 million Americans are 90 days behind on auto loan payments
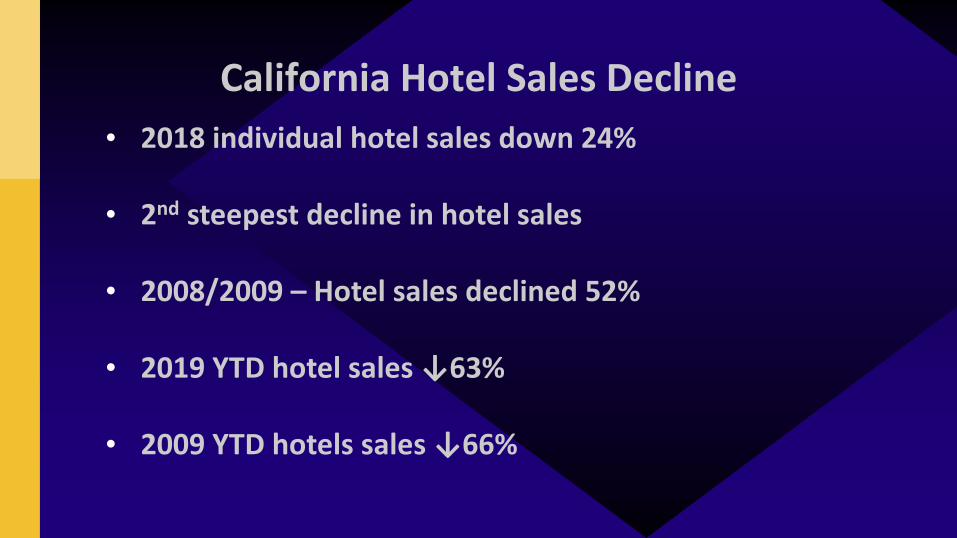
California Hotel Sales Decline• 2018 individual hotel sales down 24%
• 2nd steepest decline in hotel sales
• 2008/2009 – Hotel sales declined 52%
• 2019 YTD hotel sales ↓63%
• 2009 YTD hotels sales ↓66%
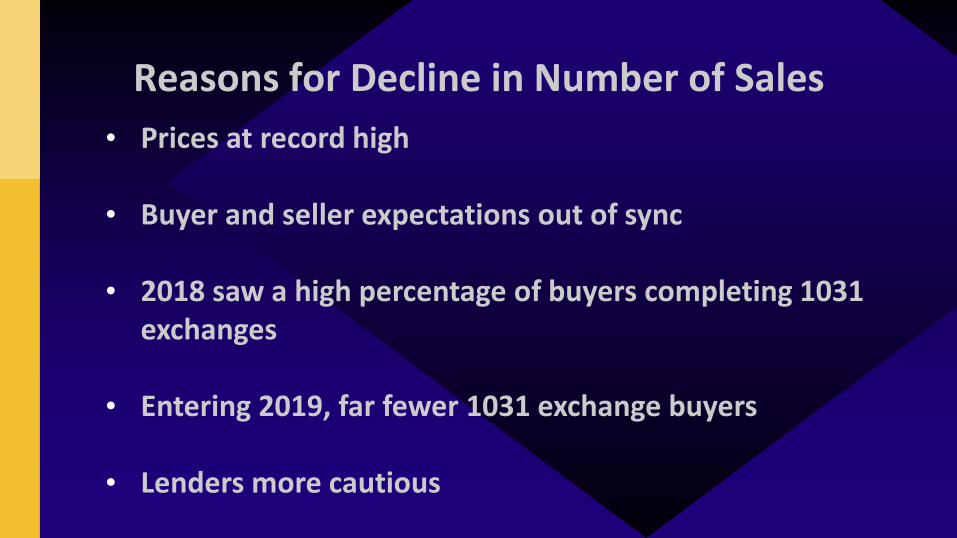
Reasons for Decline in Number of Sales• Prices at record high
• Buyer and seller expectations out of sync
• 2018 saw a high percentage of buyers completing 1031 exchanges
• Entering 2019, far fewer 1031 exchange buyers
• Lenders more cautious

Reasons for Decline in # of Sales• Interest rates expected to rise
• Expenses already increasing – Especially labor
• Fewer motivated buyers
• New supply pressure
• Fewer motivated buyers

Chinese Investment Pullback• Dalian Wanda sells One Beverly Hills

Chinese Investment Pullback• DTLA Oceanside Plaza halts construction

Chinese Investment Pullback• Anbang selling $5.5 billion luxury hotel portfolio, including
Westin St. Francis – San Francisco Loews Santa Monica Beach Hotel

Issues to Look for in 2019• Cap rates will rise
• Values will be flat or decline
• The number of individual sales will fall
• Early signs of distress
• Hotels and markets most vulnerable

Any Questions….
Alan X. ReayPresident / CalBRE: 00959901
Atlas Hospitality GroupTel. (949) 622-3400, ext. 409
E-mail: [email protected]: www.atlashospitaltiy.com


